Embed Size (px)
Citation preview
Waste Characterization & Facility Design
Part 1: Waste stream amounts analysis
Carla Guilcapi 3402968
Kamanzi Solange 3402599
Bernard Johnston 3067183
1
Contents
1. Introduction ........................................................................................................................ 2
2. Population & demographics ............................................................................................... 3
3. Assumptions ....................................................................................................................... 3
4. Waste projections ............................................................................................................... 4
5. Analysis.............................................................................................................................. 5
Population .............................................................................................................................. 6
Waste streams quantities ........................................................................................................ 6
Waste to disposal all streams ............................................................................................. 6
Waste to recycling all streams ........................................................................................... 7
6. Calculations...................................................................................................................... 10
7. References ........................................................................................................................ 12
.
2
1. INTRODUCTION
Lower Bunztal Regional Council (LBRC) has engaged JV Consulting to develop an
integrated regional waste management strategy in response to LBRC’s commitment to meet
NSW targets set in the 2007 Waste Avoidance and Resource Recovery (WARR) Strategy.
The NSW strategy is complimented by the 2009 National Waste Policy which sets the agenda
for resource management nationally.
The WARR Strategy aims to reduce waste generation and improve the efficient use of
resources. It includes targets to reduce waste to landfill from a year 2000 baseline for
municipal solid waste (MSW) to 66%, commercial and industrial waste (C&I) to 63% and
construction and demolition (C&D) waste to 76%. The projection of estimates on waste
quantities and compositional data for these waste streams is critical for the LBR strategy and
LBRC WARR commitments.
Guilcapi Kamanzi and Johnston (GKJ) have been engaged to provide data on waste quantities
for each of the waste streams at appropriate intervals to 2037. This will provide waste
generation data to JV Consulting which will be used in developing the LBR integrated waste
management strategy. The analysis will also provide data for a concept design report,
required by LBRC for standard neighbourhood transfer stations which will be used to replace
the ten small landfills currently serving the rural communities and a major transfer station
which will be used to replace the Belevi Landfill. It is intended that there will be two major
transfer stations located either side of the Corbyn River.
LBR waste stream quantities and 2012 compositional data for each of the three waste streams
has been calculated by applying estimated rates based on trend analysis over a time series as
published in relevant OEH reports. These rates have been applied to critical components
required to estimate, as accurately as possible, waste steam quantities and overall generation.
Rates for the C&I and B&D waste streams have been adjusted where required based on
information supplied in the brief, i.e. recycling rates for C&I and B&D are less than current
values in Sydney.
3
Data used to estimate waste stream quantities, composition and overall generation has been
based on information supplied in the project brief or sourced through the NSW Office of
Environment and Heritage (OEH) reports for historical data within the Extended Regulated
Area (ERA). JV Consulting has provided additional information where required.
The following components have been considered in the projections:
2. POPULATION & DEMOGRAPHICS
The LBR is situated approximately 200km south of Sydney on the south coast of NSW
positioning it approximately 2.5 hours drive from Sydney and four hours drive from
Canberra. The profile assumed for LBR is based on the ERA as defined in the WARR
strategy.
According to the brief the population in the LBR at the 2011 Census was 1,100,000. This
comprised 1,000,000 people in the City of Metapolis and 100,000 people living in rural areas
outside the city. The population increases by approximately 50,000 people in the six week
summer school holidays which occur in the December/January period. The LBRC geographic
area has not been defined in the brief.
The growth rate has been 2.1% over the previous five years to 2011 i.e. since 2006, with the
bulk of this migration is represented by retirees from Sydney and through increasing tourism.
3. ASSUMPTIONS
It is assumed that the migrant retiree population is recently retired and active i.e. mid to late
sixties and predominantly self funded through private superannuation. It is expected that
superannuation pensions will fund their remaining lifetime or fund the first five to ten years
of resettlement in the LBR prior to the receipt of social security pensions influencing choice
and location of available housing stock. This group is likely to have a higher purchasing
power due to the sale of property in Sydney where real estate prices are generally higher than
the subject area. It is therefore likely that this group will settle in separate houses with
4
individual waste bins rather than multi unit dwellings (MUDs) or retirement villages with
shared waste bins.
It is likely that the tourist numbers will increase in the LBR given the climate, location and
proximity to Sydney and Canberra. The current pattern of a 4.6% increase in population over
the school summer holidays indicates this group is predominantly families with school age
children. This may have flow on effects in the long term as more people become familiar
with the region and what it has to offer in life style and opportunities. An increase in
visitations by retiree family members from outside the region for varying lengths of time, e.g.
weekend, gazetted holidays and annual leave will increase proportionally.
The 2.1% overall rise in population is also attributed to a seemingly small proportion, relative
to migrant retirees, of people engaged directly or indirectly through an expanding local
tourism industry. This group is likely to grow as increased tourism and support services are
required to meet market demand. The increase in tourism will be subject to available
infrastructure, e.g. accommodation and camp sites and prevailing economic conditions.
As population and tourism increase and the population ages, more services will be required
which will drive construction and upgrading of new and existing infrastructure to meet
demand. This will impact on waste services provided directly by LBRC and waste
management in general within and outside the LBR. All three wastes streams will increase as
population drives regional development. To understand the potential impact of this GKJ has
provided the following data on a ‘do nothing’ scenario to ascertain potential waste quantities
generated across the MSW, C&I and B&D waste streams.
4. WASTE PROJECTIONS
In order to provide realistic waste generation projections GKJ have applied a population
growth rate for the LBR based on current growth at 2.1% or 0.42% annual average. This rate
has been standardised across metropolitan and rural zones and applied proportionally to each
baseline population at 2011. Taking into account the fertility and increasing mortality rates as
the population ages over twenty years from 2006 and youth migration from the LBR to
5
Sydney and other Australian cities the rate has been reduced by 3% in 2022 and remains
stagnant to the planning horizon at 2037.
A 4.8% population growth rate1 has been applied to the tourist group numbered at 50,000 in
2011. This rate is based on the 2010 NSW population growth adjusted to reflect the large
number of families in the group. As this group causes a peak in population and waste
services in December/January only, its effect is largely limited to the major transfer station
(MSW & C&I disposal) and the Materials Recovery Facility (MRF). CKJ has not included
this in the major transfer design as it is more cost effective to address this peak with increased
vehicle movements to and from that facility for the six week period rather than increase
infrastructure capacity.
5. ANALYSIS
All data in the following sections are weight-based unless otherwise stated. Data is presented
in charts and tables. Numbers and percentages are rounded to the nearest decimal point or
whole numbers and therefore some figures and descriptions may not add up to 100%.
Figures are inclusive of all MSW waste, i.e. kerbside MGB collection, clean up, drop off and
other council (council activities).
All tables in this section are based on ERA 2003 figures unless stated otherwise. The annual
average change is based on annual changes over the period 2003 – 2009 for MSW and C&D
for ERA. Instructions in the brief with respect to C&I and C&D require calculations using
recycling rates less than the 2009 SMA values. SMA 2009 values for C&I is 50% and B&D
is 77%. Values for ERA for this period are C&I at 60% and B&D at 68%. Accordingly C&I
have been reduced in the following calculations to a 45% recycling rate to reflect the lesser
value required in the brief. C&D has not been adjusted as it is considerably lower than the
SMA values in 2009.
1 2011 Australian Bureau of Statistics Census data for NSW is 9.7% growth in 2010. Families with children
comprised 45% of the population in NSW in 2010.
6
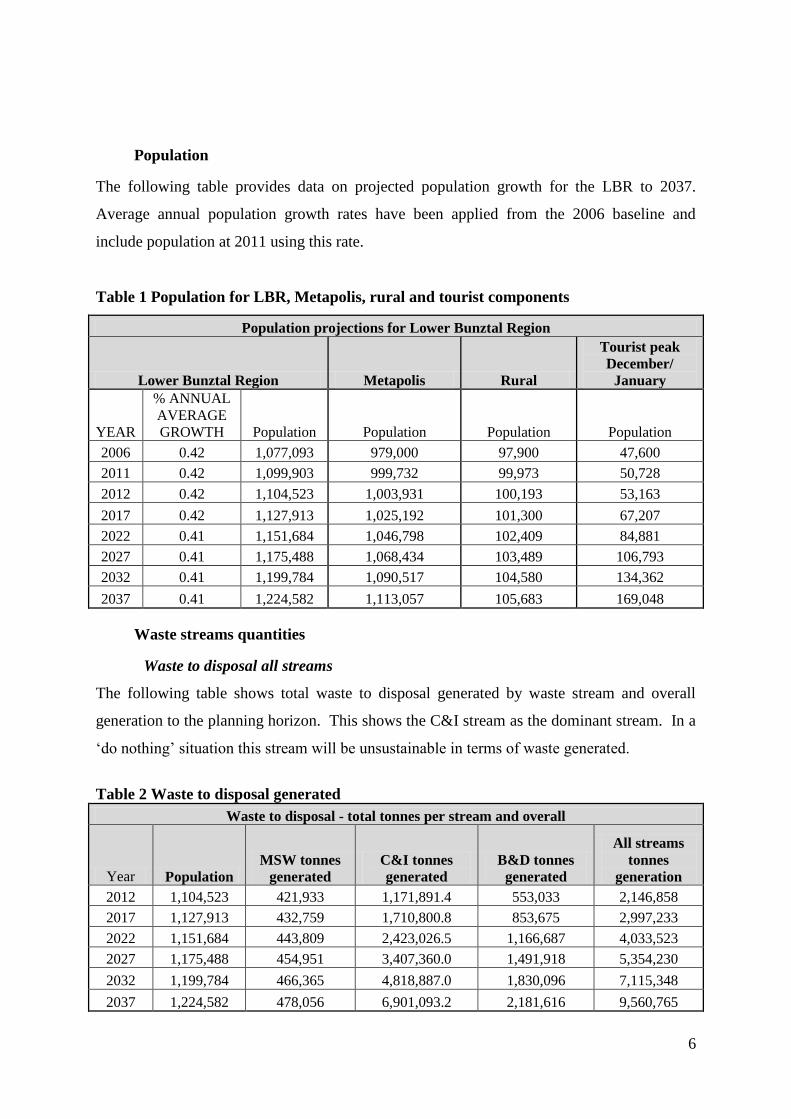
Population
The following table provides data on projected population growth for the LBR to 2037.
Average annual population growth rates have been applied from the 2006 baseline and
include population at 2011 using this rate.
Table 1 Population for LBR, Metapolis, rural and tourist components
Population projections for Lower Bunztal Region
Lower Bunztal Region Metapolis Rural
Tourist peak
December/
January
YEAR
% ANNUAL
AVERAGE
GROWTH Population Population Population Population
2006 0.42 1,077,093 979,000 97,900 47,600
2011 0.42 1,099,903 999,732 99,973 50,728
2012 0.42 1,104,523 1,003,931 100,193 53,163
2017 0.42 1,127,913 1,025,192 101,300 67,207
2022 0.41 1,151,684 1,046,798 102,409 84,881
2027 0.41 1,175,488 1,068,434 103,489 106,793
2032 0.41 1,199,784 1,090,517 104,580 134,362
2037 0.41 1,224,582 1,113,057 105,683 169,048
Waste streams quantities
Waste to disposal all streams
The following table shows total waste to disposal generated by waste stream and overall
generation to the planning horizon. This shows the C&I stream as the dominant stream. In a
‘do nothing’ situation this stream will be unsustainable in terms of waste generated.
Table 2 Waste to disposal generated
Waste to disposal - total tonnes per stream and overall
Year Population MSW tonnes
generated C&I tonnes
generated B&D tonnes
generated
All streams
tonnes
generation
2012 1,104,523 421,933 1,171,891.4 553,033 2,146,858
2017 1,127,913 432,759 1,710,800.8 853,675 2,997,233
2022 1,151,684 443,809 2,423,026.5 1,166,687 4,033,523
2027 1,175,488 454,951 3,407,360.0 1,491,918 5,354,230
2032 1,199,784 466,365 4,818,887.0 1,830,096 7,115,348
2037 1,224,582 478,056 6,901,093.2 2,181,616 9,560,765
7
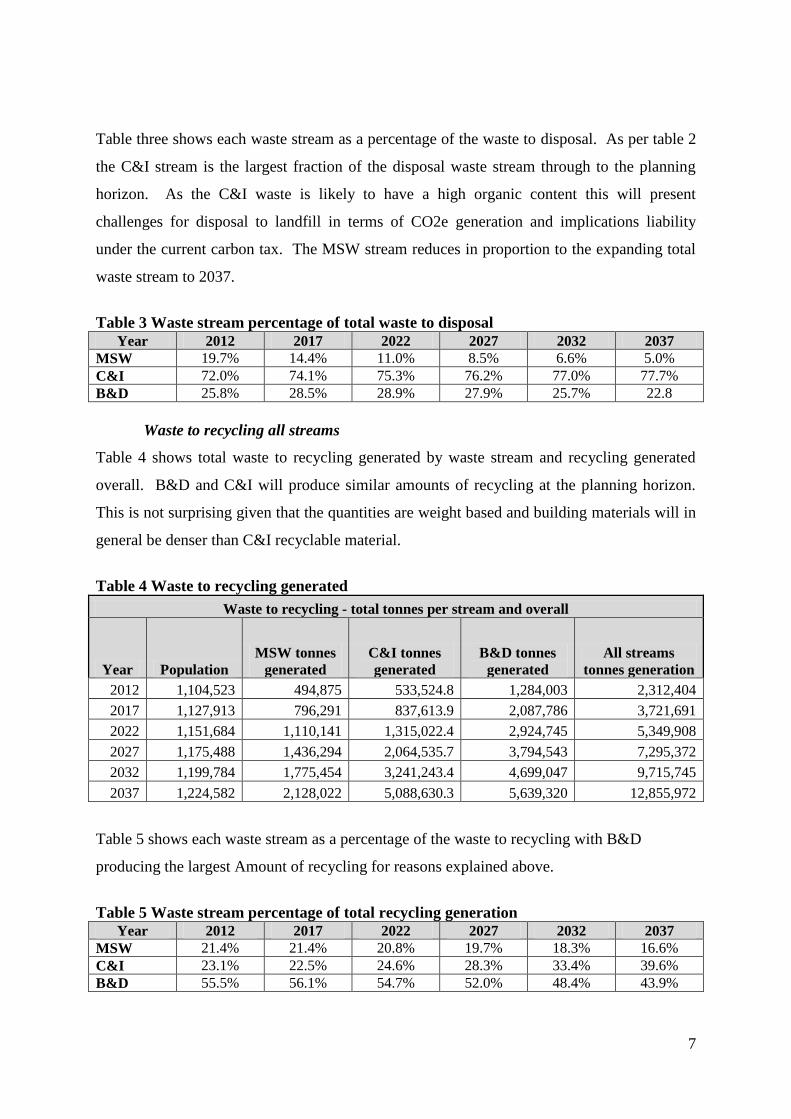
Table three shows each waste stream as a percentage of the waste to disposal. As per table 2
the C&I stream is the largest fraction of the disposal waste stream through to the planning
horizon. As the C&I waste is likely to have a high organic content this will present
challenges for disposal to landfill in terms of CO2e generation and implications liability
under the current carbon tax. The MSW stream reduces in proportion to the expanding total
waste stream to 2037.
Table 3 Waste stream percentage of total waste to disposal
Year 2012 2017 2022 2027 2032 2037 MSW 19.7% 14.4% 11.0% 8.5% 6.6% 5.0% C&I 72.0% 74.1% 75.3% 76.2% 77.0% 77.7% B&D 25.8% 28.5% 28.9% 27.9% 25.7% 22.8
Waste to recycling all streams
Table 4 shows total waste to recycling generated by waste stream and recycling generated
overall. B&D and C&I will produce similar amounts of recycling at the planning horizon.
This is not surprising given that the quantities are weight based and building materials will in
general be denser than C&I recyclable material.
Table 4 Waste to recycling generated
Waste to recycling - total tonnes per stream and overall
Year Population MSW tonnes
generated C&I tonnes
generated B&D tonnes
generated All streams
tonnes generation
2012 1,104,523 494,875 533,524.8 1,284,003 2,312,404
2017 1,127,913 796,291 837,613.9 2,087,786 3,721,691
2022 1,151,684 1,110,141 1,315,022.4 2,924,745 5,349,908
2027 1,175,488 1,436,294 2,064,535.7 3,794,543 7,295,372
2032 1,199,784 1,775,454 3,241,243.4 4,699,047 9,715,745
2037 1,224,582 2,128,022 5,088,630.3 5,639,320 12,855,972
Table 5 shows each waste stream as a percentage of the waste to recycling with B&D
producing the largest Amount of recycling for reasons explained above.
Table 5 Waste stream percentage of total recycling generation
Year 2012 2017 2022 2027 2032 2037 MSW 21.4% 21.4% 20.8% 19.7% 18.3% 16.6% C&I 23.1% 22.5% 24.6% 28.3% 33.4% 39.6% B&D 55.5% 56.1% 54.7% 52.0% 48.4% 43.9%
8
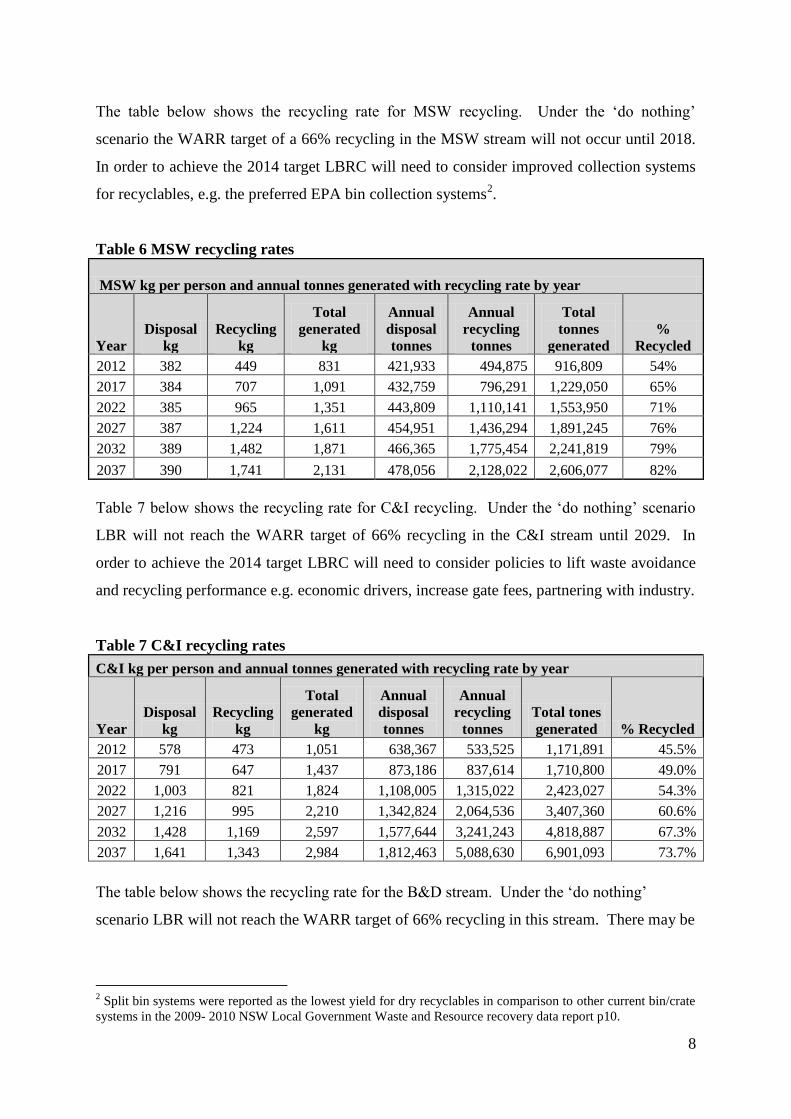
The table below shows the recycling rate for MSW recycling. Under the ‘do nothing’
scenario the WARR target of a 66% recycling in the MSW stream will not occur until 2018.
In order to achieve the 2014 target LBRC will need to consider improved collection systems
for recyclables, e.g. the preferred EPA bin collection systems2.
Table 6 MSW recycling rates
MSW kg per person and annual tonnes generated with recycling rate by year
Year Disposal
kg Recycling
kg
Total
generated kg
Annual
disposal
tonnes
Annual
recycling
tonnes
Total
tonnes generated
%
Recycled
2012 382 449 831 421,933 494,875 916,809 54%
2017 384 707 1,091 432,759 796,291 1,229,050 65%
2022 385 965 1,351 443,809 1,110,141 1,553,950 71%
2027 387 1,224 1,611 454,951 1,436,294 1,891,245 76%
2032 389 1,482 1,871 466,365 1,775,454 2,241,819 79%
2037 390 1,741 2,131 478,056 2,128,022 2,606,077 82%
Table 7 below shows the recycling rate for C&I recycling. Under the ‘do nothing’ scenario
LBR will not reach the WARR target of 66% recycling in the C&I stream until 2029. In
order to achieve the 2014 target LBRC will need to consider policies to lift waste avoidance
and recycling performance e.g. economic drivers, increase gate fees, partnering with industry.
Table 7 C&I recycling rates
C&I kg per person and annual tonnes generated with recycling rate by year
Year Disposal
kg Recycling
kg
Total
generated kg
Annual
disposal
tonnes
Annual
recycling
tonnes Total tones
generated % Recycled
2012 578 473 1,051 638,367 533,525 1,171,891 45.5%
2017 791 647 1,437 873,186 837,614 1,710,800 49.0%
2022 1,003 821 1,824 1,108,005 1,315,022 2,423,027 54.3%
2027 1,216 995 2,210 1,342,824 2,064,536 3,407,360 60.6%
2032 1,428 1,169 2,597 1,577,644 3,241,243 4,818,887 67.3%
2037 1,641 1,343 2,984 1,812,463 5,088,630 6,901,093 73.7%
The table below shows the recycling rate for the B&D stream. Under the ‘do nothing’
scenario LBR will not reach the WARR target of 66% recycling in this stream. There may be
2 Split bin systems were reported as the lowest yield for dry recyclables in comparison to other current bin/crate
systems in the 2009- 2010 NSW Local Government Waste and Resource recovery data report p10.
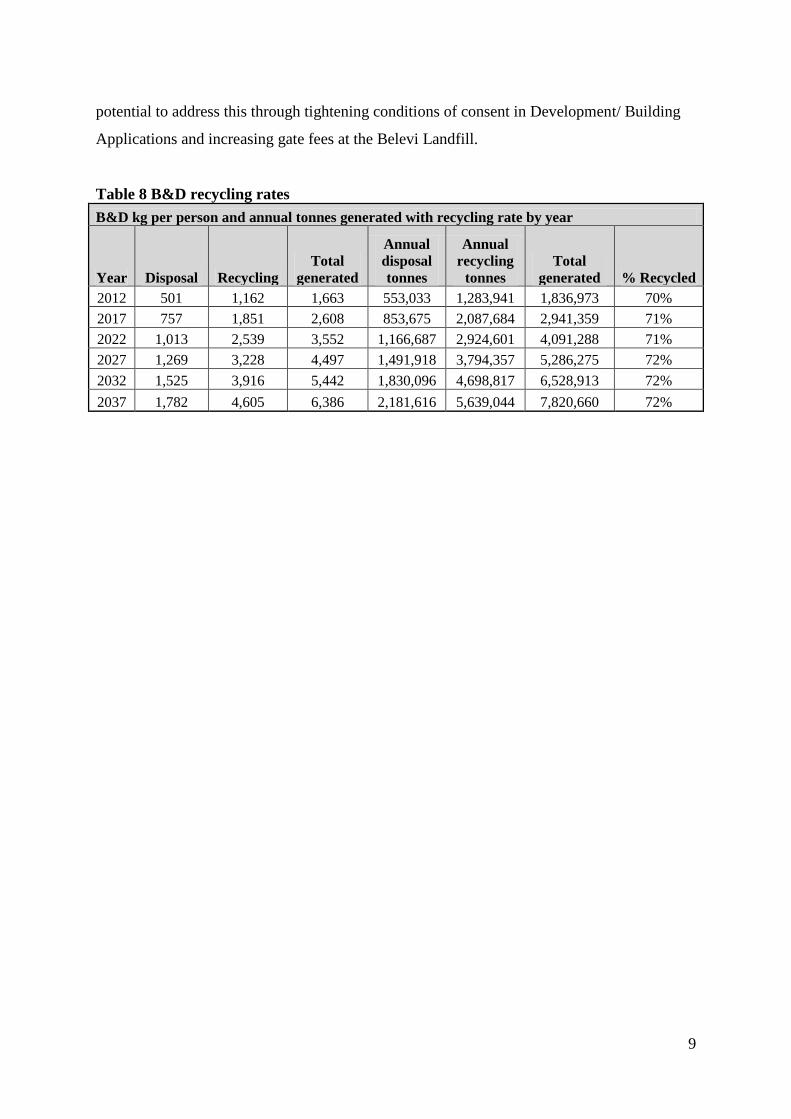
9
potential to address this through tightening conditions of consent in Development/ Building
Applications and increasing gate fees at the Belevi Landfill.
Table 8 B&D recycling rates
B&D kg per person and annual tonnes generated with recycling rate by year
Year Disposal Recycling Total
generated
Annual
disposal
tonnes
Annual
recycling
tonnes Total
generated % Recycled
2012 501 1,162 1,663 553,033 1,283,941 1,836,973 70%
2017 757 1,851 2,608 853,675 2,087,684 2,941,359 71%
2022 1,013 2,539 3,552 1,166,687 2,924,601 4,091,288 71%
2027 1,269 3,228 4,497 1,491,918 3,794,357 5,286,275 72%
2032 1,525 3,916 5,442 1,830,096 4,698,817 6,528,913 72%
2037 1,782 4,605 6,386 2,181,616 5,639,044 7,820,660 72%
10
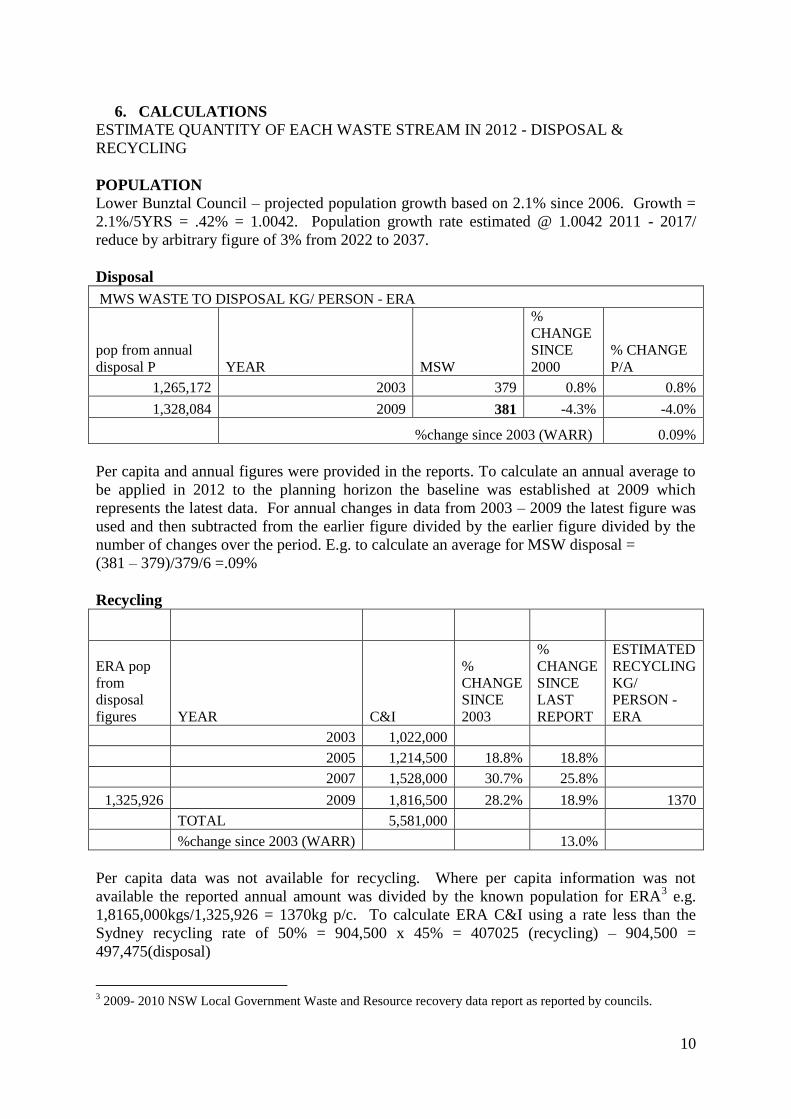
6. CALCULATIONS
ESTIMATE QUANTITY OF EACH WASTE STREAM IN 2012 - DISPOSAL &
RECYCLING
POPULATION
Lower Bunztal Council – projected population growth based on 2.1% since 2006. Growth =
2.1%/5YRS = .42% = 1.0042. Population growth rate estimated @ 1.0042 2011 - 2017/
reduce by arbitrary figure of 3% from 2022 to 2037.
Disposal
MWS WASTE TO DISPOSAL KG/ PERSON - ERA
pop from annual
disposal P YEAR MSW
%
CHANGE
SINCE
2000 % CHANGE
P/A
1,265,172 2003 379 0.8% 0.8%
1,328,084 2009 381 -4.3% -4.0%
%change since 2003 (WARR) 0.09%
Per capita and annual figures were provided in the reports. To calculate an annual average to
be applied in 2012 to the planning horizon the baseline was established at 2009 which
represents the latest data. For annual changes in data from 2003 – 2009 the latest figure was
used and then subtracted from the earlier figure divided by the earlier figure divided by the
number of changes over the period. E.g. to calculate an average for MSW disposal =
(381 – 379)/379/6 =.09%
Recycling
ERA pop
from
disposal
figures YEAR C&I
%
CHANGE
SINCE
2003
%
CHANGE
SINCE
LAST
REPORT
ESTIMATED
RECYCLING
KG/
PERSON -
ERA
2003 1,022,000
2005 1,214,500 18.8% 18.8%
2007 1,528,000 30.7% 25.8%
1,325,926 2009 1,816,500 28.2% 18.9% 1370
TOTAL 5,581,000
%change since 2003 (WARR) 13.0%
Per capita data was not available for recycling. Where per capita information was not
available the reported annual amount was divided by the known population for ERA3 e.g.
1,8165,000kgs/1,325,926 = 1370kg p/c. To calculate ERA C&I using a rate less than the
Sydney recycling rate of 50% = 904,500 x 45% = 407025 (recycling) – 904,500 =
497,475(disposal)
3 2009- 2010 NSW Local Government Waste and Resource recovery data report as reported by councils.
11
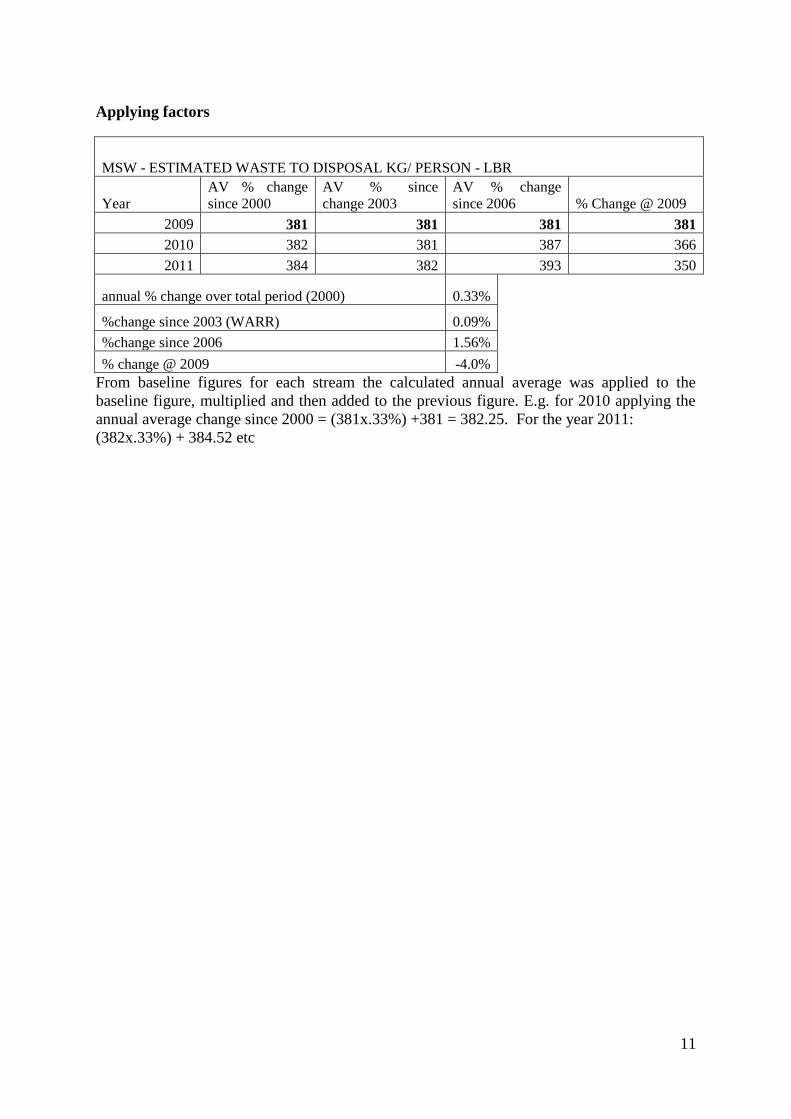
Applying factors
MSW - ESTIMATED WASTE TO DISPOSAL KG/ PERSON - LBR
Year AV % change
since 2000 AV % since
change 2003 AV % change
since 2006 % Change @ 2009
2009 381 381 381 381
2010 382 381 387 366
2011 384 382 393 350
annual % change over total period (2000) 0.33%
%change since 2003 (WARR) 0.09%
%change since 2006 1.56%
% change @ 2009 -4.0%
From baseline figures for each stream the calculated annual average was applied to the
baseline figure, multiplied and then added to the previous figure. E.g. for 2010 applying the
annual average change since 2000 = (381x.33%) +381 = 382.25. For the year 2011:
(382x.33%) + 384.52 etc
12
7. REFERENCES
Department of Environment, Climate Change and Water NSW, Waste avoidance and
resource recovery strategy progress report 2010,Sydney
Department of Environment, Climate Change and Water NSW, Waste avoidance and
resource recovery strategy progress report 2010, Sydney, March 2009, February 2011
Department of Environment, Climate Change and Water NSW, Commercial and industrial
waste in Sydney
Department of Environment, Climate Change and Water NSW, Commercial and industrial
waste in the Lower Hunter Region
Department of Environment, Climate Change and Water NSW, Report into the construction
and demolition waste stream audit 2000 – 2005, Sydney South, August 2007
WME the blue book Australian waste industry 2007/2008 Industry and market report
Department of the Environment, Water, Heritage and the Arts, National waste report 2010,
March 2010
The Office of Environment and Heritage, Department of premier and Cabinet, NSW Local
waste and resource recovery data report as reported by councils, 2009-2012, February 2012
www.absquickstas.com.au <viewed 28 August 2012>
13
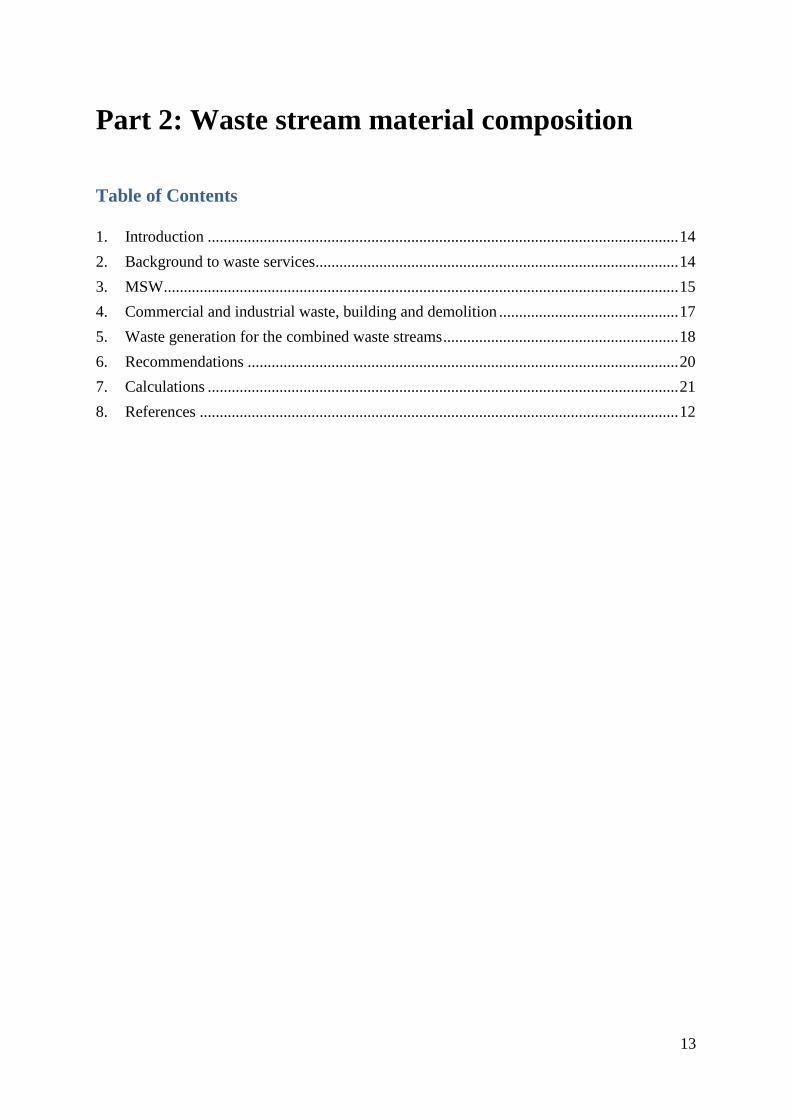
Part 2: Waste stream material composition
Table of Contents
1. Introduction ...................................................................................................................... 14
2. Background to waste services ........................................................................................... 14
3. MSW ................................................................................................................................. 15
4. Commercial and industrial waste, building and demolition ............................................. 17
5. Waste generation for the combined waste streams ........................................................... 18
6. Recommendations ............................................................................................................ 20
7. Calculations ...................................................................................................................... 21
8. References ........................................................................................................................ 12
14
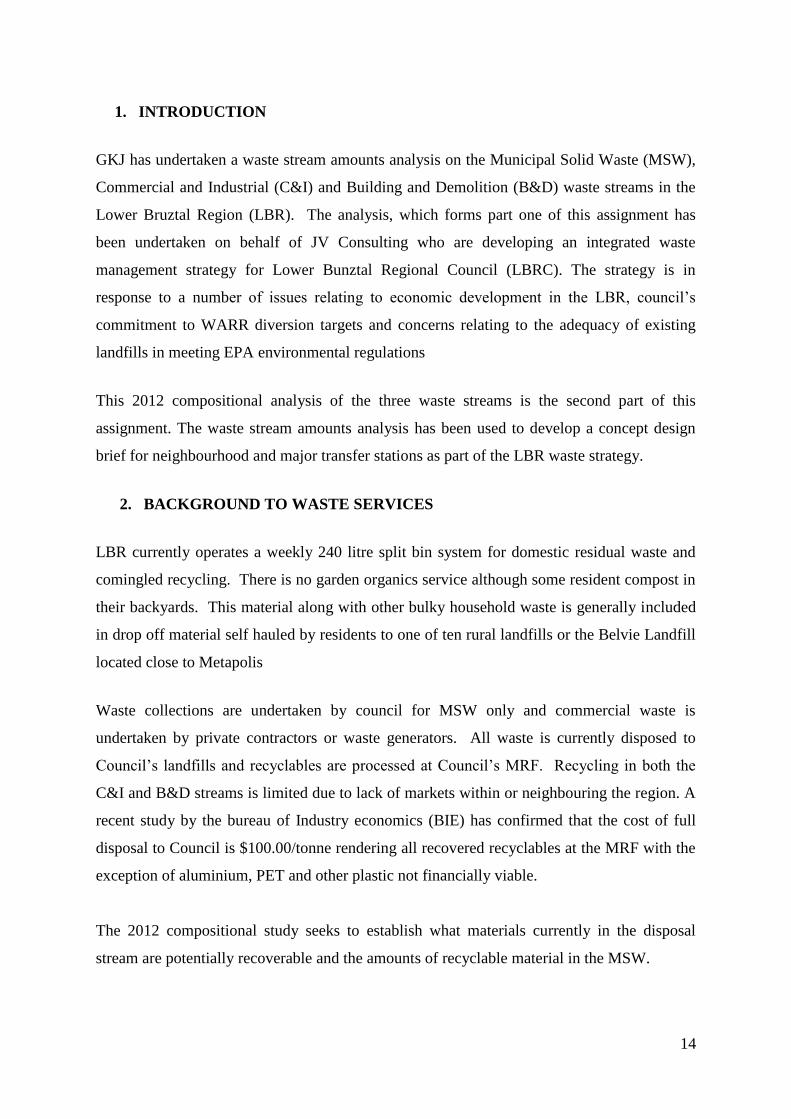
1. INTRODUCTION
GKJ has undertaken a waste stream amounts analysis on the Municipal Solid Waste (MSW),
Commercial and Industrial (C&I) and Building and Demolition (B&D) waste streams in the
Lower Bruztal Region (LBR). The analysis, which forms part one of this assignment has
been undertaken on behalf of JV Consulting who are developing an integrated waste
management strategy for Lower Bunztal Regional Council (LBRC). The strategy is in
response to a number of issues relating to economic development in the LBR, council’s
commitment to WARR diversion targets and concerns relating to the adequacy of existing
landfills in meeting EPA environmental regulations
This 2012 compositional analysis of the three waste streams is the second part of this
assignment. The waste stream amounts analysis has been used to develop a concept design
brief for neighbourhood and major transfer stations as part of the LBR waste strategy.
2. BACKGROUND TO WASTE SERVICES
LBR currently operates a weekly 240 litre split bin system for domestic residual waste and
comingled recycling. There is no garden organics service although some resident compost in
their backyards. This material along with other bulky household waste is generally included
in drop off material self hauled by residents to one of ten rural landfills or the Belvie Landfill
located close to Metapolis
Waste collections are undertaken by council for MSW only and commercial waste is
undertaken by private contractors or waste generators. All waste is currently disposed to
Council’s landfills and recyclables are processed at Council’s MRF. Recycling in both the
C&I and B&D streams is limited due to lack of markets within or neighbouring the region. A
recent study by the bureau of Industry economics (BIE) has confirmed that the cost of full
disposal to Council is $100.00/tonne rendering all recovered recyclables at the MRF with the
exception of aluminium, PET and other plastic not financially viable.
The 2012 compositional study seeks to establish what materials currently in the disposal
stream are potentially recoverable and the amounts of recyclable material in the MSW.
15
3. MSW
In 2012 recycling in the MSW stream represented 21.4% of all recycling in LBRC. This includes
the domestic kerbside collection, clean ups, drop off and other council activities. Table 2 below
details estimates for 2012 per capita and annual waste by weight and percentage recycled in
the MSW stream in LRB.
Table 9 LBR MSW per capita and annual recycling by weight
MSW kg per person and annual tonnes generated with recycling rate by year
Disposal Recycling Total
generated
Annual
disposal
tonnes
Annual
recycling
tonnes Total
generated %
Recycled
382 449 831 421,933 494,875 916,809 54%
Tables 1 and 2 provide a breakdown of MSW by sub stream for disposal and recycling as published in
the 2008-2009 NSW local government waste and resource recovery data report (local
government report) for ERA. This forms the basis of our examination of LBRC MSW.
Table 10 ERA MWS waste to disposal sub streams by proportion
ERA figures for 2009 KG/PA/PP %
Kerbside 248 65.2% 329,737
Clean up 10 2.8% 13,945
Drop off 59 15.7% 79,419 4Other council 62 16.4% 82,899
ERA Total 381 100.0% 506,000 *This figure is likely to consist of some C&D waste mis-categorised. For the purposes of this study sub streams are not
analysised separately
Table 11 ERA MSW recycling sub streams by proportion
ERA figures for 2009 KG/PA/PP % total
Total 294 100.0% 389,565
Kerbside (MGB - bins) 103.9 35.3% 137,949
Clean up (non MGB) 6.3 2.1% 8,389
Drop off (transfer) 60.9 20.7% 80,000
Other council (operations)* 122.9 41.8% 163,227
ERA Total 294 100.0% 251,616 *This figure is likely to consist of some C&D waste mis-categorised. For the purposes of this study sub streams
are not analysised separately.
4 Not provided in the local government report assumed being the difference between the ERA total and all other
components.
16
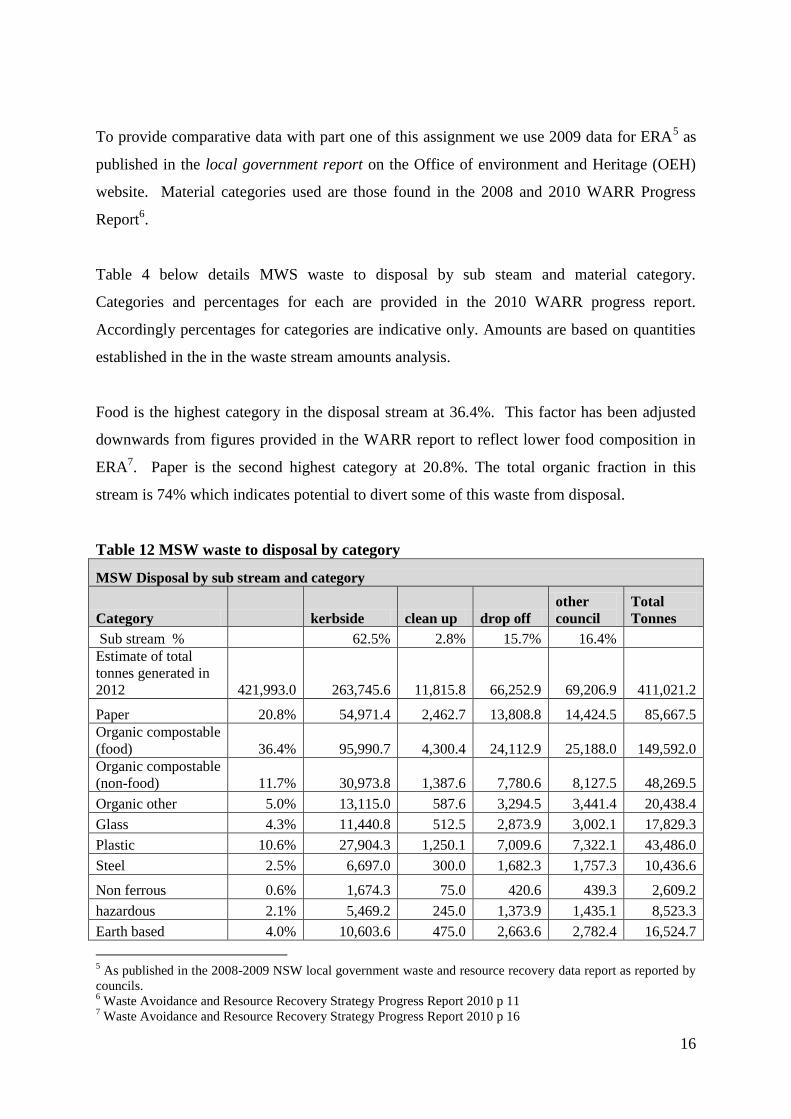
To provide comparative data with part one of this assignment we use 2009 data for ERA5 as
published in the local government report on the Office of environment and Heritage (OEH)
website. Material categories used are those found in the 2008 and 2010 WARR Progress
Report6.
Table 4 below details MWS waste to disposal by sub steam and material category.
Categories and percentages for each are provided in the 2010 WARR progress report.
Accordingly percentages for categories are indicative only. Amounts are based on quantities
established in the in the waste stream amounts analysis.
Food is the highest category in the disposal stream at 36.4%. This factor has been adjusted
downwards from figures provided in the WARR report to reflect lower food composition in
ERA7. Paper is the second highest category at 20.8%. The total organic fraction in this
stream is 74% which indicates potential to divert some of this waste from disposal.
Table 12 MSW waste to disposal by category
MSW Disposal by sub stream and category
Category kerbside clean up drop off other
council Total
Tonnes
Sub stream % 62.5% 2.8% 15.7% 16.4% Estimate of total
tonnes generated in
2012 421,993.0 263,745.6 11,815.8 66,252.9 69,206.9 411,021.2
Paper 20.8% 54,971.4 2,462.7 13,808.8 14,424.5 85,667.5 Organic compostable
(food) 36.4% 95,990.7 4,300.4 24,112.9 25,188.0 149,592.0 Organic compostable
(non-food) 11.7% 30,973.8 1,387.6 7,780.6 8,127.5 48,269.5
Organic other 5.0% 13,115.0 587.6 3,294.5 3,441.4 20,438.4
Glass 4.3% 11,440.8 512.5 2,873.9 3,002.1 17,829.3
Plastic 10.6% 27,904.3 1,250.1 7,009.6 7,322.1 43,486.0
Steel 2.5% 6,697.0 300.0 1,682.3 1,757.3 10,436.6
Non ferrous 0.6% 1,674.3 75.0 420.6 439.3 2,609.2
hazardous 2.1% 5,469.2 245.0 1,373.9 1,435.1 8,523.3
Earth based 4.0% 10,603.6 475.0 2,663.6 2,782.4 16,524.7
5 As published in the 2008-2009 NSW local government waste and resource recovery data report as reported by
councils. 6 Waste Avoidance and Resource Recovery Strategy Progress Report 2010 p 11
7 Waste Avoidance and Resource Recovery Strategy Progress Report 2010 p 16
17
MSW Disposal by sub stream and category
Category kerbside clean up drop off other
council Total
Tonnes
Other & WEEE 1.7% 4,464.7 200.0 1,121.5 1,171.5 6,957.8
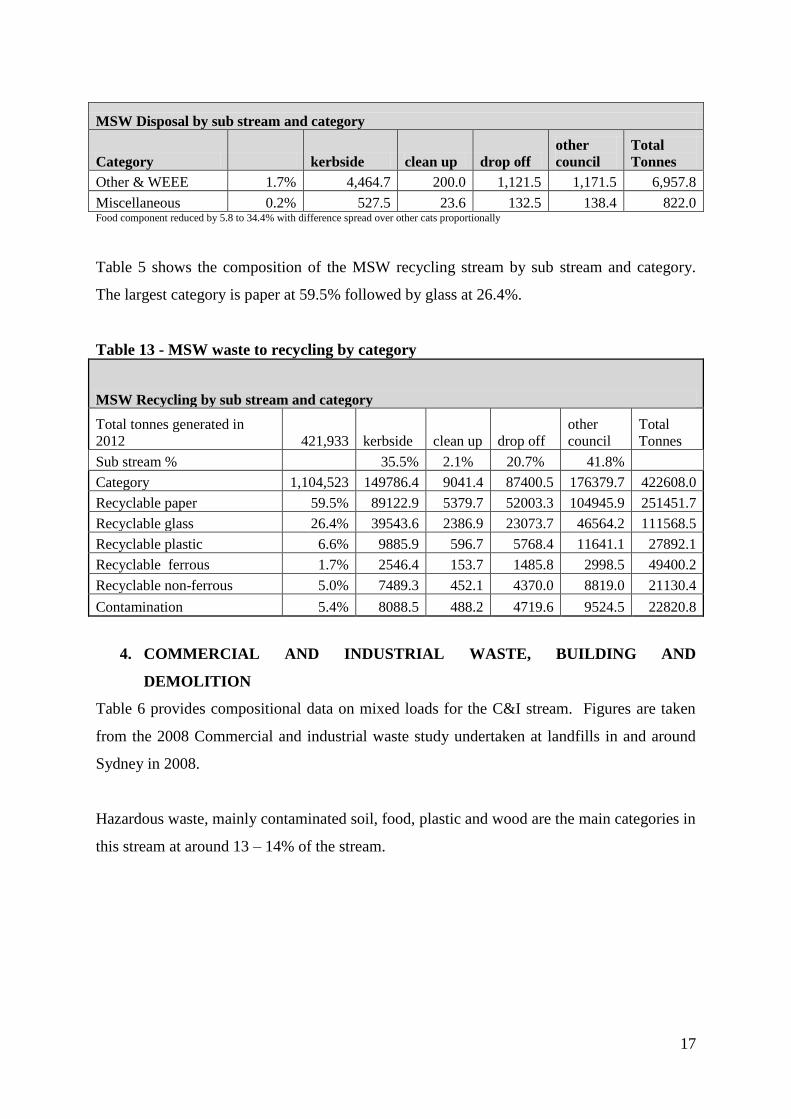
Miscellaneous 0.2% 527.5 23.6 132.5 138.4 822.0 Food component reduced by 5.8 to 34.4% with difference spread over other cats proportionally
Table 5 shows the composition of the MSW recycling stream by sub stream and category.
The largest category is paper at 59.5% followed by glass at 26.4%.
Table 13 - MSW waste to recycling by category
MSW Recycling by sub stream and category
Total tonnes generated in
2012 421,933 kerbside clean up drop off other
council Total
Tonnes
Sub stream %
35.5% 2.1% 20.7% 41.8%
Category 1,104,523 149786.4 9041.4 87400.5 176379.7 422608.0
Recyclable paper 59.5% 89122.9 5379.7 52003.3 104945.9 251451.7
Recyclable glass 26.4% 39543.6 2386.9 23073.7 46564.2 111568.5
Recyclable plastic 6.6% 9885.9 596.7 5768.4 11641.1 27892.1
Recyclable ferrous 1.7% 2546.4 153.7 1485.8 2998.5 49400.2
Recyclable non-ferrous 5.0% 7489.3 452.1 4370.0 8819.0 21130.4
Contamination 5.4% 8088.5 488.2 4719.6 9524.5 22820.8
4. COMMERCIAL AND INDUSTRIAL WASTE, BUILDING AND
DEMOLITION
Table 6 provides compositional data on mixed loads for the C&I stream. Figures are taken
from the 2008 Commercial and industrial waste study undertaken at landfills in and around
Sydney in 2008.
Hazardous waste, mainly contaminated soil, food, plastic and wood are the main categories in
this stream at around 13 – 14% of the stream.
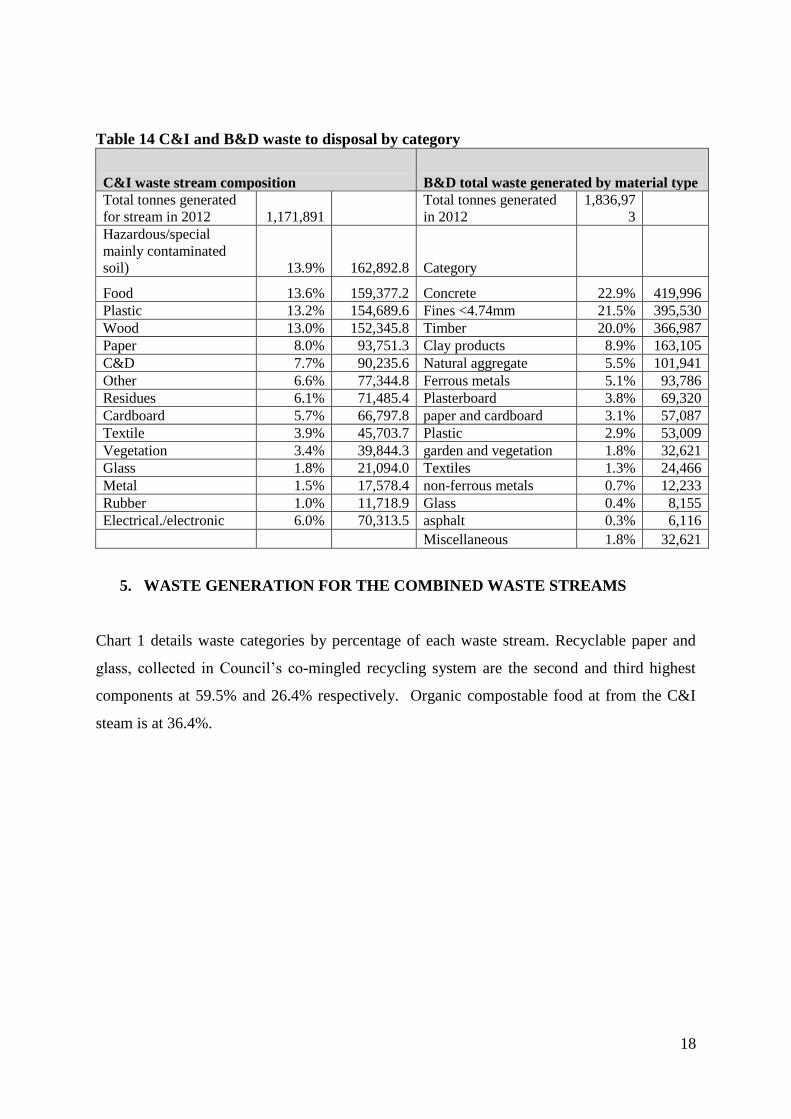
18
Table 14 C&I and B&D waste to disposal by category
C&I waste stream composition B&D total waste generated by material type Total tonnes generated
for stream in 2012 1,171,891 Total tonnes generated
in 2012 1,836,97
3 Hazardous/special
mainly contaminated
soil) 13.9% 162,892.8 Category
Food 13.6% 159,377.2 Concrete 22.9% 419,996 Plastic 13.2% 154,689.6 Fines <4.74mm 21.5% 395,530 Wood 13.0% 152,345.8 Timber 20.0% 366,987 Paper 8.0% 93,751.3 Clay products 8.9% 163,105 C&D 7.7% 90,235.6 Natural aggregate 5.5% 101,941 Other 6.6% 77,344.8 Ferrous metals 5.1% 93,786 Residues 6.1% 71,485.4 Plasterboard 3.8% 69,320 Cardboard 5.7% 66,797.8 paper and cardboard 3.1% 57,087 Textile 3.9% 45,703.7 Plastic 2.9% 53,009 Vegetation 3.4% 39,844.3 garden and vegetation 1.8% 32,621 Glass 1.8% 21,094.0 Textiles 1.3% 24,466 Metal 1.5% 17,578.4 non-ferrous metals 0.7% 12,233 Rubber 1.0% 11,718.9 Glass 0.4% 8,155 Electrical./electronic 6.0% 70,313.5 asphalt 0.3% 6,116
Miscellaneous 1.8% 32,621
5. WASTE GENERATION FOR THE COMBINED WASTE STREAMS
Chart 1 details waste categories by percentage of each waste stream. Recyclable paper and
glass, collected in Council’s co-mingled recycling system are the second and third highest
components at 59.5% and 26.4% respectively. Organic compostable food at from the C&I
steam is at 36.4%.

19
Chart 1 Consolidated waste streams by category
In a consolidated waste stream 40.6% of the entire stream is made up of organics which
comprise paper at 36.4% followed by wood and timber at 34.1%, food at 20.3% and other
organic material and vegetation at 9.3%. The bulk of the organic fraction comes from the C&I stream
at 43.4% followed by MSW at 19.9%. A further 16% of this fraction is recycled paper collected
under councils co-mingled kerbside collection system.
A large proportion of the C&I waste stream has potential to be recovered through a
composting process.
There are a number of materials in the B&D stream that are potentially recyclable such as
asphalt, concrete, clay materials, timber and plastic. It is recognised that these materials are
subject to accessibility and contamination along with environmental regulation regarding
reuse. It is estimated that these materials represent 44.6% of the entire waste stream and this
potential diversion should be further investigated in light of new technologies and an
expanding market for some products in the landscaping and building industry.
Unrecovered plastic makes up 6.6% of the entire stream with an additional 0.7% being
collected in council’s comingled kerbside collection system. Glass makes up 4.1% of the
4.0
%5
.0%
5.4
%1
.7%
26
.4%
59
.5%
6.6
%
0.3
%8
.9%
22
.9%
5.1
%2
1.5
%0
.4%
1.8
% 5.5
%0
.7%
20
.0%
3.1
%3
.8%
2.9
%1
.3%
2.5
%4
.3%
0.2
%0
.6%
2.1
%3
6.4
%1
1.7
%5
.0%
20
.8%
10
.6%
1.7
%7.7
%6
.0%
1.8
%1
.5%
13
.6%
6.6
%3
.4%
13
.0%
5.7
%1
3.2
%6
.1%
1.0
%3
.9%
0%
10%
20%
30%
40%
50%
60%
70%
Eart
h b
ase
d
Co
nta
min
atio
n
Gla
ss R
ecyc
labl
e
Pape
r R
ecyc
labl
e
B&
D m
ater
ial
Gla
ss
Foo
d
Ve
geta
tio
n
PC
ard
bo
ard
Re
sid
ue
s
Text
ile
Cla
y p
rod
uct
s
Ferr
ou
s m
eta
ls
Gla
ss
Nat
ura
l ag
gre
gate
Tim
be
r
Pla
ste
rbo
ard
Text
iles
Gla
ss
No
n fe
rro
us
Org
anic
co
mp
ost
able
(fo
od
)
Org
anic
oth
er
Pla
stic
MSW
C&I
B&D
20
entire waste stream of which 2.9% is collected in Council’s co-mingled collection system,
ferrous metals comprise 5.1 % of the entire waste stream and originate from the B&D sector.
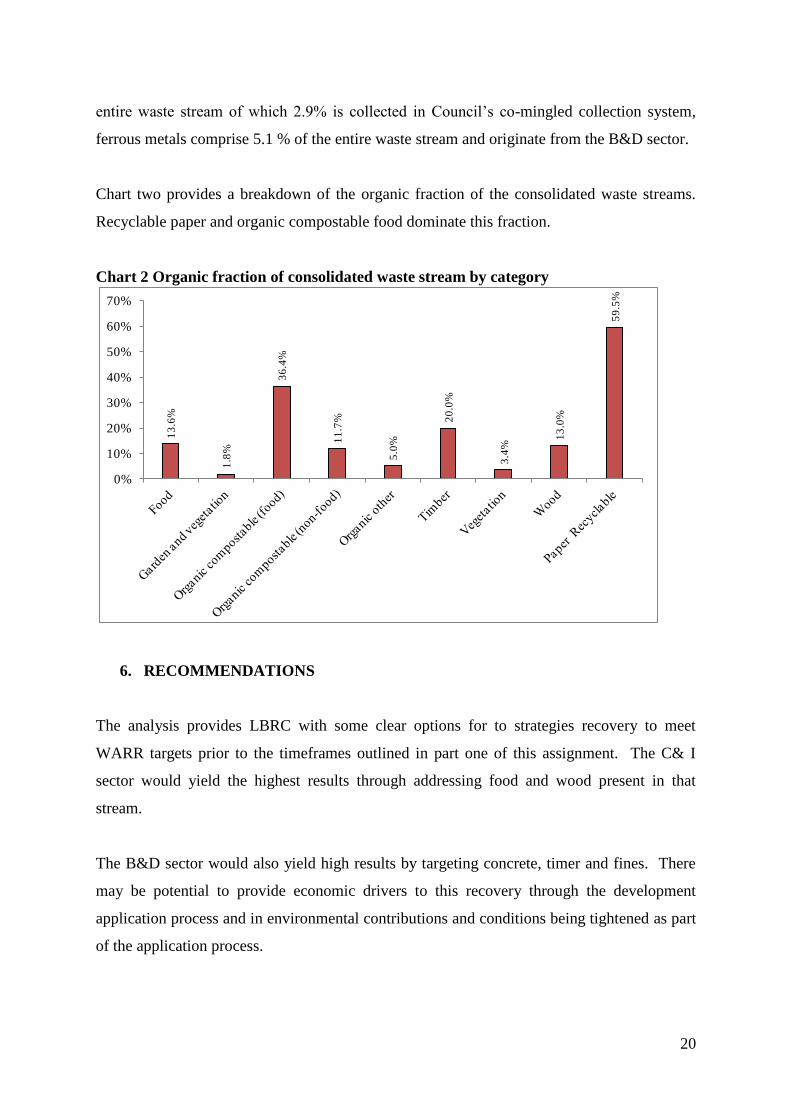
Chart two provides a breakdown of the organic fraction of the consolidated waste streams.
Recyclable paper and organic compostable food dominate this fraction.
Chart 2 Organic fraction of consolidated waste stream by category
6. RECOMMENDATIONS
The analysis provides LBRC with some clear options for to strategies recovery to meet
WARR targets prior to the timeframes outlined in part one of this assignment. The C& I
sector would yield the highest results through addressing food and wood present in that
stream.
The B&D sector would also yield high results by targeting concrete, timer and fines. There
may be potential to provide economic drivers to this recovery through the development
application process and in environmental contributions and conditions being tightened as part
of the application process.
13
.6%
1.8
%
36
.4%
11
.7%
5.0
%
20
.0%
3.4
%
13
.0%
59
.5%
0%
10%
20%
30%
40%
50%
60%
70%
21
If Council wants a more detailed analysis of the waste streams it is recommended that a
physical waste audit should be undertaken over one week to establish baseline data to be
included in any waste management strategy.
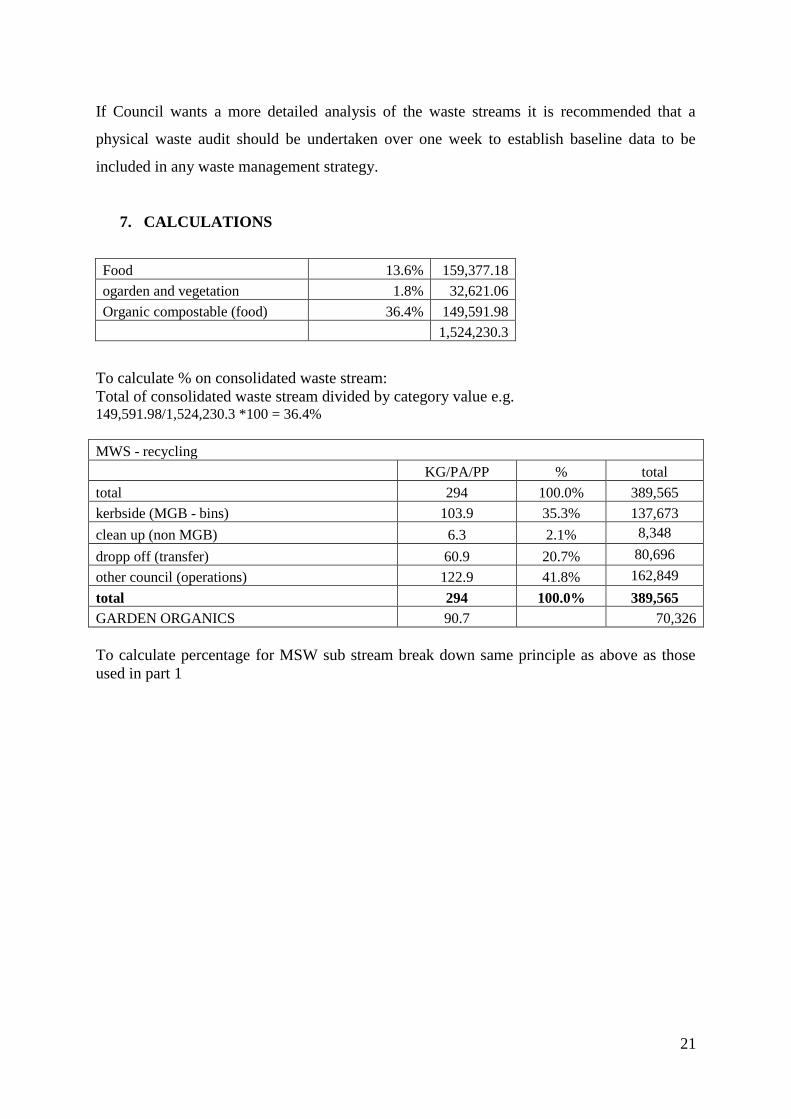
7. CALCULATIONS
Food 13.6% 159,377.18
ogarden and vegetation 1.8% 32,621.06
Organic compostable (food) 36.4% 149,591.98
1,524,230.3
To calculate % on consolidated waste stream:
Total of consolidated waste stream divided by category value e.g. 149,591.98/1,524,230.3 *100 = 36.4%
MWS - recycling
KG/PA/PP % total
total 294 100.0% 389,565
kerbside (MGB - bins) 103.9 35.3% 137,673
clean up (non MGB) 6.3 2.1% 8,348
dropp off (transfer) 60.9 20.7% 80,696
other council (operations) 122.9 41.8% 162,849
total 294 100.0% 389,565
GARDEN ORGANICS 90.7 70,326
To calculate percentage for MSW sub stream break down same principle as above as those
used in part 1
22
8. REFERENCES
Department of Environment, Climate Change and Water NSW, Waste avoidance and
resource recovery strategy progress report 2010,Sydney
Department of Environment, Climate Change and Water NSW, Waste avoidance and
resource recovery strategy progress report 2010, Sydney, March 2009, February 2011
Department of Environment, Climate Change and Water NSW, Commercial and industrial
waste in Sydney
Department of Environment, Climate Change and Water NSW, Commercial and industrial
waste in the Lower Hunter Region
Department of Environment, Climate Change and Water NSW, Report into the construction
and demolition waste stream audit 2000 – 2005, Sydney South, August 2007
WME the blue book Australian waste industry 2007/2008 Industry and market report
Department of the Environment, Water, Heritage and the Arts, National waste report 2010,
March 2010
The Office of Environment and Heritage, Department of premier and Cabinet, NSW Local
waste and resource recovery data report as reported by councils, 2009-2012, February 2012
www.absquickstas.com.au viewed 28 august 2012
23
Part 3: Selected facility design
Table of contents
3.1 Minor Transfer Station Design ........................................................................................... 24
3.1.1 Introduction .................................................................................................................. 24
3.1.2 Summary of assumptions and background data........................................................... 24
3.1.3 Process flow sheet ........................................................................................................ 26
3.1.4 Site layout, plan and sections ....................................................................................... 26
3.1.5 Important design parameters for the unit processes ..................................................... 26
3.1.6 Notes to the detail design engineers ............................................................................. 27
3.1.7 Calculations.................................................................................................................. 27
3.1.8 Operating procedure ..................................................................................................... 27
3.2 Major Transfer Station Design ............................................................................................ 29
3.2.1 Introduction .................................................................................................................. 29
3.2.2 Summary of assumptions and background data for the design of Belevi TS .............. 29
3.2.3 Process flow sheet ........................................................................................................ 32
3.2.4 Site layout, plan and sections ....................................................................................... 33
3.2.5 Important design parameters for the unit processes ..................................................... 34
3.2.6 Notes to the detail design engineers ............................................................................. 35
3.2.7 Calculations.................................................................................................................. 36
3.2.8 Analysis of the calculation data ................................................................................... 36
3.2.9 Operating procedure ..................................................................................................... 37
Reference ...................................................................................................................................... 39
24
3. Design of minor and major transfer stations
3.1 Minor Transfer Station Design
3.1.1 Introduction
Increased waste generation as a result of economic growth and consumption in Lower
Bunztal calls for adequate collection, disposal and treatment of wastes to meet social
expectation and environmental requirements.
Lower Bunztal regional council has ten small landfills serving smaller towns and villages. A
leachate problem identified from these landfills as well as the need for high level of service
has brought the council to decide on replacing these with neighbourhood style transfer
stations that will exclusively accept “other domestic” waste; embracing waste that cannot fit
into the normal domestic bins, disused furniture, clean-up waste, and garden waste.
As part of an efficient waste management system and in order to meet stringent
environmental legislations, councils tend to focus on keeping fewer but larger landfills.
Therefore, replacing the small landfills by small transfer stations is one of possible
alternatives that gives the advantage of cost effectiveness by reducing on one hand traffic
pressures and on the other hand improving materials screening and recovery.
A standard simplified design as requested by the council to reduce installation costs will be
used for all facilities.
Other background data and assumptions on which the design of the small transfer stations has
been based is provided in following sections.
3.1.2 Summary of assumptions and background data
In order to provide quality design of neighbourhood style transfer stations to the council,
assumptions as described below have been based on the need to maximize cost-effectiveness.
This has also been done by integrating best practice from benchmarked existing rural transfer
stations in Australia. This section also provides a summary of background data used; a
detailed analysis has been given in part 1 and part 2 of this assignment.
The minor transfer stations have been designed to accommodate waste from small
towns and villages in Lower Bunztal Region until the planning horizon which was
fixed for 2037 (details provided in part 1 of this assignment). The design quantities
25
have been calculated according to projected population growth and considerations of
socio-economic aspects in the ERA.
Construction of neighbourhood style transfer stations has been estimated to take up to
5 years according to best practice.
The small transfer stations will only accept “other domestic waste” (Moore S, 2012a),
other waste will be transported to major transfer stations and or landfill.
On the basis of current incoming waste trends for “other domestic waste” at small
transfer stations, 80% of the waste has been assumed to be received on weekends and
20% in weekdays.
For cost-effectiveness purposes and according to benchmarked existing rural transfer
stations, no pit and compaction equipments will be provided (US EPA, 2002). Waste
classified as “other domestic waste” will be directly unloaded into open topped bins.
According to available sizes on the market, the volume of the bins to be provided is
30 m3. These will be 2m high.
For economical reasons, no weighbridge will be provided at the minor transfer
stations due to the lower waste volumes generally received (Department of
Environment and Conservation NSW, 2006), however provision for potential future
installation has been considered.
For the same reasons as above, sufficient bins will be provided to store waste during
one week prior to be hauled to the landfill on Mondays. This has been decided in
order to optimize service charges to customers which may be affected by higher
transport costs to the landfill using prime movers.
To the required number of bins, one extra bin will be added so as to allow
replacement of full bins without removing the others from their positions while ready
to accept waste.
A survey undertaken at two minor landfills and Belevi Landfill indicates that small
car/trailer traffic is:
o Small car/trailer traffic on weekends: (90%) 8.6 cars/1,000 people/day.
o Small car/trailer traffic on weekday: (90%) 2.8 cars/1,000 people/day.
26
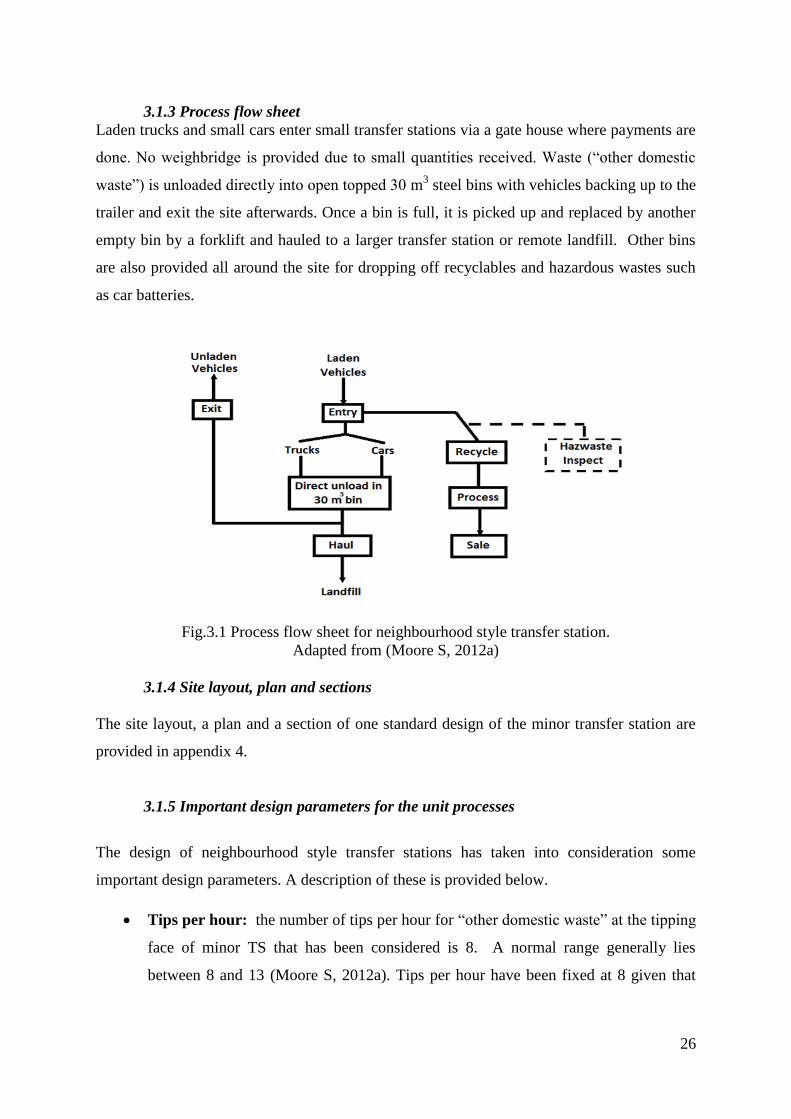
3.1.3 Process flow sheet
Laden trucks and small cars enter small transfer stations via a gate house where payments are
done. No weighbridge is provided due to small quantities received. Waste (“other domestic
waste”) is unloaded directly into open topped 30 m3 steel bins with vehicles backing up to the
trailer and exit the site afterwards. Once a bin is full, it is picked up and replaced by another
empty bin by a forklift and hauled to a larger transfer station or remote landfill. Other bins
are also provided all around the site for dropping off recyclables and hazardous wastes such
as car batteries.
Fig.3.1 Process flow sheet for neighbourhood style transfer station.
Adapted from (Moore S, 2012a)
3.1.4 Site layout, plan and sections
The site layout, a plan and a section of one standard design of the minor transfer station are
provided in appendix 4.
3.1.5 Important design parameters for the unit processes
The design of neighbourhood style transfer stations has taken into consideration some
important design parameters. A description of these is provided below.
Tips per hour: the number of tips per hour for “other domestic waste” at the tipping
face of minor TS that has been considered is 8. A normal range generally lies
between 8 and 13 (Moore S, 2012a). Tips per hour have been fixed at 8 given that
27
waste is unloaded by customers themselves and considering that lack of experience
increase the time to unload.
Peak ratio: A 0.2 peak ratio has been used for the calculation of the number of bays
required for small vehicles (Moore S, 2012a). This ratio is for a peak hour on a peak
day which assumes that 20% of vehicles come in during peak hour.
Density of waste: the density of loose waste, 200 kg/m3, has been applied to the total
projected “other domestic waste” to disposal in 2037 in the calculation of the volume
of waste expected to be received by the minor transfer station because there is no
compaction done (Moore S, 2012a).
3.1.6 Notes to the detail design engineers
As part of the detailed design, there is a need to consider the following as part of the
occupational health and safety measures.
Provide a small raised concrete edge on the platform in order to stop vehicles from
backing over the platform edge;
Provide hand rails on all platform edges in order to prevent customers from falling
into the bins while unloading/disposing of waste;
Provide for water storage to use in case of fire control;
Provide for possible future installation of weighbridge at the entrance.
Furthermore, taking advantage of the proposed site topography, natural grades within the site
can reduce construction costs to create a raised platform.
3.1.7 Calculations
Calculations for the design of the minor transfer station are shown in appendix 5.
3.1.8 Operating procedure
3.1.8.1 Usage
The facility will operate 363 days (closed in Christmas and Good Friday) from
12:00PM to 2:00 PM;
No small business or commercial waste will be accepted.
3.1.8.2 Requirements
Proof of residency will be required to be allowed access into the facilities. Residents without
the necessary proof of residency will need to get an authorization certification from their city.
28
3.1.8.3 Materials accepted
Residential:
Home furnishings
Garden waste
Special waste:
Lead acid batteries
Used motor oil
Oil-based paints
Tires
Recyclable Materials:
Ferrous metals: home appliances
Non-Ferrous metals: aluminum, copper and auto radiators empty of any
liquids
3.1.8.4 Materials not accepted
Garbage
Any liquids (gas, etc.)
Abandoned vehicles or vehicle parts
Hazardous waste
Radioactive materials
Explosives;
Body waste and dead animals
Fuel tanks, gas tanks, cylinder tanks
3.1.8.5 Prohibited vehicles
Pickup truck which has been altered or modified from the original design of the
vehicle
to permit loading in excess of designed capacity for the truck body;
Truck or vehicle with capacity design which is greater than 1.5 tons.
3.1.8.6 Regulations
29
Residents have to off-load and place material into the bins themselves and must abide by the
unloading direction of the site supervisor. Children under the age of 16 are not permitted in
the unloading area. Care and caution shall be exercised at all times. Access and offloading
assistance is provided for the disabled.
3.2 Major Transfer Station Design
3.2.1 Introduction
Lower Bunztal Regional Council is located on the south coast of New South Wales (200 km
of south of Sydney). This council has some problems with the management of waste, so it has
considered to close the Belevi Landfill and replace it with a major transfer station (TS) to be
called Belevi Transfer Station (TS).
Belevi TS is part of the new regional solid waste system which includes among other
facilities a composting plant and a material recovery facility. This major TS will bulk haul
half of the waste generated by Metapolis (Lower Bunztal Regional Council's city) to a new
landfill to be located 45 km west of this city and will only accept municipal and commercial
& industrial waste to disposal. Building and demolition waste will be hauled directly to the
new landfill. The period of construction of Belevi TS will be 5 years and the end of the
planning horizon considered was 20 years.
A concept design report has been prepared as council's petition which contains all the
essential information needed by other engineers to proceed with the detail design of Belevi
TS. Summary of assumptions, background data, process flow sheet showing processes and
flows of identified goods between unit processes, sketches of a site layout, a plan, one cross
section of the TS, important design parameters for the unit processes, notes to the detail
design engineers, calculations and comments on the meaning of the results and their
implication for waste management has been provided as part of the concept design report.
3.2.2 Summary of assumptions and background data for the design of Belevi TS
A number of assumptions and background data base on practical experience and cost-
effectiveness have been considered for the design of Belevi TS. This assumptions and
background data are also based on the analysis presented in part 1 and part 2 of this
document.
30
3.2.2.1 Background data
Lower Bunztal Regional Council intends to close the major landfill (Belevi Landfill)
and replace it with a major transfer station named for the purpose of this report Belevi
Transfer Station (TS).
Belevi TS will be located 10 km to the south west of Metapolis and will bulk haul half
of the city’s waste to a new landfill to be located 45 km west of Metapolis. Council
plans to have another similar sized transfer station on the northern side of the Corbyn
River.
According to 2011 census, Metapolis had a population of 1,000,000 people.
The growth rate over the past 5 years was 2.1% due to retirees from Sydney and
increasing tourism.
According to the waste stream amount analysis undertaken in part 1, the amount of
MSW & C&I generated by Metapolis's city was 1,797,775 tonnes in 2027. The
amount of waste generated was 2,476 t/day.
According to a survey undertaken at the Belevi Landfill and two minor landfills
indicates that small car/trailer traffic is:
o Small car/trailer traffic on weekends: (90%) 8.6 cars/1,000 people/day.
o Small car/trailer traffic on weekday: (90%) 2.8 cars/1,000 people/day.
Results of some selective weighings of compactors and other trucks using the Belevi
Landfill on Mondays is shown in the table 3.1 below.
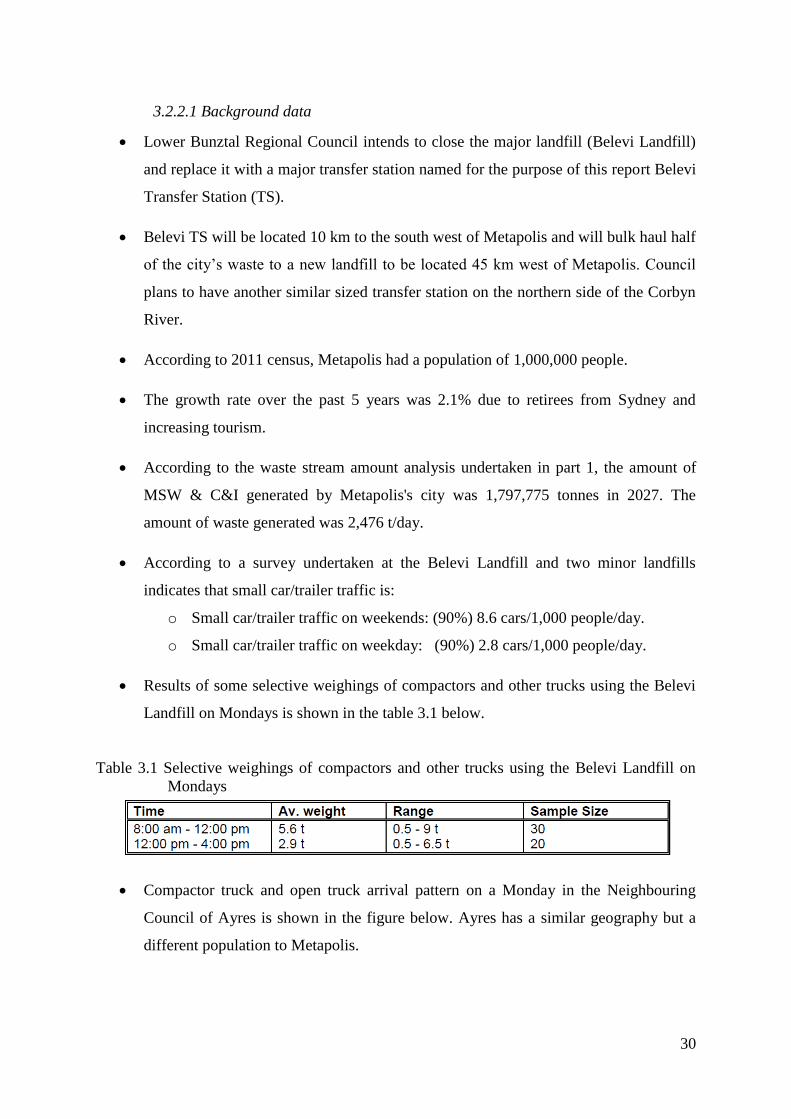
Table 3.1 Selective weighings of compactors and other trucks using the Belevi Landfill on
Mondays
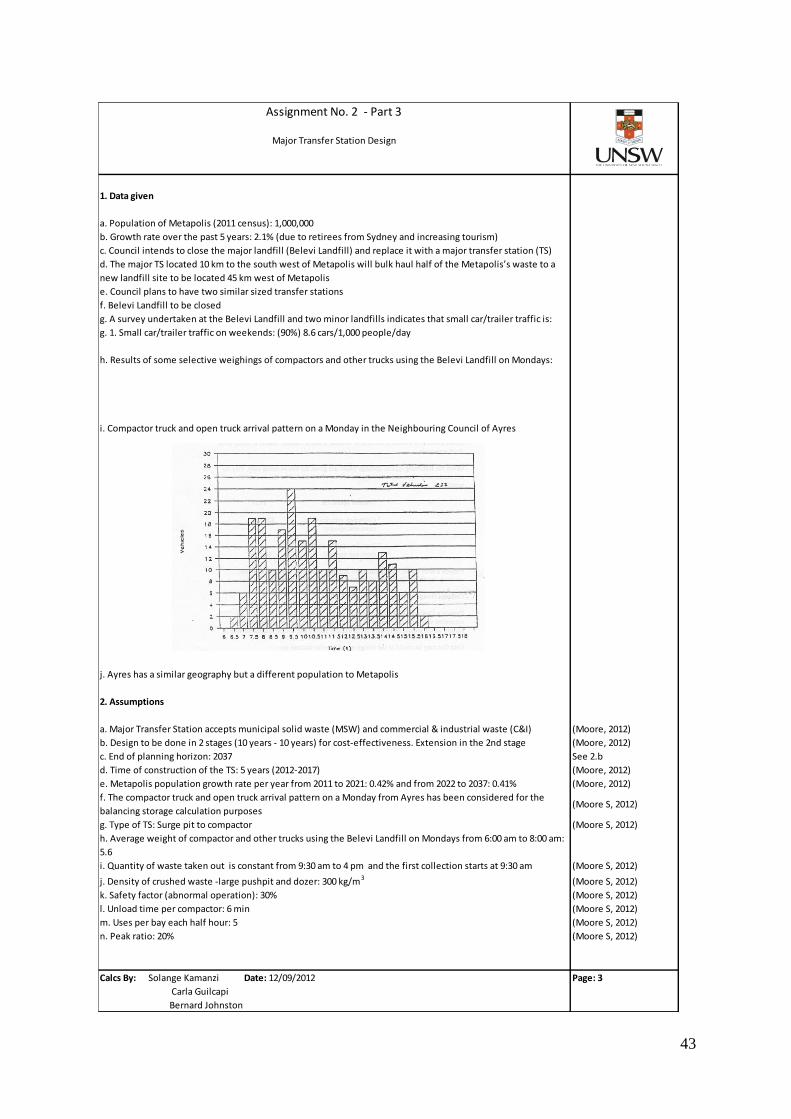
Compactor truck and open truck arrival pattern on a Monday in the Neighbouring
Council of Ayres is shown in the figure below. Ayres has a similar geography but a
different population to Metapolis.
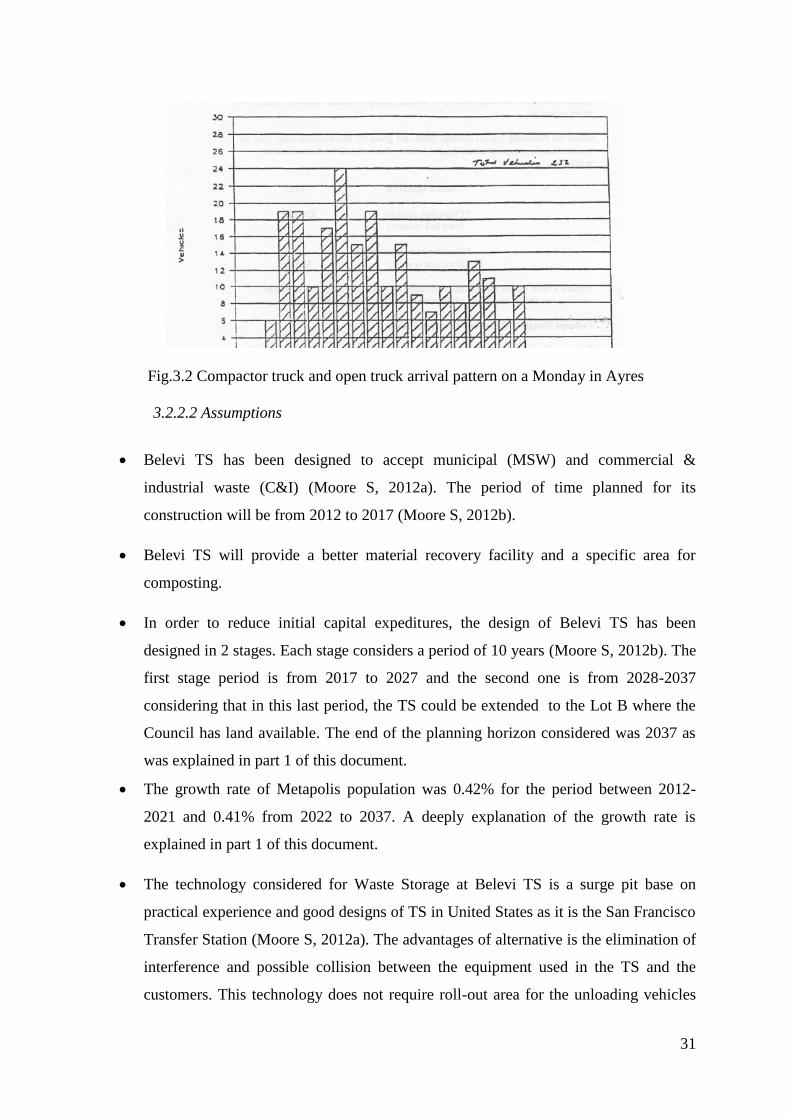
31
Fig.3.2 Compactor truck and open truck arrival pattern on a Monday in Ayres
3.2.2.2 Assumptions
Belevi TS has been designed to accept municipal (MSW) and commercial &
industrial waste (C&I) (Moore S, 2012a). The period of time planned for its
construction will be from 2012 to 2017 (Moore S, 2012b).
Belevi TS will provide a better material recovery facility and a specific area for
composting.
In order to reduce initial capital expeditures, the design of Belevi TS has been
designed in 2 stages. Each stage considers a period of 10 years (Moore S, 2012b). The
first stage period is from 2017 to 2027 and the second one is from 2028-2037
considering that in this last period, the TS could be extended to the Lot B where the
Council has land available. The end of the planning horizon considered was 2037 as
was explained in part 1 of this document.
The growth rate of Metapolis population was 0.42% for the period between 2012-
2021 and 0.41% from 2022 to 2037. A deeply explanation of the growth rate is
explained in part 1 of this document.
The technology considered for Waste Storage at Belevi TS is a surge pit base on
practical experience and good designs of TS in United States as it is the San Francisco
Transfer Station (Moore S, 2012a). The advantages of alternative is the elimination of
interference and possible collision between the equipment used in the TS and the
customers. This technology does not require roll-out area for the unloading vehicles
32
due to the fact that waste is disposed directly into the surge pit from the back of the
trucks (US EPA, 2002).
Belevi TS will operate 363 days, and it will be closed in Christmas and Good Friday
according to practical experience.
Due to lack of data of arrival pattern at Belevi Landfill, the compactor truck and open
truck arrival pattern on a Monday in the Neighbouring Council of Ayres has been
used for the design of the balancing storage capacity of Belevi TS considering as well
that Ayres has a similar geography to Metapolis.
The average weight of compactor and other trucks in the Belevi Landfill on Mondays
from 6:00 am to 8:00 am that has been considered is 5.6 because at this period of
time, it is expected similar quantity of vehicles than in the schedule from 8:00 am to
12:00 pm.
According to expert's practical experience, it has been considered that the first
collection of solid waste to haul to landfill starts at 9:30. From this time to 4pm, the
quantity of waste taken out is constant (Moore S, 2012a).
The assumptions related to the parameters number of tips per hour, peak ratio, small
car/trailer traffic on weekends, density of waste, safety factor, unloading time, number
of uses per bay, width of bay, depth of the surge pit, have been described in the
section 3.2.5
3.2.3 Process flow sheet
The figure 3.3 shows the flowchart process in Belevi TS. Laden vehicles come to the entry of
the gate house to be weight. The unit rate for other domestic waste and the rate by weight for
other waste to disposal are usually charged at the entry. Once inside, cars and trucks unload
the waste in different tipping areas to avoid collision between them. Possibly on weekends,
cars unload other domestic waste in both sides of the push pit letting a small space to trucks
to unload. Once in the tipping face, trucks and cars unload waste into a 4739 m3 surge pit of 4
m deep and 18 m wide. There could be a recovery of steel or aluminum from some home
appliances, such as refrigerators and washing machines which are disposed in bins to be sold.
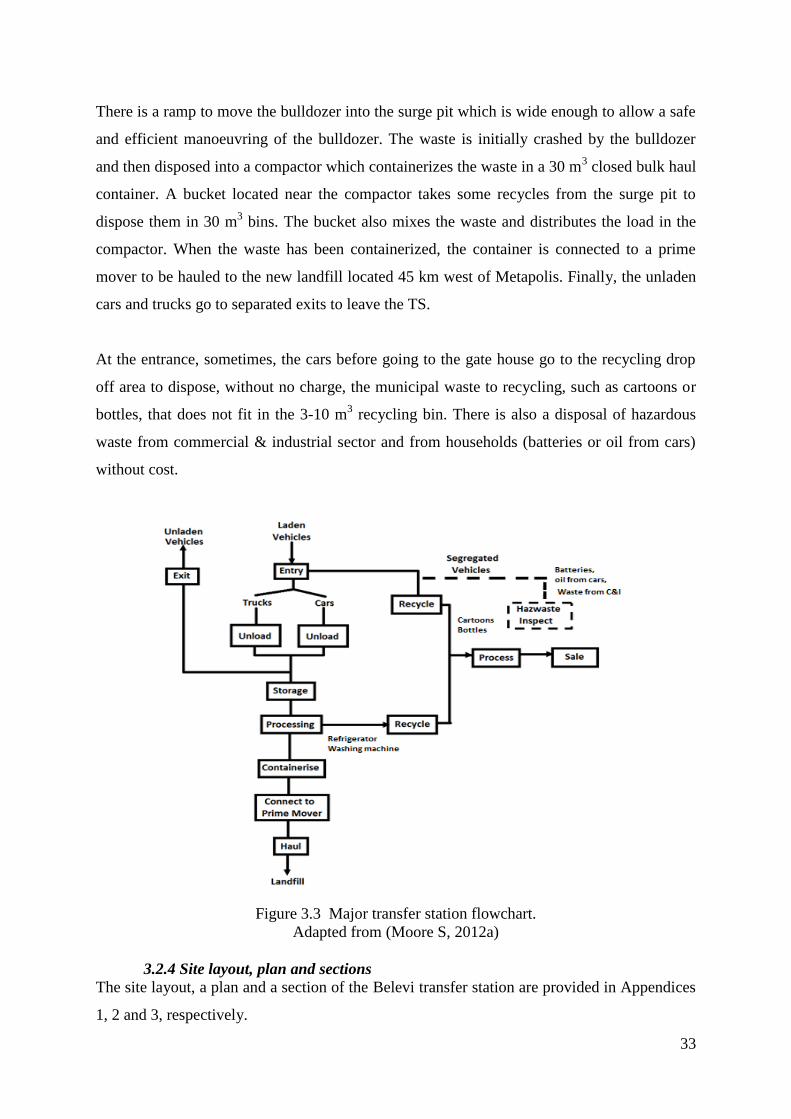
33
There is a ramp to move the bulldozer into the surge pit which is wide enough to allow a safe
and efficient manoeuvring of the bulldozer. The waste is initially crashed by the bulldozer
and then disposed into a compactor which containerizes the waste in a 30 m3 closed bulk haul
container. A bucket located near the compactor takes some recycles from the surge pit to
dispose them in 30 m3 bins. The bucket also mixes the waste and distributes the load in the
compactor. When the waste has been containerized, the container is connected to a prime
mover to be hauled to the new landfill located 45 km west of Metapolis. Finally, the unladen
cars and trucks go to separated exits to leave the TS.
At the entrance, sometimes, the cars before going to the gate house go to the recycling drop
off area to dispose, without no charge, the municipal waste to recycling, such as cartoons or
bottles, that does not fit in the 3-10 m3 recycling bin. There is also a disposal of hazardous
waste from commercial & industrial sector and from households (batteries or oil from cars)
without cost.
Figure 3.3 Major transfer station flowchart.
Adapted from (Moore S, 2012a)
3.2.4 Site layout, plan and sections
The site layout, a plan and a section of the Belevi transfer station are provided in Appendices
1, 2 and 3, respectively.
34
3.2.5 Important design parameters for the unit processes
The design of Belevi TS has taken into consideration some important design parameters such
as:
Number of tips per hour: this parameter is used in the calculation of number of
bays required by small vehicles. The number of tips per hour for “other domestic
waste” at the tipping face varies from 8 to 13 (Moore S, 2012b). For the design of
Belevi TS, the number of tips per hour considered was 13 due to the fact that casual
labour can be hired improving the time of waste unloading and reducing waste of
time in the unloading done by customers.
Peak ratio: this parameter is used in the calculation of number of bays required by
small vehicles. A 0.2 peak ratio has been used for the calculation of the number of
bays required for small vehicles (Moore S, 2012b). This ratio is for a peak hour on a
peak day which assumes that 20% of vehicles come in during peak hour.
Small car/trailer traffic on weekends: this parameter is used in the calculation of
number of bays required by small utes, trailer or vehicles. A value of 5 cars/1,000
people/day was considered in order to reduce the length of the tipping floor and with
it the cost of construction, so the council will have to provide a better service for the
collection of other domestic waste from the kerbside.
Density of waste: this parameter is used for the calculation of the volume of storage.
A density of waste equal to 300 kg/m3 has been considered because the technology to
be used in the waste storage is a surge pit where bulldozer crushes the waste before
its compaction (Moore S, 2012a).
Safety factor: this parameter is used for the calculation of the volume of storage. A
safety factor of 30% have been considered due to possible abnormal operation
(Moore S, 2012a).
Unloading time and uses per bay: this parameter is used for the calculation of
number of bay used by compactors. Unloading time of 6 minutes/per compactor was
considered due to practical experience (Moore S, 2012a). Taken into consideration
this time, the uses per bay each half hour would be 5.
35
Width of bay: this parameter is used for the calculation of the length of the tipping
face. A value of 2.8 m has been considers according to practical experience (Moore
S, 2012a).
Depth of the surge pit: this parameter is used for the calculation of the storage
capacity. According to best practice from benchmarked existing transfer stations in
the United States of America specifically in San Francisco, the depth of a surge pit to
storage 2000 t/d is around 4 to 5.5 m (Unknown, 2012), so for the design of Belevi
TS of 2476 t/d storage capacity, a depth value of 4 m has been considered.
3.2.6 Notes to the detail design engineers
The detail design engineers should include the following notes in their designs in order to
avoid the generation of noise, odors, dust, vectors, traffic and litter and to assure occupational
health and safety measures in Belevi TS.
3.2.6.1 Noise control (US EPA, 2002):
Use concrete walls and structures to assure a better sound absorption.
Install double-glazed windows to assure a better containment of noise.
Install barriers or fences, such as trees or walls, around the facility to absorb noise.
Provide long and continuous barriers to avoid undesirable receptors.
3.2.6.2 Odors control (US EPA, 2002):
Install neutralizing systems with deodorants to counteract odors.
Plant natural barriers, such as trees, to absorb and disperse odors.
Install plastic curtains at the entry and exit doors to contain odors.
Design easy cleanup floors with concrete surfaces and positive slope to drainage
systems.
Eliminate corners, crevices, and flat surfaces to avoid waste accumulation.
Seal semiporous surfaces to prevent absorption of odors.
3.2.6.3 Dust control (US EPA, 2002):
Align building openings to reduce exposure to predominant winds.
Provide curtains of plastic over building openings.
36
Provide misting systems over the tipping face area to pull down dust particles.
3.2.6.4 Vectors (e.g., rats, mice, cockroaches, and other insects) (US EPA, 2002):
Seal openings to avoid rodents and insects entrance
Install hanging or suspended wires to keep birds out of the facility and eliminate
horizontal surfaces to avoid birds congregation.
3.2.6.5 Traffic (US EPA, 2002):
Provide adequate onsite queuing space to avoid traffic interference.
Provide bright natural and artificial lighting inside the facility.
Add offsite directional signals and pavement markings.
Provide lanes for acceleration and deceleration in order to reduce congestion.
3.2.6.6 Litter (US EPA, 2002):
Design structures to account for prevailing wind direction.
Check that all trucks are leak-proof to avoid leachate spills on streets.
Provide covers for skip bins and containers.
Include litter traps to protect the stormwater drainage system.
3.2.6.7 OH&S (US EPA, 2002):
Use concrete lips to prevent that cars and trucks reversing too close to the surge pit.
3.2.7 Calculations
Calculations for the design of the major transfer station (Belevi TS) are shown in Appendix 5.
3.2.8 Analysis of the calculation data
Belevi TS has been designed in 2 stages of 10 years each of them. The time of construction is
5 years and the end of the planning horizon is 2037. This major transfer station will have a
storage capacity of 2476 t/d to manage 898,888 tonnes of MSW & C&I waste generated by
half of the Metapolis's population to be 534,217 people in 2027. Belevi TS will not accept
building & demolition waste. The dimensions of the surge pit of Belevi TS transfer station
are: 4 m deep, 18 m wide and 65 m long and the number of bays required is 45.
The dimensions obtained show that Belevi TS will not have vehicle queuing problems due to
the fact that the length of the tipping face is long enough with a value of 65 m. However, the
37
council should provide a better service for the collection of other domestic waste from the
kerbside because if it were considered the current levels according to the survey undertaken
at the Belevi Landfill which are 8.6 cars/1,000 people/peak day, the dimension of the length
would increase and also the initial capital expenditures in the construction of Belevi TS.
On the other hand, the number of bays that Belevi TS will require is 46. This value is within
the typical range, 45 to 66 bays for 12,000 to 8,000 people, respectively according to experts
in the design of TS (Moore, 2012). The width of the surge pit is also within typical range 15 -
20 m (Moore, 2012).
The extension of Belevi TS is planned to start in 2028, and it will not cause problems to the
surrounding communities because the land is property of the council. The society will be
satisfied with this proposal because the management of waste will be improved with Belevi
TS that now includes a better MRF and composting plant.
3.2.9 Operating procedure (US EPA, 2002)
The operating procedure to be applied in Belevi Transfer Station is shown below.
3.2.9.1 Usage
The facility will operate 363 days (closed in Christmas and Good Friday) from
Monday to Friday in the schedule 06:00 am to 4:00 pm.
Municipal and commercial & industrial waste will be accepted.
Building & demolition waste will not be accepted.
3.2.9.2 Materials accepted
Residential and commercial & industrial: putrescible and nonputrescible, such as:
Furnishings
Garden waste
Discarded containers, packaging, food wastes, and paper products
Household hazardous waste: hazardous materials generated by households, such as:
Cleaning products
Lead acid batteries
Used motor oil
38
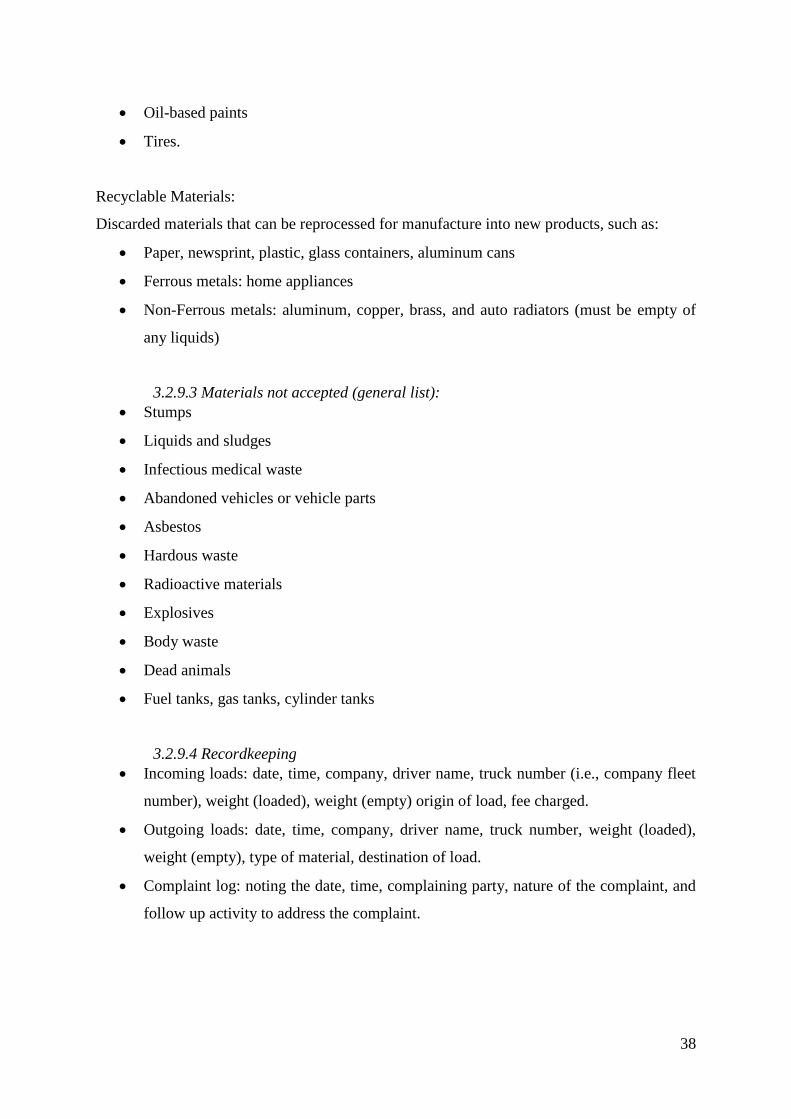
Oil-based paints
Tires.
Recyclable Materials:
Discarded materials that can be reprocessed for manufacture into new products, such as:
Paper, newsprint, plastic, glass containers, aluminum cans
Ferrous metals: home appliances
Non-Ferrous metals: aluminum, copper, brass, and auto radiators (must be empty of
any liquids)
3.2.9.3 Materials not accepted (general list):
Stumps
Liquids and sludges
Infectious medical waste
Abandoned vehicles or vehicle parts
Asbestos
Hardous waste
Radioactive materials
Explosives
Body waste
Dead animals
Fuel tanks, gas tanks, cylinder tanks
3.2.9.4 Recordkeeping
Incoming loads: date, time, company, driver name, truck number (i.e., company fleet
number), weight (loaded), weight (empty) origin of load, fee charged.
Outgoing loads: date, time, company, driver name, truck number, weight (loaded),
weight (empty), type of material, destination of load.
Complaint log: noting the date, time, complaining party, nature of the complaint, and
follow up activity to address the complaint.

39
9. REFERENCE
DEPARTMENT OF ENVIRONMENT AND CONSERVATION NSW 2006. Handbook for
Design and Operation of Rural and Regional Transfer Stations. Department of
Environment and Conservation NSW.
MOORE S 2012a. CVEN9872 Solid Waste Management, Transfer stations. University of
New South Wales, Sydney.
MOORE S. 11 September, 31 August 2012b. RE: Personal Communication.
UNKNOWN 2012. CVEN9872 Lecture Notes Unit 5: Transfer Stations.
US EPA 2002. Waste Transfer Stations: A Manual for Decision-Making. US EPA.
40
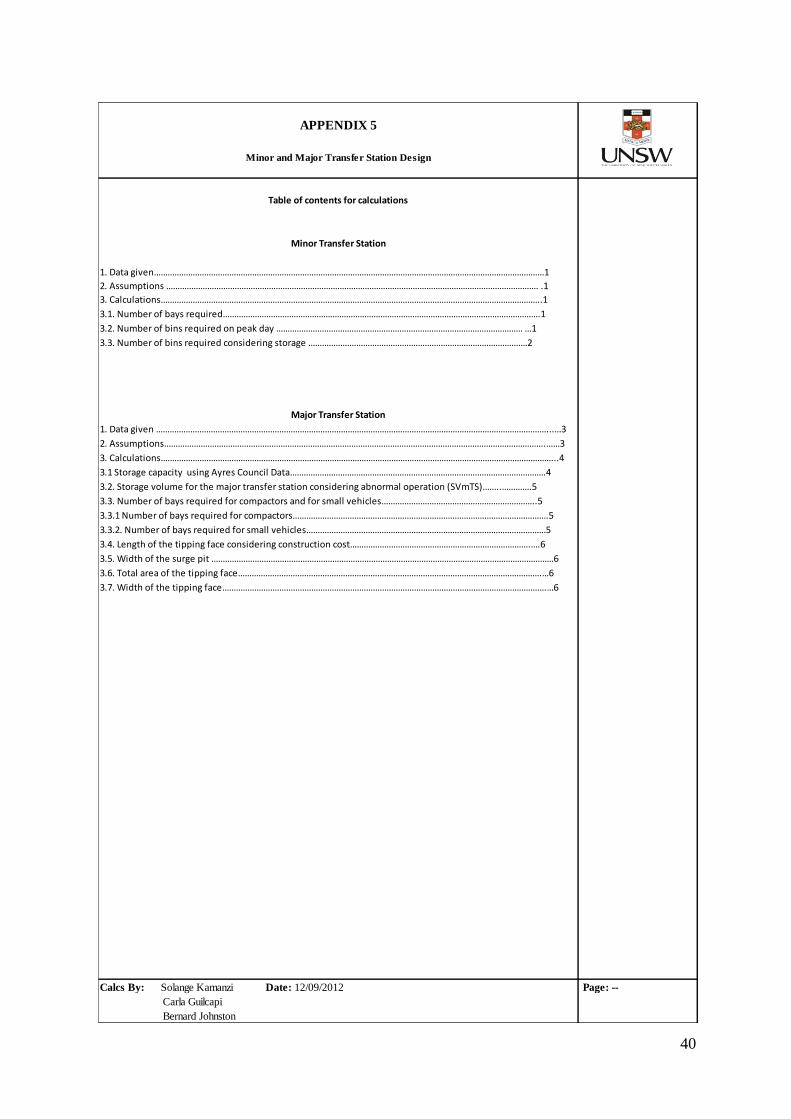
APPENDIX 5
Minor and Major Transfer Station Design
Table of contents for calculations
Minor Transfer Station
1. Data given………………………………………………………………………………………………………………………………………………………1
2. Assumptions ………………………………………………………………………………………………………………………………………………. .1
3. Calculations…………………………………………………………………………………………………………………………………………………..1
3.1. Number of bays required………………………………………………………………………………………………………………………….1
3.2. Number of bins required on peak day ……………………………………………………………………………………………… …1
3.3. Number of bins required considering storage ……………………………………………………………………………………2
Major Transfer Station
1. Data given ………………………………………………………………………………………………………………………………………………………...…3
2. Assumptions…………………………………………………………………………………………………………………………………………………..……3
3. Calculations………………………………………………………………………………………………………………………………………………………...4
3.1 Storage capacity using Ayres Council Data………………………………………………………………………………………………….4
3.2. Storage volume for the major transfer station considering abnormal operation (SVmTS)……..………….5
3.3. Number of bays required for compactors and for small vehicles…………………………………………………………..5
3.3.1 Number of bays required for compactors………………………………………………………………………………………………….5
3.3.2. Number of bays required for small vehicles……………………………………………………………………………………………5
3.4. Length of the tipping face considering construction cost…………………………………………………………………….….6
3.5. Width of the surge pit ……………………………………………………………………………………………………………………………………6
3.6. Total area of the tipping face…………………………………………………………………………………………………………………….…6
3.7. Width of the tipping face…………………………………………………………………………………………………………………………….…6
Calcs By: Solange Kamanzi Date: 12/09/2012 Page: --
Carla Guilcapi
Bernard Johnston
41
42
43
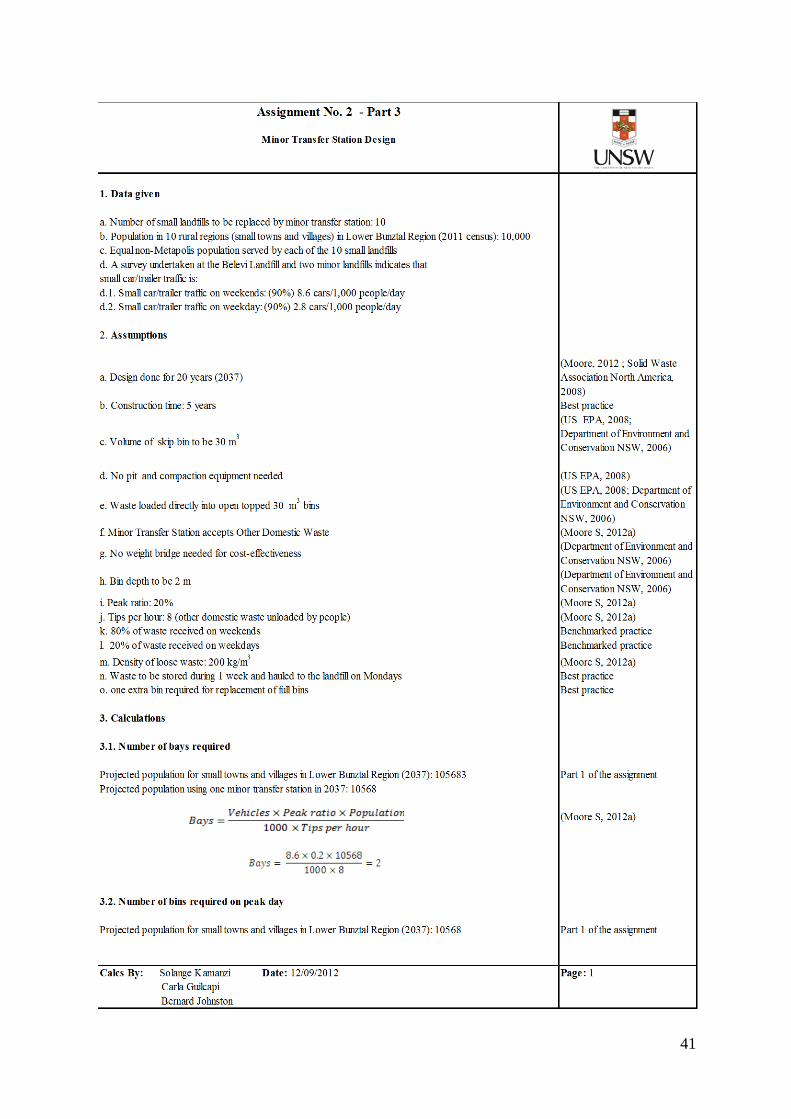
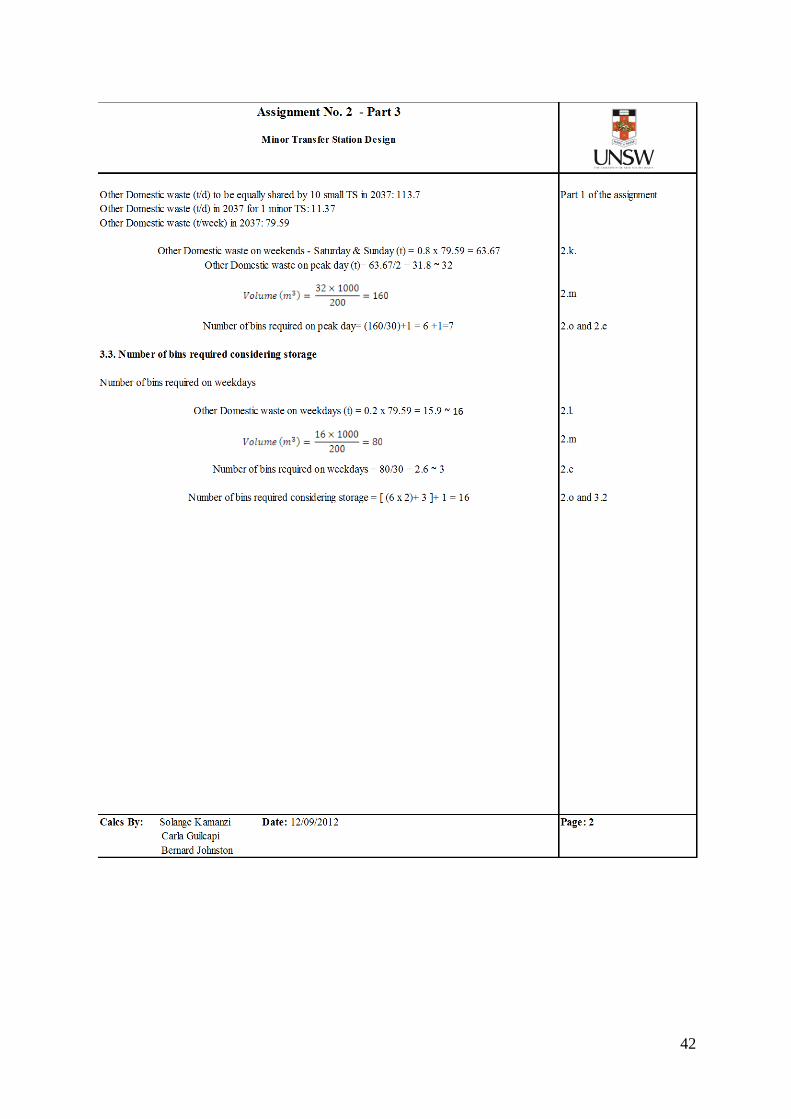
Assignment No. 2 - Part 3
Major Transfer Station Design
1. Data given
a. Population of Metapolis (2011 census): 1,000,000
b. Growth rate over the past 5 years: 2.1% (due to retirees from Sydney and increasing tourism)
c. Council intends to close the major landfill (Belevi Landfill) and replace it with a major transfer station (TS)
d. The major TS located 10 km to the south west of Metapolis will bulk haul half of the Metapolis’s waste to a
new landfill site to be located 45 km west of Metapolis
e. Council plans to have two similar sized transfer stations
f. Belevi Landfill to be closed
g. A survey undertaken at the Belevi Landfill and two minor landfills indicates that small car/trailer traffic is:
g. 1. Small car/trailer traffic on weekends: (90%) 8.6 cars/1,000 people/day
h. Results of some selective weighings of compactors and other trucks using the Belevi Landfill on Mondays:
i. Compactor truck and open truck arrival pattern on a Monday in the Neighbouring Council of Ayres
j. Ayres has a similar geography but a different population to Metapolis
2. Assumptions
a. Major Transfer Station accepts municipal solid waste (MSW) and commercial & industrial waste (C&I) (Moore, 2012)
b. Design to be done in 2 stages (10 years - 10 years) for cost-effectiveness. Extension in the 2nd stage (Moore, 2012)
c. End of planning horizon: 2037 See 2.b
d. Time of construction of the TS: 5 years (2012-2017) (Moore, 2012)
e. Metapolis population growth rate per year from 2011 to 2021: 0.42% and from 2022 to 2037: 0.41% (Moore, 2012)
f. The compactor truck and open truck arrival pattern on a Monday from Ayres has been considered for the
balancing storage calculation purposes(Moore S, 2012)
g. Type of TS: Surge pit to compactor (Moore S, 2012)
h. Average weight of compactor and other trucks using the Belevi Landfill on Mondays from 6:00 am to 8:00 am:
5.6
i. Quantity of waste taken out is constant from 9:30 am to 4 pm and the first collection starts at 9:30 am (Moore S, 2012)
j. Density of crushed waste -large pushpit and dozer: 300 kg/m3 (Moore S, 2012)
k. Safety factor (abnormal operation): 30% (Moore S, 2012)
l. Unload time per compactor: 6 min (Moore S, 2012)
m. Uses per bay each half hour: 5 (Moore S, 2012)
n. Peak ratio: 20% (Moore S, 2012)
Calcs By: Solange Kamanzi Date: 12/09/2012 Page: 3
Carla Guilcapi
Bernard Johnston
44
Assignment No. 2 - Part 3
Major Transfer Station Design
o. Tips per hour: 13 (casual labour hired) (Moore S, 2012)
p. Depth of the surge pit (m): 4 (Moore, 2012)
q. Two sides (tipping face) to unload into the surge pit (Moore S, 2012)
r. Width of each bay (m): 2.8 (Moore S, 2012)
s. In order to reduce construction cost (related to tipping floor), Council should provide a better service for the
collection of other domestic waste from the kerbside => Small car/trailer traffic on weekends: (5 cars/1,000
people/day)
t. Transfer station operates 363 days and it is closed 2 days: Christmas and Good Friday
3. Calculations
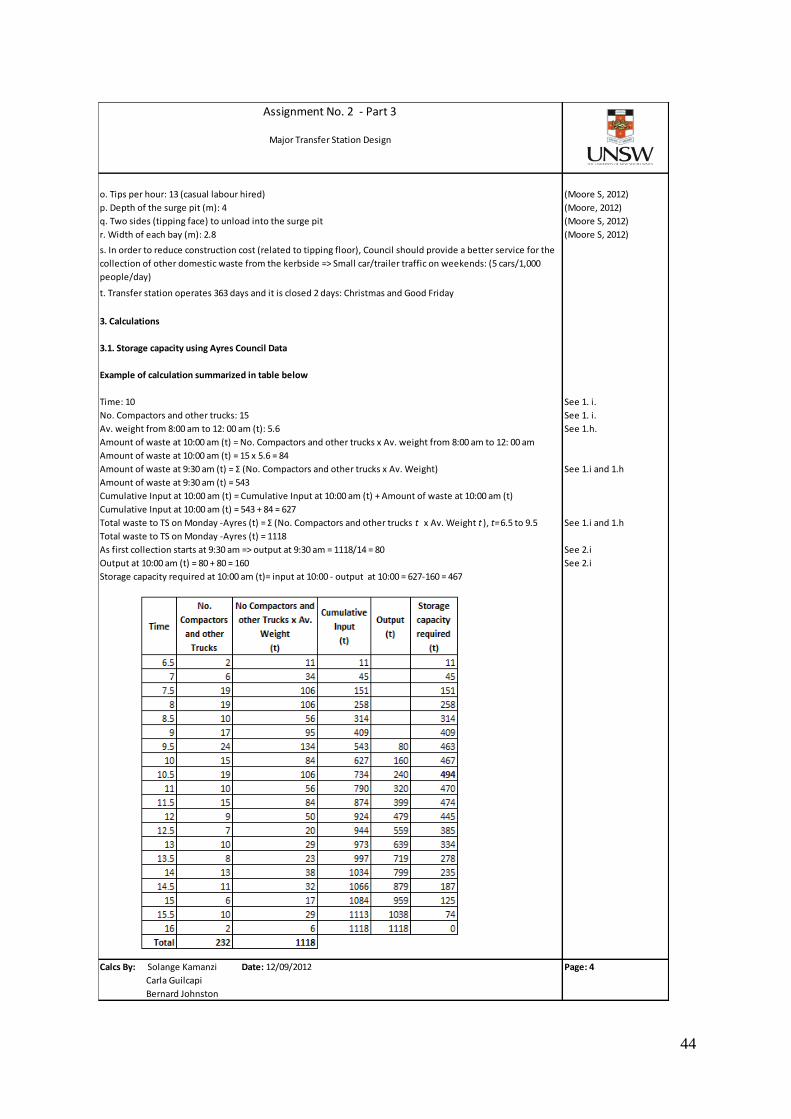
3.1. Storage capacity using Ayres Council Data
Example of calculation summarized in table below
Time: 10 See 1. i.
No. Compactors and other trucks: 15 See 1. i.
Av. weight from 8:00 am to 12: 00 am (t): 5.6 See 1.h.
Amount of waste at 10:00 am (t) = No. Compactors and other trucks x Av. weight from 8:00 am to 12: 00 am
Amount of waste at 10:00 am (t) = 15 x 5.6 = 84
Amount of waste at 9:30 am (t) = Σ (No. Compactors and other trucks x Av. Weight) See 1.i and 1.h
Amount of waste at 9:30 am (t) = 543
Cumulative Input at 10:00 am (t) = Cumulative Input at 10:00 am (t) + Amount of waste at 10:00 am (t)
Cumulative Input at 10:00 am (t) = 543 + 84 = 627
Total waste to TS on Monday -Ayres (t) = Σ (No. Compactors and other trucks t x Av. Weight t ), t=6.5 to 9.5 See 1.i and 1.h
Total waste to TS on Monday -Ayres (t) = 1118
As first collection starts at 9:30 am => output at 9:30 am = 1118/14 = 80 See 2.i
Output at 10:00 am (t) = 80 + 80 = 160 See 2.i
Storage capacity required at 10:00 am (t)= input at 10:00 - output at 10:00 = 627-160 = 467
Calcs By: Solange Kamanzi Date: 12/09/2012 Page: 4
Carla Guilcapi
Bernard Johnston
45
46
Assignment No. 2 - Part 3
Major Transfer Station Design
3.4 Length of the tipping face considering construction cost
Length of the tipping face considering construction cost = Total number of bays x width of bay (m) See 2.r.
Length of the tipping face considering construction cost (m) = 46 x 2.8 = 129 => 130
Length of one side of the tipping face considering construction cost (m) = 65
3.5. Width of the surge pit
Width of the surge pit (m) = SVmTS / Length of one side of tipping face / Depth of the surge pit See 3.2., 3.4., 2.p.
Width of the surge pit (m) = 1,967 / 65 / 2 = 15
3.6. Total area of the tipping face
Total area of the tipping face (m2) = 400 m2 + ( Half of the Metapolis's MSW & C&I waste generated per day (t) x
1,8 m2) (Solid Waste Association
North America, 2008)
Total area of the tipping face (m2) = 400 m2 + ( 2476 x 1,8 m2) = 4857
3.7. Width of the tipping face
Width of the tipping face (m) = Total area of the tipping floor (m2) / Length of one side of the tipping face (m)/2See 3.6. and 3.4.
Width of the tipping face (m) = 4857 / 65 / 2 = 37
Calcs By: Solange Kamanzi Date: 12/09/2012 Page: 6
Carla Guilcapi
Bernard Johnston