Embed Size (px)
Citation preview

WASTE MANAGEMENT AND RECYCLING FOR SUSTAINABLE LOCAL ECONOMIC DEVELOPMENT: Proactive and Reactive Strategies Georgia Institute of Technology City and Regional Planning Program Planning Local Economic Development, 2007
Nelson DavisNancy GalewskiYewande Robinson-Freeman
Nancey Green Leigh, PhD, Professor Joy Wilkins, CEcD, Co-Advisor Nancy Galewski, Final Report Coordinator Copyright 2007 Georgia Institute of Technology
Contents Introduction: Landfill Management……………………………………………………….3
Case Studies………………………………………………………..……………………...5
Zero Waste…………………………………………………………..…………………….6
Case Study: San Francisco-Norcal Waste Systems……………………………………...14
Recycling……………………………………………………………………………..….19
Case Study: Orange Grove Recycling Center-Tennessee…….…………………....……28
Landfill Gas to Energy……………………………………………………………….......31
Case Study: Interface Flooring and LaGrange, Georgia…………………………………41
Conclusion………………………………………………………………….................…44
Appendix 1…………………………………………………………………………….…45
Appendix 2…………………………………………………………………………….…46
Appendix 3…………………………………………………………………………….…48
References……………………..………………………………………………………....49
Front page image: Micropholox at http://www.microphilox.com/reference_01.htm
2

Introduction Landfill Management
According to the EPA, approximately 50%-60% of all municipal solid waste
generated in the United States is currently being disposed of in landfills. (EPA 2007a) The volume of waste going to the landfills is not necessary and there are numerous ways we can prevent waste from entering the landfill. As a result of limited landfill space, the negative impact of the landfill footprint and the difficulty in designating space for new landfills, the amount of waste being landfilled is not sustainable. States and localities will have to make large investments to deal with waste management when local landfills have reached capacity or are causing harm to the area. It would be beneficial to create waste management and recycling strategies to improve the economic, environmental and social conditions in an area.
On December 11th, 1987 the United Nations released a report by the World
Commission on Environment and Development, which called for the promotion of sustainable development, and defined it as development which meets the needs of the present generation without compromising the ability of future generations to meet their own needs. (United Nations 1987) In the United States, a great awaking was occurring. Americans were beginning to become conscious of the problems caused by the tremendous amount of trash they produced, realizing that the practices of their “throw-away” society would come back to haunt them in the not so distant future. Current waste management practices were understood to be unsustainable as long term solutions, and the concept of “reduce, reuse, recycle” would soon become the battle cry in the fight against solid waste.
Historically, industry and environment have taken divergent paths towards
preservation and profit, it is hard to imagine that before the turn of the century, cities near bodies of water simply dumped their refuse in the sea. Despite the realization of the recklessness of such past practices, there is still much to be done. It will be a challenge in the coming decades to comprehensively address our history of resource misuse. Acknowledging the impact that anticipated population increases will have on the future creation of waste, advances in science and technology can ensure that local economies actually realize economic benefits by rectifying past inefficiencies. Thus, industry must restructure its often contrary relationship with nature to one that is symbiotic, in order to preserve human, energy, and environmental resources. Success is incumbent upon sustainable initiatives to integrate the two.
A comprehensive solution to the “waste” problem is the zero waste strategy. As
the ultimate solution, this new paradigm seeks to institute a new archetype that redefines waste as we know it. The paradigm addresses all wasted resources, including those that are hazardous, compostable, and recyclable. This somewhat unconventional and “new” take on waste as a resource has the ability to redirect sectoral practices, pushing the waste industry, in particular, to use science to invent and engineer new technologies that broaden the economic spectrum of local economies.
3

In the past, the reluctance of businesses to voluntarily embrace environmental solutions and the absence of a mandatory federal zero waste policy has been a major hindrance to more efficient use of resources. Government mandates can, however, incite action. Between 1979 and 1993, in response to the Resource Recovery and Conservation Act, the documented number of landfills dropped from 20,000 to 5,300 (Tammemagi 1999), an indicator that federal legislation can instigate the pursuit of sustainable strategies for preservation and development. Currently, however, big business lobbyist activity is likely one of the major culprits in the reluctance of the federal government to embrace such a paradigm. Even so, there is also power in local government initiatives to achieve zero waste. In the U.S., municipalities like Seattle, San Francisco, and Longmont, Colorado have successfully embraced the zero waste concept as one of critical importance to the sustainability of their economies. Thus, in the absence of current federal legislation, the question that must be answered is not whether or not zero waste can be successfully implemented in local or municipal arenas – it can. But rather, whether or not those same locales will step up to the plate and take on the task of directing their own sustainable development with practices that maximize resources, sustains their economies, and offers opportunities for expansion?
Mandatory requirements that require businesses and corporations to assume fiscal
and environmental responsibility for the realization of their profits will, until then, be incumbent upon cities and states. This job can be made easier with examples of businesses that have already increased their bottom line by adopting sustainable practices. As an example, in 1999, the Epson Corporation in Portland, Oregon boasted a 90 percent diversion of its waste with the final ten percent being directed to a waste-to-energy facility. In 2000, the company reportedly reaped fiscal benefits in the amount of $308,000 by not sending any waste to the landfill. While no single municipality has to date fully achieved the zero waste goal, the implementation of incremental programs that reconstruct their current practices and processes, and that of local businesses, have set them on the path towards achieving zero waste and an economically sustainable future.
As a society, we should first promote prevention strategies because they improve
sustainability and increase the quality of life of the area in the short and long run. Proactive strategies discussed such as zero waste and recycling will help achieve the sustainability goals of a community. Second, in order to help reduce the negative footprint effects of a landfill by that produces toxic gases, and consumes state and local resources, communities should create tools that utilize landfills in a way that will create local economic development.
Our research shows how the zero waste strategy, recycling initiatives and landfill
gas to energy projects can provide an opportunity for local economic development in many areas throughout the United States. These three developments show that implementation would not only ensure greater environmental sustainability, but also have positive social and economic impacts on the area.
4
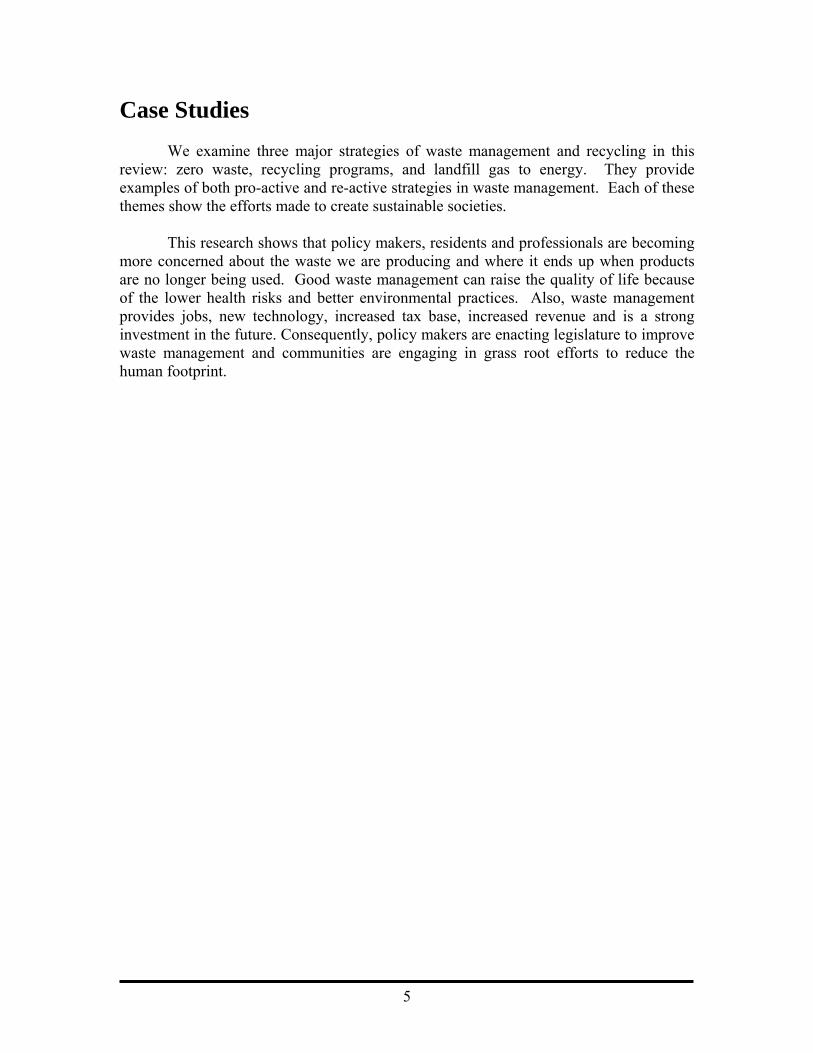
Case Studies We examine three major strategies of waste management and recycling in this
review: zero waste, recycling programs, and landfill gas to energy. They provide examples of both pro-active and re-active strategies in waste management. Each of these themes show the efforts made to create sustainable societies.
This research shows that policy makers, residents and professionals are becoming
more concerned about the waste we are producing and where it ends up when products are no longer being used. Good waste management can raise the quality of life because of the lower health risks and better environmental practices. Also, waste management provides jobs, new technology, increased tax base, increased revenue and is a strong investment in the future. Consequently, policy makers are enacting legislature to improve waste management and communities are engaging in grass root efforts to reduce the human footprint.
5
Zero Waste Overview As a comprehensive strategy to deal with waste efficiently and sustainably, zero waste is relatively new. The concept, however, is rooted in the traditional management of waste. Historically, waste material has simply been stored in landfills or incinerated. Landfills use land inefficiently and perpetuate the concept of waste, while incineration of waste produces toxic by-products which may lead to cancer. These practices are not economically, nor environmentally sustainable. Exacerbated by population growth, in conjunction with technological innovations, consumer choices and the lack of producer accountability, the amount of municipal waste being produced and diverted to landfills continues to swell (Tammemagi 1999). As a result of this non-sustainable management of waste, sustainable economic development of local economies often goes unrealized.
As a societal effort, “Zero waste is about challenging the ruling paradigm that
says we can manage wastes safely in landfills and incinerators” (Motavalli 2001, 28). According to Eric Lombardi, the executive director of the Eco-Cycle recycling program in Boulder, Colorado, the impetus for the discussion of zero waste in the U.S. came out of board discussions in the early part of the 1990’s during the National Recycling Coalition. During that time, much of Europe had already embraced the concept that businesses production models were the primary culprits of the amount of waste being produced. Partly as a result of these discussions, the GrassRoots Recycling Network (GRRN) became the U.S. advocate for zero waste in 1996 (Motavalli 2001). Proponents of zero waste see it as a viable option for sustainable economic development for several reasons. Linked closely with environmental issues and policies, as a fundamental theme, zero waste management addresses issues of sustainability in society, economy and development as an exercise in efficient resource management. Zero Waste: The Concept
The GrassRoots Recycling Network characterizes zero waste as a philosophy
geared toward the 21st century. It is a holistic approach applied to the flow of waste and resources throughout human society, in order to achieve the ultimate goal of eliminating our ecological footprint by creating closed-loop production and consumption systems. This approach seeks to achieve several goals by comprehensively capitalizing on the efficient use of human resources, energy and materials. Zero Waste New Zealand Trust (New Zealand 2008) outlines the major concepts of Zero Waste including,
• Challenge badly designed business systems that use too many resources to make
too few people more productive; • Help communities achieve a local economy that operates efficiently, sustain good jobs, and
provide a measure of self sufficiency; • Manage waste rather than eliminate waste; • Address, through job creation and civic participation, increasing waste of human resources
and the erosion of democracy;
6
7
• Redesign the current, one-way industrial system into a circular system modeled on Nature’s successful strategies.
It is important to note that zero waste is not the same as traditional waste
management, which historically dealt with waste by burning it or storing it in landfills. What distinguishes zero waste from waste management is its use of an integrated approach that makes the connection between the prevention of waste and economic sustainability. Consequently, this new paradigm goes a step beyond the management of waste, with a movement towards eradicating it by rethinking product design and the associated processes. Accordingly, wastes should be “designed” with consideration for future applications that will enhance the quality of life, produce jobs, and preserve natural resources. Process
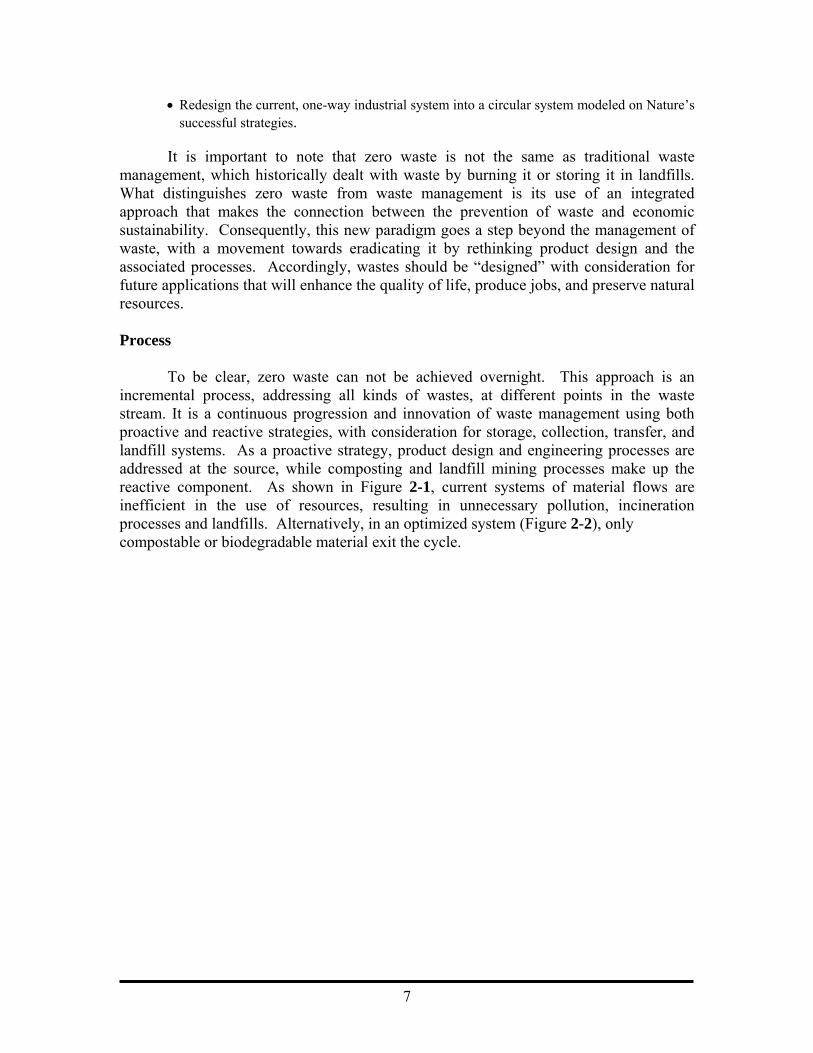
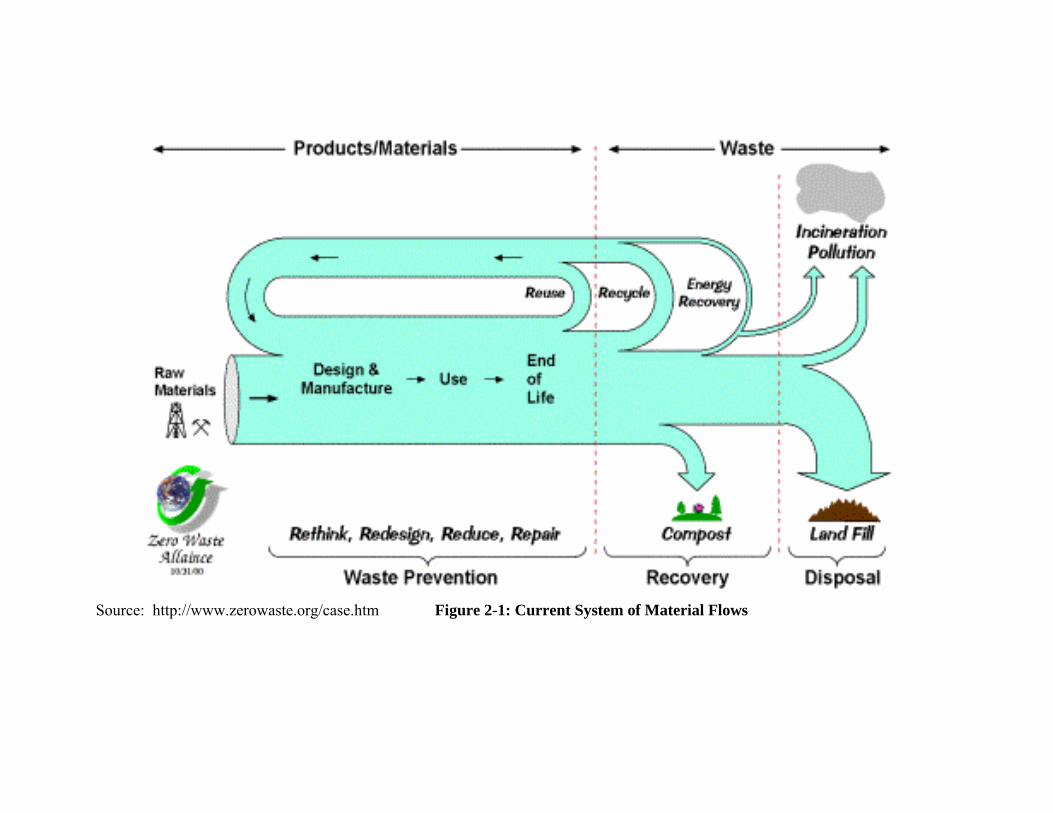
To be clear, zero waste can not be achieved overnight. This approach is an
incremental process, addressing all kinds of wastes, at different points in the waste stream. It is a continuous progression and innovation of waste management using both proactive and reactive strategies, with consideration for storage, collection, transfer, and landfill systems. As a proactive strategy, product design and engineering processes are addressed at the source, while composting and landfill mining processes make up the reactive component. As shown in Figure 2-1, current systems of material flows are inefficient in the use of resources, resulting in unnecessary pollution, incineration processes and landfills. Alternatively, in an optimized system (Figure 2-2), only compostable or biodegradable material exit the cycle.
Source: http://www.zerowaste.org/case.htm Figure 2-1: Current System of Material Flows
Source: http://www.zerowaste.org/case.htm Figure 2-2: Zero Waste Optimized System of Material Flows
Municipalities that have adopted zero waste resolutions, such as Seattle, Washington, San Francisco, Oakland, Del Norte County and Santa Cruz County, California, as well as Carrboro, North Carolina have attempted to address the low-lying fruit first. Thus, with zero waste as their ultimate goal, the adoption and implementation of reduce, reuse, recycle programs are typical starting points, with recycling accounting for a significant portion of the programs. Even so, as a closed loop process that re-introduces biodegradable solid waste back into the environment, composting also shows promise, treating “waste as food” for the environment by moving biodegradable materials through a continuous cycle of use and reuse, thus eliminating waste. If we consider that food represents a significant portion of the waste stream in most localities, organic waste makes up the bulk of municipal solid waste. In 1996 organic material accounted for approximately 67 percent of landfill wastes (Office of Solid Waste. Municipal and Industrial Solid Waste Division 1999).
As one component of the zero waste solution, composting of organic material can
help to achieve sustainable development. Characterized as a “biological nutrient,” which is “a material or product that is designed to return to the biological cycle” (McDonough and Braungart 2002, 105), composting processes safely return nutrients to nature, allowing for the reuse of quality by-products and preventing the need for pesticides that further degrade the environment. With growing interests and entrepreneurship within the waste industry, cities can achieve economies of scale that benefit local and regional development through the pursuit of endeavors that foster innovation in environmental and biological engineering with employment in fields that support those professions. Costs
Comprehensive costs to achieve zero waste in the U.S., at the municipal level, are non-existent for a number or reasons. Those reasons include the absence of:
• Centralized information banks; • Standardized reporting practices; • Fiscal and employment information disclosure; • Dissimilarities of locales and businesses pursing zero waste in terms of programs
and scale. Thus, while comprehensive numbers regarding the monetary cost to achieve zero waste are essentially absent, is certain that without the goal, the impact of the current methods of product packaging and design, manufacturing processes, and inefficient systems will cost even more in terms of future environmental quality and have an incalculable effect on local economic development.
The EPA’s Full Cost Accounting for Municipal Solid Waste Management: A
Handbook (EPA 1997), can be a useful tool to help localities examine the full costs of the resources being used or committed in routine support operations of municipal solid waste management. Evaluation of up-front, operating, back-end (life cycle and cradle to grave), remediation, and contingent, social and environmental costs can assist local governments
10
in assessing where to focus future financial resources. Benefits
The efficient management of resources produces positive outcomes for local
economic development, providing economic, social, and environmental benefits and opportunities. As a result, economies of scale are achieved, enticing small and large businesses alike to embrace sustainable waste management as a viable business model.
Job availability within the waste management sector is promising and will likely
range from blue-collar jobs to professional science and engineering jobs. According to a Monster.com piece by Aileen Cho, entitled “Work in Waste Management”, job growth for the waste management sector looks good. Full-time workers in this sector typically receive health insurance, sick leave, and paid vacations. Additionally, the Bureau of Labor Statistics projected total 2006 employment at 125,770. The Bureau also estimated the median hourly wage rate at $14.96 and an annual wage of $31,110 (Bureau of Labor Statistics 2006).
In another example, the State of South Carolina was able to quantify the economic
impact of its recycling programs which revealed that the $1.5 billion in income generated over $30 and $38 million in sales and income taxes, respectively (EPA The Economics of Recycling in the Southeast 2006). As early as 1996, Larry’s Markets, located in Bellevue Washington was able to realize $41,000 in savings over the period of one year with their composting program (Green Party 2002).
But monetary savings are not the only positive outcomes of efficient resource
management. The indirect outcome of worker productivity has also been shown to be a desirable social benefit. Work places that are healthier and promote eco-friendly work environments have the potential to create places of work that attract workers to the area. According to McDonough and Braungart (2002), procurement of a talented and productive workforce is greater than the cost of an average building. Accordingly, it is cost effective for businesses to also create work environments that people want to work in. The environment also benefits from zero waste. Composting can also pave the way for the introduction of new innovative, sustainable technologies. With a major portion of producer waste being packaging, presented here is an opportunity to collaborate with community or grass-root organizations to create new markets for biodegradable packaging. As an example, California, and the more recognized southeastern states have lands that are either currently being utilized as, or have been utilized as, tobacco fields. Business partnering with an entity like the San Francisco Tobacco Free Project, an organization that works to develop tobacco control plans for San Francisco, could lead to access to land that would be conducive to growing sugar cane which thrives in warmer climates.
11
Waste transport and packaging costs are also a factor. Studies have shown that a reduction in transport packaging alone leads to significant cost savings. The study, Where are the Biggest Cost Savings? (EPA 2007b), profile a number of companies that have reaped the benefits. In 1995, innovations in materials design to reduce the thickness of cardboard shipping containers allowed HASBRO to realize a cost savings of $400,000 and keep approximately 763,000 pounds of material out of the waste stream. As another example, Pepsi-Cola was able to deter 196 million pounds of waste away from landfills by using reusable containers for shipping as opposed to corrugated plastic containers for the transport of their drink bottles. This saved the company $44 million. Hence, efficient design and engineering results in less waste and packaging being transported. Transportation needs also decrease, allowing for decreased pollution and wear and tear on roadway infrastructure that can deplete local funds.
That “waste management does not stop at national borders” (Prüfer 1997, 82) or
municipal boundaries is an important issue for global and local markets and economic development. Consider that the United States’ top export, by volume, is waste paper. Sold as a global commodity, this waste product can positively contribute to the GDP, bringing in revenue to U.S. markets. As an example, China buys waste paper from the U.S. which then becomes “packaging for goods made in China” (Gunther 2007). On the national front, waste products in one locality may be exported to another, creating revenue for the exporting locale. The location receiving it in turn processes this waste as needed by its major sector or industry, subsequently utilizing the waste to create export items that will ultimately result in revenue returns as well. Challenges
The implementation and achievement of zero waste does have some challenges
and opponents. As an alternative to waste management and recycling, in a newspaper article entitled, “Potential of Zero Waste,” the paradigm has been described as ". . . ridiculous as telling Mary Harney that the answer to crowded hospital corridors is zero illness" (Philips 2005). Others have recognized it as a noble and possible feat, though not in the near future. Still others are straddling the fence, saying that although we can’t attain Zero Waste, “through the process, you can get closer to the goal” (Leroux 2001, 202). Some of the challenges for shifting to zero waste are the lack of federal zero waste regulation, producer accountability, consumer and producer education and participation, and the lack of local infrastructure.
The absence of regulatory legislation and market parameters is a major barrier.
Zero Waste America (ZWA 2007) has branded current policy as the primary proliferators of waste. The organization cites the lack of a federal zero waste plan, and the U.S. import and export of wastes as indirectly giving credence to “waste” markets. Additionally, a hindrance for local government, in particular, is the lack of involvement of community economic development agencies in the promotion of zero waste initiatives which would lend credence to adoption and implementation of the associated incremental programs.
12
Other challenges include consumer and producer buy-in and responsibility. Some establishments in the business community, such as Xerox and Fetzer Vinyards, have realized the positive fiscal impacts in their bottom line. According to a case study by the Zero Waste Alliance, in 1999, Xerox realized a savings of over $47 million as a result of their pursuit of zero waste, while Fetzer boasted a reduction in landfill waste by 94% and a savings of over $150,000 in dumping fees in 2001. Other businesses have been reluctant to voluntarily move towards zero waste because of anticipated costs due to the lack of infrastructure. Citizens and the community alike also view out of pocket costs as a concern. The public, private, and community sector are not well educated about the benefits and achievability of moving towards zero waste. Ultimately, success is incumbent upon the establishment of partnerships and participation from the private, public, and community sectors. Future Expectations
In spite of the critics and challenges zero waste is achievable at the local level.
The city of San Francisco is somewhat atypical in terms of its implementation and administration of zero waste, in part due to its population density. Robert Reed, of Norcal Waste Systems, a solid waste management provider, believes that the San Francisco’s programs can be successfully operated in areas like Atlanta, Seattle, Los Angeles, or Chicago, even though they are considerably less dense. (Interview 2007)
Programs that promote Zero waste as a part of an integrated waste management
system have unlimited potential as a sustainable economic development tools. Such strategies addresses sustainable approaches that include collection, transport, recycling, treatment, and storage which can only be achieved if the management of wastes are integrated into the economy and the resulting wastes are considered at all stages of production and consumption (Prüfer 1997). To gauge this, Future Cost Accounting methods may be utilized to help leaders to make efficient and informed decisions regarding solid wastes, assisting decision makers in operations planning and assessing the true cost of managing solid waste operations. It was once thought that waste is inevitable and must exist as a byproduct life. Policy implementations at local, state, regional and national levels will facilitate the way localities think about and manage waste. Moreover, government, consumers and businesses need to understand the link between the impact of “waste” and the future viability of the communities.
13
Case Study: San Francisco, California - Norcal Waste Systems (Privatized Waste Management Partnership) Historical Overview
Long before recycling and waste stream reduction was mandated by California
law, Norcal Waste Systems was a pioneer in the recycling of wastes. Its history reaches back as far as the latter part of the 19th century when scavenging for wastes in San Francisco was big business. After the major earthquake in 1906, many of the previously independent scavenger entities started to organize into a single trade organization. By the 1920’s, two refuse companies had moved to the forefront - Scavenger’s Protective Association and Sunset Scavenger Company. During this time, the city began to regulate refuse and by the 1930’s had begun to implement oversight of the program and instituted refuse pick-up services. It was during this time that Scavenger’s Protective Association monopolized the industry in the area.
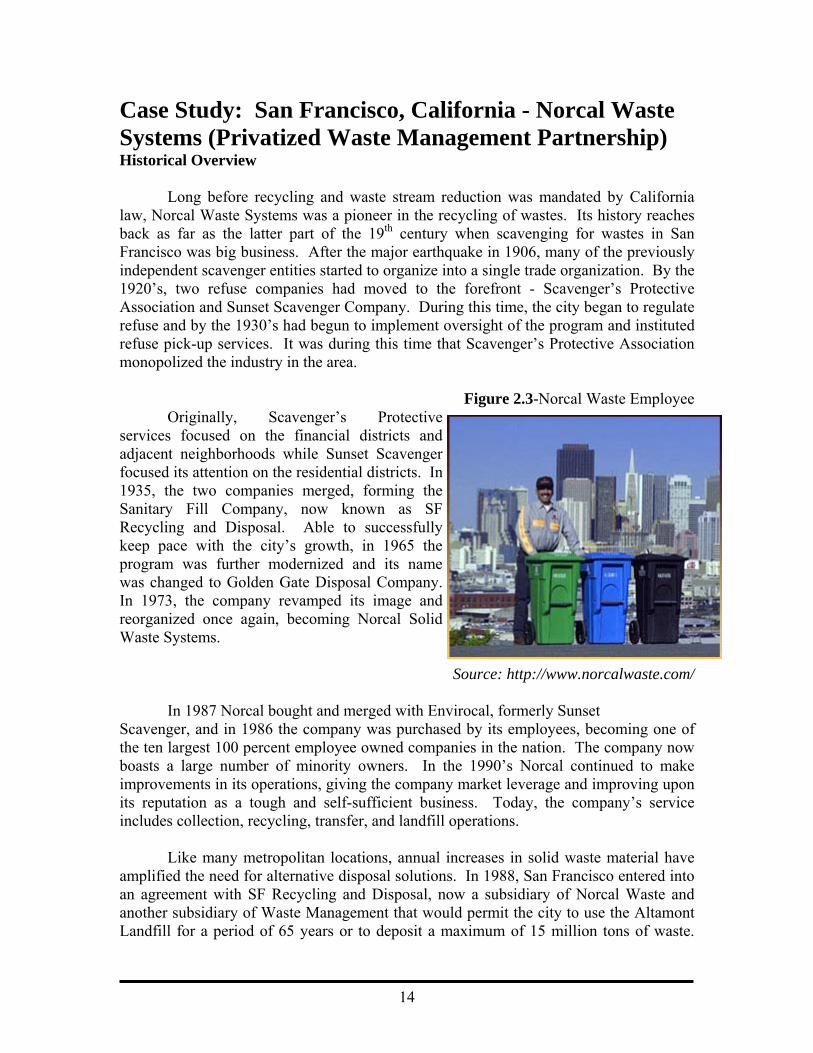
Figure 2.3-Norcal Waste Employee
Originally, Scavenger’s Protective services focused on the financial districts and adjacent neighborhoods while Sunset Scavenger focused its attention on the residential districts. In 1935, the two companies merged, forming the Sanitary Fill Company, now known as SF Recycling and Disposal. Able to successfully keep pace with the city’s growth, in 1965 the program was further modernized and its name was changed to Golden Gate Disposal Company. In 1973, the company revamped its image and reorganized once again, becoming Norcal Solid Waste Systems.
Source: http://www.norcalwaste.com/
In 1987 Norcal bought and merged with Envirocal, formerly Sunset
Scavenger, and in 1986 the company was purchased by its employees, becoming one of the ten largest 100 percent employee owned companies in the nation. The company now boasts a large number of minority owners. In the 1990’s Norcal continued to make improvements in its operations, giving the company market leverage and improving upon its reputation as a tough and self-sufficient business. Today, the company’s service includes collection, recycling, transfer, and landfill operations.
Like many metropolitan locations, annual increases in solid waste material have amplified the need for alternative disposal solutions. In 1988, San Francisco entered into an agreement with SF Recycling and Disposal, now a subsidiary of Norcal Waste and another subsidiary of Waste Management that would permit the city to use the Altamont Landfill for a period of 65 years or to deposit a maximum of 15 million tons of waste.
14
Growing concern that because of its density, the state would run out of landfill space for its waste, prompted the State of California to implement a 25% diversion rate. Moreover, the state required all cities and counties to comply with the California Integrated Waste Management Act.
This Act further mandated that all localities implement a plan to reduce the amount of solid wastes going into landfills by fifty percent by the year 2000. Furthermore, the law specified that a city entity had to have a Source Reduction and Recycling Element (SRRE), Household Hazardous Waste Element (HHWE), and a Non-Disposal Facilities Element. When combined, these elements would make up the California Integrated Waste Management Plan (IWMP). For the city and Norcal Waste, that mandate evolved into a 75% landfill diversion goal by 2010 and an ultimate zero waste goal by 2020 that would produce, consume, and recycle all products without having to throw anything away.
Organization To meet state mandated goals, government agencies, businesses, schools, came together. These entities included Norcal Waste Systems, the Department of Public Works, and the Department of Public Health, as well as a number of other government entities. Norcal Waste Systems does pick up and disposal of items and items requiring recycling and runs the transfer station and recycling processing facilities for the area. The Department of Public Works also provides assistance in the way of litter clean up and sets refuse rates for residents, while the Department of Public Health disburses licenses and permits. There are also many other organizations that provide waste management services to the area. As an employee owned company, Norcal provides jobs with benefits to its workers. According to the 2007 San Francisco Annual Rate Report, the payroll for Sunset Scavenger and Golden Gate Disposal, and SF Recycling and Disposal totaled over $85 million and $40 million, respectively. Several entities assisted in the establishment of a legislative structure for the waste goal. These included the Mayor, Norcal Waste Systems, the Commission on the Environment, San Francisco Environment, and the Board of Supervisors. With the passing of many resolutions, policy makers showed that they recognized that policies geared towards customer and company buy-in were necessary to the incremental achievement of the 75% and zero waste goals. These legislative ordinances and resolutions focused on addressing the problems of solid waste, including the 75 % and zero waste goals, policies that called for a practice what you preach message to local government, while also pushing private entities to adopt zero waste as a responsible and sustainable goal. Thus, the legislation and initiatives represented the waste goals of the city, goals for reduction of construction and demolition waste, and most importantly introduced resolutions that addressed producer responsibility, which is critical to achievement. With these resolutions and initiatives, the city anticipated innovation in waste management practices, producer and consumer responsibility, and the
15

sustainable production initiatives by producers, all contributing to the environmental and economic sustainability of the city. Operational Practice With the combined efforts of Norcal and the Department of the Environment, a strategy for zero waste was developed. The goal of the waste management strategy is to achieve 75% landfill reduction by 2010 and zero waste by 2020. The larger picture focused in on reducing, reusing, recycling dry commodities into recycled products, and composting and digesting organic materials into biomass products. The steps to achieve this included expanding existing recycling and organics programs, upgrading diversion infrastructure, developing alternative diversion technologies, generating renewable energy, and achieving sustainability. Thus, through a series of meetings, a strategy to divert landfill waste was constructed. Objectives to increase residential, commercial, and government diversion to 50 percent, 80 percent and 80 percent respectively by 2007, were established as well as goals to reduce overall landfill diversion to 70 percent, hold producers and consumers responsible for their waste, and plans for a disposal capacity search to address any additional disposal capacity required, were established.
To gauge the progress of these goals and objectives, the city performed a Waste Characterization Study to identify the major materials in the waste stream. Additionally, Norcal Waste produces an annual rate assessment based on reporting requirements established by the Department of Public Works. This report addresses diversion and disposal tonnage, commercial recycling and composting accounts, bulky item collection and toxics program participation, revenues, expenses, collection fleet vehicles, and lifeline and disabled services programs. While the report does not identify the number of jobs created or lost annually, it does provide payroll totals for subsidiary components, Sunset Scavenger, Golden Gate Disposal, and SF Recycling and Disposal. Additionally, the city performs continuous waste audits, surveys, and focus groups to further inform their strategic plan and to examine any necessary course of action.
As mentioned before, operation of the waste management program is done as a public-private partnership. One benefit to this partnership is its operation as a sustainable business enterprise. Sustainability is further promoted due to the symbiotic nature of Norcal and the city. Funding and staffing of the waste management program is unique in that Norcal Waste Systems runs the day to day operations and pick-up services, the city’s Department of the Environment is involved in the operational practices and the regulation of its fee structure. While on the surface, this partnership does seem to allow Norcal’s to monopolize garbage collection, hauling, and processing, with innovation, it does create jobs. Additionally, Norcal funds many of the city’s environmental programs.
Results
The zero waste strategy administered by Norcal Waste System and San Francisco city government has been identified as a model for rate setting, private-public partnerships, reduction in biodegradable wastes and the use of that waste to create opportunities for commerce. The practices of reduce, reuse, and recycle produced
16
intended direct outcomes, including lessening of the amount of garbage going to the landfills, increases in the tonnage of wastes diverted, and increases in composting and rates of recycling. One of the distinctive outcomes of the partnership and zero waste strategy was the ability to produce a high grade fertilizer from the composting of the food wastes in the city. Creation of this product had the effect of keeping city dollars within the city, with the use of policies that requires government and businesses to purchase this high-grade product from city businesses. As another positive outcome, other venues and initiatives that promote sustainability have also evolved. Some K-12 and universities have implemented zero waste programs, a host of businesses are participating in the food composting, and citizens are being educated about the process and its importance through public outreach. The city is on its way to meeting its goal 75% landfill diversion, though in some cases not at the rates initially anticipated.
While Norcal and the city have not fully achieved their goal of 75% diversion and zero waste, they are definitely on their way. Thus far, the goal of 50 percent landfill diversion has been met. As initially anticipated, the city’s recycling rate increased - going from 16% in 1998 to 68% in 2007 (Gunther 2007). According to Deana Simon, a Toxics Reduction Specialist, reductions in residential and commercial diversion rates have increased and are at 36% and 50% respectively, with construction and demolition at 90%.
Even with the positive results however, there have been some unanticipated outcomes. Because the residential programs are not mandatory, there is no penalty for non-participation. Thus, a high percentage of residents do not participate in the waste recycling programs. To address this, residential outreach is being reinvigorated and program accessibility is being enhanced. Incentive programs have also become available. Low-income households can qualify for Lifeline rates which are based upon gross annual income. There was also the anticipated outcome of the lack of producer responsibility, which has a huge impact on waste reduction. To address one component of this problem, a resolution was passed in June of 2007, prohibiting the use of Styrofoam containers, requiring food vendors and restaurants to use compostable or recyclable to-go containers. To promote participation, this program has been incentivized with discounts of up to 75% of garbage service costs. Additionally, monetary penalties have been put in place to address those in violation of this law with fees ranging from a warning to $500.
Innovations The innovations in Norcal’s waste management practices have not gone unnoticed. In 2005, Golden Gate Disposal, a subsidiary of Norcal Waste Systems was recognized by the State of California for its efforts to reduce wastes using sustainable practices. The waste reduction award recognized the company as a significant contributor to the reduction, reuse, recycling, and purchasing of recyclable products as a part of their sustainable business strategy.
17

Lessons Learned A number of lessons were learned from the partnership between the city of San Francisco and Norcal Waste Systems in their goal to attain 75 percent and then zero waste. The first and most apparent lesson is that privatized waste management can work. Private companies can utilize their vast access to expertise, technology, innovative techniques, access to resources, and capital to advance changes in the waste management industry and how consumers and businesses view waste. Additionally, the city’s use of a private company as a single source to administer the cities program for waste management can significantly improve efficiency and make it easier to manage resources. Continued monitoring of the program will assist in keeping the associated fees to citizens at a reasonable level. The lack of participation can also make it hard to reach waste management goals. Currently incentives, fines, and public outreach initiatives in the form of language translations, visual posters, pay as you throw, and EcoFindeRRR, which locates drop-off areas for different types of wastes, assist in increasing participation. In areas, where there are collection coverage gaps, as in some rural locations, centralized drop-off/transfer locations for a myriad of waste materials might also help. Finally, one of the most important lessons to be learned is that producer accountability is critical to the attainment of zero waste. The engineering of products and packaging that can be taken through the complete materials lifecycle is necessary. Moving toward this goal, businesses and entrepreneurs can find market niches for zero waste attainment. As an example, in a 1996 study, Norcal identified discarded food scraps as approximately 19% of landfill wastes. The company saw this finding as an opportunity to capitalize on and innovate in the recycling of food wastes. The result was a new composting program which collected food refuse from residential and business establishments and now provides jobs and economic rewards for the city. Opportunities While dollar figures that quantify the number of jobs created and their impact on tax revenue do not appear to be available, the impact of innovation in waste management to eliminate waste has been identified as a viable path towards local economic development.
18
Recycling Overview
Recycling has been around for thousands of years; one of the earliest forms was
melting down old metals and weapons into the form of new ones. One of the innovative efficiencies that came out of the industrial revolution was that of recycling scrap metal and old machinery into the parts of new machines and instruments. The American Institute of Scrap Recycling Industries (ISRI) has its roots in an organization founded in 1913 (The Economist 2007). The first big push to recycle in the United States was the result of World War II rationing and reuse of natural resources to aid the war effort. However, recycling in its current form began around 1970 when the first curbside collection programs started in the United States (The Economist 2007). Today, there are over 8,550 curbside recycling programs and 7,100 PAYT programs in the United States alone (Skumatz and Freeman 2006). Description
According to the United States Environmental Protection Agency (EPA),
recycling, in the context of waste management, “is a series of activities that includes collecting recyclable materials that would otherwise be considered waste, sorting and processing recyclables into raw materials such as fibers, and manufacturing raw materials into new products” (EPA 2007b). As a form of sustainability, recycling is a critical step for diverting Municipal Solid Wastes (MSW) from landfills and decreasing the energy required to process virgin raw materials. The simple fact that many natural resources are finite, and the costs of extracting them continue to increase as they become scarcer, is a strong motivator for investing in recycling. A cradle-to-grave energy analysis shows that many recycled products require only a fraction of the energy to make, compared to the original input required for products of virgin materials; Thus, 95% less energy is required to make recycled aluminum, 70% less for plastics, 60% for steel, 40% for paper, and 30% for glass (The Economist, 2007, 2). Yet, the decision to recycle is often left up to the individual and often at some cost to them. Many believe that the key for a successful recycling program at any scale is to educate stakeholders (the citizens) on the environmental, economic, and sustainability benefits of recycling. While education is an important part of any recycling program, studies have shown that overall program effectiveness is strongly linked to the type of recycling program implemented. High in indirect and unrealized costs, with lower participation rates, drop-off center recycling is common in rural and low density areas. More common in urban areas, curb-side, solid waste pick up programs are increasingly adding recyclable pick up in an effort to decrease the stress on landfills. In addition, innovative areas are adopting Pay-As-You-Throw (PAYT) programs (also known as variable cost or unit pricing), pricing trash by volume or weight, while the amount recycled is not subjected to a realized cost.
Using the market incentives that PAYT programs offer speaks to two of the main
goals of recycling programs in general: increasing the participation rate of the jurisdiction and increasing the amount of MSW diverted from landfills. Due to the high economic, environmental, and sustainability costs associated with landfills, researchers are placing
19
emphasis on participation, examining what factors compel people to recycle and what methods are most effective in encouraging recycling in different areas.
While participation and diversion are two key aspects, economic development, as
it pertains to recycling, is also heavily dependent on the process of recycling materials. Recycling has the ability to create and lose jobs at each step of the process – from collection, to sorting, to reprocessing, and beyond. In addition, the case study will show recycling programs have the ability to utilize the work of otherwise non-contributing members of society.
This examination will attempt to provide an overview of the current state of
recycling in the United States. It will begin by attempting to identify common traits of those who participate in recycling programs, through the examination of two rural case studies. Once participation attributes are identified, we will look into the effectiveness of PAYT collection methods to use market forces to increase recycling participation and collections and its ability to reduce MSW going to landfills. Following the examination in the collection of recyclables, the results of a report prepared by London Remade, will be reviewed focusing on the number of jobs created per thousand tons of recyclables collected and which types of recyclables offer the most opportunity for job creation. A case study will then analyze the Orange Grove Recycling Center in Chattanooga, Tennessee, which illustrates how recycling programs are able to promote job creation, job training, sustainability education, and a needed community center. It is hoped that the lessons learned from this summary and the following case study will provide effective guidance for promoting recycling as local economic development. Participation in Recycling
In the United States, rural recycling programs have had a difficult time keeping
pace with their urban counterparts. One of the main reasons for the urban advantage is that curbside waste pickup infrastructure is already in place (Jakus, Tiller, and Park 1997). Historically, citizens of rural areas simply burned their waste for lack of a better option, but as people became more aware of health and environmental degradation caused by burning, the practice has become outlawed in many jurisdictions. Because of their low population and small tax base, rural areas regularly choose not to fund curbside pickup programs, often opting for cheaper area drop off locations, which also encourage recycling (Jakus, et al. 1997). Because their recycling participation rates are typically lower than urban areas, rural recycling programs offer the largest opportunity for improvement, thus making them an important sector for examination. By focusing on the rural areas where recycling seems to be more difficult to practice, it is anticipated that participation trends can be recognized and the attributes of the people who do recycle pinpointed. Doing so will help tailor future education programs and help to identify the unreached demographic of people who need that education the most.
20
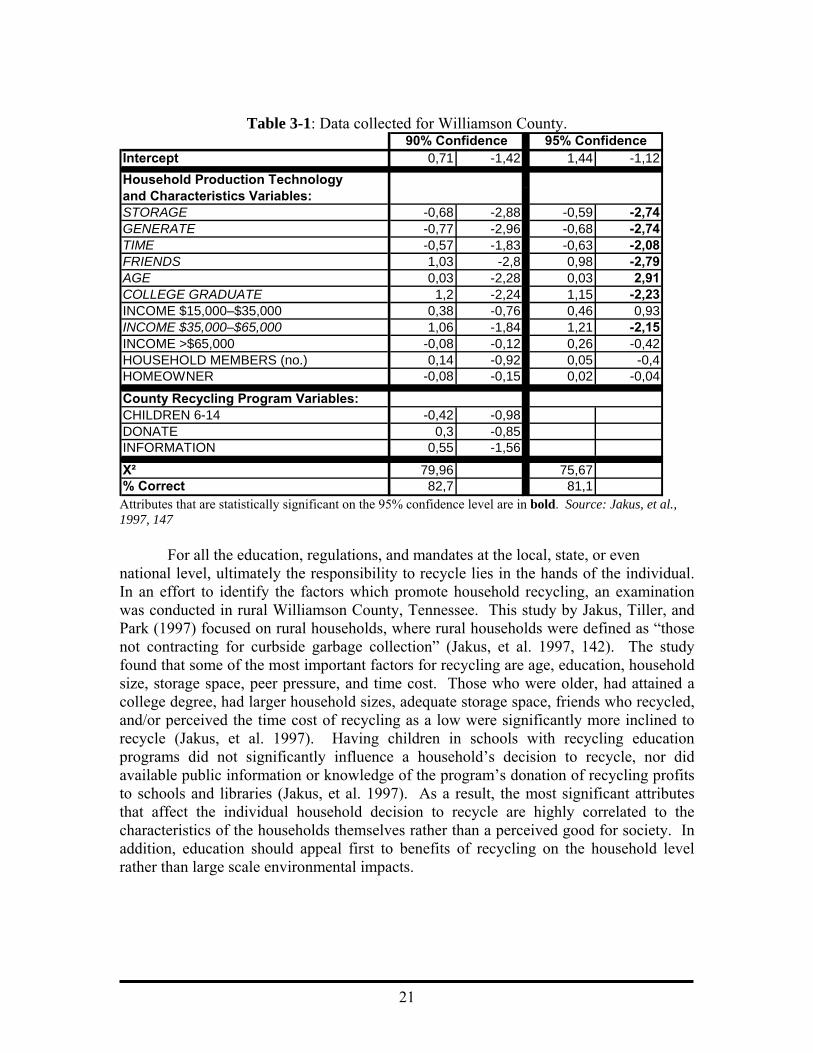
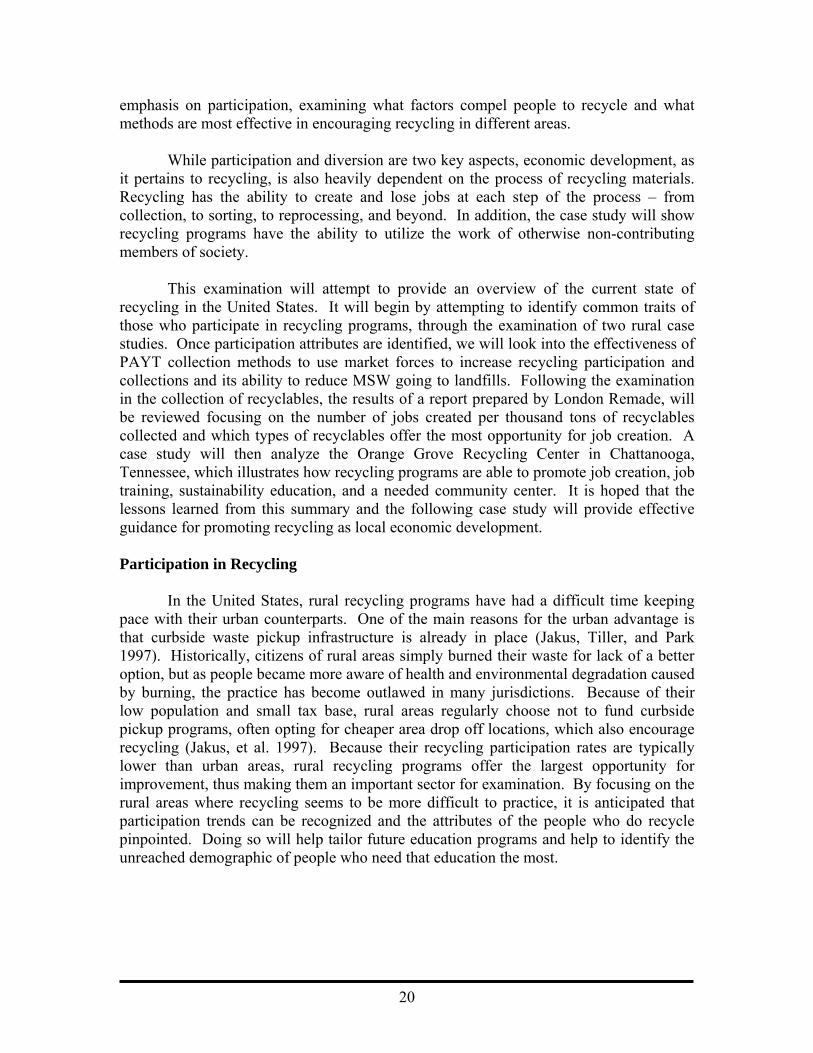
Table 3-1: Data collected for Williamson County.
Intercept 0,71 -1,42 1,44 -1,12Household Production Technologyand Characteristics Variables:STORAGE -0,68 -2,88 -0,59 -2,74GENERATE -0,77 -2,96 -0,68 -2,74TIME -0,57 -1,83 -0,63 -2,08FRIENDS 1,03 -2,8 0,98 -2,79AGE 0,03 -2,28 0,03 2,91COLLEGE GRADUATE 1,2 -2,24 1,15 -2,23INCOME $15,000–$35,000 0,38 -0,76 0,46 0,93INCOME $35,000–$65,000 1,06 -1,84 1,21 -2,15INCOME >$65,000 -0,08 -0,12 0,26 -0,42HOUSEHOLD MEMBERS (no.) 0,14 -0,92 0,05 -0,4HOMEOWNER -0,08 -0,15 0,02 -0,04
County Recycling Program Variables:CHILDREN 6-14 -0,42 -0,98DONATE 0,3 -0,85INFORMATION 0,55 -1,56
Χ² 79,96 75,67% Correct 82,7 81,1
90% Confidence 95% Confidence
Attributes that are statistically significant on the 95% confidence level are in bold. Source: Jakus, et al., 1997, 147
For all the education, regulations, and mandates at the local, state, or even
national level, ultimately the responsibility to recycle lies in the hands of the individual. In an effort to identify the factors which promote household recycling, an examination was conducted in rural Williamson County, Tennessee. This study by Jakus, Tiller, and Park (1997) focused on rural households, where rural households were defined as “those not contracting for curbside garbage collection” (Jakus, et al. 1997, 142). The study found that some of the most important factors for recycling are age, education, household size, storage space, peer pressure, and time cost. Those who were older, had attained a college degree, had larger household sizes, adequate storage space, friends who recycled, and/or perceived the time cost of recycling as a low were significantly more inclined to recycle (Jakus, et al. 1997). Having children in schools with recycling education programs did not significantly influence a household’s decision to recycle, nor did available public information or knowledge of the program’s donation of recycling profits to schools and libraries (Jakus, et al. 1997). As a result, the most significant attributes that affect the individual household decision to recycle are highly correlated to the characteristics of the households themselves rather than a perceived good for society. In addition, education should appeal first to benefits of recycling on the household level rather than large scale environmental impacts.
21
Curb-side Programs – Are they worth it? When looking into rural recycling programs, the concept of curbside collection is
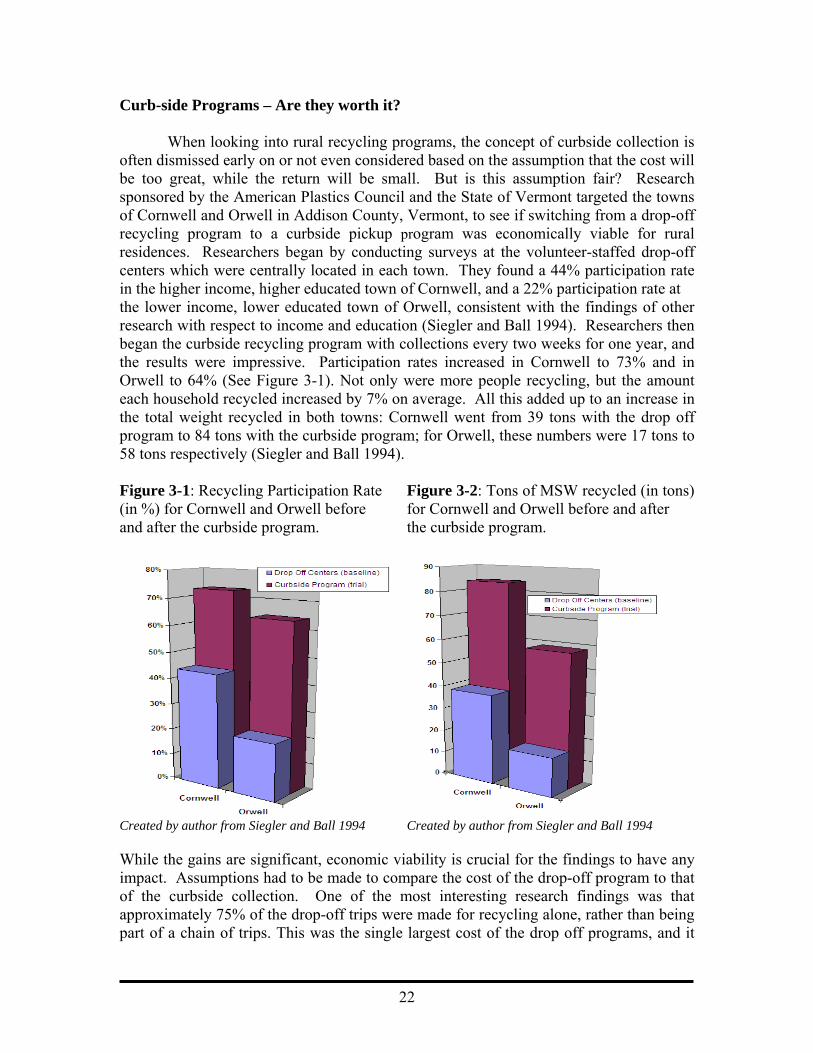
often dismissed early on or not even considered based on the assumption that the cost will be too great, while the return will be small. But is this assumption fair? Research sponsored by the American Plastics Council and the State of Vermont targeted the towns of Cornwell and Orwell in Addison County, Vermont, to see if switching from a drop-off recycling program to a curbside pickup program was economically viable for rural residences. Researchers began by conducting surveys at the volunteer-staffed drop-off centers which were centrally located in each town. They found a 44% participation rate in the higher income, higher educated town of Cornwell, and a 22% participation rate at the lower income, lower educated town of Orwell, consistent with the findings of other research with respect to income and education (Siegler and Ball 1994). Researchers then began the curbside recycling program with collections every two weeks for one year, and the results were impressive. Participation rates increased in Cornwell to 73% and in Orwell to 64% (See Figure 3-1). Not only were more people recycling, but the amount each household recycled increased by 7% on average. All this added up to an increase in the total weight recycled in both towns: Cornwell went from 39 tons with the drop off program to 84 tons with the curbside program; for Orwell, these numbers were 17 tons to 58 tons respectively (Siegler and Ball 1994). Figure 3-1: Recycling Participation Rate Figure 3-2: Tons of MSW recycled (in tons) (in %) for Cornwell and Orwell before for Cornwell and Orwell before and after and after the curbside program. the curbside program.
Created by author from Siegler and Ball 1994 Created by author from Siegler and Ball 1994 While the gains are significant, economic viability is crucial for the findings to have any impact. Assumptions had to be made to compare the cost of the drop-off program to that of the curbside collection. One of the most interesting research findings was that approximately 75% of the drop-off trips were made for recycling alone, rather than being part of a chain of trips. This was the single largest cost of the drop off programs, and it
22
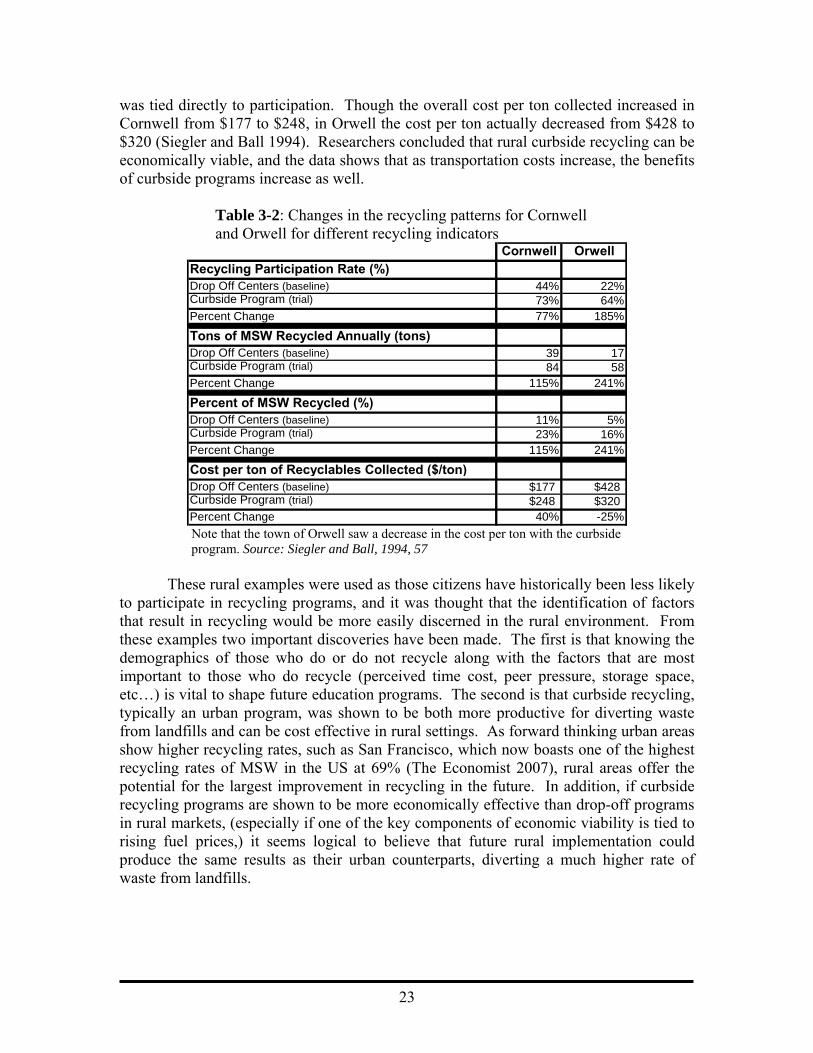
was tied directly to participation. Though the overall cost per ton collected increased in Cornwell from $177 to $248, in Orwell the cost per ton actually decreased from $428 to $320 (Siegler and Ball 1994). Researchers concluded that rural curbside recycling can be economically viable, and the data shows that as transportation costs increase, the benefits of curbside programs increase as well.
Table 3-2: Changes in the recycling patterns for Cornwell and Orwell for different recycling indicators
Cornwell OrwellRecycling Participation Rate (%)Drop Off Centers (baseline) 44% 22%Curbside Program (trial) 73% 64%Percent Change 77% 185%
Tons of MSW Recycled Annually (tons)Drop Off Centers (baseline) 39 17Curbside Program (trial) 84 58Percent Change 115% 241%
Percent of MSW Recycled (%)Drop Off Centers (baseline) 11% 5%Curbside Program (trial) 23% 16%Percent Change 115% 241%
Cost per ton of Recyclables Collected ($/ton)Drop Off Centers (baseline) $177 $428Curbside Program (trial) $248 $320Percent Change 40% -25% Note that the town of Orwell saw a decrease in the cost per ton with the curbside program. Source: Siegler and Ball, 1994, 57
These rural examples were used as those citizens have historically been less likely
to participate in recycling programs, and it was thought that the identification of factors that result in recycling would be more easily discerned in the rural environment. From these examples two important discoveries have been made. The first is that knowing the demographics of those who do or do not recycle along with the factors that are most important to those who do recycle (perceived time cost, peer pressure, storage space, etc…) is vital to shape future education programs. The second is that curbside recycling, typically an urban program, was shown to be both more productive for diverting waste from landfills and can be cost effective in rural settings. As forward thinking urban areas show higher recycling rates, such as San Francisco, which now boasts one of the highest recycling rates of MSW in the US at 69% (The Economist 2007), rural areas offer the potential for the largest improvement in recycling in the future. In addition, if curbside recycling programs are shown to be more economically effective than drop-off programs in rural markets, (especially if one of the key components of economic viability is tied to rising fuel prices,) it seems logical to believe that future rural implementation could produce the same results as their urban counterparts, diverting a much higher rate of waste from landfills.
23
“Pays As You Throw” Waste Management Programs One of the points from the previously discussed studies brought out the fact that
people tend to recycle if they believe there is a low time cost associated with it. Pay as you throw (PAYT) programs take this concept one step farther by providing an actual economic incentive for recycling, by requiring the user to pay for waste management services on a per unit basis, similar to their water or electric bill. From a national perspective, there were 7,100 PAYT programs in 2006 (up from 5,200 programs in 2001). In addition, one quarter of the United States population, and 30 of the top 100 largest US cities, are using this waste management technique, with impressive results (Skumatz and Freeman 2006). Many see PAYT programs as the next step in the recycling movement, and for good reason, as there are many benefits that PAYT programs offer. First, PAYT programs help to divert 17% more MSW per household than those with traditional methods (national averages). Second, PAYT programs not only promote recycling, they also “encourage composting, source reduction, reuse, and [a] host of other responsible methods of dealing with waste” (Skumatz and Freeman, 2006, 3). Finally, PAYT programs are easy to execute, having been implemented in as little as three months in jurisdictions of all sizes. Stated plainly, “research has demonstrated that PAYT is the most effective single action that can increase recycling and diversion, and can also be one of the most cost-effective” (Skumatz and Freeman, 2006, 3).
PAYT programs have become popular with users, as 95% to 98% of users prefer
PAYT over their old system (Skumatz and Freeman, 2006, 15). They claim a number of different reasons for this: there is a sense of equity – those who use more, pay more; recycling is encouraged but no action is mandatory; the programs are efficient, requiring little to no expense on infrastructure at the start up; with quicker implementation times, programs are seen as an answer for what can be done in the short term; following the “reduce, reuse, recycle” (3R’s) motto, programs increase environmental awareness; and programs have taken many shapes to conform to the specific size and needs of jurisdictions (Skumatz and Freeman 2006). Opponents of PAYT claim that the programs encourage illegal dumping and unfairly impact the poor and large families. However, research has shown that illegal dumping in jurisdictions with PAYT programs is no worse than those without them (Folz and Giles 2002). As far as concerns for the poor and large families, some jurisdictions have provided reduced price service to low income families, and while larger families always pay more for food and water, they are seen to have an advantage with economy of scale with recycling as they have the option to recycle as much of their waste as they choose (Skumatz and Freeman 2006).
There are multiple forms of PAYT programs functioning across the country.
Most, but not all, PAYT programs are paired with curb-side recycling programs. Again, most, but not all, of the time, PAYT programs incur an actual cost to the user, while the recycling programs do not. Some of the forms of PAYT programs include variable can, bag program, tag system, hybrid system, weight-based system, and other programs including “Recycle Banks.” Variable can, or subscribed can, programs allow customers to pay for a specific number and size of trash cans for their household use. Bag programs
24
use official bags marked with the logo of the specific collector. The bags can be purchased through supermarkets, convenience stores, or through the collector. Tag programs are almost identical to the bag program except that tags are affixed to each bag so that the collector knows that the bags have been paid for. Hybrid systems employ any combination of these methods, including a minimal fee system for minimal disposal with additional fees for additional uses. Though rarely implemented in the United States due to the infrastructure upgrade required, weight-based pricing is widely considered the most equitable system to implement and may be the future of PAYT programs (Skumatz and Freeman 2006). The Recycle Bank concept is offered as an alternative for jurisdictions unable to implement another PAYT program, where recyclables are weighed rather than trash, and rewards in the form of cash or coupons are given for increased recycling (Skumatz and Freeman 2006).
A 1994 case study of Marietta, Georgia, suggested that bag or tag programs
provided the most incentive to divert trash and recycle. The study compared approximately 400 households, half of which were on a flat fee plus can subscription, while the other half implemented a flat fee plus bag program (Van Houtven and Morris, 1999). While both of the programs proved to be successful at reducing the average amount of MSW produced by each household, the bag program proved to be more than two times as affective (36% reduction vs. 17% compared to the traditional program) as the can subscription program (Van Houtven and Morris, 1999).
Another example of a successful PAYT program includes the Boulder, Colorado,
city-wide implementation in 2001. The enacted ordinance required that haulers providing service in the city must switch to PAYT programs but left it up to the haulers to decide the pricing. The typical programs in Boulder have subscription can programs along with additional bags that can be purchased as needed. By the end of the first year of the program, the recycling rate had doubled from 17% to 34%. By 2006, the diversion rate from the MSW stream had increased to 56%. While these numbers are an example of a more successful program than what is typical, the benefits of Pay as You Throw programs are clear: these programs truly are “the most effective single action that can increase recycling and diversion, and can also be one of the most cost-effective” (Skumatz and Freeman, 2006, 3). Recycling and Job Creation – What can be expected?
If you ask them, they will simply tell you that they “are in the business of
recycling, creating environmental solutions for a sustainable capital,” but in truth, London Remade is an innovative non-profit organization primarily supported by the London Development Agency (LDA) in the United Kingdom (London Remade – FAQ). Because of its ties to the London Development Agency and based on its goal of using recycling to promote economic development and job creation, London Remade has performed an in depth analysis to look at recycling from a broad perspective (looking at topics such as landfill costs, jobs lost to recycling, and other factors not typically examined in recycling studies), find the number of job being created per 1000 tons of
25

recyclables, and look into what the difference is in job creation between the different recyclable materials.1
In their study of job creation and recycling, London Remade examined issues that
affect the waste stream as a whole and attempted to find any desirable correlations to recycling.2 Once implemented recycling programs are integrated with the rest of the waste stream, there are a number of interesting relationships that can be identified. London Remade estimates that for every $4 increase in the landfill tax, there would be about a one percent increase in the weight of recycled material (Gray, Percy, and Bruegel 2002). Another interesting finding looks at indirect job creation and job loss associated with recycling. London Remade provides a diagram detailing the eight stage process of recycling, where jobs are created or lost, and for what reason (See Figure 3-3). The goal of the diagram is to provide a graphical overview for the net creation of jobs in the waste sector, rather than the gross number of jobs created by recycling. While it is logical from an economic development perspective to look at net gains or losses, this study is not typically done by recycling agencies. London Remade then took the diagram and applied data and findings from other research to show the affects of recycling at each of the eight steps. The validity of their number hinges on the assumption that money can be invested into the process in three ways to increase recycling and reduce the amount of waste going to landfills: Changes in the collection practices can increase the proportion of waste to be recycled (i.e. investing in a PAYT program, public education on recycling, etc…), changes in the extent of separation of waste (providing more workers to increase the accuracy and volume of separation for the recyclables), and changes in the materials chosen for recycling (creating programs that receive electronic waste (e-waste) and other appliances which are highly valuable or reusable) (Gray, Percy, and Bruegel 2002). While figure 3.3 (See appendix 1) shows four places where jobs may be lost due to recycling, on the whole, recycling is shown to be a net generator of jobs as recycling increases (Gray, Percy, and Bruegel 2002).
“There a three distinct areas from which jobs are gained: curb-side collection and
sorting of recyclable glass, paper, cans, plastics and textiles (11.2 jobs gained for every 1000 tons of recyclables collected), the collection of household appliances and e-waste prior to it being part of the municipal waste stream (200.9 jobs per 1000 tons of recycling), and jobs gained from recycling aluminum prior to collection (30.07 jobs per 1000 tons of recyclables)” (Gray, Percy, and Bruegel 2002, 10). The lesson here is that it is not only important to have a recycling program to divert typical trash from the waste stream, but the implementation of a comprehensive recycling program, where appliances and e-waste are recovered, can be a major component of economic development.
From its research, London Remade made five recommendations to improve job
creation from recycling:
1 During this discussion any dollar amounts will be converted to US Dollars from UK Pound at a $2 = 1 Pound rate. 2 While the following numbers presented are specifically related to the City of London, they will be presented here as typical values that could be true of any large city in the United State. This argument is rooted in the fact that the two countries see similar national recycling rates and are, on the whole, a very similar people.
26

1. Enable or encourage local authorities to extend or improve separate
collection of recyclables 2. Help and encourage companies to invest in waste processing
(composting, using glass in construction arrogates, etc…), 3. Encourage workplaces, households, and community projects to
separate recyclables from waste before they enter the waste stream, 4. Encourage the use of existing recycling programs 5. Encourage companies and pubic sector organizations to use more
goods made from recycled material (which in turn increases the demand for recycled goods, thus increasing the price of recyclables, making recycling companies more profitable, thus hiring more workers, increasing employment, and the ability to buy and recycle more goods for more people) (Gray, Percy, and Bruegel, 2002, 16).
Proving that there could be a virtuous cycle of recycling for economic
development is one of the major steps forward from London Remade’s study. Interestingly, the report makes no mention of any implementation of PAYT programs, which would undoubtedly enhance the productivity of the current recycling infrastructure and help London Remade achieve its goals of creating a more sustainable future.
27
Case Study: Orange Grove Center, Tennessee – Recycling in Action Historic Overview
In 1953, a group of parents and Chattanooga community leaders founded the
Orange Grove Center (OGC) to serve children and adults with mental disabilities. Since then, OGC has been one of the national leaders in the creation of services for the mentally disabled. Offering education and resources for personal growth, the original class of 25 students found great success. While their personal growth was tremendous, their largest accomplishment may have been to disprove the misconceptions of the limited learning abilities of mentally disabled people widely held by the general population. Students have continued to find success and learning opportunities at the OGC, whose facilities have improved to include: vocational training, independent living facilities, full service medical (including dental) care, physical therapy, and speech therapy. Today Orange Grove provides these and many other services to over 650 children and adults, helping them overcome struggles while providing a safe haven and learning opportunities (About Orange Grove). Program
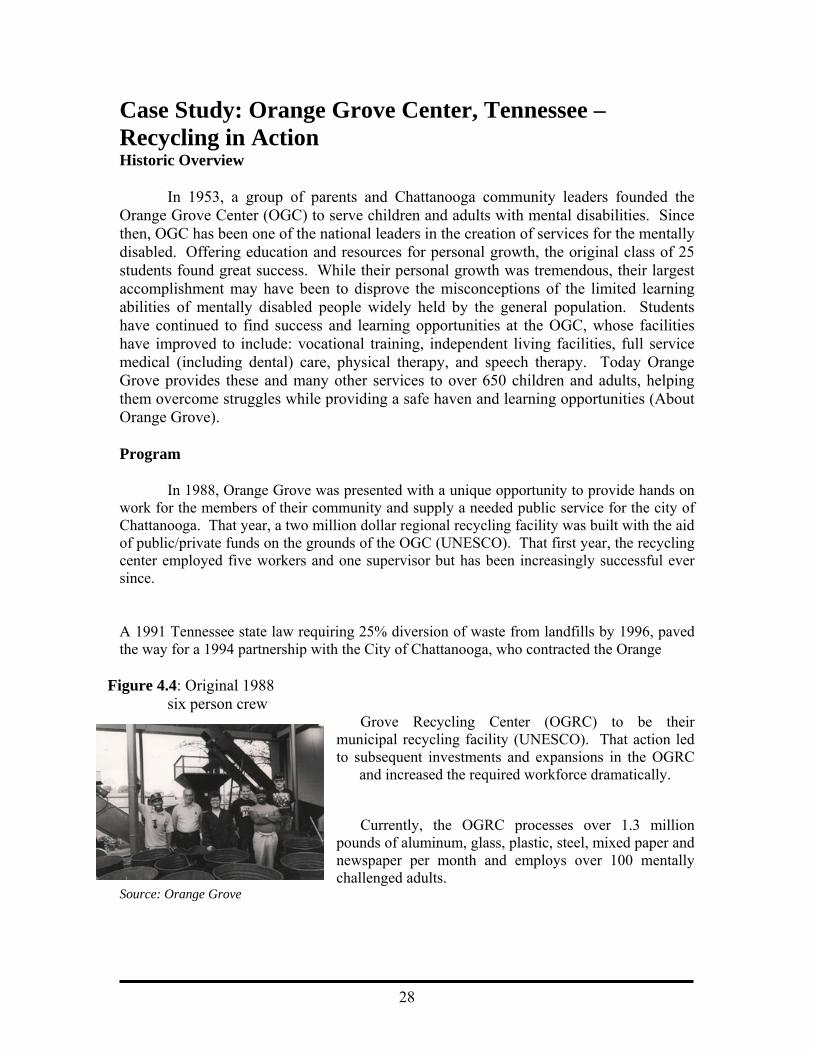
In 1988, Orange Grove was presented with a unique opportunity to provide hands on work for the members of their community and supply a needed public service for the city of Chattanooga. That year, a two million dollar regional recycling facility was built with the aid of public/private funds on the grounds of the OGC (UNESCO). That first year, the recycling center employed five workers and one supervisor but has been increasingly successful ever since. A 1991 Tennessee state law requiring 25% diversion of waste from landfills by 1996, paved the way for a 1994 partnership with the City of Chattanooga, who contracted the Orange
Figure 4.4: Original 1988
six person crew Grove Recycling Center (OGRC) to be their
municipal recycling facility (UNESCO). That action led to subsequent investments and expansions in the OGRC
and increased the required workforce dramatically.
Currently, the OGRC processes over 1.3 million
pounds of aluminum, glass, plastic, steel, mixed paper and newspaper per month and employs over 100 mentally challenged adults.
Source: Orange Grove
28

The OGRC is the MRF for the greater Chattanooga area, handling the recyclables from about 55,000 Chattanooga households (and the 500-bed Memorial Hospital, the region’s second largest), 13 southeastern counties of Tennessee, and 15 Georgia municipalities (UNESCO). With the expansion of the recycling program to include six drop off convenience centers throughout the Chattanooga area, direct employment from recycling will increase to 150 jobs for developmentally disabled citizens and several academically at risk high school students (UNESCO). Figure 4.5: Orange Grove recyclable
sorting line with mentally disabled workers.
Benefits The repetitive nature of the sorting and
collection process of recyclables is a key factor which makes employment suitable for the mentally disabled. The ability to complete repetitive tasks is a marketable skill, the mastery of which provides the workers with a sense of accomplishment that cannot replicated in vocational training or many other jobs. Many of those who have received training at the OGRC Source: Orange Grove are productive employees at other jobs (UNESCO). This human touch at Orange Grove also helps the bottom line, as many municipal recycling facilities (MRF) use high tech sorting machines which are expensive to buy and maintain. The human capital at the OGRC has kept operating costs at approximately one tenth of the amount spent at MRF supporting other midsized cities. Not only does the center cost less, but the product produced by the low-tech human capital is of a higher quality than the high-tech machines, and as recycled raw materials are resold, those produced at the OGRC receive premium prices (UNESCO).
Sustainability
The OGRC is a model of what sustainability should look like. Through the
exposure of their work at the OGRC, those with disabilities have changed many attitudes in the Chattanooga area as they are now seen as contributing, productive, and important members of society. The OGRC benefits Chattanooga socially, economically and environmentally, while at the same time promotes recycling education, and work programs for the disabled. Over 10,000 people visit the OGRC grounds each year to learn about recycling and to see sustainability in action (UNESCO). Lastly, there is a value associated with bettering the lives of those with disabilities that cannot be measured in dollars, but in truth, that value, which cannot be quantified, may be the greatest of all.
Good for Economic Development
Recycling can be big business. Sustainable jobs are created at every step of the
process, from collection to sorting to reprocessing to research and development. In 1995, the EPA released a document relating economic development to recycling. It showed that the
29
northeastern United States alone had over 103,000 jobs created by the recycling industry (EPA, 1995, 11). The benefits extend beyond the concept of sustainability when it is realized that every piece of recycled material takes the place of otherwise needed virgin material, thus conserving scarce natural resources, reducing the total amount of energy needed to process materials, and, therefore, also reducing greenhouse gas emissions. This examination in recycling brought out a number of successful examples and policies which should be recommended for implementation for communities of almost any size or type.
Overwhelming evidence shows recycling to be a sustainable, cost effective, and
needed form of local economic development which has the ability to be adapted to the specific needs of any community. The use of market incentives associated with PAYT programs seem to be the logical next step for many communities who seek to increase their diversion rates from expensive and unsustainable landfills. In addition, implementation of programs which recycle and reuse appliances and electronic waste seem to translate into the highest concentration of jobs per 1000 tons, making these programs especially appealing from an economic development perspective. Finally, as the case study shows, recycling and sustainability are about improving the lives of people, now and in the future. Employing those who would otherwise not be contributing members of society to provide a service and improve the lives of everyone, may be the best example of sustainability yet.
30
Landfill Gas to Energy Projects Overview
The goal of landfill gas mining (LFG) is to use a resource that is naturally emitted from our landfills as an alternative energy source. It requires developing infrastructure in order to capture the gas and process it in a way that can be transformed into energy. The first landfill gas to energy project originated in Rolling Hills, California at the Palos Verdes Landfill in 1979, the project followed two EPA milestone regulations regarding Landfill gas. The first regulation enacted in 1976, was the Resource Conservation and Recovery Act (RCRA) that restricted the migration of landfill gas and required the collection of explosive mixtures. The second, Public Utility Regulatory Policies (PURPA) was enacted in 1978, required utilities and power producers to connect for the purchase LFG energy at no cost to utilities (EIA 1996).
By using this gas, communities may save money, create jobs and improve the
quality of life for the surrounding area. Every year, communities approach the end of the lifecycle of an active landfill. Once the landfill closes, the community experiences the negative footprint for many years to follow. This footprint, or effects caused by the landfill that involve a myriad of consequences for the social, economic and environmental stability of a community.
In 1994, the United States Environmental Protection Agency created the Landfill
Methane Outreach Program (LMOP) as a resource for individuals, landfill owners and communities to use for various types of support for landfill gas to energy projects. The organization provides assistance to current and potential energy projects in the U.S. specifically; it provides information, workshops, tools and resources to residents, businesses and landfill owners on a domestic and international level. In addition, the EPA works in conjunction with USAID in South and Central America, South and East Asia, Russia and Central and Eastern European Countries. Danger by Definition
Landfill gas is a hazardous substance that is naturally emitted from landfills. It is
produced by the aerobic and anaerobic activity of bacteria found in organic waste. Essentially, landfill gas is produced when these bacteria break down the composition of waste in the landfill. The EPA (EPA 2006b) states Landfills are one of the greatest human contributors of methane emissions that exist, accounting for 25-35 percent of all methane sources3.
Composition
Gas produced by a landfill is typically 40-60% methane and 40-60% carbon
dioxide, which means it is not as pure at natural gas at almost 99% methane. In addition,
3 The range of numbers changes depending on the source. EPA estimates 25% for 2004 and the La Grange Landfill Presentation estimates 35%
31
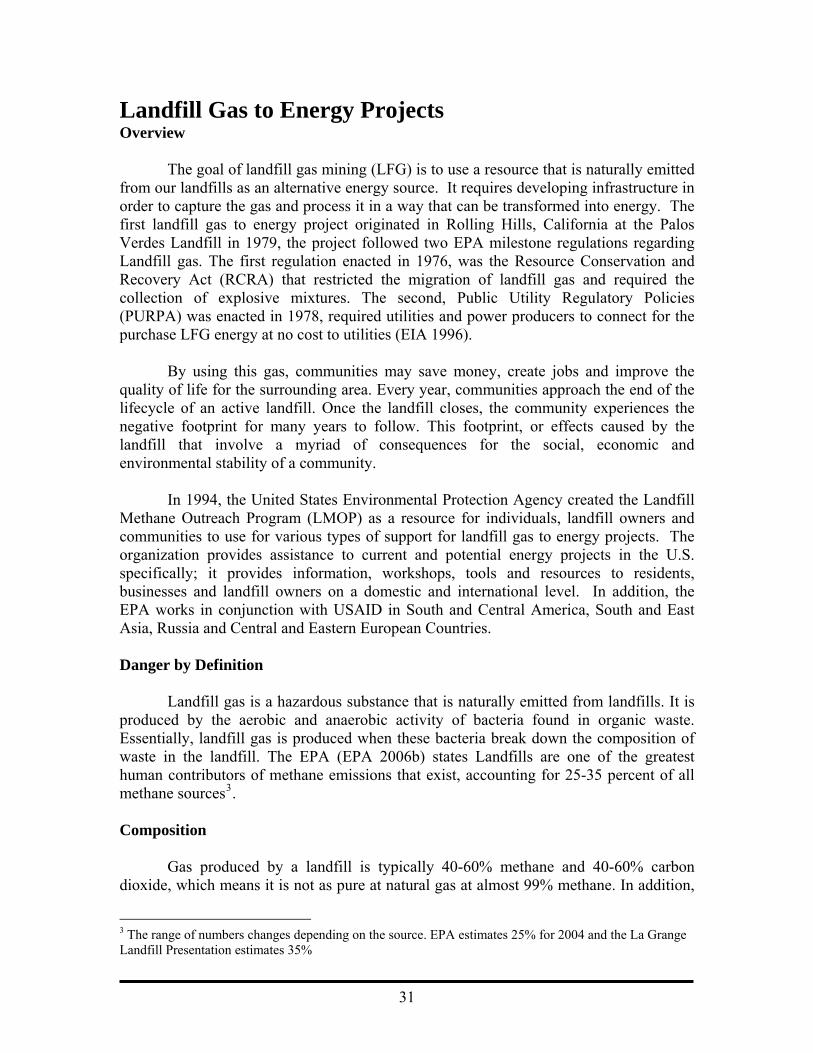
the landfill gas contains less than 1%, yet a significant amount, of other NMOC (nonmethane organic compound). Typical NMOC are composed of VOC (volatile organic compound) and HAP (polycyclic aromatic hydrocarbons) that contribute to the negative characteristics of the landfill gas. NMOCs are present in items such as household cleaning products, materials coated with or containing paints and adhesives, and other items (EPA 2006b).
Table 4.1: Landfill gasses (LFG) Constituent Gasses
Constituent Gas Concentration in LFG Range Average
Methane (CH4) 35 to 60 percent 50 percent
Carbon Dioxide (CO2) 35 to 55 percent 45 percent Nitrogen (N2) 0 to 20 percent 5 percent Oxygen (O2) 0 to 2.5 percent <1 percent Hydrogen Sulfide (H2S) 1 to 1,700 ppmv 21 ppmv Halides NA 132 ppmv Water Vapor (H2O) 1 to 10 percent NA Nonmethane Organic Compounds (NMOCs)
237 to 14,294 ppmv
2,700 ppmv
NA = not available. ppmv = parts per million by volume. Note: Highest values occur in perimeter wells.
Source: (Department of Energy Annual 1996,10 )4
NMOC are present in items such as household cleaning products, materials coated with or containing paints and adhesives, and other items (EPA FAQ 2007).
According to Brian Guzzone, a LMOP team leader, landfill gas contains about
half of the heating capacity as natural gas, at 350 to 600 Btu per cubic foot compared to 700 to 1200 Btu per cubic foot for natural gas (CNN 2006 and POWER 2007). By capturing and combusting landfill gas, the toxicity is greatly reduced. Landfill gas collection and combustion greatly reduces the organic compound emissions from landfills (Mead 1997, 7). Risks/Effects of Landfill Gas
There are numerous health, safety and environmental concerns associated with
landfill gas. The EPA classifies these risks into three categories by transmission mode: subsurface migration, surface emissions (pollution) and odor. The subsurface migration occurs when the gas moves to other areas within the landfill or outside the property. This
4 Source: G.J. Sandelli, Demonstration of Fuel Cells To Recover Energy from Landfill Gas. Phase I Final Report: Conceptual Study, EPA-600-R-92-007, prepared for the U.S. Environmental Protection Agency by International Fuel Cells Corporation (Washington, DC, January 1992); M. Doorn, J. Pacey, and D. Augenstein, Landfill Gas Energy Utilization Experience: Discussion of Technical and Non-Technical Issues, Solutions, and Trends, EPA-600/R-95-035, prepared for the Air and Energy Engineering Research Laboratory, U.S. Environmental Protection Agency by E.H. Pechan and Associates, Inc. (Washington, DC, March 1995).
32
can lead to a buildup of the gas in an enclosed area and cause a fire or explosion5. Surface emissions are responsible for contributing to ozone formation and increasing greenhouse gasses, such as methane and carbon dioxide. These emissions can also be responsible for cancerous illnesses, respiratory irritation and central nervous system damage. Uncontrolled landfill gas emissions contribute to a strong, nauseating odor that can affect the surrounding area. The EPA (EPA 2006b) claims, “Unpleasant odors can lower the quality of life for individuals that live near landfills and potentially reduce local property values”. This gas contributes to some of the many problems associated with landfills throughout the world. Not only does harnessing the gas greatly reduce these negative impacts, it can create opportunities for local economic development and an increased quality of life. The idea that communities and business can use waste and turn it into a benefit is growing in popularity and practice.
Landfill Gas Extraction Process
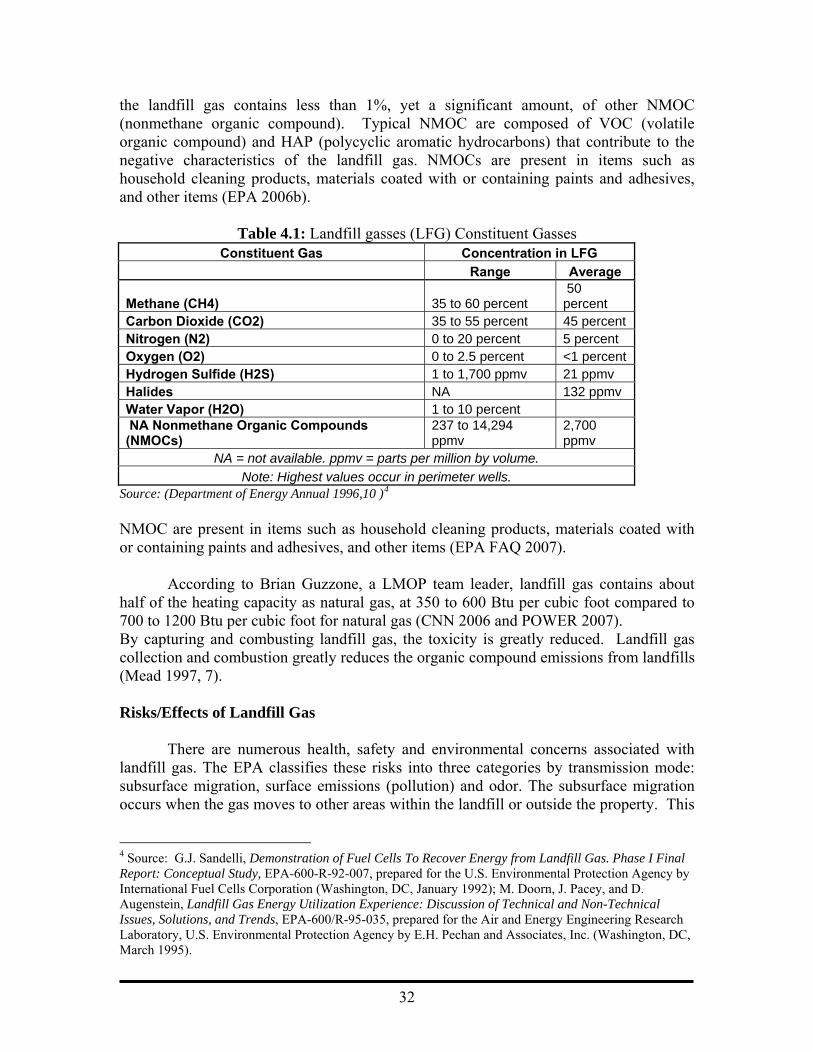
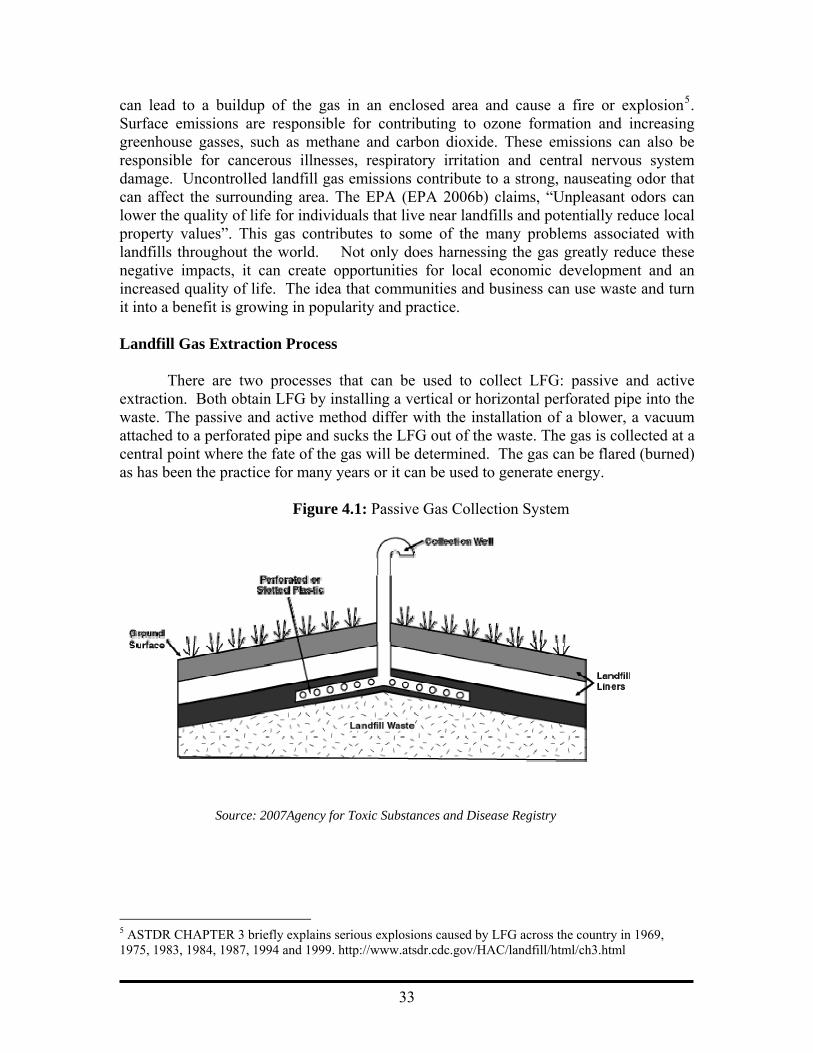
There are two processes that can be used to collect LFG: passive and active
extraction. Both obtain LFG by installing a vertical or horizontal perforated pipe into the waste. The passive and active method differ with the installation of a blower, a vacuum attached to a perforated pipe and sucks the LFG out of the waste. The gas is collected at a central point where the fate of the gas will be determined. The gas can be flared (burned) as has been the practice for many years or it can be used to generate energy.
Figure 4.1: Passive Gas Collection System
Source: 2007Agency for Toxic Substances and Disease Registry
5 ASTDR CHAPTER 3 briefly explains serious explosions caused by LFG across the country in 1969, 1975, 1983, 1984, 1987, 1994 and 1999. http://www.atsdr.cdc.gov/HAC/landfill/html/ch3.html
33
Figure 4.2: Active Gas Collection System
Source: 2007 Agency for Toxic Substances and Disease Registry
The EPA (LMOP 2007a) suggests this gas can be flared, or used to generate electricity, replace fossil fuels in industrial and manufacturing operations, fuel greenhouse operations, or be upgraded to pipeline quality gas.
In 2002, there were 350 landfill gas to energy operations (Table 4.2) and 435 in
2007 according to the LMOP database. (See Appendix 3) Due to the increase in technology, the popularity of alternative energy and the high price of fossil fuels, the number of landfill gas to energy operations has grown since.
34
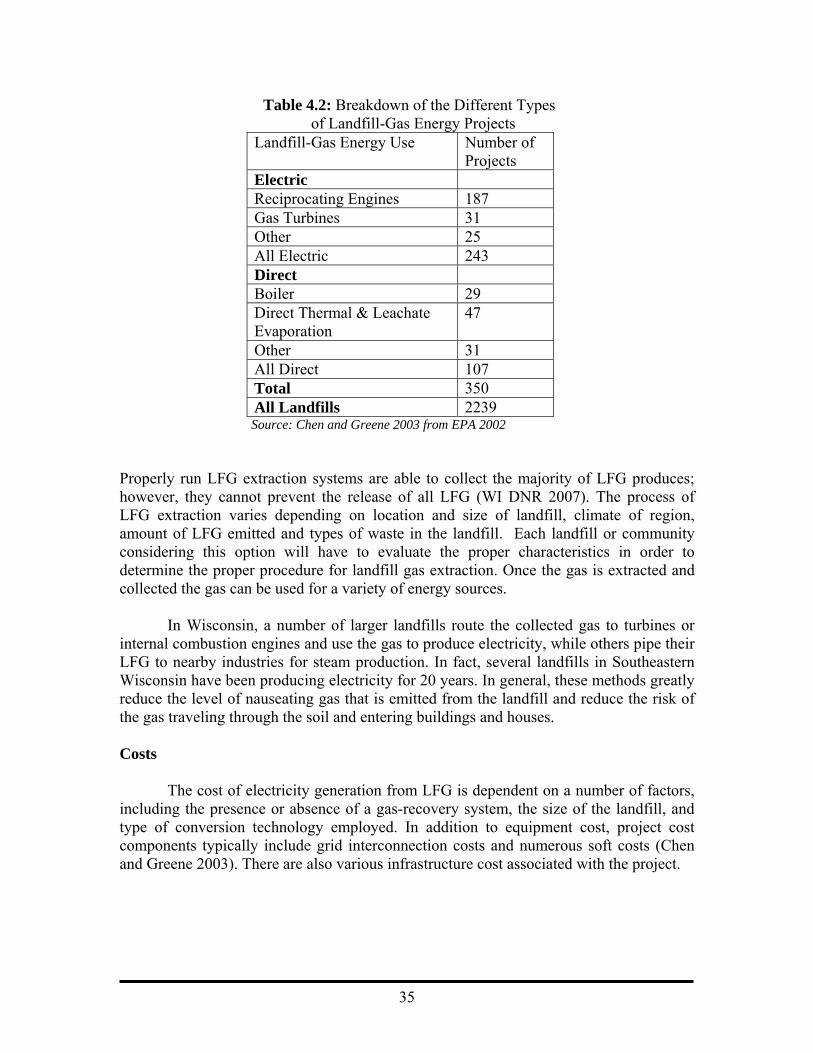
Table 4.2: Breakdown of the Different Types of Landfill-Gas Energy Projects
Landfill-Gas Energy Use Number of Projects
Electric Reciprocating Engines 187 Gas Turbines 31 Other 25 All Electric 243 Direct Boiler 29 Direct Thermal & Leachate Evaporation
47
Other 31 All Direct 107 Total 350 All Landfills 2239 Source: Chen and Greene 2003 from EPA 2002
Properly run LFG extraction systems are able to collect the majority of LFG produces; however, they cannot prevent the release of all LFG (WI DNR 2007). The process of LFG extraction varies depending on location and size of landfill, climate of region, amount of LFG emitted and types of waste in the landfill. Each landfill or community considering this option will have to evaluate the proper characteristics in order to determine the proper procedure for landfill gas extraction. Once the gas is extracted and collected the gas can be used for a variety of energy sources.
In Wisconsin, a number of larger landfills route the collected gas to turbines or
internal combustion engines and use the gas to produce electricity, while others pipe their LFG to nearby industries for steam production. In fact, several landfills in Southeastern Wisconsin have been producing electricity for 20 years. In general, these methods greatly reduce the level of nauseating gas that is emitted from the landfill and reduce the risk of the gas traveling through the soil and entering buildings and houses. Costs
The cost of electricity generation from LFG is dependent on a number of factors,
including the presence or absence of a gas-recovery system, the size of the landfill, and type of conversion technology employed. In addition to equipment cost, project cost components typically include grid interconnection costs and numerous soft costs (Chen and Greene 2003). There are also various infrastructure cost associated with the project.
35

Table 4.3: Capital Cost of a 1 Megawatt Landfill-Gas Energy Project Item Range of Costs Typical Cost Percent Collection System
$200,000 -$1,000,000 $200,000 13
Administrative: Fees, Planning, Legal, Environmental
$30,000 - $1,000,000 $30,000 2
Interconnection $20,000 - $500,000 $76,000 5
Generating Equipment $500,000 -$2,000,000 $970,000 65
Contingency $225,000 15
TOTAL $850,000 - $4,500,000 $1,500,000 100
Source: Chen and Greene 2003 from Jansen 1992. Recent reports and articles state costs of landfill gas to energy projects at $1.5 million to $9.3 million depending on the project6.
On a per-kilowatt-hour (kWh) basis, the cost of electricity generation can range
from as low as 3.4 cents per kWh to as high as 10 cents per kWh (Chen and Greene 2003, vii). When evaluating LFG systems, studies show it is usually much more economical to produce energy where there is already a collection system in place (Chen and Greene 2003)
In addition to the guidelines, studies have been performed measuring the
effectiveness of LFG systems, comparing infrastructure and environmental costs to benefits and effectiveness. First, regarding economic value of the systems, Bove and Lunghi (2006) explored the characteristics of 5 different LFG to energy systems and determined an internal combustion engine (ICE) is the most cost efficient model although it creates more pollution than other alternatives.
Benefits
There are many benefits to the capture and use of landfill gas. The gas itself is
less harmful when it is treated. A NDRC study on cancer- risk suggests that overall toxicity of LFG combustion is 23 times less than raw LFG. The study also found other benefits associated with the use of LFG such as;
Collection and combustion dramatically reduces global warming impacts and toxicity and the use of LFG to generate electricity further reduces the greenhouse gas impacts and also reduces emissions of nitrogen oxides, sulfur dioxide and mercury (Chet and Greene 2003).
6 The Interface/LaGrange, GA LFG to energy project cost was $3 million. The Green Knight Economic Development Corporation in Pennsylvania LFG to energy project cost was $9.2 million.
36
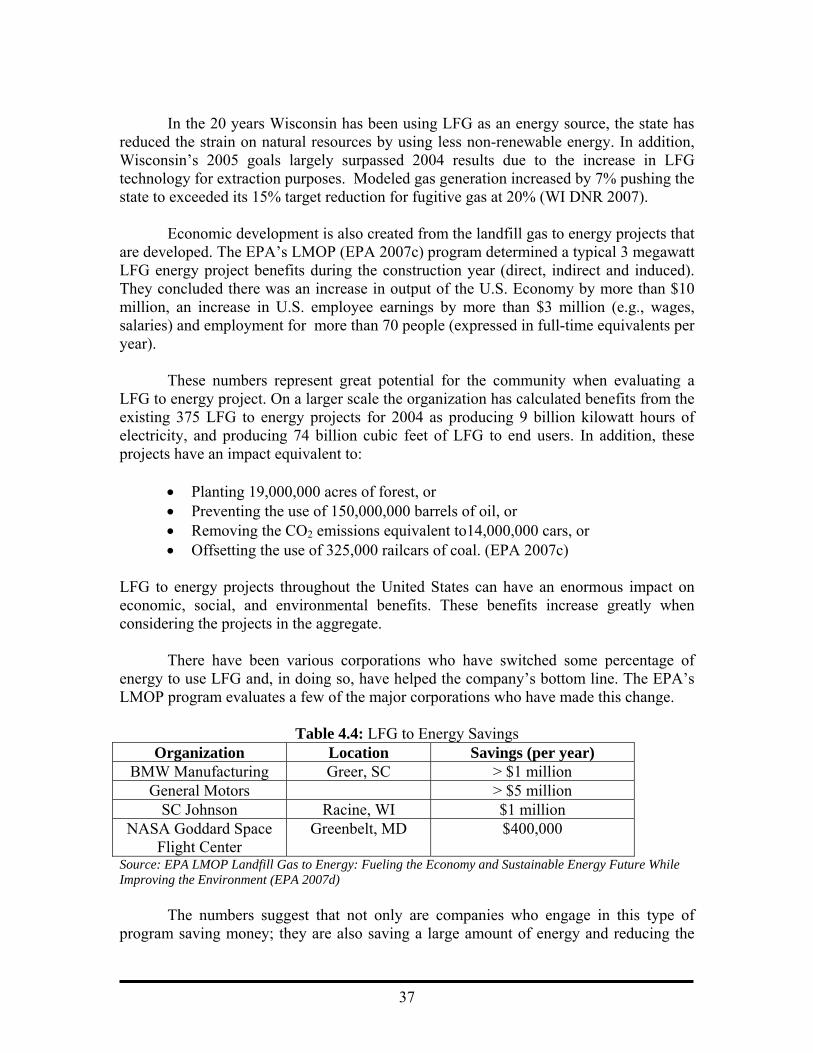
In the 20 years Wisconsin has been using LFG as an energy source, the state has
reduced the strain on natural resources by using less non-renewable energy. In addition, Wisconsin’s 2005 goals largely surpassed 2004 results due to the increase in LFG technology for extraction purposes. Modeled gas generation increased by 7% pushing the state to exceeded its 15% target reduction for fugitive gas at 20% (WI DNR 2007).
Economic development is also created from the landfill gas to energy projects that
are developed. The EPA’s LMOP (EPA 2007c) program determined a typical 3 megawatt LFG energy project benefits during the construction year (direct, indirect and induced). They concluded there was an increase in output of the U.S. Economy by more than $10 million, an increase in U.S. employee earnings by more than $3 million (e.g., wages, salaries) and employment for more than 70 people (expressed in full-time equivalents per year).
These numbers represent great potential for the community when evaluating a
LFG to energy project. On a larger scale the organization has calculated benefits from the existing 375 LFG to energy projects for 2004 as producing 9 billion kilowatt hours of electricity, and producing 74 billion cubic feet of LFG to end users. In addition, these projects have an impact equivalent to:
• Planting 19,000,000 acres of forest, or • Preventing the use of 150,000,000 barrels of oil, or • Removing the CO2 emissions equivalent to14,000,000 cars, or • Offsetting the use of 325,000 railcars of coal. (EPA 2007c)
LFG to energy projects throughout the United States can have an enormous impact on economic, social, and environmental benefits. These benefits increase greatly when considering the projects in the aggregate.
There have been various corporations who have switched some percentage of
energy to use LFG and, in doing so, have helped the company’s bottom line. The EPA’s LMOP program evaluates a few of the major corporations who have made this change.
Table 4.4: LFG to Energy Savings
Organization Location Savings (per year) BMW Manufacturing Greer, SC > $1 million
General Motors > $5 million SC Johnson Racine, WI $1 million
NASA Goddard Space Flight Center
Greenbelt, MD $400,000
Source: EPA LMOP Landfill Gas to Energy: Fueling the Economy and Sustainable Energy Future While Improving the Environment (EPA 2007d)
The numbers suggest that not only are companies who engage in this type of
program saving money; they are also saving a large amount of energy and reducing the
37
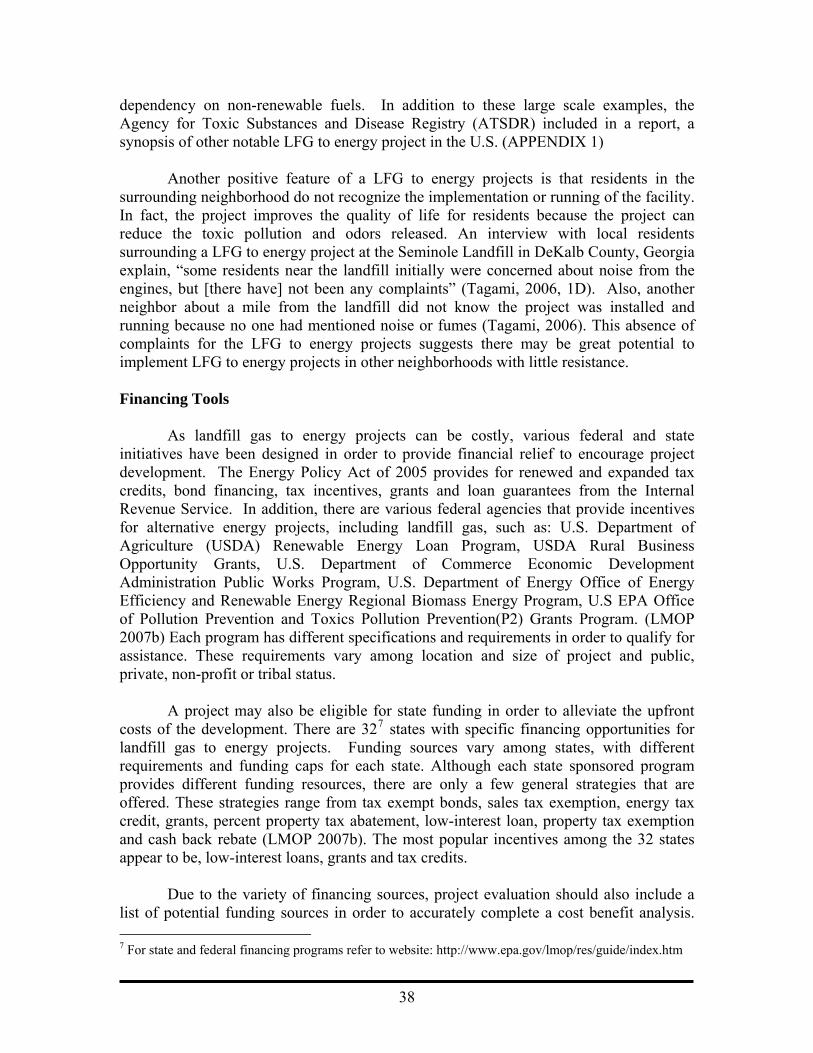
dependency on non-renewable fuels. In addition to these large scale examples, the Agency for Toxic Substances and Disease Registry (ATSDR) included in a report, a synopsis of other notable LFG to energy project in the U.S. (APPENDIX 1)
Another positive feature of a LFG to energy projects is that residents in the
surrounding neighborhood do not recognize the implementation or running of the facility. In fact, the project improves the quality of life for residents because the project can reduce the toxic pollution and odors released. An interview with local residents surrounding a LFG to energy project at the Seminole Landfill in DeKalb County, Georgia explain, “some residents near the landfill initially were concerned about noise from the engines, but [there have] not been any complaints” (Tagami, 2006, 1D). Also, another neighbor about a mile from the landfill did not know the project was installed and running because no one had mentioned noise or fumes (Tagami, 2006). This absence of complaints for the LFG to energy projects suggests there may be great potential to implement LFG to energy projects in other neighborhoods with little resistance. Financing Tools
As landfill gas to energy projects can be costly, various federal and state
initiatives have been designed in order to provide financial relief to encourage project development. The Energy Policy Act of 2005 provides for renewed and expanded tax credits, bond financing, tax incentives, grants and loan guarantees from the Internal Revenue Service. In addition, there are various federal agencies that provide incentives for alternative energy projects, including landfill gas, such as: U.S. Department of Agriculture (USDA) Renewable Energy Loan Program, USDA Rural Business Opportunity Grants, U.S. Department of Commerce Economic Development Administration Public Works Program, U.S. Department of Energy Office of Energy Efficiency and Renewable Energy Regional Biomass Energy Program, U.S EPA Office of Pollution Prevention and Toxics Pollution Prevention(P2) Grants Program. (LMOP 2007b) Each program has different specifications and requirements in order to qualify for assistance. These requirements vary among location and size of project and public, private, non-profit or tribal status.
A project may also be eligible for state funding in order to alleviate the upfront
costs of the development. There are 327 states with specific financing opportunities for landfill gas to energy projects. Funding sources vary among states, with different requirements and funding caps for each state. Although each state sponsored program provides different funding resources, there are only a few general strategies that are offered. These strategies range from tax exempt bonds, sales tax exemption, energy tax credit, grants, percent property tax abatement, low-interest loan, property tax exemption and cash back rebate (LMOP 2007b). The most popular incentives among the 32 states appear to be, low-interest loans, grants and tax credits.
Due to the variety of financing sources, project evaluation should also include a
list of potential funding sources in order to accurately complete a cost benefit analysis. 7 For state and federal financing programs refer to website: http://www.epa.gov/lmop/res/guide/index.htm
38
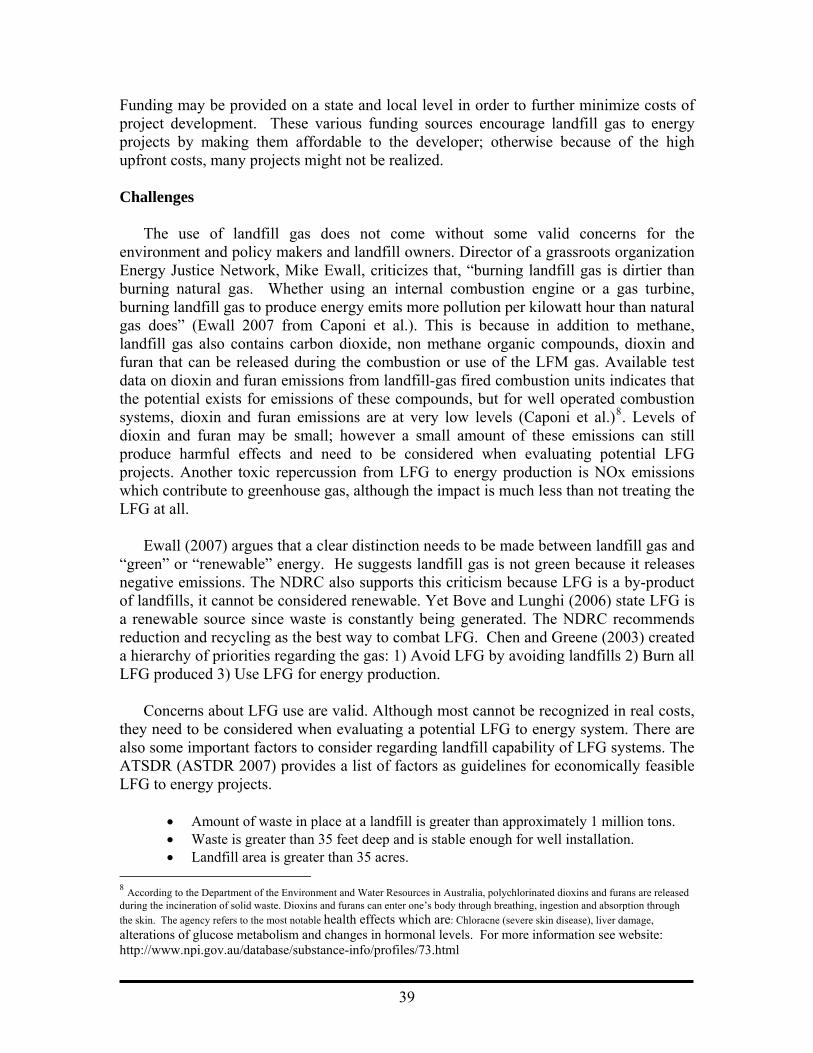
Funding may be provided on a state and local level in order to further minimize costs of project development. These various funding sources encourage landfill gas to energy projects by making them affordable to the developer; otherwise because of the high upfront costs, many projects might not be realized.
Challenges
The use of landfill gas does not come without some valid concerns for the
environment and policy makers and landfill owners. Director of a grassroots organization Energy Justice Network, Mike Ewall, criticizes that, “burning landfill gas is dirtier than burning natural gas. Whether using an internal combustion engine or a gas turbine, burning landfill gas to produce energy emits more pollution per kilowatt hour than natural gas does” (Ewall 2007 from Caponi et al.). This is because in addition to methane, landfill gas also contains carbon dioxide, non methane organic compounds, dioxin and furan that can be released during the combustion or use of the LFM gas. Available test data on dioxin and furan emissions from landfill-gas fired combustion units indicates that the potential exists for emissions of these compounds, but for well operated combustion systems, dioxin and furan emissions are at very low levels (Caponi et al.)8. Levels of dioxin and furan may be small; however a small amount of these emissions can still produce harmful effects and need to be considered when evaluating potential LFG projects. Another toxic repercussion from LFG to energy production is NOx emissions which contribute to greenhouse gas, although the impact is much less than not treating the LFG at all.
Ewall (2007) argues that a clear distinction needs to be made between landfill gas and
“green” or “renewable” energy. He suggests landfill gas is not green because it releases negative emissions. The NDRC also supports this criticism because LFG is a by-product of landfills, it cannot be considered renewable. Yet Bove and Lunghi (2006) state LFG is a renewable source since waste is constantly being generated. The NDRC recommends reduction and recycling as the best way to combat LFG. Chen and Greene (2003) created a hierarchy of priorities regarding the gas: 1) Avoid LFG by avoiding landfills 2) Burn all LFG produced 3) Use LFG for energy production.
Concerns about LFG use are valid. Although most cannot be recognized in real costs,
they need to be considered when evaluating a potential LFG to energy system. There are also some important factors to consider regarding landfill capability of LFG systems. The ATSDR (ASTDR 2007) provides a list of factors as guidelines for economically feasible LFG to energy projects.
• Amount of waste in place at a landfill is greater than approximately 1 million tons. • Waste is greater than 35 feet deep and is stable enough for well installation. • Landfill area is greater than 35 acres.
8 According to the Department of the Environment and Water Resources in Australia, polychlorinated dioxins and furans are released during the incineration of solid waste. Dioxins and furans can enter one’s body through breathing, ingestion and absorption through the skin. The agency refers to the most notable health effects which are: Chloracne (severe skin disease), liver damage, alterations of glucose metabolism and changes in hormonal levels. For more information see website: http://www.npi.gov.au/database/substance-info/profiles/73.html
39

• Landfill is composed of refuse that can generate large quantities of landfill gas composed of 35% or more of methane. An industry guideline states that gas recovery is economically viable at landfills with gas generation rates of 1 million cubic feet per day (EPA 1996).
• If a landfill is still open, active landfill operation will continue for several more years.
• If a landfill is already closed, a short time (no more than a few years) has elapsed since closure.
• Climate is conducive to gas production (very cold or very dry climates can inhibit gas production).
• Energy user is located nearby or in an area accessible to the landfill.
In order to have an economically successful LFG to energy project, research needs to be done to determine: if the project can be done and when, what type of system will be used and what size, what type of heat the LFG will be used for and who will receive the gas.
40
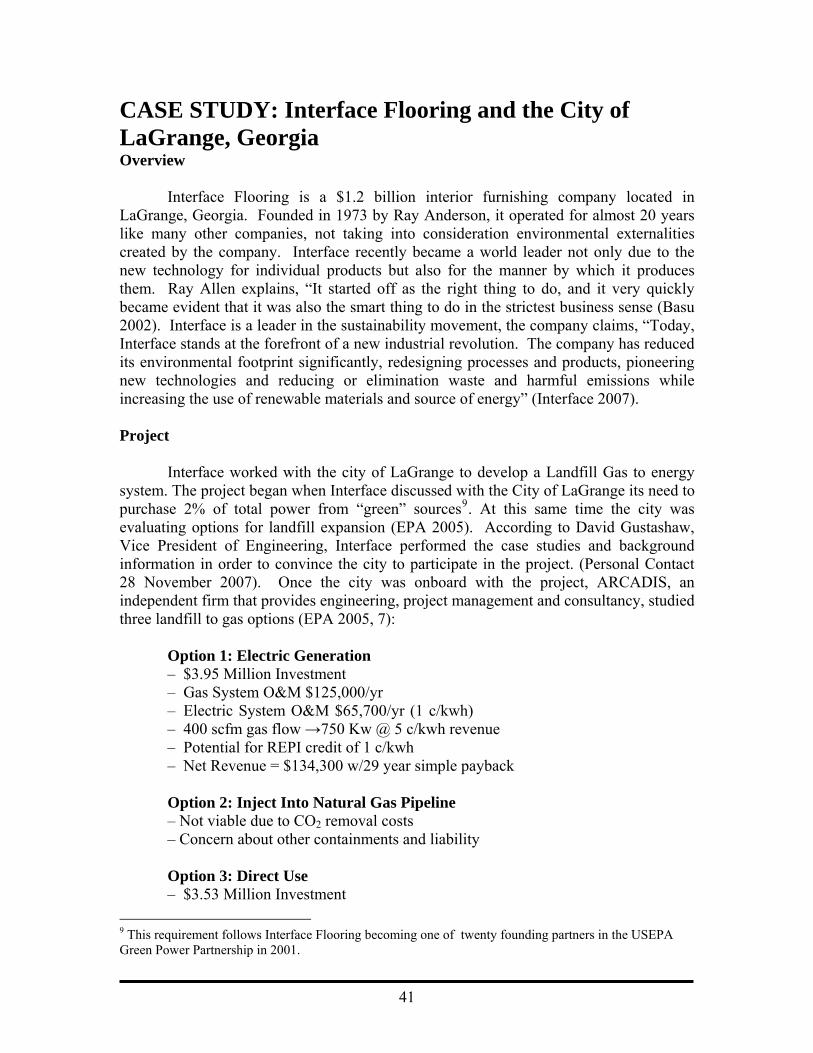
CASE STUDY: Interface Flooring and the City of LaGrange, Georgia Overview
Interface Flooring is a $1.2 billion interior furnishing company located in
LaGrange, Georgia. Founded in 1973 by Ray Anderson, it operated for almost 20 years like many other companies, not taking into consideration environmental externalities created by the company. Interface recently became a world leader not only due to the new technology for individual products but also for the manner by which it produces them. Ray Allen explains, “It started off as the right thing to do, and it very quickly became evident that it was also the smart thing to do in the strictest business sense (Basu 2002). Interface is a leader in the sustainability movement, the company claims, “Today, Interface stands at the forefront of a new industrial revolution. The company has reduced its environmental footprint significantly, redesigning processes and products, pioneering new technologies and reducing or elimination waste and harmful emissions while increasing the use of renewable materials and source of energy” (Interface 2007). Project
Interface worked with the city of LaGrange to develop a Landfill Gas to energy
system. The project began when Interface discussed with the City of LaGrange its need to purchase 2% of total power from “green” sources9. At this same time the city was evaluating options for landfill expansion (EPA 2005). According to David Gustashaw, Vice President of Engineering, Interface performed the case studies and background information in order to convince the city to participate in the project. (Personal Contact 28 November 2007). Once the city was onboard with the project, ARCADIS, an independent firm that provides engineering, project management and consultancy, studied three landfill to gas options (EPA 2005, 7): Option 1: Electric Generation ––$3.95 Million Investment$3.95 Million Investment ––Gas System O&M $125,000/yrGas System O&M $125,000/yr ––Electric System O&M $65,700/yr (1 c/kwh)Electric System O&M $65,700/yr (1 c/k ––400 scfm gas flow →750 Kw @ 5 c/kwh revenue ––Potential for REPI credit of 1 c/kwh ––Net Revenue = $134,300 w/29 year simple payback w/29 year simple payback Option 2: Inject Into Natural Gas Pipeline
– Not viable due to CO2 removal costs – Concern about other containments and liability contaminants and liability Option 3: Direct Use ––$3.53 Million Investment$3.53 Million Investment 9 This requirement follows Interface Flooring becoming one of twenty founding partners in the USEPA Green Power Partnership in 2001.
41

––Gas System O&M $125,000/yrGas System O&M $125,000/yr ––Equipment O&M $8,000/yrO&M $8,000/yr ––400 scfm gas flow @ $0.80/therm revenue@ $0.80/therm revenue
––Net Revenue = $707,960 w/ 5 year simple payback After the initial study was completed, and information was collected, the Direct Use option was found to be the most appropriate LFG application. In addition, it was determined that the installation of a Bioreactor would increase output of gas and landfill space by 30%. Although it could potentially exceed New Source Performance Standards (NSPS) emissions the bioreactor was installed (EPA 2005, 16).
The project was financed by the city, and because the city of la Grange owns all
of its utilities, it was eligible for loans. In 2002, the City of LaGrange was awarded a $1million low-interest loan from GEFA (Georgia Environmental Facilities Authority). This loan was designated for upgrading landfill equipment and could also be used for developing LFG to energy systems, including collection systems and gas generation facilities (EPA 2007d). The cost of this program was projected between $2.5 and $3 million. Both the city and Interface would be able to recover costs. Gustashaw estimates Interface will recoup these funds in two to three years and the city in four to five years (Chen 2007). Outcomes
A presentation at a LMOP conference (EPA 2005) referred to Strategies for Building
Industrial and Commercial Demand for Landfill Gas (2002) and summarized benefits to industry from LFG projects as: improved corporate environmental profile, emissions credits, lower energy costs and lower price volatility.
The city signed 10 year contracts with Interface and Milliken (a chemical and textile
company) for 77,640 Dths10 per year. The methane gas program helps power Interface’s manufacturing facility in LaGrange, Georgia. Interface saves money because the cost of LFG is 30% less than the market price for natural gas (Personal contact with Gustashaw and EPA 2005).The use of LFG not only helps Interface’s bottom line, it also cuts emissions from the company and, in addition, provides revenue to the city (Interface 2005). Monthly or annual savings have not been calculated by Interface or the City for use of this energy source. The revenue to the city is not earmarked and is directly placed into the city’s general fund which is used for a variety of different infrastructure improvements and programs. The revenue created may offset the lack of job creation from the LFG to energy program. According to the Patrick Bowie, Director of Utilities, City of LaGrange said there were no jobs created through this program and that the revenue earned from the sale of gas went to the general fund to help with city initiatives (Personal contact, Patrick Bowie, 28 November 2007).
The price Interface pays for LFG is 30% less than the price of natural gas, the
savings is calculated monthly based on the Citygate index price for the non renewable 10 Unit of heating equivalent to 1 million Btus
42

gas. (Personal contact with Gustashaw and EPA 2005) Interface pays lower rates on energy, helping the company’s bottom line (Interface 2005). Regarding environmental benefits, Interface claims, “ The magnitude of this project is such that is offsets the greenhouse gas emissions for all of Interface’s North American carpet manufacturing facilities, making them all climate neutral” (EPA 2005). Future Expectations
Interface is clearly one of the world’s leaders in sustainable industry, the company
has a special team for research and development working in state of the art facilities to develop renewable and environmental friendly raw materials for products, improve the design and process of a product and recycling technologies (Interface Research 2007). Interface may be in a unique situation regarding job creation, jobs have been created but not due to one sustainable action. Interface developed a sustainability team that addresses issues regarding economic, social and environmental sustainability. This department is responsible for information, promotion of programs, scholarships and grants. These jobs are not supported by cost savings from sustainable programs. According to Gustashaw, no jobs have been created that are directly related to the cost savings from LFG energy. In fact, he explains there was little infrastructure development needed at Interface so the overall process has not changed dramatically (Personal contact Gustashaw 28 November 2007). It also cannot be determined exactly how much Interface saves by participating in the LFG energy program and Interface has not done a cost benefit analysis since project implementation. Interface is trying to incorporate sustainability into every aspect of the company and does not see earmarking money as a way to wholly integrate sustainable measures (personal contact Erin Meezan, Director of Sustainability at Interface 28 November 2007). Recommendations
The cooperation between the City of LaGrange and Interface Flooring has many
benefits, both financial and environmental. This project could be replicated between other public landfills and corporations or private landfills and corporations. This example can serve as a basic model for private public partnerships for the development of LFG systems and the sale of LFG to energy.
Conclusion Landfill gas to energy projects could be potential investments for many
communities. With a variety of funding incentives, the upfront costs are decreased making the project more feasible. There is also research supporting landfill mining which can be another viable option for communities who do not want to or cannot implement landfill gas to energy projects. Landfill mining would also provide the benefit landfill gas to energy projects do: using something that is considered waste and turning it into valuable material.
43
Conclusion
Waste management is an issue that should be taken into consideration when discussing past, present and future planning and policy strategies. Waste management in its traditional sense is the various forms of collecting, sorting and distributing solid municipal waste. As a locality experiences changes in demographics, decision makers should adjust waste management strategies in order to account for those changes. Planning for waste management strategies is important because creation or extension of landfills are getting more difficult in cities across the nation. In fact, there are numerous examples of localities that are no longer accepting trash and are now shipping waste outside its jurisdiction and paying a premium to landfill operators in other parts of the country or world. Some of the most notable cities engaged in this practice are Toronto, New York City and discussion about Hawaii sending its trash to Seattle is pending. This report has shown through proactive and reactive strategies waste management can be used as a tool for sustainable local economic development. Zero waste, recycling and landfill gas to energy projects can be designed to raise revenue, raise profits, create jobs and improve the quality of life while managing what people throw out of their houses on garbage day.
44

Appendix 1
Source: London Remade
45
Appendix 2 In Raleigh, North Carolina, Ajinomoto Pharmaceutical Company has used landfill
gas as fuel in boilers at its facility since 1989. The steam produced by the boilers is used to heat the facility and warm pharmaceutical cultures. This project has prevented pollution equivalent to removing more than 23,000 cars from the road.
In Pittsburgh, Pennsylvania, Lucent Technologies saves $100,000 a year on fuel bills by using landfill gas to generate steam for space heating and hot water.
The City of Riverview, Michigan, works with the local utility, Detroit Energy, to recover landfill gas and create electricity with two gas turbines. The project generates enough power to meet the energy needs of more than 3,700 homes.
The Los Angeles County Sanitation District in California has succeeded in turning landfill gas into a clean alternative vehicle fuel. Landfill gas is compressed to produce enough fuel per day to run an 11-vehicle fleet, ranging from passenger vans to large on- road tractors.
Pattonville High School in Maryland Heights, Missouri, is located within 1 mile of a municipal solid waste landfill. The landfill supplies methane gas to heat the 4, 000- square- foot high school, saving the Pattonville School District thousands of dollars in annual heating costs. Pattonville High School was the first high school to use landfill gas as its source of heat (CNN 1997)
The Jenkins Brick Company installed a new factory, the Jordan Plant, in Moody,
Alabama. This plant is connected to the Veolia ES Star Ridge Landfill by a 6.5 mile long pipeline. Initially, the Jordan Plant will run of 40% LFG energy. The intention is to use 100% energy in 10 years, assuming the landfill will be able to provide the plant’s full energy needs11.
In Pennsylvania, the Green Knight Economic Development Corporation
(GKEDC) had the financial backing and financial support to build a 9.5 MW landfill gas generating plant in Pen Argyl. The project costs were about $9.2 million and GKEDC has collected about $2 million since 2001. (PennFuture 2006) The energy is sold to the Exelon power company and is enough to power about 8,000 homes. Profits support financing for new job creation in the area. GKEDC was involved in Techo-Bloc Corp. coming to the area with between 50 and 60 jobs with more to come. In addition, donations to qualifying organizations, scholarships, local services and educational events are provided due to profit. (ASCME 2003)
In Tennessee, gas from the Yancey-Mitchell landfill is used to provide energy to 4
buildings, 4 greenhouses, 4 shade structures and a visitor center. These buildings contribute to a glass blowing studio, pottery studio, gallery, heating system,
11 Presented in Agency for Toxic Substances and Disease Registry Chapter 5 (ATSDR 2007)
46

nursery, aquaponics greenhouse. The entire project cost $1.3 million by the Energy Xchange, a non-profit located in North Carolina that works regionally in order to fulfill its mission, “to demonstrate the responsible use of landfill gas as an energy source for small enterprises in craft and horticulture, and to meet local energy needs” (http://www.energyxchange.org/mission_ex.html). According to Energy Xchange (Steury 2007), the economic development recorded from 2003-2007 are $2 million grant funding, $150,000 project income, $800,000 energy savings, 8 contractors hired, 30 temporary jobs (apprentices), 3 full-time, 3 part-time jobs (project), 10 new businesses and 27 expanded businesses12.
12 The Jenkins Brick Company, Green Knight Economic Development Corporation and are additional examples provided by the authors.
47
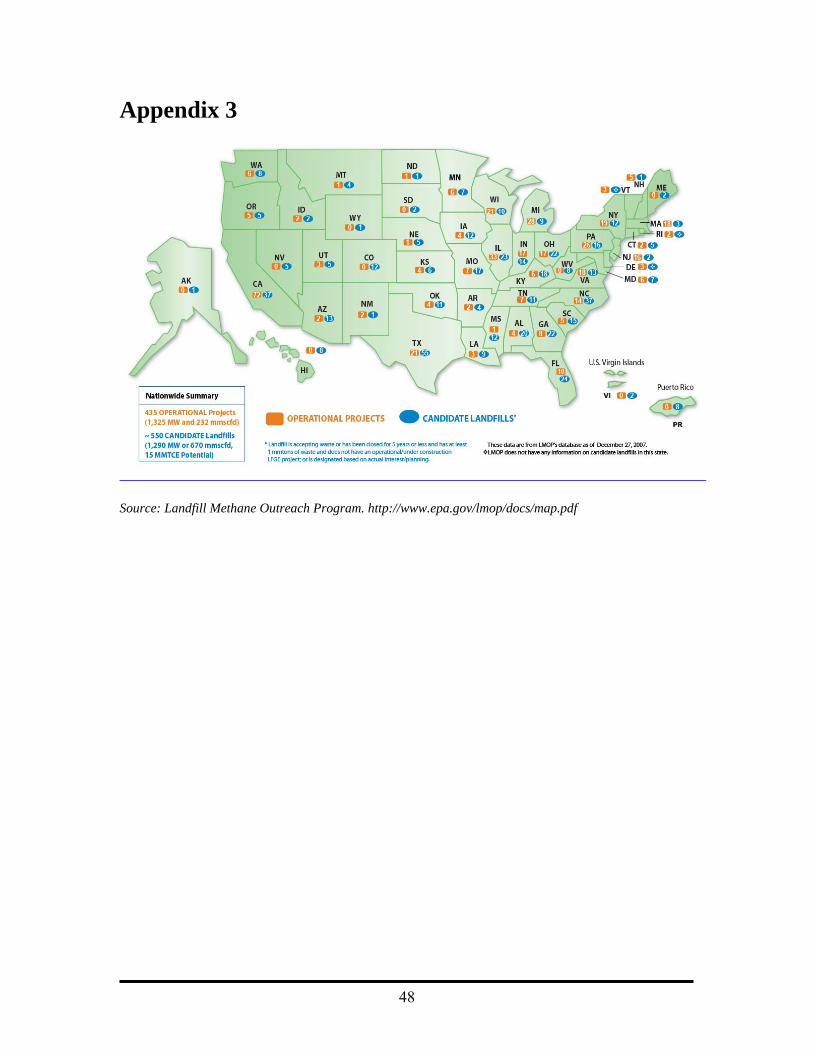
Appendix 3
Source: Landfill Methane Outreach Program. http://www.epa.gov/lmop/docs/map.pdf
48
References Agency for Toxic Substances and Disease Registry (ASTDR) 2007. Landfill gas primer-
An overview for environmental health professionals. Retrieved October 10, 2007 from website: http://www.atsdr.cdc.gov/HAC/landfill/html/toc.html
ASME International (2003). Newsletter: Anthracite-Lehigh Valley Section. Retrieved
November 20, 2007 from website: http://sections.asme.org/a-lv/news/2003_10/Oct2003NL.htm
Alter, H. (1983). Materials recovery from municipal waste: Unit operations in practice. New York, M. Dekker.
Basta, N. (1992). Environmental jobs for scientists and engineers. New York, Wiley. Basu, M. (2002) Conservation Connection: Carpet giant weaves earth-friendly policies.
Atlanta Journal-Constitution. Home Edition pg. 1F. June 12, 2002. Bove, R and Lunghi, P. (2006). Electric power generation from landfill gas using
traditional and innovative technologies. Energy Conversion and management Vol. 47 pp. 1391-1401
Bumpus, L. D. (1995). Solid Waste: Transportation and Other Costs. T. U. o. T. C. T. A.
Service, CTAS. Caponi, F., Wheless, E. and Frediani, D, Dioxin and furan emissions from landfill gas-
fired combustion units. County Sanitation District of Los Angeles County.
Chen, C. and Greene, N. (2003). Is landfill gas green energy? Natural Resources Defense Council. Retrieved November 15,2007 from website: http://www.nrdc.org/air/energy/lfg/lfg.pdf
Chen, D (July 2006) Converting trash gas into energy gold. CNN. Retrieved November
20, 2007 from website: http://www.cnn.com/2006/TECH/05/25/landfill.gas/index.html
Collin, R. W. (2006). The Environmental Protection Agency : cleaning up America's act. Westport, Conn., Greenwood Press.
Dimino, R. a. B. W. (2004). "Reaching for Zero: The Citizens Plan for Zero Waste in
New York City." New York City Zero Waste Campaign Retrieved June 2004, from http://www.consumersunion.org/other/zero-waste/index.html.
Duston, T. E. (1993). Recycling solid waste : the first choice for private and public sector
management. Westport, Conn., Quorum Books.
49
Energy Information Administration (1996) Renewable energy annual. Office of Coal, Nuclear, Electric and Alternative Fuels. U.S. Department of Energy. Retrieved November 15, 2007 from website: http://tonto.eia.doe.gov/FTPROOT/renewables/060396.pdf
Ewall, M (2007) Primer on landfill gas as “green” energy. Retrieved November 20, 2007
from website: http://www.energyjustice.com/lfg/ Green Party (2007). Towards Zero Waste. Retrieved November 2, 2007 from website:
http://www.greenparty.org.uk/files/reports/2002/waste%20briefing.htm.
Gunther, M. (2007). "The End of Garbage." Fortune 155(5): 158. Interface (2005) Annual report 2005. Retrieved November 15, 2007 from website:
http://library.corporate-ir.net/library/11/112/112931/items/197701/2005_AR2.pdf Interface (2007) Who we are: Founder. Retrieved November 20, 2007 from website:
http://www.interfaceinc.com/who/founder.html Interface (2007a). What we do: Research. Retrieved November 20, 2007 from website:
http://www.interfaceinc.com/what/research.html Landfill Methane Outreach Program (LMOP)(2007b) Funding landfill gas energy
projects: State, federal and foundation resources. Retrieved December 5, 2007 from website: http://www.epa.gov/outreach/lmop/res/guide/federal.htm
Landfill Methane Outreach Program (2007a) Basic information. Retrieved October 15,
2007 from http://www.epa.gov/lmop/overview.htm Leroux, K. (2001). "Is Zero Waste Possible?" Waste Age 32(3): 202. Luton, L. S. (1996). The politics of garbage : a community perspective on solid waste
policy making. Pittsburgh, Pa., University of Pittsburgh Press. Mead, R. (1997) Draft summary of July 24, 1997 boiler work group meeting. Eastern
Research Group. INC. Retrieved November 1, 2007 from website: http://www.epa.gov/ttn/atw/iccr/dirss/bo24jl7l.pdf
McDonough, W. and M. Braungart (2002). Cradle to cradle : remaking the way we make
things. New York, North Point Press. Motavalli, J. (2001). "ZERO WASTE (Cover story)." E Magazine: The Environmental
Magazine 12(2): 26. Municipal Solid Waste - Recycling. (n.d.). Retrieved December 3, 2007, from United States Environmental Protection Agency Web site: http://www.epa.gov/epaoswer/non-hw/muncpl/recycle.htm
50
Ostopowich, M. (2003). “Science of Waste: Refuse, Misuse, and Reuse.” Raintree
Publishers. PennFuture (2006). Citizens for Pennsylvania’s future: Working to protect
Pennsylvania’s environment and economy. Green power update. PennFuture. Retrieved November 25, 2007 from website: http://pennfuture.org/media_gpu_detial.aspx?MediaID=663&TypeID=7
Philips, S. (2005). "Potential of Zero Waste'. The Irish Times. Power Magazine (May 2007). Focus on O&M. Power Magazine. Vol. 151 No. 5.
Retrieved November 26, 2007 from website: http://www.epa.gov/lmop/overview.htm
Prüfer, C. B. (1997). Waste management in Poland and Germany : economic and legal
aspects of waste management and their impact on cooperation at national and business level. Frankfurt am Main; New York, P. Lang.
Steury, S (2007). Community ties: Direct use of landfill gas for economic development.
East Tennessee Environmental Conference. Appalachian State University Energy Center. Retrieved October 20, 2007 from website: http://www.tnenvironment.com/2007Pres_pdfs/e2_3.8MB.pdf
Tagami, T (2006). Landfill a ‘green’ electricity machine: DeKalb dump turns trash gas to
cleaner yet pricier, power. Atlanta Journal-Constitution. Main Edition pg. 1D. December 27, 2006.
Tammemagi, H. Y. (1999). The waste crisis : landfills, incinerators, and the search for a
sustainable future. New York, Oxford University Press. Tolba, M. K. (1987). Sustainable development: constraints and opportunities. London ;
Boston, Butterworths. United Nations Educational, Scientific and Cultural Organization. “Recycling and Job
Creation, Chattanooga, USA”. MOST Clearing House Best Practices Database. Retrieved November 01, 2007 from website: http://www.unesco.org/most/usa7.htm
United States Bureau of Labor Statistics (2006). “National employment and wage data
from the Occupational Employment Statistics survey by occupation, May 2006”. Retrieved March 6, 2008 from website: http://www.bls.gov/news.release/ocwage.t01.htm
51

United States Environmental Protection Agency (1997). Full Cost Accounting for Municipal Solid Waste Management: A Handbook. S. W. a. E. Response. Washington, D.C., United State Environmental Protection Agency.
United States Environmental Protection Agency (January 2005). City of LaGrange,
Georgia: Landfill gas project. Landfill Methane Outreach Program Conference, retrieved November 10, 2007 from website: http://www.epa.gov/landfill/conf/8th/Presentations/Bowie.pdf
United States Environmental Protection Agency (2006). The Economics of Recycling in
the Southeast: Understanding the Whole Picture. United States Environmental Protection Agency (2006b). Frequently asked questions
about landfill gas and how it affects public health, safety, and the environment. Retrieved on October 15, 2007 from website: http://www.epa.gov/landfill/faq-3.htm#1
United States Environmental Protection Agency (2007a) Basic facts: Municipal solid
waste. Retrieved December 2, 2007 from website: http://www.epa.gov/msw/facts.htm
United States Environmental Protection Agency (2007b). Where are the Biggest Cost
Savings? Retrieved November 10, 2007 http://www.epa.gov/wastewise/wrr/cost.htm
United States Environmental Protection Agency (2007c). Landfill gas energy: Fueling
the economy and a sustainable energy future while improving the environment. Retrieved November 1, 2007 from website: http://www.epa.gov/lmop/docs/LMOPGeneral.pdf
United States Environmental Protection Agency (2007d). Funding landfill gas energy
projects. Landfill Methane Outreach Program. Retrieved October 10, 2007 from website: http://www.epa.gov/landfill/res/guide/ga.htm
United States Office of Solid Waste. Municipal and Industrial Solid Waste Division.
(1999). Organic materials management strategies. [Washington, D.C., U.S. Environmental Protection Agency], Office of Solid Waste, Municipal and Industrial Solid Waste Division.
Wisconsin Department of Natural Resources (2007). Initiative to reduce fugitive release
of landfill gas from municipal solid waste landfills. Retrieved October 15, 2007 from website: http://www.dnr.state.wi.us/org/aw/wm/solid/gas/gas.htm
Zero Waste America 2002. The United States is sinking under a tidal wave of waste.
http://www.zerowasteamerica.org/
52

Zero Waste New Zealand Trust (2008). “The End of Waste: Zero Waste by 2020”. Retrieved from website: http://www.zerowaste.co.nz/assets/Reports/TheEndofWaste.pdf
53


![Martin Donohoe. Corporations “The [only] social responsibility of business is to increase its profits.” - Milton Friedman](https://img.pdfslide.net/doc/110x75/56649e415503460f94b33340/martin-donohoe-corporations-the-only-social-responsibility-of-business.jpg)