Embed Size (px)
Citation preview
Waste Management Study – Livingstone, Zambia ASSESSMENT OF OPPORTUNITIES FOR THE REDUCTION OF OPEN BURNING PRACTICES

Waste Management Study for Livingstone 2
Contributing consultants
Joy Simwaba, National Expert on Environment & Waste Special acknowledgements
Livingstone City Council Waste Management Unit for survey guidance, interview responses and provision of raw data Zambia Environmental Management Agency (ZEMA) for facilitation of formal contacts with the City Council
Waste Management Study for Livingstone 3
CONTENTS
ABBREVIATIONS ............................................................................................................................................... 4
TABLES & ILLUSTRATIONS .................................................................................................................................. 5
1. EXECUTIVE SUMMARY .......................................................................................................................... 6
1.1 Summary of Findings ........................................................................................................................................ 6
1.2 Summary of Areas of Improvement .................................................................................................................. 9
2. INTRODUCTION AND METHODOLOGY .............................................................................................. 10
3. CITY CONTEXT ...................................................................................................................................... 14
3.1 General ........................................................................................................................................................... 14
3.2 Regulations & Market Mechanisms Covering Waste Management in Livingstone .......................................... 17
4. WASTE MAPPING ................................................................................................................................. 19
4.1 Population Map ............................................................................................................................................... 19
4.2 Waste Map ...................................................................................................................................................... 20
4.3 Collection Systems ......................................................................................................................................... 21
4.4 Waste Characterisation ................................................................................................................................... 21
4.5 Summary of Challenges .................................................................................................................................. 22
4.6 Opportunities for Development ....................................................................................................................... 23
5. RECYCLING AND RECYCLABLES ...................................................................................................... 25
5.1 Current Practices ............................................................................................................................................ 25
5.2 Opportunities ................................................................................................................................................... 26
5.3 Roadmap Proposed ........................................................................................................................................ 27
5.4 Quantities and Sustainability ........................................................................................................................... 28
6. CITY-LEVEL WASTE DISPOSAL .......................................................................................................... 29
6.1 Current Dumpsite and Its Challenges ........................................................................................................... 29
6.2 Roadmap to Sanitary Landfill ........................................................................................................................ 29
6.3 Quick-Win Opportunities ............................................................................................................................... 33
7. PROPOSALS ON COLLECTION SYSTEM ........................................................................................... 34
7.1 Overall Strategy ............................................................................................................................................. 34
7.2 Volume Estimates .......................................................................................................................................... 34
7.3 SWOT Assessment ....................................................................................................................................... 35
7.3 Key Derived Actions ...................................................................................................................................... 38
7.4 Collection Systems and Collection Centres .................................................................................................. 38
7.5 Fees and Payment Systems ......................................................................................................................... 39
7.6 Collector Characteristics ............................................................................................................................... 40
7.7 Projected Cost Impacts ................................................................................................................................. 41
7.8 Projected Revenue Impacts .......................................................................................................................... 44
7.9 Implied Changes in Cost and Revenue Administration for Waste Management ........................................... 44
8. CONCLUSION ........................................................................................................................................ 45
PHOTOLOG ................................................................................................................................................................... 48
BIBLIOGRAPHY .............................................................................................................................................................. 49
Waste Management Study for Livingstone 4
ABBREVIATIONS
7NDP Seventh National Development Plan
AF Alternative Fuel
ARM Alternative Raw Material
BATNEEC Best Available Technology Not Entailing Excessive Cost
BAU Business As Usual
BDMs Biodegradable Materials
BOQ Bill of Quantities
BPEO Best Practicable Environmental Option
C&D Construction and Demolition
Capex Capital Expenditure
CAGR Compounded Annual Growth Rate
CBD Central Business District
CC Collection Centre
CO2 Carbon dioxide
CSO Central Statistical Office
EIA Environmental Impact Assessment
EMA 2011 The Environmental Management Act (no. 12 of 2011)
EMS Environmental Management System
EPR Extended Producer Responsibility
GHG Greenhouse Gas (emissions)
GRZ Government of the Republic of Zambia
Gt Giga.tonnes (x106 tonnes)
GVM Gross Vehicle Mass
HH Household
ISID Inclusive and Sustainable Industrial Development
JCTR Jesuit Centre for Theological Reflection
kt kilo.tonnes (1000,000kg)
LCC Livingstone City Council
MBI Market-Based Incentives
MSME Micro, Small & Medium scale Enterprises
NIMBY Not In My Back Yard
OECD Organization for Economic Cooperation and Development (a 34 member body of the most developed countries in the world)
Opex Operating Expenditure
PAYG Pay As You Go
POA Product Off-take Agreement
POPs Persistent Organic Pollutants
PPE Personal Protective Equipment
RMs Recyclable Materials
SADC Southern African Development Community
SI Statutory Instrument
SMS Short Messaging System
SUF Single-User Facility
TC Town Clerk
TPY Tons Per Year
UNIDO United Nations Industrial Development Organisation
WACS Waste Analysis and Characterisation Study
WM Waste Management
WMG Waste Management Grid
WMU Waste Management Unit
WPY Waste Processing Yard
ZABS Zambia Bureau of Standards
ZAWA Zambia Wildlife Authority
ZCSA Zambia Compulsory Standards Agency
ZEMA Zambia Environmental Management Agency
ZESCO Zambia Electricity Supply Corporation Ltd
ZRA Zambia Revenue Authority
ZS Zambian Standard
Waste Management Study for Livingstone 5
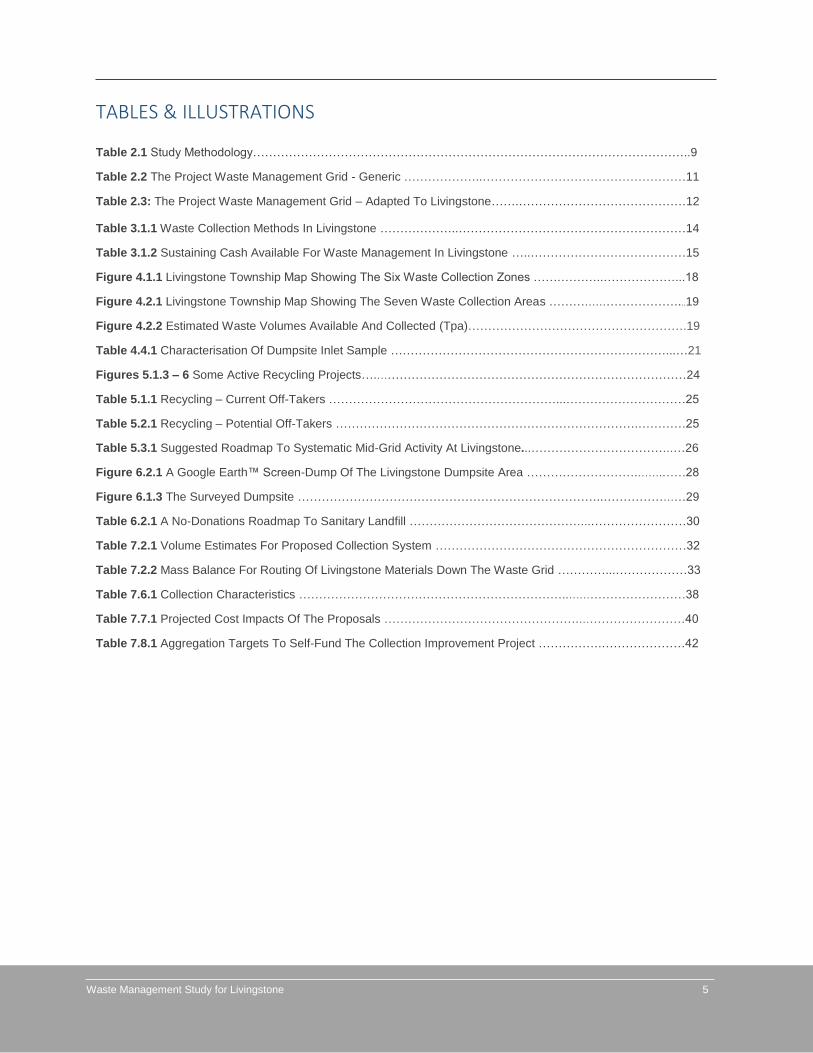
TABLES & ILLUSTRATIONS
Table 2.1 Study Methodology………………………………………………………………………………………………..9
Table 2.2 The Project Waste Management Grid - Generic ………………..……………………………………………11
Table 2.3: The Project Waste Management Grid – Adapted To Livingstone…….……………………………………12
Table 3.1.1 Waste Collection Methods In Livingstone ………………..…………………………………………………14
Table 3.1.2 Sustaining Cash Available For Waste Management In Livingstone …..…………………………………15
Figure 4.1.1 Livingstone Township Map Showing The Six Waste Collection Zones …….………..………………...18
Figure 4.2.1 Livingstone Township Map Showing The Seven Waste Collection Areas ……………………………...19
Figure 4.2.2 Estimated Waste Volumes Available And Collected (Tpa)……………………………………………….19
Table 4.4.1 Characterisation Of Dumpsite Inlet Sample ……………………………………………………………...…21
Figures 5.1.3 – 6 Some Active Recycling Projects….……………………………………………………………………24
Table 5.1.1 Recycling – Current Off-Takers …………………………………………………...…………………………25
Table 5.2.1 Recycling – Potential Off-Takers ………………………………………………………………….…………25
Table 5.3.1 Suggested Roadmap To Systematic Mid-Grid Activity At Livingstone...…………………………………26
Figure 6.2.1 A Google Earth™ Screen-Dump Of The Livingstone Dumpsite Area ……………………….…….……28
Figure 6.1.3 The Surveyed Dumpsite …………………………………………………………………..…………………29
Table 6.2.1 A No-Donations Roadmap To Sanitary Landfill ……………………………………….……………………30
Table 7.2.1 Volume Estimates For Proposed Collection System ………………………………………………………32
Table 7.2.2 Mass Balance For Routing Of Livingstone Materials Down The Waste Grid …………...………………33
Table 7.6.1 Collection Characteristics …………………………………………………………..…………………………38
Table 7.7.1 Projected Cost Impacts Of The Proposals ………………………………………….………………………40
Table 7.8.1 Aggregation Targets To Self-Fund The Collection Improvement Project …………….…………………42
Waste Management Study for Livingstone 6
Executive Summary
A first level assessment of waste management in Livingstone City has been completed. This report presents the findings and recommendations to make the waste management system sustainable. The ultimate aim of this project is to disincentivise and reduce open burning practices so the results are analysed and reported with that goal in mind.
1.1 Summary of Findings
On waste map and waste characterisation
The city produces around 90tpd of disposable waste.
Around 50% of this is collected from the CBD and public spaces like markets.
Up to 5% is collected from single-user facilities run privately by high waste institutions like the hotels.
The rest of the waste – approximately 41tpd – is in the townships where the collection rate varies depending on success of the contracted waste collection company to receive user fees and collect the waste.
Using a limited-time truck count at the dumpsite, an estimate has been made that up to 60% - 24tpd – remains uncollected in the townships and is either burned or buried.
A basic characterisation (without systematic down-sampling to ensure best representative sample) was carried out of fresh waste piles at the dumpsite and found in % by weight Organics: 35 Plastics: 17 Textiles: 9 Wood and Paper: 9 Rubber: 3 Metals: 3 Glass: 23 Other: 1
During the study period, waste directly from representative households was not available (only the waste mixed with other stock from skips, shops and lodges operating within the townships). Some characterization was carried out of waste from few households near the CBD but its representativity was doubtful and the results are therefore not reported. A planned WACS exercise with longer residence time of the study leader is recommended.
On recycling and recyclables
Very high potential. The city has had good exposure to segregation efforts and some actual projects already implemented.
Greatest potential on glass, PET bottles, organic waste and, to a much lesser extent, paper
On waste collection system
The urbanized part of the city was zoned into six and six contractors engaged in 2011 to service (collect waste from) the zones. They were: Kelly Clean, Professional Waste, Majiro Garbage Collectors, KC, BBMC and Niluna. Initial response to the call for expression of interest was low, but the required six companies were found.
OF the initial six, only three are currently active. The three who are now dormant have been rendered so by poor cash flow or working capital issues; these are: KC, BBMC and Niluna.
In the peri-urban (lower income) areas, the waste collection fee was set by the Council at K30 (US$2.5) per month.
In the higher-income areas and CBD, waste is collected at K50 (US$4.2) per month.
111
Waste Management Study for Livingstone 7
All six contractors engaged to collect waste in the city were engaged to operate in urban (K50/month) areas. Therefore, only internal and ability to achieve the critical volumes of waste (aggregation) could lead one contractor to fail and another to succeed. It is recommended that the Council ensure that the learnings from the failed franchise cases are well captured to guide the design of next steps.
The proposed system from this study is to unbundle the problem from the task.
The task (waste collection) can continue to be carried out by the collection companies – even door-to-door.
The problem (fee collection) must be solved by the Council by first re-bundling with other utility fees such as electricity (which are perceived by the service users to be far more indispensable than waste management fees). The Council should seek an agency arrangement with ZESCO or other chosen utility operator of their choice.
The bundling of waste management fees with other utility fee and successful implementation of fee collection agency is expected to be a longer term solution. In the interim, it is suggested that the council engages a ‘Stamp Management Company’ (the Stamp Manager) to run the waste management database and help to protect payment and waste collection data integrity.
It is advised that separating the challenges out into their unit components like this, though it requires administrative adjustments, will actually empower the Council to take bold, effective steps whose benefits far outweigh any administrative changes which are made necessary.
On physical collection, the recommendation is that the door-to-door collection continues, especially if/when the fee collection agency contract has been successfully executed.
However, before execution of the fee collection agency, a system of Collection Centres, CCs, is recommended to enhance service uptake in the townships. Households shall drop their waste bags off at these centres in exchange for ‘waste stamps’. The waste stamps shall carry a financial value in form of waived penalties on their property rates. Without stamps, the property rates payable would be higher. This is because all properties shall, by default, have waste collection penalties preloaded on them in exactly the same manner that ZRA applies Advance Income Tax (AIT) on all taxpayers by default, only removing it once evidence of compliance is presented, case-by-case. This system avoids the Collection Centres from having to handle cash within the townships – a ready risk for robbery and system leakages.
In order to protect integrity of the stamp system, the waste bags are to be trackable and each stamp has to be associated to a quantity of waste eventually received at the drop off point (either the Waste Processing Yard, WPY, or the dumpsite). Further, a separate entity called the Stamp Manager runs the database, originates stamps and tracks the connected bags. When waste bags are received at the drop off points, the Council activates the stamps and releases the bags to be re-used. When householders bring in their copy of stamps to claim that the default penalties be waived, the Council reconciles these with the copies received at waste drop-off points and retires both to be honoured by Finance department as fees are collected. Various operating modes of the Stamp Management system are presented, ranging from a paper-and-SMS based system which has lowest cost, to a fully computerized and networked implementation, complete with bar code readers, at highest cost.
Under both the agency and the stamp systems, the biggest change required of the Council, in addition to the need to enact the necessary by-laws, is that the financial administration has to be ready for higher receipts and higher payouts as well as the need to be liquid as the various waste-related payments fall due. In order to mitigate the risks here, particularly if the agency contract delays or is not successful, it is recommended that a separate commercial entity be incorporated to run the waste management fee collections and administration. In this case the WMU at the Council would utilize the new space availed to provide fuller technical and strategic guidance.
Waste Management Study for Livingstone 8
On the city dumpsite
The existing dumpsite has now been mapped to enable planning work around it. However, its location presents several challenges, not least, the lack of appropriate fencing as well as the wetland area which forms its Eastern and North-Eastern boundary.
If an engineered landfill is to be located at the site of the current dumpsite, an ecological study will be necessary not only to deal with the continual threat of elephants and other wildlife gaining entry but also to ensure that a failsafe barrier is planned to prevent contamination of the water which forms the seasonal wetland bordering the dumpsite on Eastern and North-Eastern sides in a burrow pit.
Nearly all activities on the waste management grid at the dumpsite are involuntarily accomplished on behalf of the City Council by the waste pickers.
The waste pickers currently operating at the dumpsite are a self-regulated, formally unrecognized group of scavengers. It is recommended to formally recognize them partly in the style of the Egyptian “Zabbaleen” model [2 pp45,91], [3] and partly like a Zambian marketeers committee (self-regulating but assisted with a work shelter, PPE and some non-removable work tools like conveyor belt, basic work furniture, etc.)
Impacts on open burning practices
Low Income Areas
The lack of clear incentives to encourage the use of a waste collection service, particularly in the densely populated, low income townships means that the impact of the efforts proposed here would be weakest in these areas. Effectiveness of the legal deterrent is also weakest due to contagion (the non-compliant cases are the majority; if they join forces to continue being non-complaint and to actively resist change, then that resistance becomes hard to beat). Educational campaigns and active engagement with area Councilors is highly encouraged to raise the impact of this project in these areas. It is also recommended that high-visual impact messages are posted in local clinics to highlight the proven link between open burning practices and respiratory diseases. Similar messages to highlight the link between un-engineered landfill, groundwater contamination and water-borne diseases.
Mid Income Areas
In the more up-market areas, there is potential to collect 900tons of waste per month, reducing the prevalence of open burning by around 53%, and allowing for the legal deterrent (penalties and their prescribed alternatives) to become effective as a second-line control measure. Educational campaigns as for the less affluent areas also encouraged.
CBD and High Income Areas
For areas within and near the CBD where income levels are higher and the impact of open burning harder to conceal, the legal deterrent is encouraged together with increased awareness campaigns. It is expected that 100% of occurrence of any open burning should be removed from these areas.
Dumpsite
This is the most difficult area in which to prevent open burning as long as it remains an open access area. The City Council itself indirectly benefits from the volume-reducing random fires which are caused on the various piles of dumped waste. The waste pickers benefit from the fires because, after picking out any useful combustible materials, the fires are then allowed to do their work and expose better the metallics, glass (when needed) and to chase away any rodents which might descend on the food scraps. To dissuade fires at the dumpsite, the formation of a formally recognized cooperative of waste pickers is encouraged. It is through this cooperative that best practices can begin to be communicated, discussed and adopted.
Waste Management Study for Livingstone 9
Aspects of the Egyptian “Zabbaleen” model [2 pp45,91], [3] could be copied. Further, the dumpsite needs to have restricted access.
1.2 Summary of Areas of Improvement
Organisation of a full WACS exercise,
Completion of interviews/discussions with the companies which abandoned their waste collection contracts (or simply became inactive) to understand better the challenges they faced so that realistic solutions can be drawn up going forward,
Full feasibility study of a licensed and actively managed dumpsite or sanitary landfill,
Development of some bankable business case documents for recycling projects in the city. May attract private projects or PPP proposals. These could include, inter alia:
Scale-up of the glass pilot project at IB Blocks Ltd,
Scale-up of the plastics project at Waste Master Zambia Ltd,
Composting and/or oil extraction from food and other organic waste from the plethora of hotels, lodges and guesthouses serving thousands of guests per day in the city.
Waste Management Study for Livingstone 10
Introduction and Methodology
This waste management study project has been carried out by direct support of the United Nations Industrial Development Organization (UNIDO). UNIDO is the specialized agency of the United Nations that promotes industrial development for poverty reduction, inclusive globalization and environmental sustainability. The mandate of UNIDO is to promote and accelerate inclusive and sustainable industrial development in the developing countries and economies in transition.
The Department of Environment under the Directorate of Program Development and Technical Cooperation is responsible and accountable for providing technical cooperation services to enhance the capabilities of developing countries and economies in transition to promote inclusive and sustainable industrial development (ISID). It does so by promoting industrial resource efficiency to strengthen green industry and improve the effective use of natural resources including water; by assisting developing countries and countries with economies in transition to achieve the objectives of and compliance with the Multilateral Environmental Agreements; and by working to reduce the release of industrial pollutants in the environment. Under the Department of Environment the Stockholm Convention Division (PTC/ENV/SCD) is responsible for supporting developing countries and countries with economies in transition to implement the Stockholm Convention (SC) on Persistent Organic Pollutants (POPs) and related industrial development aspects.
It is well documented that open burning is a major contributor of the city loading of POPs. This project seeks to reduce POPs by discouraging open burning of waste. This project seeks to create an alternative to open burning, in a well-planned waste management system incorporating sorting/segregation, collection, re-use, recycling, recovery and managed landfill.
Table 3.1 is a summary of the methodology used in this study.
TABLE 2.1 STUDY METHODOLOGY
STEP DETAIL
1 Set Objectives Lifted from TORs for UNIDO WBS 150060-1-10-03-1700 (Zambia)
2 Obtain desk level data Interview with Director Public Health & Asst. Director WMU
Obtain city maps
Obtain dumpsite survey diagrams
Obtain WM fee structure for the city
3 Verification and Validation
Guided site surveys in CBD and SUF
Guided site surveys in townships
Sampling and assessment/characterization of actual waste
Interview with waste pickers at public skips
Interview with waste pickers at dumpsite
Interview with downstream waste collectors/aggregators who sell to recyclers
Interview with recyclers
Business sustainability assessment with recyclers
222
Waste Management Study for Livingstone 11
STEP DETAIL
4 Ecological Assessment Identification of environmental and social issues impacting the project.
5 Supply Chain Assessment
Assessment of all data against a WMG adapted to the City, including collection points, fees paid/payable, recovery rates, etc
6 Recommendation Propose possible solutions to challenges identified against the
project targets
Comment on sustainability risks of the proposed solutions
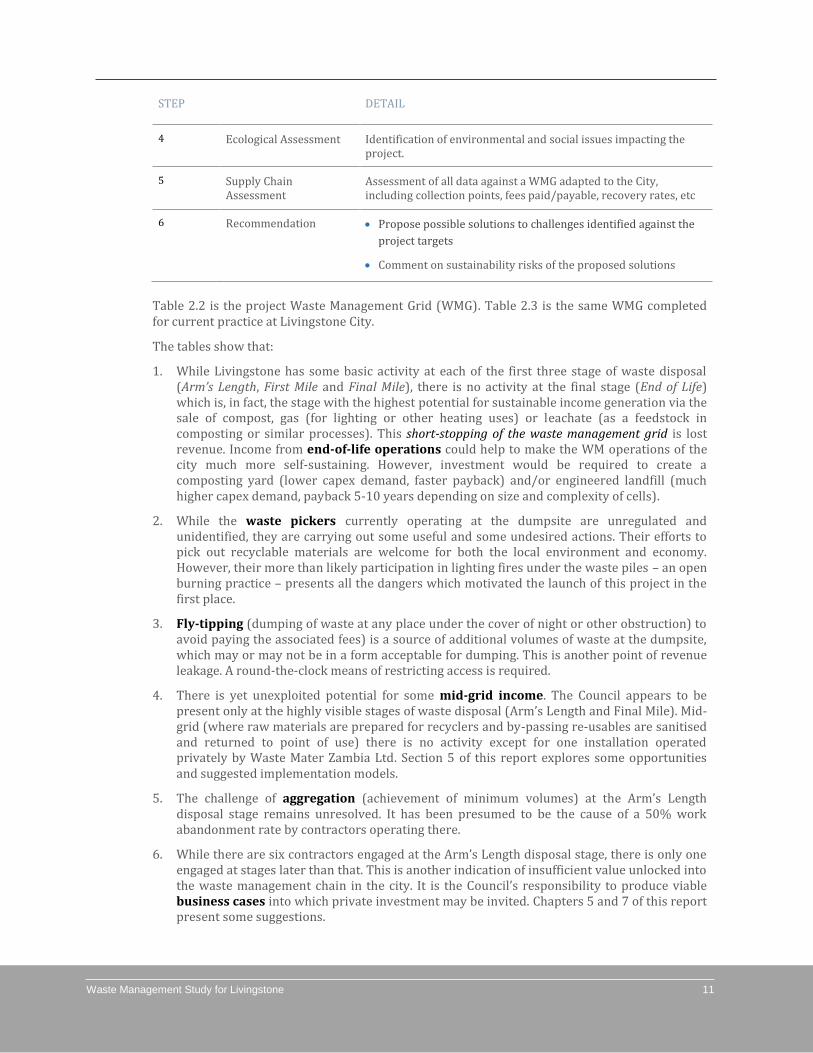
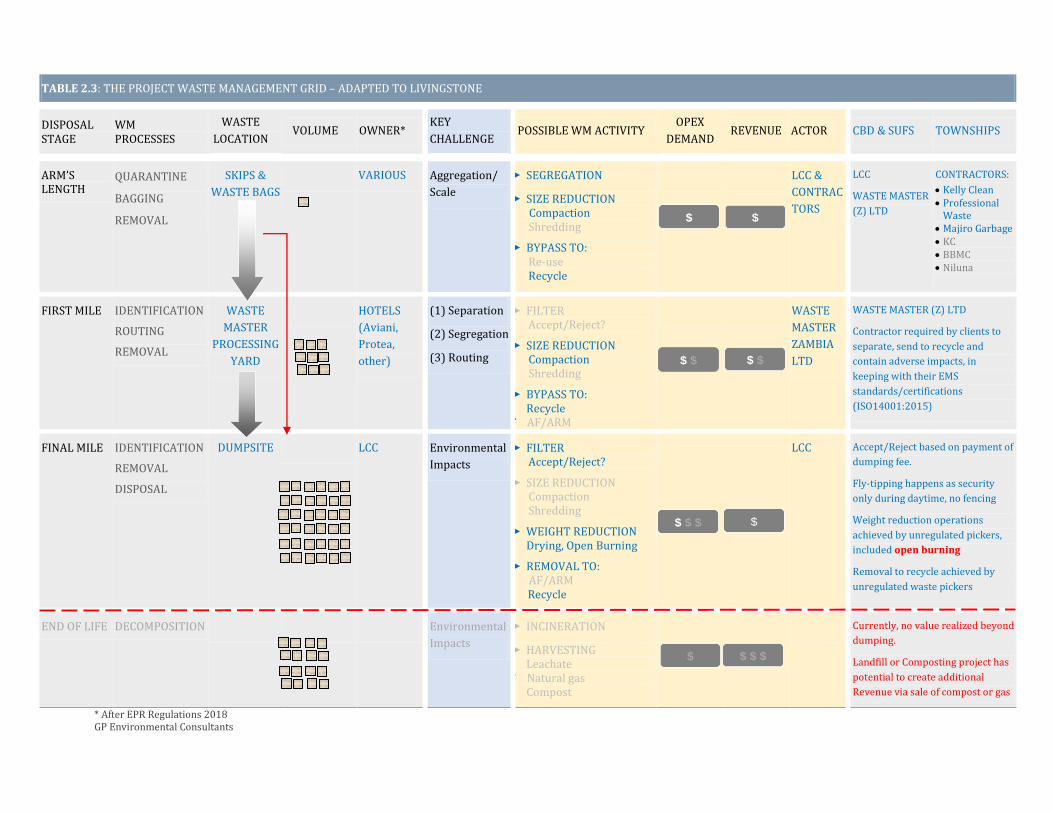
Table 2.2 is the project Waste Management Grid (WMG). Table 2.3 is the same WMG completed for current practice at Livingstone City.
The tables show that:
1. While Livingstone has some basic activity at each of the first three stage of waste disposal (Arm’s Length, First Mile and Final Mile), there is no activity at the final stage (End of Life) which is, in fact, the stage with the highest potential for sustainable income generation via the sale of compost, gas (for lighting or other heating uses) or leachate (as a feedstock in composting or similar processes). This short-stopping of the waste management grid is lost revenue. Income from end-of-life operations could help to make the WM operations of the city much more self-sustaining. However, investment would be required to create a composting yard (lower capex demand, faster payback) and/or engineered landfill (much higher capex demand, payback 5-10 years depending on size and complexity of cells).
2. While the waste pickers currently operating at the dumpsite are unregulated and unidentified, they are carrying out some useful and some undesired actions. Their efforts to pick out recyclable materials are welcome for both the local environment and economy. However, their more than likely participation in lighting fires under the waste piles – an open burning practice – presents all the dangers which motivated the launch of this project in the first place.
3. Fly-tipping (dumping of waste at any place under the cover of night or other obstruction) to avoid paying the associated fees) is a source of additional volumes of waste at the dumpsite, which may or may not be in a form acceptable for dumping. This is another point of revenue leakage. A round-the-clock means of restricting access is required.
4. There is yet unexploited potential for some mid-grid income. The Council appears to be present only at the highly visible stages of waste disposal (Arm’s Length and Final Mile). Mid-grid (where raw materials are prepared for recyclers and by-passing re-usables are sanitised and returned to point of use) there is no activity except for one installation operated privately by Waste Mater Zambia Ltd. Section 5 of this report explores some opportunities and suggested implementation models.
5. The challenge of aggregation (achievement of minimum volumes) at the Arm’s Length disposal stage remains unresolved. It has been presumed to be the cause of a 50% work abandonment rate by contractors operating there.
6. While there are six contractors engaged at the Arm’s Length disposal stage, there is only one engaged at stages later than that. This is another indication of insufficient value unlocked into the waste management chain in the city. It is the Council’s responsibility to produce viable business cases into which private investment may be invited. Chapters 5 and 7 of this report present some suggestions.
TABLE 2.2: THE PROJECT WASTE MANAGEMENT GRID - GENERIC
DISPOSAL STAGE
WM PROCESSES
WASTE
LOCATION VOLUME OWNER*
KEY
CHALLENGE POSSIBLE WM ACTIVITY
OPEX
DEMAND REVENUE ACTOR AREAS & COMMENTS
ARM’S LENGTH
QUARANTINE
BAGGING
REMOVAL
On-Site
Receptacle
Producer Aggregation/
Scale
► SEGREGATION
► SIZE REDUCTION Compaction
Shredding
► BYPASS TO: Re-use Recycle
FIRST MILE IDENTIFICATION
ROUTING
REMOVAL
Waste
Processing
Facility
Producer (1) Separation
(2) Segregation
(3) Routing
► FILTER Accept/Reject?
► SIZE REDUCTION Compaction Shredding
► BYPASS TO: Recycle
AF/ARM
FINAL MILE IDENTIFICATION
REMOVAL
DISPOSAL
Landfill
Reception
Landfill
License
Holder
Environmental
Impacts
► FILTER Accept/Reject?
► SIZE REDUCTION Compaction Shredding
► WEIGHT REDUCTION Drying
► REMOVAL TO: Recycle
AF/ARM
END OF LIFE DECOMPOSITION Landfill Landfill
License
Holder
Environmental
Impacts
► INCINERATION
► HARVESTING Leachate
F Natural gas Compost
* After EPR Regulations 2018 Separation: Process of sorting into different locations based on pre-determined characteristics Segregation: Prevention of different characteristics from mixing Aggregation: Adding together of items with similar characteristics to create larger quantities © GP Environmental Consultants/Joy Simwaba
$ $
$ $ $ $
$ $ $ $
$ $ $ $
Waste Management Study for Livingstone 13
TABLE 2.3: THE PROJECT WASTE MANAGEMENT GRID – ADAPTED TO LIVINGSTONE
DISPOSAL STAGE
WM PROCESSES
WASTE
LOCATION VOLUME OWNER*
KEY
CHALLENGE POSSIBLE WM ACTIVITY
OPEX
DEMAND REVENUE ACTOR CBD & SUFS TOWNSHIPS
ARM’S LENGTH
QUARANTINE
BAGGING
REMOVAL
SKIPS &
WASTE BAGS
VARIOUS Aggregation/
Scale
► SEGREGATION
► SIZE REDUCTION Compaction
Shredding
► BYPASS TO: Re-use Recycle
LCC &
CONTRAC
TORS
LCC
WASTE MASTER
(Z) LTD
CONTRACTORS:
Kelly Clean Professional
Waste Majiro Garbage KC BBMC Niluna
FIRST MILE IDENTIFICATION
ROUTING
REMOVAL
WASTE
MASTER
PROCESSING
YARD
HOTELS
(Aviani,
Protea,
other)
(1) Separation
(2) Segregation
(3) Routing
► FILTER Accept/Reject?
► SIZE REDUCTION Compaction Shredding
► BYPASS TO: Recycle
F AF/ARM
WASTE
MASTER
ZAMBIA
LTD
WASTE MASTER (Z) LTD
Contractor required by clients to
separate, send to recycle and
contain adverse impacts, in
keeping with their EMS
standards/certifications
(ISO14001:2015)
FINAL MILE IDENTIFICATION
REMOVAL
DISPOSAL
DUMPSITE LCC Environmental
Impacts
► FILTER Accept/Reject?
► SIZE REDUCTION Compaction Shredding
► WEIGHT REDUCTION Drying, Open Burning
► REMOVAL TO: AF/ARM
Recycle
LCC Accept/Reject based on payment of
dumping fee.
Fly-tipping happens as security
only during daytime, no fencing
Weight reduction operations
achieved by unregulated pickers,
included open burning
Removal to recycle achieved by
unregulated waste pickers
END OF LIFE DECOMPOSITION Environmental
Impacts
► INCINERATION
► HARVESTING Leachate
F Natural gas Compost
Currently, no value realized beyond
dumping.
Landfill or Composting project has
potential to create additional
Revenue via sale of compost or gas
* After EPR Regulations 2018 GP Environmental Consultants
$ $
$ $ $ $
$ $ $ $
$ $ $ $
GP Environmental Consultants 14
City Context
3.1 General
Founded in 1905, with a rich multi-cultural history, Livingstone is a city based almost entirely on tourism. The Zambia Tourism Agency (ZTA) reports that in 2018, visitors to Livingstone exceeded 250,000 (up 36% from 2017) [1]. Every year, Livingstone hosts major international events. Recently, these have included the United Nations World Tourism Organisation (UNWTO) General Assembly (2013), The World Bank, International Development Association (2018), Engineers Without Borders (2008, 2015), etc. No doubt one of the key attractions is the Mosi-Oa-Tunya (Victoria Falls) which is one of the Seven Natural Wonders of the World and a UNESCO World Heritage Site [15].
The resident population of the city is 180,000. At least 50% additional headcount is the transit/visitor population.
The government is the largest employer, through the various public service departments and the military camps. Much of the rest of the population is connected directly or indirectly to the tourism industry.
Historically, Livingstone also hosted some significant heavy industry including a motor assembly plant, a handful textile and chemicals industries in addition to tourism and construction. Currently, however, one blanket manufacturer operates. In food and agriculture, there are many MSMEs involved in cooking oil production and packaging and in supplying of fresh food to the hotel and catering industry. In construction the projects are also largely MSME-scale with a number of block makers spread across the city providing resource to an active cadre of house-builders.
The Central Business District still maintains some of the formative buildings from prior to 1935 when Livingstone was the capital city of the then Northern Rhodesia. Today, Livingstone has one of the cleanest CBDs in Zambia clustered around one main road which comes from Lusaka via the Victoria Falls and onto Victoria Falls town on the Zimbabwe side.
Spreading out from the CBD, there are 6 major population centres. The road network to the urban population centres is passable paved, but within the peri-urban (lower income) population centres, most of the roads are undulating gravel, ranging from poorly maintained to not-maintained at all, kept passable only by the regular flow of traffic.
The urban areas whose waste collection has been contracted out are:
Victoria Falls & Zambezi River area
Highlands
Ellen Brittel
Batoka North
Dambwa North
Dambwe Central & 217
There is insufficient ready data to ascertain income levels specific to Livingstone City. However, some online sources [6], including the Zambia Development Agency [7], give indicative figures ranging between K7,700 and K15,800 as monthly incomes for moderately experienced first-
333
Waste Management Study for Livingstone 15
degree holders across Zambia, across the various professions in the private sector. In its labour force survey published in December 2018, the Central Statistical Office [7] reported that the average income across all sectors, genders and experience levels by 2017 was K3,330 per month, while that specific to “Administrative & Support Service Activities” was K2,387 per month. These figures will be important for guiding wage estimates for employees or contractors to be added to the waste management activities and for guiding expectations of ability to pay by households.
Quoting a Jesuit Centre for Theological Reflection, JCTR, Livingstone Outreach Officer, the Zambia Daily Mail [9] reported that “most of the people in Livingstone get between K500 and K1,000 [in monthly] salaries, which are too low to sustain a family. He said currently, the basic needs basket stands at K3,800… for an average family of five.” For this reason, the rates already set by the Council are left unaltered with emphasis laid more on broadening service coverage.
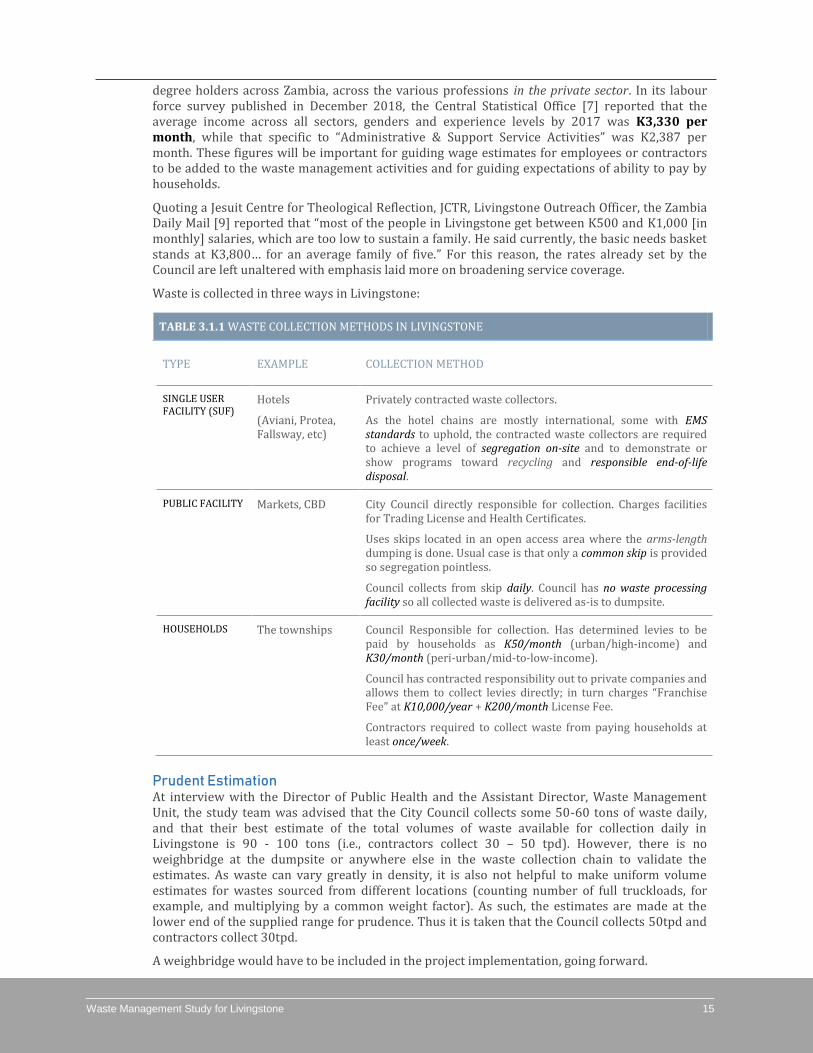
Waste is collected in three ways in Livingstone:
TABLE 3.1.1 WASTE COLLECTION METHODS IN LIVINGSTONE
TYPE EXAMPLE COLLECTION METHOD
SINGLE USER FACILITY (SUF)
Hotels
(Aviani, Protea, Fallsway, etc)
Privately contracted waste collectors.
As the hotel chains are mostly international, some with EMS standards to uphold, the contracted waste collectors are required to achieve a level of segregation on-site and to demonstrate or show programs toward recycling and responsible end-of-life disposal.
PUBLIC FACILITY Markets, CBD City Council directly responsible for collection. Charges facilities for Trading License and Health Certificates.
Uses skips located in an open access area where the arms-length dumping is done. Usual case is that only a common skip is provided so segregation pointless.
Council collects from skip daily. Council has no waste processing facility so all collected waste is delivered as-is to dumpsite.
HOUSEHOLDS The townships Council Responsible for collection. Has determined levies to be paid by households as K50/month (urban/high-income) and K30/month (peri-urban/mid-to-low-income).
Council has contracted responsibility out to private companies and allows them to collect levies directly; in turn charges “Franchise Fee” at K10,000/year + K200/month License Fee.
Contractors required to collect waste from paying households at least once/week.
Prudent Estimation At interview with the Director of Public Health and the Assistant Director, Waste Management Unit, the study team was advised that the City Council collects some 50-60 tons of waste daily, and that their best estimate of the total volumes of waste available for collection daily in Livingstone is 90 - 100 tons (i.e., contractors collect 30 – 50 tpd). However, there is no weighbridge at the dumpsite or anywhere else in the waste collection chain to validate the estimates. As waste can vary greatly in density, it is also not helpful to make uniform volume estimates for wastes sourced from different locations (counting number of full truckloads, for example, and multiplying by a common weight factor). As such, the estimates are made at the lower end of the supplied range for prudence. Thus it is taken that the Council collects 50tpd and contractors collect 30tpd.
A weighbridge would have to be included in the project implementation, going forward.
Waste Management Study for Livingstone 16
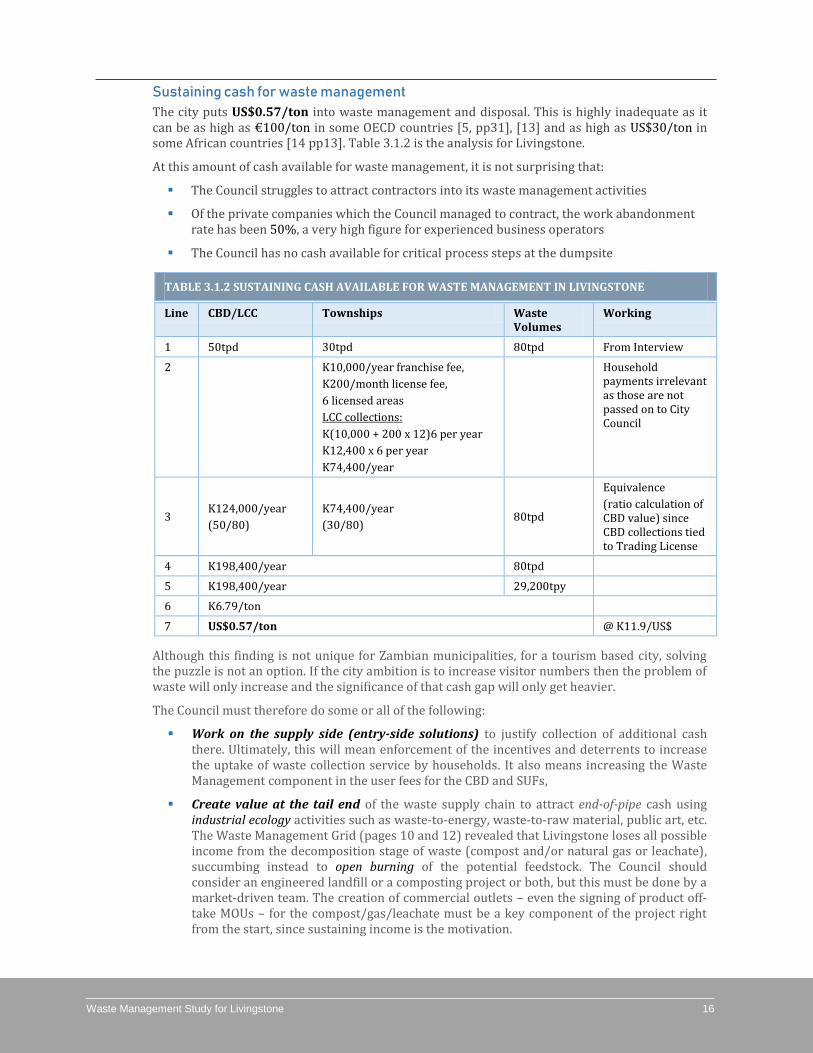
Sustaining cash for waste management
The city puts US$0.57/ton into waste management and disposal. This is highly inadequate as it can be as high as €100/ton in some OECD countries [5, pp31], [13] and as high as US$30/ton in some African countries [14 pp13]. Table 3.1.2 is the analysis for Livingstone.
At this amount of cash available for waste management, it is not surprising that:
The Council struggles to attract contractors into its waste management activities
Of the private companies which the Council managed to contract, the work abandonment rate has been 50%, a very high figure for experienced business operators
The Council has no cash available for critical process steps at the dumpsite
TABLE 3.1.2 SUSTAINING CASH AVAILABLE FOR WASTE MANAGEMENT IN LIVINGSTONE
Line CBD/LCC Townships Waste Volumes
Working
1 50tpd 30tpd 80tpd From Interview
2 K10,000/year franchise fee,
K200/month license fee,
6 licensed areas
LCC collections:
K(10,000 + 200 x 12)6 per year
K12,400 x 6 per year
K74,400/year
Household payments irrelevant as those are not passed on to City Council
3 K124,000/year
(50/80)
K74,400/year
(30/80) 80tpd
Equivalence
(ratio calculation of CBD value) since CBD collections tied to Trading License
4 K198,400/year 80tpd
5 K198,400/year 29,200tpy
6 K6.79/ton
7 US$0.57/ton @ K11.9/US$
Although this finding is not unique for Zambian municipalities, for a tourism based city, solving the puzzle is not an option. If the city ambition is to increase visitor numbers then the problem of waste will only increase and the significance of that cash gap will only get heavier.
The Council must therefore do some or all of the following:
Work on the supply side (entry-side solutions) to justify collection of additional cash there. Ultimately, this will mean enforcement of the incentives and deterrents to increase the uptake of waste collection service by households. It also means increasing the Waste Management component in the user fees for the CBD and SUFs,
Create value at the tail end of the waste supply chain to attract end-of-pipe cash using industrial ecology activities such as waste-to-energy, waste-to-raw material, public art, etc. The Waste Management Grid (pages 10 and 12) revealed that Livingstone loses all possible income from the decomposition stage of waste (compost and/or natural gas or leachate), succumbing instead to open burning of the potential feedstock. The Council should consider an engineered landfill or a composting project or both, but this must be done by a market-driven team. The creation of commercial outlets – even the signing of product off-take MOUs – for the compost/gas/leachate must be a key component of the project right from the start, since sustaining income is the motivation.
Waste Management Study for Livingstone 17
Invest in mid-grid activities such as waste sorting, washing, drying, bagging and baling, shredding, pelletizing, etc. (in short, “pre-treatment” activities) in order to earn mid-grid income from recyclers. Currently, Waste Master Zambia Ltd has some actual experience of mid-grid business in Livingstone. A PPP project or other commercial cooperation could be used.
Separate Commercial Entity
Further, the Council could consider separate running of the waste activity (incorporating a subsidiary waste management company) to ring-fence the cash-flows related to waste from general Council cash flows. The Copperbelt Waste Management Co. Ltd (formed by several councils on the Copperbelt Province) is an example. In a situation where part of the waste management cash is bundled with other incomes such as Trading Licenses in the CBD, and the proposal made in this report to bundle land rates with waste collection fees in peri-urban areas, the waste management entity would invoice the Council in a standard commercial manner, for a disciplined analysis if nothing else.
3.2 Regulations & Market Mechanisms Covering WM in Livingstone
The Local Government Act (cap. 281 of the Laws of Zambia) empowers local authorities to enact by-laws applicable in their parts of the country. Laws on air quality, cleanness of surroundings, people movement, etc., are particularly expected. The municipal and city councils are also responsible for construction and maintenance of the inner city, suburb and township road network. Under this project, this latter function of the City Council is important as it allows proper access for waste collection and waste movement.
The Environmental Management Act (2011) established and empowers the Zambia Environmental Management Agency (ZEMA) to regulate all matters related to environmental management, including approving environmental impact assessments for all prescribed projects (such as dumpsites or landfills). For the case of dumpsites or landfills, the ZEMA must issue an annually renewable operating license.
Incentives
There are certain steps the City Council has taken which could marginally/loosely count as being incentives. These might be referred to as indirect incentives, and they include:
Provision of information to market committees on waste management within their shared public spaces,
Provision of waste collection skips in markets and bus stations
Promotion of private entrepreneurial participation in waste management via the waste collection contracts offered
Low waste collection and waste dumping fees (compared to similar cities locally and internationally)
Flexible enforcement of penalties for waste management delinquencies (mostly, the educational rather than the prosecutorial route is chosen)
However, in the strict sense of making managed waste handling more attractive than unmanaged disposal, there are no direct incentives in place.
Deterrents
In a recent reinforcement of the battery of regulations subsidiary to the Local Government Act, the Minister of Local Government signed in to law S.I. No. 12 of 2018, also referred to as The Local Government (Street Vending and Nuisances) (Amendment No. 2) Regulations of 2018. These amendment regulations replaced the schedule of penalties, referred to as the First Schedule in the equivalent regulations of 1992. The penalties governing street vending, hawking, littering, waste disposal, cleanness of premises, etc., have been clarified and increased as shown in
Waste Management Study for Livingstone 18
Appendix A1 to this report. The City Council has full authority to enforce these penalties where it determines that they are necessary.
Information and Public Awareness
Available laws and by-laws notwithstanding, the main modes of supplying waste management information from the City Council to the public have been observed to be:
Via the Market Committees (to marketeers) Via the official contacts (to contractor companies operating in the CBD and the townships) Via the Councilors (elected local government politicians) who are the actual city council,
working as a governing board providing local policy direction to the career Local Government employees, and guidance to their electorate in the townships
Via press releases (paid for advertisements) in the newspapers, radio and television
Via mobile loudspeaker going round the townships as need arises
The above means of raising public awareness may look adequate. However, all but the second one are only good for providing snapshot messages of a non-technical nature. In order to deliver information regarding waste management (correct segregation, collection, need-to-pay, safe re-use, recycling, etc.), there would be need for a deeper and more sustained engagement. Thus, the City Council needs to give this aspect its own space and resource allocation in its Waste Management Plan if said Plan is to be successful.
Waste Management Study for Livingstone 19
Waste Mapping
4.1 Population Map
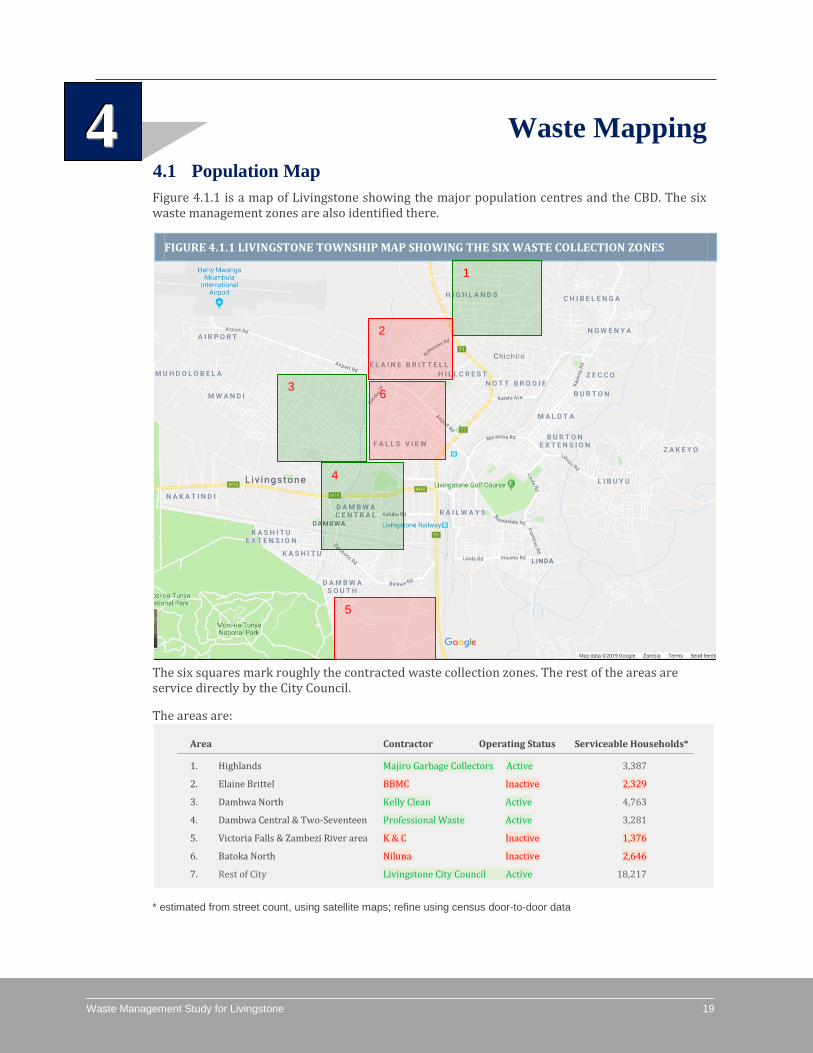
Figure 4.1.1 is a map of Livingstone showing the major population centres and the CBD. The six waste management zones are also identified there.
The six squares mark roughly the contracted waste collection zones. The rest of the areas are service directly by the City Council.
The areas are:
Area Contractor Operating Status Serviceable Households*
1. Highlands Majiro Garbage Collectors Active 3,387
2. Elaine Brittel BBMC Inactive 2,329
3. Dambwa North Kelly Clean Active 4,763
4. Dambwa Central & Two-Seventeen Professional Waste Active 3,281
5. Victoria Falls & Zambezi River area K & C Inactive 1,376
6. Batoka North Niluna Inactive 2,646
7. Rest of City Livingstone City Council Active 18,217
* estimated from street count, using satellite maps; refine using census door-to-door data
FIGURE 4.1.1 LIVINGSTONE TOWNSHIP MAP SHOWING THE SIX WASTE COLLECTION ZONES
444
3
4
1
2
5
6
Waste Management Study for Livingstone 20
4.2 Waste Map
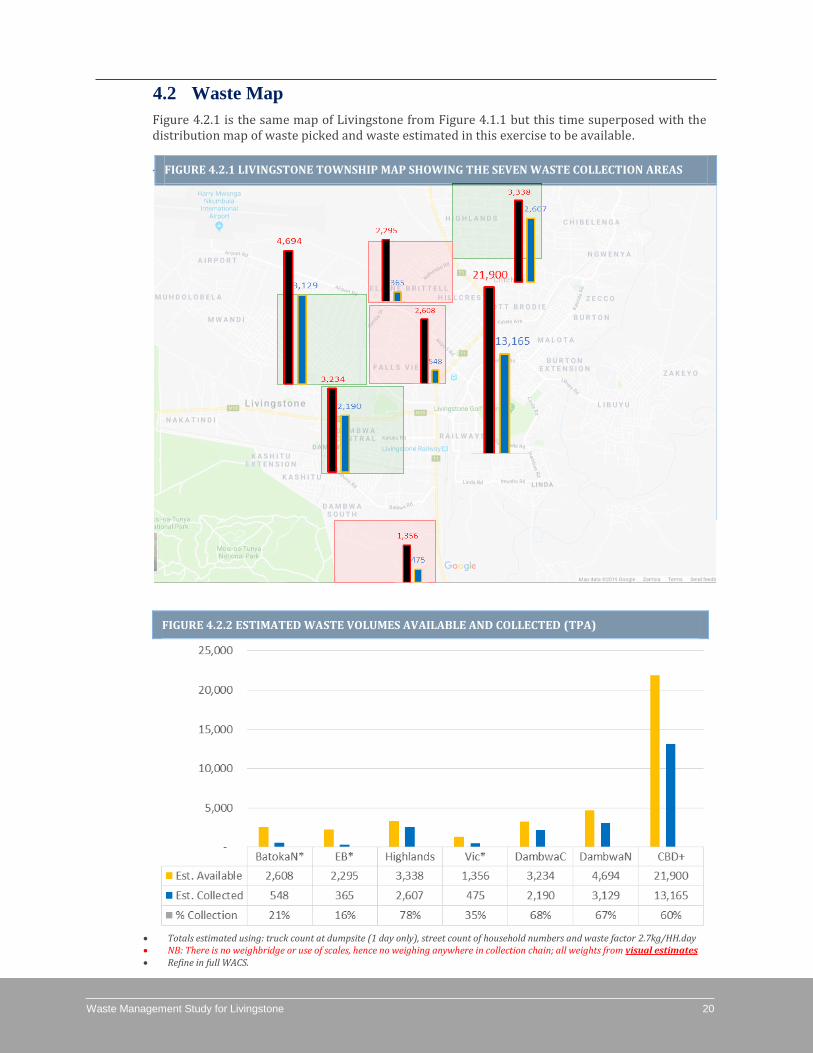
Figure 4.2.1 is the same map of Livingstone from Figure 4.1.1 but this time superposed with the distribution map of waste picked and waste estimated in this exercise to be available.
.
.
FIGURE 4.2.2 ESTIMATED WASTE VOLUMES AVAILABLE AND COLLECTED (TPA)
Totals estimated using: truck count at dumpsite (1 day only), street count of household numbers and waste factor 2.7kg/HH.day NB: There is no weighbridge or use of scales, hence no weighing anywhere in collection chain; all weights from visual estimates Refine in full WACS.
FIGURE 4.2.1 LIVINGSTONE TOWNSHIP MAP SHOWING THE SEVEN WASTE COLLECTION AREAS
FIGURE 4.2.1 LIVINGSTONE TOWNSHIP MAP SHOWING THE SIX WASTE COLLECTION ZONES
FIGURE 4.2.1 LIVINGSTONE TOWNSHIP MAP SHOWING THE SIX WASTE COLLECTION ZONES
FIGURE 4.2.1 LIVINGSTONE TOWNSHIP MAP SHOWING THE SIX WASTE COLLECTION ZONES
FIGURE 4.2.1 LIVINGSTONE TOWNSHIP MAP SHOWING THE SIX WASTE COLLECTION ZONES
FIGURE 4.2.1 LIVINGSTONE TOWNSHIP MAP SHOWING THE SIX WASTE COLLECTION ZONES
FIGURE 4.2.1 LIVINGSTONE TOWNSHIP MAP SHOWING THE SIX WASTE COLLECTION ZONES
FIGURE 4.2.1 LIVINGSTONE TOWNSHIP MAP SHOWING THE SIX WASTE COLLECTION ZONES
FIGURE 4.2.1 LIVINGSTONE TOWNSHIP MAP SHOWING THE SIX WASTE COLLECTION ZONES
FIGURE 4.2.1 LIVINGSTONE TOWNSHIP MAP SHOWING THE SIX WASTE COLLECTION ZONES
FIGURE 4.2.1 LIVINGSTONE TOWNSHIP MAP SHOWING THE SIX WASTE COLLECTION ZONES
FIGURE 4.2.1 LIVINGSTONE TOWNSHIP MAP SHOWING THE SIX WASTE COLLECTION ZONES
FIGURE 4.2.1 LIVINGSTONE TOWNSHIP MAP SHOWING THE SIX WASTE COLLECTION ZONES
Waste Management Study for Livingstone 21
4.3 Collection Systems
Two collection systems have been used in Livingstone:
Door-to-door in all contracted/franchised areas
Unmanned collection centres in CBD and all other areas where the Council collects
Frequency
The frequency of collection is at least once per week.
Routing
The contractors have been left to optimize their own routing in the zones where they operate, so the routes may vary depending on households who have paid up for the service that month.
Segregation
There is no realistic provision for segregation at point of origin as the waste, even if segregated, will be mixed for transportation especially if not packed in strong and secure bags (at own cost).
Quantities
One city-wide characteristic of waste collection is that there is no weighing anywhere in the collection chain. Some Zambian cities like Lusaka have a weighbridge at the dumpsite/landfill and this works like an end-of-chain validation on all estimates made upstream. Livingstone city does not have this provision. Nor does the city have a pressing need to weigh as all collection service charges are period-based (per month), without any reference to quantity. Thus, all reported weight figures are based on experiential knowledge of volume estimation at the WMU. This puts a large and open factor of uncertainty on the numbers. However, on a global scale, data can be compared with other places of similar demographics to Livingstone, as a first line of validation.
4.4 Waste Characterisation
There are five key points of interest at which a characterization was desired in this project, with particular emphasis on samples 1, 2, 5 and 7:
1. Households (at least one set from each of the 6 zones)
2. CBD – restaurant
3. CBD – shopping mall
4. CBD – Bus station
5. Township public use facility (market)
6. Entrance to Waste Recycle Centre
7. Entrance to dumpsite
8. Dumpsite – after waste picking
However, during the course of the study, it was found that the number of samples necessary would be overwhelming in the time available (6 days) for the on-site exercise. Further, the sampling would have to be specially prepared for in the township zones as the collection trucks always mixed the household waste with waste from markets, lodges and any other public spaces within the zone. The same happened to samples from the CBD.
The best compromise was to take sample #7 to represent general city waste.
The entrance to the dumpsite was easy to access and the trucks and tractors could easily be sampled. However, representativity was found to be a clear problem as more and more arrivals were observed. The solution was to sample from freshly dumped materials after a few trucks and tractors had dumped there. The characterization below is of this sample.
Waste Management Study for Livingstone 22
TABLE 4.4.1 CHARACTERISATION OF DUMPSITE INLET SAMPLE
LINE STEP TOOLS DETAIL RESULTS
1 First Sample Dig-Out
Spade
Shovel
Polyethylene Bags
Dig out approx. 1.0m diameter, 0.5m depth, cylinder of waste from the stockpile
2 Mixing Garden Folk
Spade
Use the garden folk to turn the waste around to homogenise the distribution of materials through the sample
Use spade to cut and break down large pieces of waste
3 Down-sampling
Spade
Shovel
Clear floor space
Polyethylene Bags
Cut out about 20% of the sampled material from the waste poured on a clear floor
4 Drying Garden folk Spread out the re-sampled materials to dry out naturally from daylight heat
5 Filtering Grid/sieve Use a grid (mesh size at least 50mm) to filter out abnormally sized objects
6 Separation Garden folk Spread the filtered materials out on clear floor and manually separate into the various material categories
7 Weighing Scale Weigh each of the materials separately
Glass: 25.83 kg
Plastic: 19.09 kg
Organics: 39.30 kg
Wood & Paper: 10.11 kg
Textiles: 10.11 kg
Rubber: 3.37 kg
Metal: 3.37 kg
Other: 1.12 kg
All 112.29 kg
8 Report Calculator Calculate the percentage of each type of waste by weight
Glass: 23%,
Plastic: 17%,
Organics: 35%,
Wood & Paper: 9%,
Textiles: 9%,
Rubber: 3%,
Metal: 3%,
Other: 1%
4.5 Summary of Challenges
While Livingstone’s remarkably high waste collection rate from the CBD (compared to other towns and cities in Zambia and neighbouring countries) is noted, the following weaknesses remain:
1. The uptake rate of managed waste collection services in the townships is still very low (estimated 30 – 50%). Attempts to involve the private sector through franchise contracts has resulted in a high work abandonment rate at implementation stage.
2. A systematic and full-coverage WACS will refine collection estimates. Time and resource constraint on current exercise limited the quality of characterisation achievable (as presented in Section 4.4 above). Section 4.6 (below) suggests a work-plan.
Waste Management Study for Livingstone 23
3. A non-engineered dumpsite. There is notable work on waste spreading and compaction to reduce the safety risks, the visual nuisance and wind sweepage. However, other ecological risks, particularly those related to sub-ground contamination of the water in seasonal wetland, remain.
4. An open access dumpsite. Minimal vehicular restrictions apply but only during daylight hours, so fly-tipping is a real and ready risk.
5. Short-circuiting of the bulk of the waste from point of generation to the dumpsite. There is very minimal mid-grid activity other than happens at the marginally sustainable Waste Master recycling yard. Chapter 5 of this report presents a deeper assessment of possible activity to generate feedstock for the recycling industry.
4.6 Opportunities for Development
The WACS
The characterization achieved in this effort is good enough for opening the conversation on waste management in Livingstone City and for making high-level estimates only. However, in order to gain detailed data to guide planning and detailed costing of collection routes as well as the siting of recycling centres, it will be useful that a full Waste Analysis and Characterisation Study (WACS) is carried out at all key points of the waste chain. These should include:
All the townships, especially the densely populated settlements, using representative households – recommend 10 samples per township per day covering at least 3 carefully chosen days, total 180 samples
All key public centres (markets, food outlets and malls in the CBD, bus stations, major hotels and lodges, etc) – recommend total 60 samples
Industrial establishments – recommend total 30 samples
The dumpsite entrance – recommend 3 samples
The dumpsite (after the waste-pickers have completed their picking) – recommend 3 samples
The total of 276 samples analysed would create a very clear waste balance. It would require some 15-30 workers (sorters, weighers, data loggers, drivers or hired transport, and analyst/s) dependent on time available. Around 15 work days for the team should be allowed to complete the exercise.
The end result of the WACS would allow for a source/cause assessment to be made, and which assessment would supply waste generation functions which can confidently project the evolution in volumes and characteristics as the city develops its industrial and demographic structure. The Waste Management Plan, especially the landfill aspect, could then be updated with information of the highest quality.
Landfill
In meeting with the Town Clerk and Director of Public Health, it was revealed that the City Council has been seeking a long term solution to the lack of sanitary landfill for a number of years now. A restatement of the key challenges:
Much of the land where current dumpsite sits is a seasonal wetland. This reduces the effective space where waste can be stored, let alone, landfilled. A landfill next to a water source might be an ecological disaster if the cells are not well protected as the seepage of leachate from decomposing materials could damage the ecosystem of the neighbouring wetland.
Open access. This is compounded by the fact that elephants frequent this area from the neighbouring national park. Any fencing erected has to be designed to resist damage by elephants. The cost of this is expected to be prohibitive and so some other innovative solution is needed.
Waste Management Study for Livingstone 24
The problem of open access generates several offshoot problems including safety of the unregulated waste pickers, random fires on the dumped materials, fly-tipping, etc.
During the site surveys it was also discovered that the dumpsite had not been surveyed for a disciplined positioning and costing of the various components of a landfill. This exercise was completed in-house during the course of this study and the resulting survey maps have been generated by the Council Surveyor. A screen-dump of this map is shown in Figure 6.1.3.
After this work, there is now need to complete the feasibility study for locating a sanitary landfill in the dry part of the mapped dumpsite. Some first-level detail is presented in Section 6 of this report.
Recycling
It was also found during the study that the tourism industry in Livingstone generates some significant volumes of uniform waste such as glass bottles, PET bottles, food packaging, food waste, etc. Some entrepreneurial projects have even been implemented and have proven themselves to be sustainable (having existed a few years already). These projects now need to be scaled in order to have a significant impact on the waste management objectives of the city and to reduce the potential loading on the dumpsite and successor landfill. Since these projects are under implementation by MSMEs, there shall be need for technical and financial input for these projects to scale successfully and in a manner that also has the maximum impact on waste management in the city. In order for this objective to be met, it is imperative that the City Council be involved by adding tangible value to the scale-up effort of these entrepreneurial projects. One key way in which value could be added is by helping to generate scale-up business case documents, bankable due to their proven nature and the ready availability of as many applicable statutory authorisations as are possible at this stage. These projects include:
The pilot project on partial substitution of aggregates with crushed glass waste in block making. Business Case: IB Blocks Ltd.
The pilot project of running a collection, sorting and packaging centre for various recyclable wastes. Business Case: Waste Master (Zambia) Ltd
Oil extraction from food waste from the various hotels and eateries in the city. Proposed/new.
Composting from all other organic wastes. Proposed/new.
There is more detail and proposals of immediate next steps on these projets in Section 5 of this report.
Waste Management Study for Livingstone 25
Recycling and Recyclables
5.1 Current Practices
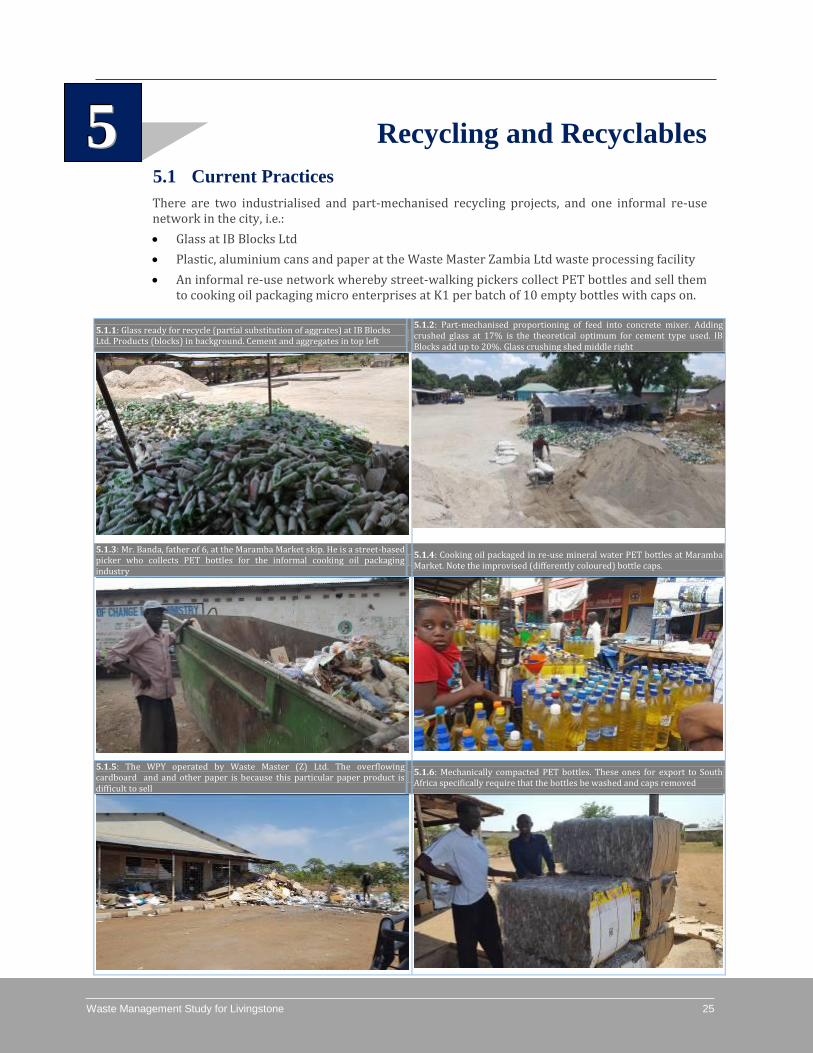
There are two industrialised and part-mechanised recycling projects, and one informal re-use network in the city, i.e.:
Glass at IB Blocks Ltd
Plastic, aluminium cans and paper at the Waste Master Zambia Ltd waste processing facility
An informal re-use network whereby street-walking pickers collect PET bottles and sell them to cooking oil packaging micro enterprises at K1 per batch of 10 empty bottles with caps on.
5.1.1: Glass ready for recycle (partial substitution of aggrates) at IB Blocks Ltd. Products (blocks) in background. Cement and aggregates in top left
5.1.2: Part-mechanised proportioning of feed into concrete mixer. Adding crushed glass at 17% is the theoretical optimum for cement type used. IB Blocks add up to 20%. Glass crushing shed middle right
5.1.3: Mr. Banda, father of 6, at the Maramba Market skip. He is a street-based picker who collects PET bottles for the informal cooking oil packaging industry
5.1.4: Cooking oil packaged in re-use mineral water PET bottles at Maramba Market. Note the improvised (differently coloured) bottle caps.
5.1.5: The WPY operated by Waste Master (Z) Ltd. The overflowing cardboard and and other paper is because this particular paper product is difficult to sell
5.1.6: Mechanically compacted PET bottles. These ones for export to South Africa specifically require that the bottles be washed and caps removed
555
Waste Management Study for Livingstone 26
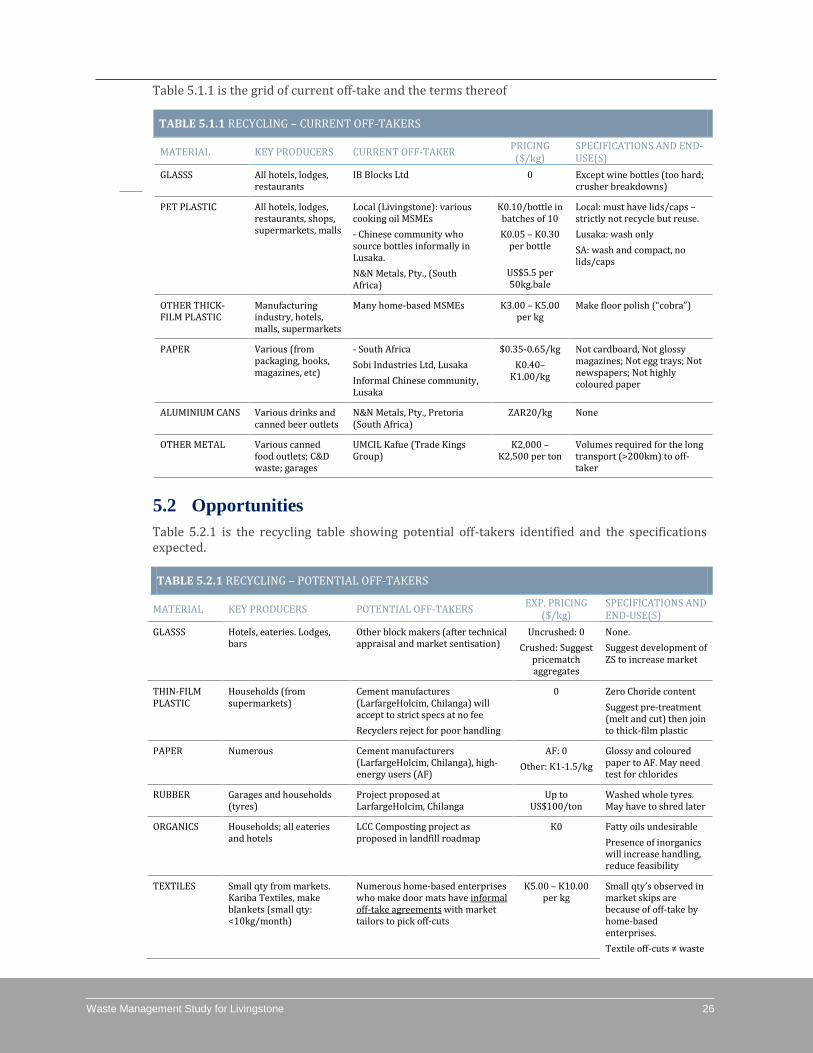
Table 5.1.1 is the grid of current off-take and the terms thereof
TABLE 5.1.1 RECYCLING – CURRENT OFF-TAKERS
MATERIAL KEY PRODUCERS CURRENT OFF-TAKER PRICING
($/kg) SPECIFICATIONS AND END-USE(S)
GLASSS All hotels, lodges, restaurants
IB Blocks Ltd 0 Except wine bottles (too hard; crusher breakdowns)
PET PLASTIC All hotels, lodges, restaurants, shops, supermarkets, malls
Local (Livingstone): various cooking oil MSMEs
- Chinese community who source bottles informally in Lusaka.
N&N Metals, Pty., (South Africa)
K0.10/bottle in batches of 10
K0.05 – K0.30 per bottle
US$5.5 per 50kg.bale
Local: must have lids/caps – strictly not recycle but reuse.
Lusaka: wash only
SA: wash and compact, no lids/caps
OTHER THICK-FILM PLASTIC
Manufacturing industry, hotels, malls, supermarkets
Many home-based MSMEs K3.00 – K5.00 per kg
Make floor polish (“cobra”)
PAPER Various (from packaging, books, magazines, etc)
- South Africa
Sobi Industries Ltd, Lusaka
Informal Chinese community, Lusaka
$0.35-0.65/kg
K0.40–K1.00/kg
Not cardboard, Not glossy magazines; Not egg trays; Not newspapers; Not highly coloured paper
ALUMINIUM CANS Various drinks and canned beer outlets
N&N Metals, Pty., Pretoria (South Africa)
ZAR20/kg None
OTHER METAL Various canned food outlets; C&D waste; garages
UMCIL Kafue (Trade Kings Group)
K2,000 – K2,500 per ton
Volumes required for the long transport (>200km) to off-taker
5.2 Opportunities
Table 5.2.1 is the recycling table showing potential off-takers identified and the specifications expected.
TABLE 5.2.1 RECYCLING – POTENTIAL OFF-TAKERS
MATERIAL KEY PRODUCERS POTENTIAL OFF-TAKERS EXP. PRICING
($/kg) SPECIFICATIONS AND END-USE(S)
GLASSS Hotels, eateries. Lodges, bars
Other block makers (after technical appraisal and market sentisation)
Uncrushed: 0
Crushed: Suggest pricematch aggregates
None.
Suggest development of ZS to increase market
THIN-FILM PLASTIC
Households (from supermarkets)
Cement manufactures (LarfargeHolcim, Chilanga) will accept to strict specs at no fee
Recyclers reject for poor handling
0 Zero Choride content
Suggest pre-treatment (melt and cut) then join to thick-film plastic
PAPER Numerous Cement manufacturers (LarfargeHolcim, Chilanga), high-energy users (AF)
AF: 0
Other: K1-1.5/kg
Glossy and coloured paper to AF. May need test for chlorides
RUBBER Garages and households (tyres)
Project proposed at LarfargeHolcim, Chilanga
Up to US$100/ton
Washed whole tyres. May have to shred later
ORGANICS Households; all eateries and hotels
LCC Composting project as proposed in landfill roadmap
K0 Fatty oils undesirable
Presence of inorganics will increase handling, reduce feasibility
TEXTILES Small qty from markets. Kariba Textiles, make blankets (small qty: <10kg/month)
Numerous home-based enterprises who make door mats have informal off-take agreements with market tailors to pick off-cuts
K5.00 – K10.00 per kg
Small qty’s observed in market skips are because of off-take by home-based enterprises.
Textile off-cuts ≠ waste
Waste Management Study for Livingstone 27
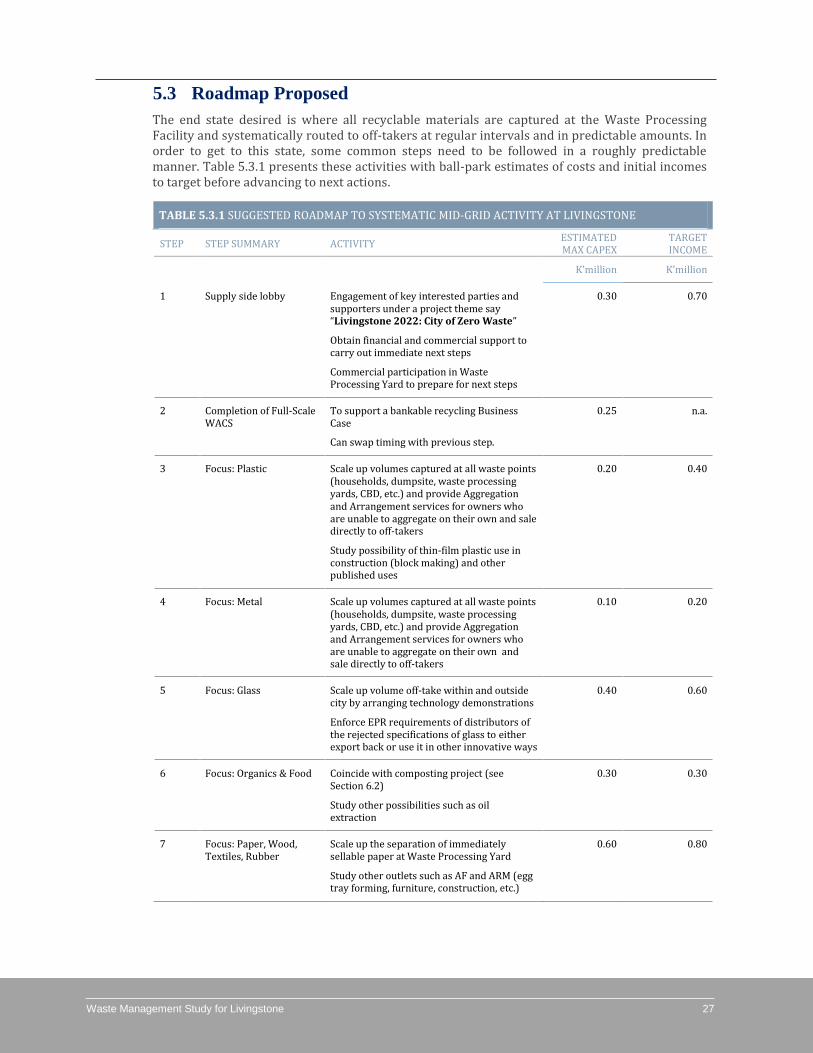
5.3 Roadmap Proposed
The end state desired is where all recyclable materials are captured at the Waste Processing Facility and systematically routed to off-takers at regular intervals and in predictable amounts. In order to get to this state, some common steps need to be followed in a roughly predictable manner. Table 5.3.1 presents these activities with ball-park estimates of costs and initial incomes to target before advancing to next actions.
TABLE 5.3.1 SUGGESTED ROADMAP TO SYSTEMATIC MID-GRID ACTIVITY AT LIVINGSTONE
STEP STEP SUMMARY ACTIVITY ESTIMATED MAX CAPEX
TARGET INCOME
K’million K’million
1 Supply side lobby Engagement of key interested parties and supporters under a project theme say “Livingstone 2022: City of Zero Waste”
Obtain financial and commercial support to carry out immediate next steps
Commercial participation in Waste Processing Yard to prepare for next steps
0.30 0.70
2 Completion of Full-Scale WACS
To support a bankable recycling Business Case
Can swap timing with previous step.
0.25 n.a.
3 Focus: Plastic Scale up volumes captured at all waste points (households, dumpsite, waste processing yards, CBD, etc.) and provide Aggregation and Arrangement services for owners who are unable to aggregate on their own and sale directly to off-takers
Study possibility of thin-film plastic use in construction (block making) and other published uses
0.20 0.40
4 Focus: Metal Scale up volumes captured at all waste points (households, dumpsite, waste processing yards, CBD, etc.) and provide Aggregation and Arrangement services for owners who are unable to aggregate on their own and sale directly to off-takers
0.10 0.20
5 Focus: Glass Scale up volume off-take within and outside city by arranging technology demonstrations
Enforce EPR requirements of distributors of the rejected specifications of glass to either export back or use it in other innovative ways
0.40 0.60
6 Focus: Organics & Food Coincide with composting project (see Section 6.2)
Study other possibilities such as oil extraction
0.30 0.30
7 Focus: Paper, Wood, Textiles, Rubber
Scale up the separation of immediately sellable paper at Waste Processing Yard
Study other outlets such as AF and ARM (egg tray forming, furniture, construction, etc.)
0.60 0.80
Waste Management Study for Livingstone 28
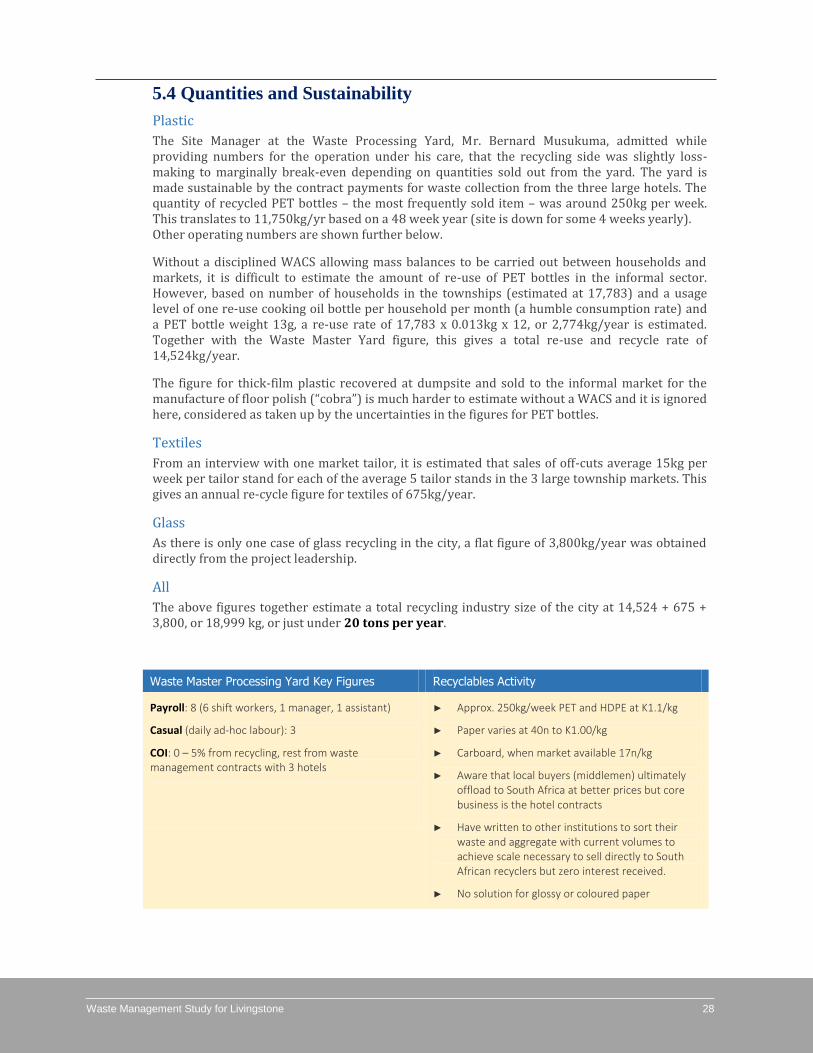
5.4 Quantities and Sustainability
Plastic
The Site Manager at the Waste Processing Yard, Mr. Bernard Musukuma, admitted while providing numbers for the operation under his care, that the recycling side was slightly loss-making to marginally break-even depending on quantities sold out from the yard. The yard is made sustainable by the contract payments for waste collection from the three large hotels. The quantity of recycled PET bottles – the most frequently sold item – was around 250kg per week. This translates to 11,750kg/yr based on a 48 week year (site is down for some 4 weeks yearly). Other operating numbers are shown further below.
Without a disciplined WACS allowing mass balances to be carried out between households and markets, it is difficult to estimate the amount of re-use of PET bottles in the informal sector. However, based on number of households in the townships (estimated at 17,783) and a usage level of one re-use cooking oil bottle per household per month (a humble consumption rate) and a PET bottle weight 13g, a re-use rate of 17,783 x 0.013kg x 12, or 2,774kg/year is estimated. Together with the Waste Master Yard figure, this gives a total re-use and recycle rate of 14,524kg/year.
The figure for thick-film plastic recovered at dumpsite and sold to the informal market for the manufacture of floor polish (“cobra”) is much harder to estimate without a WACS and it is ignored here, considered as taken up by the uncertainties in the figures for PET bottles.
Textiles
From an interview with one market tailor, it is estimated that sales of off-cuts average 15kg per week per tailor stand for each of the average 5 tailor stands in the 3 large township markets. This gives an annual re-cycle figure for textiles of 675kg/year.
Glass
As there is only one case of glass recycling in the city, a flat figure of 3,800kg/year was obtained directly from the project leadership.
All
The above figures together estimate a total recycling industry size of the city at 14,524 + 675 + 3,800, or 18,999 kg, or just under 20 tons per year.
Waste Master Processing Yard Key Figures Recyclables Activity
Payroll: 8 (6 shift workers, 1 manager, 1 assistant)
Casual (daily ad-hoc labour): 3
COI: 0 – 5% from recycling, rest from waste management contracts with 3 hotels
► Approx. 250kg/week PET and HDPE at K1.1/kg
► Paper varies at 40n to K1.00/kg
► Carboard, when market available 17n/kg
► Aware that local buyers (middlemen) ultimately offload to South Africa at better prices but core business is the hotel contracts
► Have written to other institutions to sort their waste and aggregate with current volumes to achieve scale necessary to sell directly to South African recyclers but zero interest received.
► No solution for glossy or coloured paper
Waste Management Study for Livingstone 29
City-Level Waste Disposal
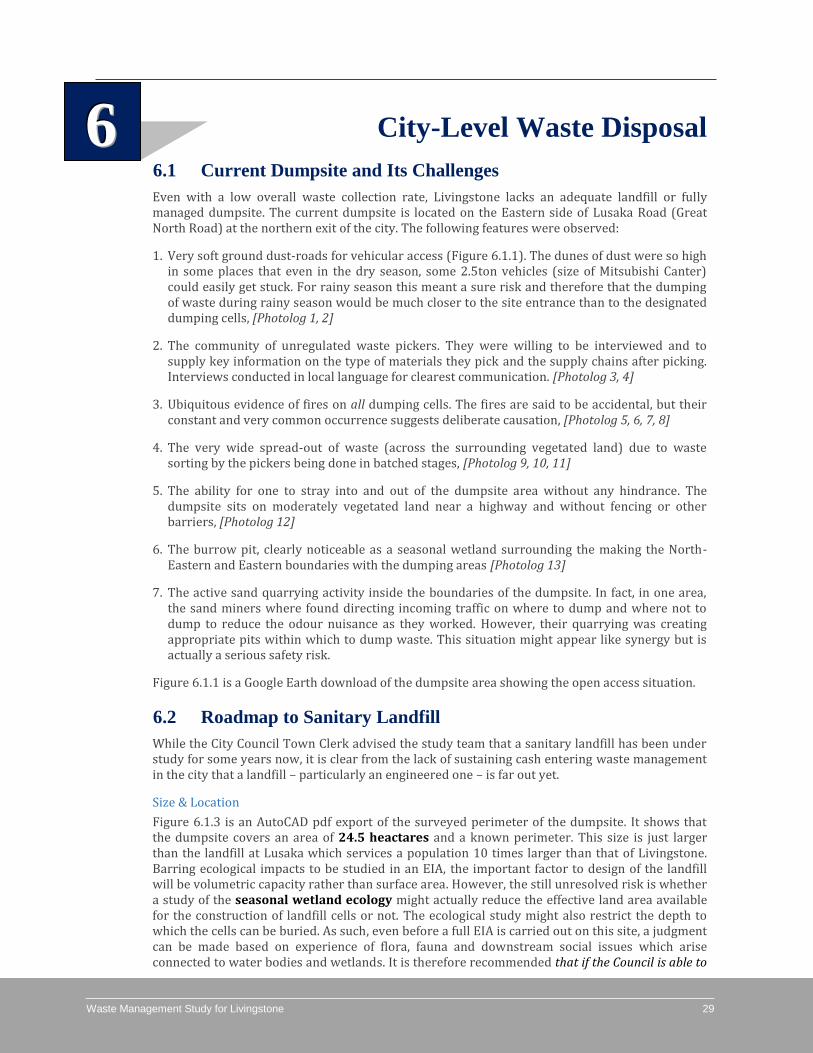
6.1 Current Dumpsite and Its Challenges
Even with a low overall waste collection rate, Livingstone lacks an adequate landfill or fully managed dumpsite. The current dumpsite is located on the Eastern side of Lusaka Road (Great North Road) at the northern exit of the city. The following features were observed:
1. Very soft ground dust-roads for vehicular access (Figure 6.1.1). The dunes of dust were so high in some places that even in the dry season, some 2.5ton vehicles (size of Mitsubishi Canter) could easily get stuck. For rainy season this meant a sure risk and therefore that the dumping of waste during rainy season would be much closer to the site entrance than to the designated dumping cells, [Photolog 1, 2]
2. The community of unregulated waste pickers. They were willing to be interviewed and to supply key information on the type of materials they pick and the supply chains after picking. Interviews conducted in local language for clearest communication. [Photolog 3, 4]
3. Ubiquitous evidence of fires on all dumping cells. The fires are said to be accidental, but their constant and very common occurrence suggests deliberate causation, [Photolog 5, 6, 7, 8]
4. The very wide spread-out of waste (across the surrounding vegetated land) due to waste sorting by the pickers being done in batched stages, [Photolog 9, 10, 11]
5. The ability for one to stray into and out of the dumpsite area without any hindrance. The dumpsite sits on moderately vegetated land near a highway and without fencing or other barriers, [Photolog 12]
6. The burrow pit, clearly noticeable as a seasonal wetland surrounding the making the North-Eastern and Eastern boundaries with the dumping areas [Photolog 13]
7. The active sand quarrying activity inside the boundaries of the dumpsite. In fact, in one area, the sand miners where found directing incoming traffic on where to dump and where not to dump to reduce the odour nuisance as they worked. However, their quarrying was creating appropriate pits within which to dump waste. This situation might appear like synergy but is actually a serious safety risk.
Figure 6.1.1 is a Google Earth download of the dumpsite area showing the open access situation.
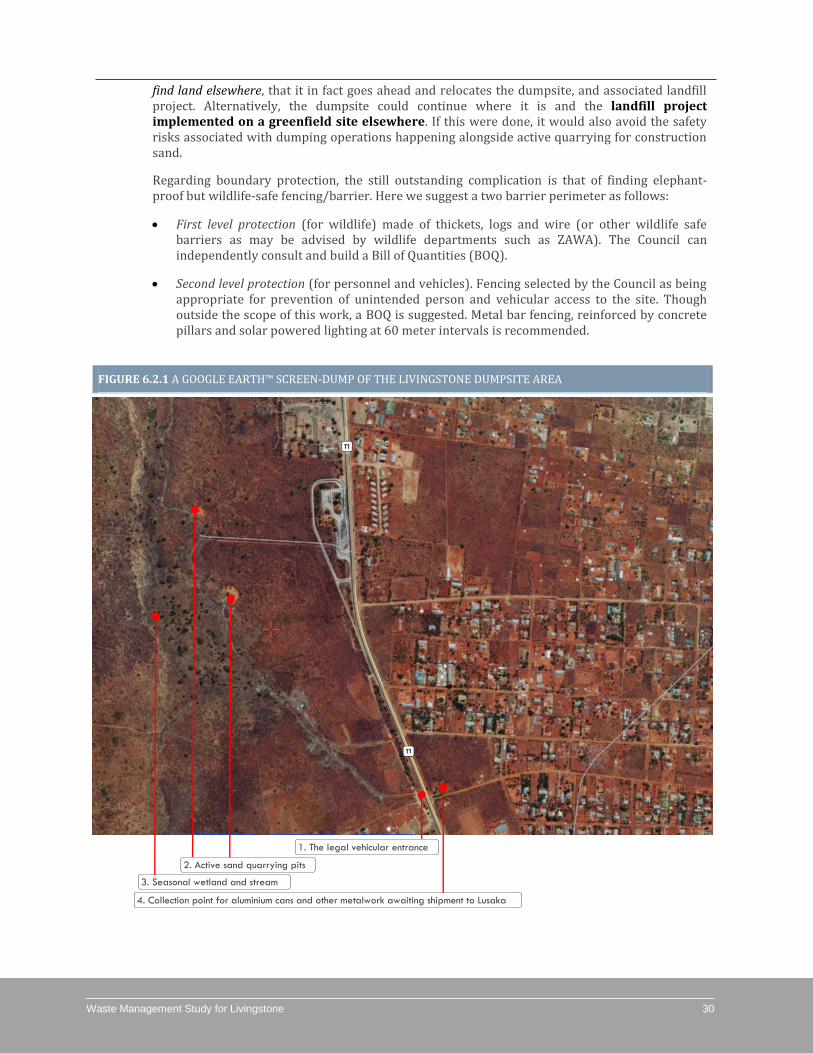
6.2 Roadmap to Sanitary Landfill
While the City Council Town Clerk advised the study team that a sanitary landfill has been under study for some years now, it is clear from the lack of sustaining cash entering waste management in the city that a landfill – particularly an engineered one – is far out yet.
Size & Location
Figure 6.1.3 is an AutoCAD pdf export of the surveyed perimeter of the dumpsite. It shows that the dumpsite covers an area of 24.5 heactares and a known perimeter. This size is just larger than the landfill at Lusaka which services a population 10 times larger than that of Livingstone. Barring ecological impacts to be studied in an EIA, the important factor to design of the landfill will be volumetric capacity rather than surface area. However, the still unresolved risk is whether a study of the seasonal wetland ecology might actually reduce the effective land area available for the construction of landfill cells or not. The ecological study might also restrict the depth to which the cells can be buried. As such, even before a full EIA is carried out on this site, a judgment can be made based on experience of flora, fauna and downstream social issues which arise connected to water bodies and wetlands. It is therefore recommended that if the Council is able to
666
Waste Management Study for Livingstone 30
find land elsewhere, that it in fact goes ahead and relocates the dumpsite, and associated landfill project. Alternatively, the dumpsite could continue where it is and the landfill project implemented on a greenfield site elsewhere. If this were done, it would also avoid the safety risks associated with dumping operations happening alongside active quarrying for construction sand.
Regarding boundary protection, the still outstanding complication is that of finding elephant-proof but wildlife-safe fencing/barrier. Here we suggest a two barrier perimeter as follows:
First level protection (for wildlife) made of thickets, logs and wire (or other wildlife safe barriers as may be advised by wildlife departments such as ZAWA). The Council can independently consult and build a Bill of Quantities (BOQ).
Second level protection (for personnel and vehicles). Fencing selected by the Council as being appropriate for prevention of unintended person and vehicular access to the site. Though outside the scope of this work, a BOQ is suggested. Metal bar fencing, reinforced by concrete pillars and solar powered lighting at 60 meter intervals is recommended.
FIGURE 6.2.1 A GOOGLE EARTH™ SCREEN-DUMP OF THE LIVINGSTONE DUMPSITE AREA
1. The legal vehicular entrance
3. Seasonal wetland and stream
4. Collection point for aluminium cans and other metalwork awaiting shipment to Lusaka
2. Active sand quarrying pits
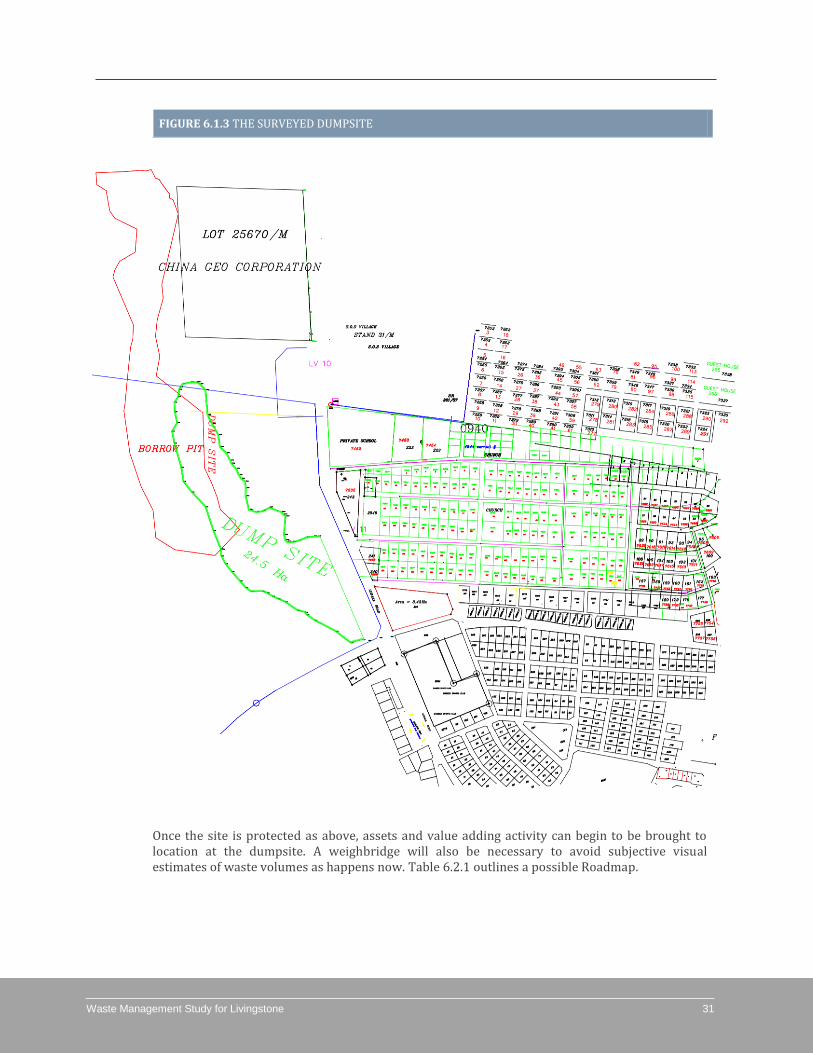
Waste Management Study for Livingstone 31
FIGURE 6.1.3 THE SURVEYED DUMPSITE
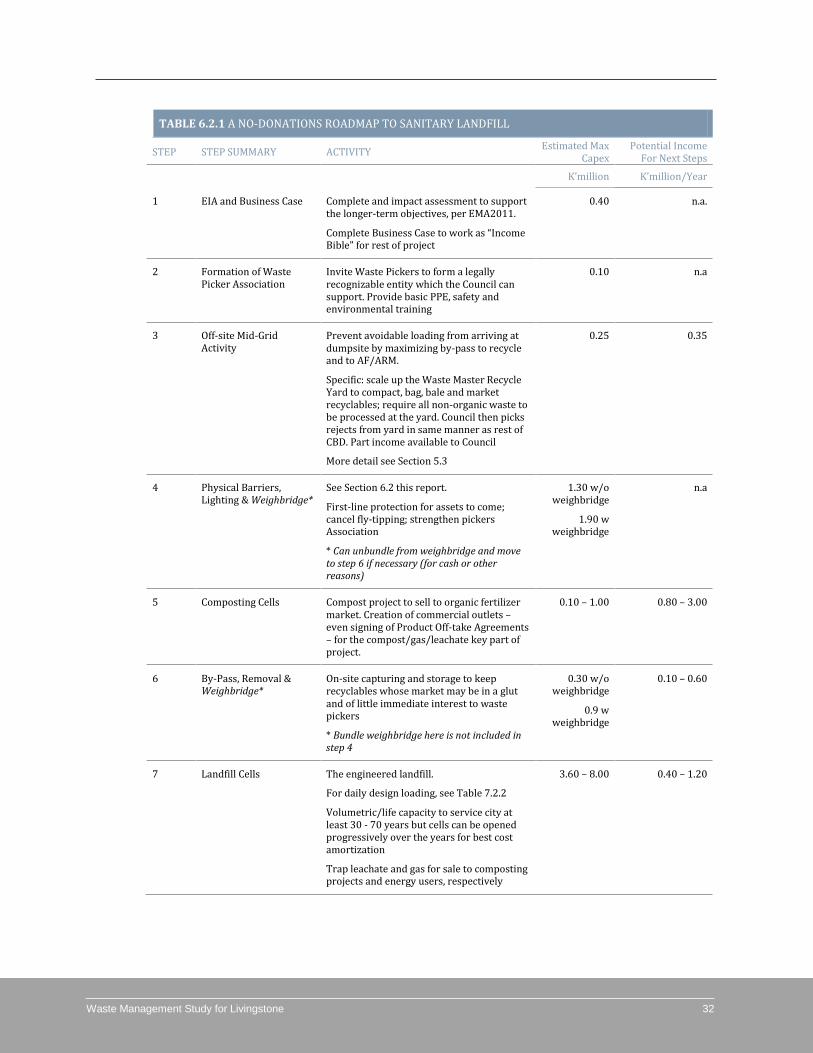
Once the site is protected as above, assets and value adding activity can begin to be brought to location at the dumpsite. A weighbridge will also be necessary to avoid subjective visual estimates of waste volumes as happens now. Table 6.2.1 outlines a possible Roadmap.
Waste Management Study for Livingstone 32
TABLE 6.2.1 A NO-DONATIONS ROADMAP TO SANITARY LANDFILL
STEP STEP SUMMARY ACTIVITY Estimated Max
Capex Potential Income
For Next Steps
K’million K’million/Year
1 EIA and Business Case Complete and impact assessment to support the longer-term objectives, per EMA2011.
Complete Business Case to work as “Income Bible” for rest of project
0.40 n.a.
2 Formation of Waste Picker Association
Invite Waste Pickers to form a legally recognizable entity which the Council can support. Provide basic PPE, safety and environmental training
0.10 n.a
3 Off-site Mid-Grid Activity
Prevent avoidable loading from arriving at dumpsite by maximizing by-pass to recycle and to AF/ARM.
Specific: scale up the Waste Master Recycle Yard to compact, bag, bale and market recyclables; require all non-organic waste to be processed at the yard. Council then picks rejects from yard in same manner as rest of CBD. Part income available to Council
More detail see Section 5.3
0.25 0.35
4 Physical Barriers, Lighting & Weighbridge*
See Section 6.2 this report.
First-line protection for assets to come; cancel fly-tipping; strengthen pickers Association
* Can unbundle from weighbridge and move to step 6 if necessary (for cash or other reasons)
1.30 w/o weighbridge
1.90 w weighbridge
n.a
5 Composting Cells Compost project to sell to organic fertilizer market. Creation of commercial outlets – even signing of Product Off-take Agreements – for the compost/gas/leachate key part of project.
0.10 – 1.00 0.80 – 3.00
6 By-Pass, Removal & Weighbridge*
On-site capturing and storage to keep recyclables whose market may be in a glut and of little immediate interest to waste pickers
* Bundle weighbridge here is not included in step 4
0.30 w/o weighbridge
0.9 w weighbridge
0.10 – 0.60
7 Landfill Cells The engineered landfill.
For daily design loading, see Table 7.2.2
Volumetric/life capacity to service city at least 30 - 70 years but cells can be opened progressively over the years for best cost amortization
Trap leachate and gas for sale to composting projects and energy users, respectively
3.60 – 8.00 0.40 – 1.20
Waste Management Study for Livingstone 33
6.3 Quick-Win Opportunities
As shown in Table 6.2.1, step 5 (composting) is a most lucrative operation, looking at the relative size of income to investment. However, even for this part of the project, fencing will be necessary. The cost of fencing can therefore not be jumped, unless the Council finds alternative land for a composting project which is located in a different area form the dumpsite. The cost of EIA and Business Case are also not avoidable: the EIA because it is the law applicable to projects of this nature; the Business Case because otherwise the various project components may lack a unifying structure and the discipline necessary to see them past their demanding phases in order to perform their function of discharging revenue to the Council to support a landfill project.
That said, the following sub-components present quick win opportunities (opportunities where the payback time can easily be brought to less than 12 months). They can be pursued as early as possible in order to gather momentum for the more demanding phases:
Composting, using the organic fraction of the waste from the various eateries within the city
Recycling raw material supply, e.g., glass to IB Blocks and other block manufacturers within or neighbouring Livingstone; plastics from Water Master Yard
Oil extraction from food waste, to be used as an alternative fuel within the food industry or lighting uses
Shredding and baling of non-recyclable paper to be transported, together with whole tyres, to cement manufacturers as alternative fuel. For this part to be successful, however, the volumes of this type of waste – sorted and uniform – have to be very high (can consume over 30tons in a single day). Periods of aggregation may be required. It can also be expected that such off-takers globally experienced in AF/ARM matters may bargain hard for lowest possible prices (or may not want to pay prices at all and instead seek to charge the Council a disposal fee). In order to be successful with these, a higher level partnership must be sought where they overtly support the longer term objectives of the project and are willing to make some contribution via the low-price purchase of pre-processed waste materials. Alternatively, the materials may be given free of cost but a commercial fee charged on logistics (sorting, storage and transport).
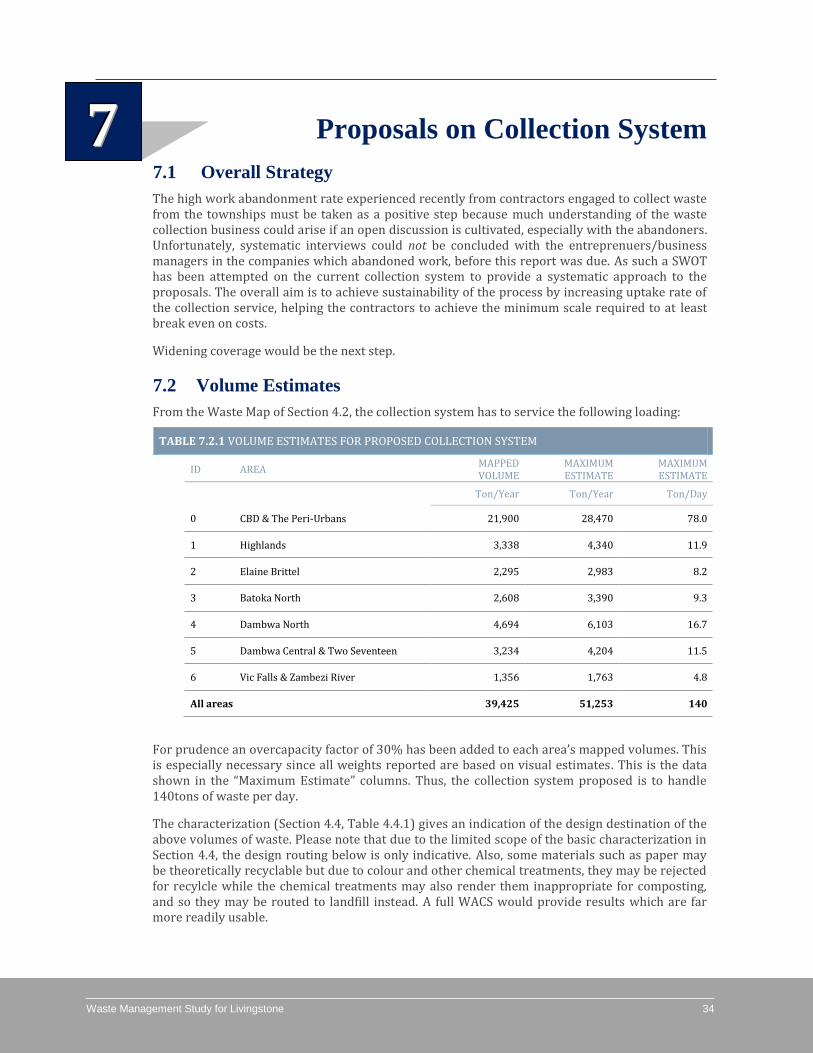
Waste Management Study for Livingstone 34
Proposals on Collection System
7.1 Overall Strategy
The high work abandonment rate experienced recently from contractors engaged to collect waste from the townships must be taken as a positive step because much understanding of the waste collection business could arise if an open discussion is cultivated, especially with the abandoners. Unfortunately, systematic interviews could not be concluded with the entreprenuers/business managers in the companies which abandoned work, before this report was due. As such a SWOT has been attempted on the current collection system to provide a systematic approach to the proposals. The overall aim is to achieve sustainability of the process by increasing uptake rate of the collection service, helping the contractors to achieve the minimum scale required to at least break even on costs.
Widening coverage would be the next step.
7.2 Volume Estimates
From the Waste Map of Section 4.2, the collection system has to service the following loading:
TABLE 7.2.1 VOLUME ESTIMATES FOR PROPOSED COLLECTION SYSTEM
ID AREA MAPPED VOLUME
MAXIMUM ESTIMATE
MAXIMUM ESTIMATE
Ton/Year Ton/Year Ton/Day
0 CBD & The Peri-Urbans 21,900 28,470 78.0
1 Highlands 3,338 4,340 11.9
2 Elaine Brittel 2,295 2,983 8.2
3 Batoka North 2,608 3,390 9.3
4 Dambwa North 4,694 6,103 16.7
5 Dambwa Central & Two Seventeen 3,234 4,204 11.5
6 Vic Falls & Zambezi River 1,356 1,763 4.8
All areas 39,425 51,253 140
For prudence an overcapacity factor of 30% has been added to each area’s mapped volumes. This is especially necessary since all weights reported are based on visual estimates. This is the data shown in the “Maximum Estimate” columns. Thus, the collection system proposed is to handle 140tons of waste per day.
The characterization (Section 4.4, Table 4.4.1) gives an indication of the design destination of the above volumes of waste. Please note that due to the limited scope of the basic characterization in Section 4.4, the design routing below is only indicative. Also, some materials such as paper may be theoretically recyclable but due to colour and other chemical treatments, they may be rejected for recylcle while the chemical treatments may also render them inappropriate for composting, and so they may be routed to landfill instead. A full WACS would provide results which are far more readily usable.
777
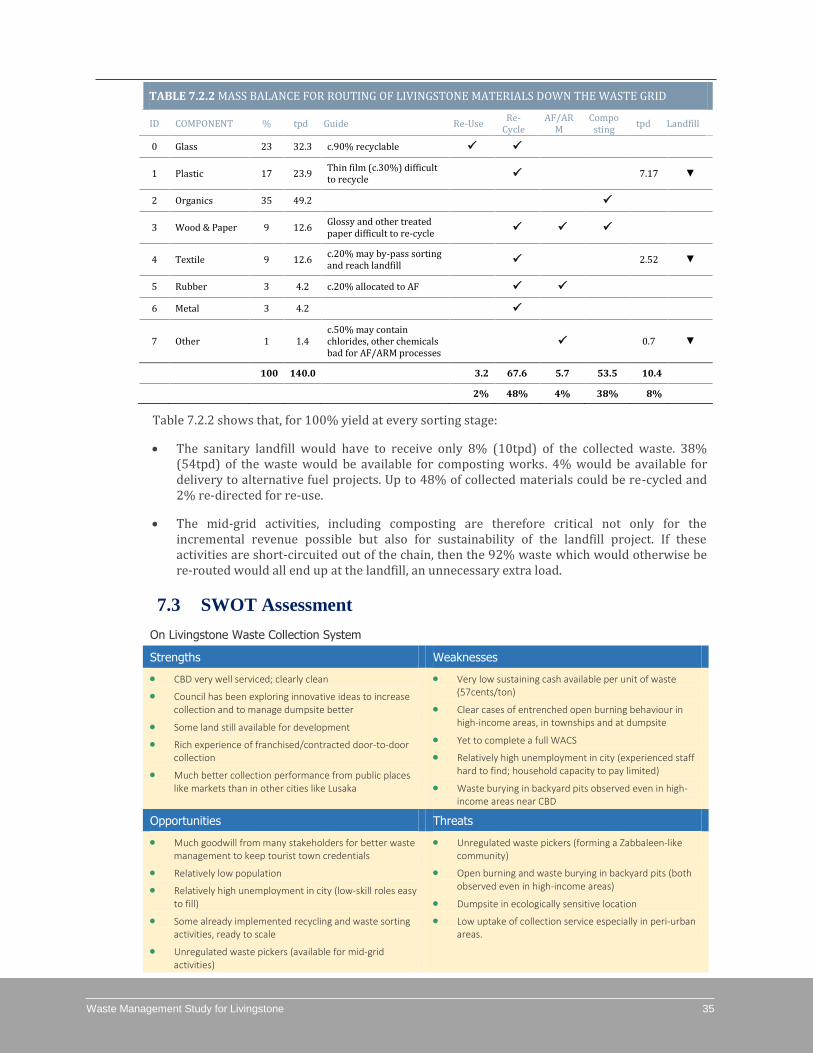
Waste Management Study for Livingstone 35
TABLE 7.2.2 MASS BALANCE FOR ROUTING OF LIVINGSTONE MATERIALS DOWN THE WASTE GRID
ID COMPONENT % tpd Guide Re-Use Re-
Cycle AF/AR
M Compo
sting tpd Landfill
0 Glass 23 32.3 c.90% recyclable
1 Plastic 17 23.9 Thin film (c.30%) difficult to recycle
7.17 ▼
2 Organics 35 49.2
3 Wood & Paper 9 12.6 Glossy and other treated paper difficult to re-cycle
4 Textile 9 12.6 c.20% may by-pass sorting and reach landfill
2.52 ▼
5 Rubber 3 4.2 c.20% allocated to AF
6 Metal 3 4.2
7 Other 1 1.4 c.50% may contain chlorides, other chemicals bad for AF/ARM processes
0.7 ▼
100 140.0 3.2 67.6 5.7 53.5 10.4
2% 48% 4% 38% 8%
Table 7.2.2 shows that, for 100% yield at every sorting stage:
The sanitary landfill would have to receive only 8% (10tpd) of the collected waste. 38% (54tpd) of the waste would be available for composting works. 4% would be available for delivery to alternative fuel projects. Up to 48% of collected materials could be re-cycled and 2% re-directed for re-use.
The mid-grid activities, including composting are therefore critical not only for the incremental revenue possible but also for sustainability of the landfill project. If these activities are short-circuited out of the chain, then the 92% waste which would otherwise be re-routed would all end up at the landfill, an unnecessary extra load.
7.3 SWOT Assessment
On Livingstone Waste Collection System
Strengths Weaknesses
CBD very well serviced; clearly clean
Council has been exploring innovative ideas to increase collection and to manage dumpsite better
Some land still available for development
Rich experience of franchised/contracted door-to-door collection
Much better collection performance from public places like markets than in other cities like Lusaka
Very low sustaining cash available per unit of waste (57cents/ton)
Clear cases of entrenched open burning behaviour in high-income areas, in townships and at dumpsite
Yet to complete a full WACS
Relatively high unemployment in city (experienced staff hard to find; household capacity to pay limited)
Waste burying in backyard pits observed even in high-income areas near CBD
Opportunities Threats
Much goodwill from many stakeholders for better waste management to keep tourist town credentials
Relatively low population
Relatively high unemployment in city (low-skill roles easy to fill)
Some already implemented recycling and waste sorting activities, ready to scale
Unregulated waste pickers (available for mid-grid activities)
Unregulated waste pickers (forming a Zabbaleen-like community)
Open burning and waste burying in backyard pits (both observed even in high-income areas)
Dumpsite in ecologically sensitive location
Low uptake of collection service especially in peri-urban areas.
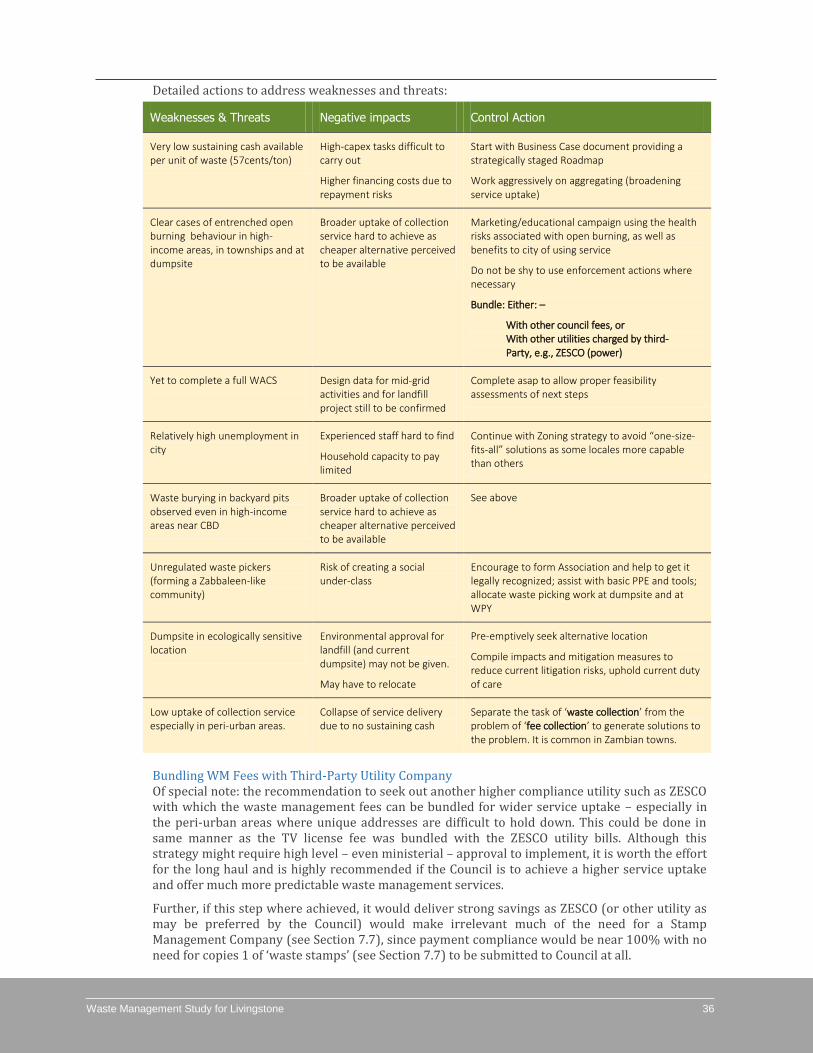
Waste Management Study for Livingstone 36
Detailed actions to address weaknesses and threats:
Weaknesses & Threats Negative impacts Control Action
Very low sustaining cash available per unit of waste (57cents/ton)
High-capex tasks difficult to carry out
Higher financing costs due to repayment risks
Start with Business Case document providing a strategically staged Roadmap
Work aggressively on aggregating (broadening service uptake)
Clear cases of entrenched open burning behaviour in high-income areas, in townships and at dumpsite
Broader uptake of collection service hard to achieve as cheaper alternative perceived to be available
Marketing/educational campaign using the health risks associated with open burning, as well as benefits to city of using service
Do not be shy to use enforcement actions where necessary
Bundle: Either: –
With other council fees, or With other utilities charged by third- Party, e.g., ZESCO (power)
Yet to complete a full WACS
Design data for mid-grid activities and for landfill project still to be confirmed
Complete asap to allow proper feasibility assessments of next steps
Relatively high unemployment in city
Experienced staff hard to find
Household capacity to pay limited
Continue with Zoning strategy to avoid “one-size-fits-all” solutions as some locales more capable than others
Waste burying in backyard pits observed even in high-income areas near CBD
Broader uptake of collection service hard to achieve as cheaper alternative perceived to be available
See above
Unregulated waste pickers (forming a Zabbaleen-like community)
Risk of creating a social under-class
Encourage to form Association and help to get it legally recognized; assist with basic PPE and tools; allocate waste picking work at dumpsite and at WPY
Dumpsite in ecologically sensitive location
Environmental approval for landfill (and current dumpsite) may not be given.
May have to relocate
Pre-emptively seek alternative location
Compile impacts and mitigation measures to reduce current litigation risks, uphold current duty of care
Low uptake of collection service especially in peri-urban areas.
Collapse of service delivery due to no sustaining cash
Separate the task of ‘waste collection’ from the problem of ‘fee collection’ to generate solutions to the problem. It is common in Zambian towns.
Bundling WM Fees with Third-Party Utility Company Of special note: the recommendation to seek out another higher compliance utility such as ZESCO with which the waste management fees can be bundled for wider service uptake – especially in the peri-urban areas where unique addresses are difficult to hold down. This could be done in same manner as the TV license fee was bundled with the ZESCO utility bills. Although this strategy might require high level – even ministerial – approval to implement, it is worth the effort for the long haul and is highly recommended if the Council is to achieve a higher service uptake and offer much more predictable waste management services.
Further, if this step where achieved, it would deliver strong savings as ZESCO (or other utility as may be preferred by the Council) would make irrelevant much of the need for a Stamp Management Company (see Section 7.7), since payment compliance would be near 100% with no need for copies 1 of ‘waste stamps’ (see Section 7.7) to be submitted to Council at all.
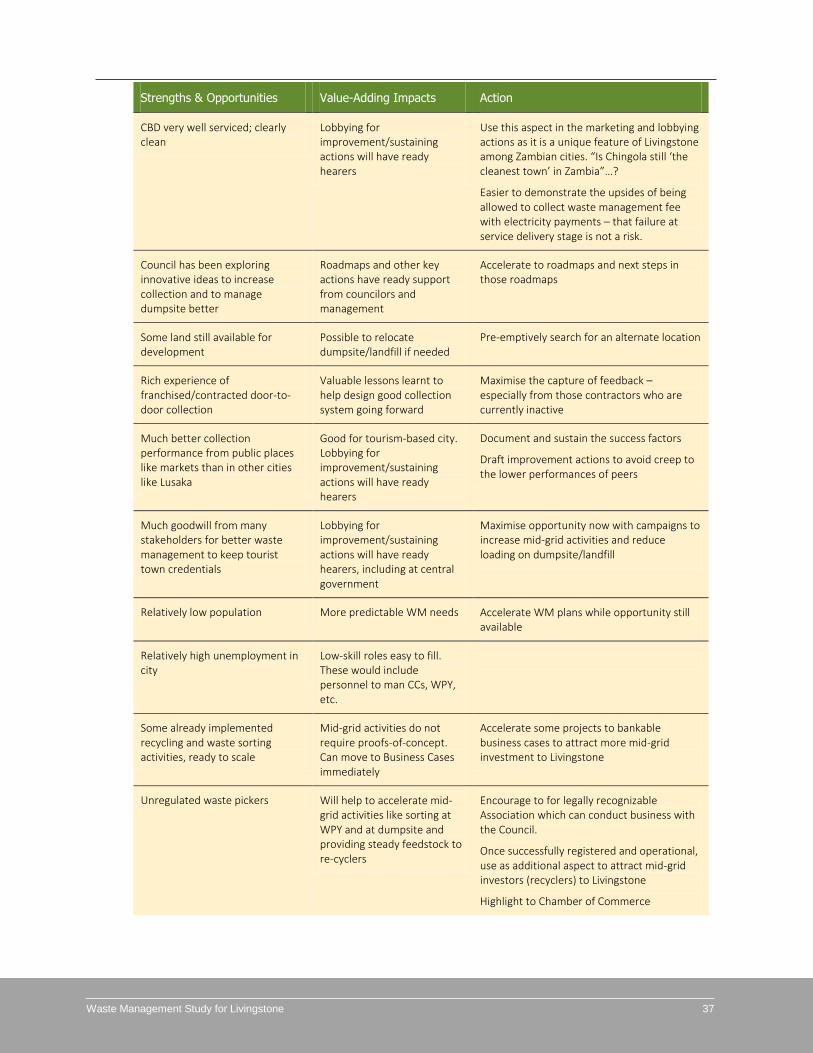
Waste Management Study for Livingstone 37
Strengths & Opportunities Value-Adding Impacts Action
CBD very well serviced; clearly clean
Lobbying for improvement/sustaining actions will have ready hearers
Use this aspect in the marketing and lobbying actions as it is a unique feature of Livingstone among Zambian cities. “Is Chingola still ‘the cleanest town’ in Zambia”…?
Easier to demonstrate the upsides of being allowed to collect waste management fee with electricity payments – that failure at service delivery stage is not a risk.
Council has been exploring innovative ideas to increase collection and to manage dumpsite better
Roadmaps and other key actions have ready support from councilors and management
Accelerate to roadmaps and next steps in those roadmaps
Some land still available for development
Possible to relocate dumpsite/landfill if needed
Pre-emptively search for an alternate location
Rich experience of franchised/contracted door-to-door collection
Valuable lessons learnt to help design good collection system going forward
Maximise the capture of feedback – especially from those contractors who are currently inactive
Much better collection performance from public places like markets than in other cities like Lusaka
Good for tourism-based city. Lobbying for improvement/sustaining actions will have ready hearers
Document and sustain the success factors
Draft improvement actions to avoid creep to the lower performances of peers
Much goodwill from many stakeholders for better waste management to keep tourist town credentials
Lobbying for improvement/sustaining actions will have ready hearers, including at central government
Maximise opportunity now with campaigns to increase mid-grid activities and reduce loading on dumpsite/landfill
Relatively low population More predictable WM needs Accelerate WM plans while opportunity still available
Relatively high unemployment in city
Low-skill roles easy to fill. These would include personnel to man CCs, WPY, etc.
Some already implemented recycling and waste sorting activities, ready to scale
Mid-grid activities do not require proofs-of-concept. Can move to Business Cases immediately
Accelerate some projects to bankable business cases to attract more mid-grid investment to Livingstone
Unregulated waste pickers Will help to accelerate mid-grid activities like sorting at WPY and at dumpsite and providing steady feedstock to re-cyclers
Encourage to for legally recognizable Association which can conduct business with the Council.
Once successfully registered and operational, use as additional aspect to attract mid-grid investors (recyclers) to Livingstone
Highlight to Chamber of Commerce
GP Environmental Consultants 38
7.3 Key Derived Actions
As some of the actions repeat (being relevant to multiple issues identified), the following is the
summary of unique actions to form the thinking going forward:
(a) Aggressively resolve the aggregation problem. It is the only lever available to the Council for
increasing cash in the city’s waste management operations
(b) Create a Business Case document which will incorporate among other things, roadmaps for
developing a Waste Processing Yard, a compost yard, an engineered landfill and incorporating
the informal waste pickers into the waste management chain of the city.
(c) Seriously consider a contract with the power utility, ZESCO, to collect waste management fees
together with payments for power, in same manner as TV license fees are collected by agency
(d) Separate the task of ‘waste collection’ from the problem of ‘fee collection’ so that the problem
can be solved. It is not a problem unique to Livingstone. The solution may therefore have to be
national in nature. Livingstone, with a unique need to lead in city cleanness, can take the lead.
(e) When lobbying for program support, do not short-sale the city’s unique achievements so far,
particularly in collection rate, mid-grid activities and CBD organization.
(f) Maximise the capture of lessons learnt from unsuccessful contracting efforts.
7.4 Collection Systems and Collection Centres
Currently, there is a multiplicity of collection points as follows:
Skips in public areas
Skips in SUFs
Individual households in the townships
As experience has shown, the first two types of collection points are sustainable under current social conditions while the last one continues to present Aggregation challenges (the contractors concerned struggle to achieve minimum scale to sustain their operations).
The City Council, being local government is best placed to take the first steps toward resolving the Aggregation problem.
It is now proposed that a solution be adopted. This shall involve the following suggested steps:
Small skips or large (1m3) poly sacks and weighing scales be provided in common spaces working as collection centres (CCs) in the townships,
Households be required to bring waste to these CCs in exchange for ‘waste stamps – copy 1’. One waste stamp shall be equivalent to a specified (say 1kg) quantity of waste,
Collectors be required to pick up aggregated waste from the CCs together with ‘waste stamps – copy 2’,
Each Collector be required to retire their batch of ‘waste stamps – copy 2’ at a Council designated waste drop-off point (either the Waste Processing Yard or the Dumpsite) together with the associated waste. The stamps will provide information on point of origin
Waste Management Study for Livingstone 39
(down to the household involved) while the waste dropped off will authenticate the stamps. For extra assurance, the waste should be weighed if weighbridge available. Using information captured from this stamp system, the council can map the households which require targeted enforcement action as they will be persistently absent from the stamp-retirement entries in the database.
The waste collection fees in the townships, particularly the peri-urban areas be bundled with land rates or similar fees which are currently already payable to the Council,
Households can bring their ‘waste stamps – copy 1’ to offset the WM Penalty component to their land rates (and revert to paying original land rate plus WM Fee only), but these stamps must be matched to their copy 2’s as retired by the Collection company. This system of charging is currently in use by the ZRA who apply Advance Income Tax (AIT) to all taxpayers’ records on file until evidence is produced showing that they have been tax compliant elsewhere, then the AIT is offset case-by-case.
It is anticipated that this system of pre-emptively bundling the fees and only unbundling upon presentation of proof of compliance would help the various departments of Council to synergise their efforts at achieving compliance. This is because all fees to Council shall be pursued using the same database and efforts. For Waste Management, this will further help to increase the uptake of managed collection services and help to solve the aggregation problem. The downside is that it increases the administration chain and that presents the risk of diversion of cash from WM to other pressing requirements. It also increases the system paperwork unless strategic investment can be made to computerize right from the start. It is, nonetheless, necessary to solve the aggregation problem which has caused a high rate of work abandonment in the recent past. In the absence of better solutions, it must be seriously considered.
7.5 Fees and Payment Systems
Fees
Until the problem of Aggregation is resolved, it is not possible to assess whether or not the current fee structure is adequate. The only firm guidance available to this study is a top-down view highlighted in Section 3.1 (page 14) showing that the city only puts 57cents per ton into waste management (a figure which, when compared to other countries, appears to be highly inadequate).
A comparison with other towns, see further below, also indicates that there may yet be room to increase the collection fee. Caution however, must be taken as livelihoods and income levels in Livingstone might have to be reviewed in a more disciplined manner before the comparison tables are applied.
Fee Structure – End Users:
Urban (high income) areas: K50 per month per household
Peri-urban (lower income) areas: K30 per month per household
SUFs: As negotiated in contract
Public Spaces & CBD: As bundled with trading licenses
Penalties for failing to dispose in regulated way: As stipulated in S.I. (1,666.67 fee units)
Dumping Fee (if self-transporting to dumpsite): K30 per month
Fee structure – Franchisees:
Franchise Fee: K10,000 per year
Dumping Fee: K200 per month
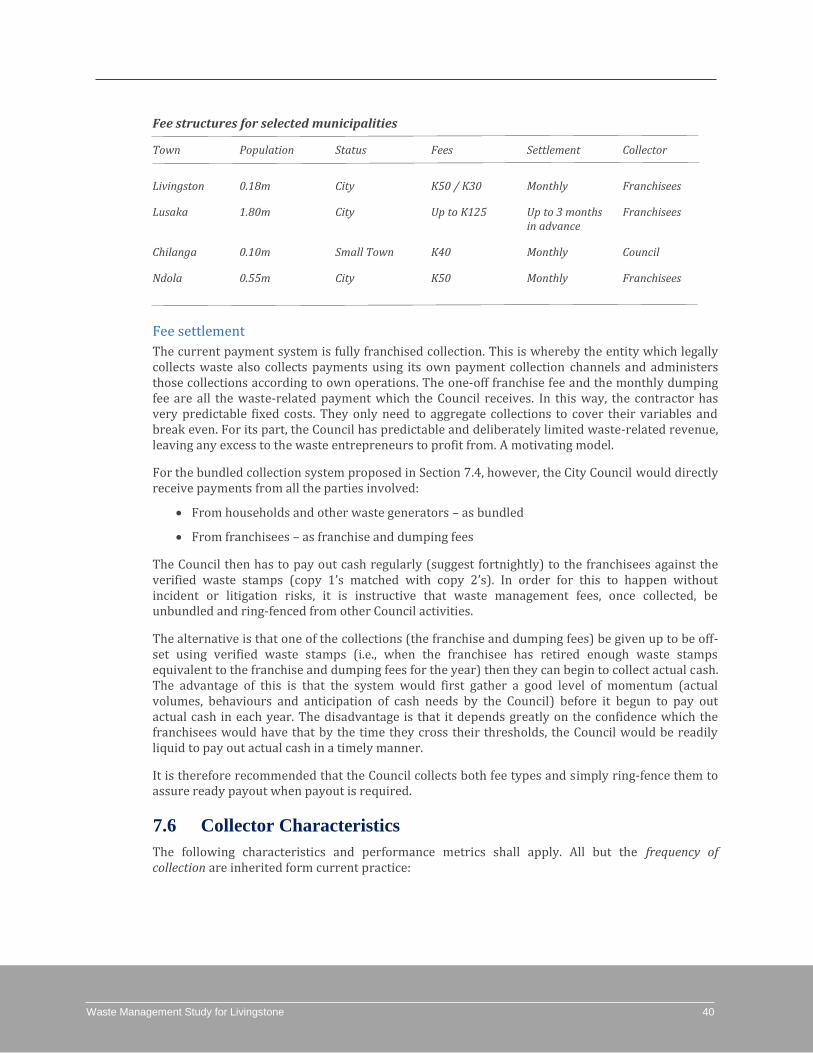
Waste Management Study for Livingstone 40
Fee structures for selected municipalities
Town Population Status Fees Settlement Collector
Livingston 0.18m City K50 / K30 Monthly Franchisees
Lusaka 1.80m City Up to K125 Up to 3 months Franchisees in advance
Chilanga 0.10m Small Town K40 Monthly Council
Ndola 0.55m City K50 Monthly Franchisees
Fee settlement
The current payment system is fully franchised collection. This is whereby the entity which legally collects waste also collects payments using its own payment collection channels and administers those collections according to own operations. The one-off franchise fee and the monthly dumping fee are all the waste-related payment which the Council receives. In this way, the contractor has very predictable fixed costs. They only need to aggregate collections to cover their variables and break even. For its part, the Council has predictable and deliberately limited waste-related revenue, leaving any excess to the waste entrepreneurs to profit from. A motivating model.
For the bundled collection system proposed in Section 7.4, however, the City Council would directly receive payments from all the parties involved:
From households and other waste generators – as bundled
From franchisees – as franchise and dumping fees
The Council then has to pay out cash regularly (suggest fortnightly) to the franchisees against the verified waste stamps (copy 1’s matched with copy 2’s). In order for this to happen without incident or litigation risks, it is instructive that waste management fees, once collected, be unbundled and ring-fenced from other Council activities.
The alternative is that one of the collections (the franchise and dumping fees) be given up to be off-set using verified waste stamps (i.e., when the franchisee has retired enough waste stamps equivalent to the franchise and dumping fees for the year) then they can begin to collect actual cash. The advantage of this is that the system would first gather a good level of momentum (actual volumes, behaviours and anticipation of cash needs by the Council) before it begun to pay out actual cash in each year. The disadvantage is that it depends greatly on the confidence which the franchisees would have that by the time they cross their thresholds, the Council would be readily liquid to pay out actual cash in a timely manner.
It is therefore recommended that the Council collects both fee types and simply ring-fence them to assure ready payout when payout is required.
7.6 Collector Characteristics
The following characteristics and performance metrics shall apply. All but the frequency of collection are inherited form current practice:
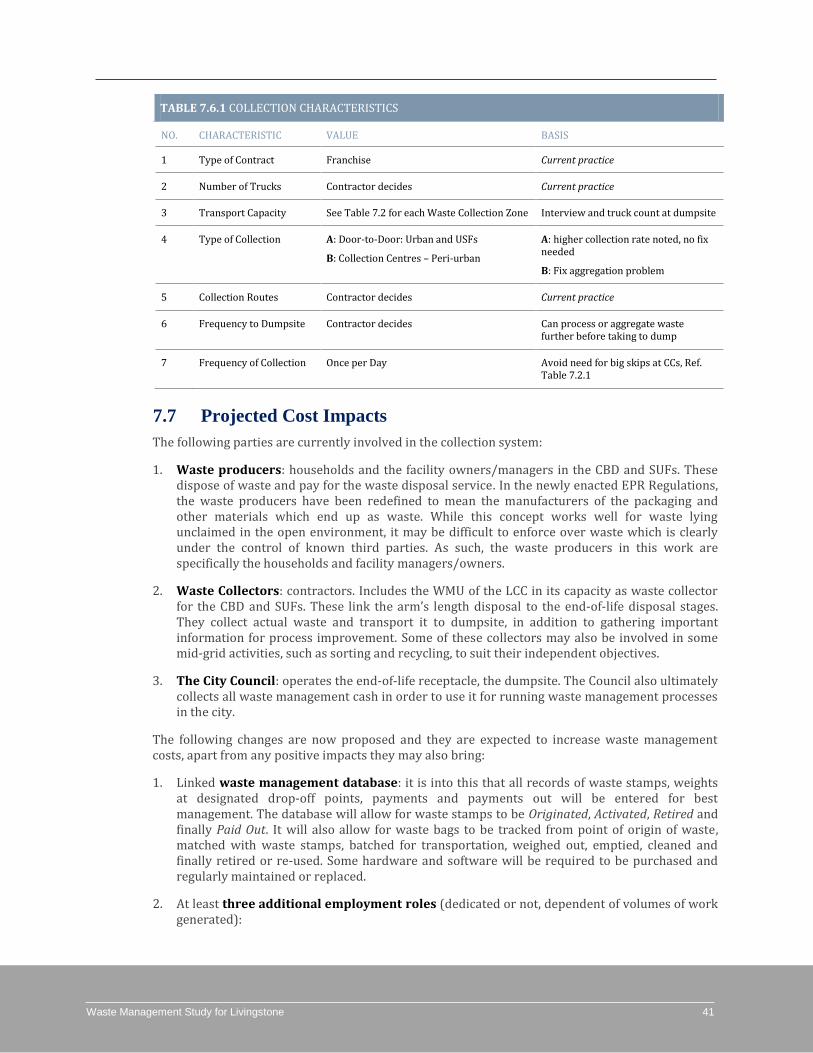
Waste Management Study for Livingstone 41
TABLE 7.6.1 COLLECTION CHARACTERISTICS
NO. CHARACTERISTIC VALUE BASIS
1 Type of Contract Franchise Current practice
2 Number of Trucks Contractor decides Current practice
3 Transport Capacity See Table 7.2 for each Waste Collection Zone Interview and truck count at dumpsite
4 Type of Collection A: Door-to-Door: Urban and USFs
B: Collection Centres – Peri-urban
A: higher collection rate noted, no fix needed
B: Fix aggregation problem
5 Collection Routes Contractor decides Current practice
6 Frequency to Dumpsite Contractor decides Can process or aggregate waste further before taking to dump
7 Frequency of Collection Once per Day Avoid need for big skips at CCs, Ref. Table 7.2.1
7.7 Projected Cost Impacts
The following parties are currently involved in the collection system:
1. Waste producers: households and the facility owners/managers in the CBD and SUFs. These dispose of waste and pay for the waste disposal service. In the newly enacted EPR Regulations, the waste producers have been redefined to mean the manufacturers of the packaging and other materials which end up as waste. While this concept works well for waste lying unclaimed in the open environment, it may be difficult to enforce over waste which is clearly under the control of known third parties. As such, the waste producers in this work are specifically the households and facility managers/owners.
2. Waste Collectors: contractors. Includes the WMU of the LCC in its capacity as waste collector for the CBD and SUFs. These link the arm’s length disposal to the end-of-life disposal stages. They collect actual waste and transport it to dumpsite, in addition to gathering important information for process improvement. Some of these collectors may also be involved in some mid-grid activities, such as sorting and recycling, to suit their independent objectives.
3. The City Council: operates the end-of-life receptacle, the dumpsite. The Council also ultimately collects all waste management cash in order to use it for running waste management processes in the city.
The following changes are now proposed and they are expected to increase waste management costs, apart from any positive impacts they may also bring:
1. Linked waste management database: it is into this that all records of waste stamps, weights at designated drop-off points, payments and payments out will be entered for best management. The database will allow for waste stamps to be Originated, Activated, Retired and finally Paid Out. It will also allow for waste bags to be tracked from point of origin of waste, matched with waste stamps, batched for transportation, weighed out, emptied, cleaned and finally retired or re-used. Some hardware and software will be required to be purchased and regularly maintained or replaced.
2. At least three additional employment roles (dedicated or not, dependent of volumes of work generated):
Waste Management Study for Livingstone 42
(a) two to receive waste at designated drop-off points (Processing Yard and Dumpsite), weigh it (if weighbridge or scale available) and activate the associated batch numbers, waste bags and waste stamp copy 2’s in the database;
(b) one to retire the waste stamp copy 1s brought by the waste generators at WMU by matching them to the corresponding copy 2’s as previously Activated when the waste was received.
3. Stamp Manager: A company responsible for:
(a) Originating waste stamps on the waste management database and issuing duo copies of each stamp, one issued to the waste generator and one to the collector;
(b) Weighing the waste at the Collection Centre and assigning the weights to the waste bags;
(c) Batching of bags for transportation and recording the unique batch numbers in the database, appropriately assigned to the included waste stamps;
(d) Providing uniquely trackable waste bags (using bar codes or other system). The bags must be uniquely trackable so that waste can be traced from originating household to drop-off points; it will also help to authenticate the waste stamps as each stamp is to be associated with a bag and its quantity of waste as well as the household/facility from which it came. When the waste bags are emptied, they are handed back to Stamp Manager for re-use or retirement out of the database.
The stamp management company will not generate any unique income but will be the face of the waste management chain at the Collection Centres and will also be instrumental to the integrity of all data on the waste management database. Their payment will therefore come from the waste management fees collected.
It is recommended that this be a separate company with experience in logistics management, particularly in tagging and tracking, and should have the means to run a distributed network of Collection Centres in the townships. They should be separate from the Council so that their operations are fully ring-fenced out of any cash movements in the waste handling system. This should disincentivise them from participating in any schemes to jump the system or to falsify any part of the database.
However, a company with such capabilities may be difficult to afford, especially where payment compliance is low and a total of only K198,400 is available for waste management works (see Section 3.1, page 15). It is therefore recommended that a Stamp Manager be brought on board as a final step in the improvement project. Prior to engagement of a dedicated Stamp Manager, it is suggested that the Collection Centres be manned by each collection company in their own zone with batched waste stamps being obtained directly from the WMU. Another option would be engagement of a lower-cost Stamp Manager running a paper-and-SMS based system with daily reconciliations in a physical book or computer file master kept at WMU.
The need for stamps is two-fold:
(a) to avoid the Collection Centres from handling cash which might make them targets for robbery
(b) to have a complete module of the waste management chain which is totally ring-fenced from cash flows, and only serves to umpire and protect data. Indeed, data integrity should form a part of the KPIs against which contract payment is made. This reduces the risks of collusion and value leakage from the system.
Table 7.7.1 is a summary of the expected movements in cost (+ve is added costs, -ve is reduced costs). Note: these are absolute costs only and are not netted off with revenues.
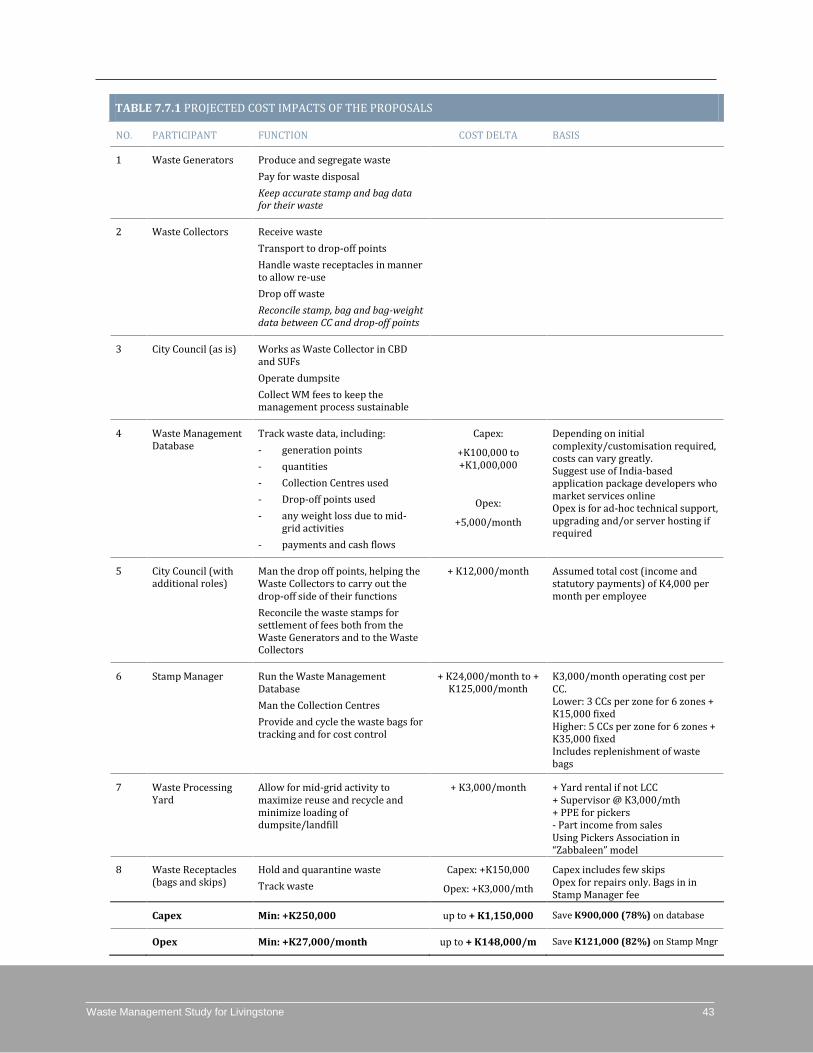
Waste Management Study for Livingstone 43
TABLE 7.7.1 PROJECTED COST IMPACTS OF THE PROPOSALS
NO. PARTICIPANT FUNCTION COST DELTA BASIS
1 Waste Generators Produce and segregate waste
Pay for waste disposal
Keep accurate stamp and bag data for their waste
2 Waste Collectors Receive waste
Transport to drop-off points
Handle waste receptacles in manner to allow re-use
Drop off waste
Reconcile stamp, bag and bag-weight data between CC and drop-off points
3 City Council (as is) Works as Waste Collector in CBD and SUFs
Operate dumpsite
Collect WM fees to keep the management process sustainable
4 Waste Management Database
Track waste data, including:
- generation points
- quantities
- Collection Centres used
- Drop-off points used
- any weight loss due to mid-grid activities
- payments and cash flows
Capex:
+K100,000 to +K1,000,000
Opex:
+5,000/month
Depending on initial complexity/customisation required, costs can vary greatly. Suggest use of India-based application package developers who market services online Opex is for ad-hoc technical support, upgrading and/or server hosting if required
5 City Council (with additional roles)
Man the drop off points, helping the Waste Collectors to carry out the drop-off side of their functions
Reconcile the waste stamps for settlement of fees both from the Waste Generators and to the Waste Collectors
+ K12,000/month Assumed total cost (income and statutory payments) of K4,000 per month per employee
6 Stamp Manager Run the Waste Management Database
Man the Collection Centres
Provide and cycle the waste bags for tracking and for cost control
+ K24,000/month to + K125,000/month
K3,000/month operating cost per CC. Lower: 3 CCs per zone for 6 zones + K15,000 fixed Higher: 5 CCs per zone for 6 zones + K35,000 fixed Includes replenishment of waste bags
7 Waste Processing Yard
Allow for mid-grid activity to maximize reuse and recycle and minimize loading of dumpsite/landfill
+ K3,000/month + Yard rental if not LCC + Supervisor @ K3,000/mth + PPE for pickers - Part income from sales Using Pickers Association in “Zabbaleen” model
8 Waste Receptacles (bags and skips)
Hold and quarantine waste
Track waste
Capex: +K150,000
Opex: +K3,000/mth
Capex includes few skips Opex for repairs only. Bags in in Stamp Manager fee
Capex Min: +K250,000 up to + K1,150,000 Save K900,000 (78%) on database
Opex Min: +K27,000/month up to + K148,000/m Save K121,000 (82%) on Stamp Mngr
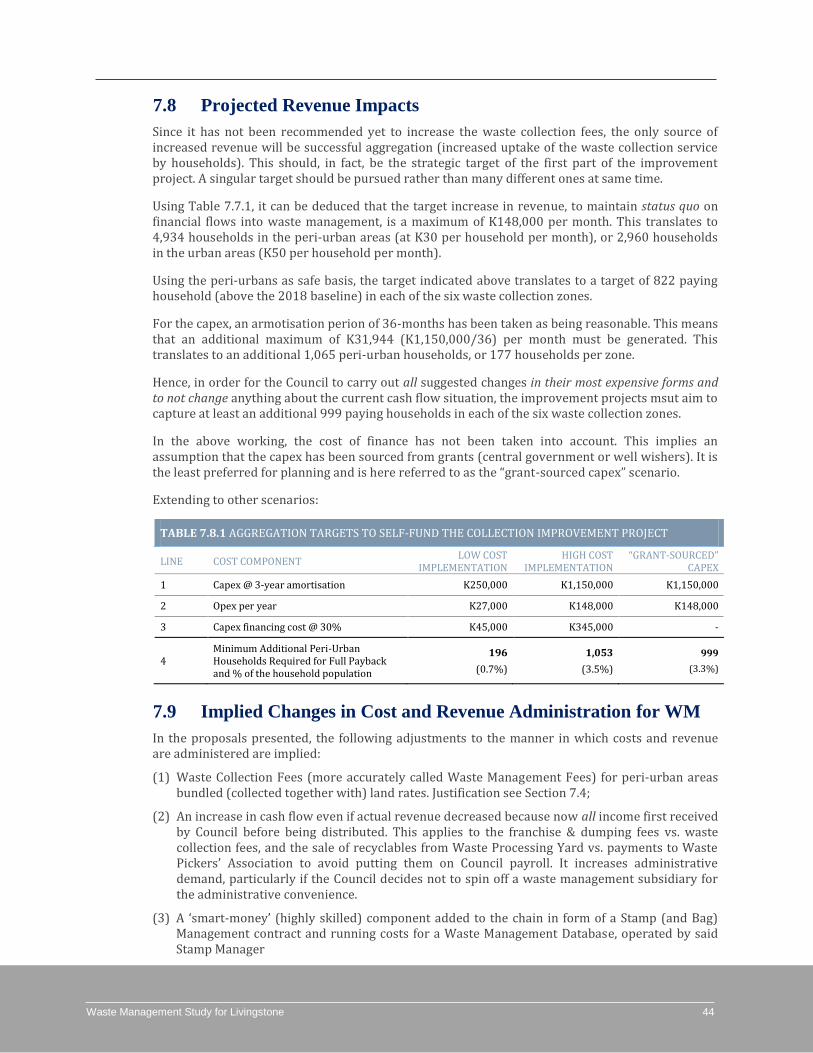
Waste Management Study for Livingstone 44
7.8 Projected Revenue Impacts
Since it has not been recommended yet to increase the waste collection fees, the only source of increased revenue will be successful aggregation (increased uptake of the waste collection service by households). This should, in fact, be the strategic target of the first part of the improvement project. A singular target should be pursued rather than many different ones at same time.
Using Table 7.7.1, it can be deduced that the target increase in revenue, to maintain status quo on financial flows into waste management, is a maximum of K148,000 per month. This translates to 4,934 households in the peri-urban areas (at K30 per household per month), or 2,960 households in the urban areas (K50 per household per month).
Using the peri-urbans as safe basis, the target indicated above translates to a target of 822 paying household (above the 2018 baseline) in each of the six waste collection zones.
For the capex, an armotisation perion of 36-months has been taken as being reasonable. This means that an additional maximum of K31,944 (K1,150,000/36) per month must be generated. This translates to an additional 1,065 peri-urban households, or 177 households per zone.
Hence, in order for the Council to carry out all suggested changes in their most expensive forms and to not change anything about the current cash flow situation, the improvement projects msut aim to capture at least an additional 999 paying households in each of the six waste collection zones.
In the above working, the cost of finance has not been taken into account. This implies an assumption that the capex has been sourced from grants (central government or well wishers). It is the least preferred for planning and is here referred to as the “grant-sourced capex” scenario.
Extending to other scenarios:
TABLE 7.8.1 AGGREGATION TARGETS TO SELF-FUND THE COLLECTION IMPROVEMENT PROJECT
LINE COST COMPONENT LOW COST
IMPLEMENTATION HIGH COST
IMPLEMENTATION “GRANT-SOURCED”
CAPEX
1 Capex @ 3-year amortisation K250,000 K1,150,000 K1,150,000
2 Opex per year K27,000 K148,000 K148,000
3 Capex financing cost @ 30% K45,000 K345,000 -
4 Minimum Additional Peri-Urban Households Required for Full Payback and % of the household population
196
(0.7%)
1,053
(3.5%)
999
(3.3%)
7.9 Implied Changes in Cost and Revenue Administration for WM
In the proposals presented, the following adjustments to the manner in which costs and revenue are administered are implied:
(1) Waste Collection Fees (more accurately called Waste Management Fees) for peri-urban areas bundled (collected together with) land rates. Justification see Section 7.4;
(2) An increase in cash flow even if actual revenue decreased because now all income first received by Council before being distributed. This applies to the franchise & dumping fees vs. waste collection fees, and the sale of recyclables from Waste Processing Yard vs. payments to Waste Pickers’ Association to avoid putting them on Council payroll. It increases administrative demand, particularly if the Council decides not to spin off a waste management subsidiary for the administrative convenience.
(3) A ‘smart-money’ (highly skilled) component added to the chain in form of a Stamp (and Bag) Management contract and running costs for a Waste Management Database, operated by said Stamp Manager
Waste Management Study for Livingstone 45
Conclusion
A study of the waste management system at Livingstone has been completed. This was a broad study looking at the entire grid from point of origin to end-of-life disposal, including fee structures, collection systems and contracting. The areas for further assessment have been identified. Proposals for system improvement, which could be made even with the current level of results, have also been presented.
Collection systems In terms of collection systems, the Council is using three types of collectors: self, contracted franchisees and CBEs (community-based enterprises). The CBEs do not have contracts yet with the Council and so they have not been reviewed specifically in this report as their work does not differ from any other Council operational engagement as it performs its functions in its part of the waste collection areas.
The franchisees are empowered to collect fees directly and use as their own income. The only intervention is that the fee levels are set by the Council as local government. Currently all franchisees operate in the higher-income (urban) areas where the waste collection fees are K50 per month. They (the franchisees) in turn pay a fixed amount per year to the Council in two parts: a one-off franchise fee of K10,000 and twelve equal instalments of K200 each in waste dumping fees. The franchisees collect waste door-to-door from those from whom they have collected waste collection fees. In this manner, the franchisees have the lever of scale to control revenue and cost-efficiency to control their level of profitability. Their failure (work abandonment, rather than outright commercial failure) rate has been found to be high at 50%. Six contractors were engaged in 2011 but by end of 2018, only three were found to be active.
For its part, the council collects waste from the CBD where the waste collection fees are bundled with other charges connected to the Trading License, and the collection is done from skips and smaller bins located in easily accessible spaces. The Council also collects from the peri-urban areas where the waste collection fee for door-to-door collection is K30 monthly. The Council also collects waste from any single-user facilities not specifically contracted out.
Re-use, recycling and disposal After about 20tons/year (0.05%) has been recycled or re-used, an overall collection rate of 57% of the remaining waste is achieved. Although this collection rate is on the more decent end of the scale for any Zambian municipality, it is very concerning. This is because the 43% of un-accounted-for waste (equivalent to 16,947tons/year) is disposed of by open burning, burying (in unregulated backyard pits) or fly-tipping (into natural waster-ways, sewage-ways, drainages or abandoned structures).
The key recycling activities (some even part-mechanised) utilize soft glass, textile off-cuts and PET bottles.
The re-use and recycling projects, taking around 0.05% of yearly city waste, are far less significant in terms of quantity used but form a significant part of Livingstone social and economic life. Some street pickers earn a livelihood – even support entire families – from picking mineral water PET bottles and selling these in batches to cooking oil, paraffin (lighting oil) and drinks (“munkoyo”) packagers operating in the townships. Although informal, the scale of this industry in the townships is significant as evidenced by their now standardized pricing and open display of products in the township markets.
888
Waste Management Study for Livingstone 46
Livingstone does not have a publicly run waste processing facility, but there is one privately run facility which services the large hotels like Aviani and Royal Livingstone who have EMS (environmental management system) credentials to protect.
Dumpsite and landfill An assessment of the current dumpsite has found that it is situated in an ecologically sensitive area in addition to doubling as a sand quarry. Thus, a recommendation has been made that the Council seriously consider relocating the site, or continuing to run it as is but launch the proposed composting and landfill projects elsewhere.
Service uptake rate and fee collection In terms of managed waste disposal, a recommendation has been made that the task of waste collection be unbundled from the closely linked but not identical problem of fee collection. This should allow the Council to either re-bundle the collection of this fee with other utilities such as pre-paid electricity. If successful, ZESCO (the national power utility company) could then be engaged in an agency contract to collect waste management fees on a monthly frequency. This action could make a strong step-change to compliance with both fee payment and waste handling. It is envisaged, however than this agency contract might take a long time before acceptance and implementation. As such, a stop-gap system involving outsourcing of the waste management database to a “Stamp Manager” is proposed.
The Stamp Manager would issue out “waste stamps”, supply and track the waste disposal bags (for re-use and for validation of stamps at payment stage) and educate people in the townships about the waste collection service. By allowing people to retire their stamps to the City Council to claim that the Council removes the waste management penalty pre-loaded onto their property rates or other regulated fee, the Stamp Manager would be helping with the collection of the fee without being required to handle Council cash as well. This concept copies the AIT system as applied to import duties by the country’s tax administrator, ZRA, with the objective of ensuring that only the Council collects and distributes cash and all cash transactions are removed from the townships to the designated Council offices which are appropriately secured to discharge that function. Under this system, the franchisees would only collect waste and stamps. They would have to retire their waste stamps to prove the quantity of waste they collected. If these stamps matched those retired by the households as well as the waste bags tracked by the Stamp Manager, the franchisee would receive payment for their service directly from the Council.
The outstanding risk remains of how high the public appetite might be for paying even the underlying fee on which the waste management fee would be piggy-backing as proposed. While there would be little choice if the waste fee piggy-backed the electric bill (ZESCO worked long at their own collection problem until they came up with pre-paid meters), the problem might persist longer if property rates were the ones piggy-backed. Broadly speaking, the public never has appetite to pay for anything at all! As such, the Council has to develop its own appetite for occasionally meting out enforcement actions on waste management to begin to change the underlying culture toward waste handling. The Council can also carry out wide educational campaigns designed to create the right attitudes toward waste disposal, especially in schools whose pupils can then influence home managers toward taking the right actions. This two-pronged approach (enforcement and education) may be indispensable even under a ZESCO-as-agency scenario. The problem may be cultural as well – why should I be stopped from burying my waste at my own privately owned land…?
In other words, bundling of the waste management fee (as the case is now) is not the problem; it is what the waste management fee is currently riding on that is. Currently, the collection of the fee is bundled with the collection of waste and then the two are contracted out to weakly capitalized entities who are then tasked with navigating their own way around the very real and common problem of low compliance to waste collection regulations. This combination almost guarantees a high work abandonment rate. It is strongly recommended that the Council take a different approach.

Waste Management Study for Livingstone 47
A high level roadmap has been generated to create pointers on how an engineered landfill project could be implemented without much grant aid.
A key part of the recommendation of next steps is that the Council carries out a full WACS (waste analysis and characterization study). The results of the WACS would enable both the re-cycling and the landfill roadmaps to be fleshed out in a lot more detail than presented here.
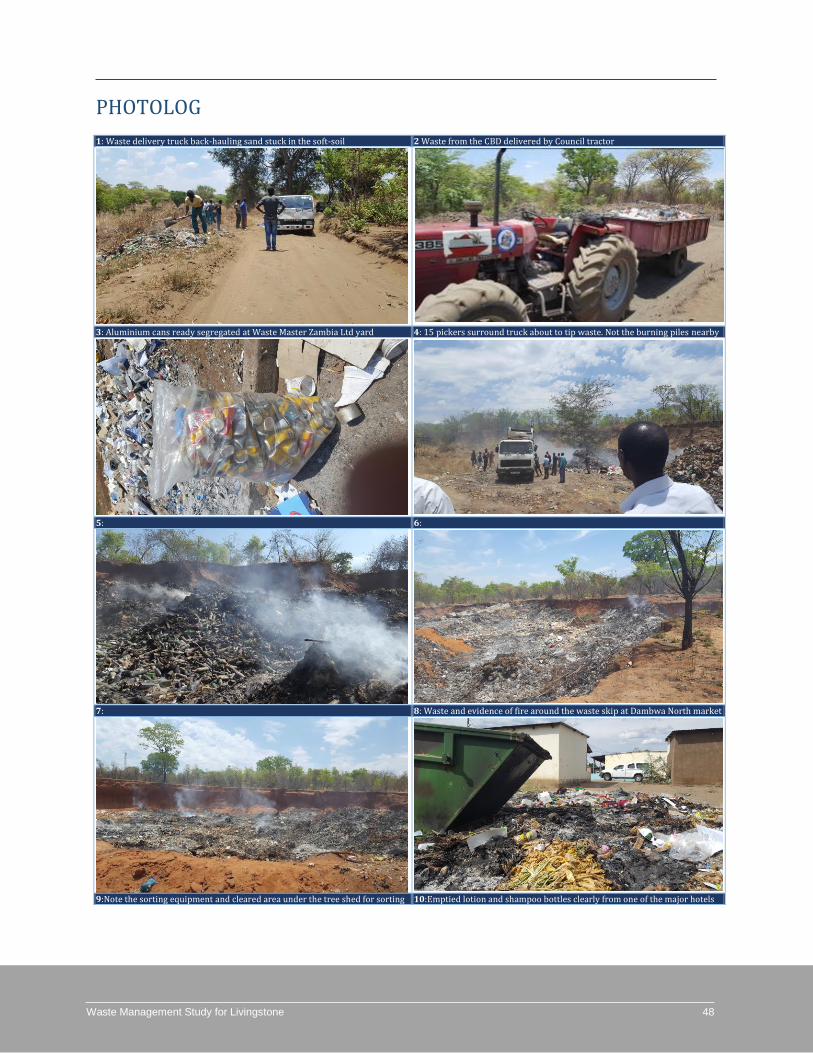
Waste Management Study for Livingstone 48
PHOTOLOG
1: Waste delivery truck back-hauling sand stuck in the soft-soil 2 Waste from the CBD delivered by Council tractor
3: Aluminium cans ready segregated at Waste Master Zambia Ltd yard 4: 15 pickers surround truck about to tip waste. Not the burning piles nearby
5: 6:
7: 8: Waste and evidence of fire around the waste skip at Dambwa North market
9:Note the sorting equipment and cleared area under the tree shed for sorting 10:Emptied lotion and shampoo bottles clearly from one of the major hotels
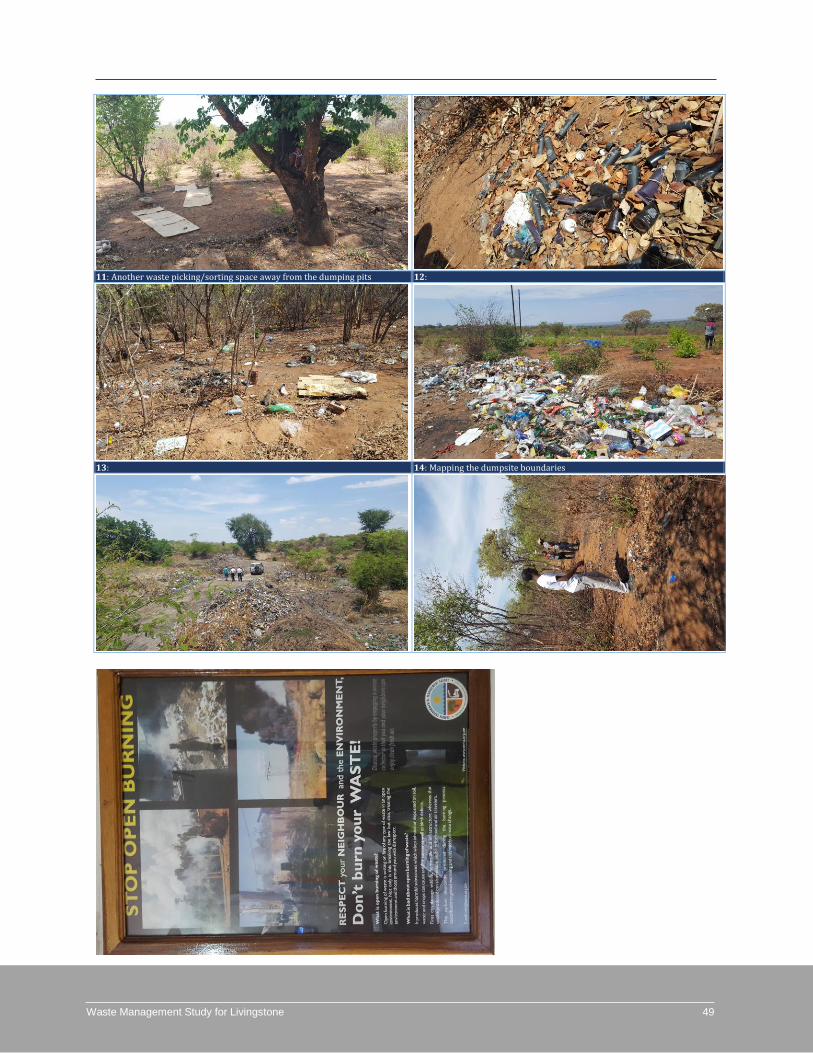
Waste Management Study for Livingstone 49
11: Another waste picking/sorting space away from the dumping pits 12:
13: 14: Mapping the dumpsite boundaries
Waste Management Study for Livingstone 50
BIBLIOGRAPHY
[1] https://www.lusakatimes.com/2019/01/02/livingstone-records-increase-in-tourist-arrivals-for-2018/ as read at Feb
2019.
[2] Zaki, Tarek et al / New Centre for Integrated Studies of Land and Environment / GIZ (2013), Annual Report for
Solid Waste Management In Egypt, 2013, Ministry of State for Environmental Affairs, Egypt.
[3] https://ejatlas.org/conflict/zabbaleen-cairo as read Feb 2019
[4] EcoGov Project (2011). Waste Analysis and Characterization Study – A Manual. Philippine Environmental
Governance Project, Pasig City, Philippines.
[5] Hogg, Dominic/Eunomia Research & Consulting/ECOTEC Research & Consulting (2002), Cost For Municipal
Waste Management in the EU – Final Report to the Directorate General, European Commission, European
Commission
[6] https://www.averagesalarysurvey.com/zambia as read Feb 2019
[7] http://www.zda.org.zm/cost/en/Cost_of Doing Business/Labour/Zambian_Public_Holidays/Indicative
Monthly_Salaries as read Feb 2019
[8] CSO (2018), 2017 Labour Force Survey Report, Ministry of Labour and Social Security, Lusaka.
[9] http://www.daily-mail.co.zm/cost-of-living-goes-down-in-livingstone/ as read Feb 2019
[10] Central Statistical Office (Zambia) (2013), Population and Demographic Projections 2011 – 2035
[11] https://www.arcgis.com/apps/MapJournal/index.html?appid=a031bce9e953409eaf8d90484ea87c52 as red Feb
2019
[12] Hauer, TB; Steiner, Martin; Vogel, Erich (2011); How to design an appropriate waste fee Principles, Practices
and Applications of Waste Management Fees, International Solid Waste Association
[13] https://www.colliercountyfl.gov/your-government/divisions-s-z/utility-billing-customer-service/rates/solid-waste-
collection-fees-residential-and-commercial, as read Feb 2019
[14] Basson, Lauren; Bronkhorst, Salomé; Fordyce, Nicholas; Eds. (2018), 2018 Market Intelligence Report, Green
Cape, Western Cape Government, South Africa
[15] https://whc.unesco.org/en/list/509 as read Feb 2019