Embed Size (px)
Citation preview
NICHOLAS SCHOOL OF THE ENVIRONMENT | DUKE UNIVERSITY
Wastewater Generation and
Disposal from Natural Gas
Wells in Pennsylvania
By
Aurana Lewis
Dr. Martin Doyle, Adviser
May 2012
Masters Project submitted in partial fulfillment of the
requirements for the Master of Environmental Management degree in
the Nicholas School of the Environment of
Duke University
i
Abstract
The recent boom in natural gas production in Pennsylvania has generated huge volumes of
wastewater. Key drivers have been a combination of high prices for natural gas, advances in
horizontal drilling, and hydraulic fracturing; a technique used to explore ‘unconventional’ gas
formations. Using data gathered by the Pennsylvania Department of Environmental Protection,
the volumes of waste generated and waste disposal methods were examined.
Comparing wastewater and gas production from unconventional natural gas exploration in the
Marcellus shale (hereafter ‘Marcellus wells’), and conventional natural gas (hereafter
‘conventional wells’) found Marcellus wells were more efficient, producing approximately three
times more natural gas per gallon of wastewater. Waste composition was similar between the
two well types, but Marcellus wells produced an average of 1.355 million gallons (Mgal) of waste
and 1,301 million cubic feet of natural gas (MMcf) over four years compared with an average of
0.120 Mgal of waste and 32.2 MMcf from conventional wells for the same timeframe. While the
Marcellus wells are more efficient, the unconventional drilling has created a boom in natural gas
production in the northeast, dramatically increasing wastewater generation.
A timeline looking at regulatory changes over this period, and the resulting shifts in disposal
options, showed a transition from historical disposal methods, relying heavily on dilution, to the
current framework relying on reuse, injection wells and advances in dissolved solid treatments.
With growth expected in to continue in Pennsylvania and to spread to the neighboring states of
West Virginia and Ohio, waste generation will continue increasing in the northeastern region.
Based on this assessment of waste generation, disposal options, and future growth, the
northeast needs to focus on improving wastewater recycling and advanced wastewater
treatment options that remove dissolved constituents prior to disposal. Given the ecological
damage seen as shale gas expanded into the northeast and the regulatory restrictions that have
been created, well operators in the northeast must develop a system of reuse and treatment for
wastewater if shale gas is to continue expanding.
ii
Table of Contents
Introduction: ..................................................................................................................................... 1
History of Hydraulic Fracturing .................................................................................................. 4
Outline of Topics ........................................................................................................................ 5
Methods: .......................................................................................................................................... 7
Section I: Waste Composition and Production ................................................................................. 9
Drilling Fluids .............................................................................................................................. 9
Fracturing Fluid and Brine ........................................................................................................ 11
Brine ......................................................................................................................................... 14
Basic Sediment/Spent Lubricant/Servicing Fluid ..................................................................... 16
Gas production ......................................................................................................................... 16
Section I – Conclusions on Waste Volume Production ............................................................ 18
Section II: Waste Disposal Options and Utilization: ....................................................................... 20
A Timeline of Waste Disposal from PA Wells........................................................................... 22
Publically Owned Treatment Works (POTWs): ..................................................................... 23
Centralized Waste Treatment (CWTs): ................................................................................. 24
The Wave of the Future ........................................................................................................ 25
Underground Injection Wells ............................................................................................... 26
Reuse .................................................................................................................................... 28
Advanced CWT ...................................................................................................................... 31
Section II - Conclusion .............................................................................................................. 34
Future Concerns - Landfill Disposal .......................................................................................... 35
Proposed State and Federal Regulatory Changes: ................................................................... 35
Section III: Projections: ................................................................................................................... 36
Conclusions: .................................................................................................................................... 38
References: ..................................................................................................................................... 39
iii
List of Figures
Figure 1 - United States wellhead prices for natural gas since 1973 (EIA 2012a). .......................... 1
Figure 2 - Gas and oil production estimates from the Pennsylvania Department of Environment’s
Oil and Gas Database (EIA 2011; EIA 2012b). .................................................................................. 2
Figure 3 - Wastewater production from conventional and Marcellus wells from 2003 to 2011.1 . 2
Figure 4 - Media coverage of the term “hydraulic fracturing” from a variety of sources............... 3
Figure 5 – Shale gas plays in the United States, including the Marcellus shale in the northeast
(EIA 2010). ....................................................................................................................................... 6
Figure 6 - Drilling waste volumes produced from conventional and Marcellus wells. ................. 10
Figure 7 - Ratios of water, sand, and chemicals for slick-water fracture fluid (Arthur et al. 2008)
....................................................................................................................................................... 11
Figure 8- A histogram of water use for hydraulic fracturing in Bradford County. It is unclear
whether the wells were drilled vertically or horizontally (Frac Focus 2011). ............................... 12
Figure 9- Fracking fluid volumes produced from Marcellus and conventional wells. ................... 13
Figure 10 - Brine volumes from Marcellus and conventional wells for each year of production. 14
Figure 11 - Gas production from Marcellus and conventional wells by year. ............................... 17
Figure 12 – Cumulative breakdown of waste by type for conventional and Marcellus wells from
2001 to 2011.................................................................................................................................. 18
Figure 13- A four-year profile of waste production from Marcellus and conventional wells. ...... 19
Figure 14 - Volumes of wastewater disposed at POTW facilities over time. ................................ 23
Figure 15 – Volumes of wastewater disposed at CWT facilities though time. .............................. 24
Figure 16 – Injection well disposal volumes of oil and gas wastewater through time. ................ 27
Figure 17 – Volumes of wastewater reused from oil and natural gas though time. ..................... 30
Figure 18 - The two pie charts show the overall disposal method for 2009 and 2011 respectively,
with side bars indicating the disposal method by CWT facility. (PA DEP 2012; Veil 2010; Hapchuk
2012). ............................................................................................................................................. 32
Figure 19 - Waste disposal trends overtime for conventional and Marcellus wastewater. ......... 34
Figure 20 – Estimates of natural gas resource extraction over the next 20 years (EIA 2012c). .... 36
iv
List of Tables
Table 1 – Brine production by year for Marcellus and conventional wells. .................................. 15
Table 2 - Contaminant levels for Marcellus wastewater and regulatory discharge standards. .... 16
Table 3 – Gas production by year for Marcellus and conventional wells. .................................... 17
Table 4 – A four-year profile of waste and gas production for an average Marcellus and
conventional well. ......................................................................................................................... 20
Table 5 – The maximum levels of constituents that could be present to reuse waste fluids for
hydraulic fracturing mixtures in 2007. .......................................................................................... 28
Table 6 – The maximum levels of constituents that may be present to reuse waste fluids for
hydraulic fracturing mixtures in 2011. .......................................................................................... 29
Table 7 – Factors for various advanced treatment options to remove TDS. ................................ 33
v
List of Acronyms
Bbl Oil barrel (42 US gallons)
Bcf Billions of cubic feet
Bcfe Billions of cubic feet equivalent for natural gas
Bgal Billions of gallons
BOGM Bureau of Oil and Gas Management
CWT Centralized waste treatment
Mcf Thousands of cubic feet
Mgal Millions of gallons
MHF Massive hydraulic fractures
MMcf Millions of cubic feet
NETL National Energy Technology Laboratory
NORM Naturally occurring radioactive material
PA DEP Pennsylvania Department of Environmental Protection
POTW Publically owned treatment works
RCRA Resource Conservation and Recovery Act
SGEIS Supplemental generic environmental impact statement
TDS Total dissolved solids
TSS Total suspended solids
1
Introduction:
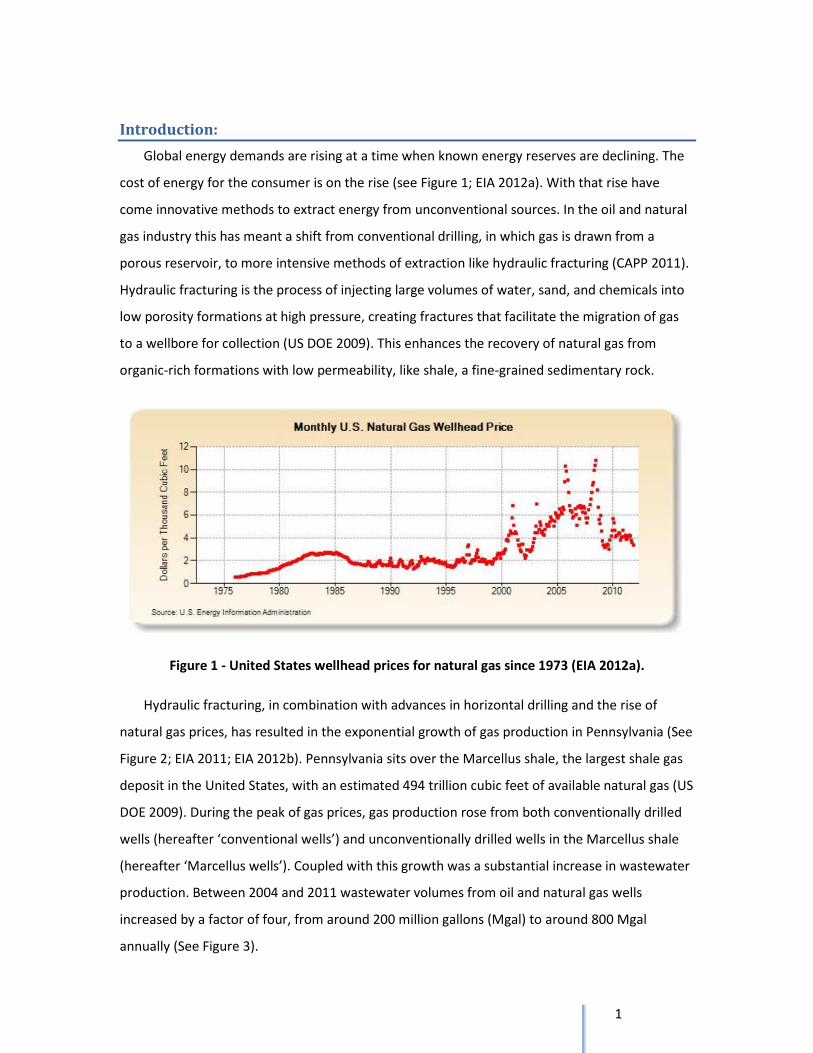
Global energy demands are rising at a time when known energy reserves are declining. The
cost of energy for the consumer is on the rise (see Figure 1; EIA 2012a). With that rise have
come innovative methods to extract energy from unconventional sources. In the oil and natural
gas industry this has meant a shift from conventional drilling, in which gas is drawn from a
porous reservoir, to more intensive methods of extraction like hydraulic fracturing (CAPP 2011).
Hydraulic fracturing is the process of injecting large volumes of water, sand, and chemicals into
low porosity formations at high pressure, creating fractures that facilitate the migration of gas
to a wellbore for collection (US DOE 2009). This enhances the recovery of natural gas from
organic-rich formations with low permeability, like shale, a fine-grained sedimentary rock.
Figure 1 - United States wellhead prices for natural gas since 1973 (EIA 2012a).
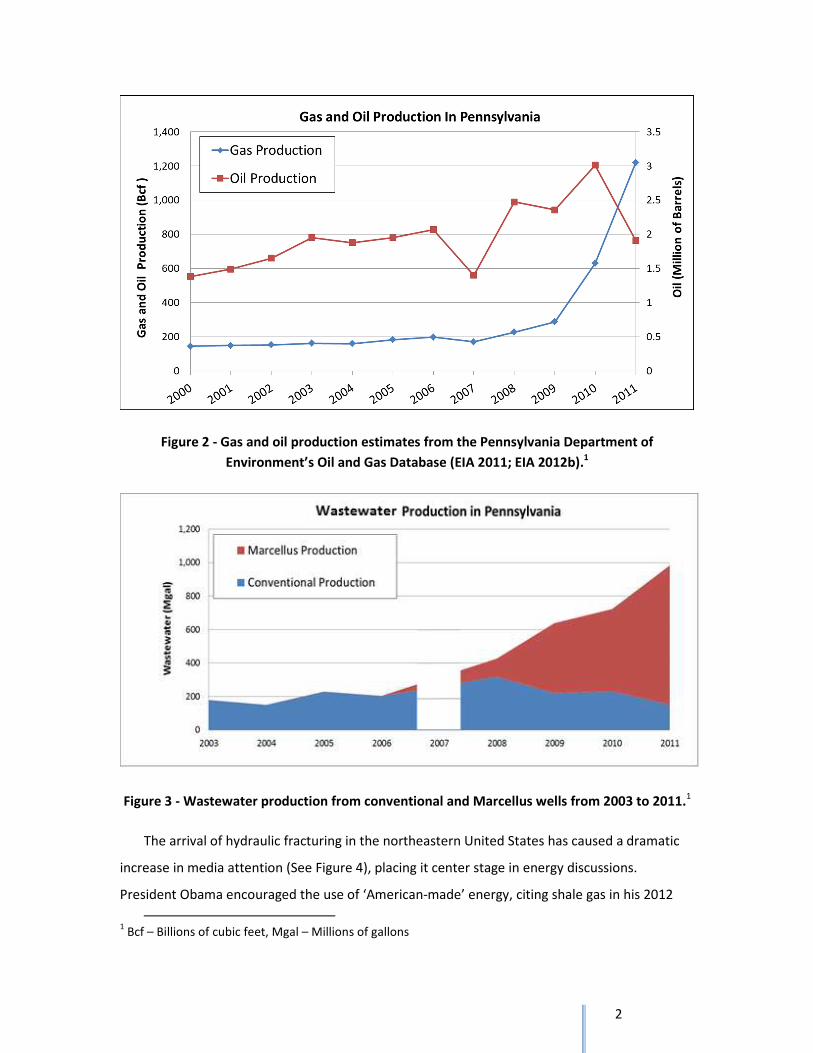
Hydraulic fracturing, in combination with advances in horizontal drilling and the rise of
natural gas prices, has resulted in the exponential growth of gas production in Pennsylvania (See
Figure 2; EIA 2011; EIA 2012b). Pennsylvania sits over the Marcellus shale, the largest shale gas
deposit in the United States, with an estimated 494 trillion cubic feet of available natural gas (US
DOE 2009). During the peak of gas prices, gas production rose from both conventionally drilled
wells (hereafter ‘conventional wells’) and unconventionally drilled wells in the Marcellus shale
(hereafter ‘Marcellus wells’). Coupled with this growth was a substantial increase in wastewater
production. Between 2004 and 2011 wastewater volumes from oil and natural gas wells
increased by a factor of four, from around 200 million gallons (Mgal) to around 800 Mgal
annually (See Figure 3).
2
Figure 2 - Gas and oil production estimates from the Pennsylvania Department of
Environment’s Oil and Gas Database (EIA 2011; EIA 2012b).1
Figure 3 - Wastewater production from conventional and Marcellus wells from 2003 to 2011.1
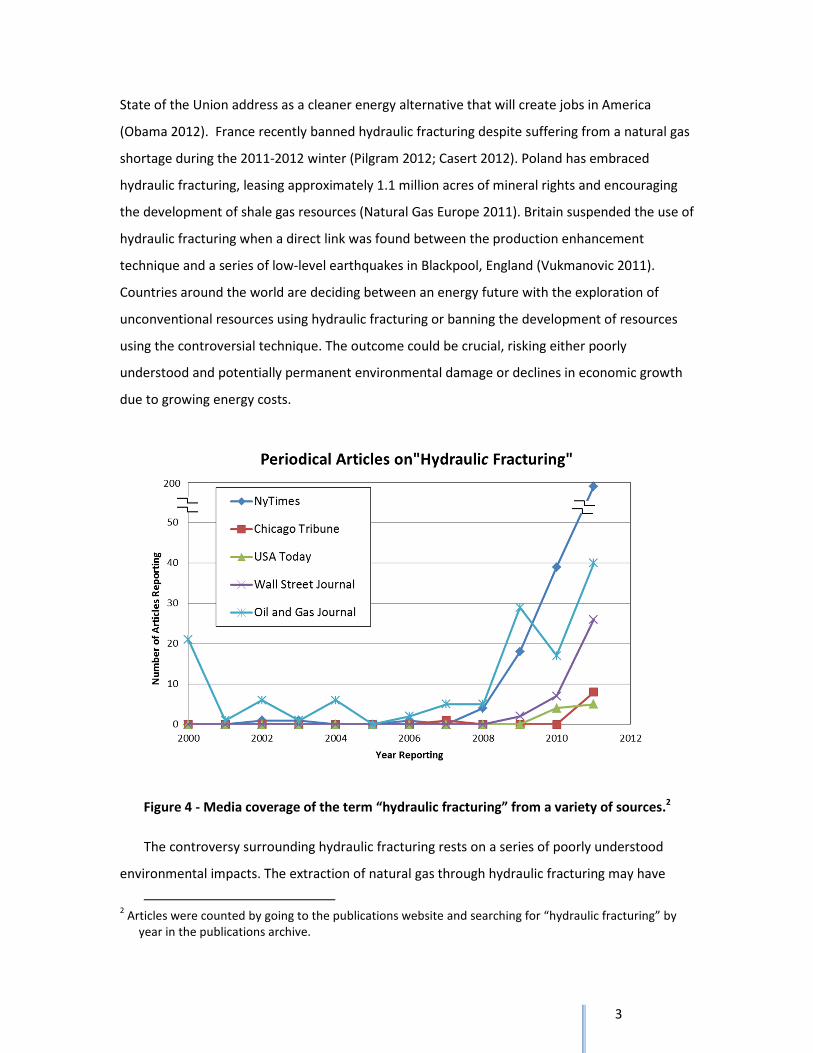
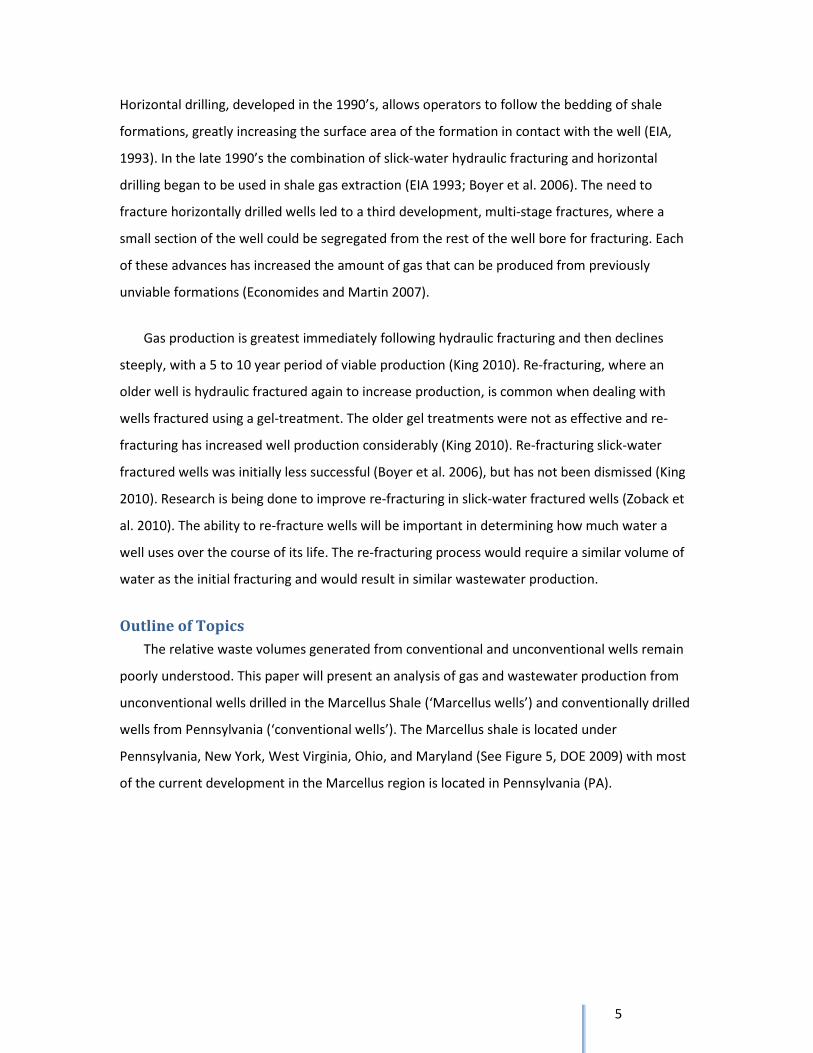
The arrival of hydraulic fracturing in the northeastern United States has caused a dramatic
increase in media attention (See Figure 4), placing it center stage in energy discussions.
President Obama encouraged the use of ‘American-made’ energy, citing shale gas in his 2012
1 Bcf – Billions of cubic feet, Mgal – Millions of gallons
3
State of the Union address as a cleaner energy alternative that will create jobs in America
(Obama 2012). France recently banned hydraulic fracturing despite suffering from a natural gas
shortage during the 2011-2012 winter (Pilgram 2012; Casert 2012). Poland has embraced
hydraulic fracturing, leasing approximately 1.1 million acres of mineral rights and encouraging
the development of shale gas resources (Natural Gas Europe 2011). Britain suspended the use of
hydraulic fracturing when a direct link was found between the production enhancement
technique and a series of low-level earthquakes in Blackpool, England (Vukmanovic 2011).
Countries around the world are deciding between an energy future with the exploration of
unconventional resources using hydraulic fracturing or banning the development of resources
using the controversial technique. The outcome could be crucial, risking either poorly
understood and potentially permanent environmental damage or declines in economic growth
due to growing energy costs.
Figure 4 - Media coverage of the term “hydraulic fracturing” from a variety of sources.2
The controversy surrounding hydraulic fracturing rests on a series of poorly understood
environmental impacts. The extraction of natural gas through hydraulic fracturing may have
2 Articles were counted by going to the publications website and searching for “hydraulic fracturing” by
year in the publications archive.
4
direct impacts on the environment (Zoback 2010), but some of the largest impacts are from the
generation of large quantities of wastewater. Current conventional on-shore oil and gas
activities generate an estimated 848 billion of gallons (Bgal) of wastewater per year (Clark and
Veil 2009). At present it is unclear how hydraulic fracturing and the development of
unconventional gas resources may alter the volumes of wastewater being generated. Disposal of
wastewater is one of the largest challenges facing the natural gas industry (Clark and Veil 2009).
History of Hydraulic Fracturing
Hydraulic fracturing has been used in oil and gas production since the 1940’s, although only
recently has hydraulic fracturing been widely used to develop unconventional shale gas
resources (Economics and Martin 2007). In additional to higher prices, advances in hydraulic
fracturing fluid mixtures and better horizontal drilling techniques have both decreased the costs
and increased the effectiveness of these practices (Boyer et al. 2006; Economides and Martin
2007), leading to a widespread development of unconventional resources.
The most common hydraulic fracturing method currently in use, called slick-water hydraulic
fracturing, was developed for the Barnett shale in Texas in the 1990’s (Economides and Martin
2007; Paktinat and O’Neil 2011). It was not until the mid-1980s that operators began using
massive hydraulic fractures (MHF) in the Barnett shale, which used a gel-based fluid (2,270 m3)
and sand (635,000 kg) to open the fractures (Boyer et al. 2006). In 1997 the focus shifted to the
use of slick-water techniques, which uses a much higher ratio of water to chemicals than gels.
For modern hydraulic fractures the ratio used is between 11,000 m3 to 19,000 m3 of water,
1300-2300 kg of sand, and 110-190 m3 of chemicals on average per well (US DOE 2009).3 While
well performance was only slightly improved using slick-water mixtures, costs were
approximately 65% lower, prompting an almost complete shift to slick-water fracturing (Boyer
et al. 2006).
The second important technological advance was the ability to utilize horizontal drilling to
focus on specific rock formations. The thickness of a shale beds is generally only 100 to 600 feet,
greatly limiting the effect hydraulic fracturing can have in vertical wells (US DOE, 2009).
3 The ratios of water, sand, and chemicals were calculated based on information from Modern Shale Gas:
a Primer (US DOE 2009). Sand density was assumed to be 2.6 Kg/m3.
5
Horizontal drilling, developed in the 1990’s, allows operators to follow the bedding of shale
formations, greatly increasing the surface area of the formation in contact with the well (EIA,
1993). In the late 1990’s the combination of slick-water hydraulic fracturing and horizontal
drilling began to be used in shale gas extraction (EIA 1993; Boyer et al. 2006). The need to
fracture horizontally drilled wells led to a third development, multi-stage fractures, where a
small section of the well could be segregated from the rest of the well bore for fracturing. Each
of these advances has increased the amount of gas that can be produced from previously
unviable formations (Economides and Martin 2007).
Gas production is greatest immediately following hydraulic fracturing and then declines
steeply, with a 5 to 10 year period of viable production (King 2010). Re-fracturing, where an
older well is hydraulic fractured again to increase production, is common when dealing with
wells fractured using a gel-treatment. The older gel treatments were not as effective and re-
fracturing has increased well production considerably (King 2010). Re-fracturing slick-water
fractured wells was initially less successful (Boyer et al. 2006), but has not been dismissed (King
2010). Research is being done to improve re-fracturing in slick-water fractured wells (Zoback et
al. 2010). The ability to re-fracture wells will be important in determining how much water a
well uses over the course of its life. The re-fracturing process would require a similar volume of
water as the initial fracturing and would result in similar wastewater production.
Outline of Topics
The relative waste volumes generated from conventional and unconventional wells remain
poorly understood. This paper will present an analysis of gas and wastewater production from
unconventional wells drilled in the Marcellus Shale (‘Marcellus wells’) and conventionally drilled
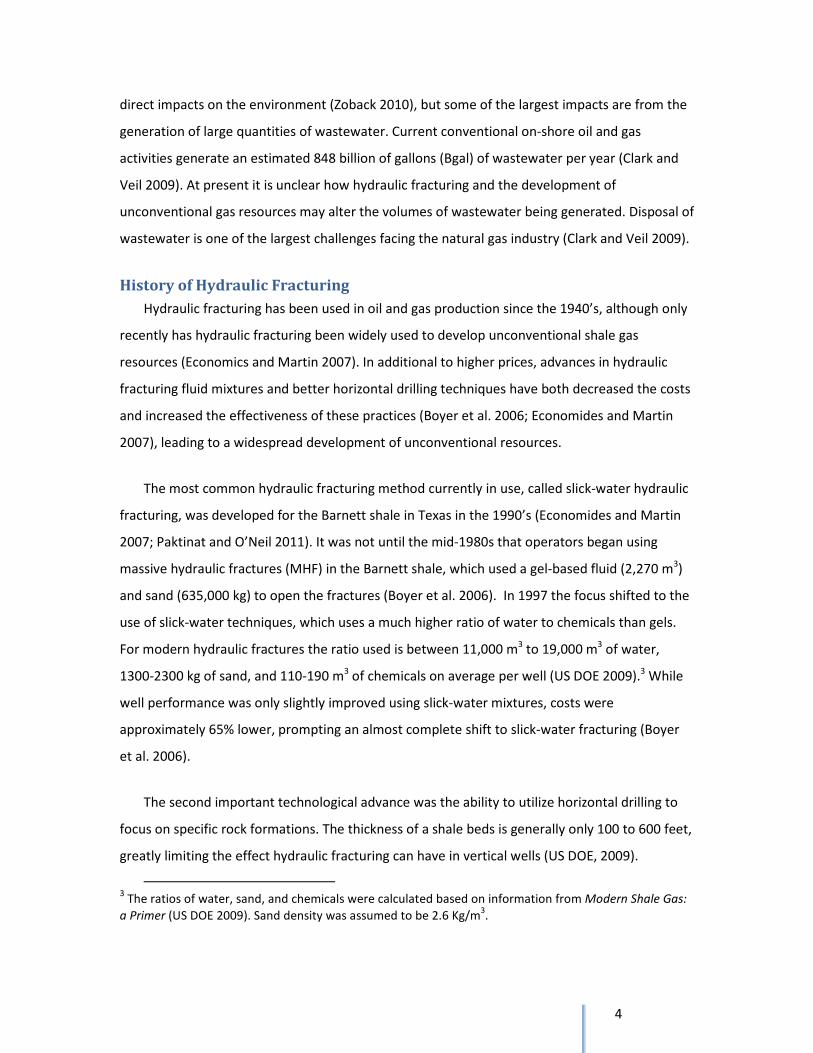
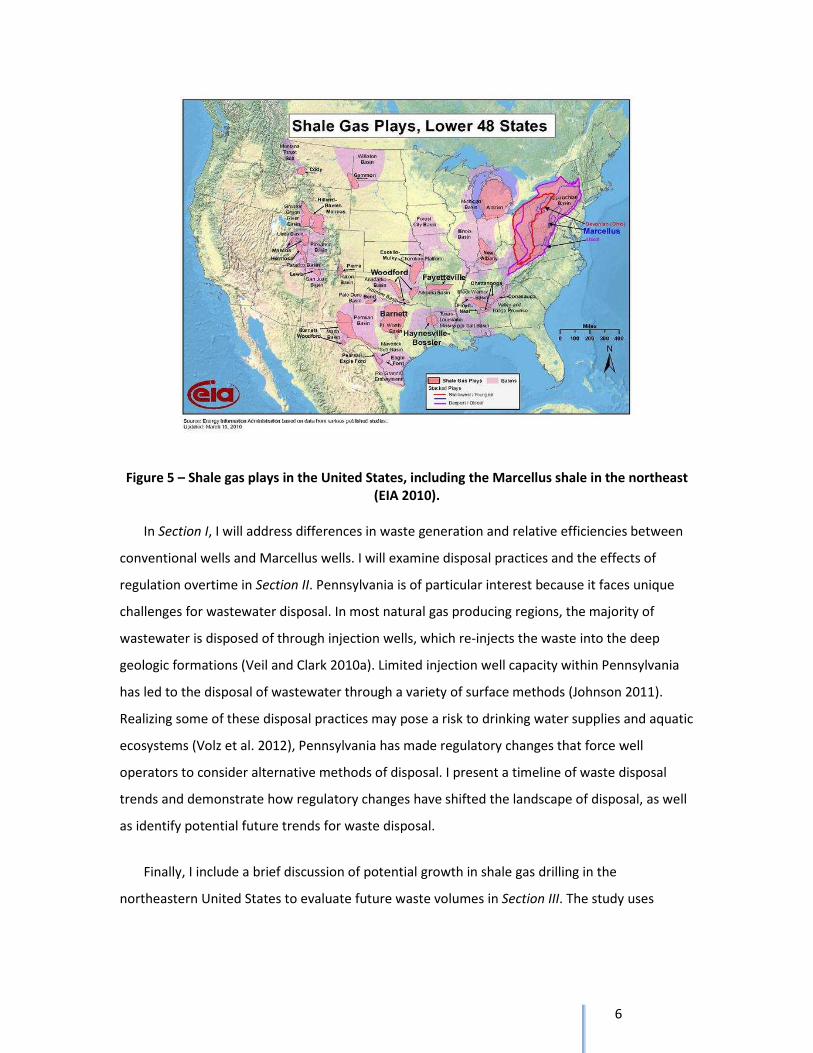
wells from Pennsylvania (‘conventional wells’). The Marcellus shale is located under
Pennsylvania, New York, West Virginia, Ohio, and Maryland (See Figure 5, DOE 2009) with most
of the current development in the Marcellus region is located in Pennsylvania (PA).
6
Figure 5 – Shale gas plays in the United States, including the Marcellus shale in the northeast
(EIA 2010).
In Section I, I will address differences in waste generation and relative efficiencies between
conventional wells and Marcellus wells. I will examine disposal practices and the effects of
regulation overtime in Section II. Pennsylvania is of particular interest because it faces unique
challenges for wastewater disposal. In most natural gas producing regions, the majority of
wastewater is disposed of through injection wells, which re-injects the waste into the deep
geologic formations (Veil and Clark 2010a). Limited injection well capacity within Pennsylvania
has led to the disposal of wastewater through a variety of surface methods (Johnson 2011).
Realizing some of these disposal practices may pose a risk to drinking water supplies and aquatic
ecosystems (Volz et al. 2012), Pennsylvania has made regulatory changes that force well
operators to consider alternative methods of disposal. I present a timeline of waste disposal
trends and demonstrate how regulatory changes have shifted the landscape of disposal, as well
as identify potential future trends for waste disposal.
Finally, I include a brief discussion of potential growth in shale gas drilling in the
northeastern United States to evaluate future waste volumes in Section III. The study uses
7
current estimated waste production, trends in waste disposal, and future growth scenarios to
consider options for Pennsylvania’s growing wastewater disposal needs.
Methods:
Data were downloaded from the PA DEP oil and gas reporting website. The PA DEP Bureau
of Oil and Gas Management (BOGM) collects data on well production and waste volumes in
accordance with PA law (25 PA §78.121). Well reports are due annually for all wells, including
the production volumes of hydrocarbons, types and volumes of waste, and waste disposal or
reuse information (25 PA §78.121(a)). Well location, well type, and operator identification
information is collected at the time of drilling (25 PA§78.122). The collected data had several
errors that needed to be addressed. The following discusses errors and corrections to the data
prior to analysis.
Information was collected annually from conventional well operators. Marcellus operators
reported annually until March 2010, when a new law required reporting of Marcellus well
production and waste volumes bi-annually (PA S.B. 297). Data from Marcellus wells were
reported twice during the transition in the period from July 2009 to December 2009. Although
the reported gas and waste records overlapped for this period, waste records were not
duplicated in the reported data (Roger Dietz, PA DEP, personal communication). Gas production
was duplicated over the period and required re-calculation. The database included days of
production, allowing estimates of production in the overlapping period.
The data contained numerous wells that reported no production of gas, oil or condensate.
These wells were removed from the analysis, leaving the 2,240 Marcellus wells and 81,718
conventional wells.
Data were reported for each well by waste type and accepting disposal facility for each year.
In a given year a well could produce multiple types of waste and deliver to multiple facilities,
with separate entries for each waste type and facility. In cases where a single volume of
wastewater was sent to multiple facilities, the volume of wastewater appeared to be over-
reported. Several wells recorded the same amount of waste for a single period going to multiple
waste facilities, and, upon closer review, the total waste volumes for these records appeared
8
abnormally high. Considering reasons for this error, the most feasible explanation appears to be
the total volume of waste was reported disposed to each facility, where in reality only a portion
of the waste went to each facility. This would multiply the waste volume generated at any
individual well by the number of facilities used, giving a falsely high waste volume. Given this
assumption the waste amount was divided evenly between all the accepting facilities. The
analysis looked for wells with identical waste volumes during individual periods (yearly or bi-
yearly) being delivered to multiple facilities. For waste deliveries meeting these criteria, the
waste volume was divided by the number of disposal facilities and this new volume was
reported for each facility.
The wells also reported a waste by type, classifying the waste by 8 residual waste codes
defined by the Bureau of Waste Management (BWM 2001). Only 6 of the wastes refer to liquid
waste, Brine, Drilling Waste, Fracking Fracking waste (sometimes called Frac Fluid), Basic
Sediment, Servicing Fluid and Spent Lubricant Waste. A description of these waste types will be
discussed in Section I. All waste types were assumed to be correctly identified in the reporting.
For each waste record, the disposal facility name, address and geographic coordinates were
provided. Additionally, operators reported a ‘Disposal Method’ indicating the type of facility
receiving the waste. Several reported fields for disposal facilities had significant problems.
Common errors included misspellings in the facility name, lack of location information, and
multiple ‘disposal methods’ identified for a single facility. Clean-up of the data focused on
correctly identifying Municipal Treatment Facilities or publically owned treatment works
(POTW), centralized waste treatment facilities (CWT) and injection wells. Similar disposal facility
names and geographic locations were checked against data gathered from Google Earth, the PA
DEP, Argonne National Laboratory, and facility websites.
After correcting the data, statistical analyses were performed to assess differences in
wastewater volumes generated by conventional and Marcellus wells. Because the data were
often non-normally distributed, comparisons were made using 95% bootstrapped confidence
intervals.
To create a timeline of waste disposal, overall waste disposal volumes were totaled by year.
While some conventional wells also produce substantial quantities of oil, all conventional wells
9
were included in the analyses because they all produced varying amounts of natural gas and
because the wastewater is disposed of using the same methods regardless of how much oil a
well produces. The total volumes were analyzed by waste type and year, and compared with a
discussion of regulatory changes in Pennsylvania.
The waste data from 2007 was permanently lost by the PA DEP and was not available for
this analysis.
Section I: Waste Composition and Production
Wastewater is produced continuously throughout drilling, fracturing, and production
phases. At different stages the chemical composition of waste can vary greatly. The wastewater
entered into the Pennsylvania DEP database is separated into 6 categories that indicate what
part of the process the waste is produced in (BWM 2010). The following section will discuss how
waste is generated, estimates of waste volumes, and consider general contaminants for each
waste type. Although the following section will discuss how errors may occur in the labeling of
waste, all of the waste labels are assumed to be correct for this analysis.
Drilling Fluids
The first type of waste is drilling fluid, also called drilling mud. Drilling fluid is used during the
drilling process to lubricate the drill bit, control any upwelling pressure in the well, and support
the well bore while removing drill cuttings (Caen et al. 2012; NYSDEC 2011). There are a variety
of potential drilling fluids that can be used by well operators, including air-based, water-based,
petroleum-based and synthetic-oil (‘food-grade’) based drilling fluids (Caen et al. 2012). In
Pennsylvania the surface area of the well, from the surface to 50 feet below fresh groundwater
or 50 feet into consolidated rock (whichever is deeper), must be drilled with air, freshwater or
freshwater based drilling fluid (25 PA § 78.83(a); 25 PA § 78.83(c)). Below this depth, there are
no regulations requiring or banning the use of any particular type of drilling fluid, but
petroleum-based drilling fluid is rarely used by industry due to environmental protection laws
and costs (OH EPA 2012; Caen et al. 2012). However, the use of petroleum-based muds may
occur in Marcellus shale drilling as they have recently been used in other shale gas fields (Mabile
et al. 2011).
10
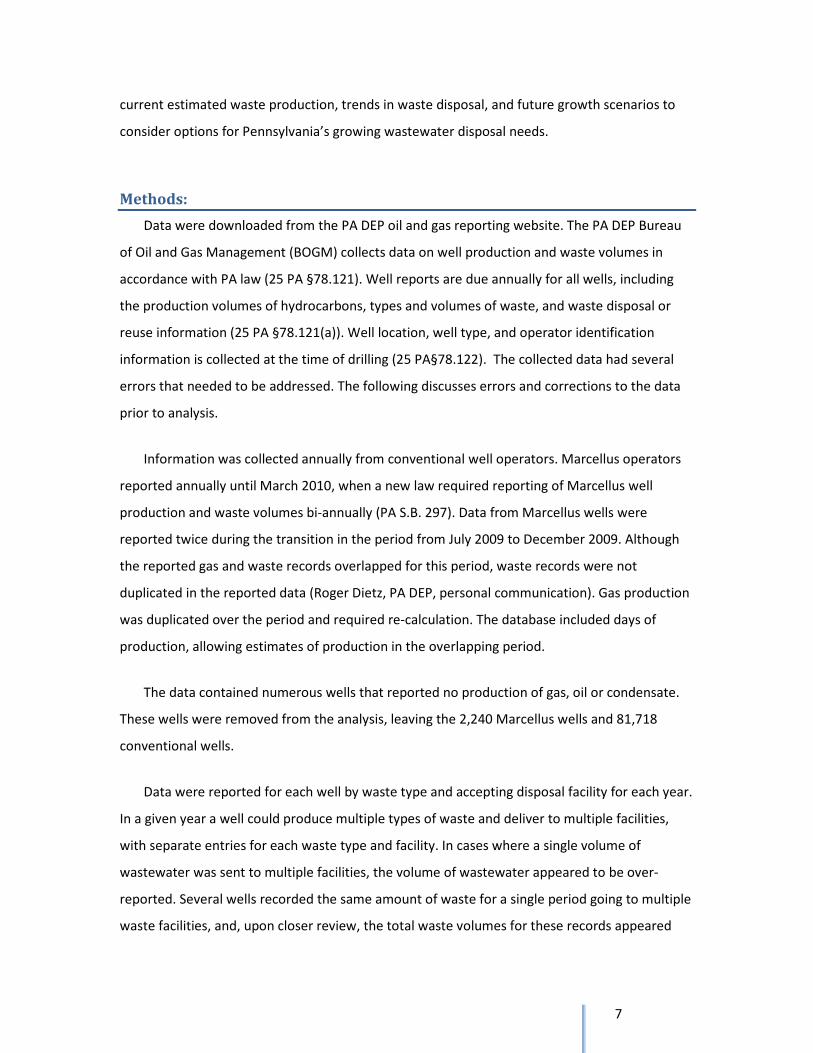
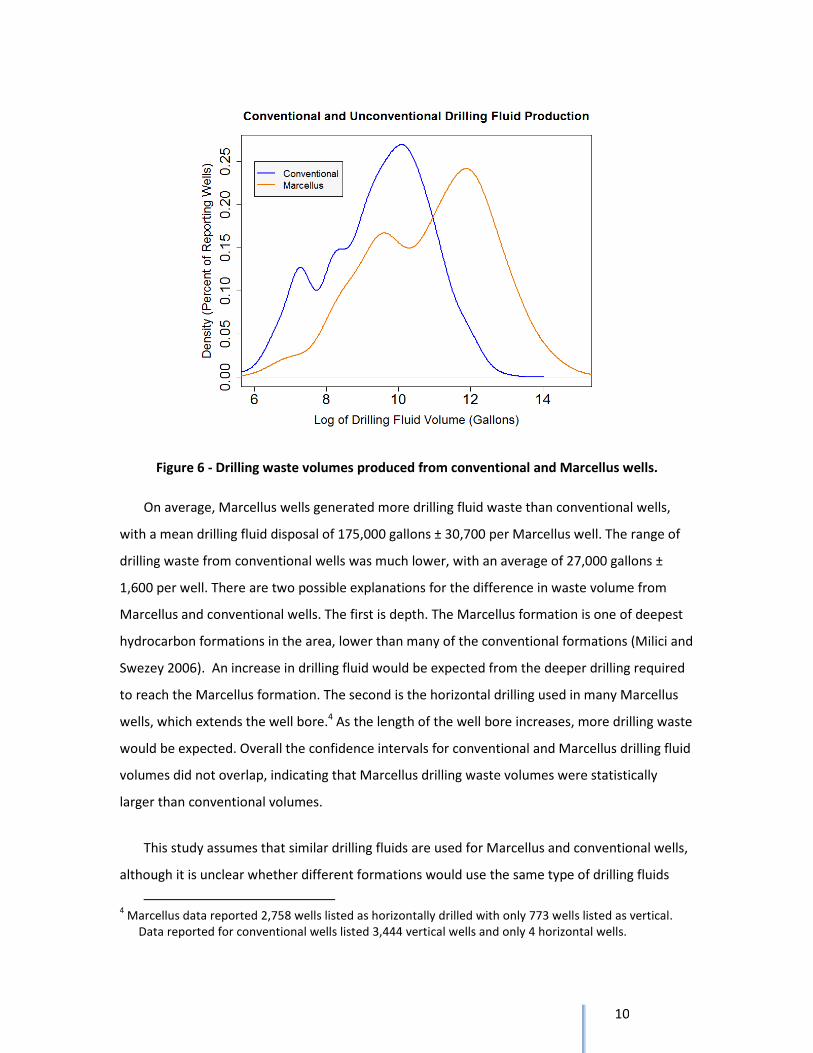
Figure 6 - Drilling waste volumes produced from conventional and Marcellus wells.
On average, Marcellus wells generated more drilling fluid waste than conventional wells,
with a mean drilling fluid disposal of 175,000 gallons ± 30,700 per Marcellus well. The range of
drilling waste from conventional wells was much lower, with an average of 27,000 gallons ±
1,600 per well. There are two possible explanations for the difference in waste volume from
Marcellus and conventional wells. The first is depth. The Marcellus formation is one of deepest
hydrocarbon formations in the area, lower than many of the conventional formations (Milici and
Swezey 2006). An increase in drilling fluid would be expected from the deeper drilling required
to reach the Marcellus formation. The second is the horizontal drilling used in many Marcellus
wells, which extends the well bore.4 As the length of the well bore increases, more drilling waste
would be expected. Overall the confidence intervals for conventional and Marcellus drilling fluid
volumes did not overlap, indicating that Marcellus drilling waste volumes were statistically
larger than conventional volumes.
This study assumes that similar drilling fluids are used for Marcellus and conventional wells,
although it is unclear whether different formations would use the same type of drilling fluids
4 Marcellus data reported 2,758 wells listed as horizontally drilled with only 773 wells listed as vertical.
Data reported for conventional wells listed 3,444 vertical wells and only 4 horizontal wells.
11
(Caen et al. 2012). The analysis of impacts unique to hydraulic fracturing for the supplemental
generic environmental impact statement (SGEIS) prepared by the State of New York indicated
that drilling fluid for hydraulically fractured wells was considered the same as historic drilling
fluid types (NYSDEC 2011). Drilling muds may contain a number of hazardous contaminants,
including heavy metals, organic pollutants, and hydrocarbons (Mall and Donnelly 2010). Drilling
fluids are a one-time volume of waste, produced only during the creation of the well.
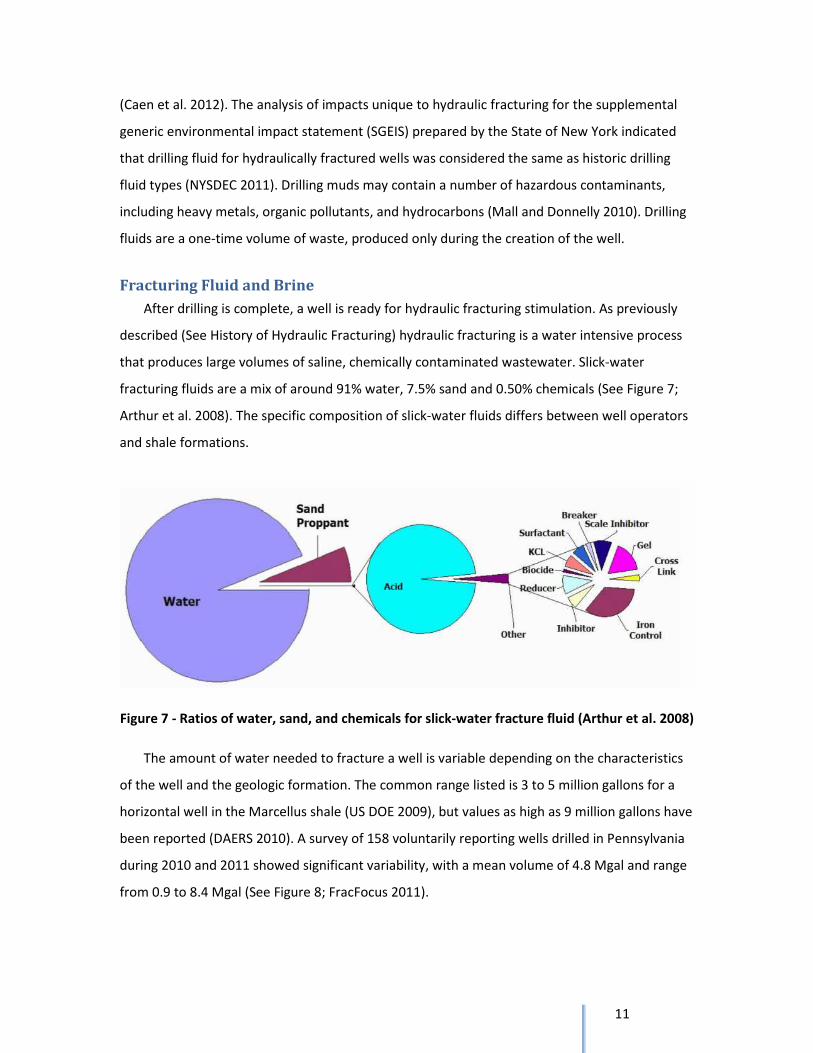
Fracturing Fluid and Brine
After drilling is complete, a well is ready for hydraulic fracturing stimulation. As previously
described (See History of Hydraulic Fracturing) hydraulic fracturing is a water intensive process
that produces large volumes of saline, chemically contaminated wastewater. Slick-water
fracturing fluids are a mix of around 91% water, 7.5% sand and 0.50% chemicals (See Figure 7;
Arthur et al. 2008). The specific composition of slick-water fluids differs between well operators
and shale formations.
Figure 7 - Ratios of water, sand, and chemicals for slick-water fracture fluid (Arthur et al. 2008)
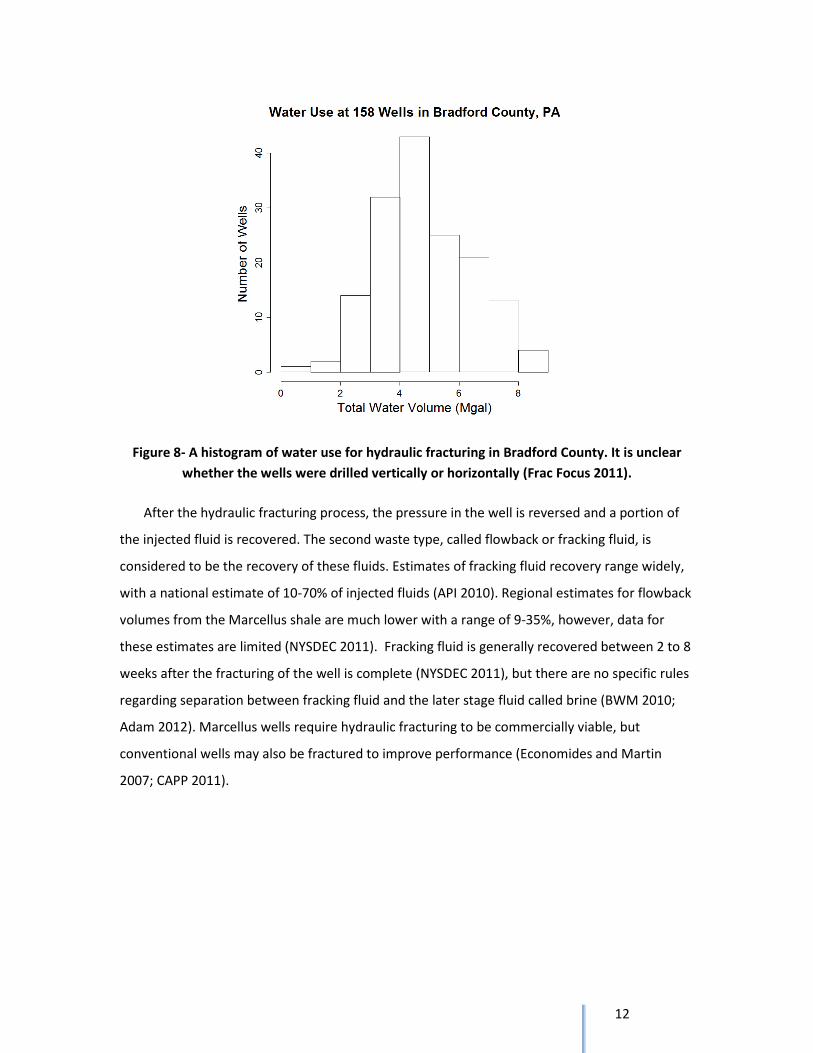
The amount of water needed to fracture a well is variable depending on the characteristics
of the well and the geologic formation. The common range listed is 3 to 5 million gallons for a
horizontal well in the Marcellus shale (US DOE 2009), but values as high as 9 million gallons have
been reported (DAERS 2010). A survey of 158 voluntarily reporting wells drilled in Pennsylvania
during 2010 and 2011 showed significant variability, with a mean volume of 4.8 Mgal and range
from 0.9 to 8.4 Mgal (See Figure 8; FracFocus 2011).
12
Figure 8- A histogram of water use for hydraulic fracturing in Bradford County. It is unclear
whether the wells were drilled vertically or horizontally (Frac Focus 2011).
After the hydraulic fracturing process, the pressure in the well is reversed and a portion of
the injected fluid is recovered. The second waste type, called flowback or fracking fluid, is
considered to be the recovery of these fluids. Estimates of fracking fluid recovery range widely,
with a national estimate of 10-70% of injected fluids (API 2010). Regional estimates for flowback
volumes from the Marcellus shale are much lower with a range of 9-35%, however, data for
these estimates are limited (NYSDEC 2011). Fracking fluid is generally recovered between 2 to 8
weeks after the fracturing of the well is complete (NYSDEC 2011), but there are no specific rules
regarding separation between fracking fluid and the later stage fluid called brine (BWM 2010;
Adam 2012). Marcellus wells require hydraulic fracturing to be commercially viable, but
conventional wells may also be fractured to improve performance (Economides and Martin
2007; CAPP 2011).
13
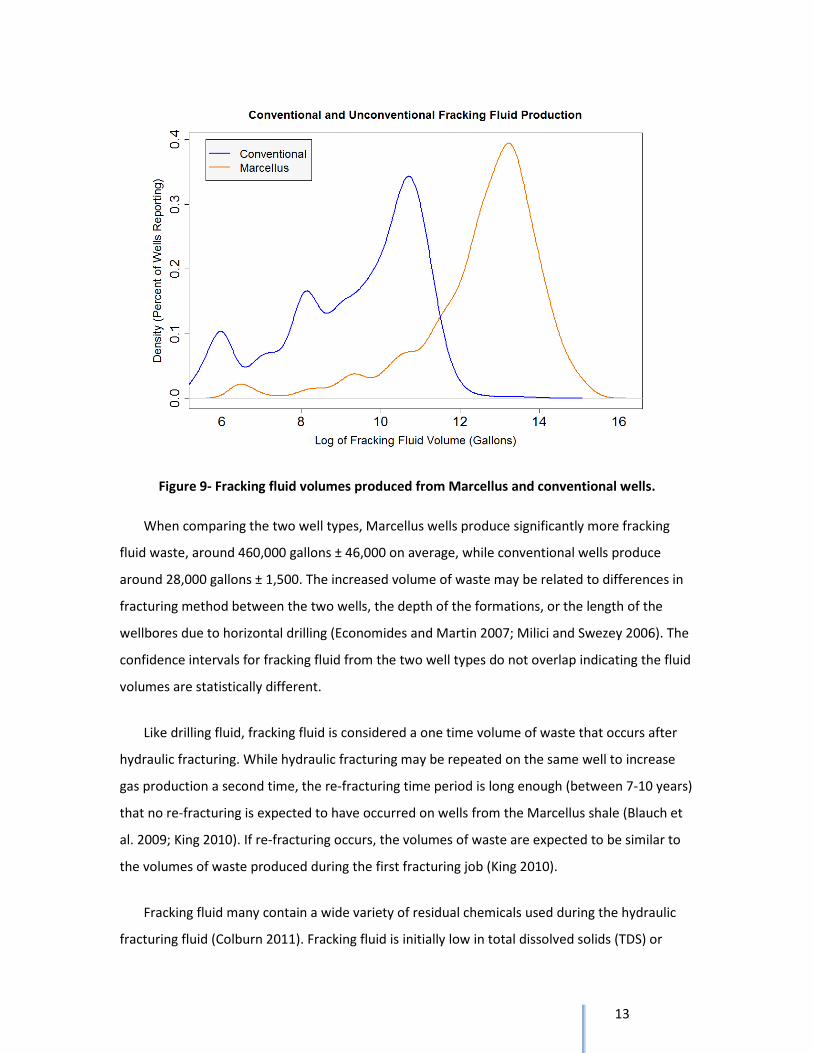
Figure 9- Fracking fluid volumes produced from Marcellus and conventional wells.
When comparing the two well types, Marcellus wells produce significantly more fracking
fluid waste, around 460,000 gallons ± 46,000 on average, while conventional wells produce
around 28,000 gallons ± 1,500. The increased volume of waste may be related to differences in
fracturing method between the two wells, the depth of the formations, or the length of the
wellbores due to horizontal drilling (Economides and Martin 2007; Milici and Swezey 2006). The
confidence intervals for fracking fluid from the two well types do not overlap indicating the fluid
volumes are statistically different.
Like drilling fluid, fracking fluid is considered a one time volume of waste that occurs after
hydraulic fracturing. While hydraulic fracturing may be repeated on the same well to increase
gas production a second time, the re-fracturing time period is long enough (between 7-10 years)
that no re-fracturing is expected to have occurred on wells from the Marcellus shale (Blauch et
al. 2009; King 2010). If re-fracturing occurs, the volumes of waste are expected to be similar to
the volumes of waste produced during the first fracturing job (King 2010).
Fracking fluid many contain a wide variety of residual chemicals used during the hydraulic
fracturing fluid (Colburn 2011). Fracking fluid is initially low in total dissolved solids (TDS) or
14
salts, naturally occurring radioactive material (NORM), and heavy metals similar to the fluid
injected into the well. Overtime the fracking fluid becomes a saline brine through contact with
the rocks and mixing with in situ formation fluids (Blauch et al. 2009). The shift from fracking
fluid to brine, the final type of waste fluid produced, occurs gradually and with separation
determined by the well operator (J. Adams, personal communication, March 8, 2012).
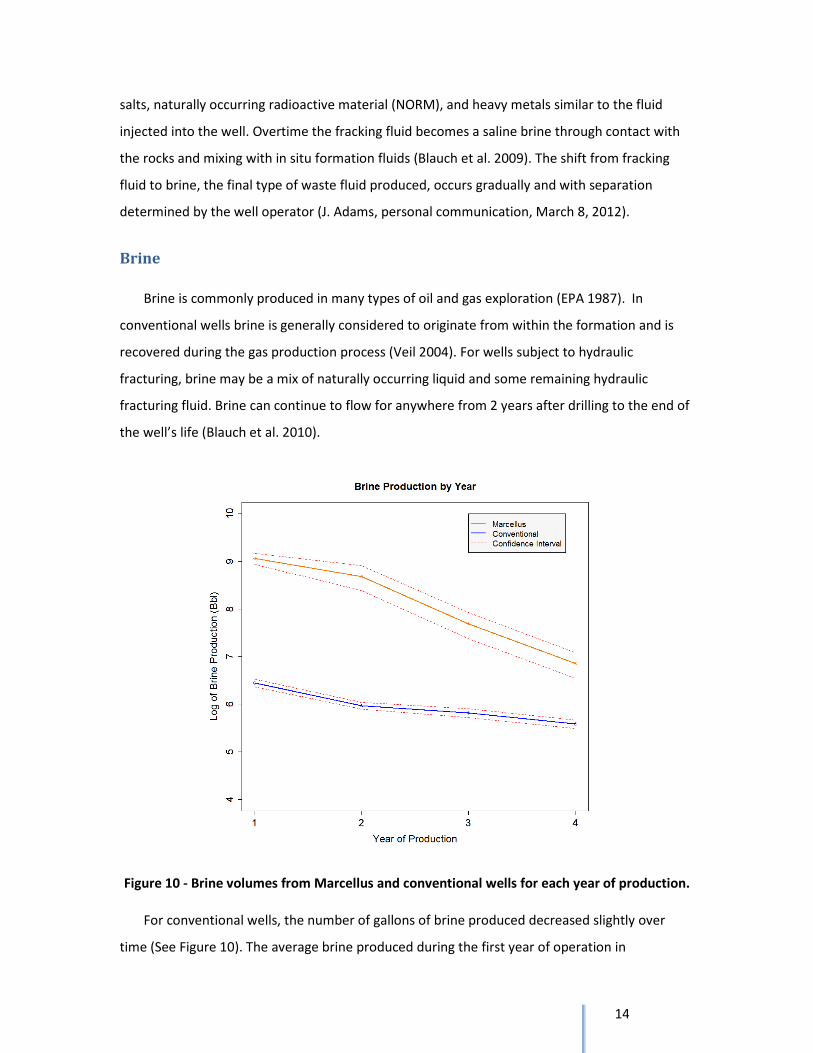
Brine
Brine is commonly produced in many types of oil and gas exploration (EPA 1987). In
conventional wells brine is generally considered to originate from within the formation and is
recovered during the gas production process (Veil 2004). For wells subject to hydraulic
fracturing, brine may be a mix of naturally occurring liquid and some remaining hydraulic
fracturing fluid. Brine can continue to flow for anywhere from 2 years after drilling to the end of
the well’s life (Blauch et al. 2010).
Figure 10 - Brine volumes from Marcellus and conventional wells for each year of production.
For conventional wells, the number of gallons of brine produced decreased slightly over
time (See Figure 10). The average brine produced during the first year of operation in
15
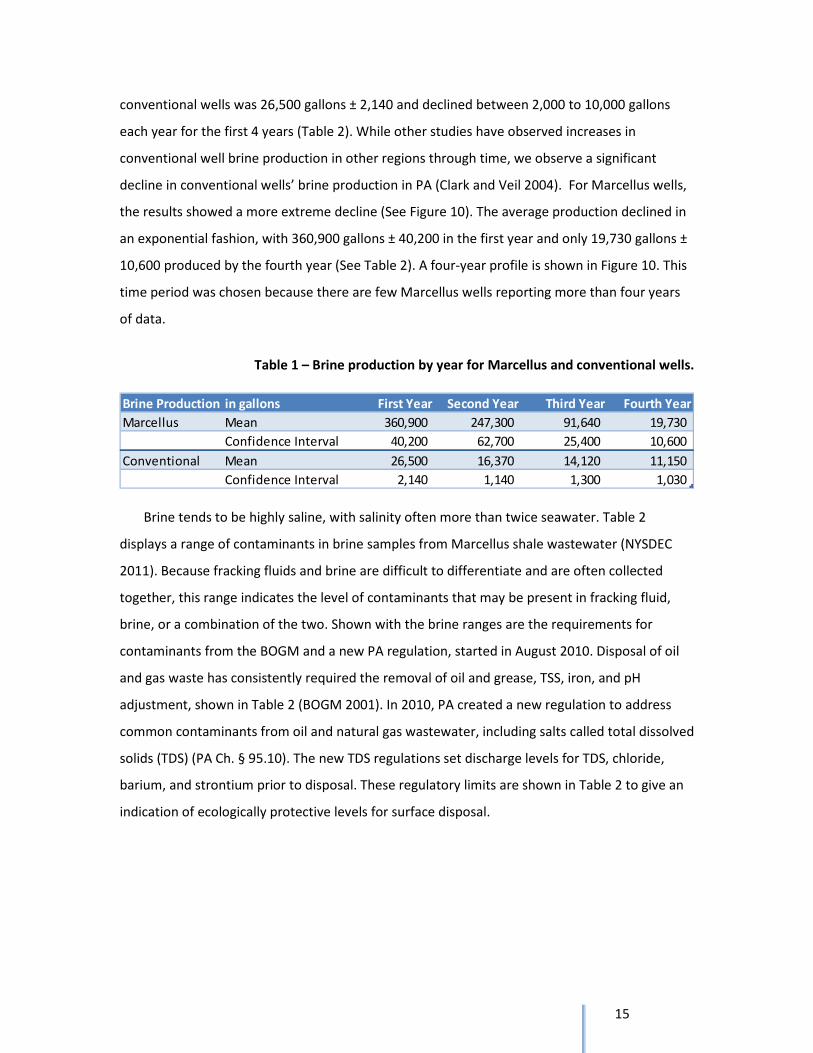
conventional wells was 26,500 gallons ± 2,140 and declined between 2,000 to 10,000 gallons
each year for the first 4 years (Table 2). While other studies have observed increases in
conventional well brine production in other regions through time, we observe a significant
decline in conventional wells’ brine production in PA (Clark and Veil 2004). For Marcellus wells,
the results showed a more extreme decline (See Figure 10). The average production declined in
an exponential fashion, with 360,900 gallons ± 40,200 in the first year and only 19,730 gallons ±
10,600 produced by the fourth year (See Table 2). A four-year profile is shown in Figure 10. This
time period was chosen because there are few Marcellus wells reporting more than four years
of data.
Table 1 – Brine production by year for Marcellus and conventional wells.
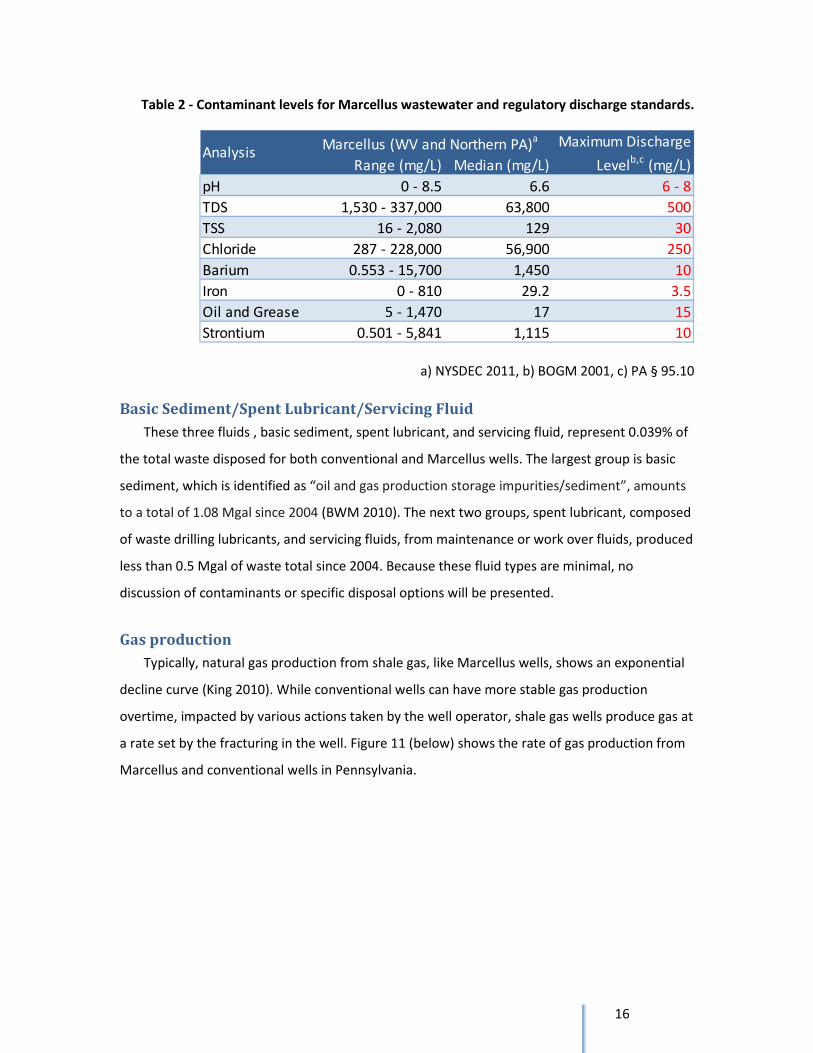
Brine tends to be highly saline, with salinity often more than twice seawater. Table 2
displays a range of contaminants in brine samples from Marcellus shale wastewater (NYSDEC
2011). Because fracking fluids and brine are difficult to differentiate and are often collected
together, this range indicates the level of contaminants that may be present in fracking fluid,
brine, or a combination of the two. Shown with the brine ranges are the requirements for
contaminants from the BOGM and a new PA regulation, started in August 2010. Disposal of oil
and gas waste has consistently required the removal of oil and grease, TSS, iron, and pH
adjustment, shown in Table 2 (BOGM 2001). In 2010, PA created a new regulation to address
common contaminants from oil and natural gas wastewater, including salts called total dissolved
solids (TDS) (PA Ch. § 95.10). The new TDS regulations set discharge levels for TDS, chloride,
barium, and strontium prior to disposal. These regulatory limits are shown in Table 2 to give an
indication of ecologically protective levels for surface disposal.
Brine Production in gallons First Year Second Year Third Year Fourth Year
Marcellus Mean 360,900 247,300 91,640 19,730
Confidence Interval 40,200 62,700 25,400 10,600
Conventional Mean 26,500 16,370 14,120 11,150
Confidence Interval 2,140 1,140 1,300 1,030
16
Table 2 - Contaminant levels for Marcellus wastewater and regulatory discharge standards.
a) NYSDEC 2011, b) BOGM 2001, c) PA § 95.10
Basic Sediment/Spent Lubricant/Servicing Fluid
These three fluids , basic sediment, spent lubricant, and servicing fluid, represent 0.039% of
the total waste disposed for both conventional and Marcellus wells. The largest group is basic
sediment, which is identified as “oil and gas production storage impurities/sediment”, amounts
to a total of 1.08 Mgal since 2004 (BWM 2010). The next two groups, spent lubricant, composed
of waste drilling lubricants, and servicing fluids, from maintenance or work over fluids, produced
less than 0.5 Mgal of waste total since 2004. Because these fluid types are minimal, no
discussion of contaminants or specific disposal options will be presented.
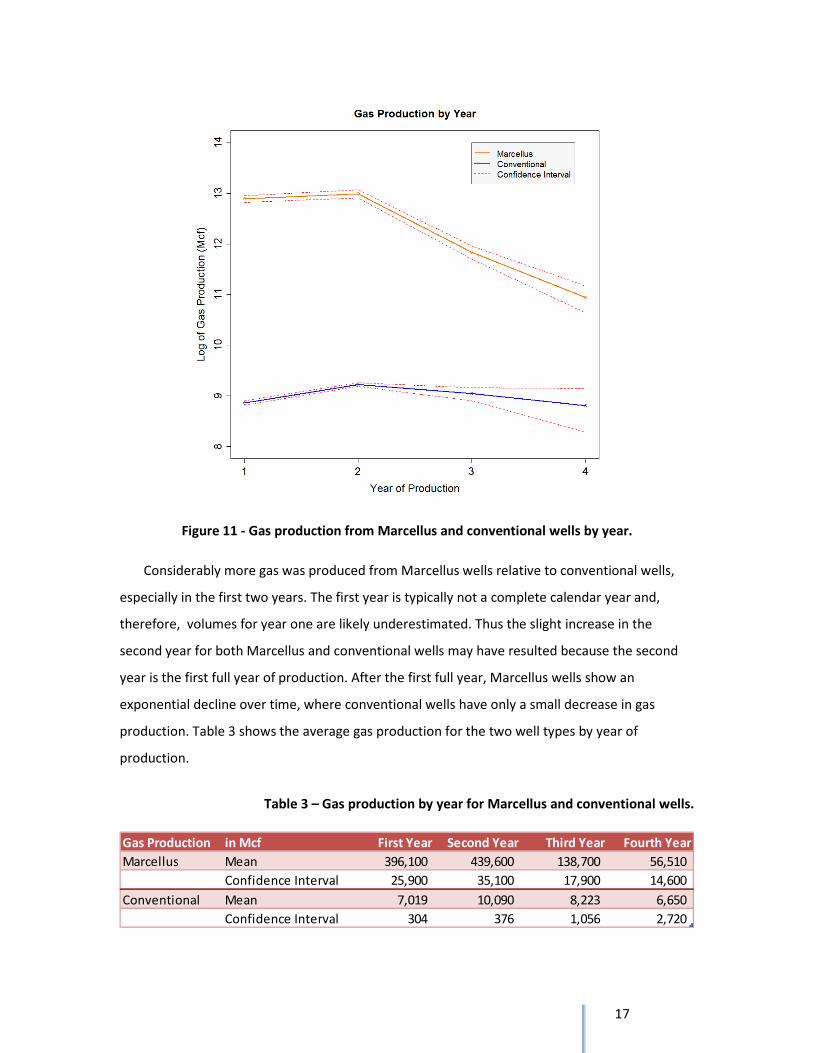
Gas production
Typically, natural gas production from shale gas, like Marcellus wells, shows an exponential
decline curve (King 2010). While conventional wells can have more stable gas production
overtime, impacted by various actions taken by the well operator, shale gas wells produce gas at
a rate set by the fracturing in the well. Figure 11 (below) shows the rate of gas production from
Marcellus and conventional wells in Pennsylvania.
Range (mg/L) Median (mg/L)
pH 0 - 8.5 6.6 6 - 8
TDS 1,530 - 337,000 63,800 500
TSS 16 - 2,080 129 30
Chloride 287 - 228,000 56,900 250
Barium 0.553 - 15,700 1,450 10
Iron 0 - 810 29.2 3.5
Oil and Grease 5 - 1,470 17 15
Strontium 0.501 - 5,841 1,115 10
AnalysisMaximum Discharge
Levelb,c
(mg/L)
Marcellus (WV and Northern PA)a
17
Figure 11 - Gas production from Marcellus and conventional wells by year.
Considerably more gas was produced from Marcellus wells relative to conventional wells,
especially in the first two years. The first year is typically not a complete calendar year and,
therefore, volumes for year one are likely underestimated. Thus the slight increase in the
second year for both Marcellus and conventional wells may have resulted because the second
year is the first full year of production. After the first full year, Marcellus wells show an
exponential decline over time, where conventional wells have only a small decrease in gas
production. Table 3 shows the average gas production for the two well types by year of
production.
Table 3 – Gas production by year for Marcellus and conventional wells.
Gas Production in Mcf First Year Second Year Third Year Fourth Year
Marcellus Mean 396,100 439,600 138,700 56,510
Confidence Interval 25,900 35,100 17,900 14,600
Conventional Mean 7,019 10,090 8,223 6,650
Confidence Interval 304 376 1,056 2,720
18
Section I – Conclusions on Waste Volume Production
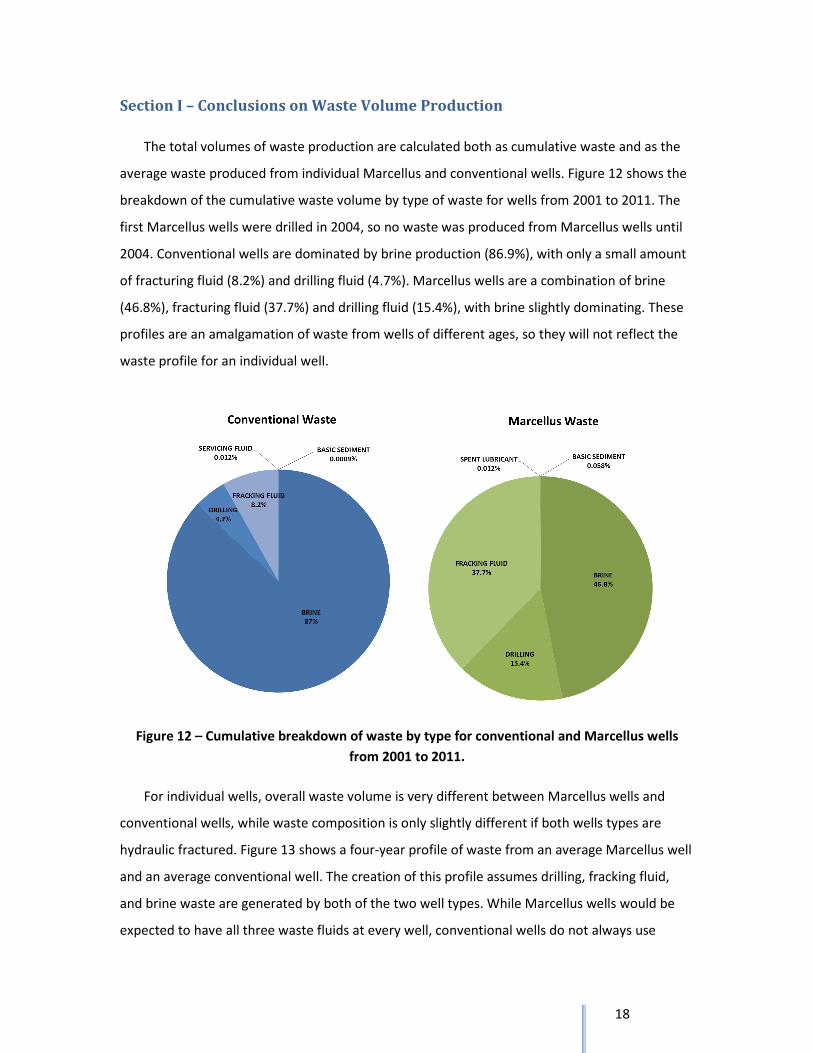
The total volumes of waste production are calculated both as cumulative waste and as the
average waste produced from individual Marcellus and conventional wells. Figure 12 shows the
breakdown of the cumulative waste volume by type of waste for wells from 2001 to 2011. The
first Marcellus wells were drilled in 2004, so no waste was produced from Marcellus wells until
2004. Conventional wells are dominated by brine production (86.9%), with only a small amount
of fracturing fluid (8.2%) and drilling fluid (4.7%). Marcellus wells are a combination of brine
(46.8%), fracturing fluid (37.7%) and drilling fluid (15.4%), with brine slightly dominating. These
profiles are an amalgamation of waste from wells of different ages, so they will not reflect the
waste profile for an individual well.
Figure 12 – Cumulative breakdown of waste by type for conventional and Marcellus wells
from 2001 to 2011.
For individual wells, overall waste volume is very different between Marcellus wells and
conventional wells, while waste composition is only slightly different if both wells types are
hydraulic fractured. Figure 13 shows a four-year profile of waste from an average Marcellus well
and an average conventional well. The creation of this profile assumes drilling, fracking fluid,
and brine waste are generated by both of the two well types. While Marcellus wells would be
expected to have all three waste fluids at every well, conventional wells do not always use
19
hydraulic fracturing and may not generate fracking fluid waste (Economides and Martin 2007).
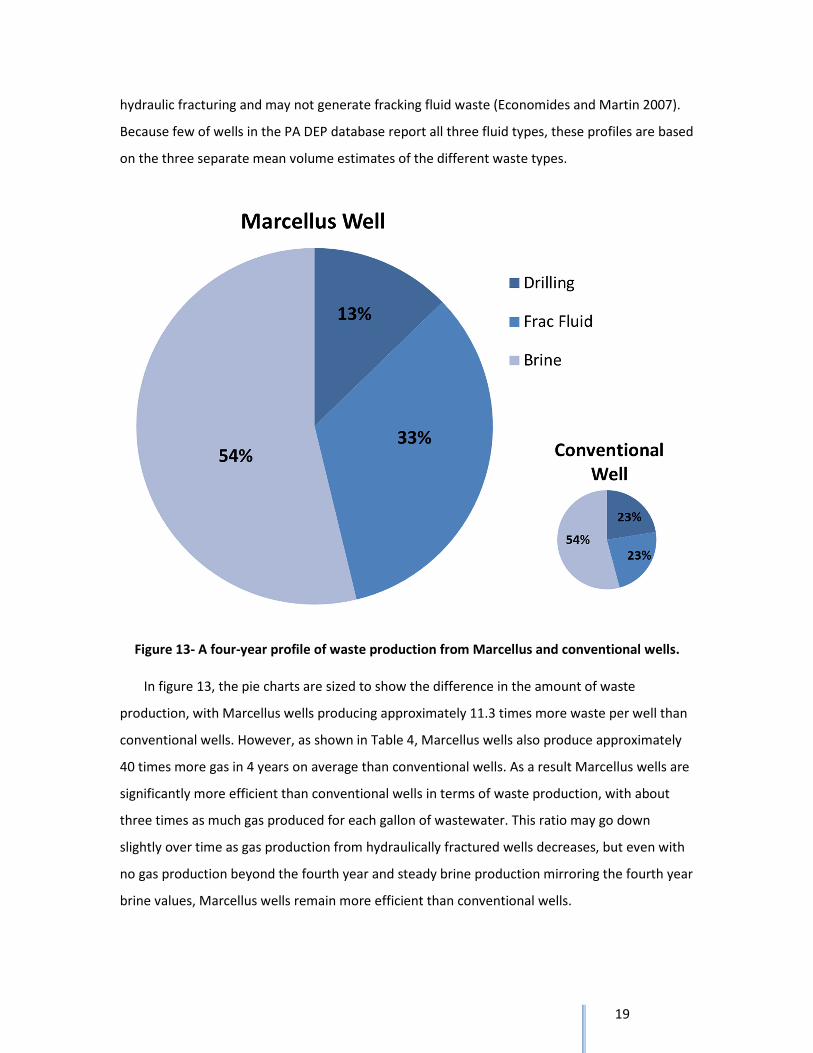
Because few of wells in the PA DEP database report all three fluid types, these profiles are based
on the three separate mean volume estimates of the different waste types.
Figure 13- A four-year profile of waste production from Marcellus and conventional wells.
In figure 13, the pie charts are sized to show the difference in the amount of waste
production, with Marcellus wells producing approximately 11.3 times more waste per well than
conventional wells. However, as shown in Table 4, Marcellus wells also produce approximately
40 times more gas in 4 years on average than conventional wells. As a result Marcellus wells are
significantly more efficient than conventional wells in terms of waste production, with about
three times as much gas produced for each gallon of wastewater. This ratio may go down
slightly over time as gas production from hydraulically fractured wells decreases, but even with
no gas production beyond the fourth year and steady brine production mirroring the fourth year
brine values, Marcellus wells remain more efficient than conventional wells.
20
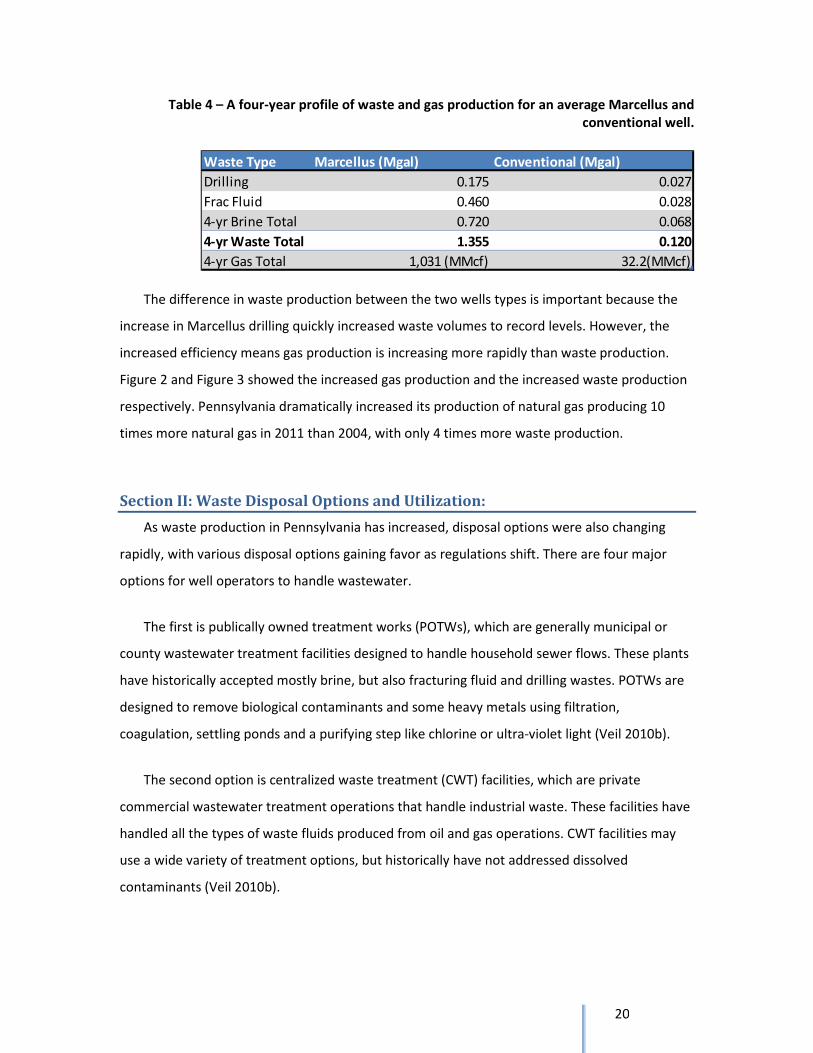
Table 4 – A four-year profile of waste and gas production for an average Marcellus and
conventional well.
The difference in waste production between the two wells types is important because the
increase in Marcellus drilling quickly increased waste volumes to record levels. However, the
increased efficiency means gas production is increasing more rapidly than waste production.
Figure 2 and Figure 3 showed the increased gas production and the increased waste production
respectively. Pennsylvania dramatically increased its production of natural gas producing 10
times more natural gas in 2011 than 2004, with only 4 times more waste production.
Section II: Waste Disposal Options and Utilization:
As waste production in Pennsylvania has increased, disposal options were also changing
rapidly, with various disposal options gaining favor as regulations shift. There are four major
options for well operators to handle wastewater.
The first is publically owned treatment works (POTWs), which are generally municipal or
county wastewater treatment facilities designed to handle household sewer flows. These plants
have historically accepted mostly brine, but also fracturing fluid and drilling wastes. POTWs are
designed to remove biological contaminants and some heavy metals using filtration,
coagulation, settling ponds and a purifying step like chlorine or ultra-violet light (Veil 2010b).
The second option is centralized waste treatment (CWT) facilities, which are private
commercial wastewater treatment operations that handle industrial waste. These facilities have
handled all the types of waste fluids produced from oil and gas operations. CWT facilities may
use a wide variety of treatment options, but historically have not addressed dissolved
contaminants (Veil 2010b).
Waste Type Marcellus (Mgal) Conventional (Mgal)
Drilling 0.175 0.027
Frac Fluid 0.460 0.028
4-yr Brine Total 0.720 0.068
4-yr Waste Total 1.355 0.120
4-yr Gas Total 1,031 (MMcf) 32.2(MMcf)
21
The third option is injection wells, where waste is injected into a deep subsurface formation
for permanently disposal. Injection wells are not impacted by waste type or contaminants
during disposal.
The fourth option is recycling, where wastewater is blended with fresh water and hydraulic
fracturing chemicals for use in subsequent hydraulic fracture treatments. Recycling is growing in
popularity, but has limitations on the amounts of TDS, barium and other contaminants that can
be present for the waste to acceptable for reuse in hydraulic fracturing fluids (NYSDEC 2011).
Recycling waste is easiest when it has low concentrations of TDS and heavy metals, such as
fracturing fluid, but may also be used for brine or drilling fluid if the waste is treated.
In choosing disposal options it is important to note that these waste fluids are being handled
and disposed of as non-hazardous waste, although in some cases the wastes may contain
hazardous materials that pose a risk to human health (EPA 1987). The hazardous materials
present in wastes are regulated under the Resource Conservation and Recovery Act (RCRA),
which classifies waste as hazardous (subtitle C) or non-hazardous (subtitle D) (40 CFR Part 261).
Although oil and gas waste fluids often contain contaminants that are considered hazardous or
may have hazardous characteristics, Congress specifically exempted these wastes from a
hazardous classification in the Solid Waste Disposal Act Amendments section 3001(b)(2)(A) (EPA
1987; SWDA 3001(b)(2)(A)).
The implications of this exemption for waste disposal from oil and gas exploration are
profound for both disposal and handling of waste fluids. Without this exemption it is unclear
whether either conventional or Marcellus production wastes could be disposed at POTW or
landfills, and CWT facilities would not be allowed to treat the waste as it is currently being
managed.
Another result of this classification is that the majority of the solid waste material from
drilling and production, as it is not considered hazardous material, can be disposed of onsite
with appropriate permits (PA Ch. 25§ 78.62). Waste disposed of onsite must be solid material
that has limited hazardous leaching properties (PA Ch. 25§ 78.62(b)). Only limited solid waste
products are disposed of offsite from oil and gas drillers in Pennsylvania, less than 1 million tons
a year of solid waste generally.
22
A Timeline of Waste Disposal from PA Wells
Historically, the major disposal option used by oil and gas operators in Pennsylvania was
treatment and disposal to surface waters. From 2001 to 2004, the majority of waste disposal
was handled by CWT, with some reliance on a variety of other disposal options including
POTWs, injection wells, and reuse. Effluent limits for oil and gas waste at POTW and CWT
facilities followed state and federal guidelines, with mandatory requirements for total
suspended solids (TSS), oil and grease, total iron, acidity, and pH (BOGM 2001; 40 CFR 435.32).
Waste volumes during this time were relatively small with approximately 144 Mgal ± 17.4
produced each year. In 2004 and 2005 waste volumes began to increase with a dramatic jump in
2008 to 428 Mgal, more than double the historic disposal volumes. The increase was driven by
both record breaking natural gas prices and the increasing exploration of the Marcellus shale,
using advanced drilling techniques, driving up both conventional and Marcellus waste volumes.
The 2008 surge in waste alerted Pennsylvania to the first major regulatory issue in oil and gas
waste disposal.
Even meeting the state and federal discharge requirements, many POTWs and CWTs are not
designed to remove common conventional pollutants found in produced water. The most
important are the extremely high concentrations of TDS (See Section II). In 2010, the National
Energy Technology Laboratory (NETL) conducted a survey of POTW and CWT facilities that
accept Marcellus wastewater (Veil 2010). The survey contacted 18 out of the 32 POTWs shown
to be accepting oil and gas wastewater5 and found none of the 18 POTWs surveyed removed
TDS during treatment (Veil 2010). Given the types of treatment that are required for the
removal of TDS, it is assumed that none of the POTW plants have any TDS removal treatment.
The survey also contacted many of the largest CWT facilities as well. For the ten largest CWT
facilities, processing approximately 90% of wastewater sent to CWT, only 1 had installed a pre-
treatment plan that removed TDS and chlorides (Veil 2010b).
5 The PA DEP database listed 32 POTW facilities accepting oil and gas wastewater.
23
Publically Owned Treatment Works (POTWs):
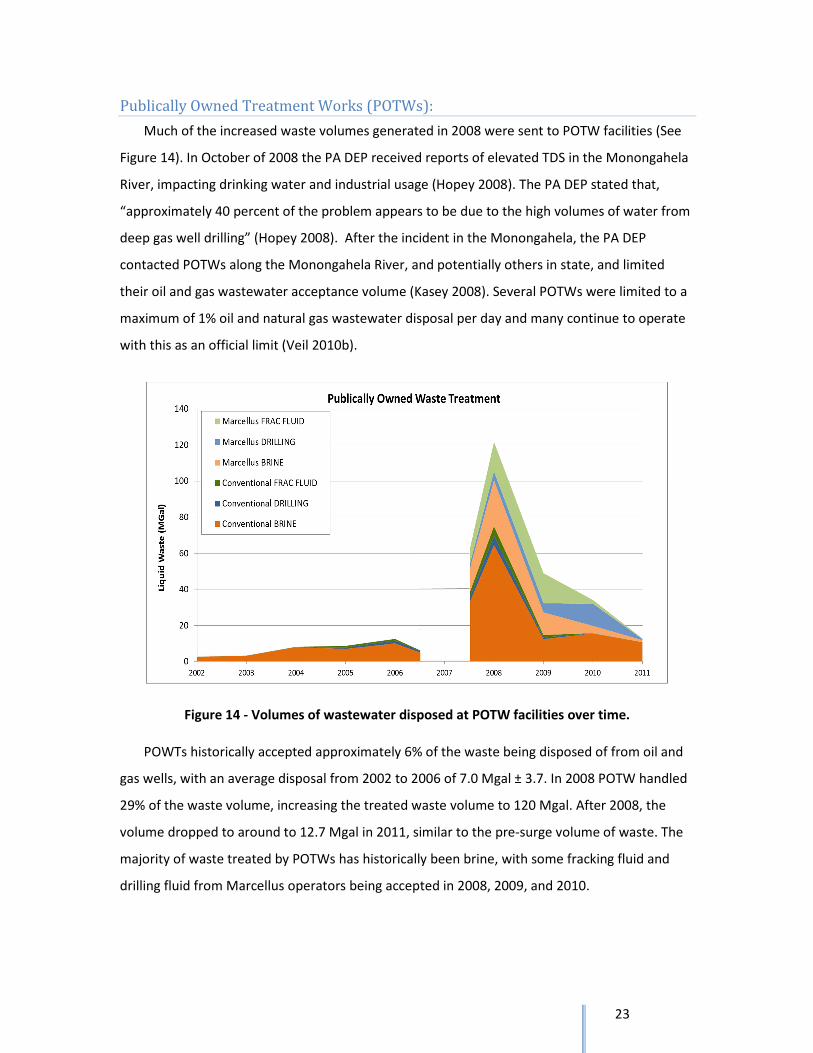
Much of the increased waste volumes generated in 2008 were sent to POTW facilities (See
Figure 14). In October of 2008 the PA DEP received reports of elevated TDS in the Monongahela
River, impacting drinking water and industrial usage (Hopey 2008). The PA DEP stated that,
“approximately 40 percent of the problem appears to be due to the high volumes of water from
deep gas well drilling” (Hopey 2008). After the incident in the Monongahela, the PA DEP
contacted POTWs along the Monongahela River, and potentially others in state, and limited
their oil and gas wastewater acceptance volume (Kasey 2008). Several POTWs were limited to a
maximum of 1% oil and natural gas wastewater disposal per day and many continue to operate
with this as an official limit (Veil 2010b).
Figure 14 - Volumes of wastewater disposed at POTW facilities over time.
POWTs historically accepted approximately 6% of the waste being disposed of from oil and
gas wells, with an average disposal from 2002 to 2006 of 7.0 Mgal ± 3.7. In 2008 POTW handled
29% of the waste volume, increasing the treated waste volume to 120 Mgal. After 2008, the
volume dropped to around to 12.7 Mgal in 2011, similar to the pre-surge volume of waste. The
majority of waste treated by POTWs has historically been brine, with some fracking fluid and
drilling fluid from Marcellus operators being accepted in 2008, 2009, and 2010.
24
Centralized Waste Treatment (CWTs):
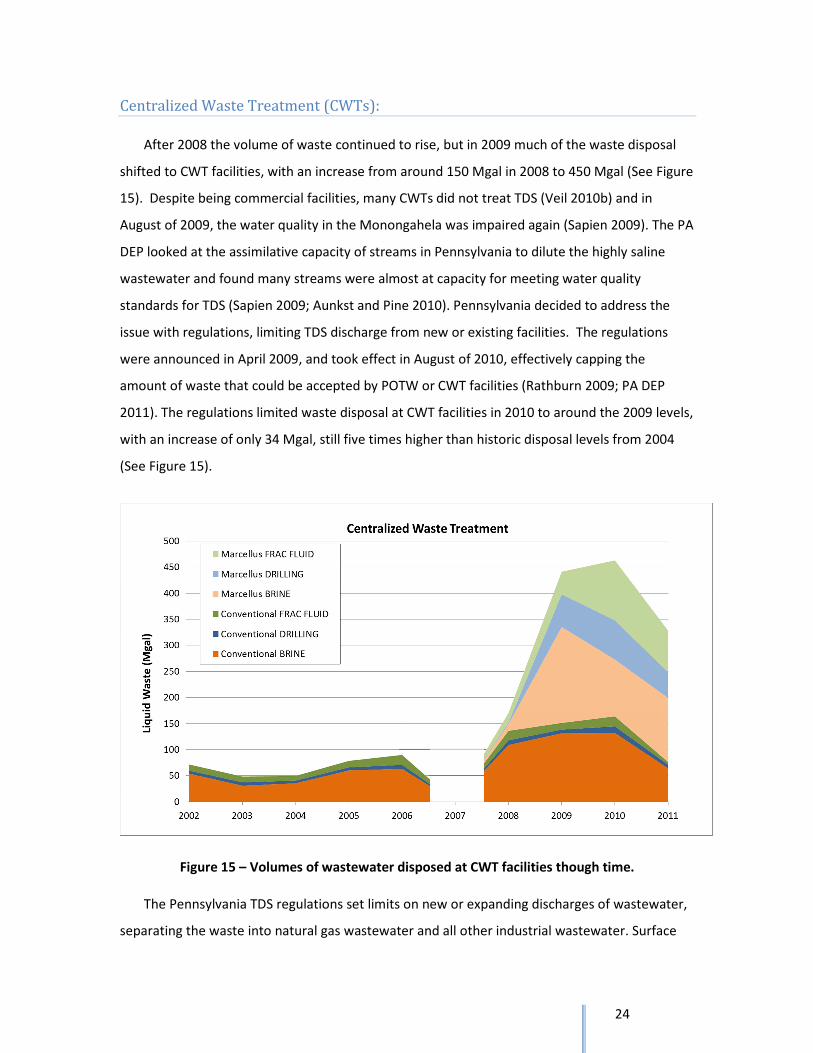
After 2008 the volume of waste continued to rise, but in 2009 much of the waste disposal
shifted to CWT facilities, with an increase from around 150 Mgal in 2008 to 450 Mgal (See Figure
15). Despite being commercial facilities, many CWTs did not treat TDS (Veil 2010b) and in
August of 2009, the water quality in the Monongahela was impaired again (Sapien 2009). The PA
DEP looked at the assimilative capacity of streams in Pennsylvania to dilute the highly saline
wastewater and found many streams were almost at capacity for meeting water quality
standards for TDS (Sapien 2009; Aunkst and Pine 2010). Pennsylvania decided to address the
issue with regulations, limiting TDS discharge from new or existing facilities. The regulations
were announced in April 2009, and took effect in August of 2010, effectively capping the
amount of waste that could be accepted by POTW or CWT facilities (Rathburn 2009; PA DEP
2011). The regulations limited waste disposal at CWT facilities in 2010 to around the 2009 levels,
with an increase of only 34 Mgal, still five times higher than historic disposal levels from 2004
(See Figure 15).
Figure 15 – Volumes of wastewater disposed at CWT facilities though time.
The Pennsylvania TDS regulations set limits on new or expanding discharges of wastewater,
separating the waste into natural gas wastewater and all other industrial wastewater. Surface
25
discharges of waste from natural gas wells must have TDS less than 500mg/L, chloride less than
250 mg/L, and strontium and barium less than 10mg/L (PA 95.10). The new discharges must also
comply with New Source Performance Standard under 40 CFR 437.45(b), the standards for CWT
accepting several types of industrial waste. These standards cover a suite of metals, organics,
and some conventional parameters (40 CFR 437.45(b)).
The TDS regulations address only new and expanding loading of TDS. All previously
permitted sources, called ‘grandfathered’ facilities, are allowed to continue discharging, until an
expansion (>5,000 mg/L average per day increase) occurs (PA DEP 2011). Because the majority
of CWT and POTW facilities did not have TDS criteria in their discharge permits, PA DEP used
historic data to estimate the TDS loading from the facilities.
The Wave of the Future
As natural gas drilling expanded it became clear that surface water disposal was having a
negative impact on water quality (Spear and Kenderes 2009). While the historic amount of oil
and gas wastewater could be assimilated into streams without damage, the increased volumes
of waste could no longer be diluted for disposal. State and federal regulatory agencies focused
on reducing wastewater discharges to surface waters.
In 2011 the EPA addressed pretreatment requirements for waste sent to POTWs, designed
to prevent damage to the facility or the release of untreated pollutants. The EPA argues that oil
and gas waste fails both the pass-through requirement, which bans the flow of pollution that
passes through the waste treatment facility unchanged (40 CFR 403.3(p)), and interference,
where waste either inhibits the treatment process or affects the disposal of sewage sludge (40
CFR 403.3(k)). The first argument, that TDS is a pass-through pollutant, may have been negated
by Pennsylvania’s authorizing TDS levels for POTW plants through the 2010 TDS regulations (40
CFR 403.5(a)(2)(ii)). However, the argument that oil and gas wastewater may cause interference,
harming the biological processes in POTW plants and reducing the effectiveness of biological
treatments, is still valid (Hanlon 2011). Because the EPA regulates waste to POTWs at a national
level, disposal at POTWs may be soon be barred in all states, a consideration for others in the
northeastern region with limited waste disposal options (Hanlon 2011).
26
The PA DEP also identified additional contaminants of concern in oil and gas wastewater. In
April 2011, the PA DEP requested that drilling operators voluntarily cease delivering wastewater
to 15 ‘grandfathered’ POTW and CWT facilities (Perry 2011).6 A study of downstream impacts
from a facility had shown elevated bromide levels in state waters (Perry 2011). Elevated
bromide levels have been shown to increase cancer causing disinfection byproducts at water
treatment facilities (Pressman et al. 2010; Perry 2011).
Although some ‘grandfathered’ facilities are still discharging oil and gas wastewater to
streams without treatment, the regulatory focus is driving a shift to other waste disposal
options. Of the developing disposal options two were already in use, injection wells and reuse,
and a third option, CWT or mobile treatment units that can reduce TDS, became available very
recently.
Underground Injection Wells
Underground inject is the mostly commonly used disposal method for onshore oil and gas
wastewater, but underground injection wells are limited in Pennsylvania, with only 6 operating
wells (Clark and Veil 2004; Johnson 2011). Pennsylvania may have additional capacity for
injection wells, but it uses many underground areas for natural gas storage, with the majority of
potential injection well sites already in use for other purposes (GMSAC 2011).
Ohio has significant number of injection wells and is the major acceptor waste for injection
disposal. Based on the analysis of injection well disposal sites included in the database, Ohio
accepts 92% of injected waste. West Virginia has identified only 2 commercial injection disposal
wells (Manchin 2010) and has limited records for injection well disposal volumes, accepting only
3% of injection well waste.
Costs have been rising for waste injection in Ohio, with a regulation in 2010 that increased
the disposal price from $0.05 per barrel to $0.20 per Bbl for out of ‘region’ waste (OLSO 2010).
Additionally, a series of earthquakes were linked to an injection well in Youngstown, leading to
stricter regulations and mounting public concern (OH DNR 2012).
6 See Appendix A for the list of operators.
27
Figure 16 – Injection well disposal volumes of oil and gas wastewater through time.
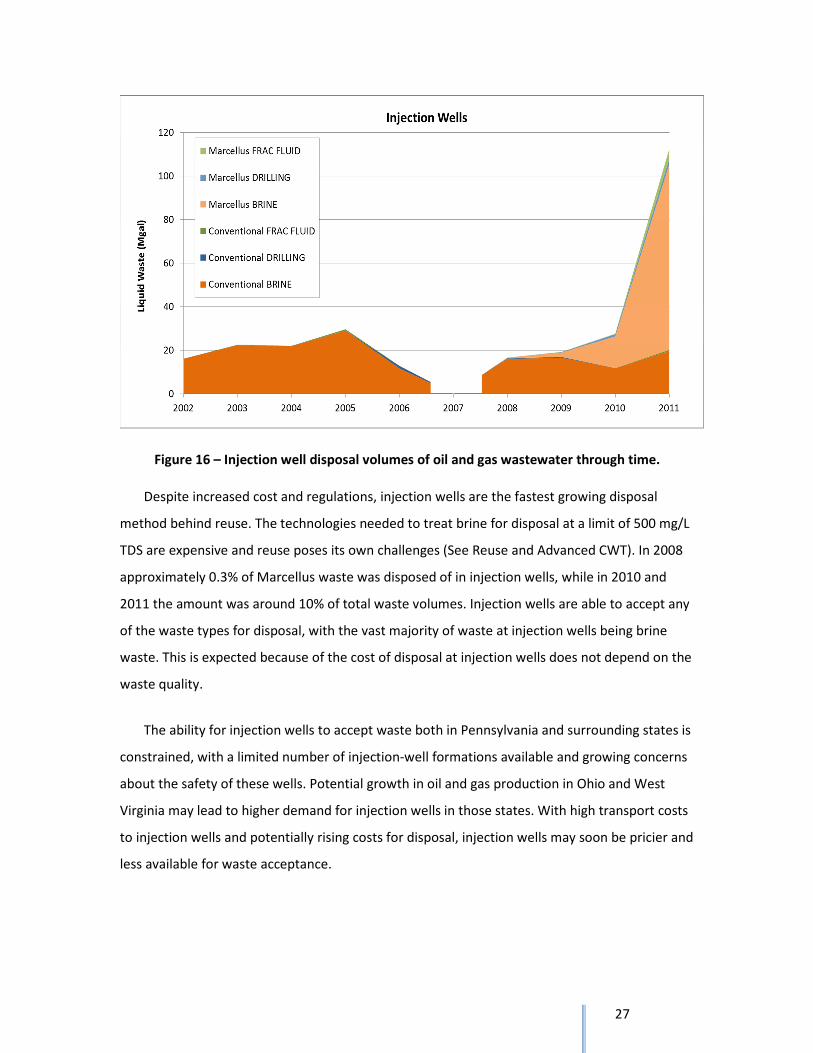
Despite increased cost and regulations, injection wells are the fastest growing disposal
method behind reuse. The technologies needed to treat brine for disposal at a limit of 500 mg/L
TDS are expensive and reuse poses its own challenges (See Reuse and Advanced CWT). In 2008
approximately 0.3% of Marcellus waste was disposed of in injection wells, while in 2010 and
2011 the amount was around 10% of total waste volumes. Injection wells are able to accept any
of the waste types for disposal, with the vast majority of waste at injection wells being brine
waste. This is expected because of the cost of disposal at injection wells does not depend on the
waste quality.
The ability for injection wells to accept waste both in Pennsylvania and surrounding states is
constrained, with a limited number of injection-well formations available and growing concerns
about the safety of these wells. Potential growth in oil and gas production in Ohio and West
Virginia may lead to higher demand for injection wells in those states. With high transport costs
to injection wells and potentially rising costs for disposal, injection wells may soon be pricier and
less available for waste acceptance.
28
Reuse
Recycling is one of the fast growing disposal methods, with considerable political weight
encouraging recycling options for natural gas wastewater disposal (GMSAC 2011). In
Pennsylvania, the new TDS rules have increased the push to recycle more wastewater.
During reuse, the wastewater is commonly blended with fresh water for a future hydraulic
fracturing job (Mantell 2010). Other reuse options that are not feasible in Pennsylvania due to
waste quality are agricultural uses, where low-TDS brine wastes are reused for irrigation or
livestock operations, or industrial reuses where lower quality water can be replace high quality
water in certain processes (IOGCC 2006; Hum et al. 2005). While these options are possible,
generally they require a very low level of TDS and other constituents, limiting the feasibility for
the majority of Marcellus waste even outside of Pennsylvania (IOGCC 2006).
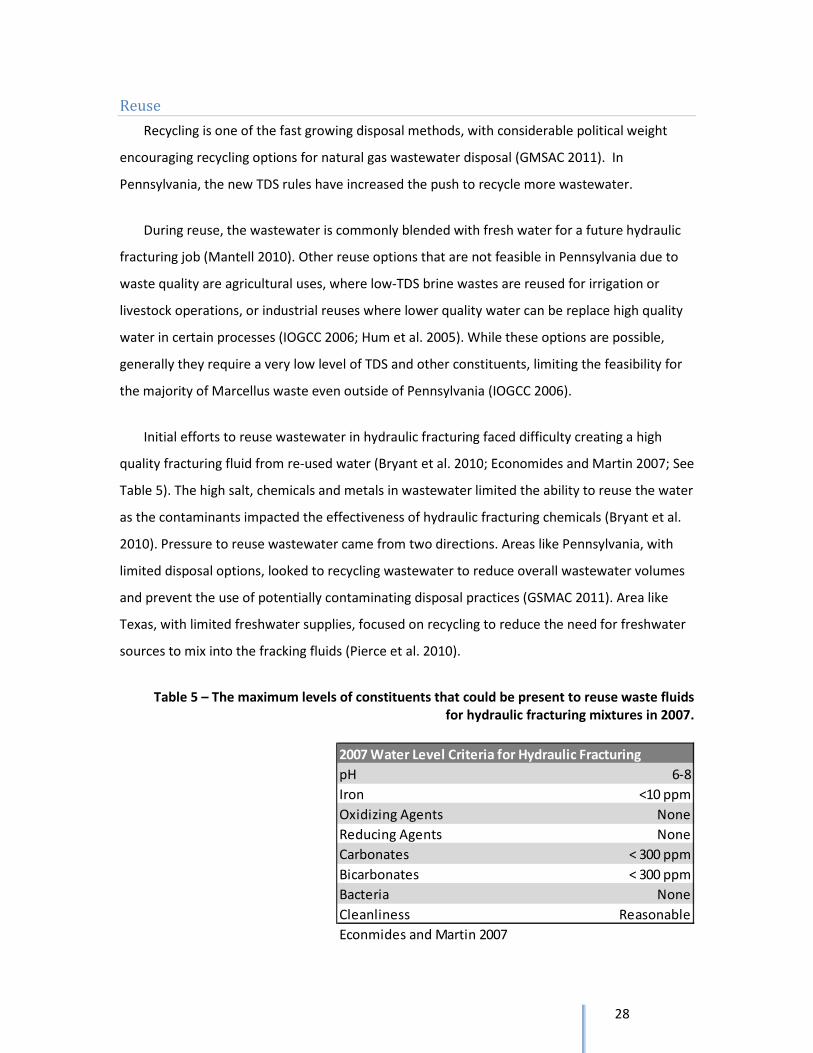
Initial efforts to reuse wastewater in hydraulic fracturing faced difficulty creating a high
quality fracturing fluid from re-used water (Bryant et al. 2010; Economides and Martin 2007; See
Table 5). The high salt, chemicals and metals in wastewater limited the ability to reuse the water
as the contaminants impacted the effectiveness of hydraulic fracturing chemicals (Bryant et al.
2010). Pressure to reuse wastewater came from two directions. Areas like Pennsylvania, with
limited disposal options, looked to recycling wastewater to reduce overall wastewater volumes
and prevent the use of potentially contaminating disposal practices (GSMAC 2011). Area like
Texas, with limited freshwater supplies, focused on recycling to reduce the need for freshwater
sources to mix into the fracking fluids (Pierce et al. 2010).
Table 5 – The maximum levels of constituents that could be present to reuse waste fluids
for hydraulic fracturing mixtures in 2007.
pH 6-8
Iron <10 ppm
Oxidizing Agents None
Reducing Agents None
Carbonates < 300 ppm
Bicarbonates < 300 ppm
Bacteria None
Cleanliness Reasonable
Econmides and Martin 2007
2007 Water Level Criteria for Hydraulic Fracturing
29
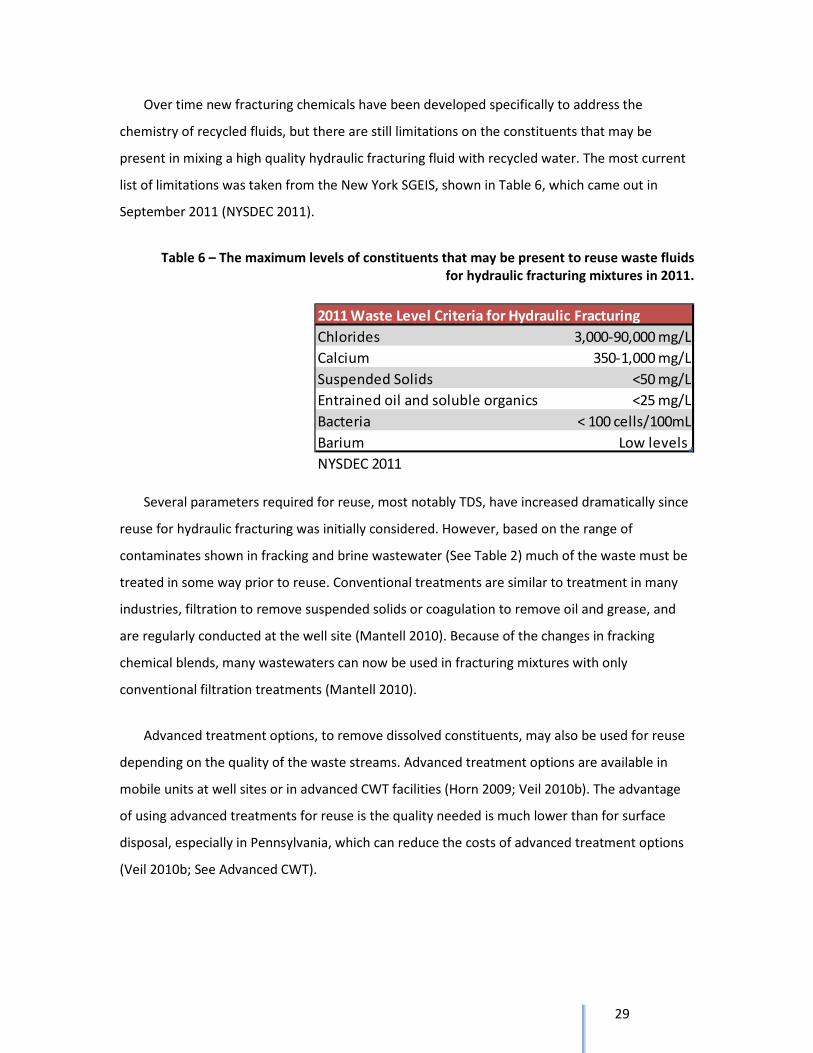
Over time new fracturing chemicals have been developed specifically to address the
chemistry of recycled fluids, but there are still limitations on the constituents that may be
present in mixing a high quality hydraulic fracturing fluid with recycled water. The most current
list of limitations was taken from the New York SGEIS, shown in Table 6, which came out in
September 2011 (NYSDEC 2011).
Table 6 – The maximum levels of constituents that may be present to reuse waste fluids
for hydraulic fracturing mixtures in 2011.
Several parameters required for reuse, most notably TDS, have increased dramatically since
reuse for hydraulic fracturing was initially considered. However, based on the range of
contaminates shown in fracking and brine wastewater (See Table 2) much of the waste must be
treated in some way prior to reuse. Conventional treatments are similar to treatment in many
industries, filtration to remove suspended solids or coagulation to remove oil and grease, and
are regularly conducted at the well site (Mantell 2010). Because of the changes in fracking
chemical blends, many wastewaters can now be used in fracturing mixtures with only
conventional filtration treatments (Mantell 2010).
Advanced treatment options, to remove dissolved constituents, may also be used for reuse
depending on the quality of the waste streams. Advanced treatment options are available in
mobile units at well sites or in advanced CWT facilities (Horn 2009; Veil 2010b). The advantage
of using advanced treatments for reuse is the quality needed is much lower than for surface
disposal, especially in Pennsylvania, which can reduce the costs of advanced treatment options
(Veil 2010b; See Advanced CWT).
2011 Waste Level Criteria for Hydraulic Fracturing
Chlorides 3,000-90,000 mg/L
Calcium 350-1,000 mg/L
Suspended Solids <50 mg/L
Entrained oil and soluble organics <25 mg/L
Bacteria < 100 cells/100mL
Barium Low levels
NYSDEC 2011
30
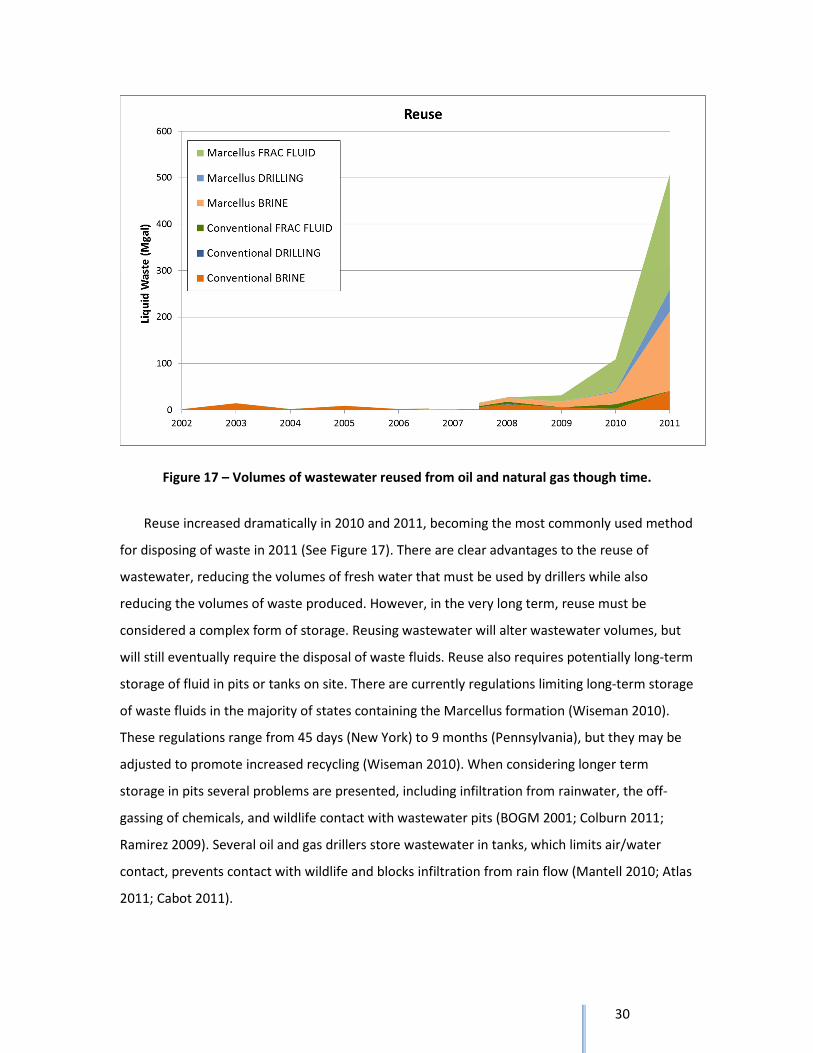
Figure 17 – Volumes of wastewater reused from oil and natural gas though time.
Reuse increased dramatically in 2010 and 2011, becoming the most commonly used method
for disposing of waste in 2011 (See Figure 17). There are clear advantages to the reuse of
wastewater, reducing the volumes of fresh water that must be used by drillers while also
reducing the volumes of waste produced. However, in the very long term, reuse must be
considered a complex form of storage. Reusing wastewater will alter wastewater volumes, but
will still eventually require the disposal of waste fluids. Reuse also requires potentially long-term
storage of fluid in pits or tanks on site. There are currently regulations limiting long-term storage
of waste fluids in the majority of states containing the Marcellus formation (Wiseman 2010).
These regulations range from 45 days (New York) to 9 months (Pennsylvania), but they may be
adjusted to promote increased recycling (Wiseman 2010). When considering longer term
storage in pits several problems are presented, including infiltration from rainwater, the off-
gassing of chemicals, and wildlife contact with wastewater pits (BOGM 2001; Colburn 2011;
Ramirez 2009). Several oil and gas drillers store wastewater in tanks, which limits air/water
contact, prevents contact with wildlife and blocks infiltration from rain flow (Mantell 2010; Atlas
2011; Cabot 2011).
31
When considering reuse as an option, well operators evaluate the economics of reuse: how
much does water acquisition, transport, and disposal cost relative to any storage, treatment and
transport that must occur for wastewater reuse (Mantell 2010). The quantity and timing of
waterwater recovery from wells can strongly impact these costs, especially given that brine
volumes must be collected over long periods (Mantell 2010). As shown in Figure 17, reuse of
fracking and drilling fluid is relatively higher than reuse of brine due partly to waste quality and
partly to the timing of waste generation (Mantell 2010).
The limitations of reuse are found in the need for additional drilling, the quality of
wastewater relative to hydraulic fracturing needs, and storage of materials. While reuse is an
excellent option for reducing waste volumes, it requires a mixture of treatment, storage and
continued fracturing to be a functional waste handling method. While the projections of growth
are extremely large, it is unclear whether reuse will be a viable option for all operators in all
locations.
Advanced CWT
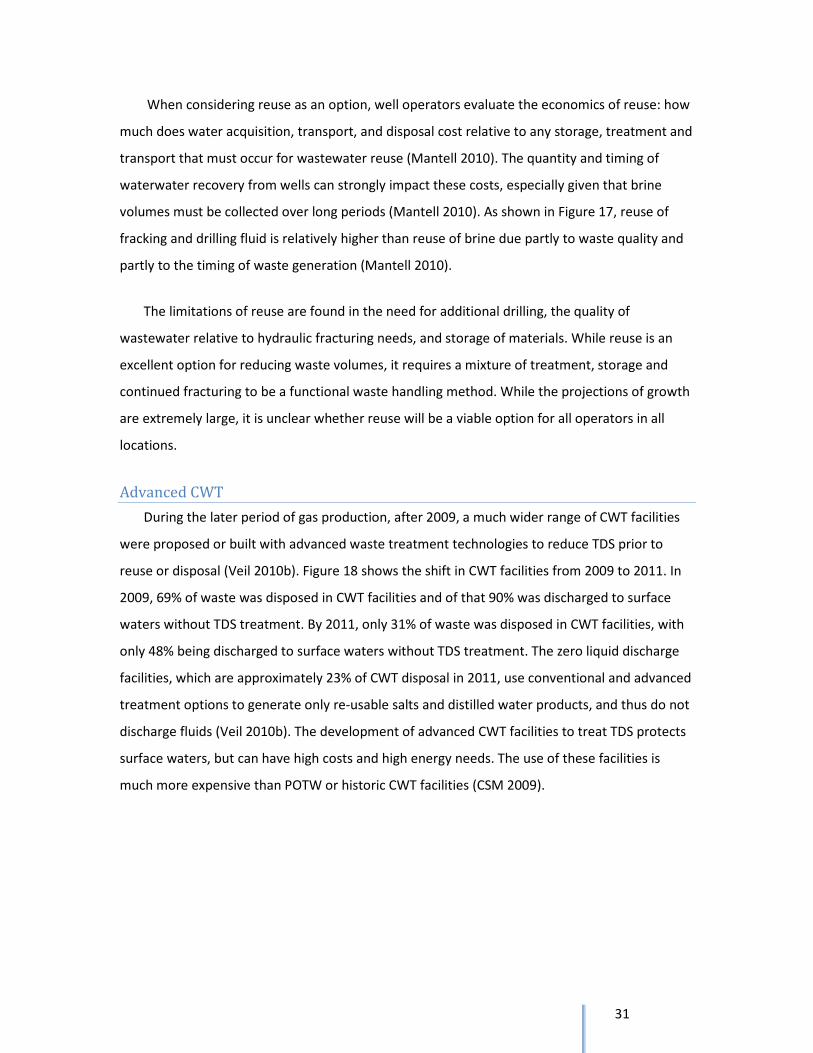
During the later period of gas production, after 2009, a much wider range of CWT facilities
were proposed or built with advanced waste treatment technologies to reduce TDS prior to
reuse or disposal (Veil 2010b). Figure 18 shows the shift in CWT facilities from 2009 to 2011. In
2009, 69% of waste was disposed in CWT facilities and of that 90% was discharged to surface
waters without TDS treatment. By 2011, only 31% of waste was disposed in CWT facilities, with
only 48% being discharged to surface waters without TDS treatment. The zero liquid discharge
facilities, which are approximately 23% of CWT disposal in 2011, use conventional and advanced
treatment options to generate only re-usable salts and distilled water products, and thus do not
discharge fluids (Veil 2010b). The development of advanced CWT facilities to treat TDS protects
surface waters, but can have high costs and high energy needs. The use of these facilities is
much more expensive than POTW or historic CWT facilities (CSM 2009).
32
Figure 18 - The two pie charts show the overall disposal method for 2009 and 2011
respectively, with side bars indicating the disposal method by CWT facility. (PA DEP 2012; Veil
2010; Hapchuk 2012).
There are a variety of different treatment technologies that are used by advanced CWT
facilities, and of these have different energy, quality, and cost requirements. The most
commonly discussed advanced treatment options are reverse osmosis, thermal distillation,
electro-dialysis, and ion exchange (NYSDEC 2011). Of the available treatment options, only
thermal distillation and reverse osmosis are being considered for use in the Marcellus shale (Veil
2010b). Currently other advanced treatment options are only able to manage relatively low
levels of TDS in influent, or have large energy costs relative to TDS levels (CSM 2009; See Table
7).
33
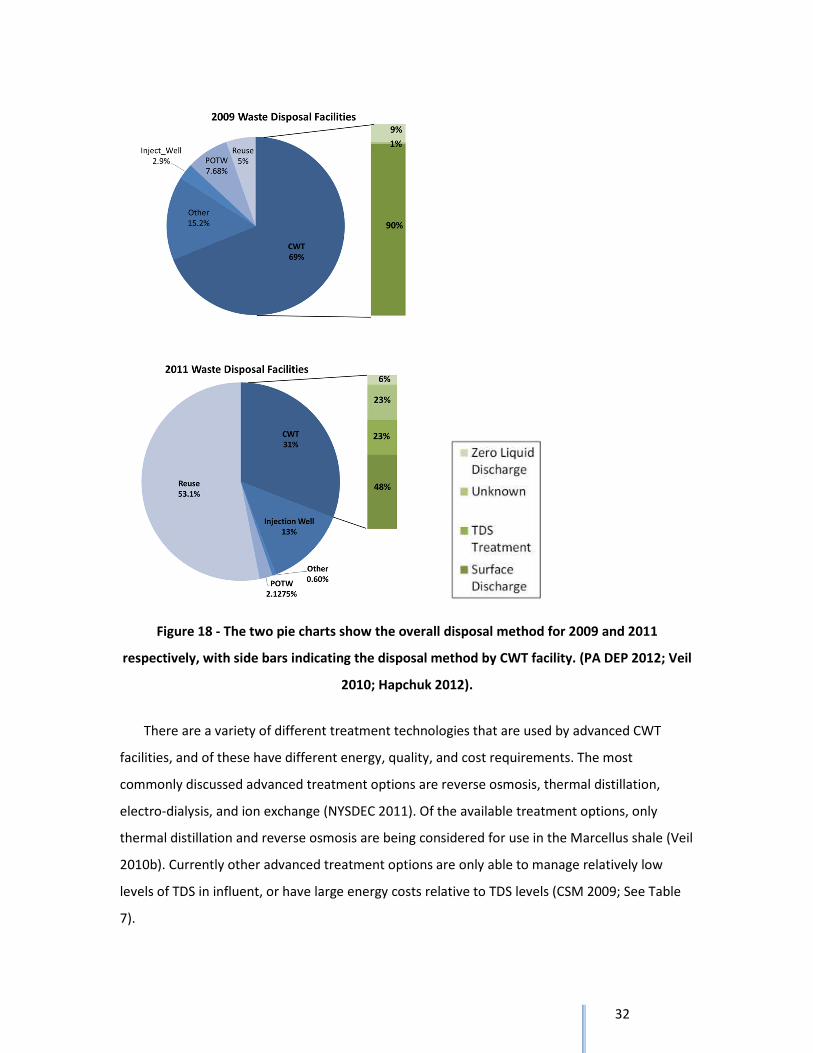
Table 7 – Factors for various advanced treatment options to remove TDS.
1 URS 2011,
2 TRRC 2011,
3 Horn 2009,
4 NETL 2012,
5 CSM 2009,
6 Veil 2010b
Most advanced treatment technologies require pre-treatment to remove oil and grease,
TSS, and some dissolved constituents that may cause scaling. The most common type of pre-
treatment appears to be filtration (NYSDEC 2011). After filtration, the waste is may be treated
with chemicals to precipitate dissolved contaminants that can form scale or salt precipitates
during treatment (NYSDEC 2011).
Thermal distillation makes no distinctions between waste quality, but requires a very high
input of energy. Thermal distillation is already in use in the Barnett shale in Texas, treating
waste in mobile units at well sites (TRRC 2011). Two facilities in the Marcellus are already using
thermal distillation, and several other zero liquid discharge facilities in the Marcellus are using a
combination of extensive pretreatment and thermal distillation (Veil 2010b).
Reverse osmosis uses advanced membranes with pressure gradients to separate dissolved
contaminants (URS 2011). Reverse osmosis is limited to TDS levels around 45,000 mg/L,
although higher level TDS may be treated with a reduction in efficiency and increased
membrane impacts (CSM 2009). Reverse osmosis has been used extensively in desalinating
seawater and occasionally on produced water in other areas of the country, but is only under
consideration for the Marcellus (CSM 2009; URS 2011).
Treatment
Energy
cost1
Energy Input
Relative
to TDS1
Applicable
to1
Pretreatment
Requirement1
Final
Water
TDS1
In Use?
Ion Exchange Low
Low
increase All Waste Filtration
200-500
mg/L
Yes, Montana and
Wyoming 4
Reverse
Osmosis Moderate Increase
Moderate
TDS Extensive
200-500
mg/L
Yes, Texas and
proposed
Pennsylvania1,6
Eletrodialysis
Reversal High
High
Increase High TDS Filtration
200-1000
mg/L
Thermal
Distillation High Indepen. High TDS Minimal <10 mg/L
Yes, Texas and
Pennsylvania 2,6
Ozone/
Ultrasonic/
Ultraviolet Low Increase All Water Filtration Variable Yes, Texas 3
a Feed TDS >20,000 mg/L
34
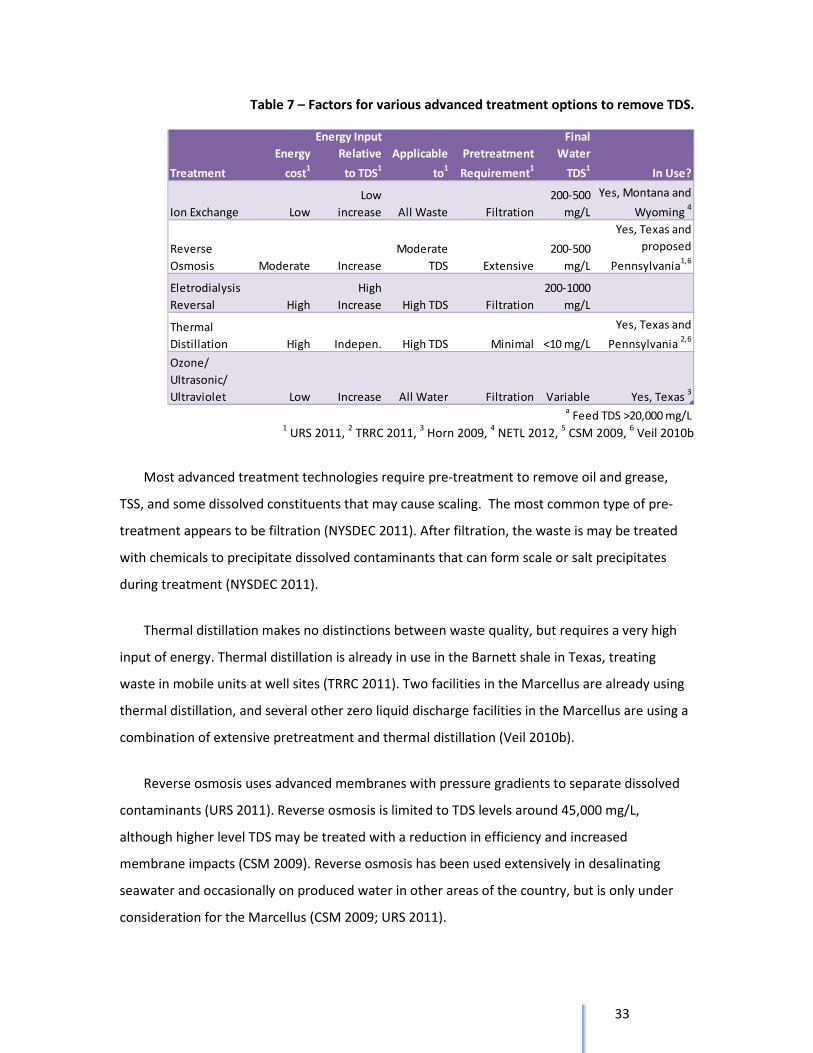
Section II - Conclusion
Figure 19 - Waste disposal trends overtime for conventional and Marcellus wastewater.
Over time different disposal method have gained favor with well operators or disfavor with
regulators. Disposal has shifted from historical disposal methods, mostly to surface waters, to
dispose of fluids through reuse, injection wells and advanced CWT (See Figure 19). Surface
disposal still occurs, especially for waste fluids from conventional natural gas wells.
It is unclear whether the state regulatory system, or a federal regulatory system being
considered by the EPA, would be the best solution for this problem. Considerations in this area
include issues of waste quality, availability of disposal options, and costs/feasibility of treatment
options. The current regulatory standards of 500 mg/L encourage drillers to dispose of waste
through reuse or injection wells because the disposal standard requires intensive treatment. A
better solution might be to set a higher TDS level for treatment plants and remove any
authorization of historic waste disposal or differences between conventional and Marcellus
waste. This would use the assimilative capacity of Pennsylvania streams to the highest extent
without over or under treating waste from different waste streams.
35
Future Concerns - Landfill Disposal
Landfills play an important role in waste disposal, as they are often the acceptors of
byproduct waste from CWT and POTW facilities (Veil 2010, Alexander and Shilling 2011). There
are growing concerns around landfills accepting waste sludge from treatment plant operators
disposing of significant amounts oil and gas wastewater. One of the largest concerns for landfill
acceptance of waste is the presence of elevated levels of NORM in waste material, especially
sewage sludges (Urbina 2011; NYSDOH 2009). Pennsylvania already has a requirement for
landfills to have a Radiation Protection Action Plan (PA § 270.140a). Under the radiation plans,
waste disposed at landfills has been screened for radioactive material, but at present no waste
has exhibited radioactive levels that would require further action by the landfill (Alexander and
Shilling 2011).
A second question is the disposal of saltcake, the waste sludge from CWT facilities with TDS
treatment systems that handle large volumes of oil and gas waste. At present it is unclear
whether landfill disposal of large volumes of salt-rich sewage sludge could have negative
impacts. Studies of the impact of salt on landfill clay liners indicate that there are potential
increases in hydraulic conductance or swelling of the liner (Arasan et al. 2010). No studies have
been conducted directly on the impact of natural gas salts on landfill liners or the potential
impacts of a shift to facilities producing large volumes of salt cake on landfills.
Proposed State and Federal Regulatory Changes:
At present the EPA has not promulgated any regulations for shale gas effluent (or other
onshore oil and gas wastewater disposal), but the EPA has noted that it will develop effluent
limits for both coal-bed methane and shale gas wastewater (EPA 2011). The new regulations are
currently being scoped and it is unclear what pollutants would be included or what treatment
would be required for disposal (B. Damico, personal communication, February 13, 2012). The
effluent limits would be applied under the requirements for direct discharges and will probably
include some level of TDS or chloride control, although the process is still in planning and list of
considered pollutant is not available (B. Damico, personal communication, February 13, 2012).
Although these regulations will be important, it must be noted that rise in gas prices in 2008
36
launched an increase in conventional oil and natural gas waste disposal. The conventional well
waste would not be required to meet shale gas effluent requirements, limiting the surface water
protection provided by these regulations.
Pennsylvania’s Water Resource Advisory Committee is currently reviewing a draft proposing
more stringent chloride, dissolved oxygen and sulfate requirements (WRAC 2012). These limits
would create stringent standards for some of the disposal parameters commonly found in TDS
and would probably be applied to plants grandfathered into the TDS regulations (WRAC 2012).
Section III: Projections:
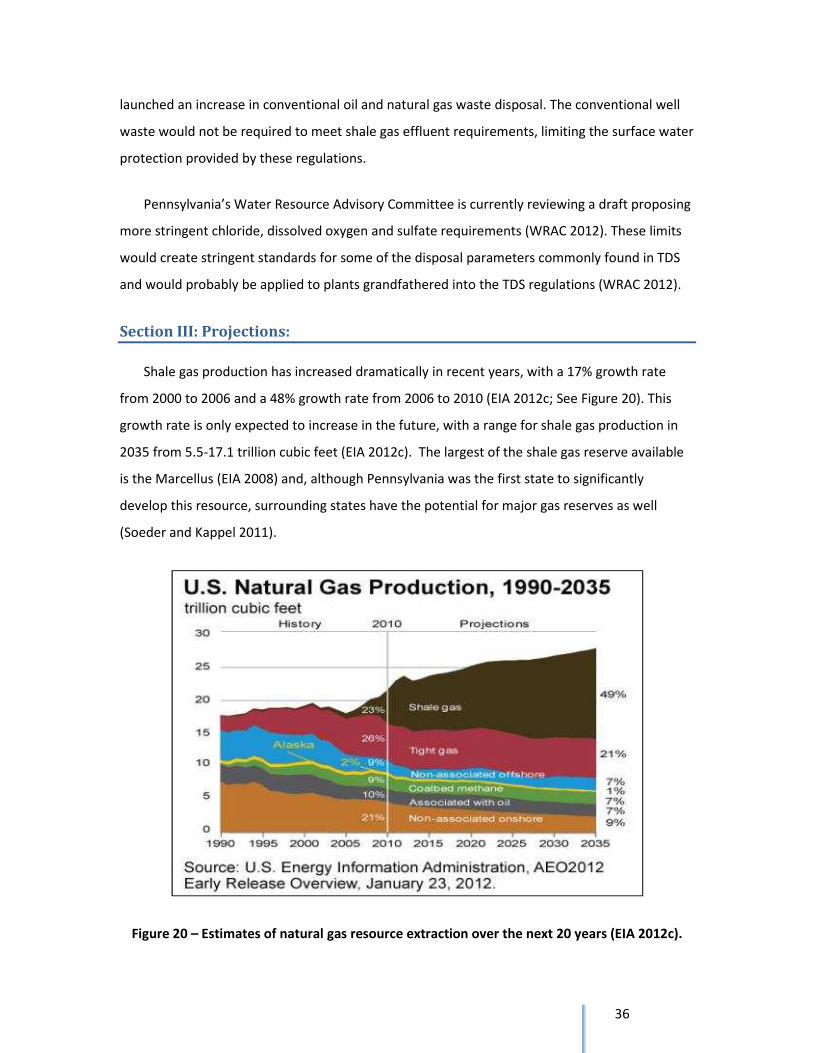
Shale gas production has increased dramatically in recent years, with a 17% growth rate
from 2000 to 2006 and a 48% growth rate from 2006 to 2010 (EIA 2012c; See Figure 20). This
growth rate is only expected to increase in the future, with a range for shale gas production in
2035 from 5.5-17.1 trillion cubic feet (EIA 2012c). The largest of the shale gas reserve available
is the Marcellus (EIA 2008) and, although Pennsylvania was the first state to significantly
develop this resource, surrounding states have the potential for major gas reserves as well
(Soeder and Kappel 2011).
Figure 20 – Estimates of natural gas resource extraction over the next 20 years (EIA 2012c).
37
Pennsylvania is expected to continue extensive production of natural gas from the
Marcellus. The highest predictions show a continued strong growth, with estimates of 12.0
billion cubic feet equivalents (bcfe) per day in 2015 and 17.5 bcfe/day in 2020, a growth of rate
around 100% of production per year (Considine et al. 2011). Comparing the short-term
estimates from the report to production, the report estimates 3.5 bcfe per day in 2011 while
calculated Marcellus production was 2.88 bcfe per day in 20117 (Considine et al. 2011).
West Virginia began shale gas exploration in the Marcellus in 2005, but lagged behind
Pennsylvania in the authorizing of shale gas permits after 2008 (WV DEP 2012). At present West
Virginia has 727 active Marcellus wells, but 2,072 permits for Marcellus wells have been
approved and have permits increased by 25% from 2010 to 2011 (WV DEP 2012).
Ohio also predicts growth, in both the Marcellus and the Utica shale, which lies below the
Marcellus (Weinstein and Partridge 2011; See Figure 5). At present Ohio has 33 wells drilled,
with 4 wells in active production in the Utica shale (Thomas et al. 2012). Estimates of future
drilling ranges from 1,918 wells by 2014 (Thomas et al 2012) to 4,000 wells by 2015 (Kleinhenz
2011) with some advocating for even lower estimates due the lower price for natural gas and
potential impacts of industry funding on report results (Weinstein and Partridge 2011).
At present New York State has banned high volume hydraulic fracturing, defined as greater
than 80,000 gallons and is currently working on a final SGEIS for hydraulic fracturing and shale
gas extraction (NYSDEC 2012). No predictions of shale gas exploration can be made until a clear
regulatory picture emerges.
The lowest projections see shale gas as an unsustainable bubble, with high over-head costs
requiring a much higher wellhead price ($7.00/Mcf) for sustained growth (Burman 2010). Under
these circumstances, limited growth for shale gas could be met by CWT facilities, but recycling
might decrease due to limited availability of fracture jobs to reuse wastewater. Additionally, the
cost of disposal at advanced CWT facilities may be especially burdensome, leading to waste
being redirected of older ‘grandfathered’ facilities.
7 Calculates natural gas equivalent as 5.8 Mcf per barrel of oil or condensate produced.
38
The majority of predictions indicate continued growth in Marcellus drilling. Estimates range
across the states ranges from around 4,000 wells in total to more than 15,000 wells in the three
states allowing drilling. These increases would generate enormous volumes of waste. Given the
current strains being seen in the disposal system, the growth of shale gas will require continued
efforts to find safe disposal methods.
Conclusions:
The expansion of natural gas drilling into the Marcellus shale formation has vastly increased
both gas and wastewater production in Pennsylvania. A comparison between Marcellus wells
and conventional wells shows that natural gas production from the Marcellus shale is more
efficient than from conventional formations, with approximately three times as much gas
produced per gallon of wastewater. Despite the increased efficiency, Pennsylvania currently
produces much higher volumes of wastewater because the production of natural gas has
dramatically increased, mostly due to Marcellus shale wells.
The increase in wastewater overwhelmed available disposal methods during the early
period of drilling from 2004 to 2009, with consequences for surface water quality. Overtime
regulations were put into place to address waste disposal, shifting treatment methods from
surfaces discharges to reuse, injection wells, and advanced waste treatment. Each of these
options will be needed to address future growth in natural gas extraction, but injection wells are
very limited in the northeast and cannot absorb significantly more waste. Reuse has already
proven very flexible at absorbing large quantities waste, with an enormous increase between
2009 and 2011. However, reuse does not permanently dispose of waste and has limitations
regarding the quality and timing of wastewater recovery. Advanced waste treatment options are
gaining in popularity, but remain expensive and energy intensive.
Given the anticipated future growth in shale gas production in the northeast, reuse and
advanced treatment options must be promoted to protect surface water quality. Regulatory
agencies need to consider how to encourage safe, viable alternatives to surface discharges by
supporting reuse and advanced waste treatment to manage ever increasing wastewater
volumes.
39
References:
Alexander, J and L. Shilling. 2011. The Impacts of the Natural Gas Industry on Landfill Operations. Penn
State Extension Webinar with Jay Alexander, General Manager of Wayne Township Landfill and Larry
Shilling, Regional Vice President of Casella Waste Systems. Retrieved from
http://extension.psu.edu/naturalgas/webinars/recorded/impacts-of-natural-gas-industry-on-landfill-
operations.
American Petroleum Institute (API). 2009. Hydraulic Fracturing Operations – Well Construction and
Integrity Guidelines. October 2009. Retrieved from
http://www.api.org/~/media/Files/Policy/Exploration/API_HF1.ashx
American Petroleum Institute (API). 2010. Water Management Associated with Hydraulic Fracturing. June
2010. Retrieved from http://www.api.org/~/media/Files/Policy/Exploration/HF2_e1.ashx.
American Petroleum Institute (API). 2011. Horizontal Shale Gas [Video]. Licensed from John Perez
Graphics and Design. Retrieved from http://www.api.org/policy-and-issues/policy-
items/hf/drilling_video.aspx
Arasan, S., Akbulut, R.K., Yetimoglu, T., and G. Yilmaz. 2010. Swelling Pressure of Compacted Clay Liners
Contaminated with Inorganic Salt Solutions. Environmental and Engineering GeoScience. Vol. 16(4) 401-
409.
Arthur, D., Bohm, B., and M. Layne. 2008. Hydraulic Fracturing Consideration for Natural Gas Wells of the
Marcellus Shale. All Consulting. Retrieved from
http://www.thefriendsvillegroup.com/HydraulicFracturingReport1.2008.pdf
Atlas Resources (Atlas). 2011. RE: EPA Request for Information on Marcellus Shale Flowback Water.
Communication from Atlas Resources to Jaqueline Morrison, Land and Chemicals Division of EPA Region
3. May 25, 2011. Retrieved from http://www.epa.gov/region3/marcellus_shale/pdf/responses2info-req5-
12-11/atlas1-208.pdf
Aunkst, D. and E. Pine. 2010, November 18. PA Dept of Environmental Protection’s Regulatory Update.
Penn State Extension Webinar with Dana Aunkst and Eugene Pine from the Pennsylvania Department of
Environmental Protection [Video]. Retrieved from
http://extension.psu.edu/naturalgas/webinars/recorded/pa-dept-of-environmental-protections-
regulatory-update.
Blauch, M.E., Myers, R.R., Moore, T.R., and B.A. Lipinski. 2009. Marcellus Shale Post-Frac Flowback
Waters – Where is all the Salt Coming From and What are the Implications? Society of Petroleum
Engineers. SPE 125740.
Boyer, C., Kieschnick, J., Suarez-Rivera, R., Lewis, R. and G. Walters. 2006. Producing Gas from Its Source.
Oilfield Review, Autumn 2006. Retrieved from
http://www.slb.com/~/media/Files/resources/oilfield_review/ors06/aut06/producing_gas.ashx.
40
Burman, A. 2010. Shale Gas—Abundance or Mirage? Why The Marcellus Shale Will Disappoint
Expectations. Energy Bulletin. Retrieved from http://www.firstenercastfinancial.com/pdfs/100101.pdf.
Bureau of Oil and Gas Management (BOGM). 2001. Oil and Gas Wastewater Permitting Manual.
Pennsylvania Department of Environmental Protection. (Doc. Num. 550-2100-002).
Bureau of Waste Management (BWM). 2010. Residual Waste Codes (RWC). Pennsylvania Department of
Environmental Protection. August 2010. Retrieved from
http://www.elibrary.dep.state.pa.us/dsweb/Get/Document-80896/2540-PM-BWM0404.pdf.
Bryant, J., Welton, T., and J. Haggstrom. 2010. Will flowback or produced water do? Exploration and
Production. September 2010. Retrieved from
http://www.halliburton.com/public/pe/contents/Papers_and_Articles/web/A_through_P/0910HEP_Sand
_HAL.PDF
Cabot Oil & Gas Corporation (Cabot). 2011. RE: EPA Request for Information on Marcellus Shale Flowback
Water. Communication from Cabot Oil & Gas Corporation to Jaqueline Morrison, Land and Chemicals
Division of EPA Region 3. May 25, 2011. Retrieved from
http://www.epa.gov/region3/marcellus_shale/pdf/responses2info-req5-12-11/cabot.pdf
Caen, R., Darley, H.C.H., and G. R. Gray. 2011. Composition and Properties of Drilling and Completion
Fluids 6 edition. Gulf Professional Publishing: Waltham, MA.
Canadian Association of Petroleum Producers (CAPP). 2011. Upstream Dialogue: The Facts on Natural Gas.
September 2011. Retrieved from http://www.capp.ca/getdoc.aspx?DocId=196037&DT=NTV.
Capacasa, J. 2011. Administrative Order for Compliance and Request for Information. Example Letter sent
to 13 Facilities in Pennsylvania by the Water Protection Division of the EPA Region 3 Office. September 28,
2011. Retrieved from http://www.epa.gov/region03/marcellus_shale/pdf/resource-ext-
orders/alleghenyvalley.pdf.
Casert, R. 2012. EU prepares for potential gas crisis. Associated Press. February 3, 2012. Accessed
February 5, 2012. Retrieved from
http://www.google.com/hostednews/ap/article/ALeqM5gxiKUuzNhdwlfof9zS4fZWJSVyNA?docId=6431e2
6b541d43de9fa5ee94c21925cd
Clark, C.E. and J.A. Veil. 2009. Produced Water Volumes and Management Practices in the United States.
Argonne National Laboratory. U.S. Department of Energy, Oak Ridge, TN. Retrieved from
http://www.evs.anl.gov/pub/doc/ANL_EVS__R09_produced_water_volume_report_2437.pdf
Colborn T, Kwiatkowski C, Schultz K, Bachran M. (in press). Natural gas operations from a public health
perspective. International Journal of Human & Ecological Risk Assessment. Retrieved
from http://www.endocrinedisruption.com/files/NaturalGasManuscriptPDF09_13_10.pdf
Colorado School of Mines (CSM). 2009. An Integrated Framework for Treatment Management of
Produced Water: Technical assessment of produced water treatment technologies. Retrieved from
http://www.rpsea.org/attachments/contentmanagers/3447/07122-
12_Technical_Assessment_of_Produced_Water_Technologies_First_Edition_P.pdf.
41
Considine, T.J., R.Watson and S. Blumsack. 2011. The Pennsylvania Marcellus Natural Gas Industry: Status,
Economic Impacts and Future Potential. Pennsylvania State University. Retrieved from
http://marcelluscoalition.org/wp-content/uploads/2011/07/Final-2011-PA-Marcellus-Economic-
Impacts.pdf.
Department of Agricultural Economics and Rural Sociology (DAERS). 2010. Marcellus Education Fact Sheet:
Withdrawals for Development of Marcellus Shale Gas in Pennsylvania. Pennsylvania State University.
Accessed: Nov 1, 2010. Retrieved from http://pubs.cas.psu.edu/FreePubs/pdfs/ua460.pdf.
Economides, M.J. and T. Martin. 2007. Modern Fracturing: Enhancing Natural Gas Production. ET
Publishing: Houston, TX.
Energy In Depth. 2010. History of Hydraulic Fracturing. Online, accessed Nov 1, 2010, Retrieved from
http://www.energyindepth.org/in-depth/frac-in-depth/history-of-hf/
Energy Information Administration (EIA). 1993. Drilling Sideways – A Review of Horizontal Well
Technology and Its Domestic Application. Retrieved from
http://www.eia.doe.gov/pub/oil_gas/natural_gas/analysis_publications/drilling_sideways_well_technolo
gy/pdf/tr0565.pdf
Energy Information Administration (EIA). 2011. Annual Pennsylvania Field Production of Crude Oil. Online,
updated July 28, 2011, accessed Jan 15, 2012. Retrieved from
http://www.eia.gov/dnav/pet/hist/LeafHandler.ashx?n=PET&s=MCRFPPA1&f=A
Energy Information Administration (EIA). 2012a. U.S. Natural Gas Wellhead Prices. Online, updated
January 1, 2012 Retrieved from http://205.254.135.7/dnav/ng/hist/n9190us3m.htm.
Energy Information Administration. (EIA). 2012b. Annual Pennsylvania Natural Gas Gross Withdrawals.
Online, updated January 30, 2012, accessed February 5, 2012. Retrieved from
http://www.eia.gov/dnav/ng/hist/n9010pa2a.htm.
Energy Information Administration. (EIA). 2012c. Annual Energy Outlook 2012 Early Release Overview.
Released January 23, 2012. Retrieved from http://www.eia.gov/forecasts/aeo/er/early_introduction.cfm.
Environmental Protection Agency (EPA). 1987. Report to Congress: Management of Wastes from
Exploration, Development, and Production of Crude Oil, Natural Gas, and Geothermal Energy. EPA 530-
SW-88-003. Washington, D.C.
Environmental Protection Agency (EPA). 2011. Technical Support Document for the 2010 Effluent
Guidelines Program Plan. Retrieved from
http://water.epa.gov/lawsregs/lawsguidance/cwa/304m/upload/tsd_effluent_program_10_2011.pdf
Frac Focus. 2011. Well Data taken from wells fracturing in Bradford Country from 2010 to 2011. Accessed
December 2011. Retrieved from http://www.hydraulicfracturingdisclosure.org/fracfocusfind/.
Governor’s Marcellus Shale Advisory Commission (GMSAC). 2011. Governor’s Marcellus Shale Advisory
42
Commission Report. Released July 22, 2011. Retrieved from
http://www.mde.state.md.us/programs/Land/mining/marcellus/Documents/MSAC_Final_Report.pdf.
Hanlon, J. 2011. Natural gas drilling in the Marcellus Shale under the NPDES program. Attachment to
memorandum from James Hanlon, Direct of EPA’s Office of Wastewater Management to EPA Regions.
March 16, 2011.
Hapchuk, Inc. 2012. LAD – Treatment Facility Plant. Summary of LAD treatment facility technology. Online,
accessed February 20, 2012. Retrieved from http://www.hapchukinc.com/lad.php.
Horn, A. 2009 . Breakthrough Mobile Water Treatment Converts 75% of Fracturing Flowback Fluid to
Fresh Water and Lowers CO2. Society of Petroleum Engineers. SPE 121104-MS.
Hopey, D. 2008. DEP Seeks Cause of River Pollution. Pittsburgh Post-Gazette. October 22, 2008. Retrieved
from http://www.uppermon.org/news/Pgh-Alleg/PG-DEP_seeks-22Oct08.htm.
Hum, F., Tsang, P., Kantzas, A. and T. Harding. 2005. Is it possible to treat produced water for recycle and
beneficial reuse? Society of Petroleum Engineers. PS2005-316.
Humphries, H. 2009. DEP detects total dissolved solids over standards in Monongahela River.
Pennsylvania Department of Environmental news release. October 14, 2009. Retrieved from
http://www.portal.state.pa.us/portal/server.pt/community/newsroom/14287?id=2390&typeid=1
Interstate Oil and Gas Compact Commission (IOGCC) and All Consulting. 2006. A Guide to Practical
Management of Produced Water from Onshore Oil and Gas Operations in the United States. Prepared for
U.S. Department of Energy and National Petroleum Technology Office.
Johnson, K. 2011. Underground Injection Wells as an option for disposal of shale gas wastewater policies
and practicality. Penn State Extension Webinar with Karen D. Johnson, Chief, Ground Water and
Enforcement Branch, US EPA, Region 3, Philadelphia. Retrieved from
https://meeting.psu.edu/p28484535/?launcher=false&fcsContent=true&pbMode=normal.
Kasey, P. 2008. PA Sewage plants ordered to refuse gas well drilling water. The State Journal. November
14, 2008. Retrieved from http://www.uppermon.org/news/charleston/SJ-PA_Drilling_water-
14Nov08.htm.
King, G.E. 2010. Thirty Years of Gas Shale Fracturing: What Have We Learned? Society of Petroleum
Engineers. SPE 133456.
Kleinhenz and Associates (Kleinhenz). 2011. Ohio‘s Natural Gas and Crude Oil Exploration and Production
Industry and the Emerging Utica Gas Formation. September 2011. Retrieved from
http://www.oogeep.org/downloads/file/Economic%20Impact%20Study/Ohio%20Natural%20Gas%20and
%20Crude%20Oil%20Industry%20Economic%20Impact%20Study%20September%202011.pdf.
Long, S. 2009. Wastewater Woes: Will DEP for Wastewater with high Total Dissolved Solids. The River
Reporter Climate Challenge. Online, accessed January 15, 2011. Retrieved from
http://www.riverreporter.com/issues/09-04-23/head1-wastewater.html.
43
Mabile, M., Richardson, D., Garner, S., Broussand, and R. Smith. 2011. Holistic Drilling Fluid and Waste
Management in the Fayetteville Shale. Society of Petroleum Engineers. SPE 144036.
Mall, A. and D. Donnelly, 2010. Petition for Rulemaking Pursuant to Section 6974(a) of the Resource
Conservation and Recovery Act Concerning the Regulation of Wastes Associated with the Exploration,
Development, or Production of Crude Oil or Natural Gas or Geothermal Energy. Petition to Lisa Jackson,
Administrator of the U.S. Department of Environmental Protection from the National Resource Defense
Council. September 8, 2010. Retrieved from http://docs.nrdc.org/energy/files/ene_10091301a.pdf
Manchin, J. 2010. Industry Guidance Gas Well Drilling/Completion, Large Water Volume Fracture
Treatments. West Virginia Department of Environment (WVDEP). Retrieved from
http://www.dep.wv.gov/oil-and-gas/GI/Documents/Marcellus%20Guidance%201-8-10%20Final.pdf
Mantell, M.E. 2011. Produced Water Reuse and Recycling Challenges and Opportunities Across Major
Shale Plays. Presented at EPA Hydraulic Fracturing Study Technical Workshop #4. March 29-30, 2011;
Arlington, VA. Retrieved from http://www.epa.gov/hfstudy/09_Mantell_-_Reuse_508.pdf.
Milici, R. and Swezey, C. (2006). Assessment of Appalachian basin oil and gas resources: Devonian shale -
middle and upper Paleozoic total petroleum system. U.S. Geological Survey, Open-File Report, pp. 2006-
1237.
National Energy Technology Laboratory (NETL). 2012. Produced Water Management Fact Sheet – Ion
Exchange. Accessed April 16, 2011. Retrieved from
http://www.netl.doe.gov/technologies/pwmis/techdesc/ionex/index.html.
Natural Gas Europe. 2011. Exxon to Proceed with Hydraulic Fracturing in Poland. September 28, 2011.
Retrieved from http://www.naturalgaseurope.com/exxonmobil-poland-hydraulic-fracturing
New York State Department of Environmental Conservation (NYSDEC). 2011. Revised Draft Supplemental
Generic Environmental Impact Statement on the Oil, Gas and Solution Mining Regulatory Program: Well
Permit Issuance for Horizontal Drilling and High-Volume Hydraulic Fracturing to Develop the Marcellus
Shale and Other Low-Permeability Gas Reservoirs. September 7, 2011. Retrieved from
http://www.dec.ny.gov/data/dmn/rdsgeisfull0911.pdf
New York State Department of Environmental Conservation (NYSDEC). 2012. SGEIS on the Oil, Gas, and
Solution Mining Regulatory Program. Accessed April 12, 2012. Retrieved from
http://www.dec.ny.gov/energy/47554.html.
New York State Department of Health (NYSDOH). 2009. Bureau of Environmental Radiation Protection
Comments “Supplemental Generic environmental Impact Statement on the Oil and Gas regulatory
Program Well permit issuance for Horizontal Drilling and High-Volume Hydraulic Fracturing to Develop the
Marcellus Shale and other Low-Permeability Gas Reservoirs. July 21, 2009. Retrieved from
http://s3.amazonaws.com/propublica/assets/natural_gas/nysdoh_marcellus_concerns_090721.pdf
Niquette, M. 2012. Ohio Tries to Escape Fate as a Dumping Ground for Fracking Fluid. Bloomberg.
February 1, 2012. Retrieved from http://www.bloomberg.com/news/2012-02-01/ohio-tries-to-escape-
fate-as-a-dumping-ground-for-fracking-fluid.html
44
Obama, B. 2012. Transcript: Obama’s 2012 State of the Union. FoxNews. January 24, 2012. Retrieved from
http://www.foxnews.com/politics/2012/01/24/transcript-obamas-2012-state-union/.
Ohio Department of Environmental Protection (OH EPA). 2012. Shale Oil and Gas Drilling – Glossary of
Terms. Accessed March 3, 2012. Retrieved from http://www.epa.ohio.gov/shale.aspx.
Ohio Department of Natural Resources (OH DNR). 2012. Preliminary report on the Northstar 1 Class II
Injection Well and the seismic events in the Youngstown, Ohio area.
Ohio Legislative Service Commission (OLSC). 2010. Final Analysis: Senate Bill 165. Effective June 30, 2010.
Retrieved from http://www.lsc.state.oh.us/analyses128/10-sb165-128.pdf.
Paktinat, J. and B. O’Neil. 2011. High Brine Tolerant Polymer Improves the Performance of Slickwater Frac
in Shale Reservoirs. Society of Petroleum Engineers. SPE 144210.
Pennsylvania Code. Chapter 95 Wastewater Treatment Requirements. Section 10 Treatment
requirements for new and expanding mass loadings of Total Dissolved Solids (TDS). Retrieved from
http://www.pacode.com/secure/data/025/chapter95/chap95toc.html.
Pennsylvania Department of Environmental Protection (PA DEP). 2011. Policy and Procedure for NPDES
Permitting of Discharges of Total Dissolved Solids (TDS) – 25 Code 2011) Doc. Num. 385-2100-002.
Retrieved from http://www.elibrary.dep.state.pa.us/dsweb/Get/Document-85967/385-2100-
002%20tech%20guidance.pdf
Pennsylvania Department of Environmental Protection (PA DEP). 2012. Records from Oil and Gas
Management database. Accessed February 12, 2012. Retrieved from
https://www.paoilandgasreporting.state.pa.us/publicreports/.
Perry. S. 2011. Letter From Scott Perry to SM Energy Co. and other gas companies regarding elevated
bromide levels. July 11, 2011. Retrieved from http://www.epa.gov/region3/marcellus_shale/pdf/letter-
padep-to-epa7-26-11.pdf.
Pierce, D., Bertrand, K. and C.C. Vasiliu. 2010. Water Recycling Helps with Sustainability. Society of
Petroleum Engineers. SPE 134137
Pilgram, S. 2011. French lawmakers ban controversial shale gas drilling. France24, November 11, 2011.
Retrieved from http://www.france24.com/en/20110511-france-votes-ban-shale-gas-drilling-fracking-
ump-sarkozy;
Pressman, J.G. et al. 2010. Concentration, Chlorination, and Chemical Analysis of Drinking Water for
Disinfection Byproduct Mixtures Health Effects Research: U.S. EPA’s Four Lab Study. Environmental
Science and Technology. 44: 7184-7192.
Rathbun, T. 2009 DEP Sets New Standards for Wastewater with high Total Dissolved Solids. Memo
released April 16, 2009. Retrieved from
http://www.portal.state.pa.us/portal/server.pt/community/newsroom/14287?id=2178&typeid=1.
45
Ramirez, P. 2009. Reserve Pit Management: Risks to Migratory Birds. U.S. Fish and Wildlife Region 6.
Retrieved from http://www.fws.gov/mountain-prairie/contaminants/documents/ReservePits.pdf
Sapien, J. 2009. With Natural Gas Drilling Boom Pennsylvania Faces an Onslaught of Wastewater.
Propublica. October 3, 2009. Retrieved from http://www.propublica.org/article/wastewater-from-gas-
drilling-boom-may-threaten-monongahela-river.
Shapiro, S., Dinske, C. and C. Langenbruch. 2010. Seismogenic index and magnitude probability of
earthquakes induced during reservoir fluid stimulation. Society of Exploration Geophysicists. Vol 29(3)
304-309.
Soeder, D. and W. Kappel. 2009. Water Resources and Natural Gas Production from the Marcellus Shale.
USGS Fact Sheet. Retrieved from http://pubs.usgs.gov/fs/2009/3032/pdf/FS2009-3032.pdf
Spear, R. and G. Kenderes. 2009. Cause and Effect Survey South Fork Tenmile Creek. Pennsylvania
Department of Environmental Protection. February 2, 2009. Retrieved from
http://files.dep.state.pa.us/Water/Wastewater%20Management/WastewaterPortalFiles/MarcellusShale
WastewaterPartnership/south_fork_tenmile_feb_2009.pdf
Texas Railroad Commission (TRRC). 2011. Water Use in the Barnett Shale. Updated January 24, 2011,
accessed April 16, 2012. Retrieved from
http://www.rrc.state.tx.us/barnettshale/wateruse_barnettshale.php.
Thomas, A.R., Lendel, I., Hill, E.W., Southgate, D. and R. Chase. 2012. An Analysis of The Economic
Potential for Shale Formations in Ohio. Funded by Ohio Shale Coalition. Retrieved from
http://media.cleveland.com/business_impact/other/Shale%20Final%20Report.pdf.
Urbina, I. 2011. Regulation Lax as Gas Wells’ Tainted Water Hits Rivers. New York Times February 26,
2011. Retrieved from http://www.nytimes.com/2011/02/27/us/27gas.html?pagewanted=all#.
URS Corporation (URS). 2011. Water-Related Issues Associated with Gas Production in the Marcellus
Shale. Prepared for NYSERDA, Albany, NY. March 25, 2011.
U.S. Department of Energy (US DOE). National Energy Technology Laboratory (DOE). 2009. Modern Shale
Gas Development in the United States: A Primer. National Energy Technology Laboratory. Retrieved from
http://www.netl.doe.gov/technologies/oil-gas/publications/EPreports/Shale_Gas_Primer_2009.pdf
Veil, J.A., M.G. Puder, D. Elcock, and R.J. Redweik, Jr. 2004. A white paper describing produced water from
production of crude oil, natural gas, and coal bed methane. DOE W-31-109-Eng-38.
Veil, J.A. and C.E. Clark. 2010a. Produced Water volumes estimates and management practices. Society of
Petroleum Engineers. SPE 125999-MS.
Veil, J.A., 2010b, Water Management Technologies Used by Marcellus Shale Gas Producers. Argonne
National Laboratory, Office of Fossil Energy, National Energy Technology Laboratory, July 2010. Retrieved
from http://www.evs.anl.gov/pub/doc/Water%20Mgmt%20in%20Marcellus-final-jul10.pdf.
46
Volz, C., Ferrar, K., Michanowicz, D., Christen, C., Kearney, S., Kelso, M. and S. Malone. 2011. Contaminant
Characterization of effluent from Pennsylvania Brine Treatment Inc., Josephine Facility being released into
Blacklick Creek, Indiana County, Pennsylvania: Implications for disposal of oil and gas flowback fluids from
brine treatment plants. Center for Health Environments, Department of Environmental and Occupational
Health, University of Pittsburgh. March 25, 2011. Retrieved from http://ia700608.us.archive.org/6/items/ContaminantCharacterizationOfEffluentFromPennsylvaniaBrineTr
eatment/Josephine_V2_CHEC_2011.pdf
Vukmanovic, O. 2011. UK firm says shale fracking caused earthquakes. Reuters. November 2, 2011.
Retrieved from http://uk.reuters.com/article/2011/11/02/greenbiz-us-gas-fracking-
idUKTRE7A160020111102
Water Resource Advisory Council (WRAC). 2012. January 11, 2012 - Meeting Agenda. Harrisburg, PA.
Retrieved from
http://files.dep.state.pa.us/PublicParticipation/Advisory%20Committees/AdvCommPortalFiles/WRAC/Ag
enda/1-11-12%20Agenda.pdf.
Weinstein, A. and M.D. Partridge. 2011. The Economic Value of Shale Natural Gas in Ohio. Ohio State
University. December 2011. Retrieved from http://aede.osu.edu/sites/drupal-
aede.web/files/Economic%20Value%20of%20Shale%20Dec%202011.pdf.
West Virginia Department of Environmental Protection (WV DEP). 2012. Oil and Gas Database, records
from the “Marcellus” formation. Accessed March 18, 2012. Retrieved from
https://apps.dep.wv.gov/oog/wellsearch_new.cfm
Wiseman, H. (2009) Untested Waters: The Rise of Hydraulic Fracturing in Oil and Gas Production and the
Need to Revisit Regulation. Fordham Environmental Law Review 115.
Ziemkiewicz, P. 2008. High TDS in the Monongahela River: Analysis of the Chemical Data. Water Research
Institute. Accessed February 8, 2012. Retrieved from http://www.uppermon.org/Marcellus_Shale/Mon-
Oct-Dec-2008.htm
Zoback, M., Kitasei, S., and B. Copithorne. “Addressing the Environmental Risks from Shale Gas
Development,” World Watch Institute, July 2010. Retrieved from http://blogs.worldwatch.org/revolt/wp-
content/uploads/2010/07/Environmental-Risks-Paper-July-2010-FOR-PRINT.pdf