Embed Size (px)
Citation preview
Pedro Manuel Saraiva Cardoso
Licenciado em Engenharia do Ambiente
Wastewater Treatment and Energy Valorisation in Small Wastewater Treatment
Plants
Dissertação para obtenção do Grau de Mestre em Bioenergia
Orientador: José Filipe Santos Oliveira, Professor Catedrático, Faculdade de Ciências e Tecnologia, Universidade Nova de
Lisboa. Co-orientador: João Fernando Pereira Gomes, Professor Coordenador, Instituto Superior de Engenharia de Lisboa.
Júri:
Presidente: Prof. Doutora Benilde Simões Mendes Arguente(s): Prof. Doutor Santino Eugénio Di Berardino
Vogal(ais): Prof. Doutor Nuno Lapa
Outubro de 2008

II
III
Wastewater Treatment and Energy Valorisation in Small Wastewater Treatment Plants
Direitos de Autor © Pedro Manuel Saraiva Cardoso Faculdade de Ciências e Tecnologia
Universidade Nova de Lisboa A Faculdade de Ciências e Tecnologia e a Universidade Nova de Lisboa têm o direito, perpetuo e sem limites geográficos, de arquivar e publicar esta dissertação através de exemplares impressos reproduzidos em papel ou de forma digital, ou por qualquer outro meio conhecido ou que venha a ser inventado, e de a divulgar através de repositórios científicos e de admitir a sua cópia e distribuição com objetivos educacionais ou de investigação, não comerciais, desde que seja dado crédito ao autor e editor.

IV

V
Para o Vítor, a Lídia e a Catarina;
do Pedro

VI

VII
Acknowledgements:
I want to express my sincere gratitude to Professor Santos Oliveira and Professor João Gomes for all motivation, technical support and references, during all my academic and professional development.
I want to show also my appreciation for all persons that I contacted and worked during the presented work, namely to Ing. Ana Alegria and Ing. Mónica Morais from SMAS de Sintra, Dr. Susana Perez and Dr. Mikel Belsue from INASMET, Ing. Norberto Duarte, Ing. Rui Braz, Ing. Catarina Gonçalves and Ing. Dinis Rodrigues from ISQ.
I will always be very grateful to Ing. Dias Miranda, Ing. Manuel Cruz and Ing. Lobato Faria for all the support that I had in ISQ, for the conclusion of this dissertation.

VIII
IX
Abstract:
This dissertation aims to find ways to improve environmental and energy performances of three small wastewater treatment plants (WWTP). These WWTP, placed in Sintra municipality, were case studies for the identification of corrective measures and solutions in order to improve their environmental and energy performance. The settings of these three WWTP was obtained by an audit exercise, performed under a specific methodology for small WWTP. After this assessment were proposed corrections and solutions for all identified improvement opportunities.
Were also discussed solutions for the treatment of sewage sludge, due to the actual problems resulted by its disposal and to take advantage of its energy valorisation potential. Was presented as case study, a sludge thermal treatment and its energy valorisation by gasification. This specific case study was occurred in a pilot gasification reactor in San Sebastian, Spain.
Another theme discussed on this dissertation was the possibility to provide energy autonomy for small and isolated WWTP using renewable energies, in this specific case, wind energy. Was studied the wind availability and pattern, for the region of Magoito, where Magoito WWTP is placed. This study was supported by Wasp software, analysis of meteorological databases for the region and by the collection of data provided by an on-site a meteorological station, placed on Magoito WWTP.
The state of the art on wastewater treatment technologies and sludge treatment and valorisation, for small WWTP, was also compiled, as well as an overview of the main Portuguese and European legislation and European policies on this subject.
Keywords: Small WWTP, Sludge, Gasification, Isolated WWTP, Wind Energy.

X
XI
Resumo:
Esta dissertação pretende de encontrar possibilidades de melhoria de desempenho ambiental e energético de três Estações de Tratamento de Águas Residuais (ETAR). Estas ETAR situam-se no Município de Sintra, e serviram de caso de estudo para a identificação de medidas corretivas e soluções que melhorassem o seu desempenho ambiental e energético.
As condições de funcionamento destas ETAR foram obtidas através de exercícios de auditoria cuja metodologia foi desenvolvida para se adaptassem corretamente á realidade das pequenas ETAR. Em consequência destas auditorias foram propostas medidas corretivas e soluções para todas as oportunidades de melhoria identificadas.
Também foram discutidas soluções para o tratamento das Lamas de ETAR, devido aos atuais problemas relacionados com o seu encaminhamento para destino final e para explorar o seu potencial de valorização energética. Foi apresentado como caso de estudo o tratamento térmico destas lamas e a sua valorização energética, por via da gasificação. Este caso de estudo específico ocorreu num gasificador piloto, em San Sebastian, Espanha.
Outro tema abordado nesta dissertação foi a possibilidade de tornar autónomas, do ponto de vista energético, pequenas ETAR que se encontrem isoladas ou em localizações remotas, utilizando energias renováveis e neste caso especifico energia eólica. Foram estudados a disponibilidade e o padrão dos ventos dos ventos, na região do Magoito, onde se situa a ETAR do Magoito. Este estudo foi obtido com recurso ao programa Wasp, análise de dados meteorológicos disponíveis para a região em estudo e através da compilação de dados provenientes de uma estação metrológica, colocada na ETAR do Magoito, para esse efeito.
Também foi compilado o estado da arte nas tecnologias de tratamento de água e lamas para pequenas ETAR, bem como um apanhado da principal legislação Portuguesa e Europeia e políticas europeias, para este setor.
Palavras Chave: Pequenas WWTP, Lamas, Gasificação, ETAR Isolada, Energia Eólica.

XII
XIII
Table of Contents:
1. Legislation overview ............................................................................................................................ 1
1.1. European legislation on wastewater ....................................................................................... 1
1.2. European legislation on sewage sludge .................................................................................. 2
1.2.1. Sewage sludge Directive .................................................................................................. 2
1.2.2. Legislation compliance .................................................................................................... 3
1.3. Portuguese legislation on wastewater .................................................................................... 5
1.4. Portuguese legislation on sludge ............................................................................................ 9
1.5. Municipal wastewater drainage – SMAS de Sintra regulations ............................................ 10
2. Portuguese chronological water policies ........................................................................................... 13
2.1. Evolution of the strategy and planning in the water sector ................................................. 13
2.2. Recent statistic data .............................................................................................................. 15
2.3. Overview of wastewater treatment in Portugal ................................................................... 15
2.4. Sludge production in Portugal ............................................................................................... 17
3. Best available WWT technology for small populations (up to 5.000 population equivalents) ........... 19
3.1. Traditional intensive techniques ........................................................................................... 19
3.1.1. Biological filters ............................................................................................................. 19
3.1.2. Rotating Biological Contactors (Bio-Disks) .................................................................... 19
3.1.3. Activated Sludge – Extended Aeration .......................................................................... 19
3.2. Extensive Techniques: ........................................................................................................... 20
3.2.1. Fixed Film Cultures on Small Media .............................................................................. 20
3.2.2. Infiltration-Percolation through Sand ........................................................................... 20
3.2.3. Vertical Flow Reed Bed Filters ....................................................................................... 20
3.2.4. Horizontal Flow Reed Bed Filters .................................................................................. 21
3.2.5. Suspended Growth Cultures ......................................................................................... 21
3.2.6. Natural Lagoons (Stabilization Ponds) ........................................................................... 21
3.2.7. Macrophytes Lagoons ................................................................................................... 21
3.2.8. Aerated Lagoons ............................................................................................................ 21
4. Case Study of SMAS de Sintra WWTP ............................................................................................. 23
4.1. Magoito WWTP ..................................................................................................................... 23
4.1.1. Pre-treatment ................................................................................................................ 26
4.1.2. Primary Treatment ........................................................................................................ 27
4.1.3. Secondary Treatment .................................................................................................... 27
4.1.4. Tertiary Treatment ........................................................................................................ 29
XIV
4.1.5. Sludge treatment ........................................................................................................... 30
4.1.6. Equipment ..................................................................................................................... 31
4.1.7. Sensors and alarms ........................................................................................................ 32
4.1.8. Plant Efficiency and optimisation potential .................................................................. 32
4.1.9. Recommendations......................................................................................................... 33
4.2. Almoçageme WWTP .............................................................................................................. 34
4.2.1. Pre-treatment ................................................................................................................ 37
4.2.2. Primary Treatment ........................................................................................................ 37
4.2.3. Secondary Treatment .................................................................................................... 38
4.2.4. Sludge treatment ........................................................................................................... 39
4.2.5. Equipment ..................................................................................................................... 40
4.2.6. Sensors and alarms ........................................................................................................ 41
4.2.7. Plant efficiency and optimisation potential .................................................................. 41
4.2.8. Recommendations......................................................................................................... 41
4.3. Vila Verde WWTP .................................................................................................................. 42
4.3.1. Pre-treatment ................................................................................................................ 45
4.3.2. Primary treatment ......................................................................................................... 45
4.3.3. Secondary treatment ..................................................................................................... 46
4.3.4. Sludge treatment ........................................................................................................... 47
4.3.5. Equipment ..................................................................................................................... 47
4.3.6. Sensors and alarms ........................................................................................................ 48
4.3.7. Plant Efficiency and optimisation potential: ................................................................. 48
4.3.8. Recommendations......................................................................................................... 48
5. Thermal treatment of wastewater sludge and its applications .......................................................... 51
5.1. Sewage sludge treatment process ........................................................................................ 51
5.1.1. Introduction ................................................................................................................... 51
5.1.2. Drying process ............................................................................................................... 52
5.1.3. Incineration ................................................................................................................... 52
5.1.4. Gasification .................................................................................................................... 53
5.1.5. Composting.................................................................................................................... 53
5.1.6. WWTP Sludge characteristics ........................................................................................ 53
5.2. WWTP sludge in Portugal ...................................................................................................... 54
5.2.1. Sludge production ......................................................................................................... 54
5.2.2. Final sludge destination ................................................................................................. 57
5.3. Analysis of Sintra WWTP sewage sludge: .............................................................................. 62
5.4. Gasification of sludge ............................................................................................................ 65
XV
5.4.1. Technologies .................................................................................................................. 65
5.4.2. Thermal drying and gasification process ....................................................................... 65
5.4.3. Combustible Gas Use ..................................................................................................... 65
5.4.4. Case study ...................................................................................................................... 66
5.4.5. Results ........................................................................................................................... 67
5.4.6. Conclusions about gasification ...................................................................................... 72
5.4.7. Comparative analysis ..................................................................................................... 72
6. Wind Energy Availability at Magoito WWTP Site and Nearby Area .................................................. 75
6.1. Characterisation of Magoito WWTP Anemometric Station: ................................................. 75
6.2. Characterization of the reference anemometric station ...................................................... 78
6.3. Results ................................................................................................................................... 80
6.4. Conclusion of the wind potential study ................................................................................ 82
7. Global conclusion and further investigation opportunities ................................................................. 83
8. References ........................................................................................................................................ 85

XVI
XVII
List of Figures:
Figure 2.1 Map from 1941 with geographic information of water supply services. (Source: INAG) ... 13
Figure 2.2 Chronological evolution of the attendance levels in Portugal of wastewater drainage and
treatment. (Source: INSAAR) ....................................................................................................... 15
Figure 2.3 A) Attendance index of Portuguese wastewater drainage service; B) Attendance index of
Portuguese wastewater treatment service. (Source: INSAAR) .................................................... 16
Figure 2.4 View of Magoito Beach and Ribeira da Mata water line. ................................................... 23
Figure 2.5 Magoito WWTP treatment scheme. ................................................................................... 24
Figure 2.6 A) Affluent entry; B) Parshall channel................................................................................ 27
Figure 2.7 A) Pre-treatment screen (manual and mechanical); B) Pre-treatment grit remover. ........ 27
Figure 2.8 Aeration tank and secondary decanter. ............................................................................. 28
Figure 2.9 Aeration tank turbine. ........................................................................................................ 28
Figure 2.10 Surface spray system. ................................................................................................... 28
Figure 2.11 Rotary drum screen. ...................................................................................................... 29
Figure 2.12 U.V. unit. ........................................................................................................................ 29
Figure 2.13 Tertiary treatment electric board .................................................................................... 29
Figure 2.14 Final effluent with sodium hypochlorite injection ........................................................... 30
Figure 2.15 Sludge Drying Beds ....................................................................................................... 30
Figure 2.16 – A) Filter bags; B) Mobile strip filter ............................................................................. 30
Figure 2.17 Sludge for agriculture use .............................................................................................. 31
Figure 2.18 Almoçageme WWTP treatment scheme ....................................................................... 34
Figure 2.19 Two types of screens ..................................................................................................... 37
Figure 2.20 Primary sedimentation tanks ......................................................................................... 38
Figure 2.21 Bio-disks ........................................................................................................................ 38
Figure 2.22 Secondary decanter ...................................................................................................... 39
Figure 2.23 A) Filter bags; B) Drying beds ....................................................................................... 39
Figure 2.24 Anaerobic digester ......................................................................................................... 39
Figure 2.25 Vila Verde WWTP treatment scheme ............................................................................ 43
Figure 2.26 Pre-treatment ................................................................................................................. 45
Figure 2.27 Vila Verde WWTP Imhoff tank ....................................................................................... 45
Figure 2.28 Vila Verde WWTP bio-disks .......................................................................................... 46
Figure 2.29 Vila Verde WWTP secondary decanter ......................................................................... 46
Figure 2.30 Vila Verde WWTP drying beds ...................................................................................... 47
Figure 5.1 Portuguese Sludge (dry material) production, in 1994, 1999 and 2006. ........................... 55
Figure 5.2 Estimative of sludge production, in plurimunicipal system of Portugal at 2006 ................ 56
Figure 5.3 Sludge final destination ..................................................................................................... 57
Figure 5.4 Principal processes of WWTP sludge treatment ............................................................... 59
Figure 5.5 Principal processes of WWTP sludge treatment (cont.) .................................................... 59
Figure 5.6 Functional scheme of Parada WWTP ............................................................................... 60
Figure 5.7 Composting station general description ............................................................................ 60
XVIII
Figure 5.8 Portugal soil map ............................................................................................................... 61
Figure 5.9 Gasification scheme .......................................................................................................... 65
Figure 5.10 Thermal drying treatment. ............................................................................................. 66
Figure 5.11 Inasmet Gasification system. ......................................................................................... 67
Figure 6.1 Satellite view of Magoito WWTP where the anemometric station is located (source:
Google Earth) ................................................................................................................................ 75
Figure 6.2 Map with the zone in study for the wind energy potential ................................................. 76
Figure 6.3 Wind rose of the Magoito WWTP anemometric station..................................................... 77
Figure 6.4 Wind speed data of Magoito WWTP anemometric station: histogram of wind class ....... 77
Figure 6.5 Wind speed data of Magoito WWTP anemometric station: Weibull distribution. .............. 78
Figure 6.6 Wind rose of the reference anemometric station. .............................................................. 79
Figure 6.7 Wind speed data of the reference anemometric station: histogram of wind class ............ 79
Figure 6.8 Wind speed data of the reference anemometric station: Weibull distribution ................... 80
Figure 6.9 Wind velocities map at a height of 50 meters above the ground (UTM ED50 S29
coordinates) .................................................................................................................................. 81
XIX
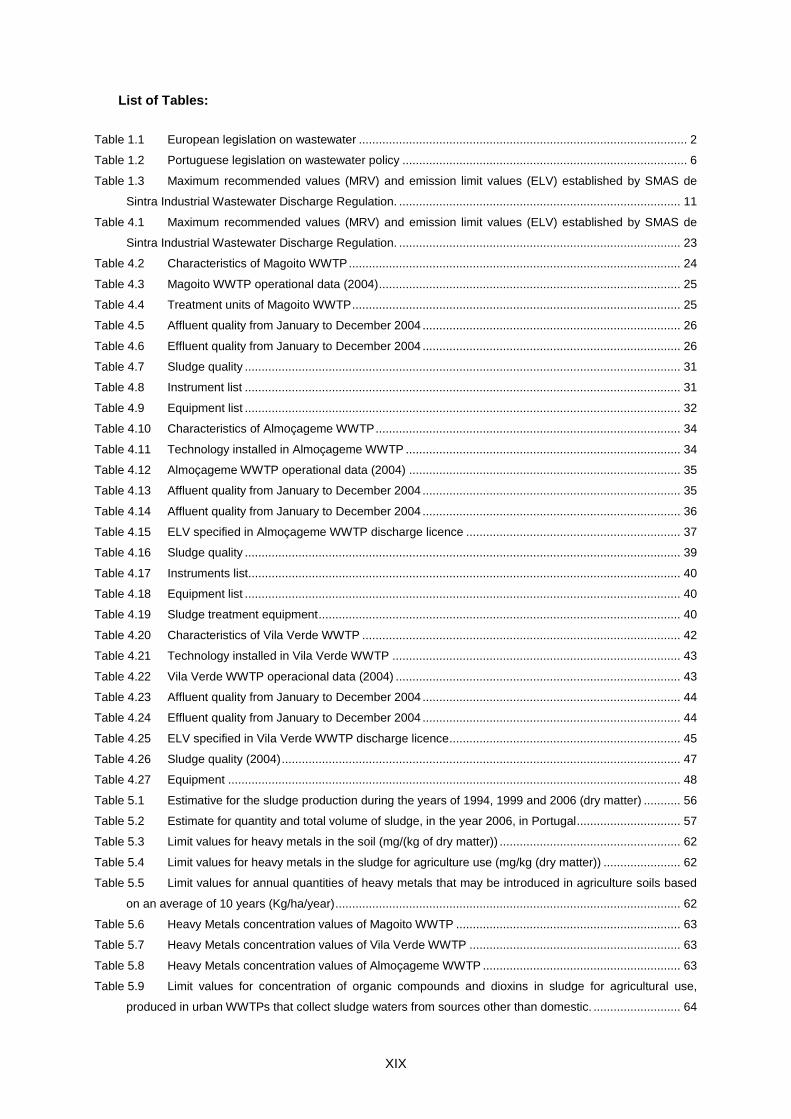
List of Tables:
Table 1.1 European legislation on wastewater .................................................................................................. 2
Table 1.2 Portuguese legislation on wastewater policy ..................................................................................... 6
Table 1.3 Maximum recommended values (MRV) and emission limit values (ELV) established by SMAS de
Sintra Industrial Wastewater Discharge Regulation. .................................................................................... 11
Table 4.1 Maximum recommended values (MRV) and emission limit values (ELV) established by SMAS de
Sintra Industrial Wastewater Discharge Regulation. .................................................................................... 23
Table 4.2 Characteristics of Magoito WWTP ................................................................................................... 24
Table 4.3 Magoito WWTP operational data (2004) .......................................................................................... 25
Table 4.4 Treatment units of Magoito WWTP .................................................................................................. 25
Table 4.5 Affluent quality from January to December 2004 ............................................................................. 26
Table 4.6 Effluent quality from January to December 2004 ............................................................................. 26
Table 4.7 Sludge quality .................................................................................................................................. 31
Table 4.8 Instrument list .................................................................................................................................. 31
Table 4.9 Equipment list .................................................................................................................................. 32
Table 4.10 Characteristics of Almoçageme WWTP ........................................................................................... 34
Table 4.11 Technology installed in Almoçageme WWTP .................................................................................. 34
Table 4.12 Almoçageme WWTP operational data (2004) ................................................................................. 35
Table 4.13 Affluent quality from January to December 2004 ............................................................................. 35
Table 4.14 Affluent quality from January to December 2004 ............................................................................. 36
Table 4.15 ELV specified in Almoçageme WWTP discharge licence ................................................................ 37
Table 4.16 Sludge quality .................................................................................................................................. 39
Table 4.17 Instruments list ................................................................................................................................. 40
Table 4.18 Equipment list .................................................................................................................................. 40
Table 4.19 Sludge treatment equipment ............................................................................................................ 40
Table 4.20 Characteristics of Vila Verde WWTP ............................................................................................... 42
Table 4.21 Technology installed in Vila Verde WWTP ...................................................................................... 43
Table 4.22 Vila Verde WWTP operacional data (2004) ..................................................................................... 43
Table 4.23 Affluent quality from January to December 2004 ............................................................................. 44
Table 4.24 Effluent quality from January to December 2004 ............................................................................. 44
Table 4.25 ELV specified in Vila Verde WWTP discharge licence ..................................................................... 45
Table 4.26 Sludge quality (2004) ....................................................................................................................... 47
Table 4.27 Equipment ....................................................................................................................................... 48
Table 5.1 Estimative for the sludge production during the years of 1994, 1999 and 2006 (dry matter) ........... 56
Table 5.2 Estimate for quantity and total volume of sludge, in the year 2006, in Portugal ............................... 57
Table 5.3 Limit values for heavy metals in the soil (mg/(kg of dry matter)) ...................................................... 62
Table 5.4 Limit values for heavy metals in the sludge for agriculture use (mg/kg (dry matter)) ....................... 62
Table 5.5 Limit values for annual quantities of heavy metals that may be introduced in agriculture soils based
on an average of 10 years (Kg/ha/year) ....................................................................................................... 62
Table 5.6 Heavy Metals concentration values of Magoito WWTP ................................................................... 63
Table 5.7 Heavy Metals concentration values of Vila Verde WWTP ............................................................... 63
Table 5.8 Heavy Metals concentration values of Almoçageme WWTP ........................................................... 63
Table 5.9 Limit values for concentration of organic compounds and dioxins in sludge for agricultural use,
produced in urban WWTPs that collect sludge waters from sources other than domestic. .......................... 64
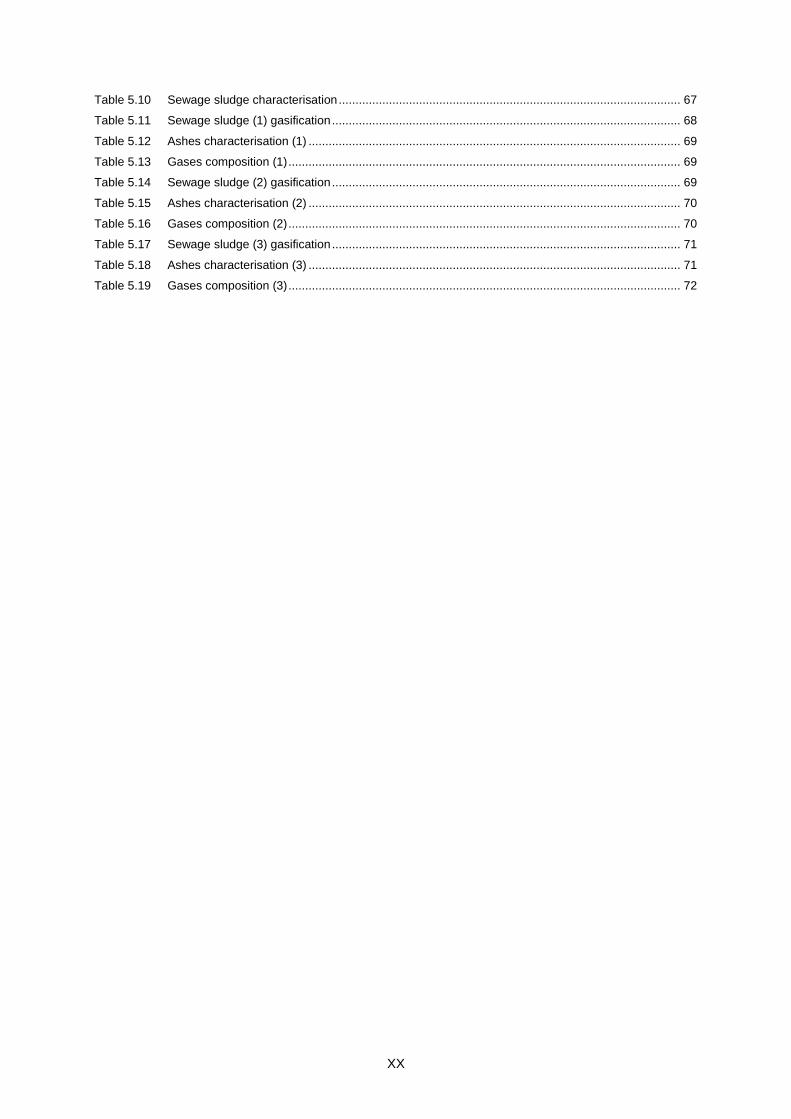
XX
Table 5.10 Sewage sludge characterisation ...................................................................................................... 67
Table 5.11 Sewage sludge (1) gasification ........................................................................................................ 68
Table 5.12 Ashes characterisation (1) ............................................................................................................... 69
Table 5.13 Gases composition (1) ..................................................................................................................... 69
Table 5.14 Sewage sludge (2) gasification ........................................................................................................ 69
Table 5.15 Ashes characterisation (2) ............................................................................................................... 70
Table 5.16 Gases composition (2) ..................................................................................................................... 70
Table 5.17 Sewage sludge (3) gasification ........................................................................................................ 71
Table 5.18 Ashes characterisation (3) ............................................................................................................... 71
Table 5.19 Gases composition (3) ..................................................................................................................... 72
XXI
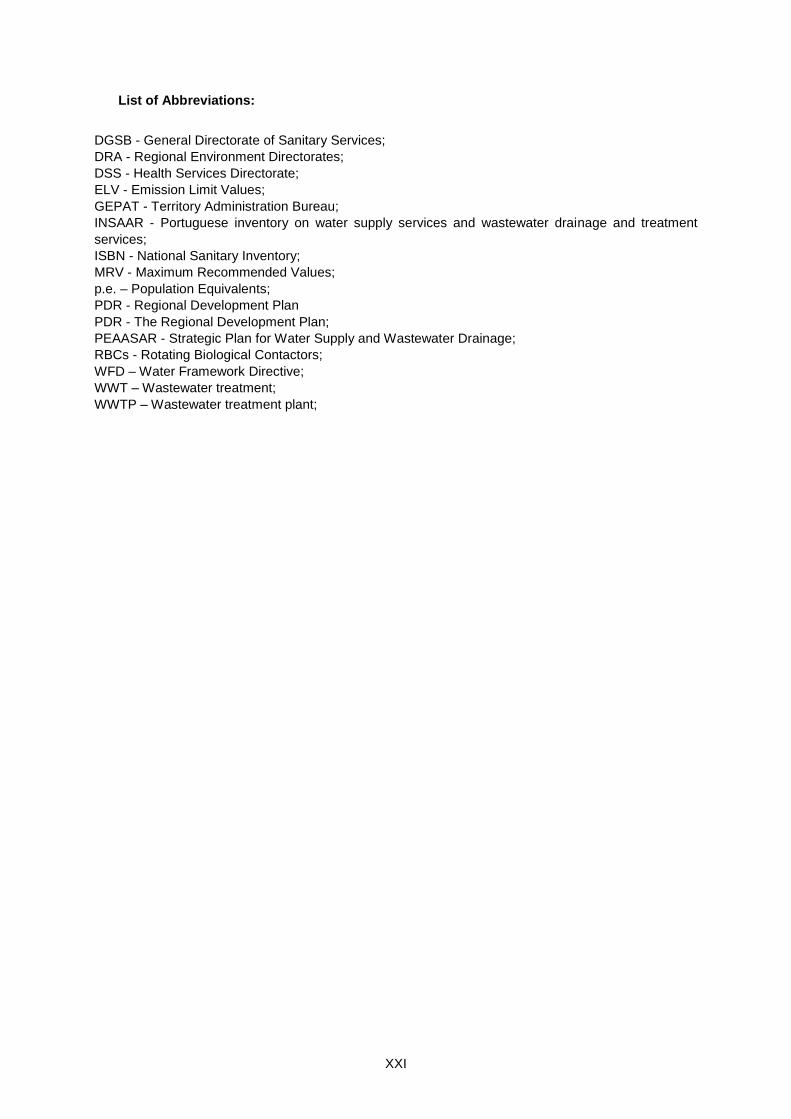
List of Abbreviations:
DGSB - General Directorate of Sanitary Services;
DRA - Regional Environment Directorates;
DSS - Health Services Directorate;
ELV - Emission Limit Values;
GEPAT - Territory Administration Bureau;
INSAAR - Portuguese inventory on water supply services and wastewater drainage and treatment
services;
ISBN - National Sanitary Inventory;
MRV - Maximum Recommended Values;
p.e. – Population Equivalents;
PDR - Regional Development Plan
PDR - The Regional Development Plan;
PEAASAR - Strategic Plan for Water Supply and Wastewater Drainage;
RBCs - Rotating Biological Contactors;
WFD – Water Framework Directive;
WWT – Wastewater treatment;
WWTP – Wastewater treatment plant;

XXII
1
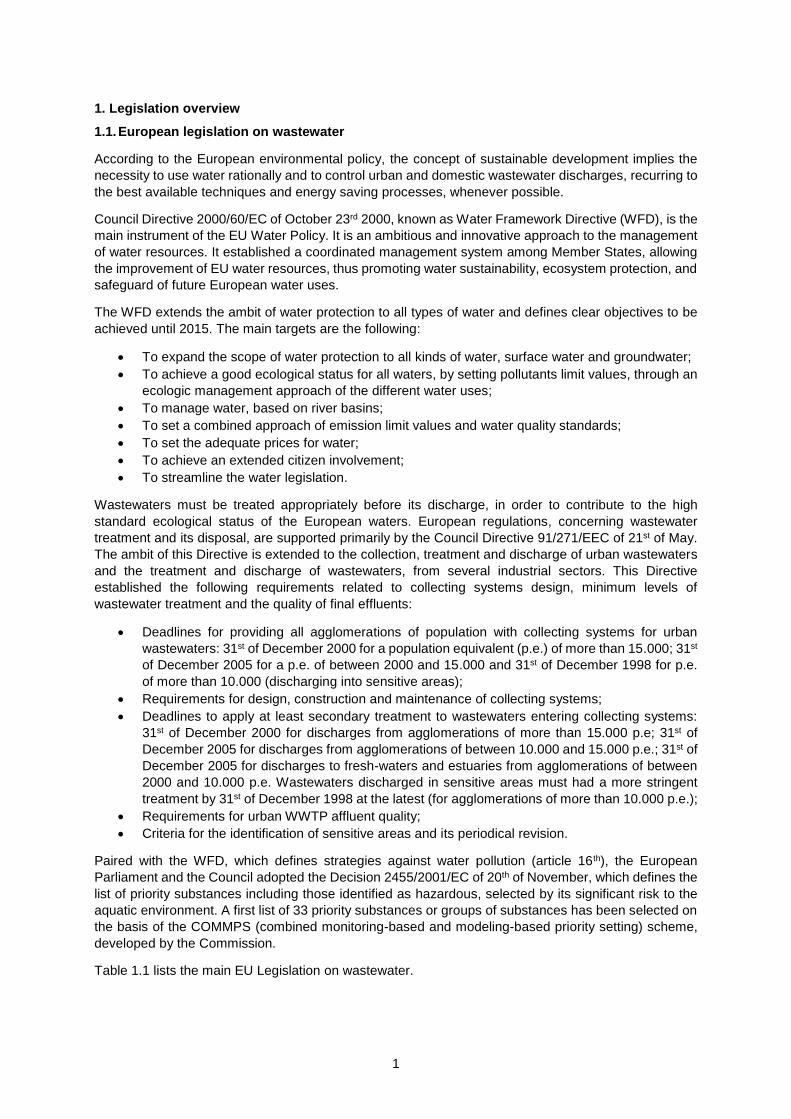
1. Legislation overview
1.1. European legislation on wastewater
According to the European environmental policy, the concept of sustainable development implies the
necessity to use water rationally and to control urban and domestic wastewater discharges, recurring to
the best available techniques and energy saving processes, whenever possible.
Council Directive 2000/60/EC of October 23rd 2000, known as Water Framework Directive (WFD), is the
main instrument of the EU Water Policy. It is an ambitious and innovative approach to the management
of water resources. It established a coordinated management system among Member States, allowing
the improvement of EU water resources, thus promoting water sustainability, ecosystem protection, and
safeguard of future European water uses.
The WFD extends the ambit of water protection to all types of water and defines clear objectives to be
achieved until 2015. The main targets are the following:
To expand the scope of water protection to all kinds of water, surface water and groundwater;
To achieve a good ecological status for all waters, by setting pollutants limit values, through an
ecologic management approach of the different water uses;
To manage water, based on river basins;
To set a combined approach of emission limit values and water quality standards;
To set the adequate prices for water;
To achieve an extended citizen involvement;
To streamline the water legislation.
Wastewaters must be treated appropriately before its discharge, in order to contribute to the high
standard ecological status of the European waters. European regulations, concerning wastewater
treatment and its disposal, are supported primarily by the Council Directive 91/271/EEC of 21st of May.
The ambit of this Directive is extended to the collection, treatment and discharge of urban wastewaters
and the treatment and discharge of wastewaters, from several industrial sectors. This Directive
established the following requirements related to collecting systems design, minimum levels of
wastewater treatment and the quality of final effluents:
Deadlines for providing all agglomerations of population with collecting systems for urban
wastewaters: 31st of December 2000 for a population equivalent (p.e.) of more than 15.000; 31st
of December 2005 for a p.e. of between 2000 and 15.000 and 31st of December 1998 for p.e.
of more than 10.000 (discharging into sensitive areas);
Requirements for design, construction and maintenance of collecting systems;
Deadlines to apply at least secondary treatment to wastewaters entering collecting systems:
31st of December 2000 for discharges from agglomerations of more than 15.000 p.e; 31st of
December 2005 for discharges from agglomerations of between 10.000 and 15.000 p.e.; 31st of
December 2005 for discharges to fresh-waters and estuaries from agglomerations of between
2000 and 10.000 p.e. Wastewaters discharged in sensitive areas must had a more stringent
treatment by 31st of December 1998 at the latest (for agglomerations of more than 10.000 p.e.);
Requirements for urban WWTP affluent quality;
Criteria for the identification of sensitive areas and its periodical revision.
Paired with the WFD, which defines strategies against water pollution (article 16th), the European
Parliament and the Council adopted the Decision 2455/2001/EC of 20th of November, which defines the
list of priority substances including those identified as hazardous, selected by its significant risk to the
aquatic environment. A first list of 33 priority substances or groups of substances has been selected on
the basis of the COMMPS (combined monitoring-based and modeling-based priority setting) scheme,
developed by the Commission.
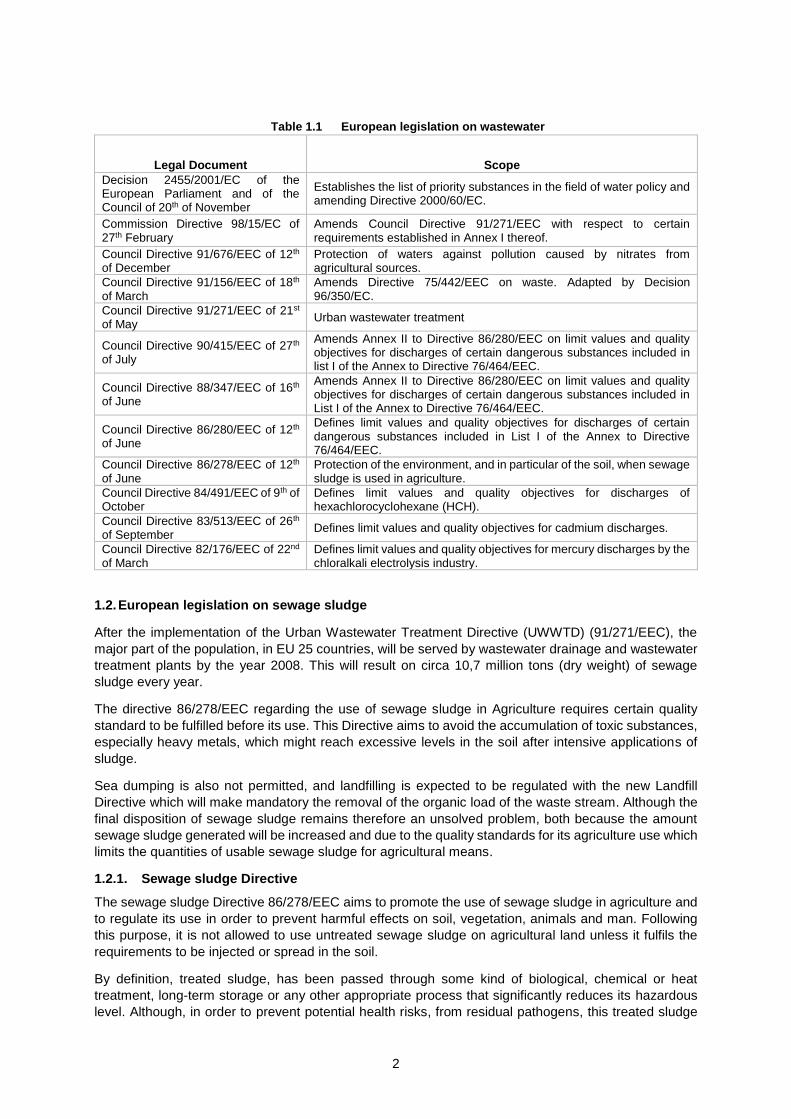
Table 1.1 lists the main EU Legislation on wastewater.
2
Table 1.1 European legislation on wastewater
Legal Document Scope
Decision 2455/2001/EC of the European Parliament and of the Council of 20th of November
Establishes the list of priority substances in the field of water policy and amending Directive 2000/60/EC.
Commission Directive 98/15/EC of 27th February
Amends Council Directive 91/271/EEC with respect to certain requirements established in Annex I thereof.
Council Directive 91/676/EEC of 12th of December
Protection of waters against pollution caused by nitrates from agricultural sources.
Council Directive 91/156/EEC of 18th of March
Amends Directive 75/442/EEC on waste. Adapted by Decision 96/350/EC.
Council Directive 91/271/EEC of 21st of May
Urban wastewater treatment
Council Directive 90/415/EEC of 27th of July
Amends Annex II to Directive 86/280/EEC on limit values and quality objectives for discharges of certain dangerous substances included in list I of the Annex to Directive 76/464/EEC.
Council Directive 88/347/EEC of 16th of June
Amends Annex II to Directive 86/280/EEC on limit values and quality objectives for discharges of certain dangerous substances included in List I of the Annex to Directive 76/464/EEC.
Council Directive 86/280/EEC of 12th of June
Defines limit values and quality objectives for discharges of certain dangerous substances included in List I of the Annex to Directive 76/464/EEC.
Council Directive 86/278/EEC of 12th of June
Protection of the environment, and in particular of the soil, when sewage sludge is used in agriculture.
Council Directive 84/491/EEC of 9th of October
Defines limit values and quality objectives for discharges of hexachlorocyclohexane (HCH).
Council Directive 83/513/EEC of 26th of September
Defines limit values and quality objectives for cadmium discharges.
Council Directive 82/176/EEC of 22nd of March
Defines limit values and quality objectives for mercury discharges by the chloralkali electrolysis industry.
1.2. European legislation on sewage sludge
After the implementation of the Urban Wastewater Treatment Directive (UWWTD) (91/271/EEC), the
major part of the population, in EU 25 countries, will be served by wastewater drainage and wastewater
treatment plants by the year 2008. This will result on circa 10,7 million tons (dry weight) of sewage
sludge every year.
The directive 86/278/EEC regarding the use of sewage sludge in Agriculture requires certain quality
standard to be fulfilled before its use. This Directive aims to avoid the accumulation of toxic substances,
especially heavy metals, which might reach excessive levels in the soil after intensive applications of
sludge.
Sea dumping is also not permitted, and landfilling is expected to be regulated with the new Landfill
Directive which will make mandatory the removal of the organic load of the waste stream. Although the
final disposition of sewage sludge remains therefore an unsolved problem, both because the amount
sewage sludge generated will be increased and due to the quality standards for its agriculture use which
limits the quantities of usable sewage sludge for agricultural means.
1.2.1. Sewage sludge Directive
The sewage sludge Directive 86/278/EEC aims to promote the use of sewage sludge in agriculture and
to regulate its use in order to prevent harmful effects on soil, vegetation, animals and man. Following
this purpose, it is not allowed to use untreated sewage sludge on agricultural land unless it fulfils the
requirements to be injected or spread in the soil.
By definition, treated sludge, has been passed through some kind of biological, chemical or heat
treatment, long-term storage or any other appropriate process that significantly reduces its hazardous
level. Although, in order to prevent potential health risks, from residual pathogens, this treated sludge
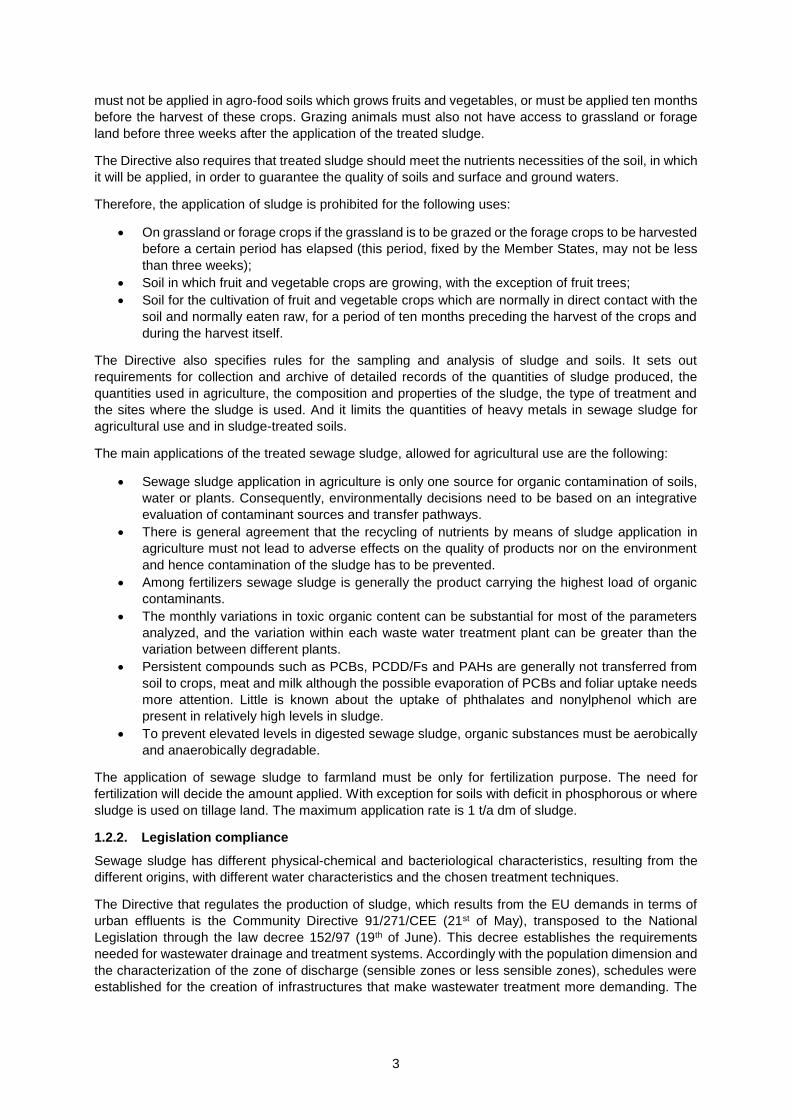
3
must not be applied in agro-food soils which grows fruits and vegetables, or must be applied ten months
before the harvest of these crops. Grazing animals must also not have access to grassland or forage
land before three weeks after the application of the treated sludge.
The Directive also requires that treated sludge should meet the nutrients necessities of the soil, in which
it will be applied, in order to guarantee the quality of soils and surface and ground waters.
Therefore, the application of sludge is prohibited for the following uses:
On grassland or forage crops if the grassland is to be grazed or the forage crops to be harvested
before a certain period has elapsed (this period, fixed by the Member States, may not be less
than three weeks);
Soil in which fruit and vegetable crops are growing, with the exception of fruit trees;
Soil for the cultivation of fruit and vegetable crops which are normally in direct contact with the
soil and normally eaten raw, for a period of ten months preceding the harvest of the crops and
during the harvest itself.
The Directive also specifies rules for the sampling and analysis of sludge and soils. It sets out
requirements for collection and archive of detailed records of the quantities of sludge produced, the
quantities used in agriculture, the composition and properties of the sludge, the type of treatment and
the sites where the sludge is used. And it limits the quantities of heavy metals in sewage sludge for
agricultural use and in sludge-treated soils.
The main applications of the treated sewage sludge, allowed for agricultural use are the following:
Sewage sludge application in agriculture is only one source for organic contamination of soils,
water or plants. Consequently, environmentally decisions need to be based on an integrative
evaluation of contaminant sources and transfer pathways.
There is general agreement that the recycling of nutrients by means of sludge application in
agriculture must not lead to adverse effects on the quality of products nor on the environment
and hence contamination of the sludge has to be prevented.
Among fertilizers sewage sludge is generally the product carrying the highest load of organic
contaminants.
The monthly variations in toxic organic content can be substantial for most of the parameters
analyzed, and the variation within each waste water treatment plant can be greater than the
variation between different plants.
Persistent compounds such as PCBs, PCDD/Fs and PAHs are generally not transferred from
soil to crops, meat and milk although the possible evaporation of PCBs and foliar uptake needs
more attention. Little is known about the uptake of phthalates and nonylphenol which are
present in relatively high levels in sludge.
To prevent elevated levels in digested sewage sludge, organic substances must be aerobically
and anaerobically degradable.
The application of sewage sludge to farmland must be only for fertilization purpose. The need for
fertilization will decide the amount applied. With exception for soils with deficit in phosphorous or where
sludge is used on tillage land. The maximum application rate is 1 t/a dm of sludge.
1.2.2. Legislation compliance
Sewage sludge has different physical-chemical and bacteriological characteristics, resulting from the
different origins, with different water characteristics and the chosen treatment techniques.
The Directive that regulates the production of sludge, which results from the EU demands in terms of
urban effluents is the Community Directive 91/271/CEE (21st of May), transposed to the National
Legislation through the law decree 152/97 (19th of June). This decree establishes the requirements
needed for wastewater drainage and treatment systems. Accordingly with the population dimension and
the characterization of the zone of discharge (sensible zones or less sensible zones), schedules were
established for the creation of infrastructures that make wastewater treatment more demanding. The
4
above mentioned Directive prohibits the sludge deposition in superficial waters since December 31st of
1998.
The sludge which results from the treatment in the liquid stage, presents a very low concentration of
solids, which makes it difficult to transport and handle. Another problem related to the management of
this product lies in the risk of its degradation. Thus, in order to reduce the occupied volume and to avoid
the release of unpleasant odours (resulting from organic matter decomposition) this product is subjected
to treatment or stabilisation. There are several processes for treating the sludge, integrating physical
stages, chemical and/or biological, which creates a great variety of sludge characteristics, depending
on the treatment adopted. At the present time there still is inexistent a legislation that clearly specifies
the requirements for the sludge treatments. Nevertheless, a second draft version of the Directive for
biological treatment of “bio residues” is already known, and establishes the criteria for treatment to apply
to the organic waste, which includes the WWTP sludge.
The sludge management includes not only the treatment, but also the option for final destination, since
the availability of deposit sites is decreasing. These final destination options should be technically viable
and cost-effective. Although there are a great variety of techniques for final sludge deposition, and the
majority fit into one of the three main categories: application to the soil, deposition into landfills and
thermal technologies. These techniques are, as expected, the ones who draw the most complete
legislative frame.
If the agricultural valorisation can be considered as an adequate final destination, then the sludge is
subjected to what lies in the Directive 86/278/CEE (12th of June), which was transposed into the national
legislation through the decree 446/91 (22nd of November). This decree concerns the protection of the
soils which are subjected to the use of sludge coming from water and sludge waters. The law decree
176/96 (2nd series) and 177/96 (2nd series), issued in October 3rd, establish the maximum concentration
in heavy metals present in the sludge and in the soils where the sludge will be applied, and the rules
relative to the sludge and soil analyses.
In terms of the near future, a new Community Directive is being prepared (the draft version is already
known – ENV. E. 3/LM, April 27, 2000). This document establishes that the sludge should be applied to
the soils whenever benefits can be taken from this action, in terms of the cultures growing, or as a
conditioner for the soil. If the application conditions and established value-limits are confirmed in the
future, the agricultural valorisation will become a less used solution, since the sludge can hardly comply
with the established parameters.
In conditions where the sludge cannot be applied to the soil, due to environmental, geographical or
political constraints, they are included in another category of residue which regulates the handling
principles for these materials.
The guidelines for waste management are established in the Directive 91/156/CEE (15th of June), which
was adopted by the decision n 96/350/CE. In Portugal, these Directives were transposed through the
law decree 239//97 (9th of September), while the requirements for storage, treatment, valorisation and
elimination of waste are established by the law decree 961/98 (10th of November). As for the
transportation in the National territory, the norms are defined in the decree 335/97, dated May 16th.
Due to the specificity of its characteristics, the sludge is considered to be dangerous waste. As such,
they are subject to legislation that regulates this type of residues, namely the Directive 91/689/CE,
changed by the Directive 94/31/CE.
The incineration is one of the possible processes to adopt for waste elimination. In result of the
environmental risks that are involved, in terms of air emissions, the subject was regulated through EU
norms, such as the Directive 89/369/CEE (8th of June) and 89/429/CEE (21st of June) concerning,
respectively, the prevention and reduction of air pollution coming from the new urban waste incineration
facilities. The transposition of the Directive 89/369/CEE to the National law was made through the law
decree 352/90 (9th of November), and regulated through the law decree 286/93 (12th of March), recently
altered by the decree 125/97, from February 21st.
5
The incineration processes for dangerous and non-dangerous waste are regulated, respectively, by the
Directives 94/67/CE (16th of December) and 2000/76/CE (4th of December), and have as their major
objectives the prevention and reduction of the negative effects of these activities for the environment.
Later on, the Directive 2000/767/CE revokes the former Directives 89/369/CEE and 89/429/CEE, in
order to promote the adoption of more restrictive measures. This Directive also establishes that there
should be a common Directive to regulate both incineration and co-incineration of dangerous and non-
dangerous wastes, with a structure similar to the Directive 94/67/CEE.
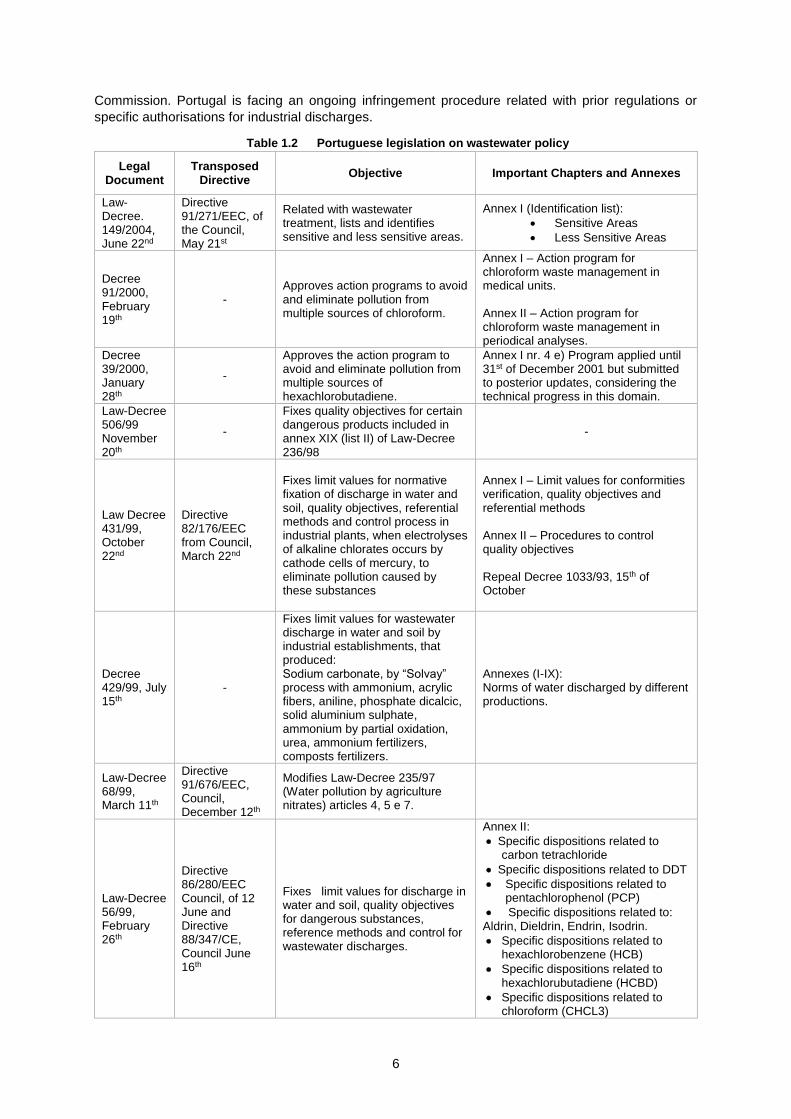
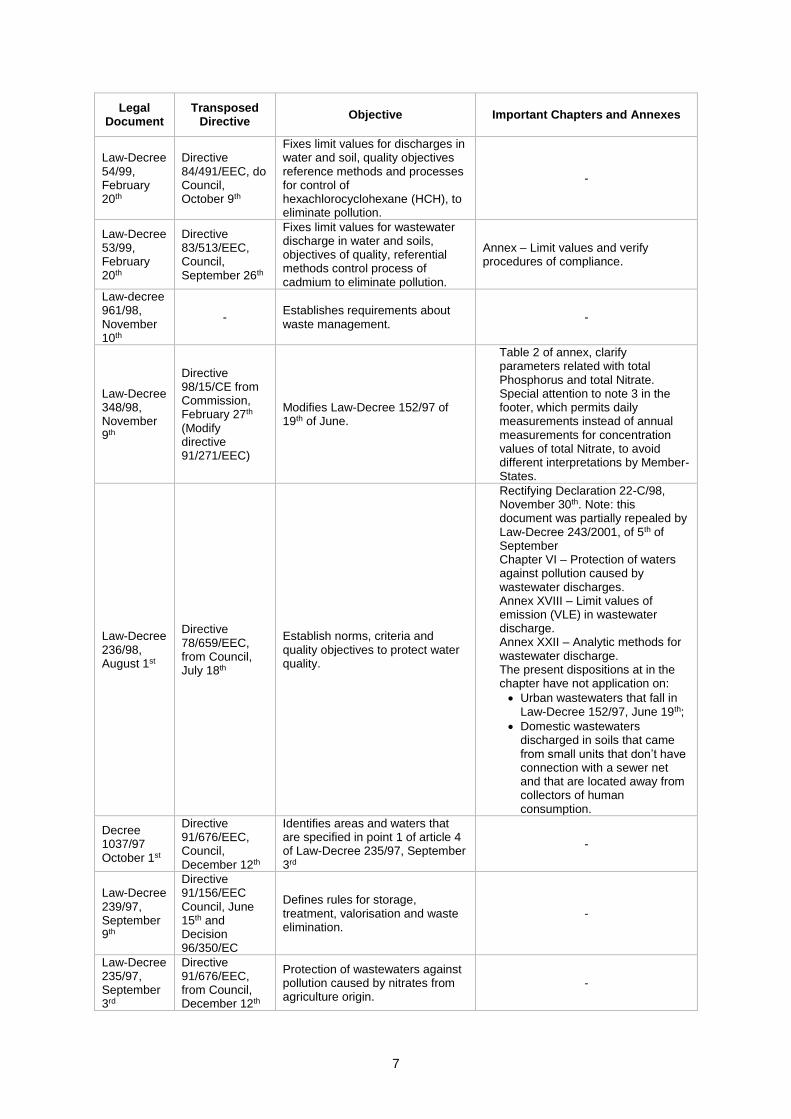
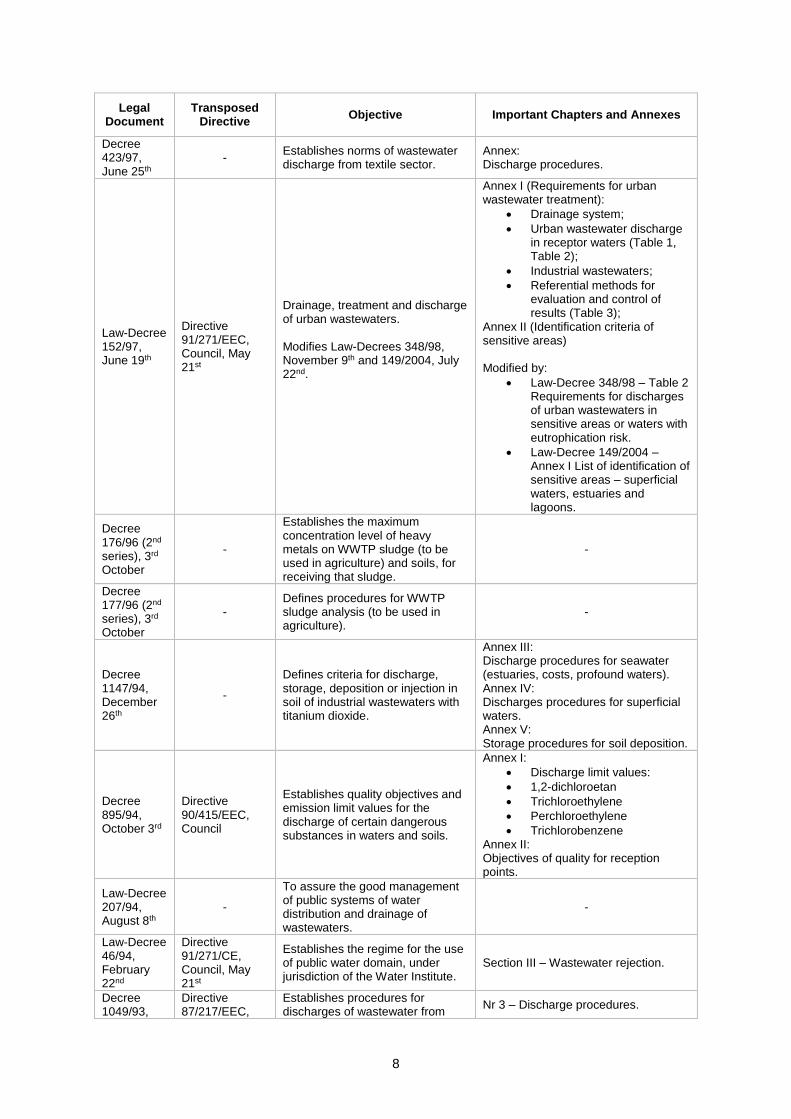
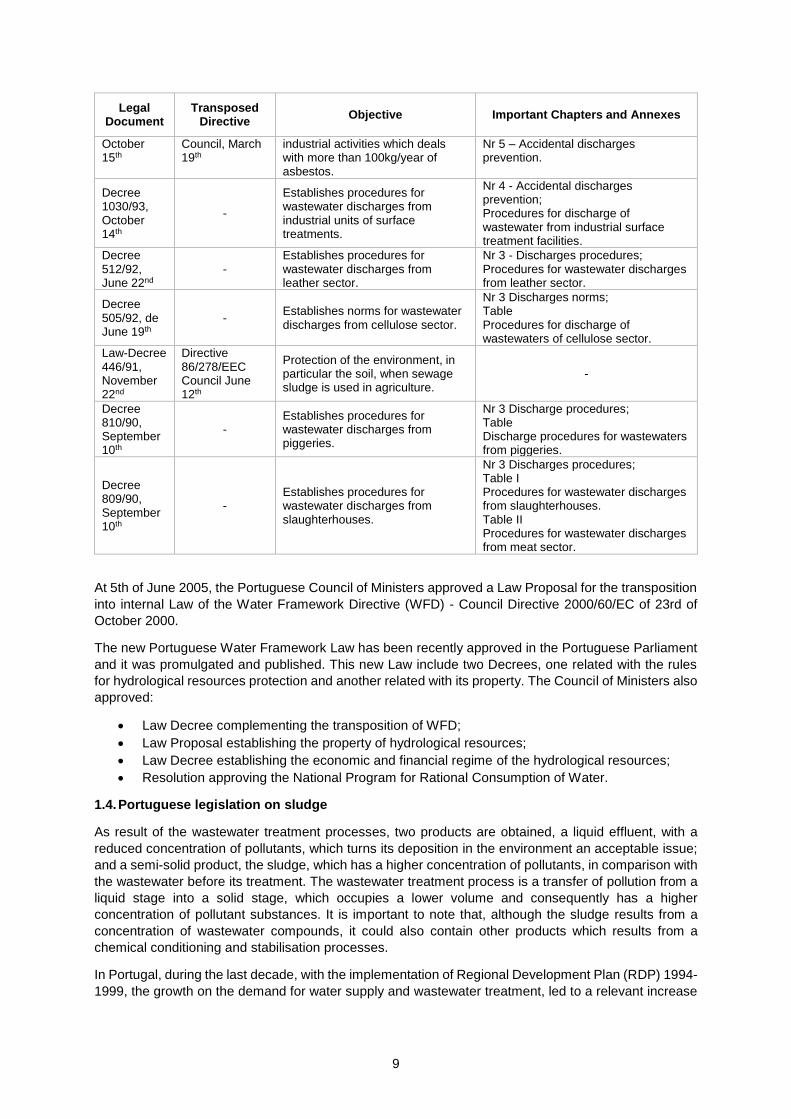
1.3. Portuguese legislation on wastewater
Over the last decade, Portuguese legislation concerning water policy has been growing considerably
mainly due to the necessity to transpose European Legislation, but also due to the necessity to fulfil the
objectives and achieve the targets defined by national strategies and policies aiming the sustainable
development of urban water services. The most important Portuguese laws are briefly described in Erro!
A origem da referência não foi encontrada..
Council Directive 91/271/EEC of 21st of May, concerning urban wastewater treatment, was transposed
to the Portuguese Law. Were transposed the parts related to the conception of drainage and treatment
systems (law Decree 23/95 of 23rd of August) and industrial and urban wastewaters discharge licenses
regime (Law Decrees 45/94, 46/94 and 47/94, of 22nd of February). The transposition was completed
with the publication of Law Decree 152/97 of 19th of June, which establishes rules for the discharge of
urban wastewaters in aquatic media.
Law-decree 152/97 defines several requirements for treated urban wastewater discharges, taking into
consideration the dimension of population agglomerations and the classification of the receptor media
(sensitive or less sensitive areas). The sludge resulting from wastewater treatment, according to this
diploma, should be reused whenever possible. Its discharge to surface waters is strictly forbidden and
its elimination should be performed under authorization from competent authorities. The main
requirements established by this diploma are related with:
The construction, conception and maintenance of wastewater collecting systems;
The quality of WWTP effluents discharged in aquatic media (maximum concentration levels,
minimum percentage reduction, selection of discharge points);
The quality of WWTP effluents discharged in sensitive areas with risk of eutrophication;
Pre-treatment (when necessary) of industrial effluents prior to their discharge in collecting
systems;
Sample collection, control reference methods and evaluation of results;
The deadlines for the implementation of collecting systems and secondary treatment in WWTP
(depending on the population size).
The deadlines for the implementation of collecting systems and secondary treatment in WWTP,
according to the dimension of the population served, are the same of those defined by Council Directive
91/271/EEC of 21st of May, and described before in this document (see European Legislation).
In the second Commission report on the Implementation of Council Directive 91/271/EEC of 21st of May,
dated 31st of December 1998, the Commission believes that all Portuguese agglomerations of more
than 15.000 p.e. should have at least secondary treatment on 31st of December 2000, including those
which discharge into the less sensitive areas identified by the Portuguese authorities.
In October 1999, the Portuguese authorities sent to the Commission a list of 27 agglomerations of more
than 10.000 p.e. situated in the catchments areas of the sensitive areas identified by Portugal. On 31st
December 1998, only five of these 27 agglomerations were in conformity with the provisions of the
Directive. The Portuguese authorities proposed then to achieve compliance for the other agglomerations
in 2003 at the latest.
According to the third Commission report (2004), Portugal has implemented the main obligations of
Council Directive 91/271/EEC, although some exercises may still not be necessarily approved by the
6
Commission. Portugal is facing an ongoing infringement procedure related with prior regulations or
specific authorisations for industrial discharges.
Table 1.2 Portuguese legislation on wastewater policy
Legal Document
Transposed Directive
Objective Important Chapters and Annexes
Law-Decree. 149/2004, June 22nd
Directive 91/271/EEC, of the Council, May 21st
Related with wastewater treatment, lists and identifies sensitive and less sensitive areas.
Annex I (Identification list):
Sensitive Areas
Less Sensitive Areas
Decree 91/2000, February 19th
- Approves action programs to avoid and eliminate pollution from multiple sources of chloroform.
Annex I – Action program for chloroform waste management in medical units. Annex II – Action program for chloroform waste management in periodical analyses.
Decree 39/2000, January 28th
-
Approves the action program to avoid and eliminate pollution from multiple sources of hexachlorobutadiene.
Annex I nr. 4 e) Program applied until 31st of December 2001 but submitted to posterior updates, considering the technical progress in this domain.
Law-Decree 506/99 November 20th
-
Fixes quality objectives for certain dangerous products included in annex XIX (list II) of Law-Decree 236/98
-
Law Decree 431/99, October 22nd
Directive 82/176/EEC from Council, March 22nd
Fixes limit values for normative fixation of discharge in water and soil, quality objectives, referential methods and control process in industrial plants, when electrolyses of alkaline chlorates occurs by cathode cells of mercury, to eliminate pollution caused by these substances
Annex I – Limit values for conformities verification, quality objectives and referential methods Annex II – Procedures to control quality objectives Repeal Decree 1033/93, 15th of October
Decree 429/99, July 15th
-
Fixes limit values for wastewater discharge in water and soil by industrial establishments, that produced: Sodium carbonate, by “Solvay” process with ammonium, acrylic fibers, aniline, phosphate dicalcic, solid aluminium sulphate, ammonium by partial oxidation, urea, ammonium fertilizers, composts fertilizers.
Annexes (I-IX): Norms of water discharged by different productions.
Law-Decree 68/99, March 11th
Directive 91/676/EEC, Council, December 12th
Modifies Law-Decree 235/97 (Water pollution by agriculture nitrates) articles 4, 5 e 7.
Law-Decree 56/99, February 26th
Directive 86/280/EEC Council, of 12 June and Directive 88/347/CE, Council June 16th
Fixes limit values for discharge in water and soil, quality objectives for dangerous substances, reference methods and control for wastewater discharges.
Annex II:
Specific dispositions related to carbon tetrachloride
Specific dispositions related to DDT
Specific dispositions related to pentachlorophenol (PCP)
Specific dispositions related to: Aldrin, Dieldrin, Endrin, Isodrin.
Specific dispositions related to hexachlorobenzene (HCB)
Specific dispositions related to hexachlorubutadiene (HCBD)
Specific dispositions related to chloroform (CHCL3)
7
Legal Document
Transposed Directive
Objective Important Chapters and Annexes
Law-Decree 54/99, February 20th
Directive 84/491/EEC, do Council, October 9th
Fixes limit values for discharges in water and soil, quality objectives reference methods and processes for control of hexachlorocyclohexane (HCH), to eliminate pollution.
-
Law-Decree 53/99, February 20th
Directive 83/513/EEC, Council, September 26th
Fixes limit values for wastewater discharge in water and soils, objectives of quality, referential methods control process of cadmium to eliminate pollution.
Annex – Limit values and verify procedures of compliance.
Law-decree 961/98, November 10th
- Establishes requirements about waste management.
-
Law-Decree 348/98, November 9th
Directive 98/15/CE from Commission, February 27th (Modify directive 91/271/EEC)
Modifies Law-Decree 152/97 of 19th of June.
Table 2 of annex, clarify parameters related with total Phosphorus and total Nitrate. Special attention to note 3 in the footer, which permits daily measurements instead of annual measurements for concentration values of total Nitrate, to avoid different interpretations by Member-States.
Law-Decree 236/98, August 1st
Directive 78/659/EEC, from Council, July 18th
Establish norms, criteria and quality objectives to protect water quality.
Rectifying Declaration 22-C/98, November 30th. Note: this document was partially repealed by Law-Decree 243/2001, of 5th of September Chapter VI – Protection of waters against pollution caused by wastewater discharges. Annex XVIII – Limit values of emission (VLE) in wastewater discharge. Annex XXII – Analytic methods for wastewater discharge. The present dispositions at in the chapter have not application on:
Urban wastewaters that fall in Law-Decree 152/97, June 19th;
Domestic wastewaters discharged in soils that came from small units that don’t have connection with a sewer net and that are located away from collectors of human consumption.
Decree 1037/97 October 1st
Directive 91/676/EEC, Council, December 12th
Identifies areas and waters that are specified in point 1 of article 4
of Law-Decree 235/97, September 3rd
-
Law-Decree 239/97, September 9th
Directive 91/156/EEC Council, June 15th and Decision 96/350/EC
Defines rules for storage, treatment, valorisation and waste elimination.
-
Law-Decree 235/97, September 3rd
Directive 91/676/EEC, from Council, December 12th
Protection of wastewaters against pollution caused by nitrates from agriculture origin.
-
8
Legal Document
Transposed Directive
Objective Important Chapters and Annexes
Decree 423/97, June 25th
- Establishes norms of wastewater discharge from textile sector.
Annex: Discharge procedures.
Law-Decree 152/97, June 19th
Directive 91/271/EEC, Council, May 21st
Drainage, treatment and discharge of urban wastewaters. Modifies Law-Decrees 348/98, November 9th and 149/2004, July 22nd.
Annex I (Requirements for urban wastewater treatment):
Drainage system;
Urban wastewater discharge in receptor waters (Table 1, Table 2);
Industrial wastewaters;
Referential methods for evaluation and control of results (Table 3);
Annex II (Identification criteria of sensitive areas) Modified by:
Law-Decree 348/98 – Table 2 Requirements for discharges of urban wastewaters in sensitive areas or waters with eutrophication risk.
Law-Decree 149/2004 – Annex I List of identification of sensitive areas – superficial waters, estuaries and lagoons.
Decree 176/96 (2nd series), 3rd October
-
Establishes the maximum concentration level of heavy metals on WWTP sludge (to be used in agriculture) and soils, for receiving that sludge.
-
Decree 177/96 (2nd series), 3rd October
- Defines procedures for WWTP sludge analysis (to be used in agriculture).
-
Decree 1147/94, December 26th
-
Defines criteria for discharge, storage, deposition or injection in soil of industrial wastewaters with titanium dioxide.
Annex III: Discharge procedures for seawater (estuaries, costs, profound waters). Annex IV: Discharges procedures for superficial waters. Annex V: Storage procedures for soil deposition.
Decree 895/94, October 3rd
Directive 90/415/EEC, Council
Establishes quality objectives and emission limit values for the discharge of certain dangerous substances in waters and soils.
Annex I:
Discharge limit values:
1,2-dichloroetan
Trichloroethylene
Perchloroethylene
Trichlorobenzene Annex II: Objectives of quality for reception points.
Law-Decree 207/94, August 8th
-
To assure the good management of public systems of water distribution and drainage of wastewaters.
-
Law-Decree 46/94, February 22nd
Directive 91/271/CE, Council, May 21st
Establishes the regime for the use of public water domain, under jurisdiction of the Water Institute.
Section III – Wastewater rejection.
Decree 1049/93,
Directive 87/217/EEC,
Establishes procedures for discharges of wastewater from
Nr 3 – Discharge procedures.
9
Legal Document
Transposed Directive
Objective Important Chapters and Annexes
October 15th
Council, March 19th
industrial activities which deals with more than 100kg/year of asbestos.
Nr 5 – Accidental discharges prevention.
Decree 1030/93, October 14th
-
Establishes procedures for wastewater discharges from industrial units of surface treatments.
Nr 4 - Accidental discharges prevention; Procedures for discharge of wastewater from industrial surface treatment facilities.
Decree 512/92, June 22nd
- Establishes procedures for wastewater discharges from leather sector.
Nr 3 - Discharges procedures; Procedures for wastewater discharges from leather sector.
Decree 505/92, de June 19th
- Establishes norms for wastewater discharges from cellulose sector.
Nr 3 Discharges norms; Table Procedures for discharge of wastewaters of cellulose sector.
Law-Decree 446/91, November 22nd
Directive 86/278/EEC Council June 12th
Protection of the environment, in particular the soil, when sewage sludge is used in agriculture.
-
Decree 810/90, September 10th
- Establishes procedures for wastewater discharges from piggeries.
Nr 3 Discharge procedures; Table Discharge procedures for wastewaters from piggeries.
Decree 809/90, September 10th
- Establishes procedures for wastewater discharges from slaughterhouses.
Nr 3 Discharges procedures; Table I Procedures for wastewater discharges from slaughterhouses. Table II Procedures for wastewater discharges from meat sector.
At 5th of June 2005, the Portuguese Council of Ministers approved a Law Proposal for the transposition
into internal Law of the Water Framework Directive (WFD) - Council Directive 2000/60/EC of 23rd of
October 2000.
The new Portuguese Water Framework Law has been recently approved in the Portuguese Parliament
and it was promulgated and published. This new Law include two Decrees, one related with the rules
for hydrological resources protection and another related with its property. The Council of Ministers also
approved:
Law Decree complementing the transposition of WFD;
Law Proposal establishing the property of hydrological resources;
Law Decree establishing the economic and financial regime of the hydrological resources;
Resolution approving the National Program for Rational Consumption of Water.
1.4. Portuguese legislation on sludge
As result of the wastewater treatment processes, two products are obtained, a liquid effluent, with a
reduced concentration of pollutants, which turns its deposition in the environment an acceptable issue;
and a semi-solid product, the sludge, which has a higher concentration of pollutants, in comparison with
the wastewater before its treatment. The wastewater treatment process is a transfer of pollution from a
liquid stage into a solid stage, which occupies a lower volume and consequently has a higher
concentration of pollutant substances. It is important to note that, although the sludge results from a
concentration of wastewater compounds, it could also contain other products which results from a
chemical conditioning and stabilisation processes.
In Portugal, during the last decade, with the implementation of Regional Development Plan (RDP) 1994-
1999, the growth on the demand for water supply and wastewater treatment, led to a relevant increase
10
of the production of sludge, and a consequent rise of costs related with the sludge management,
concerning its treatment, transportation and final destination.
The treatment of sludge is a complex process, and is more difficult in areas with a higher population
density, such as the coastal region between Setúbal and Viana do Castelo and Algarve coast. The
difficulty results from the conjunction of three major factors: the dimension of the population served, the
high quality level of wastewater treatment in the coastal areas and the lack of available areas for the
sludge final deposition.
According to the RDP 2000-2006, it is foreseen that the service will grow, covering 96% of the population
in water supply and 90% in drainage and wastewater treatment. Additionally, the compliance with the
Community Directive 91/271/CEE, of 21st of May, and subsequently transposed into the National
Legislation through the law decree 152/97 of 19th of June, implies that wastewater from locations with
more than 2000 people must be subjected, at least, to secondary treatment, depending on its discharge
location. This will result in a significant increase of the sludge production, in a short period of time, and
consequently will cause a rise on the costs associated with its treatment and disposal. One of the
problems caused by the compliance with the objectives established by the Strategic Plan for Water
Supply and Wastewater Treatment is the inefficient management plans for the sludge resulting from the
treatment processes.
1.5. Municipal wastewater drainage – SMAS de Sintra regulations
Many Municipalities in Portugal have implemented municipal regulations for the discharge of wastewater
into their collectors. Were defined maximum levels for pollutants and published several norms regarding
the protection of the collecting systems, in order to assure the safeguard of infrastructures, the effective
treatment in WWTP and the good quality of the final effluent, according to the national legislation.
Municipal regulations also define responsibilities for the installation and maintenance of collectors,
inspection, audit activities, prevention of fresh water contamination, forbidden dumping, tariffs and other
activities.
SMAS de Sintra, as the water management entity, are responsible for the conception, construction and
exploitation of the public wastewater drainage systems of Sintra municipality. SMAS de Sintra is
responsible for the operation and management of 11 small WWTP, most of them located in coastal
areas.
The Municipal Wastewater Discharge Regulation established by SMAS Sintra (SMAS MWDR), was
prepared in compliance with the disposed on Law-Decree 207/94 of 6th of August 1994 and with the
Regulation Decree 23/95 of 23rd of August. It is valid since 1997, after being subjected to public
discussion and approved in Municipal Assembly with the main specifications described below:
SMAS de Sintra is responsible for the management of the public drainage system and
responsible for its connection with the buildings. The maintenance and repair of these
infrastructures is also the responsibility of SMAS (except when damages are caused by third
parties);
All drainage projects must be performed in accordance with a project of civil engineering,
previously approved by SMAS de Sintra;
The consumer or end-user is responsible for the conservation and repair of building’s drainage
systems;
SMAS de Sintra may proceed to inspection activities during and after de construction of
building’s drainage systems;
All building’s drainage systems will be connected to a public collector after its compliance with
all requirements established by SMAS MWDR;
SMAS MWDR also establishes norms to prevent the contamination of fresh water by
wastewater;
It lists the materials and substances whose discharge into public collectors is strictly forbidden,
such as:
• inflammable and explosive substances;
11
• laboratory effluents;
• hospital effluents;
• sand;
• ashes;
• effluents with temperatures above 30ºC;
• wastewater sludge from septic tanks;
• oils and greases;
• food wastes;
• industrial effluents (containing dangerous substances to human life and for the
environment).
SMAS MWDR defines some norms related with the communication between SMAS de Sintra
and the system end-users, such as the responsibilities when damage in buildings occurs due to
inappropriate occurrences in the drainage system;
SMAS de Sintra may demand the installation of water/wastewater flow counters;
In order to support the costs associated with the construction and maintenance of collectors and
WWTP, SMAS de Sintra may charge connection, conservation and treatment tariffs to end-
users;
SMAS de Sintra also has another regulation, the Industrial Wastewater Discharge Regulation (IWDR),
with the objective to ensure that industrial wastewater will not affect negatively WWTP staff health, the
durability and hydraulic conditions of flow ducts, interceptors and emissaries, the WWTP exploitation
conditions, the quality of effluents, the ecology conditions of the environment and the final destiny of the
produced sludge, according to the actual legislation.
The IWDR defines:
the industrial wastewaters characteristics for its discharge into municipal drainage systems (in
terms of forbidden substances, forbidden effluents and emission limit values);
a contingency plan after accidental discharges;
procedures for emission acceptance;
procedures for monitoring and control (inspection activities, self-control, etc.);
sample collection procedures, in-situ measurement procedures and analytical methodologies;
a formula for tariff calculation.
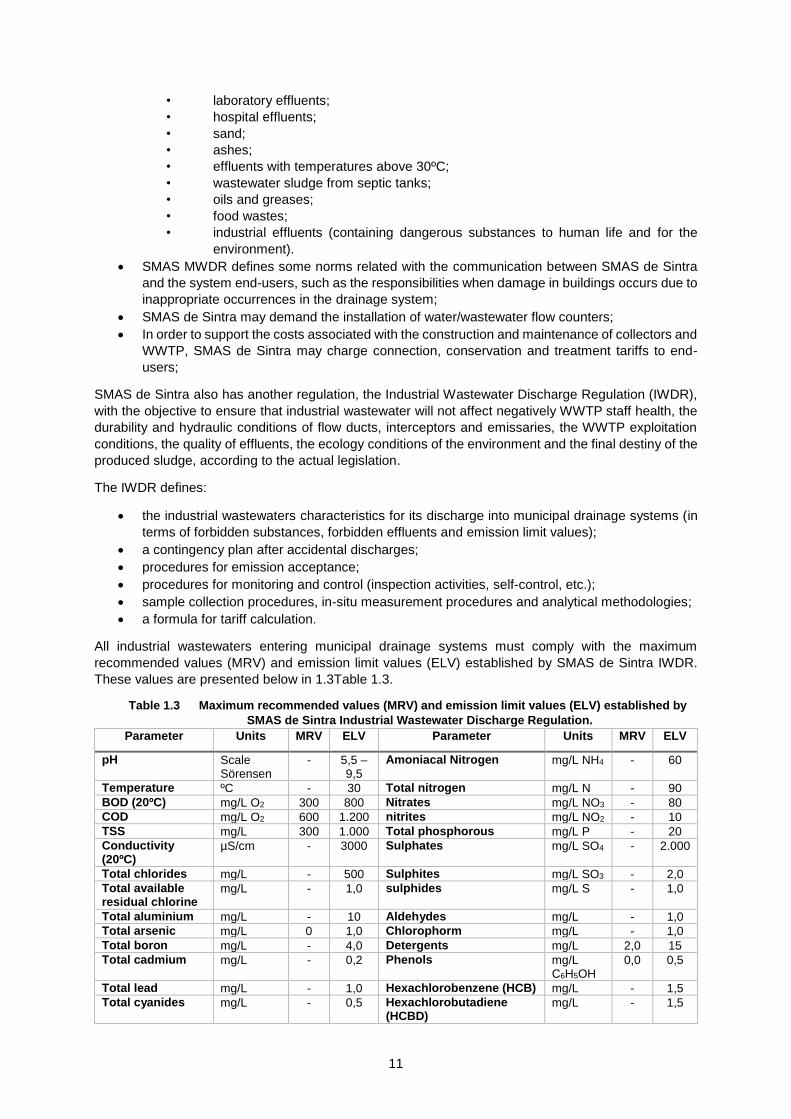
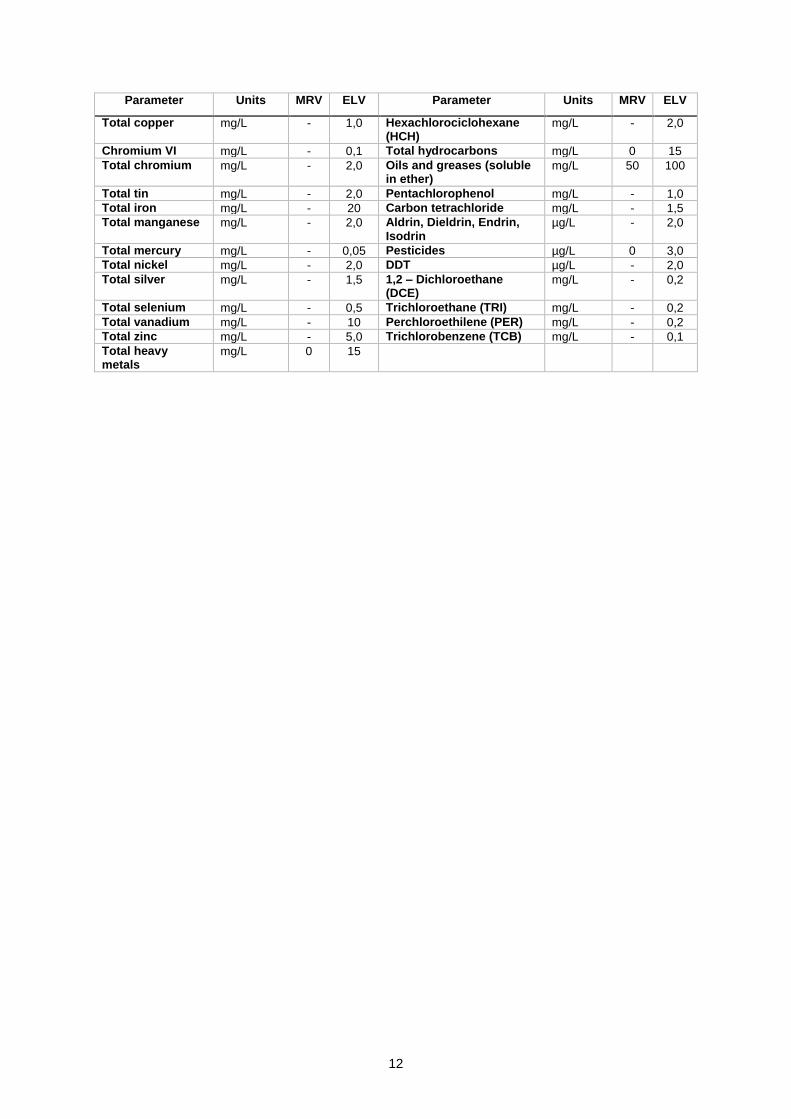
All industrial wastewaters entering municipal drainage systems must comply with the maximum
recommended values (MRV) and emission limit values (ELV) established by SMAS de Sintra IWDR.
These values are presented below in 1.3Table 1.3.
Table 1.3 Maximum recommended values (MRV) and emission limit values (ELV) established by
SMAS de Sintra Industrial Wastewater Discharge Regulation.
Parameter Units MRV ELV Parameter Units MRV ELV
pH Scale Sörensen
- 5,5 – 9,5
Amoniacal Nitrogen mg/L NH4 - 60
Temperature ºC - 30 Total nitrogen mg/L N - 90
BOD (20ºC) mg/L O2 300 800 Nitrates mg/L NO3 - 80
COD mg/L O2 600 1.200 nitrites mg/L NO2 - 10
TSS mg/L 300 1.000 Total phosphorous mg/L P - 20
Conductivity (20ºC)
µS/cm - 3000 Sulphates mg/L SO4 - 2.000
Total chlorides mg/L - 500 Sulphites mg/L SO3 - 2,0
Total available residual chlorine
mg/L - 1,0 sulphides mg/L S - 1,0
Total aluminium mg/L - 10 Aldehydes mg/L - 1,0
Total arsenic mg/L 0 1,0 Chlorophorm mg/L - 1,0
Total boron mg/L - 4,0 Detergents mg/L 2,0 15
Total cadmium mg/L - 0,2 Phenols mg/L C6H5OH
0,0 0,5
Total lead mg/L - 1,0 Hexachlorobenzene (HCB) mg/L - 1,5
Total cyanides mg/L - 0,5 Hexachlorobutadiene (HCBD)
mg/L - 1,5
12
Parameter Units MRV ELV Parameter Units MRV ELV
Total copper mg/L - 1,0 Hexachlorociclohexane (HCH)
mg/L - 2,0
Chromium VI mg/L - 0,1 Total hydrocarbons mg/L 0 15
Total chromium mg/L - 2,0 Oils and greases (soluble in ether)
mg/L 50 100
Total tin mg/L - 2,0 Pentachlorophenol mg/L - 1,0
Total iron mg/L - 20 Carbon tetrachloride mg/L - 1,5
Total manganese mg/L - 2,0 Aldrin, Dieldrin, Endrin, Isodrin
µg/L - 2,0
Total mercury mg/L - 0,05 Pesticides µg/L 0 3,0
Total nickel mg/L - 2,0 DDT µg/L - 2,0
Total silver mg/L - 1,5 1,2 – Dichloroethane (DCE)
mg/L - 0,2
Total selenium mg/L - 0,5 Trichloroethane (TRI) mg/L - 0,2
Total vanadium mg/L - 10 Perchloroethilene (PER) mg/L - 0,2
Total zinc mg/L - 5,0 Trichlorobenzene (TCB) mg/L - 0,1
Total heavy metals
mg/L 0 15
13
2. Portuguese chronological water policies
2.1. Evolution of the strategy and planning in the water sector
The earliest activity related with the compilation of information about demography, water distribution,
sanitary systems and municipal activity remounts to 1934. At this time, the biggest concern was to
compile an inventory which integrates economic data, namely data related with water tariffs.
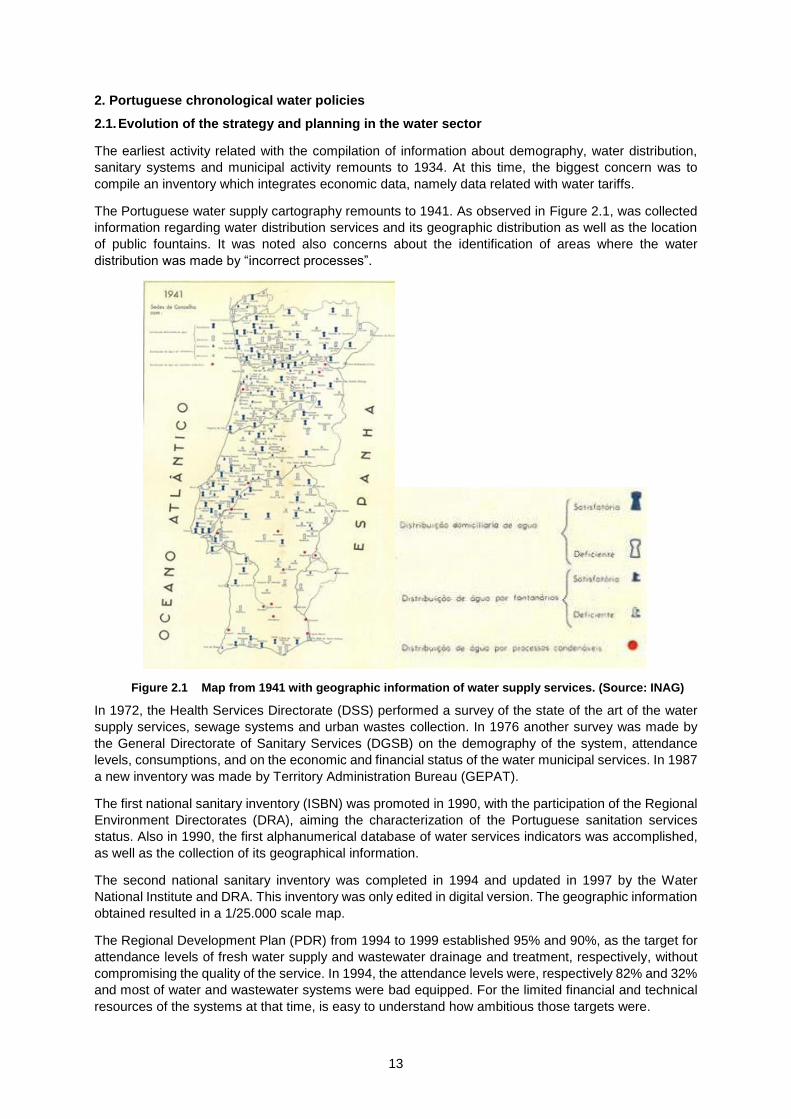
The Portuguese water supply cartography remounts to 1941. As observed in Figure 2.1, was collected
information regarding water distribution services and its geographic distribution as well as the location
of public fountains. It was noted also concerns about the identification of areas where the water
distribution was made by “incorrect processes”.
Figure 2.1 Map from 1941 with geographic information of water supply services. (Source: INAG)
In 1972, the Health Services Directorate (DSS) performed a survey of the state of the art of the water
supply services, sewage systems and urban wastes collection. In 1976 another survey was made by
the General Directorate of Sanitary Services (DGSB) on the demography of the system, attendance
levels, consumptions, and on the economic and financial status of the water municipal services. In 1987
a new inventory was made by Territory Administration Bureau (GEPAT).
The first national sanitary inventory (ISBN) was promoted in 1990, with the participation of the Regional
Environment Directorates (DRA), aiming the characterization of the Portuguese sanitation services
status. Also in 1990, the first alphanumerical database of water services indicators was accomplished,
as well as the collection of its geographical information.
The second national sanitary inventory was completed in 1994 and updated in 1997 by the Water
National Institute and DRA. This inventory was only edited in digital version. The geographic information
obtained resulted in a 1/25.000 scale map.
The Regional Development Plan (PDR) from 1994 to 1999 established 95% and 90%, as the target for
attendance levels of fresh water supply and wastewater drainage and treatment, respectively, without
compromising the quality of the service. In 1994, the attendance levels were, respectively 82% and 32%
and most of water and wastewater systems were bad equipped. For the limited financial and technical
resources of the systems at that time, is easy to understand how ambitious those targets were.
14
There was a significant increase on the number of population served by water supply services (90% by
the year 2000) as well as a significant improvement of the service quality. The same evolution happened
with wastewater drainage and treatment services, reaching, by the year 2000 the attendance levels of
75% and 55%, for wastewater drainage and treatment, respectively. The installed capacity for
wastewater treatment was 70% and the main reason for the lower attendance level (55%) was due to
the inexistence connections between the municipal wastewater drainage systems and the existing
WWTP.
The Law-Decree 95/94 of 22nd of February 1994 was published in order to regulate the planning process
of the hydrological resources. This diploma allowed the elaboration and approval of 15 basin plans and
a national water plan. For this purpose, the Portuguese Continental territory was divided into 15 regions,
according with the main hydrographic basins and its adjacent coastal regions.
In 2000, all Hydrographic Basin Plans were concluded. They defined the regional strategies for an
adequate valorisation, protection and management of waters, for each hydrographic basin or for the
aggregation of smaller basins, according to the ministerial dispatch of 98/12/31 and according to the
Law Decree 45/94 of 22nd of February 1994. The Hydrographic Basin Plans have been updated until
1998 and a has a database with information on the water supply systems and wastewater collection and
treatment systems, as well as the same information georeferenciated on maps.
The National Water Plan, elaborated in the sequence of the Basin Plans and approved by Law Decree
112/2002 of 17th of April, defines the national strategies for the integrated management of the
Portuguese waters, supported by the results of the surveys on the current water situation which
promoted the definition of objectives and targets. The Regional Water Plans of Azores and Madeira
were approved, respectively in 2003 and 2004.
The National Water Plan and the Hydrographic Basin Plans were important documents for the
improvement of the hydrological management in the beginning of the XXI century. They were the main
planning documents, for the restructuring the management of the hydrological and, were fundamental
factor, for the achievement of effective and coherent hydrological policies.
The objectives defined by the most recent Regional Development Plan (PDR 2000-2006) aim the
consolidation of the targets defined by the previous PDR (1994-1999), by the improvement on the
attendance levels of fresh water supply and wastewater drainage and treatment, achieving respectively,
95% and 90%.
In order to assure the fulfilment of these objectives, the Ministry of Environment and Territory promoted
the realization of a Strategic Plan for Water Supply and Wastewater Drainage (PEAASAR) for the period
of 2000-2006. The main actions of this plan are the following:
Growth of existing water supply systems and wastewater drainage and treatment
systems, with the construction of new infrastructures;
Rehabilitation of WWTP;
Reduction of water losses and renewal of the distribution ducts and collectors;
Promotion of integrated solutions;
Reuse of treated effluents;
Promotion of rational water use;
Promotion of specialized technical training;
Promotion of the quality of water sources and of urban water services.
In order to successfully achieve the objectives of PEEASAR was also necessary to:
Comply with national and European legislation related with water quality and with the
conception, dimensioning, construction and exploitation of urban water cycle
infrastructures;
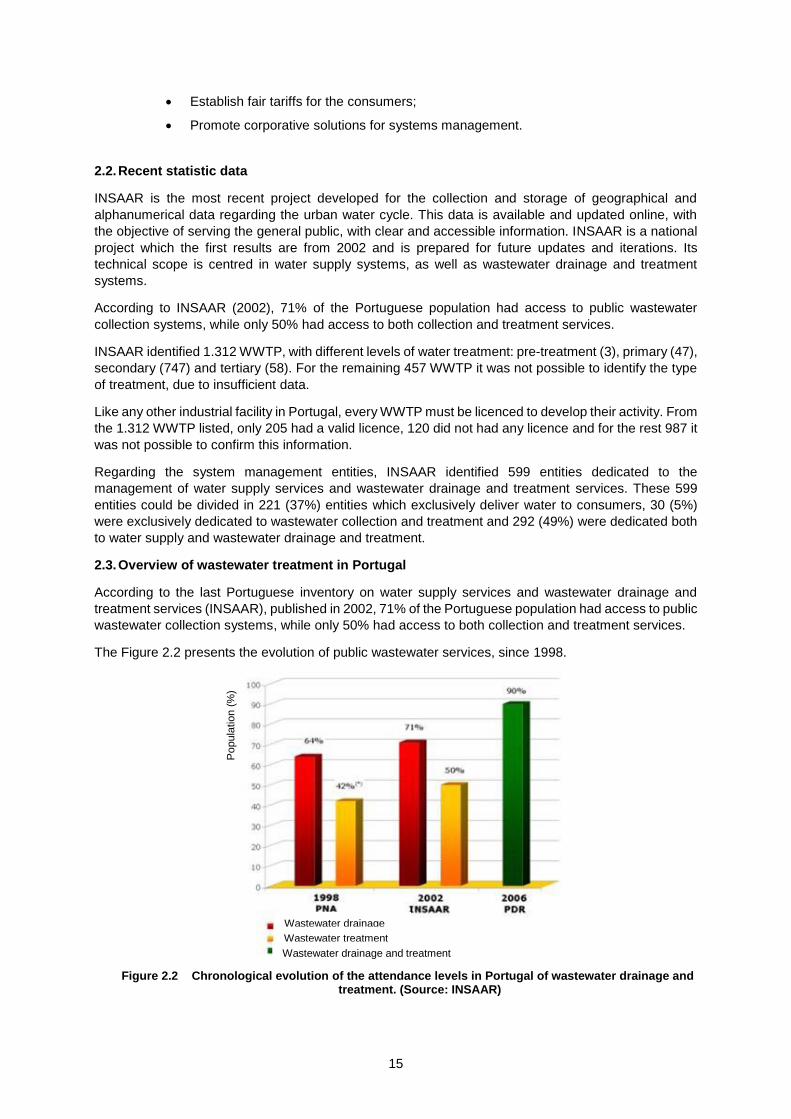
15
Establish fair tariffs for the consumers;
Promote corporative solutions for systems management.
2.2. Recent statistic data
INSAAR is the most recent project developed for the collection and storage of geographical and
alphanumerical data regarding the urban water cycle. This data is available and updated online, with
the objective of serving the general public, with clear and accessible information. INSAAR is a national
project which the first results are from 2002 and is prepared for future updates and iterations. Its
technical scope is centred in water supply systems, as well as wastewater drainage and treatment
systems.
According to INSAAR (2002), 71% of the Portuguese population had access to public wastewater
collection systems, while only 50% had access to both collection and treatment services.
INSAAR identified 1.312 WWTP, with different levels of water treatment: pre-treatment (3), primary (47),
secondary (747) and tertiary (58). For the remaining 457 WWTP it was not possible to identify the type
of treatment, due to insufficient data.
Like any other industrial facility in Portugal, every WWTP must be licenced to develop their activity. From
the 1.312 WWTP listed, only 205 had a valid licence, 120 did not had any licence and for the rest 987 it
was not possible to confirm this information.
Regarding the system management entities, INSAAR identified 599 entities dedicated to the
management of water supply services and wastewater drainage and treatment services. These 599
entities could be divided in 221 (37%) entities which exclusively deliver water to consumers, 30 (5%)
were exclusively dedicated to wastewater collection and treatment and 292 (49%) were dedicated both
to water supply and wastewater drainage and treatment.
2.3. Overview of wastewater treatment in Portugal
According to the last Portuguese inventory on water supply services and wastewater drainage and
treatment services (INSAAR), published in 2002, 71% of the Portuguese population had access to public
wastewater collection systems, while only 50% had access to both collection and treatment services.
The Figure 2.2 presents the evolution of public wastewater services, since 1998.
Figure 2.2 Chronological evolution of the attendance levels in Portugal of wastewater drainage and treatment. (Source: INSAAR)
Popula
tion (
%)
Wastewater drainage
Wastewater treatment
Wastewater drainage and treatment
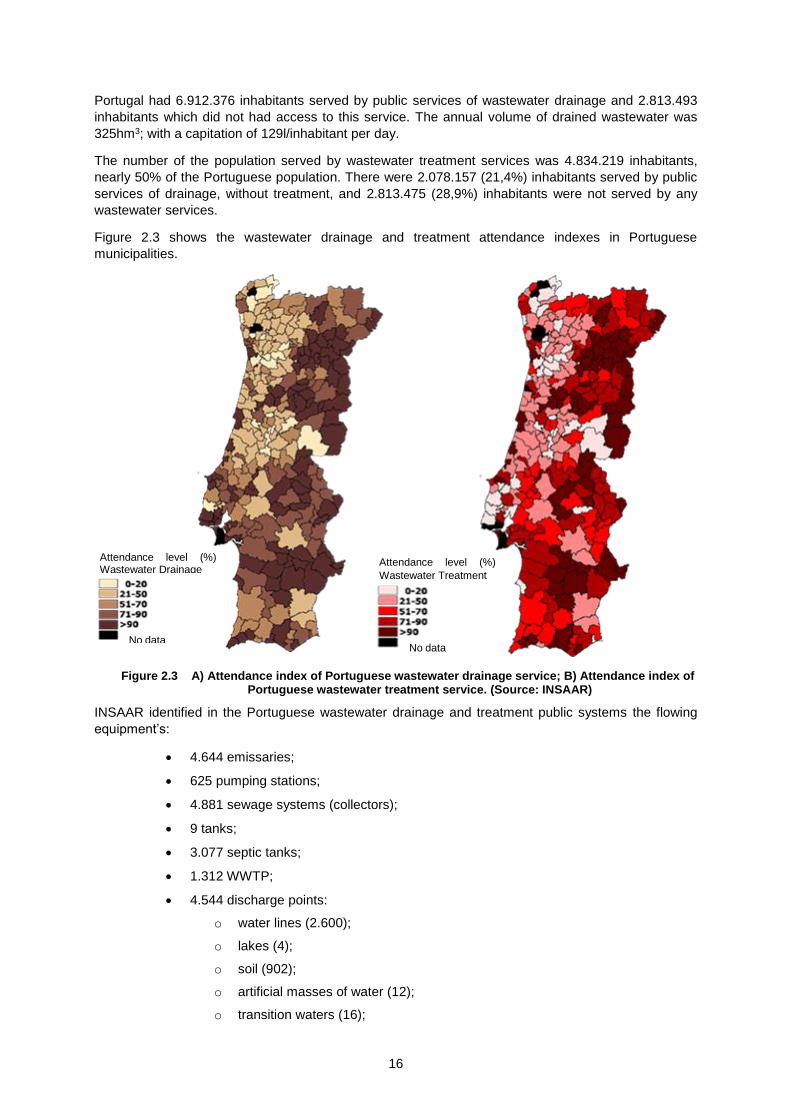
16
Portugal had 6.912.376 inhabitants served by public services of wastewater drainage and 2.813.493
inhabitants which did not had access to this service. The annual volume of drained wastewater was
325hm3; with a capitation of 129l/inhabitant per day.
The number of the population served by wastewater treatment services was 4.834.219 inhabitants,
nearly 50% of the Portuguese population. There were 2.078.157 (21,4%) inhabitants served by public
services of drainage, without treatment, and 2.813.475 (28,9%) inhabitants were not served by any
wastewater services.
Figure 2.3 shows the wastewater drainage and treatment attendance indexes in Portuguese
municipalities.
Figure 2.3 A) Attendance index of Portuguese wastewater drainage service; B) Attendance index of Portuguese wastewater treatment service. (Source: INSAAR)
INSAAR identified in the Portuguese wastewater drainage and treatment public systems the flowing
equipment’s:
4.644 emissaries;
625 pumping stations;
4.881 sewage systems (collectors);
9 tanks;
3.077 septic tanks;
1.312 WWTP;
4.544 discharge points:
o water lines (2.600);
o lakes (4);
o soil (902);
o artificial masses of water (12);
o transition waters (16);
Attendance level (%) Wastewater Drainage
Attendance level (%)
Wastewater Treatment
No data
No data
17
o bays (53);
o coast wasters (22);
o unavailable data (935).
Preliminary treatment attended 25.000 inhabitants (0.3%), primary treatment attended 1.865.542
inhabitants (19%), secondary treatment attended 1.757.414 inhabitants (18%) and tertiary attended
1.476.916 inhabitants (15%).
From the 205 licenced WWTP, 1 had pre-treatment, 4 had primary treatment, 147 had secondary
treatment and 31 had tertiary treatment. For the remaining 22 it was not possible to obtain any
information.
2.4. Sludge production in Portugal
From the 1.312 identified WWTP, only 195 (15%) had available data on their sludge production. The
annual sludge production in from all these 195 WWTP was 299.117 tons.
The final destination of this sludge was agriculture (61%), municipality greens fields (9%), landfills (15%),
treatment facilities (10%) and other destinations (5%).

18
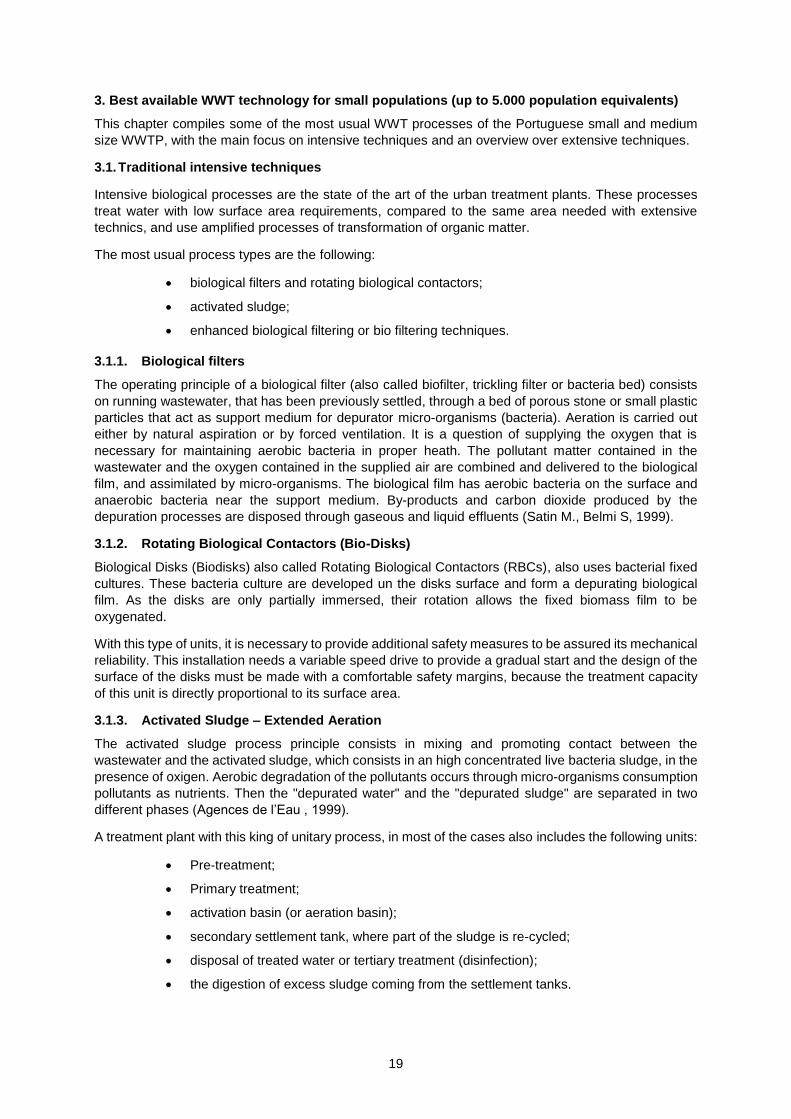
19
3. Best available WWT technology for small populations (up to 5.000 population equivalents)
This chapter compiles some of the most usual WWT processes of the Portuguese small and medium
size WWTP, with the main focus on intensive techniques and an overview over extensive techniques.
3.1. Traditional intensive techniques
Intensive biological processes are the state of the art of the urban treatment plants. These processes
treat water with low surface area requirements, compared to the same area needed with extensive
technics, and use amplified processes of transformation of organic matter.
The most usual process types are the following:
biological filters and rotating biological contactors;
activated sludge;
enhanced biological filtering or bio filtering techniques.
3.1.1. Biological filters
The operating principle of a biological filter (also called biofilter, trickling filter or bacteria bed) consists
on running wastewater, that has been previously settled, through a bed of porous stone or small plastic
particles that act as support medium for depurator micro-organisms (bacteria). Aeration is carried out
either by natural aspiration or by forced ventilation. It is a question of supplying the oxygen that is
necessary for maintaining aerobic bacteria in proper heath. The pollutant matter contained in the
wastewater and the oxygen contained in the supplied air are combined and delivered to the biological
film, and assimilated by micro-organisms. The biological film has aerobic bacteria on the surface and
anaerobic bacteria near the support medium. By-products and carbon dioxide produced by the
depuration processes are disposed through gaseous and liquid effluents (Satin M., Belmi S, 1999).
3.1.2. Rotating Biological Contactors (Bio-Disks)
Biological Disks (Biodisks) also called Rotating Biological Contactors (RBCs), also uses bacterial fixed
cultures. These bacteria culture are developed un the disks surface and form a depurating biological
film. As the disks are only partially immersed, their rotation allows the fixed biomass film to be
oxygenated.
With this type of units, it is necessary to provide additional safety measures to be assured its mechanical
reliability. This installation needs a variable speed drive to provide a gradual start and the design of the
surface of the disks must be made with a comfortable safety margins, because the treatment capacity
of this unit is directly proportional to its surface area.
3.1.3. Activated Sludge – Extended Aeration
The activated sludge process principle consists in mixing and promoting contact between the
wastewater and the activated sludge, which consists in an high concentrated live bacteria sludge, in the
presence of oxigen. Aerobic degradation of the pollutants occurs through micro-organisms consumption
pollutants as nutrients. Then the "depurated water" and the "depurated sludge" are separated in two
different phases (Agences de l’Eau , 1999).
A treatment plant with this king of unitary process, in most of the cases also includes the following units:
Pre-treatment;
Primary treatment;
activation basin (or aeration basin);
secondary settlement tank, where part of the sludge is re-cycled;
disposal of treated water or tertiary treatment (disinfection);
the digestion of excess sludge coming from the settlement tanks.
20
3.2. Extensive Techniques:
Extensive technics are processes of depuration which use fixed microorganism’s cultures, or suspended
growth cultures which use solar energy to produce oxygen by photosynthesis. It is possible to operate
this type of units without electricity, except the aerated lagoon, in order to provide power for the aerators
or air blowers. These techniques can also be distinguished intensive techniques by the fact that the
applied surface loads remain very low.
These techniques have been developed in different countries for communities that are, in general, less
than 500p.e.
Some examples of extensive techniques are the following:
Fixed film cultures;
Infiltration-percolation;
Vertical flow reed bed filter;
Horizontal flow reed bed filter;
Suspended growth cultures;
Natural lagoon;
Macrophyte lagoon;
Aerated lagoon;
Hybrid systems.
3.2.1. Fixed Film Cultures on Small Media
Depuration processes with fixed film cultures on small media consist in running the water to be treated
through several independent beds/units (with microorganisms).
The two main mechanisms are the following:
Superficial filtering: suspended solids (SS) are removed at the surface of the filter bed
and, with them, a part of the organic pollution (particulate COD);
Oxidation: the granular area makes up a biological reactor, a special large surface area
support.
3.2.2. Infiltration-Percolation through Sand
Infiltration-percolation of waste water is a treatment process by aerobic biological filtering through a fine
granular medium. Water is successively distributed over several infiltration units. Hydraulic loads are
several hundred litres per square meter of filter bed per day. The water to be treated is evenly distributed
on the surface of the filter, which is not enclosed. The distribution area for the water is maintained in the
open air and is visible.
Another interesting variant of purification by the soil is made up of buried vertical or horizontal sand
filters. These techniques are used, above all, for situations involving autonomous treatment remain
interesting for grouped autonomous treatment concerning a few hundred population equivalents.
3.2.3. Vertical Flow Reed Bed Filters
The filters are excavations made to be impermeable, filled with successive layers of gravel or sand with
a grading that varies according to the quality of the wastewater to be treated.
As opposed to the previously mentioned infiltration-percolation, the raw affluent is distributed directly,
without prior settling, onto the surface of the filter. During flow through it is subject to a physical (filtering),
chemical (adsorption, complexing, etc.) and biological (biomass attached to small media) treatment. The
21
treated water is drained. The filters are fed with raw sewage by tanker loads. Within the same plant, the
filtering surface is separated into several units which make it possible to establish periods of treatment
and inactivity. The purifying principle lies in the development of an aerobic biomass attached to a
reconstituted soil. Oxygen is supplied by convection and diffusion. The oxygen yield by the plant roots
and rhizomes is negligible in relation to the needs (Armstrong; 1979).
3.2.4. Horizontal Flow Reed Bed Filters
In horizontal flow reed bed filters, the filter pack is almost totally saturated with water. The effluent is
spread out over the entire inlet horizontal cross-section of the bed by a distributor system located at one
end of the bed; it then flows in a direction that is practically horizontal through substrate. Most of the
time, feeding takes place continuously since the supplied organic load is low.
Removal takes place via a drain positioned at the opposite end of the bed, at the bottom and buried in
a trench of draining stones. A pipe is connected to a siphon which allows the height of the overflow to
be adjusted, and thus the level of the water in the bed, in such a way that it is saturated during the
feeding period. The water level must be maintained at approximately 5 cm under the surface of the
material. In fact, water must not circulate above the surface, so as to avoid short-circuiting of treatment;
therefore there is no free water surface and no risk of insect proliferation.
3.2.5. Suspended Growth Cultures
The purification process using suspended growth cultures relies on the development of bacterial
cultures, mainly of the aerobic type. Oxygen comes from many sources depending on to the approaches
taken. The bacterial culture is separated from the treated water by a sedimentation structure, most often,
specifically clarifier, settling lagoon.
3.2.6. Natural Lagoons (Stabilization Ponds)
Purification is ensured thanks to a long retention time, in several watertight basins placed in series. The
number of basins most commonly used is 3. However, using a configuration with 4 or even 6 basins
makes more thorough disinfection possible.
The basic mechanism on which natural lagoon relies is photosynthesis. The upper water segment in the
basins is exposed to light. This allows the development of algae which produce the oxygen that is
required for the development and maintenance of aerobic bacteria. These bacteria are responsible for
the decomposition of the organic matter.
Carbon dioxide produced by the bacteria, as well as mineral salts contained in the waste water, allows
the plank-tonic algae to multiply. Therefore, there is a proliferation of two interdependent populations:
bacteria and algae, also called "microphytes". This cycle is self-maintained as long as the system
receives solar energy and organic matter.
At the bottom of the basin, where light does not penetrate, there are anaerobic bacteria which break
down the sludge produced from the settling of organic matter. Carbon dioxide and methane are released
from this level.
3.2.7. Macrophytes Lagoons
Macrophyte lagoons reproduce natural wetlands with a free water surface, while trying to highlight the
interests of natural ecosystems. This approach is generally used with the purpose of improving treatment
(on the BOD5 or SST parameters) or to refine it (nutrients, metals, etc.). However, the use of a
microphyte finishing lagoon can show better results and is easier to maintain.
3.2.8. Aerated Lagoons
Oxygenation is, in the case of aerated lagoons, supplied mechanically by a surface aerator or air blower.
This principle differs from activated sludge only by the absence of continuous sludge extraction or sludge
recycling systems.
22
In the aeration stage, the water to be treated is in contact with micro-organisms that consume and
assimilate the nutrients produced by the pollution that is to be removed. These micro-organisms are
essentially bacteria and fungi (comparable to those present in activated sludge plants).
In the settling stage, suspended solids which are clusters of micro-organisms and trapped particles,
settle to form sludge. This sludge is regularly pumped or removed from the basin when their volume
becomes too great. This settling stage is made up of a simple settling lagoon, or preferably, two basins
which can be by-passed separately for cleaning operations.
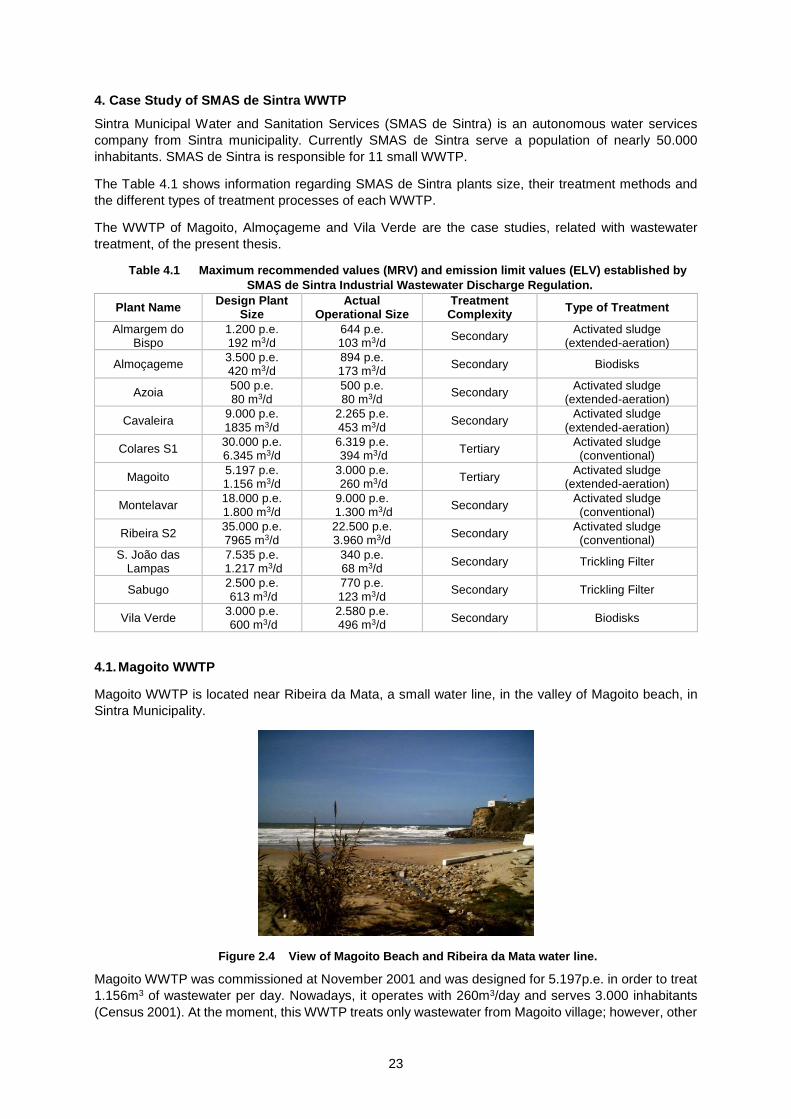
23
4. Case Study of SMAS de Sintra WWTP
Sintra Municipal Water and Sanitation Services (SMAS de Sintra) is an autonomous water services
company from Sintra municipality. Currently SMAS de Sintra serve a population of nearly 50.000
inhabitants. SMAS de Sintra is responsible for 11 small WWTP.
The Table 4.1 shows information regarding SMAS de Sintra plants size, their treatment methods and
the different types of treatment processes of each WWTP.
The WWTP of Magoito, Almoçageme and Vila Verde are the case studies, related with wastewater
treatment, of the present thesis.
Table 4.1 Maximum recommended values (MRV) and emission limit values (ELV) established by
SMAS de Sintra Industrial Wastewater Discharge Regulation.
Plant Name Design Plant
Size Actual
Operational Size Treatment
Complexity Type of Treatment
Almargem do Bispo
1.200 p.e. 192 m3/d
644 p.e. 103 m3/d
Secondary Activated sludge
(extended-aeration)
Almoçageme 3.500 p.e. 420 m3/d
894 p.e. 173 m3/d
Secondary Biodisks
Azoia 500 p.e. 80 m3/d
500 p.e. 80 m3/d
Secondary Activated sludge
(extended-aeration)
Cavaleira 9.000 p.e. 1835 m3/d
2.265 p.e. 453 m3/d
Secondary Activated sludge
(extended-aeration)
Colares S1 30.000 p.e. 6.345 m3/d
6.319 p.e. 394 m3/d
Tertiary Activated sludge (conventional)
Magoito 5.197 p.e. 1.156 m3/d
3.000 p.e. 260 m3/d
Tertiary Activated sludge
(extended-aeration)
Montelavar 18.000 p.e. 1.800 m3/d
9.000 p.e. 1.300 m3/d
Secondary Activated sludge (conventional)
Ribeira S2 35.000 p.e. 7965 m3/d
22.500 p.e. 3.960 m3/d
Secondary Activated sludge (conventional)
S. João das Lampas
7.535 p.e. 1.217 m3/d
340 p.e. 68 m3/d
Secondary Trickling Filter
Sabugo 2.500 p.e. 613 m3/d
770 p.e. 123 m3/d
Secondary Trickling Filter
Vila Verde 3.000 p.e. 600 m3/d
2.580 p.e. 496 m3/d
Secondary Biodisks
4.1. Magoito WWTP
Magoito WWTP is located near Ribeira da Mata, a small water line, in the valley of Magoito beach, in
Sintra Municipality.
Figure 2.4 View of Magoito Beach and Ribeira da Mata water line.
Magoito WWTP was commissioned at November 2001 and was designed for 5.197p.e. in order to treat
1.156m3 of wastewater per day. Nowadays, it operates with 260m3/day and serves 3.000 inhabitants
(Census 2001). At the moment, this WWTP treats only wastewater from Magoito village; however, other
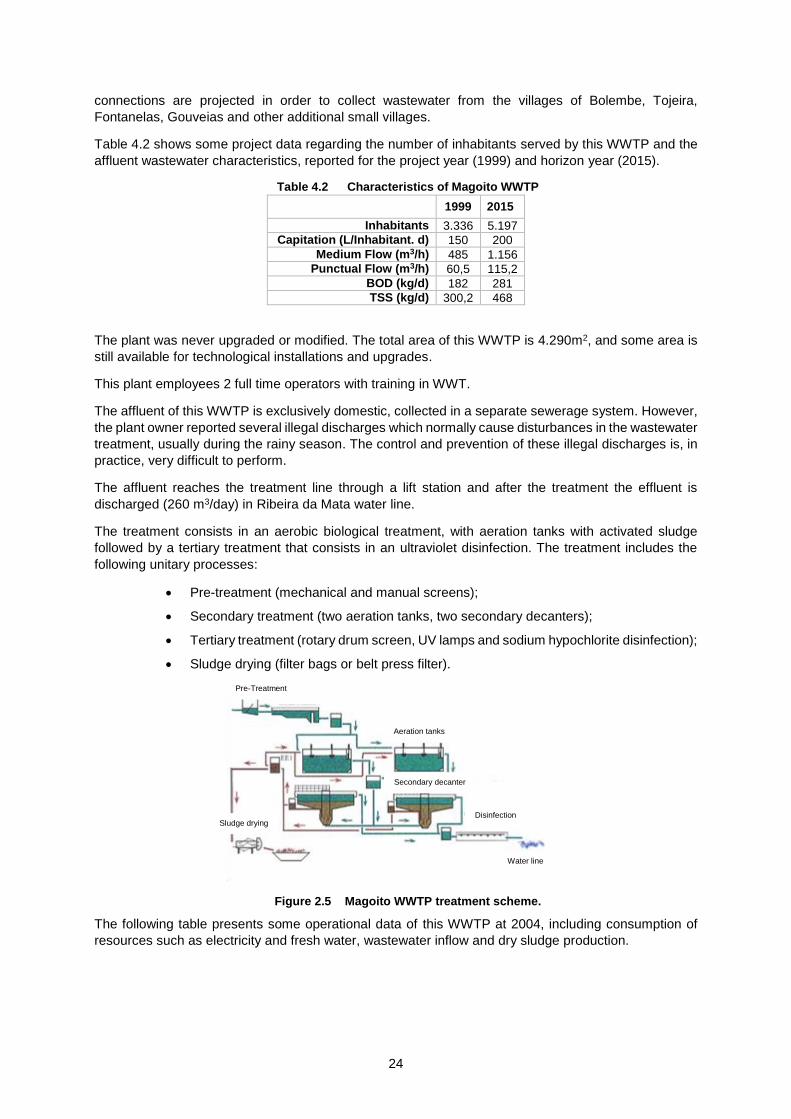
24
connections are projected in order to collect wastewater from the villages of Bolembe, Tojeira,
Fontanelas, Gouveias and other additional small villages.
Table 4.2 shows some project data regarding the number of inhabitants served by this WWTP and the
affluent wastewater characteristics, reported for the project year (1999) and horizon year (2015).
Table 4.2 Characteristics of Magoito WWTP
1999 2015
Inhabitants 3.336 5.197
Capitation (L/Inhabitant. d) 150 200
Medium Flow (m3/h) 485 1.156
Punctual Flow (m3/h) 60,5 115,2
BOD (kg/d) 182 281
TSS (kg/d) 300,2 468
The plant was never upgraded or modified. The total area of this WWTP is 4.290m2, and some area is
still available for technological installations and upgrades.
This plant employees 2 full time operators with training in WWT.
The affluent of this WWTP is exclusively domestic, collected in a separate sewerage system. However,
the plant owner reported several illegal discharges which normally cause disturbances in the wastewater
treatment, usually during the rainy season. The control and prevention of these illegal discharges is, in
practice, very difficult to perform.
The affluent reaches the treatment line through a lift station and after the treatment the effluent is
discharged (260 m3/day) in Ribeira da Mata water line.
The treatment consists in an aerobic biological treatment, with aeration tanks with activated sludge
followed by a tertiary treatment that consists in an ultraviolet disinfection. The treatment includes the
following unitary processes:
Pre-treatment (mechanical and manual screens);
Secondary treatment (two aeration tanks, two secondary decanters);
Tertiary treatment (rotary drum screen, UV lamps and sodium hypochlorite disinfection);
Sludge drying (filter bags or belt press filter).
Figure 2.5 Magoito WWTP treatment scheme.
The following table presents some operational data of this WWTP at 2004, including consumption of
resources such as electricity and fresh water, wastewater inflow and dry sludge production.
Pre-Treatment
Aeration tanks
Secondary decanter
Disinfection
Water line
Sludge drying
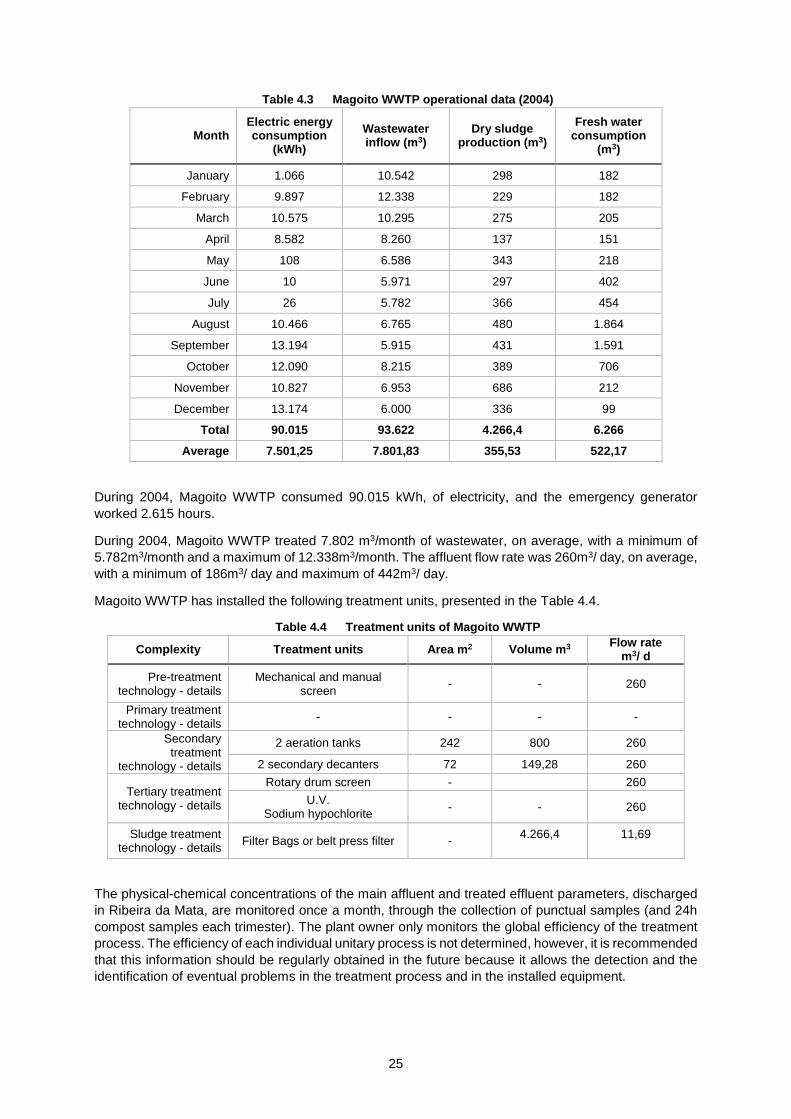
25
Table 4.3 Magoito WWTP operational data (2004)
Month Electric energy consumption
(kWh)
Wastewater inflow (m3)
Dry sludge production (m3)
Fresh water consumption
(m3)
January 1.066 10.542 298 182
February 9.897 12.338 229 182
March 10.575 10.295 275 205
April 8.582 8.260 137 151
May 108 6.586 343 218
June 10 5.971 297 402
July 26 5.782 366 454
August 10.466 6.765 480 1.864
September 13.194 5.915 431 1.591
October 12.090 8.215 389 706
November 10.827 6.953 686 212
December 13.174 6.000 336 99
Total 90.015 93.622 4.266,4 6.266
Average 7.501,25 7.801,83 355,53 522,17
During 2004, Magoito WWTP consumed 90.015 kWh, of electricity, and the emergency generator
worked 2.615 hours.
During 2004, Magoito WWTP treated 7.802 m3/month of wastewater, on average, with a minimum of
5.782m3/month and a maximum of 12.338m3/month. The affluent flow rate was 260m3/ day, on average,
with a minimum of 186m3/ day and maximum of 442m3/ day.
Magoito WWTP has installed the following treatment units, presented in the Table 4.4.
Table 4.4 Treatment units of Magoito WWTP
Complexity Treatment units Area m2 Volume m3 Flow rate
m3/ d
Pre-treatment technology - details
Mechanical and manual screen
- - 260
Primary treatment technology - details
- - - -
Secondary treatment
technology - details
2 aeration tanks 242 800 260
2 secondary decanters 72 149,28 260
Tertiary treatment technology - details
Rotary drum screen - 260
U.V. Sodium hypochlorite
- - 260
Sludge treatment technology - details
Filter Bags or belt press filter - 4.266,4
11,69
The physical-chemical concentrations of the main affluent and treated effluent parameters, discharged
in Ribeira da Mata, are monitored once a month, through the collection of punctual samples (and 24h
compost samples each trimester). The plant owner only monitors the global efficiency of the treatment
process. The efficiency of each individual unitary process is not determined, however, it is recommended
that this information should be regularly obtained in the future because it allows the detection and the
identification of eventual problems in the treatment process and in the installed equipment.
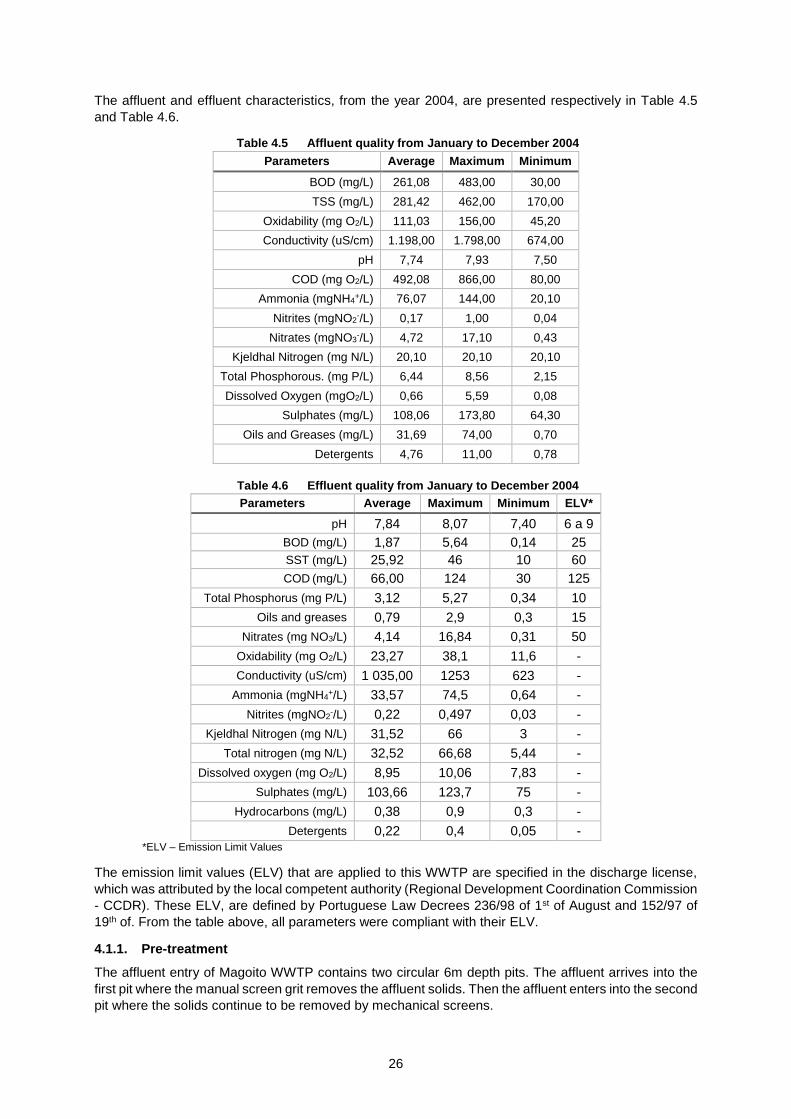
26
The affluent and effluent characteristics, from the year 2004, are presented respectively in Table 4.5
and Table 4.6.
Table 4.5 Affluent quality from January to December 2004
Parameters Average Maximum Minimum
BOD (mg/L) 261,08 483,00 30,00
TSS (mg/L) 281,42 462,00 170,00
Oxidability (mg O2/L) 111,03 156,00 45,20
Conductivity (uS/cm) 1.198,00 1.798,00 674,00
pH 7,74 7,93 7,50
COD (mg O2/L) 492,08 866,00 80,00
Ammonia (mgNH4+/L) 76,07 144,00 20,10
Nitrites (mgNO2-/L) 0,17 1,00 0,04
Nitrates (mgNO3-/L) 4,72 17,10 0,43
Kjeldhal Nitrogen (mg N/L) 20,10 20,10 20,10
Total Phosphorous. (mg P/L) 6,44 8,56 2,15
Dissolved Oxygen (mgO2/L) 0,66 5,59 0,08
Sulphates (mg/L) 108,06 173,80 64,30
Oils and Greases (mg/L) 31,69 74,00 0,70
Detergents 4,76 11,00 0,78
Table 4.6 Effluent quality from January to December 2004
Parameters Average Maximum Minimum ELV*
pH 7,84 8,07 7,40 6 a 9
BOD (mg/L) 1,87 5,64 0,14 25
SST (mg/L) 25,92 46 10 60
COD (mg/L) 66,00 124 30 125
Total Phosphorus (mg P/L) 3,12 5,27 0,34 10
Oils and greases 0,79 2,9 0,3 15
Nitrates (mg NO3/L) 4,14 16,84 0,31 50
Oxidability (mg O2/L) 23,27 38,1 11,6 -
Conductivity (uS/cm) 1 035,00 1253 623 -
Ammonia (mgNH4+/L) 33,57 74,5 0,64 -
Nitrites (mgNO2-/L) 0,22 0,497 0,03 -
Kjeldhal Nitrogen (mg N/L) 31,52 66 3 -
Total nitrogen (mg N/L) 32,52 66,68 5,44 -
Dissolved oxygen (mg O2/L) 8,95 10,06 7,83 -
Sulphates (mg/L) 103,66 123,7 75 -
Hydrocarbons (mg/L) 0,38 0,9 0,3 -
Detergents 0,22 0,4 0,05 - *ELV – Emission Limit Values
The emission limit values (ELV) that are applied to this WWTP are specified in the discharge license,
which was attributed by the local competent authority (Regional Development Coordination Commission
- CCDR). These ELV, are defined by Portuguese Law Decrees 236/98 of 1st of August and 152/97 of
19th of. From the table above, all parameters were compliant with their ELV.
4.1.1. Pre-treatment
The affluent entry of Magoito WWTP contains two circular 6m depth pits. The affluent arrives into the
first pit where the manual screen grit removes the affluent solids. Then the affluent enters into the second
pit where the solids continue to be removed by mechanical screens.
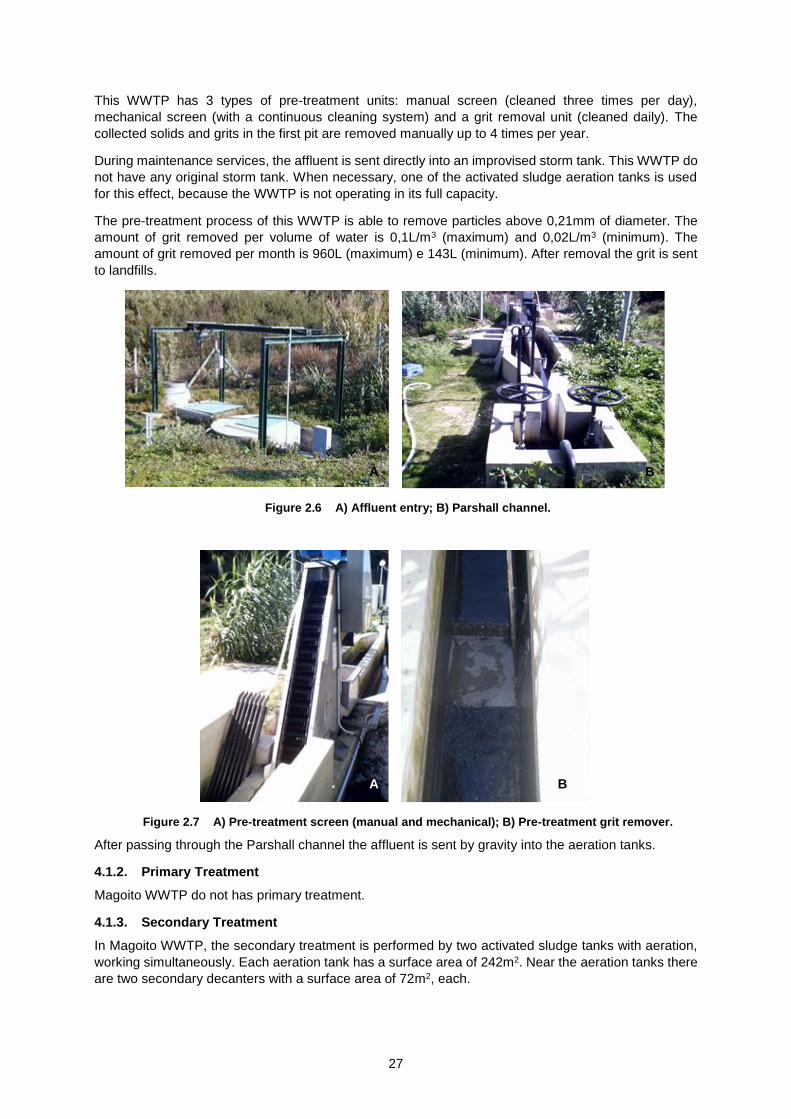
27
This WWTP has 3 types of pre-treatment units: manual screen (cleaned three times per day),
mechanical screen (with a continuous cleaning system) and a grit removal unit (cleaned daily). The
collected solids and grits in the first pit are removed manually up to 4 times per year.
During maintenance services, the affluent is sent directly into an improvised storm tank. This WWTP do
not have any original storm tank. When necessary, one of the activated sludge aeration tanks is used
for this effect, because the WWTP is not operating in its full capacity.
The pre-treatment process of this WWTP is able to remove particles above 0,21mm of diameter. The
amount of grit removed per volume of water is 0,1L/m3 (maximum) and 0,02L/m3 (minimum). The
amount of grit removed per month is 960L (maximum) e 143L (minimum). After removal the grit is sent
to landfills.
Figure 2.6 A) Affluent entry; B) Parshall channel.
Figure 2.7 A) Pre-treatment screen (manual and mechanical); B) Pre-treatment grit remover.
After passing through the Parshall channel the affluent is sent by gravity into the aeration tanks.
4.1.2. Primary Treatment
Magoito WWTP do not has primary treatment.
4.1.3. Secondary Treatment
In Magoito WWTP, the secondary treatment is performed by two activated sludge tanks with aeration,
working simultaneously. Each aeration tank has a surface area of 242m2. Near the aeration tanks there
are two secondary decanters with a surface area of 72m2, each.
A B
A
B
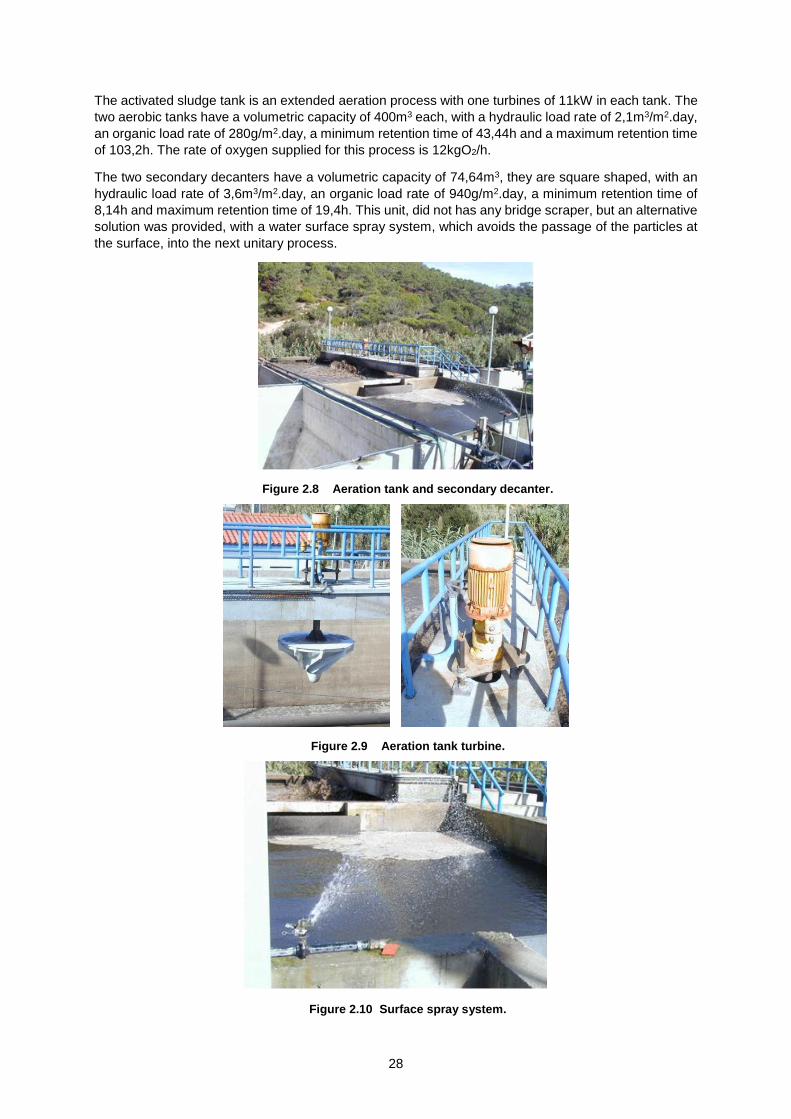
28
The activated sludge tank is an extended aeration process with one turbines of 11kW in each tank. The
two aerobic tanks have a volumetric capacity of 400m3 each, with a hydraulic load rate of 2,1m3/m2.day,
an organic load rate of 280g/m2.day, a minimum retention time of 43,44h and a maximum retention time
of 103,2h. The rate of oxygen supplied for this process is 12kgO2/h.
The two secondary decanters have a volumetric capacity of 74,64m3, they are square shaped, with an
hydraulic load rate of 3,6m3/m2.day, an organic load rate of 940g/m2.day, a minimum retention time of
8,14h and maximum retention time of 19,4h. This unit, did not has any bridge scraper, but an alternative
solution was provided, with a water surface spray system, which avoids the passage of the particles at
the surface, into the next unitary process.
Figure 2.8 Aeration tank and secondary decanter.
Figure 2.9 Aeration tank turbine.
Figure 2.10 Surface spray system.
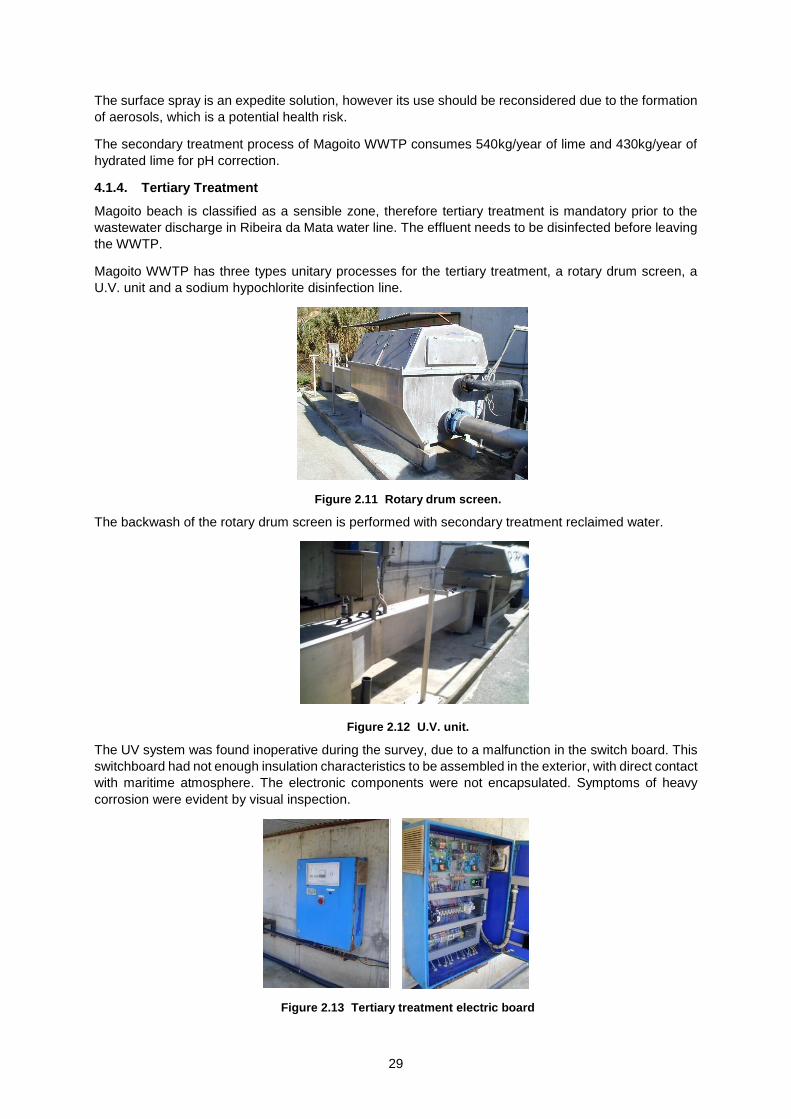
29
The surface spray is an expedite solution, however its use should be reconsidered due to the formation
of aerosols, which is a potential health risk.
The secondary treatment process of Magoito WWTP consumes 540kg/year of lime and 430kg/year of
hydrated lime for pH correction.
4.1.4. Tertiary Treatment
Magoito beach is classified as a sensible zone, therefore tertiary treatment is mandatory prior to the
wastewater discharge in Ribeira da Mata water line. The effluent needs to be disinfected before leaving
the WWTP.
Magoito WWTP has three types unitary processes for the tertiary treatment, a rotary drum screen, a
U.V. unit and a sodium hypochlorite disinfection line.
Figure 2.11 Rotary drum screen.
The backwash of the rotary drum screen is performed with secondary treatment reclaimed water.
Figure 2.12 U.V. unit.
The UV system was found inoperative during the survey, due to a malfunction in the switch board. This
switchboard had not enough insulation characteristics to be assembled in the exterior, with direct contact
with maritime atmosphere. The electronic components were not encapsulated. Symptoms of heavy
corrosion were evident by visual inspection.
Figure 2.13 Tertiary treatment electric board
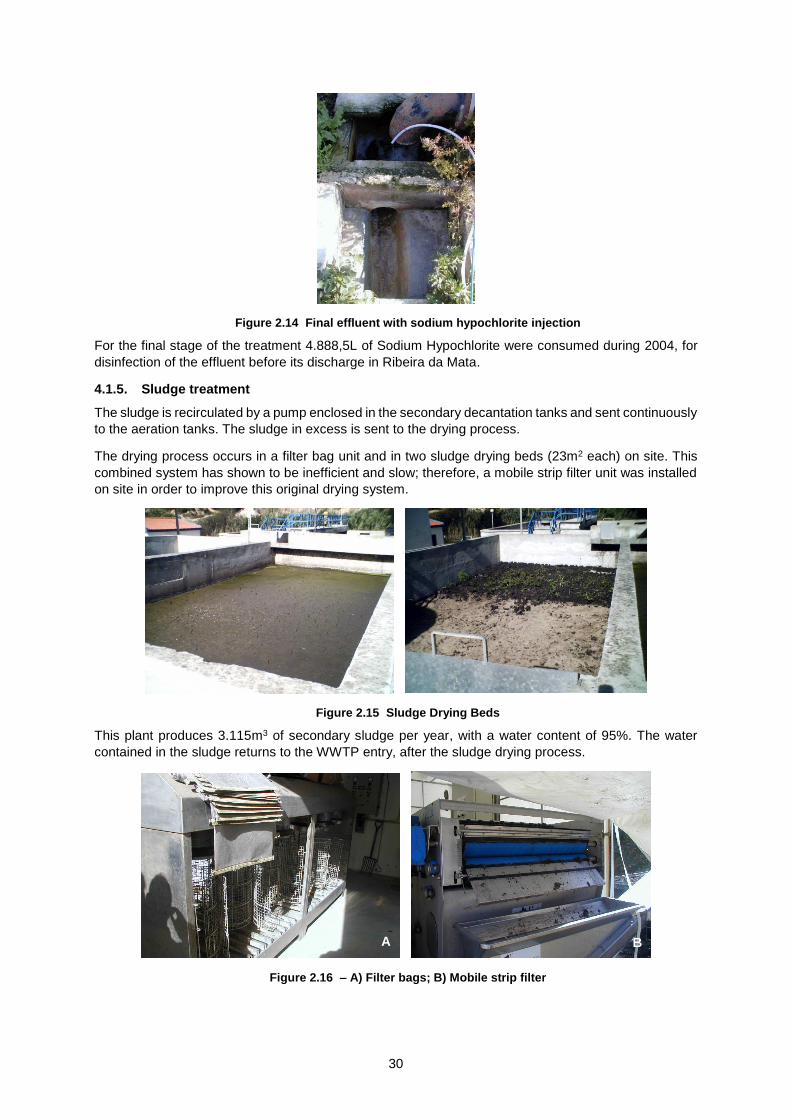
30
Figure 2.14 Final effluent with sodium hypochlorite injection
For the final stage of the treatment 4.888,5L of Sodium Hypochlorite were consumed during 2004, for
disinfection of the effluent before its discharge in Ribeira da Mata.
4.1.5. Sludge treatment
The sludge is recirculated by a pump enclosed in the secondary decantation tanks and sent continuously
to the aeration tanks. The sludge in excess is sent to the drying process.
The drying process occurs in a filter bag unit and in two sludge drying beds (23m2 each) on site. This
combined system has shown to be inefficient and slow; therefore, a mobile strip filter unit was installed
on site in order to improve this original drying system.
Figure 2.15 Sludge Drying Beds
This plant produces 3.115m3 of secondary sludge per year, with a water content of 95%. The water
contained in the sludge returns to the WWTP entry, after the sludge drying process.
Figure 2.16 – A) Filter bags; B) Mobile strip filter
A
B
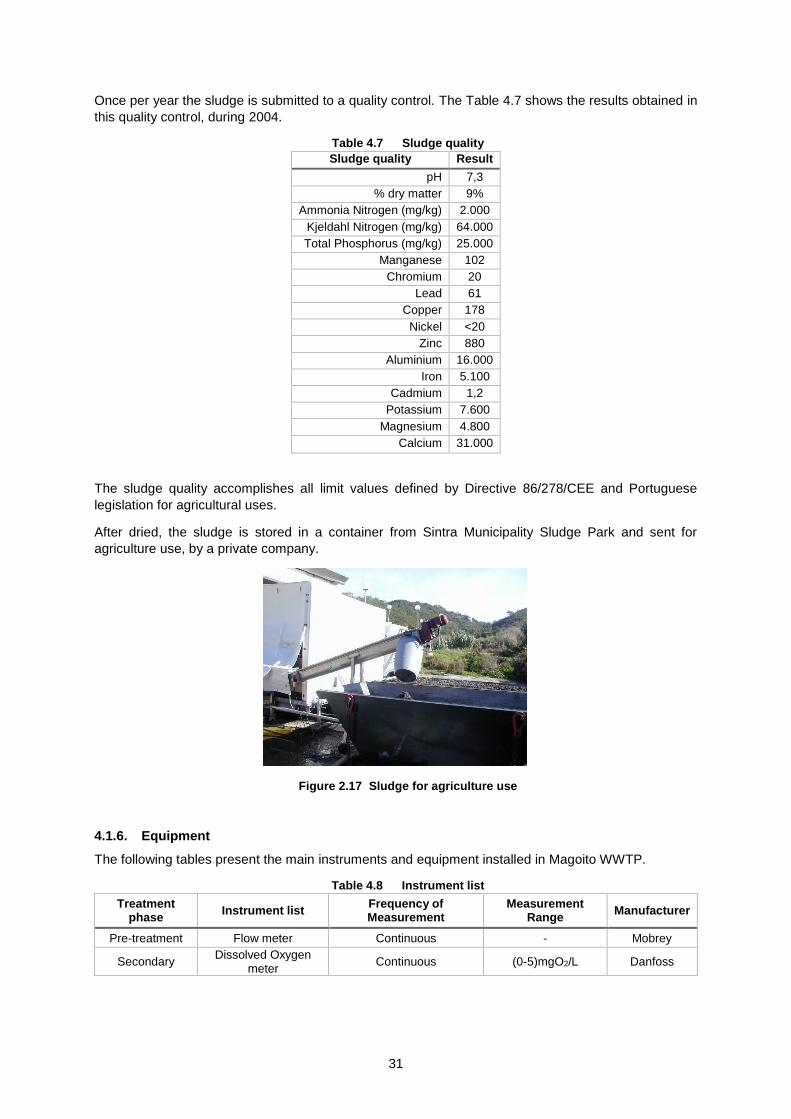
31
Once per year the sludge is submitted to a quality control. The Table 4.7 shows the results obtained in
this quality control, during 2004.
Table 4.7 Sludge quality
Sludge quality Result
pH 7,3
% dry matter 9%
Ammonia Nitrogen (mg/kg) 2.000
Kjeldahl Nitrogen (mg/kg) 64.000
Total Phosphorus (mg/kg) 25.000
Manganese 102
Chromium 20
Lead 61
Copper 178
Nickel <20
Zinc 880
Aluminium 16.000
Iron 5.100
Cadmium 1,2
Potassium 7.600
Magnesium 4.800
Calcium 31.000
The sludge quality accomplishes all limit values defined by Directive 86/278/CEE and Portuguese
legislation for agricultural uses.
After dried, the sludge is stored in a container from Sintra Municipality Sludge Park and sent for
agriculture use, by a private company.
Figure 2.17 Sludge for agriculture use
4.1.6. Equipment
The following tables present the main instruments and equipment installed in Magoito WWTP.
Table 4.8 Instrument list
Treatment phase
Instrument list Frequency of Measurement
Measurement Range
Manufacturer
Pre-treatment Flow meter Continuous - Mobrey
Secondary Dissolved Oxygen
meter Continuous (0-5)mgO2/L Danfoss
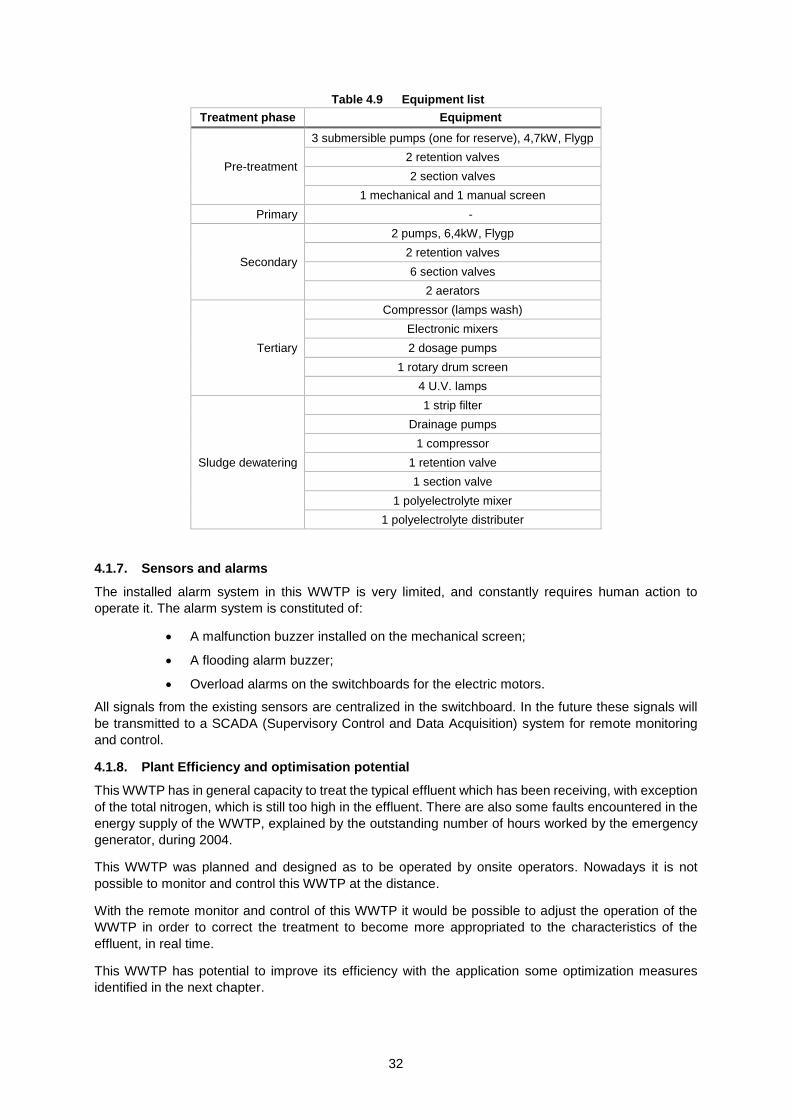
32
Table 4.9 Equipment list
Treatment phase Equipment
Pre-treatment
3 submersible pumps (one for reserve), 4,7kW, Flygp
2 retention valves
2 section valves
1 mechanical and 1 manual screen
Primary -
Secondary
2 pumps, 6,4kW, Flygp
2 retention valves
6 section valves
2 aerators
Tertiary
Compressor (lamps wash)
Electronic mixers
2 dosage pumps
1 rotary drum screen
4 U.V. lamps
Sludge dewatering
1 strip filter
Drainage pumps
1 compressor
1 retention valve
1 section valve
1 polyelectrolyte mixer
1 polyelectrolyte distributer
4.1.7. Sensors and alarms
The installed alarm system in this WWTP is very limited, and constantly requires human action to
operate it. The alarm system is constituted of:
A malfunction buzzer installed on the mechanical screen;
A flooding alarm buzzer;
Overload alarms on the switchboards for the electric motors.
All signals from the existing sensors are centralized in the switchboard. In the future these signals will
be transmitted to a SCADA (Supervisory Control and Data Acquisition) system for remote monitoring
and control.
4.1.8. Plant Efficiency and optimisation potential
This WWTP has in general capacity to treat the typical effluent which has been receiving, with exception
of the total nitrogen, which is still too high in the effluent. There are also some faults encountered in the
energy supply of the WWTP, explained by the outstanding number of hours worked by the emergency
generator, during 2004.
This WWTP was planned and designed as to be operated by onsite operators. Nowadays it is not
possible to monitor and control this WWTP at the distance.
With the remote monitor and control of this WWTP it would be possible to adjust the operation of the
WWTP in order to correct the treatment to become more appropriated to the characteristics of the
effluent, in real time.
This WWTP has potential to improve its efficiency with the application some optimization measures
identified in the next chapter.
33
4.1.9. Recommendations
Recommendation regarding the quality of the affluent/effluent:
Should be taken analyses before and after each unitary operation, in order to be
possible to compare and to measure the efficiency of each unitary operation.
Recommendations for the pre-treatment phase:
Should be changed the wastewater intake point, to a more elevated one, in order to the
system could work by gravity;
Should be built a storm water deposit.
Recommendation for the secondary treatment phase:
The deposition of TSS should be increased with a filtration system after the secondary
decantation. The filtration will also improve the disinfection operation by U.V. in the next
unitary operation.
Recommendation for the tertiary treatment phase:
The equipment of installed in the tertiary treatment should covered and protected
against corrosion, due to the proximity of the ocean. The electric board of the U.V.
disinfection system should be installed in the control room, near the other command
boards.
Recommendation regarding the emergency generator:
Should be built a cover and an impermeable concrete base for the emergency
generator.
Recommendation regarding the plant equipment:
Should be adopted urgent measures concerning the insulation of the electric
equipment.
The plant should have a preventive/predictive maintenance program, specially covering
the critical equipment.
Recommendation regarding the process control:
The actual WWTP system does not allow an automatic adjustment to meet the changes
of the quality of the affluent and other environmental conditions. The WWTP operates
by the experience of the supervisor technicians. However, the operation can be
improved by the study of the centralized data that will be sampled from the new sensors
to be installed in the plant.
For remote data communication, a new PLC with a communication card must be
installed in this WWTP. The PLC will act as a remote terminal unit and the SCADA
software at SMAS office, can present a real time graphical illustration of the WWT
performance and provide real-time information. With these new facilities it will be
possible to manage and to predict almost all emergency situations and to have 24 hours
of operational response, per day.
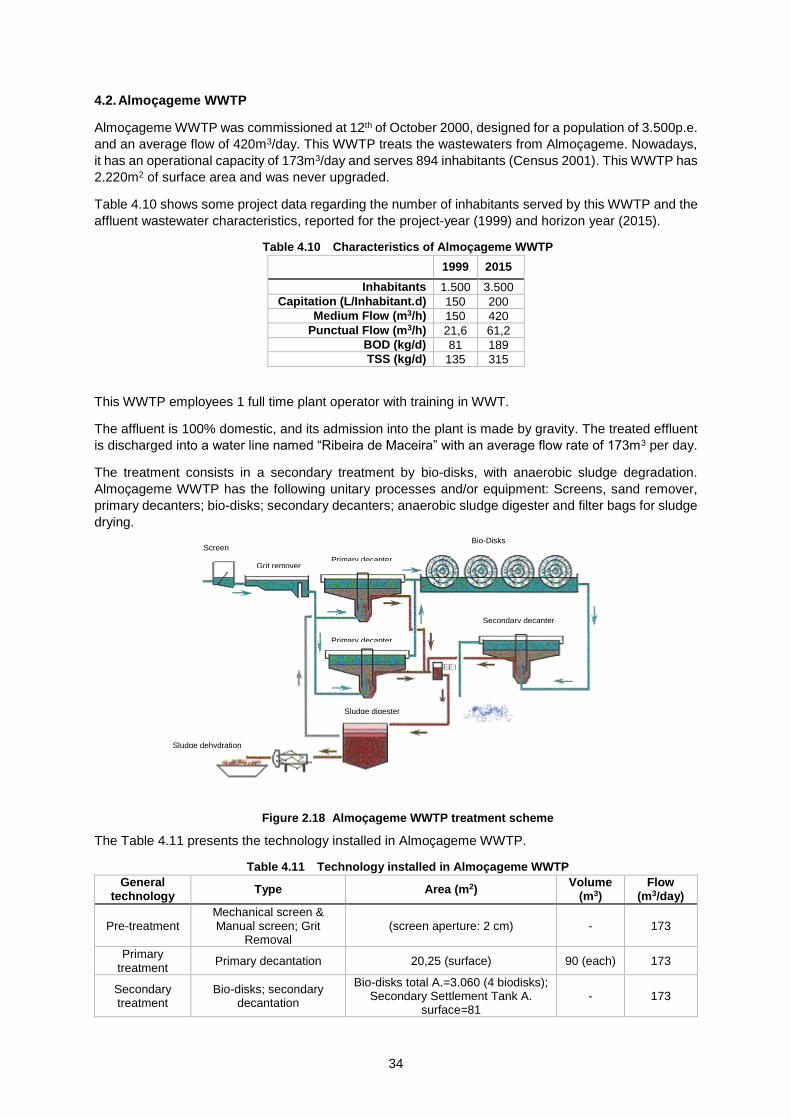
34
4.2. Almoçageme WWTP
Almoçageme WWTP was commissioned at 12th of October 2000, designed for a population of 3.500p.e.
and an average flow of 420m3/day. This WWTP treats the wastewaters from Almoçageme. Nowadays,
it has an operational capacity of 173m3/day and serves 894 inhabitants (Census 2001). This WWTP has
2.220m2 of surface area and was never upgraded.
Table 4.10 shows some project data regarding the number of inhabitants served by this WWTP and the
affluent wastewater characteristics, reported for the project-year (1999) and horizon year (2015).
Table 4.10 Characteristics of Almoçageme WWTP
1999 2015
Inhabitants 1.500 3.500
Capitation (L/Inhabitant.d) 150 200
Medium Flow (m3/h) 150 420
Punctual Flow (m3/h) 21,6 61,2
BOD (kg/d) 81 189
TSS (kg/d) 135 315
This WWTP employees 1 full time plant operator with training in WWT.
The affluent is 100% domestic, and its admission into the plant is made by gravity. The treated effluent
is discharged into a water line named “Ribeira de Maceira” with an average flow rate of 173m3 per day.
The treatment consists in a secondary treatment by bio-disks, with anaerobic sludge degradation.
Almoçageme WWTP has the following unitary processes and/or equipment: Screens, sand remover,
primary decanters; bio-disks; secondary decanters; anaerobic sludge digester and filter bags for sludge
drying.
Figure 2.18 Almoçageme WWTP treatment scheme
The Table 4.11 presents the technology installed in Almoçageme WWTP.
Table 4.11 Technology installed in Almoçageme WWTP
General technology
Type Area (m2) Volume
(m3) Flow
(m3/day)
Pre-treatment Mechanical screen & Manual screen; Grit
Removal (screen aperture: 2 cm) - 173
Primary treatment
Primary decantation 20,25 (surface) 90 (each) 173
Secondary treatment
Bio-disks; secondary decantation
Bio-disks total A.=3.060 (4 biodisks); Secondary Settlement Tank A.
surface=81 - 173
Bio-Disks
Aeration tanks
Screen
Aeration tanks Grit remover Primary decanter
Secondary decanter
Primary decanter
Sludge digester
Sludge dehydration
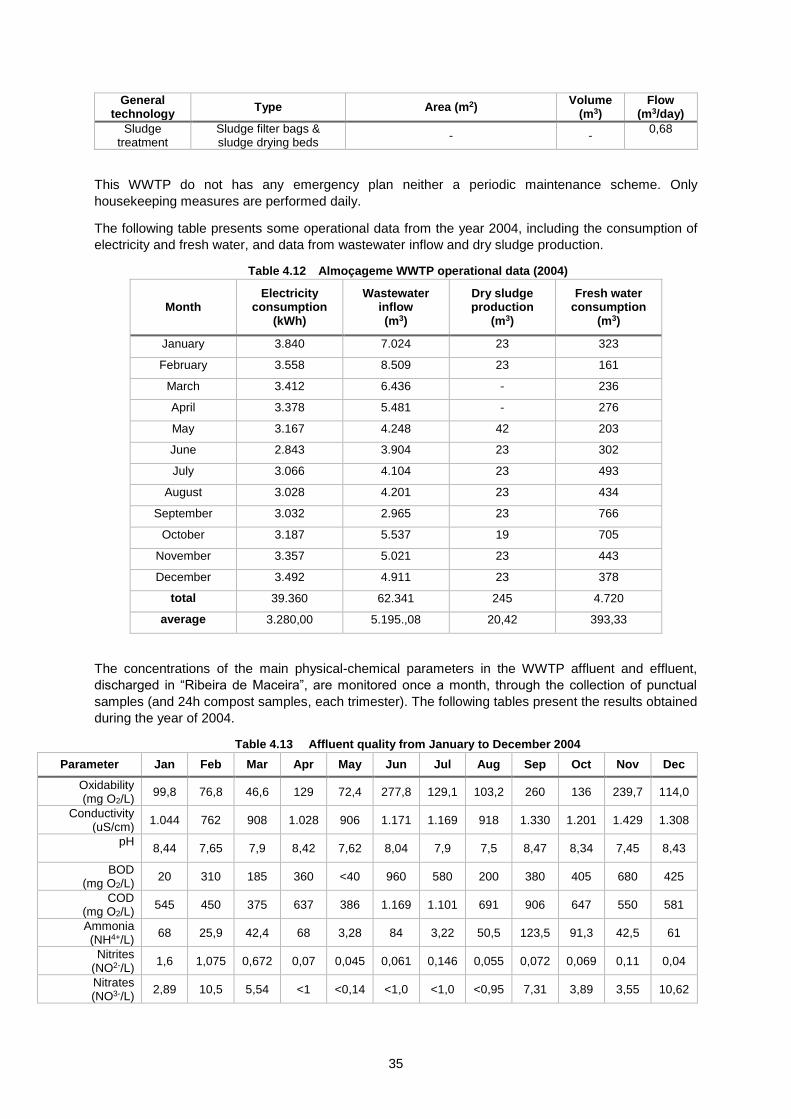
35
General technology
Type Area (m2) Volume
(m3) Flow
(m3/day)
Sludge treatment
Sludge filter bags & sludge drying beds
- - 0,68
This WWTP do not has any emergency plan neither a periodic maintenance scheme. Only
housekeeping measures are performed daily.
The following table presents some operational data from the year 2004, including the consumption of
electricity and fresh water, and data from wastewater inflow and dry sludge production.
Table 4.12 Almoçageme WWTP operational data (2004)
Month Electricity
consumption (kWh)
Wastewater inflow (m3)
Dry sludge production
(m3)
Fresh water consumption
(m3)
January 3.840 7.024 23 323
February 3.558 8.509 23 161
March 3.412 6.436 - 236
April 3.378 5.481 - 276
May 3.167 4.248 42 203
June 2.843 3.904 23 302
July 3.066 4.104 23 493
August 3.028 4.201 23 434
September 3.032 2.965 23 766
October 3.187 5.537 19 705
November 3.357 5.021 23 443
December 3.492 4.911 23 378
total 39.360 62.341 245 4.720
average 3.280,00 5.195.,08 20,42 393,33
The concentrations of the main physical-chemical parameters in the WWTP affluent and effluent,
discharged in “Ribeira de Maceira”, are monitored once a month, through the collection of punctual
samples (and 24h compost samples, each trimester). The following tables present the results obtained
during the year of 2004.
Table 4.13 Affluent quality from January to December 2004
Parameter Jan Feb Mar Apr May Jun Jul Aug Sep Oct Nov Dec
Oxidability (mg O2/L)
99,8 76,8 46,6 129 72,4 277,8 129,1 103,2 260 136 239,7 114,0
Conductivity (uS/cm)
1.044 762 908 1.028 906 1.171 1.169 918 1.330 1.201 1.429 1.308
pH
8,44 7,65 7,9 8,42 7,62 8,04 7,9 7,5 8,47 8,34 7,45 8,43
BOD (mg O2/L)
20 310 185 360 <40 960 580 200 380 405 680 425
COD (mg O2/L)
545 450 375 637 386 1.169 1.101 691 906 647 550 581
Ammonia (NH4+/L)
68 25,9 42,4 68 3,28 84 3,22 50,5 123,5 91,3 42,5 61
Nitrites (NO2-/L)
1,6 1,075 0,672 0,07 0,045 0,061 0,146 0,055 0,072 0,069 0,11 0,04
Nitrates (NO3-/L)
2,89 10,5 5,54 <1 <0,14 <1,0 <1,0 <0,95 7,31 3,89 3,55 10,62
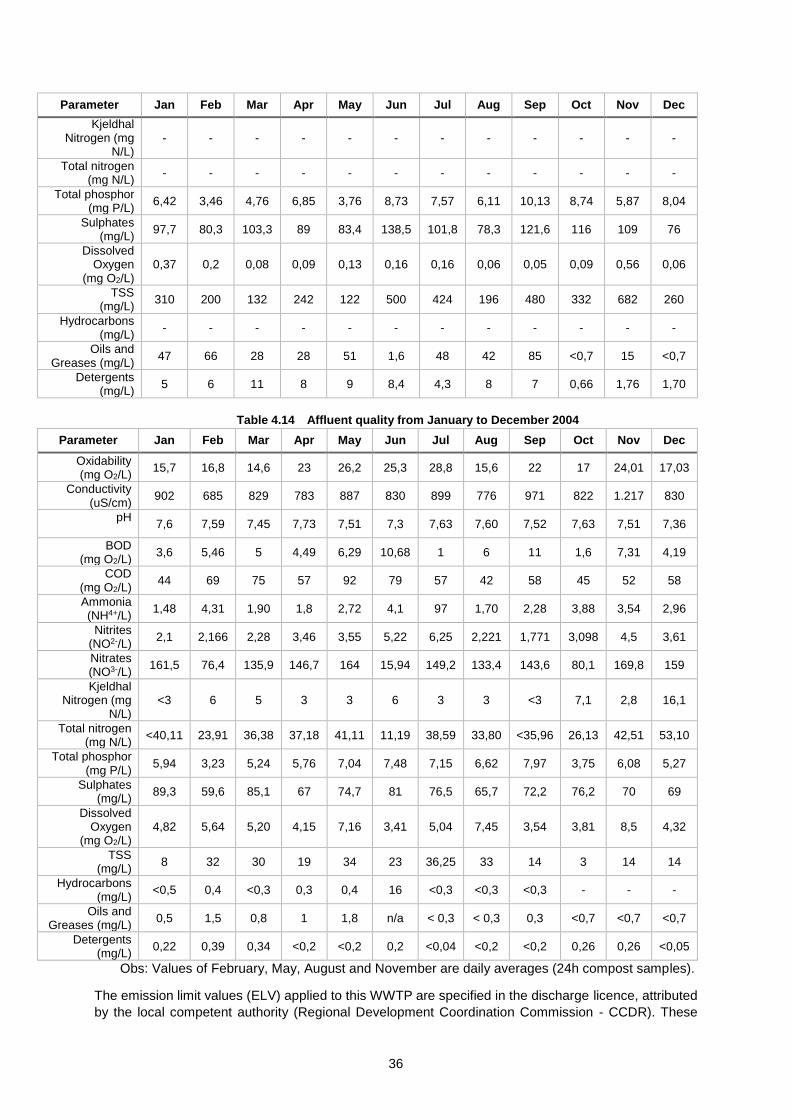
36
Parameter Jan Feb Mar Apr May Jun Jul Aug Sep Oct Nov Dec
Kjeldhal Nitrogen (mg
N/L) - - - - - - - - - - - -
Total nitrogen (mg N/L)
- - - - - - - - - - - -
Total phosphor (mg P/L)
6,42 3,46 4,76 6,85 3,76 8,73 7,57 6,11 10,13 8,74 5,87 8,04
Sulphates (mg/L)
97,7 80,3 103,3 89 83,4 138,5 101,8 78,3 121,6 116 109 76
Dissolved Oxygen
(mg O2/L) 0,37 0,2 0,08 0,09 0,13 0,16 0,16 0,06 0,05 0,09 0,56 0,06
TSS (mg/L)
310 200 132 242 122 500 424 196 480 332 682 260
Hydrocarbons (mg/L)
- - - - - - - - - - - -
Oils and Greases (mg/L)
47 66 28 28 51 1,6 48 42 85 <0,7 15 <0,7
Detergents (mg/L)
5 6 11 8 9 8,4 4,3 8 7 0,66 1,76 1,70
Table 4.14 Affluent quality from January to December 2004
Parameter Jan Feb Mar Apr May Jun Jul Aug Sep Oct Nov Dec
Oxidability (mg O2/L)
15,7 16,8 14,6 23 26,2 25,3 28,8 15,6 22 17 24,01 17,03
Conductivity (uS/cm)
902 685 829 783 887 830 899 776 971 822 1.217 830
pH
7,6 7,59 7,45 7,73 7,51 7,3 7,63 7,60 7,52 7,63 7,51 7,36
BOD (mg O2/L)
3,6 5,46 5 4,49 6,29 10,68 1 6 11 1,6 7,31 4,19
COD (mg O2/L)
44 69 75 57 92 79 57 42 58 45 52 58
Ammonia (NH4+/L)
1,48 4,31 1,90 1,8 2,72 4,1 97 1,70 2,28 3,88 3,54 2,96
Nitrites (NO2-/L)
2,1 2,166 2,28 3,46 3,55 5,22 6,25 2,221 1,771 3,098 4,5 3,61
Nitrates (NO3-/L)
161,5 76,4 135,9 146,7 164 15,94 149,2 133,4 143,6 80,1 169,8 159
Kjeldhal Nitrogen (mg
N/L) <3 6 5 3 3 6 3 3 <3 7,1 2,8 16,1
Total nitrogen (mg N/L)
<40,11 23,91 36,38 37,18 41,11 11,19 38,59 33,80 <35,96 26,13 42,51 53,10
Total phosphor (mg P/L)
5,94 3,23 5,24 5,76 7,04 7,48 7,15 6,62 7,97 3,75 6,08 5,27
Sulphates (mg/L)
89,3 59,6 85,1 67 74,7 81 76,5 65,7 72,2 76,2 70 69
Dissolved Oxygen
(mg O2/L) 4,82 5,64 5,20 4,15 7,16 3,41 5,04 7,45 3,54 3,81 8,5 4,32
TSS (mg/L)
8 32 30 19 34 23 36,25 33 14 3 14 14
Hydrocarbons (mg/L)
<0,5 0,4 <0,3 0,3 0,4 16 <0,3 <0,3 <0,3 - - -
Oils and Greases (mg/L)
0,5 1,5 0,8 1 1,8 n/a < 0,3 < 0,3 0,3 <0,7 <0,7 <0,7
Detergents (mg/L)
0,22 0,39 0,34 <0,2 <0,2 0,2 <0,04 <0,2 <0,2 0,26 0,26 <0,05
Obs: Values of February, May, August and November are daily averages (24h compost samples).
The emission limit values (ELV) applied to this WWTP are specified in the discharge licence, attributed
by the local competent authority (Regional Development Coordination Commission - CCDR). These
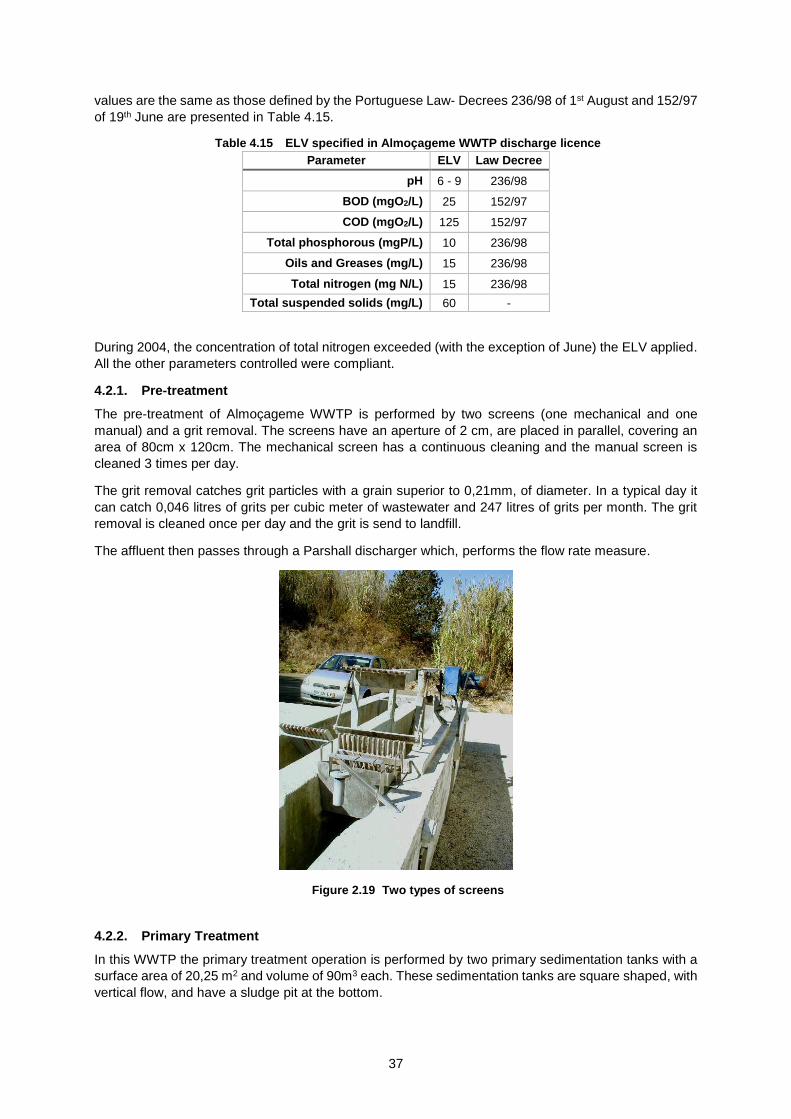
37
values are the same as those defined by the Portuguese Law- Decrees 236/98 of 1st August and 152/97
of 19th June are presented in Table 4.15.
Table 4.15 ELV specified in Almoçageme WWTP discharge licence
Parameter ELV Law Decree
pH 6 - 9 236/98
BOD (mgO2/L) 25 152/97
COD (mgO2/L) 125 152/97
Total phosphorous (mgP/L) 10 236/98
Oils and Greases (mg/L) 15 236/98
Total nitrogen (mg N/L) 15 236/98
Total suspended solids (mg/L) 60 -
During 2004, the concentration of total nitrogen exceeded (with the exception of June) the ELV applied.
All the other parameters controlled were compliant.
4.2.1. Pre-treatment
The pre-treatment of Almoçageme WWTP is performed by two screens (one mechanical and one
manual) and a grit removal. The screens have an aperture of 2 cm, are placed in parallel, covering an
area of 80cm x 120cm. The mechanical screen has a continuous cleaning and the manual screen is
cleaned 3 times per day.
The grit removal catches grit particles with a grain superior to 0,21mm, of diameter. In a typical day it
can catch 0,046 litres of grits per cubic meter of wastewater and 247 litres of grits per month. The grit
removal is cleaned once per day and the grit is send to landfill.
The affluent then passes through a Parshall discharger which, performs the flow rate measure.
Figure 2.19 Two types of screens
4.2.2. Primary Treatment
In this WWTP the primary treatment operation is performed by two primary sedimentation tanks with a
surface area of 20,25 m2 and volume of 90m3 each. These sedimentation tanks are square shaped, with
vertical flow, and have a sludge pit at the bottom.
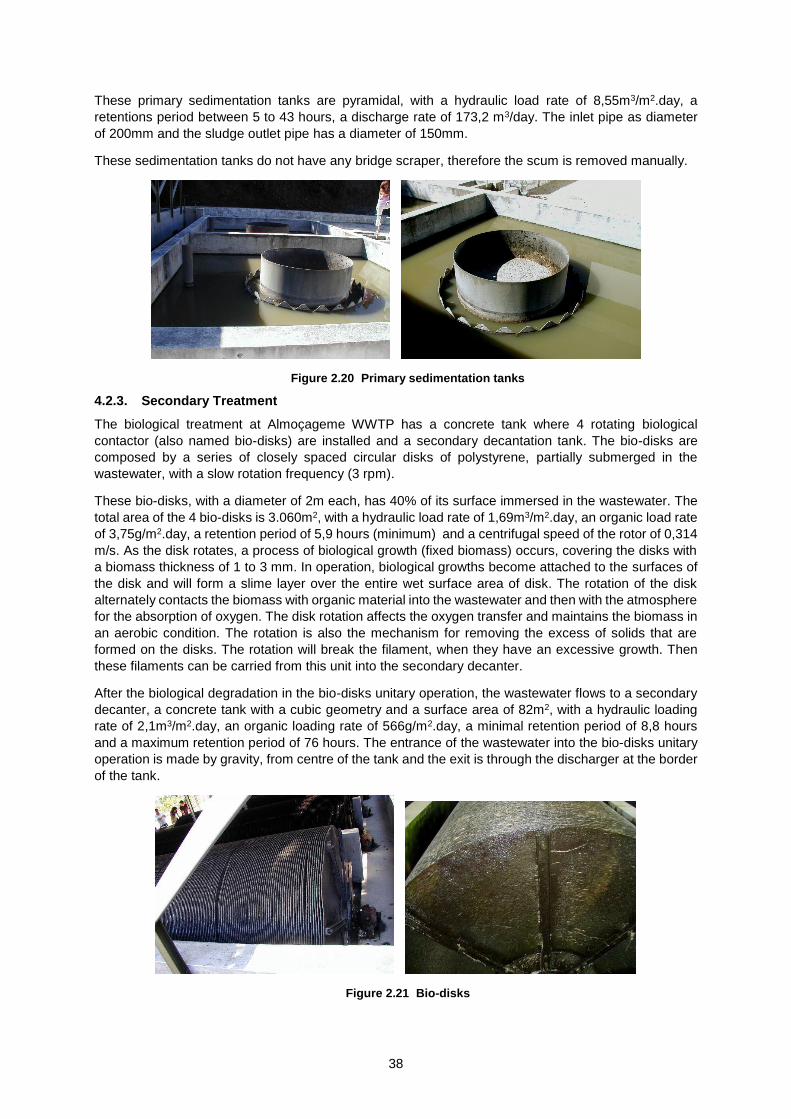
38
These primary sedimentation tanks are pyramidal, with a hydraulic load rate of 8,55m3/m2.day, a
retentions period between 5 to 43 hours, a discharge rate of 173,2 m3/day. The inlet pipe as diameter
of 200mm and the sludge outlet pipe has a diameter of 150mm.
These sedimentation tanks do not have any bridge scraper, therefore the scum is removed manually.
Figure 2.20 Primary sedimentation tanks
4.2.3. Secondary Treatment
The biological treatment at Almoçageme WWTP has a concrete tank where 4 rotating biological
contactor (also named bio-disks) are installed and a secondary decantation tank. The bio-disks are
composed by a series of closely spaced circular disks of polystyrene, partially submerged in the
wastewater, with a slow rotation frequency (3 rpm).
These bio-disks, with a diameter of 2m each, has 40% of its surface immersed in the wastewater. The
total area of the 4 bio-disks is 3.060m2, with a hydraulic load rate of 1,69m3/m2.day, an organic load rate
of 3,75g/m2.day, a retention period of 5,9 hours (minimum) and a centrifugal speed of the rotor of 0,314
m/s. As the disk rotates, a process of biological growth (fixed biomass) occurs, covering the disks with
a biomass thickness of 1 to 3 mm. In operation, biological growths become attached to the surfaces of
the disk and will form a slime layer over the entire wet surface area of disk. The rotation of the disk
alternately contacts the biomass with organic material into the wastewater and then with the atmosphere
for the absorption of oxygen. The disk rotation affects the oxygen transfer and maintains the biomass in
an aerobic condition. The rotation is also the mechanism for removing the excess of solids that are
formed on the disks. The rotation will break the filament, when they have an excessive growth. Then
these filaments can be carried from this unit into the secondary decanter.
After the biological degradation in the bio-disks unitary operation, the wastewater flows to a secondary
decanter, a concrete tank with a cubic geometry and a surface area of 82m2, with a hydraulic loading
rate of 2,1m3/m2.day, an organic loading rate of 566g/m2.day, a minimal retention period of 8,8 hours
and a maximum retention period of 76 hours. The entrance of the wastewater into the bio-disks unitary
operation is made by gravity, from centre of the tank and the exit is through the discharger at the border
of the tank.
Figure 2.21 Bio-disks
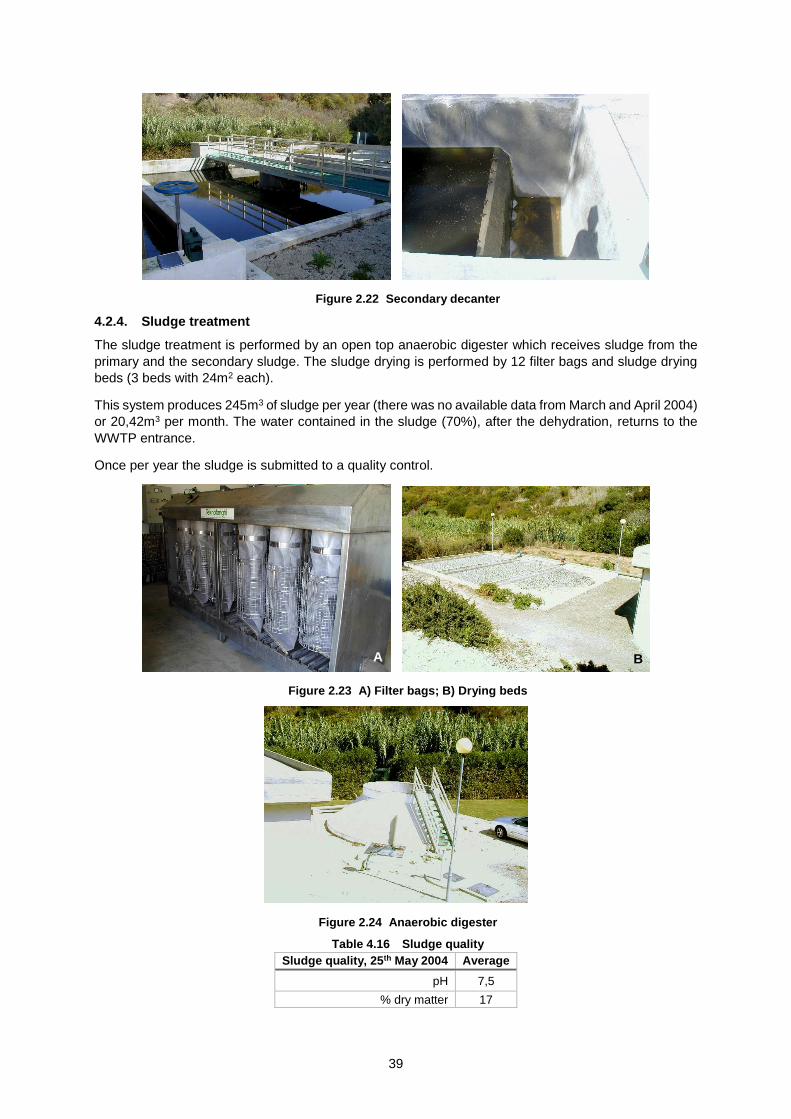
39
Figure 2.22 Secondary decanter
4.2.4. Sludge treatment
The sludge treatment is performed by an open top anaerobic digester which receives sludge from the
primary and the secondary sludge. The sludge drying is performed by 12 filter bags and sludge drying
beds (3 beds with 24m2 each).
This system produces 245m3 of sludge per year (there was no available data from March and April 2004)
or 20,42m3 per month. The water contained in the sludge (70%), after the dehydration, returns to the
WWTP entrance.
Once per year the sludge is submitted to a quality control.
Figure 2.23 A) Filter bags; B) Drying beds
Figure 2.24 Anaerobic digester
Table 4.16 Sludge quality
Sludge quality, 25th May 2004 Average
pH 7,5
% dry matter 17
B
A
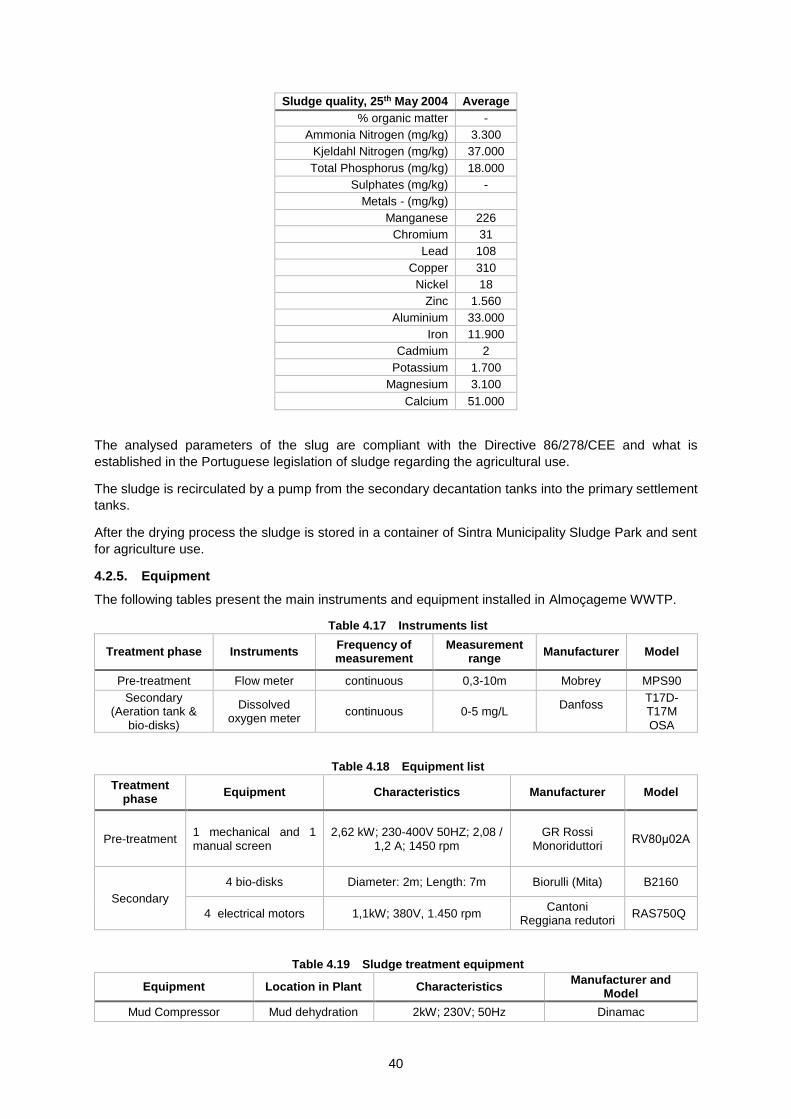
40
Sludge quality, 25th May 2004 Average
% organic matter -
Ammonia Nitrogen (mg/kg) 3.300
Kjeldahl Nitrogen (mg/kg) 37.000
Total Phosphorus (mg/kg) 18.000
Sulphates (mg/kg) -
Metals - (mg/kg)
Manganese 226
Chromium 31
Lead 108
Copper 310
Nickel 18
Zinc 1.560
Aluminium 33.000
Iron 11.900
Cadmium 2
Potassium 1.700
Magnesium 3.100
Calcium 51.000
The analysed parameters of the slug are compliant with the Directive 86/278/CEE and what is
established in the Portuguese legislation of sludge regarding the agricultural use.
The sludge is recirculated by a pump from the secondary decantation tanks into the primary settlement
tanks.
After the drying process the sludge is stored in a container of Sintra Municipality Sludge Park and sent
for agriculture use.
4.2.5. Equipment
The following tables present the main instruments and equipment installed in Almoçageme WWTP.
Table 4.17 Instruments list
Treatment phase Instruments Frequency of measurement
Measurement range
Manufacturer Model
Pre-treatment Flow meter continuous 0,3-10m Mobrey MPS90
Secondary (Aeration tank &
bio-disks)
Dissolved oxygen meter
continuous 0-5 mg/L Danfoss
T17D-T17M OSA
Table 4.18 Equipment list
Treatment phase
Equipment Characteristics Manufacturer Model
Pre-treatment 1 mechanical and 1 manual screen
2,62 kW; 230-400V 50HZ; 2,08 / 1,2 A; 1450 rpm
GR Rossi
Monoriduttori
RV80μ02A
Secondary
4 bio-disks Diameter: 2m; Length: 7m Biorulli (Mita) B2160
4 electrical motors 1,1kW; 380V, 1.450 rpm Cantoni
Reggiana redutori RAS750Q
Table 4.19 Sludge treatment equipment
Equipment Location in Plant Characteristics Manufacturer and
Model
Mud Compressor Mud dehydration 2kW; 230V; 50Hz Dinamac
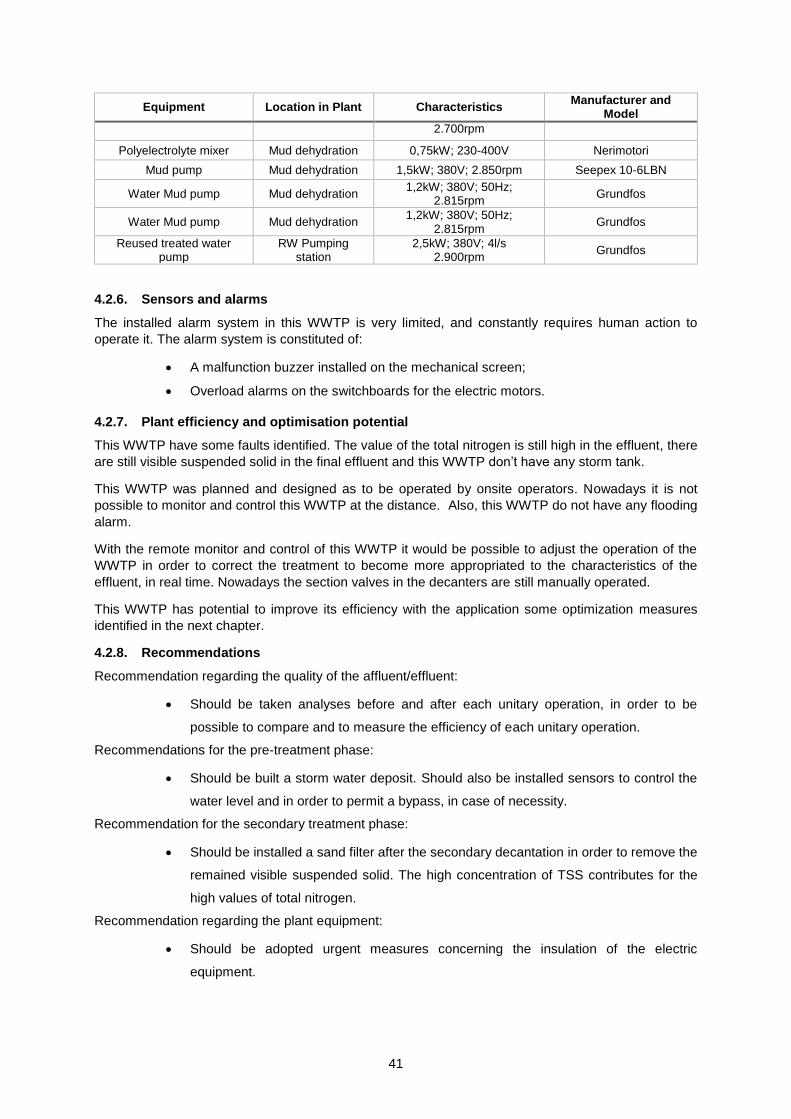
41
Equipment Location in Plant Characteristics Manufacturer and
Model
2.700rpm
Polyelectrolyte mixer Mud dehydration 0,75kW; 230-400V Nerimotori
Mud pump Mud dehydration 1,5kW; 380V; 2.850rpm Seepex 10-6LBN
Water Mud pump Mud dehydration 1,2kW; 380V; 50Hz;
2.815rpm Grundfos
Water Mud pump Mud dehydration 1,2kW; 380V; 50Hz;
2.815rpm Grundfos
Reused treated water pump
RW Pumping station
2,5kW; 380V; 4l/s 2.900rpm
Grundfos
4.2.6. Sensors and alarms
The installed alarm system in this WWTP is very limited, and constantly requires human action to
operate it. The alarm system is constituted of:
A malfunction buzzer installed on the mechanical screen;
Overload alarms on the switchboards for the electric motors.
4.2.7. Plant efficiency and optimisation potential
This WWTP have some faults identified. The value of the total nitrogen is still high in the effluent, there
are still visible suspended solid in the final effluent and this WWTP don’t have any storm tank.
This WWTP was planned and designed as to be operated by onsite operators. Nowadays it is not
possible to monitor and control this WWTP at the distance. Also, this WWTP do not have any flooding
alarm.
With the remote monitor and control of this WWTP it would be possible to adjust the operation of the
WWTP in order to correct the treatment to become more appropriated to the characteristics of the
effluent, in real time. Nowadays the section valves in the decanters are still manually operated.
This WWTP has potential to improve its efficiency with the application some optimization measures
identified in the next chapter.
4.2.8. Recommendations
Recommendation regarding the quality of the affluent/effluent:
Should be taken analyses before and after each unitary operation, in order to be
possible to compare and to measure the efficiency of each unitary operation.
Recommendations for the pre-treatment phase:
Should be built a storm water deposit. Should also be installed sensors to control the
water level and in order to permit a bypass, in case of necessity.
Recommendation for the secondary treatment phase:
Should be installed a sand filter after the secondary decantation in order to remove the
remained visible suspended solid. The high concentration of TSS contributes for the
high values of total nitrogen.
Recommendation regarding the plant equipment:
Should be adopted urgent measures concerning the insulation of the electric
equipment.
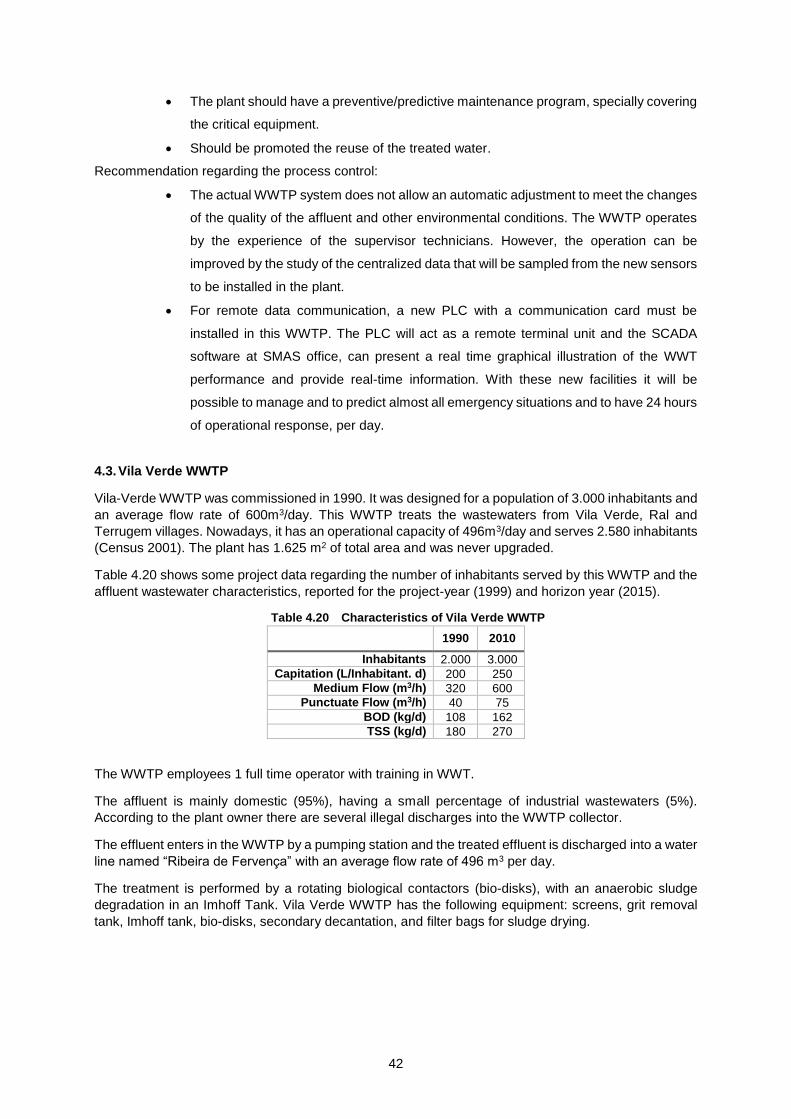
42
The plant should have a preventive/predictive maintenance program, specially covering
the critical equipment.
Should be promoted the reuse of the treated water.
Recommendation regarding the process control:
The actual WWTP system does not allow an automatic adjustment to meet the changes
of the quality of the affluent and other environmental conditions. The WWTP operates
by the experience of the supervisor technicians. However, the operation can be
improved by the study of the centralized data that will be sampled from the new sensors
to be installed in the plant.
For remote data communication, a new PLC with a communication card must be
installed in this WWTP. The PLC will act as a remote terminal unit and the SCADA
software at SMAS office, can present a real time graphical illustration of the WWT
performance and provide real-time information. With these new facilities it will be
possible to manage and to predict almost all emergency situations and to have 24 hours
of operational response, per day.
4.3. Vila Verde WWTP
Vila-Verde WWTP was commissioned in 1990. It was designed for a population of 3.000 inhabitants and
an average flow rate of 600m3/day. This WWTP treats the wastewaters from Vila Verde, Ral and
Terrugem villages. Nowadays, it has an operational capacity of 496m3/day and serves 2.580 inhabitants
(Census 2001). The plant has 1.625 m2 of total area and was never upgraded.
Table 4.20 shows some project data regarding the number of inhabitants served by this WWTP and the
affluent wastewater characteristics, reported for the project-year (1999) and horizon year (2015).
Table 4.20 Characteristics of Vila Verde WWTP
1990 2010
Inhabitants 2.000 3.000
Capitation (L/Inhabitant. d) 200 250
Medium Flow (m3/h) 320 600
Punctuate Flow (m3/h) 40 75
BOD (kg/d) 108 162
TSS (kg/d) 180 270
The WWTP employees 1 full time operator with training in WWT.
The affluent is mainly domestic (95%), having a small percentage of industrial wastewaters (5%).
According to the plant owner there are several illegal discharges into the WWTP collector.
The effluent enters in the WWTP by a pumping station and the treated effluent is discharged into a water
line named “Ribeira de Fervença” with an average flow rate of 496 m3 per day.
The treatment is performed by a rotating biological contactors (bio-disks), with an anaerobic sludge
degradation in an Imhoff Tank. Vila Verde WWTP has the following equipment: screens, grit removal
tank, Imhoff tank, bio-disks, secondary decantation, and filter bags for sludge drying.
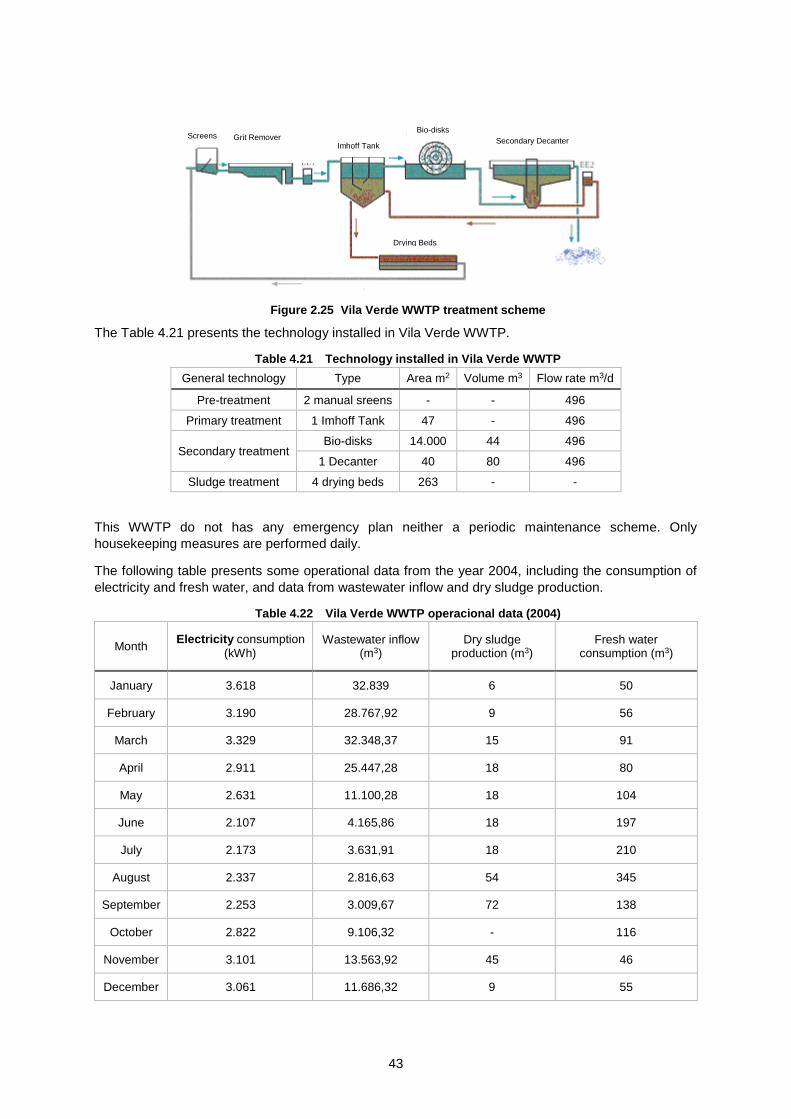
43
Figure 2.25 Vila Verde WWTP treatment scheme
The Table 4.21 presents the technology installed in Vila Verde WWTP.
Table 4.21 Technology installed in Vila Verde WWTP
General technology Type Area m2 Volume m3 Flow rate m3/d
Pre-treatment 2 manual sreens - - 496
Primary treatment 1 Imhoff Tank 47 - 496
Secondary treatment Bio-disks 14.000 44 496
1 Decanter 40 80 496
Sludge treatment 4 drying beds 263 - -
This WWTP do not has any emergency plan neither a periodic maintenance scheme. Only
housekeeping measures are performed daily.
The following table presents some operational data from the year 2004, including the consumption of
electricity and fresh water, and data from wastewater inflow and dry sludge production.
Table 4.22 Vila Verde WWTP operacional data (2004)
Month Electricity consumption
(kWh) Wastewater inflow
(m3) Dry sludge
production (m3) Fresh water
consumption (m3)
January 3.618 32.839 6 50
February 3.190 28.767,92 9 56
March 3.329 32.348,37 15 91
April 2.911 25.447,28 18 80
May 2.631 11.100,28 18 104
June 2.107 4.165,86 18 197
July 2.173 3.631,91 18 210
August 2.337 2.816,63 54 345
September 2.253 3.009,67 72 138
October 2.822 9.106,32 - 116
November 3.101 13.563,92 45 46
December 3.061 11.686,32 9 55
Screens Grit Remover Imhoff Tank
Bio-disks
Secondary Decanter
Drying Beds
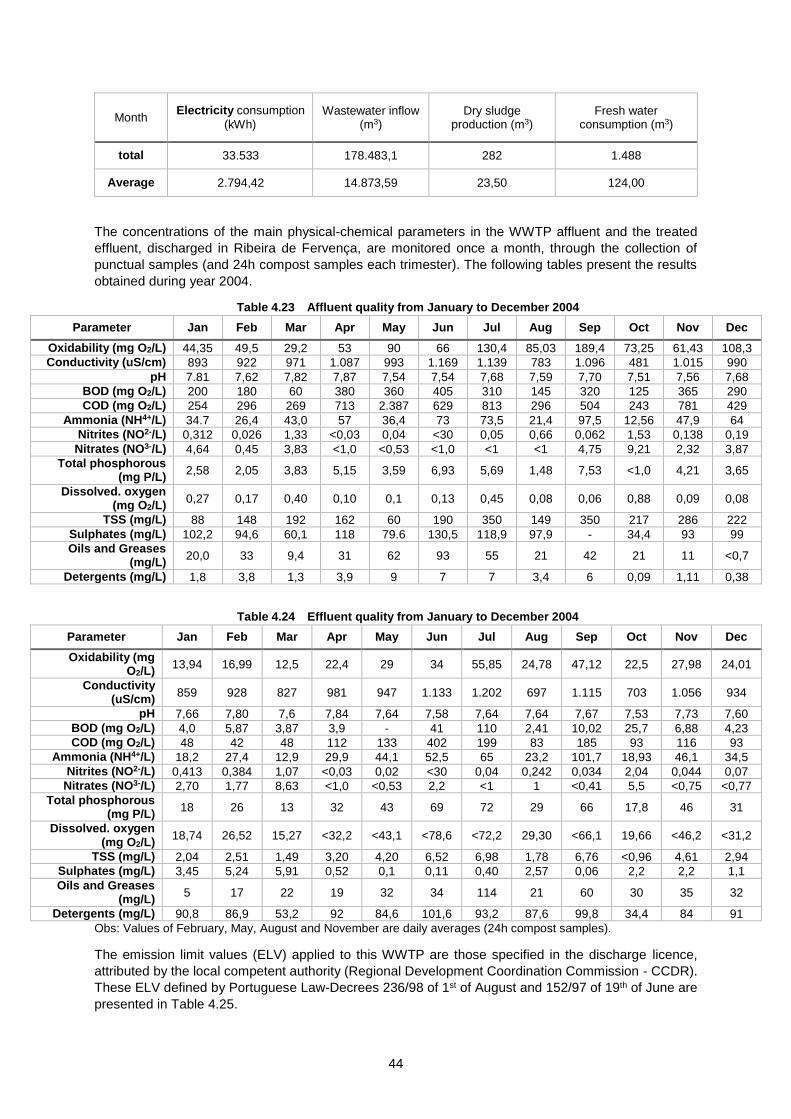
44
Month Electricity consumption
(kWh) Wastewater inflow
(m3) Dry sludge
production (m3) Fresh water
consumption (m3)
total 33.533 178.483,1 282 1.488
Average 2.794,42 14.873,59 23,50 124,00
The concentrations of the main physical-chemical parameters in the WWTP affluent and the treated
effluent, discharged in Ribeira de Fervença, are monitored once a month, through the collection of
punctual samples (and 24h compost samples each trimester). The following tables present the results
obtained during year 2004.
Table 4.23 Affluent quality from January to December 2004
Parameter Jan Feb Mar Apr May Jun Jul Aug Sep Oct Nov Dec
Oxidability (mg O2/L) 44,35 49,5 29,2 53 90 66 130,4 85,03 189,4 73,25 61,43 108,3
Conductivity (uS/cm) 893 922 971 1.087 993 1.169 1.139 783 1.096 481 1.015 990
pH 7.81 7,62 7,82 7,87 7,54 7,54 7,68 7,59 7,70 7,51 7,56 7,68
BOD (mg O2/L) 200 180 60 380 360 405 310 145 320 125 365 290
COD (mg O2/L) 254 296 269 713 2.387 629 813 296 504 243 781 429
Ammonia (NH4+/L) 34.7 26,4 43,0 57 36,4 73 73,5 21,4 97,5 12,56 47,9 64
Nitrites (NO2-/L) 0,312 0,026 1,33 <0,03 0,04 <30 0,05 0,66 0,062 1,53 0,138 0,19
Nitrates (NO3-/L) 4,64 0,45 3,83 <1,0 <0,53 <1,0 <1 <1 4,75 9,21 2,32 3,87
Total phosphorous (mg P/L)
2,58 2,05 3,83 5,15 3,59 6,93 5,69 1,48 7,53 <1,0 4,21 3,65
Dissolved. oxygen (mg O2/L)
0,27 0,17 0,40 0,10 0,1 0,13 0,45 0,08 0,06 0,88 0,09 0,08
TSS (mg/L) 88 148 192 162 60 190 350 149 350 217 286 222
Sulphates (mg/L) 102,2 94,6 60,1 118 79.6 130,5 118,9 97,9 - 34,4 93 99
Oils and Greases (mg/L)
20,0 33 9,4 31 62 93 55 21 42 21 11 <0,7
Detergents (mg/L) 1,8 3,8 1,3 3,9 9 7 7 3,4 6 0,09 1,11 0,38
Table 4.24 Effluent quality from January to December 2004
Parameter Jan Feb Mar Apr May Jun Jul Aug Sep Oct Nov Dec
Oxidability (mg O2/L)
13,94 16,99 12,5 22,4 29 34 55,85 24,78 47,12 22,5 27,98 24,01
Conductivity (uS/cm)
859 928 827 981 947 1.133 1.202 697 1.115 703 1.056 934
pH 7,66 7,80 7,6 7,84 7,64 7,58 7,64 7,64 7,67 7,53 7,73 7,60
BOD (mg O2/L) 4,0 5,87 3,87 3,9 - 41 110 2,41 10,02 25,7 6,88 4,23
COD (mg O2/L) 48 42 48 112 133 402 199 83 185 93 116 93
Ammonia (NH4+/L) 18,2 27,4 12,9 29,9 44,1 52,5 65 23,2 101,7 18,93 46,1 34,5
Nitrites (NO2-/L) 0,413 0,384 1,07 <0,03 0,02 <30 0,04 0,242 0,034 2,04 0,044 0,07
Nitrates (NO3-/L) 2,70 1,77 8,63 <1,0 <0,53 2,2 <1 1 <0,41 5,5 <0,75 <0,77
Total phosphorous (mg P/L)
18 26 13 32 43 69 72 29 66 17,8 46 31
Dissolved. oxygen (mg O2/L)
18,74 26,52 15,27 <32,2 <43,1 <78,6 <72,2 29,30 <66,1 19,66 <46,2 <31,2
TSS (mg/L) 2,04 2,51 1,49 3,20 4,20 6,52 6,98 1,78 6,76 <0,96 4,61 2,94
Sulphates (mg/L) 3,45 5,24 5,91 0,52 0,1 0,11 0,40 2,57 0,06 2,2 2,2 1,1
Oils and Greases (mg/L)
5 17 22 19 32 34 114 21 60 30 35 32
Detergents (mg/L) 90,8 86,9 53,2 92 84,6 101,6 93,2 87,6 99,8 34,4 84 91
Obs: Values of February, May, August and November are daily averages (24h compost samples).
The emission limit values (ELV) applied to this WWTP are those specified in the discharge licence,
attributed by the local competent authority (Regional Development Coordination Commission - CCDR).
These ELV defined by Portuguese Law-Decrees 236/98 of 1st of August and 152/97 of 19th of June are
presented in Table 4.25.
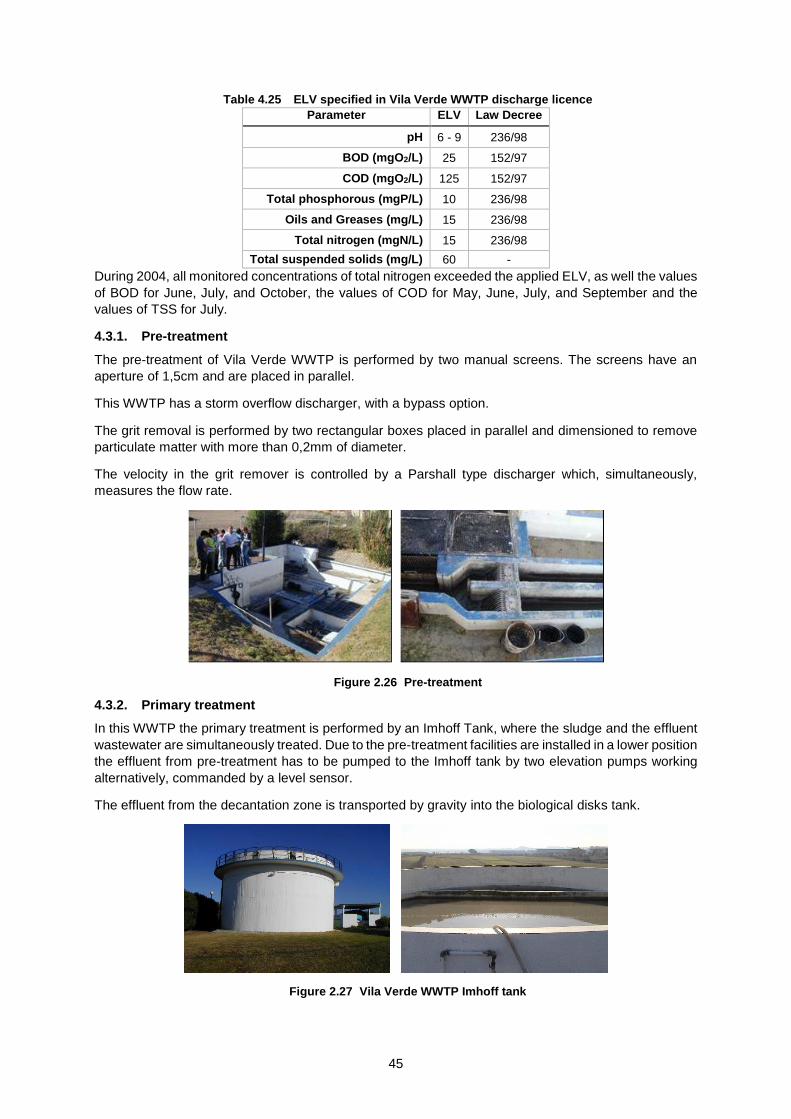
45
Table 4.25 ELV specified in Vila Verde WWTP discharge licence
Parameter ELV Law Decree
pH 6 - 9 236/98
BOD (mgO2/L) 25 152/97
COD (mgO2/L) 125 152/97
Total phosphorous (mgP/L) 10 236/98
Oils and Greases (mg/L) 15 236/98
Total nitrogen (mgN/L) 15 236/98
Total suspended solids (mg/L) 60 -
During 2004, all monitored concentrations of total nitrogen exceeded the applied ELV, as well the values
of BOD for June, July, and October, the values of COD for May, June, July, and September and the
values of TSS for July.
4.3.1. Pre-treatment
The pre-treatment of Vila Verde WWTP is performed by two manual screens. The screens have an
aperture of 1,5cm and are placed in parallel.
This WWTP has a storm overflow discharger, with a bypass option.
The grit removal is performed by two rectangular boxes placed in parallel and dimensioned to remove
particulate matter with more than 0,2mm of diameter.
The velocity in the grit remover is controlled by a Parshall type discharger which, simultaneously,
measures the flow rate.
Figure 2.26 Pre-treatment
4.3.2. Primary treatment
In this WWTP the primary treatment is performed by an Imhoff Tank, where the sludge and the effluent
wastewater are simultaneously treated. Due to the pre-treatment facilities are installed in a lower position
the effluent from pre-treatment has to be pumped to the Imhoff tank by two elevation pumps working
alternatively, commanded by a level sensor.
The effluent from the decantation zone is transported by gravity into the biological disks tank.
Figure 2.27 Vila Verde WWTP Imhoff tank
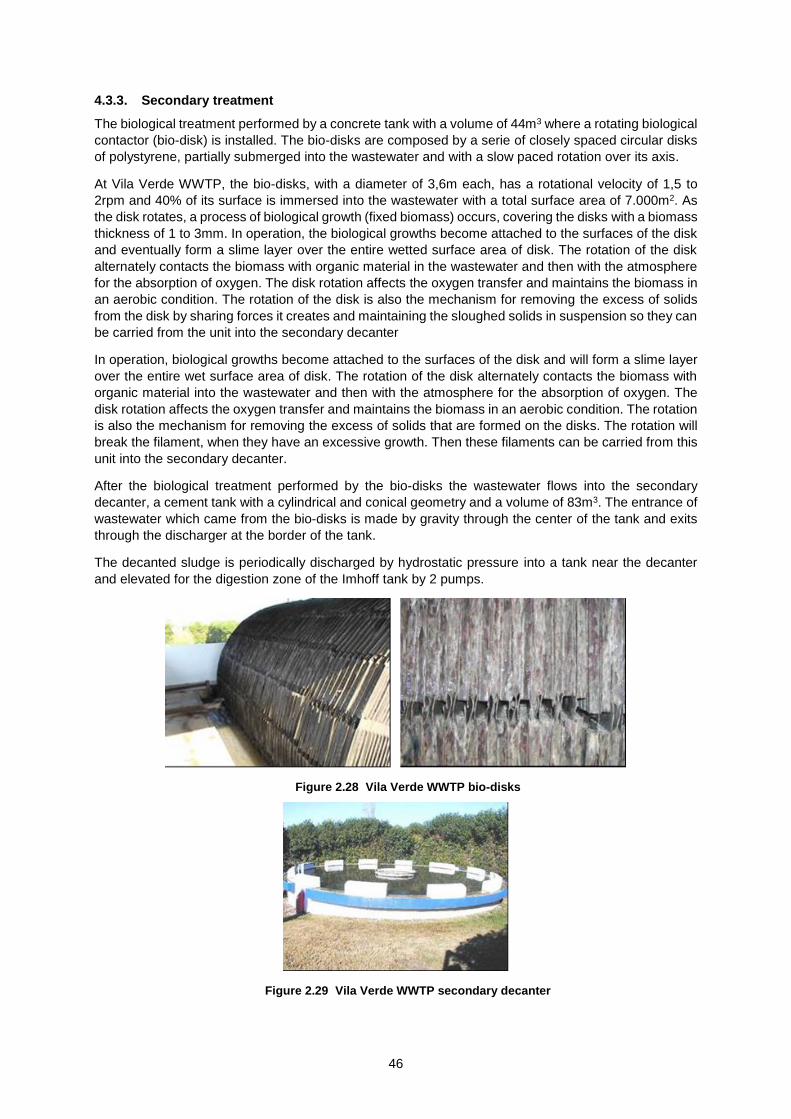
46
4.3.3. Secondary treatment
The biological treatment performed by a concrete tank with a volume of 44m3 where a rotating biological
contactor (bio-disk) is installed. The bio-disks are composed by a serie of closely spaced circular disks
of polystyrene, partially submerged into the wastewater and with a slow paced rotation over its axis.
At Vila Verde WWTP, the bio-disks, with a diameter of 3,6m each, has a rotational velocity of 1,5 to
2rpm and 40% of its surface is immersed into the wastewater with a total surface area of 7.000m2. As
the disk rotates, a process of biological growth (fixed biomass) occurs, covering the disks with a biomass
thickness of 1 to 3mm. In operation, the biological growths become attached to the surfaces of the disk
and eventually form a slime layer over the entire wetted surface area of disk. The rotation of the disk
alternately contacts the biomass with organic material in the wastewater and then with the atmosphere
for the absorption of oxygen. The disk rotation affects the oxygen transfer and maintains the biomass in
an aerobic condition. The rotation of the disk is also the mechanism for removing the excess of solids
from the disk by sharing forces it creates and maintaining the sloughed solids in suspension so they can
be carried from the unit into the secondary decanter
In operation, biological growths become attached to the surfaces of the disk and will form a slime layer
over the entire wet surface area of disk. The rotation of the disk alternately contacts the biomass with
organic material into the wastewater and then with the atmosphere for the absorption of oxygen. The
disk rotation affects the oxygen transfer and maintains the biomass in an aerobic condition. The rotation
is also the mechanism for removing the excess of solids that are formed on the disks. The rotation will
break the filament, when they have an excessive growth. Then these filaments can be carried from this
unit into the secondary decanter.
After the biological treatment performed by the bio-disks the wastewater flows into the secondary
decanter, a cement tank with a cylindrical and conical geometry and a volume of 83m3. The entrance of
wastewater which came from the bio-disks is made by gravity through the center of the tank and exits
through the discharger at the border of the tank.
The decanted sludge is periodically discharged by hydrostatic pressure into a tank near the decanter
and elevated for the digestion zone of the Imhoff tank by 2 pumps.
Figure 2.28 Vila Verde WWTP bio-disks
Figure 2.29 Vila Verde WWTP secondary decanter
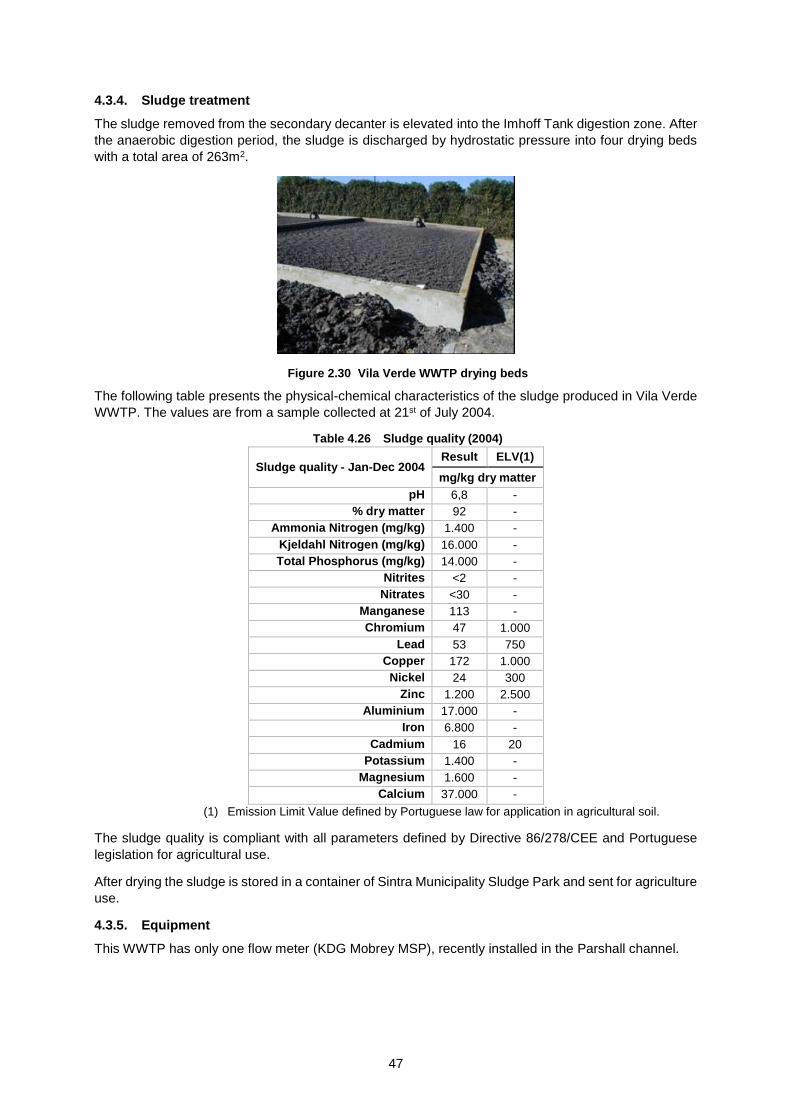
47
4.3.4. Sludge treatment
The sludge removed from the secondary decanter is elevated into the Imhoff Tank digestion zone. After
the anaerobic digestion period, the sludge is discharged by hydrostatic pressure into four drying beds
with a total area of 263m2.
Figure 2.30 Vila Verde WWTP drying beds
The following table presents the physical-chemical characteristics of the sludge produced in Vila Verde
WWTP. The values are from a sample collected at 21st of July 2004.
Table 4.26 Sludge quality (2004)
Sludge quality - Jan-Dec 2004 Result ELV(1)
mg/kg dry matter
pH 6,8 -
% dry matter 92 -
Ammonia Nitrogen (mg/kg) 1.400 -
Kjeldahl Nitrogen (mg/kg) 16.000 -
Total Phosphorus (mg/kg) 14.000 -
Nitrites <2 -
Nitrates <30 -
Manganese 113 -
Chromium 47 1.000
Lead 53 750
Copper 172 1.000
Nickel 24 300
Zinc 1.200 2.500
Aluminium 17.000 -
Iron 6.800 -
Cadmium 16 20
Potassium 1.400 -
Magnesium 1.600 -
Calcium 37.000 -
(1) Emission Limit Value defined by Portuguese law for application in agricultural soil.
The sludge quality is compliant with all parameters defined by Directive 86/278/CEE and Portuguese
legislation for agricultural use.
After drying the sludge is stored in a container of Sintra Municipality Sludge Park and sent for agriculture
use.
4.3.5. Equipment
This WWTP has only one flow meter (KDG Mobrey MSP), recently installed in the Parshall channel.
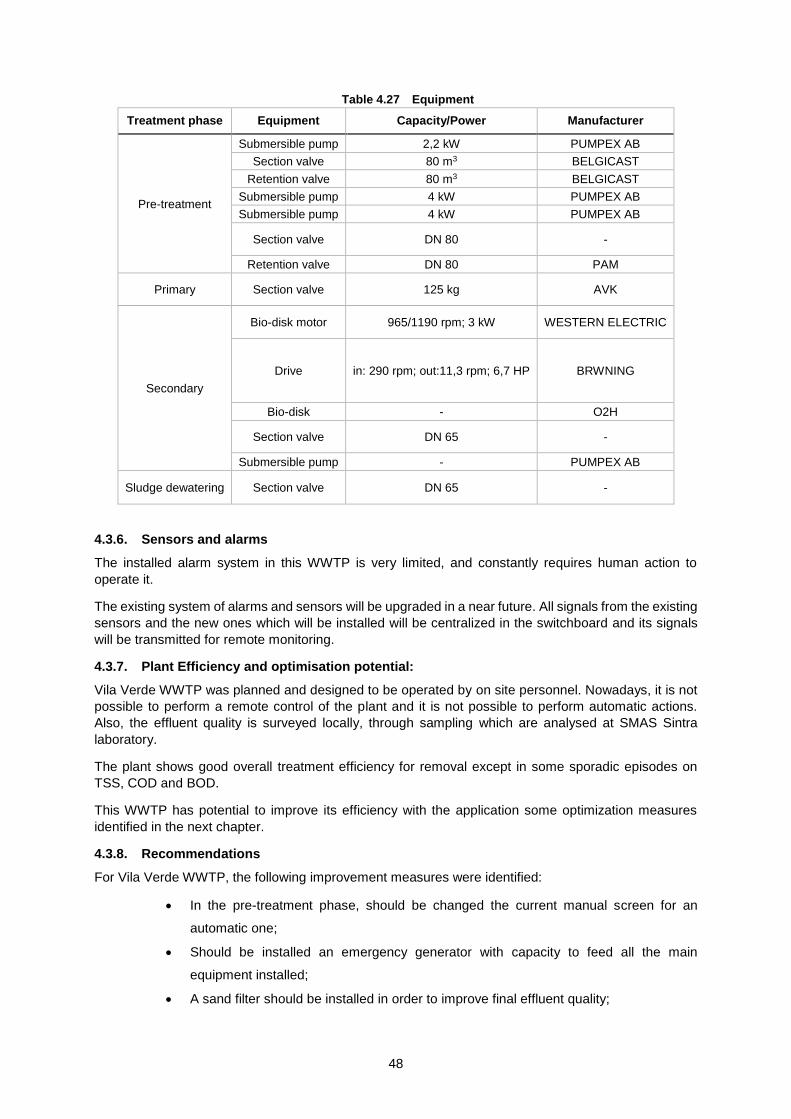
48
Table 4.27 Equipment
Treatment phase Equipment Capacity/Power Manufacturer
Pre-treatment
Submersible pump 2,2 kW PUMPEX AB
Section valve 80 m3 BELGICAST
Retention valve 80 m3 BELGICAST
Submersible pump 4 kW PUMPEX AB
Submersible pump 4 kW PUMPEX AB
Section valve DN 80 -
Retention valve DN 80 PAM
Primary Section valve 125 kg AVK
Secondary
Bio-disk motor 965/1190 rpm; 3 kW WESTERN ELECTRIC
Drive in: 290 rpm; out:11,3 rpm; 6,7 HP BRWNING
Bio-disk - O2H
Section valve DN 65 -
Submersible pump - PUMPEX AB
Sludge dewatering Section valve DN 65 -
4.3.6. Sensors and alarms
The installed alarm system in this WWTP is very limited, and constantly requires human action to
operate it.
The existing system of alarms and sensors will be upgraded in a near future. All signals from the existing
sensors and the new ones which will be installed will be centralized in the switchboard and its signals
will be transmitted for remote monitoring.
4.3.7. Plant Efficiency and optimisation potential:
Vila Verde WWTP was planned and designed to be operated by on site personnel. Nowadays, it is not
possible to perform a remote control of the plant and it is not possible to perform automatic actions.
Also, the effluent quality is surveyed locally, through sampling which are analysed at SMAS Sintra
laboratory.
The plant shows good overall treatment efficiency for removal except in some sporadic episodes on
TSS, COD and BOD.
This WWTP has potential to improve its efficiency with the application some optimization measures
identified in the next chapter.
4.3.8. Recommendations
For Vila Verde WWTP, the following improvement measures were identified:
In the pre-treatment phase, should be changed the current manual screen for an
automatic one;
Should be installed an emergency generator with capacity to feed all the main
equipment installed;
A sand filter should be installed in order to improve final effluent quality;
49
Currently, only the global efficiency of the WWTP is monitored. Should also be
monitored the efficiency of each unitary operation;
The plant should be subject to a preventive/predictive maintenance program, specially
covering its critical equipment;
The actual WWTP system does not allow an automatic adjustment to meet the changes
of the quality of the affluent and other environmental conditions. The WWTP operates
by the experience of the supervisor technicians. However, the operation can be
improved by the study of the centralized data that will be sampled from the new sensors
to be installed in the plant.
For remote data communication, a new PLC with a communication card must be
installed in this WWTP. The PLC will act as a remote terminal unit and the SCADA
software at SMAS office, can present a real time graphical illustration of the WWT
performance and provide real-time information. With these new facilities it will be
possible to manage and to predict almost all emergency situations and to have 24 hours
of operational response, per day.

50
51
5. Thermal treatment of wastewater sludge and its applications
5.1. Sewage sludge treatment process
5.1.1. Introduction
Solid and semi-solid waste, generated in human activities of today’s societies, result in severe
environmental problems around the Globe. These wastes may come from wastewater treatment plants,
domestic activity, commercial, service or industries, which will generate urban, agricultural and industrial
solid wastes. The reduction of these wastes may occur through different scenarios, from prevention to
recovery of valuable products and consequent final deposition.
The optimisation potential of these wastes management depends on many factors: origin, quantity,
composition, region of production, season of production, available technology of treatment and/or
valorisation, treatment costs, deposition costs availability of human resources, adequate technological
demands, environmental policy of the region, public acceptance of the proposed solution at a local and
regional level.
The sludge management is an expensive and a complex activity. If the management is executed
inappropriately it can compromise the environmental and sanitary benefits obtained by a correct
implementation of the sludge treatment.
The final destination of the WWTP sludge constitutes a fundamental step for the success of a sludge
treatment system. The choice and evaluation of best alternatives for the treatment and final destination
of sludge is complex, since it involves technical, economic, environmental and legal aspects that go
beyond the limits of the treatment plants sphere.
Despite the selection of the sludge final destination is a complex process and, many times costly, it still
became neglected in the conception of the treatment systems. It is common to find WWTP which were
conceived and projected without any particular concern about adequate sludge management, opting to
concentrate their efforts in the treatment of the liquid stage. This situation leads to high costs, operational
setbacks which, many times, generate environmental impacts which compromise the benefits and the
investment in treatment systems.
The WWTP sludge has a complex composition, containing high levels of organic matter and nutrients
which may be valorised in agriculture. Therefore, sludge contains also contaminants (heavy metals,
pesticides, detergents, etc.), pathogenic organisms (virus, protozoa, bacteria and fungus) and organic
compounds, which may potentially cause strong odours, attract animals (insects, rodents) and,
depending on its concentration, may offer risk of environmental pollution.
The sludge which came from urban waste water treatment, when properly treated to form a set of quality
and homogenous waste, is named biosolid. In order to adopt this term, biosolid, it is mandatory for the
sludge to have certain chemical and biological characteristics which must be compatible with a valuable
utilization, for example in the agriculture. The biosolid is a product which enhances the benefits of the
sludge valorisation in opposition unproductive final depositions, such as the landfill deposition.
The sludge in a conventional wastewater treatment plant is produced in various points of the treatment
and depuration process. And the environmental management of the sludge is a problem that needs to
be considered carefully in order to be efficient. When treating sludge, it is critical to do not redirect the
pollution that originally in the water, to other environmental media, such as soil and air. This can happen
by the application of inappropriate technologies or by applying unsuitable disposal approaches, for the
local conditions.
The first unitary operation with sludge treatment occur in the pre-treatment. In general, the solids and
sands collected in this first depuration point are similar those found in urban waste, therefore residue is
treated like urban waste.
The second unitary operation with sludge treatment occur usually in the primary treatment, where the
sludge (primary sludge) is collected by sedimentation. This sludge is separated from the water and has
a specific treatment which depends on the WWTP size and type.
52
After the primary treatment, the water passes into the biologic treatment phase. The sludge generated
in the secondary decanter is recirculated to the aeration tank and the sludge which is in excess is purged
and do not proceed into the next unitary operation. Generally, the primary sludge is always more
concentrated than the biologic sludge. This secondary sludge is required to treat wastewater in the
WWTP.
The most common stages in the sludge treatment are:
To eliminate water by increasing the solids concentration;
To remove the volatile compounds in order to reduce the concentration of
biodegradable organic material.
Therefore, the first step to reduce the water volume is the thickening process. This process is either
carried by gravity or by flotation, depending on the sludge type.
Even after treatment, the thickened sludge has 95% of water, consequently, it is still considered a liquid.
The next treatment step consists in the removal of the volatile material removal for sludge stabilization
phase. This process is performed by an anaerobic or aerobic digestion. Usually, due to the low demand
on space occupation, small WWTP prefer to use aerobic digestion treatments.
Therefore, the dehydration process starts onsite with a centrifuge dehydration or a press filter.
5.1.2. Drying process
In order to be performed drying process any specific requirements need to be complied a. This means
that all kinds of sludge from municipal wastewater treatment plants may be processed in a properly
designed drying area or plant. Although the possible presence of pathogens is a major concern.
In terms of energy consumption, the water removal by evaporation/drying is usually more expensive
process in comparison with mechanical methods such as press and centrifugation. A good practice is
to perform proper mechanical dewatering before any drying process.
A dry form of sludge is a major marketing advantage because it is a commercially valuable product with
the following applications:
Fertiliser for agriculture and forest;
Secondary fuel for cement kilns, power plants and incinerators;
Soil filling and landscaping.
If the sludge reaches 90% of dry matter it is considered a stable product, with low leachability, high
calorific value and with capacity of being digested in order to produce methane. Due to its high calorific
value, it should be used as fuel on gasification and incineration processes for energy valorisation.
5.1.3. Incineration
Nowadays, the incineration of wastewater sludge could be either done alone or in combination with
other types of waste. In Europe 15% of all WWTP produced end in an incinerator.
The Incineration of sludge can be performed in a specific incinerator or in municipal solid waste
incinerator. From the economic point of view these methods of treatment are viable in the sludge that is
not allowed to be used in agriculture valorisation.
After a pre-drying, the sludge can also be incinerated in cement kilns because it has a high calorific
value. Pollutants will become stabilised in the clinker.
The combination of different waste streams, municipal solid waste and wastewater sludge, also enables
optimisation of the incinerator operations. One of the best examples is incineration of sludge granulate
which results from a thermal drying process. This material can be easily stored and can act as an
incinerator secondary fuel when no other local treatment method is available and it is proven to be more
cost effective.
53
The resulting product from the incineration process it is a stable material without volatile content but that
should always be confirm its inert properties before its final deposition due to its high levels of heavy
metals which will add a toxicity load to the landfill leachate.
5.1.4. Gasification
Gasification is a thermal process where the combustible content of a material is converted with air
(oxygen and/or steam) to an inflammable gas.
The product resulting from the gasification reaction of organic material, like the dry sewage sludge, is a
gas made mostly of CO, H2, CH4, H2O, N2 and an inert residue. This reaction takes place by combustion
of part of the residue with air deficit. Temperatures of 850 to 950ºC are required and the performance
obtained is better as the moisture content of the starting material is lower. A prior thermal drying stage
is thus necessary for optimum process application. With the thermal drying, the sludge passes from a
dry material content of 25% to 85-90%. The gas obtained by gasification is a combustible gas, so it can
have different uses depending of its calorific value. The direct combustion of the gas in electrical energy
engines and turbines allows its valorisation as a source of heat energy for the drying stage.
Finally, the gasification process produces two waste types: inert ashes, which can be dumped, and tars,
which can be reintroduced to the gasification system as energy valorisation potential material. The
quantity of ashes and tars generated on process depends on the gasification system used and the
sewage initial organic material content.
5.1.5. Composting
Sludge composting aims to achieve a biologically stabilisation sludge while controlling pollution risks in
order to develop agriculture or other end use outlets exploiting the nutrient or organic value of sewage
sludge. It can be applied either to non-digested sludge or to digested sludge. Composting involves
aerobic degradation of organic matter, as well as a potential decrease of the sludge water content, the
efficiency of which depends on the composting process.
As a general reference, the water content of a compost mixture of organic wastes should be around
55% while the organic matter content should be greater than 70%, facilitating effective bio-degradation.
High moisture content above 60% reduces the temperature, porosity and thus the oxygen concentration
while low moisture content, below 50%, could limit the rate of composting. At values of 10-15%, the
bacterial metabolism generally ceases to function. Bacterial activity is also influenced by pH, with the
optimal values being between 5,5 and 8.
A balance of the nitrogen and carbon content is necessary for the proper growth of micro-organisms.
The carbon to nitrogen ratio (C/N) of the mixture is therefore commonly used to define the optimum
functional conditions. Although values ranging between 25 and 30 are recommended, the types of
molecules concerned must be evaluated when establishing the ideal ratio.
This process generates an ending product with a volatile material percentage lower than thermal drying
due to the biological degradation of the organic components. This product could be used with agricultural
purposes if fulfils the linked normative.
5.1.6. WWTP Sludge characteristics
Sludge are an inevitable product of waste water treatment, coming essentially from the accumulation of
the products in suspensions in residual affluent residual waters, generally transformed by the action of
microorganisms during the treatment.
Sludge is collected at different stages of the wastewater treatment process. In conventional small sized
wastewater treatment plants, sludge comes from the primary decantation operation and from secondary
and tertiary processes (if applicable). In many cases sludge are obtained in a mixed form, (primary
sludge combined with secondary sludge) in the primary decanter. In other situations, sludge are
separated into different decanters and only afterwards processed in common. Normally, sludge
generated in the tertiary treatment exists in low quantity, except when chemical precipitation is involved
for phosphorous removal.
54
Sewage sludge contains both compounds of agricultural value (including organic matter, nitrogen,
phosphorus and potassium, and to a lesser extent, calcium, sulphur and magnesium), and pollutants
which usually consist of heavy metals, organic pollutants and pathogens. The characteristics of sludge
depend on the original pollution load of the treated wastewater and, also, on the technical characteristics
of the wastewater and sludge treatments carried out.
Sludge is usually treated before disposal or recycling in order to reduce its water content, its fermentation
propensity or the presence of pathogens. Several treatment processes exist, such as thickening,
dewatering, stabilisation and disinfection, and thermal drying. The sludge may undergo one or several
treatments.
With the purpose of encourage the recycling of sludge, it should be taken into account that the
development of agricultural recycling depends principally on the possibilities to improve the quality of
sludge itself and increase confidence in sludge quality. This implies the prevention of pollution of the
wastewater, at source by reducing the possibilities for heavy metals and organic compounds to enter
the wastewater sewage system, and improving sludge treatment as well as ensuring the monitoring of
sludge quality. These technical solutions require major investment from the water companies or local
authorities in charge of treating the wastewater. The possibility to certify the treatment processes
involved and the quality of sludge, either through independent "sewage sludge audits" or by the
certification of sludge production and treatment processes, could help to increase confidence in sludge
quality.
In the same way, the quality standards of sludge recycling practices also need to be guaranteed,
especially for agricultural recycling.
Dewatered sludge is mainly composed (70 to 80%) by water. In dry weight, the organic matter is the
main compound of sludge (from 50 to 70%), varying according to the stabilisation level. Furthermore,
sludge are composed by some nutrients, mainly nitrogen and phosphorous. Sludge may also contain
certain quantities of heavy metals and micro-organisms, such as bacteria and virus.
5.2. WWTP sludge in Portugal
5.2.1. Sludge production
The evolution of sludge production in Portugal during the years of 1994, 1999 and 2006, according to
the served population data presented in the Situation for Basic Sanitation in Portugal (1994) and the
Regional Development Plan 2000-2006 (years 1999-2006).
That study was made by region, matching each region with the area that corresponds to the multi-
municipal systems, as defined in the MAOT (2000). Some of the multi-municipal systems have already
been created, while others are being planned for the near future.
The presupposed adopted for the national estimate for sludge production are as follows:
The following four major treatment processes are considered: primary treatment;
secondary treatment for waste waters produced in agglomerations with more than 2.000
inhabitants in areas classified as less sensitive and for agglomerations with populations
that lie between 2.000 and 10.000 inhabitants in more sensitive areas; a more rigorous
treatment than the secondary level (such as tertiary with nutrient removal or biological
combined with reagents – secondary and tuning) for treating residual waters produced
in agglomerations with more than 10.000 inhabitants for areas classified as sensitive;
and primary treatment assisted with reagents for especially classified individual cases.
The treatment adopted in the special cases, passes of the agreement established
between the Portuguese authorities and the European Commission. At present, the
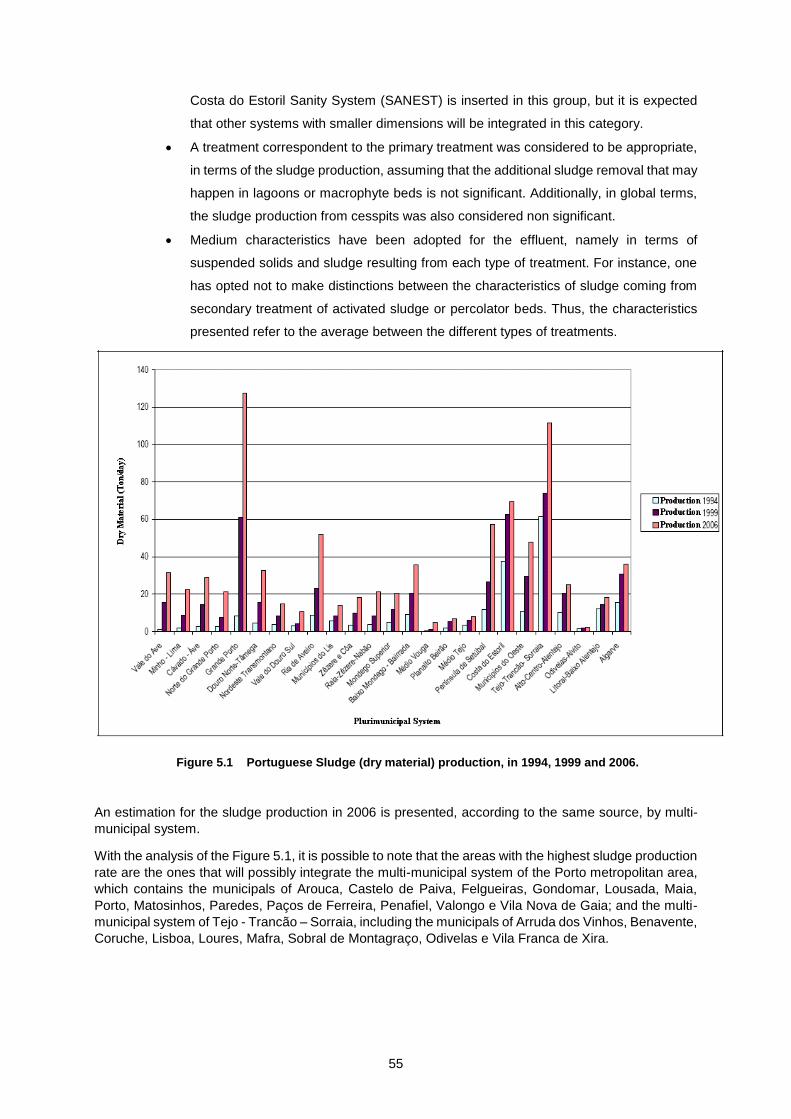
55
Costa do Estoril Sanity System (SANEST) is inserted in this group, but it is expected
that other systems with smaller dimensions will be integrated in this category.
A treatment correspondent to the primary treatment was considered to be appropriate,
in terms of the sludge production, assuming that the additional sludge removal that may
happen in lagoons or macrophyte beds is not significant. Additionally, in global terms,
the sludge production from cesspits was also considered non significant.
Medium characteristics have been adopted for the effluent, namely in terms of
suspended solids and sludge resulting from each type of treatment. For instance, one
has opted not to make distinctions between the characteristics of sludge coming from
secondary treatment of activated sludge or percolator beds. Thus, the characteristics
presented refer to the average between the different types of treatments.
Figure 5.1 Portuguese Sludge (dry material) production, in 1994, 1999 and 2006.
An estimation for the sludge production in 2006 is presented, according to the same source, by multi-
municipal system.
With the analysis of the Figure 5.1, it is possible to note that the areas with the highest sludge production
rate are the ones that will possibly integrate the multi-municipal system of the Porto metropolitan area,
which contains the municipals of Arouca, Castelo de Paiva, Felgueiras, Gondomar, Lousada, Maia,
Porto, Matosinhos, Paredes, Paços de Ferreira, Penafiel, Valongo e Vila Nova de Gaia; and the multi-
municipal system of Tejo - Trancão – Sorraia, including the municipals of Arruda dos Vinhos, Benavente,
Coruche, Lisboa, Loures, Mafra, Sobral de Montagraço, Odivelas e Vila Franca de Xira.
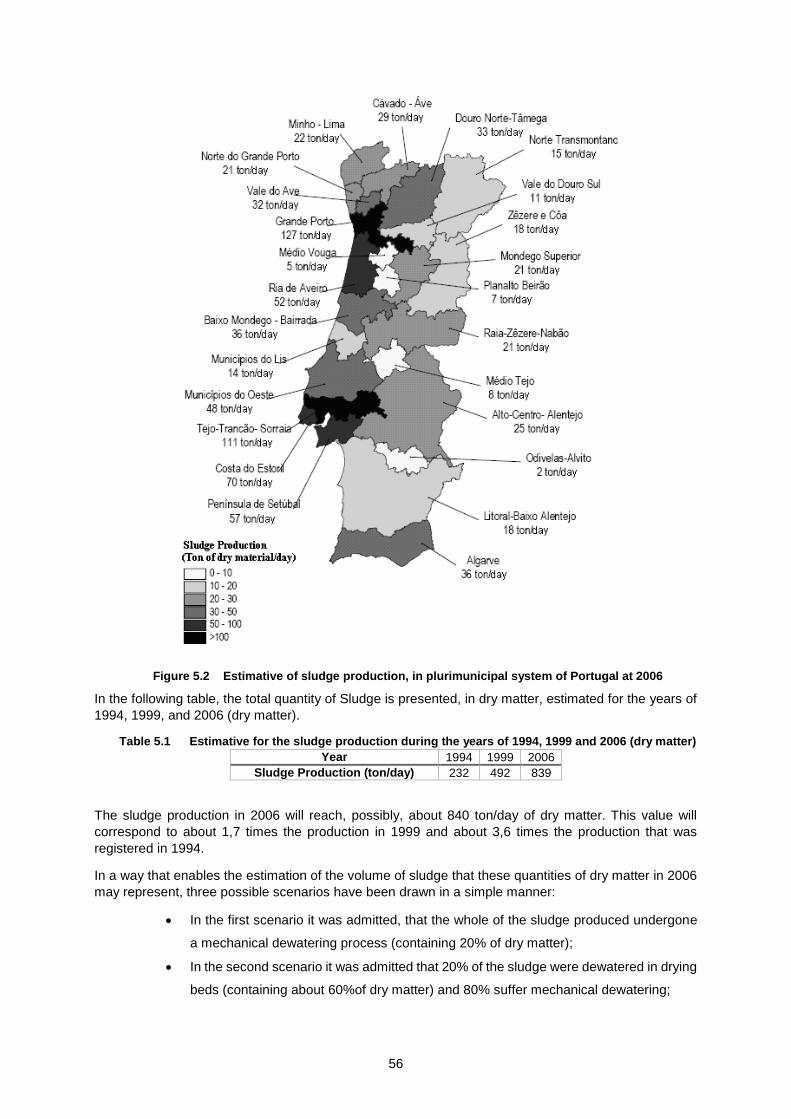
56
Figure 5.2 Estimative of sludge production, in plurimunicipal system of Portugal at 2006
In the following table, the total quantity of Sludge is presented, in dry matter, estimated for the years of
1994, 1999, and 2006 (dry matter).
Table 5.1 Estimative for the sludge production during the years of 1994, 1999 and 2006 (dry matter)
Year 1994 1999 2006
Sludge Production (ton/day) 232 492 839
The sludge production in 2006 will reach, possibly, about 840 ton/day of dry matter. This value will
correspond to about 1,7 times the production in 1999 and about 3,6 times the production that was
registered in 1994.
In a way that enables the estimation of the volume of sludge that these quantities of dry matter in 2006
may represent, three possible scenarios have been drawn in a simple manner:
In the first scenario it was admitted, that the whole of the sludge produced undergone
a mechanical dewatering process (containing 20% of dry matter);
In the second scenario it was admitted that 20% of the sludge were dewatered in drying
beds (containing about 60%of dry matter) and 80% suffer mechanical dewatering;
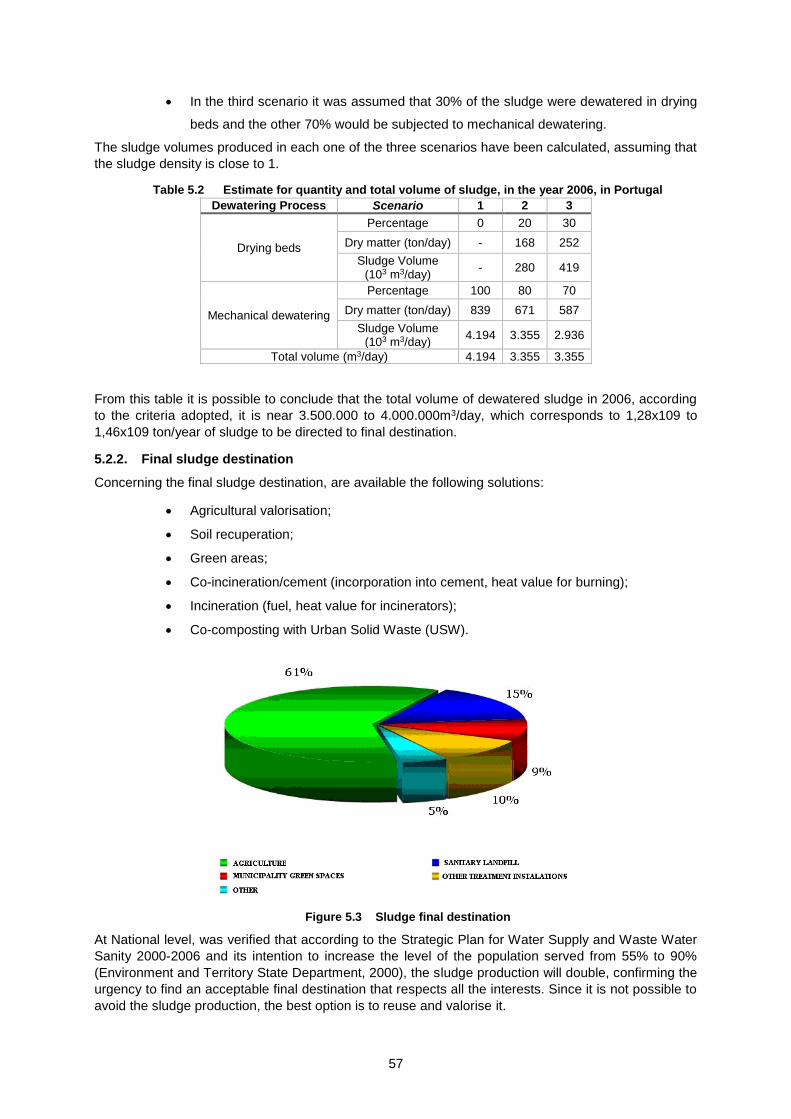
57
In the third scenario it was assumed that 30% of the sludge were dewatered in drying
beds and the other 70% would be subjected to mechanical dewatering.
The sludge volumes produced in each one of the three scenarios have been calculated, assuming that
the sludge density is close to 1.
Table 5.2 Estimate for quantity and total volume of sludge, in the year 2006, in Portugal
Dewatering Process Scenario 1 2 3
Drying beds
Percentage 0 20 30
Dry matter (ton/day) - 168 252
Sludge Volume (103 m3/day)
- 280 419
Mechanical dewatering
Percentage 100 80 70
Dry matter (ton/day) 839 671 587
Sludge Volume (103 m3/day)
4.194 3.355 2.936
Total volume (m3/day) 4.194 3.355 3.355
From this table it is possible to conclude that the total volume of dewatered sludge in 2006, according
to the criteria adopted, it is near 3.500.000 to 4.000.000m3/day, which corresponds to 1,28x10⁹ to
1,46x10⁹ ton/year of sludge to be directed to final destination.
5.2.2. Final sludge destination
Concerning the final sludge destination, are available the following solutions:
Agricultural valorisation;
Soil recuperation;
Green areas;
Co-incineration/cement (incorporation into cement, heat value for burning);
Incineration (fuel, heat value for incinerators);
Co-composting with Urban Solid Waste (USW).
Figure 5.3 Sludge final destination
At National level, was verified that according to the Strategic Plan for Water Supply and Waste Water
Sanity 2000-2006 and its intention to increase the level of the population served from 55% to 90%
(Environment and Territory State Department, 2000), the sludge production will double, confirming the
urgency to find an acceptable final destination that respects all the interests. Since it is not possible to
avoid the sludge production, the best option is to reuse and valorise it.
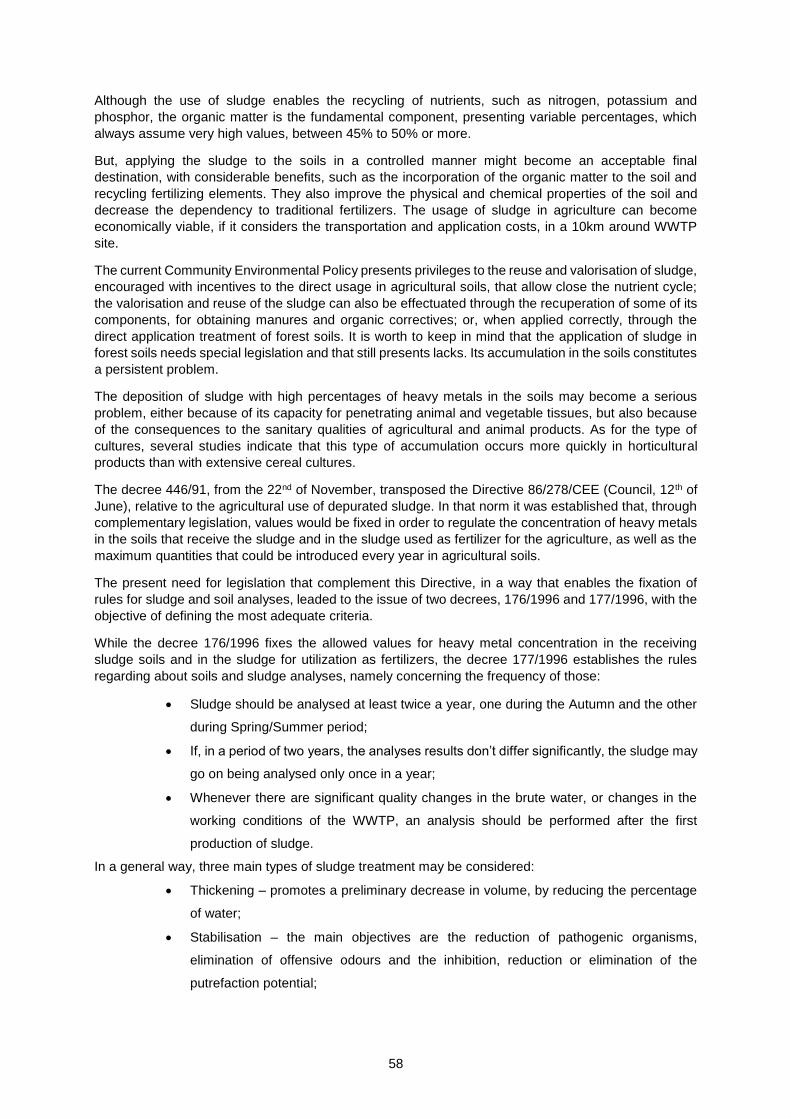
58
Although the use of sludge enables the recycling of nutrients, such as nitrogen, potassium and
phosphor, the organic matter is the fundamental component, presenting variable percentages, which
always assume very high values, between 45% to 50% or more.
But, applying the sludge to the soils in a controlled manner might become an acceptable final
destination, with considerable benefits, such as the incorporation of the organic matter to the soil and
recycling fertilizing elements. They also improve the physical and chemical properties of the soil and
decrease the dependency to traditional fertilizers. The usage of sludge in agriculture can become
economically viable, if it considers the transportation and application costs, in a 10km around WWTP
site.
The current Community Environmental Policy presents privileges to the reuse and valorisation of sludge,
encouraged with incentives to the direct usage in agricultural soils, that allow close the nutrient cycle;
the valorisation and reuse of the sludge can also be effectuated through the recuperation of some of its
components, for obtaining manures and organic correctives; or, when applied correctly, through the
direct application treatment of forest soils. It is worth to keep in mind that the application of sludge in
forest soils needs special legislation and that still presents lacks. Its accumulation in the soils constitutes
a persistent problem.
The deposition of sludge with high percentages of heavy metals in the soils may become a serious
problem, either because of its capacity for penetrating animal and vegetable tissues, but also because
of the consequences to the sanitary qualities of agricultural and animal products. As for the type of
cultures, several studies indicate that this type of accumulation occurs more quickly in horticultural
products than with extensive cereal cultures.
The decree 446/91, from the 22nd of November, transposed the Directive 86/278/CEE (Council, 12th of
June), relative to the agricultural use of depurated sludge. In that norm it was established that, through
complementary legislation, values would be fixed in order to regulate the concentration of heavy metals
in the soils that receive the sludge and in the sludge used as fertilizer for the agriculture, as well as the
maximum quantities that could be introduced every year in agricultural soils.
The present need for legislation that complement this Directive, in a way that enables the fixation of
rules for sludge and soil analyses, leaded to the issue of two decrees, 176/1996 and 177/1996, with the
objective of defining the most adequate criteria.
While the decree 176/1996 fixes the allowed values for heavy metal concentration in the receiving
sludge soils and in the sludge for utilization as fertilizers, the decree 177/1996 establishes the rules
regarding about soils and sludge analyses, namely concerning the frequency of those:
Sludge should be analysed at least twice a year, one during the Autumn and the other
during Spring/Summer period;
If, in a period of two years, the analyses results don’t differ significantly, the sludge may
go on being analysed only once in a year;
Whenever there are significant quality changes in the brute water, or changes in the
working conditions of the WWTP, an analysis should be performed after the first
production of sludge.
In a general way, three main types of sludge treatment may be considered:
Thickening – promotes a preliminary decrease in volume, by reducing the percentage
of water;
Stabilisation – the main objectives are the reduction of pathogenic organisms,
elimination of offensive odours and the inhibition, reduction or elimination of the
putrefaction potential;
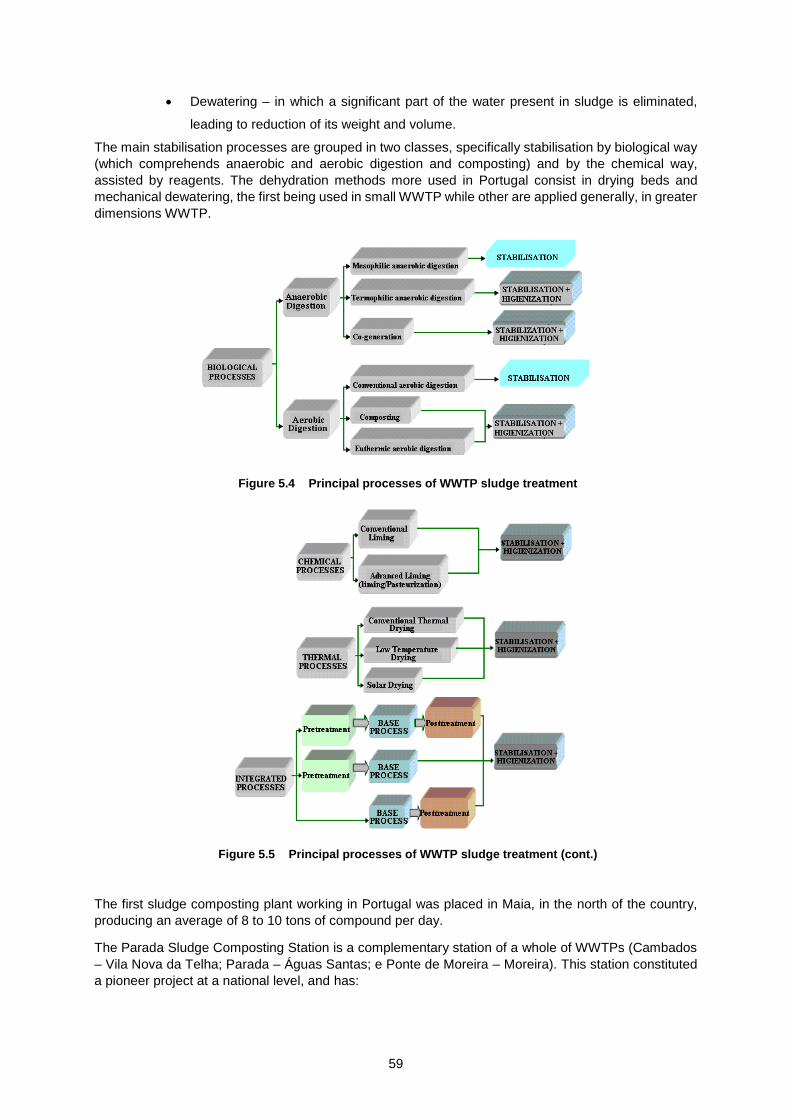
59
Dewatering – in which a significant part of the water present in sludge is eliminated,
leading to reduction of its weight and volume.
The main stabilisation processes are grouped in two classes, specifically stabilisation by biological way
(which comprehends anaerobic and aerobic digestion and composting) and by the chemical way,
assisted by reagents. The dehydration methods more used in Portugal consist in drying beds and
mechanical dewatering, the first being used in small WWTP while other are applied generally, in greater
dimensions WWTP.
Figure 5.4 Principal processes of WWTP sludge treatment
Figure 5.5 Principal processes of WWTP sludge treatment (cont.)
The first sludge composting plant working in Portugal was placed in Maia, in the north of the country,
producing an average of 8 to 10 tons of compound per day.
The Parada Sludge Composting Station is a complementary station of a whole of WWTPs (Cambados
– Vila Nova da Telha; Parada – Águas Santas; e Ponte de Moreira – Moreira). This station constituted
a pioneer project at a national level, and has:
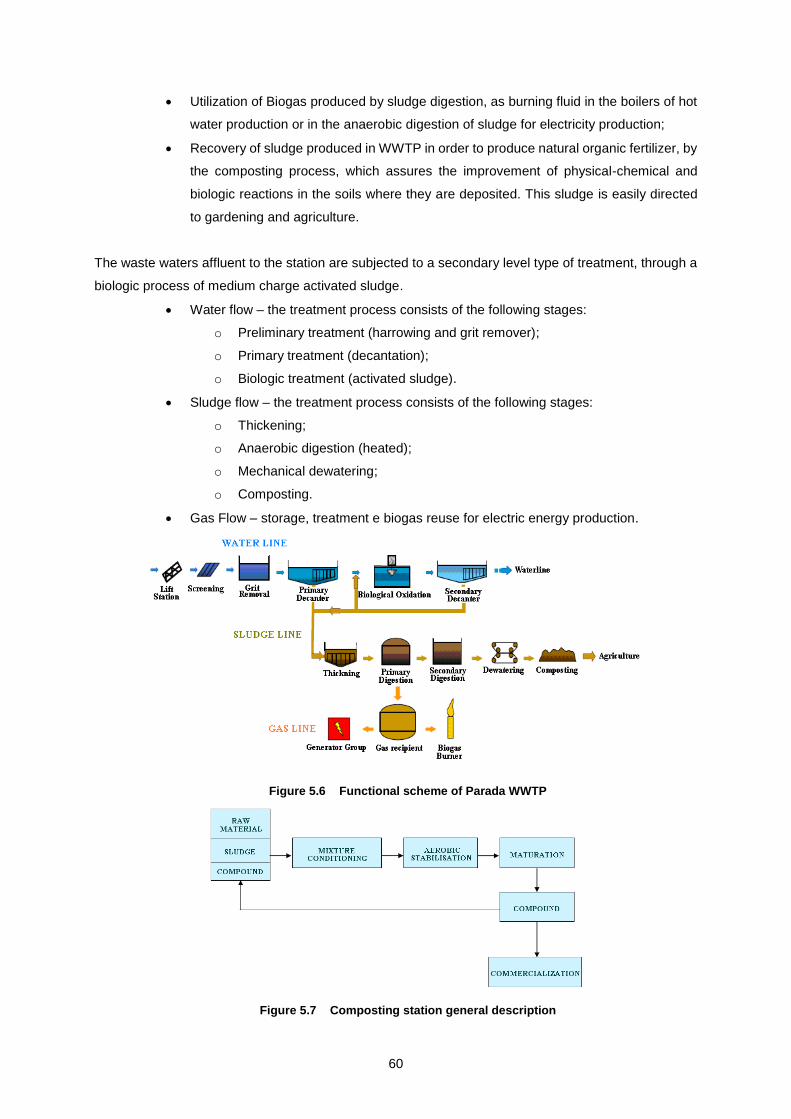
60
Utilization of Biogas produced by sludge digestion, as burning fluid in the boilers of hot
water production or in the anaerobic digestion of sludge for electricity production;
Recovery of sludge produced in WWTP in order to produce natural organic fertilizer, by
the composting process, which assures the improvement of physical-chemical and
biologic reactions in the soils where they are deposited. This sludge is easily directed
to gardening and agriculture.
The waste waters affluent to the station are subjected to a secondary level type of treatment, through a
biologic process of medium charge activated sludge.
Water flow – the treatment process consists of the following stages:
o Preliminary treatment (harrowing and grit remover);
o Primary treatment (decantation);
o Biologic treatment (activated sludge).
Sludge flow – the treatment process consists of the following stages:
o Thickening;
o Anaerobic digestion (heated);
o Mechanical dewatering;
o Composting.
Gas Flow – storage, treatment e biogas reuse for electric energy production.
Figure 5.6 Functional scheme of Parada WWTP
Figure 5.7 Composting station general description
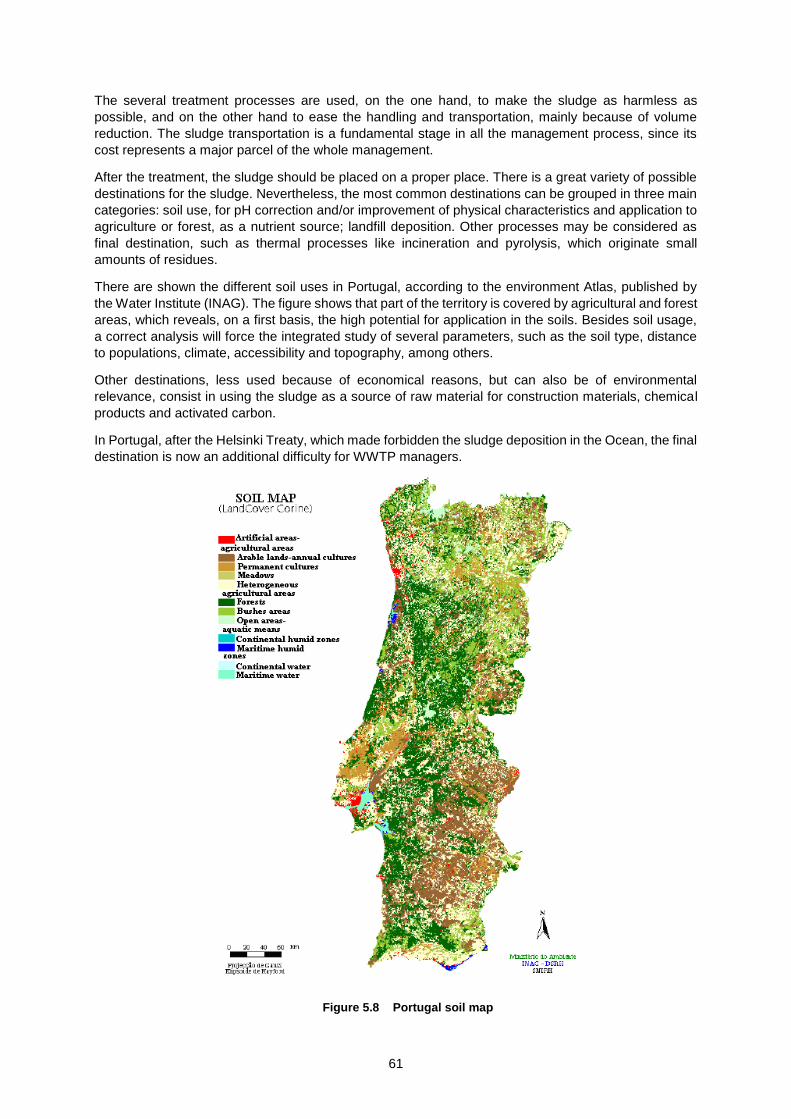
61
The several treatment processes are used, on the one hand, to make the sludge as harmless as
possible, and on the other hand to ease the handling and transportation, mainly because of volume
reduction. The sludge transportation is a fundamental stage in all the management process, since its
cost represents a major parcel of the whole management.
After the treatment, the sludge should be placed on a proper place. There is a great variety of possible
destinations for the sludge. Nevertheless, the most common destinations can be grouped in three main
categories: soil use, for pH correction and/or improvement of physical characteristics and application to
agriculture or forest, as a nutrient source; landfill deposition. Other processes may be considered as
final destination, such as thermal processes like incineration and pyrolysis, which originate small
amounts of residues.
There are shown the different soil uses in Portugal, according to the environment Atlas, published by
the Water Institute (INAG). The figure shows that part of the territory is covered by agricultural and forest
areas, which reveals, on a first basis, the high potential for application in the soils. Besides soil usage,
a correct analysis will force the integrated study of several parameters, such as the soil type, distance
to populations, climate, accessibility and topography, among others.
Other destinations, less used because of economical reasons, but can also be of environmental
relevance, consist in using the sludge as a source of raw material for construction materials, chemical
products and activated carbon.
In Portugal, after the Helsinki Treaty, which made forbidden the sludge deposition in the Ocean, the final
destination is now an additional difficulty for WWTP managers.
Figure 5.8 Portugal soil map
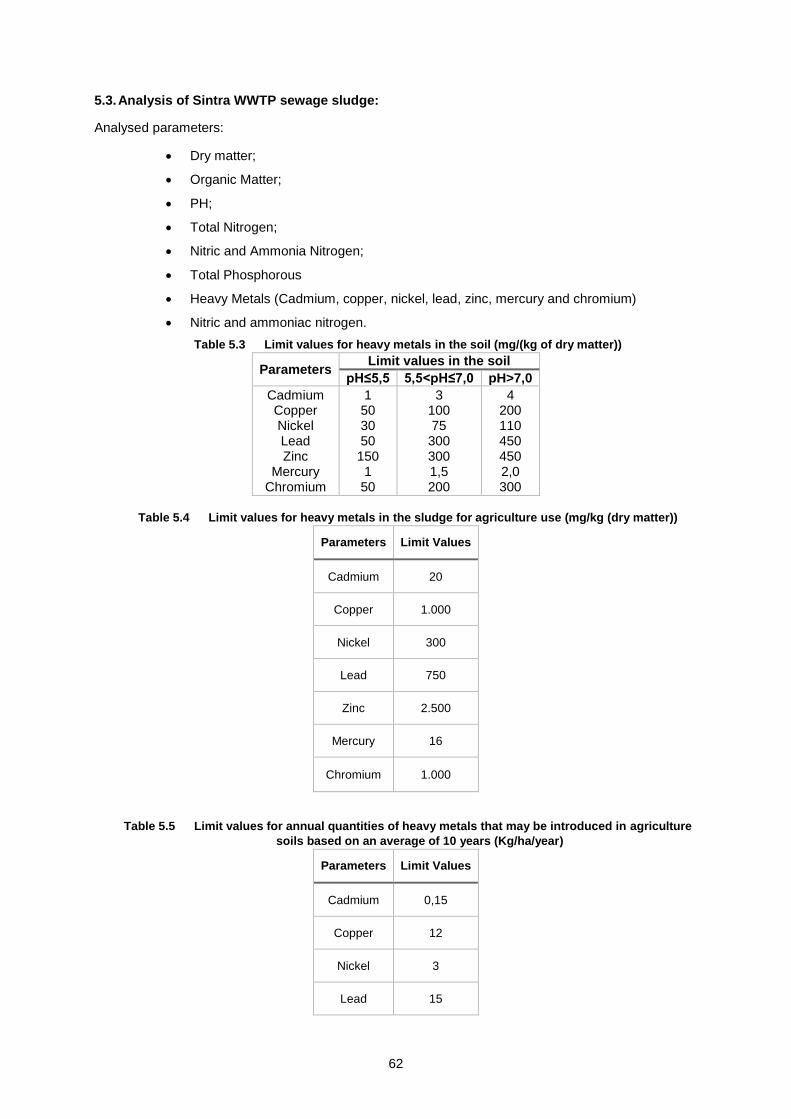
62
5.3. Analysis of Sintra WWTP sewage sludge:
Analysed parameters:
Dry matter;
Organic Matter;
PH;
Total Nitrogen;
Nitric and Ammonia Nitrogen;
Total Phosphorous
Heavy Metals (Cadmium, copper, nickel, lead, zinc, mercury and chromium)
Nitric and ammoniac nitrogen.
Table 5.3 Limit values for heavy metals in the soil (mg/(kg of dry matter))
Parameters Limit values in the soil
pH≤5,5 5,5<pH≤7,0 pH>7,0
Cadmium Copper Nickel Lead Zinc
Mercury Chromium
1 50 30 50 150 1 50
3 100 75 300 300 1,5 200
4 200 110 450 450 2,0 300
Table 5.4 Limit values for heavy metals in the sludge for agriculture use (mg/kg (dry matter))
Parameters Limit Values
Cadmium 20
Copper 1.000
Nickel 300
Lead 750
Zinc 2.500
Mercury 16
Chromium 1.000
Table 5.5 Limit values for annual quantities of heavy metals that may be introduced in agriculture
soils based on an average of 10 years (Kg/ha/year)
Parameters Limit Values
Cadmium 0,15
Copper 12
Nickel 3
Lead 15
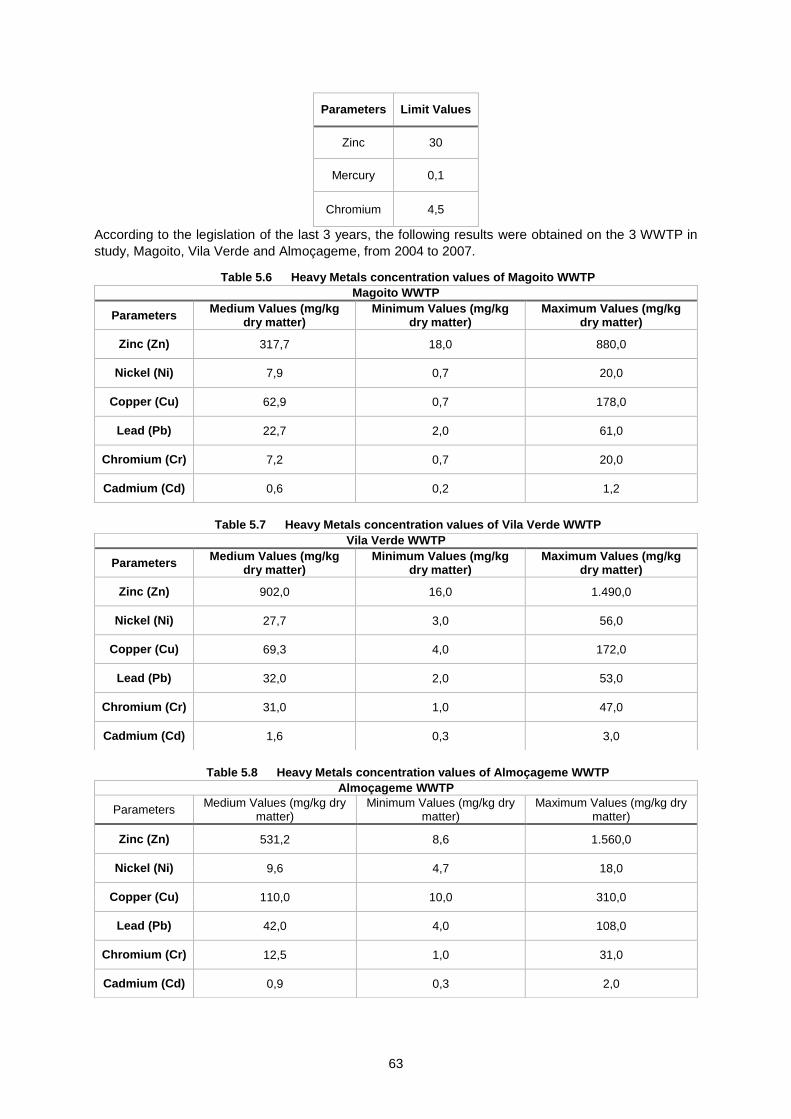
63
Parameters Limit Values
Zinc 30
Mercury 0,1
Chromium 4,5
According to the legislation of the last 3 years, the following results were obtained on the 3 WWTP in
study, Magoito, Vila Verde and Almoçageme, from 2004 to 2007.
Table 5.6 Heavy Metals concentration values of Magoito WWTP
Magoito WWTP
Parameters Medium Values (mg/kg
dry matter) Minimum Values (mg/kg
dry matter) Maximum Values (mg/kg
dry matter)
Zinc (Zn) 317,7 18,0 880,0
Nickel (Ni) 7,9 0,7 20,0
Copper (Cu) 62,9 0,7 178,0
Lead (Pb) 22,7 2,0 61,0
Chromium (Cr) 7,2 0,7 20,0
Cadmium (Cd) 0,6 0,2 1,2
Table 5.7 Heavy Metals concentration values of Vila Verde WWTP
Table 5.8 Heavy Metals concentration values of Almoçageme WWTP
Vila Verde WWTP
Parameters Medium Values (mg/kg
dry matter) Minimum Values (mg/kg
dry matter) Maximum Values (mg/kg
dry matter)
Zinc (Zn) 902,0 16,0 1.490,0
Nickel (Ni) 27,7 3,0 56,0
Copper (Cu) 69,3 4,0 172,0
Lead (Pb) 32,0 2,0 53,0
Chromium (Cr) 31,0 1,0 47,0
Cadmium (Cd) 1,6 0,3 3,0
Almoçageme WWTP
Parameters Medium Values (mg/kg dry
matter) Minimum Values (mg/kg dry
matter) Maximum Values (mg/kg dry
matter)
Zinc (Zn) 531,2 8,6 1.560,0
Nickel (Ni) 9,6 4,7 18,0
Copper (Cu) 110,0 10,0 310,0
Lead (Pb) 42,0 4,0 108,0
Chromium (Cr) 12,5 1,0 31,0
Cadmium (Cd) 0,9 0,3 2,0
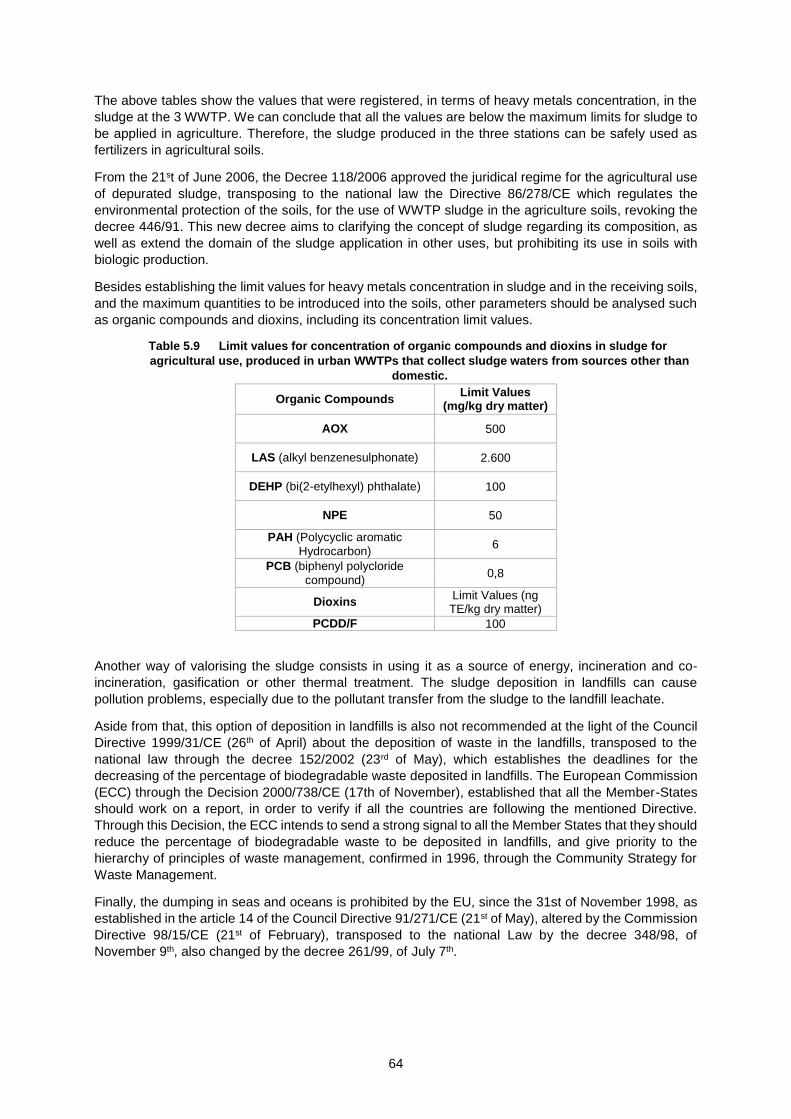
64
The above tables show the values that were registered, in terms of heavy metals concentration, in the
sludge at the 3 WWTP. We can conclude that all the values are below the maximum limits for sludge to
be applied in agriculture. Therefore, the sludge produced in the three stations can be safely used as
fertilizers in agricultural soils.
From the 21st of June 2006, the Decree 118/2006 approved the juridical regime for the agricultural use
of depurated sludge, transposing to the national law the Directive 86/278/CE which regulates the
environmental protection of the soils, for the use of WWTP sludge in the agriculture soils, revoking the
decree 446/91. This new decree aims to clarifying the concept of sludge regarding its composition, as
well as extend the domain of the sludge application in other uses, but prohibiting its use in soils with
biologic production.
Besides establishing the limit values for heavy metals concentration in sludge and in the receiving soils,
and the maximum quantities to be introduced into the soils, other parameters should be analysed such
as organic compounds and dioxins, including its concentration limit values.
Table 5.9 Limit values for concentration of organic compounds and dioxins in sludge for
agricultural use, produced in urban WWTPs that collect sludge waters from sources other than
domestic.
Organic Compounds Limit Values
(mg/kg dry matter)
AOX 500
LAS (alkyl benzenesulphonate) 2.600
DEHP (bi(2-etylhexyl) phthalate) 100
NPE 50
PAH (Polycyclic aromatic
Hydrocarbon) 6
PCB (biphenyl polycloride
compound) 0,8
Dioxins Limit Values (ng TE/kg dry matter)
PCDD/F 100
Another way of valorising the sludge consists in using it as a source of energy, incineration and co-
incineration, gasification or other thermal treatment. The sludge deposition in landfills can cause
pollution problems, especially due to the pollutant transfer from the sludge to the landfill leachate.
Aside from that, this option of deposition in landfills is also not recommended at the light of the Council
Directive 1999/31/CE (26th of April) about the deposition of waste in the landfills, transposed to the
national law through the decree 152/2002 (23rd of May), which establishes the deadlines for the
decreasing of the percentage of biodegradable waste deposited in landfills. The European Commission
(ECC) through the Decision 2000/738/CE (17th of November), established that all the Member-States
should work on a report, in order to verify if all the countries are following the mentioned Directive.
Through this Decision, the ECC intends to send a strong signal to all the Member States that they should
reduce the percentage of biodegradable waste to be deposited in landfills, and give priority to the
hierarchy of principles of waste management, confirmed in 1996, through the Community Strategy for
Waste Management.
Finally, the dumping in seas and oceans is prohibited by the EU, since the 31st of November 1998, as
established in the article 14 of the Council Directive 91/271/CE (21st of May), altered by the Commission
Directive 98/15/CE (21st of February), transposed to the national Law by the decree 348/98, of
November 9th, also changed by the decree 261/99, of July 7th.
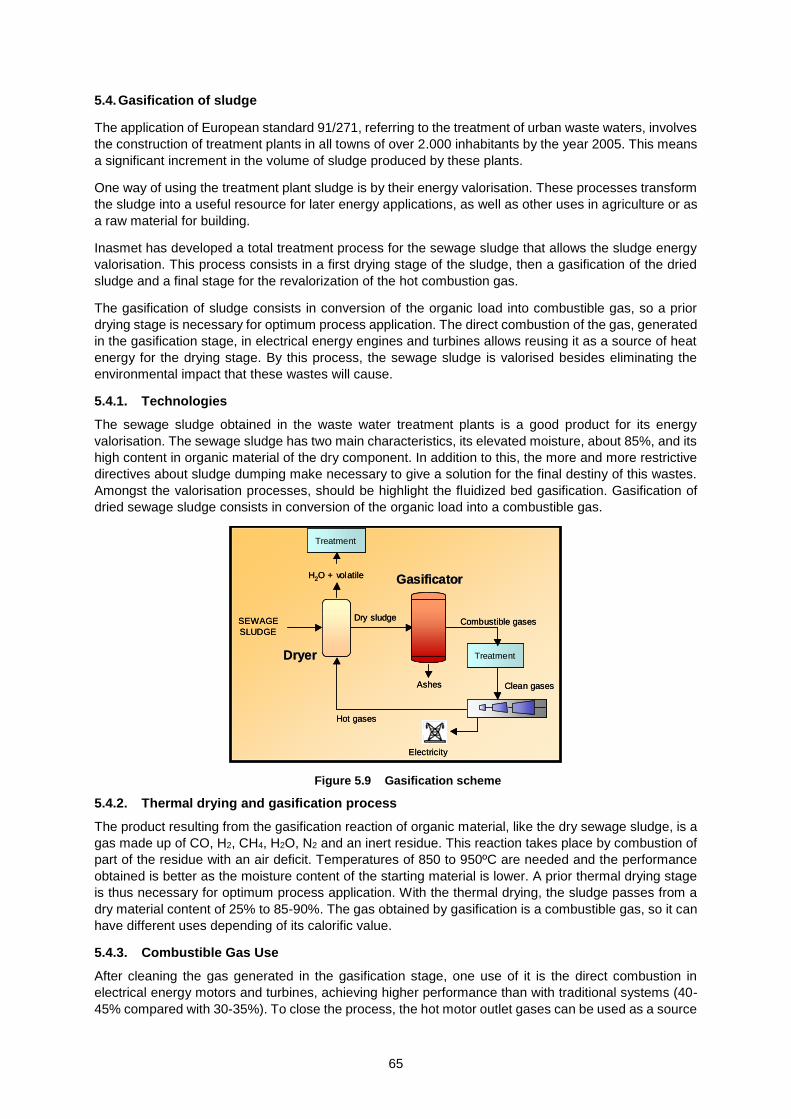
65
5.4. Gasification of sludge
The application of European standard 91/271, referring to the treatment of urban waste waters, involves
the construction of treatment plants in all towns of over 2.000 inhabitants by the year 2005. This means
a significant increment in the volume of sludge produced by these plants.
One way of using the treatment plant sludge is by their energy valorisation. These processes transform
the sludge into a useful resource for later energy applications, as well as other uses in agriculture or as
a raw material for building.
Inasmet has developed a total treatment process for the sewage sludge that allows the sludge energy
valorisation. This process consists in a first drying stage of the sludge, then a gasification of the dried
sludge and a final stage for the revalorization of the hot combustion gas.
The gasification of sludge consists in conversion of the organic load into combustible gas, so a prior
drying stage is necessary for optimum process application. The direct combustion of the gas, generated
in the gasification stage, in electrical energy engines and turbines allows reusing it as a source of heat
energy for the drying stage. By this process, the sewage sludge is valorised besides eliminating the
environmental impact that these wastes will cause.
5.4.1. Technologies
The sewage sludge obtained in the waste water treatment plants is a good product for its energy
valorisation. The sewage sludge has two main characteristics, its elevated moisture, about 85%, and its
high content in organic material of the dry component. In addition to this, the more and more restrictive
directives about sludge dumping make necessary to give a solution for the final destiny of this wastes.
Amongst the valorisation processes, should be highlight the fluidized bed gasification. Gasification of
dried sewage sludge consists in conversion of the organic load into a combustible gas.
Figure 5.9 Gasification scheme
5.4.2. Thermal drying and gasification process
The product resulting from the gasification reaction of organic material, like the dry sewage sludge, is a
gas made up of CO, H2, CH4, H2O, N2 and an inert residue. This reaction takes place by combustion of
part of the residue with an air deficit. Temperatures of 850 to 950ºC are needed and the performance
obtained is better as the moisture content of the starting material is lower. A prior thermal drying stage
is thus necessary for optimum process application. With the thermal drying, the sludge passes from a
dry material content of 25% to 85-90%. The gas obtained by gasification is a combustible gas, so it can
have different uses depending of its calorific value.
5.4.3. Combustible Gas Use
After cleaning the gas generated in the gasification stage, one use of it is the direct combustion in
electrical energy motors and turbines, achieving higher performance than with traditional systems (40-
45% compared with 30-35%). To close the process, the hot motor outlet gases can be used as a source
Ashes Clean gases
GasificatorGasificator
Hot gases
Electricity
H2O + volatile
Treatment
SEWAGE
SLUDGE
Dry sludge Combustible gases
DryerDryer Treatment
Ashes Clean gases
GasificatorGasificator
Hot gases
Electricity
H2O + volatile
Treatment
SEWAGE
SLUDGE
Dry sludge Combustible gases
DryerDryer Treatment
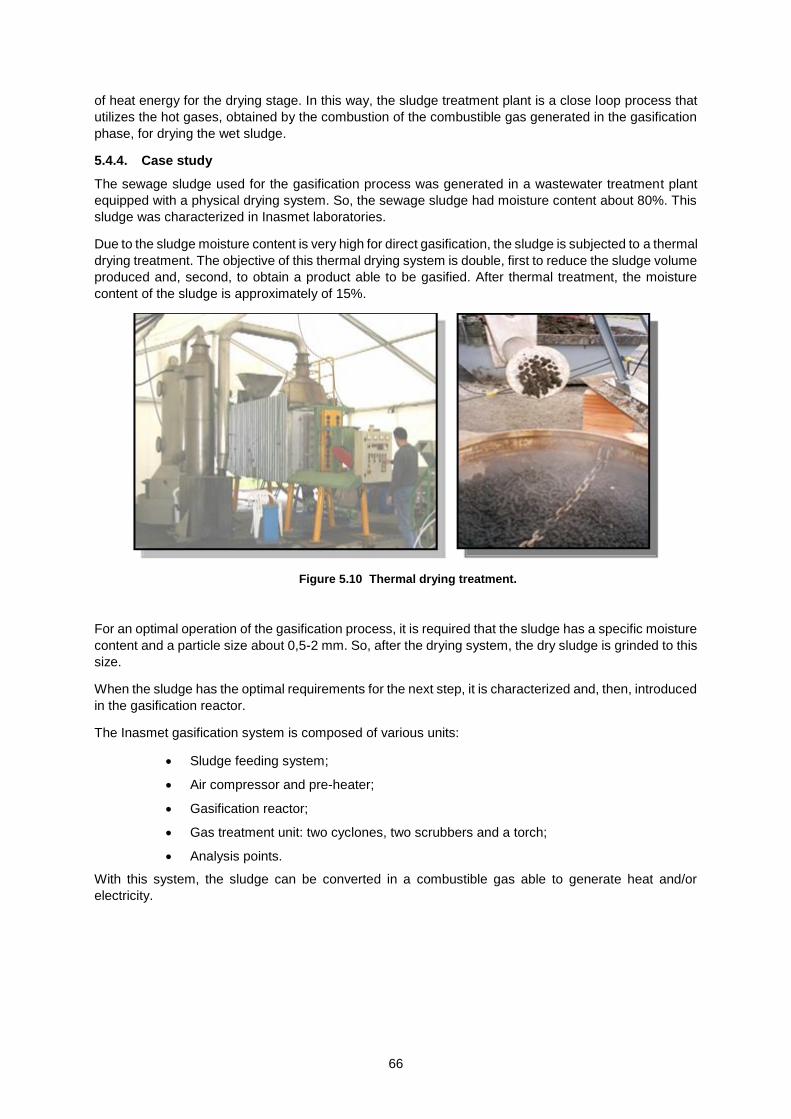
66
of heat energy for the drying stage. In this way, the sludge treatment plant is a close loop process that
utilizes the hot gases, obtained by the combustion of the combustible gas generated in the gasification
phase, for drying the wet sludge.
5.4.4. Case study
The sewage sludge used for the gasification process was generated in a wastewater treatment plant
equipped with a physical drying system. So, the sewage sludge had moisture content about 80%. This
sludge was characterized in Inasmet laboratories.
Due to the sludge moisture content is very high for direct gasification, the sludge is subjected to a thermal
drying treatment. The objective of this thermal drying system is double, first to reduce the sludge volume
produced and, second, to obtain a product able to be gasified. After thermal treatment, the moisture
content of the sludge is approximately of 15%.
Figure 5.10 Thermal drying treatment.
For an optimal operation of the gasification process, it is required that the sludge has a specific moisture
content and a particle size about 0,5-2 mm. So, after the drying system, the dry sludge is grinded to this
size.
When the sludge has the optimal requirements for the next step, it is characterized and, then, introduced
in the gasification reactor.
The Inasmet gasification system is composed of various units:
Sludge feeding system;
Air compressor and pre-heater;
Gasification reactor;
Gas treatment unit: two cyclones, two scrubbers and a torch;
Analysis points.
With this system, the sludge can be converted in a combustible gas able to generate heat and/or
electricity.
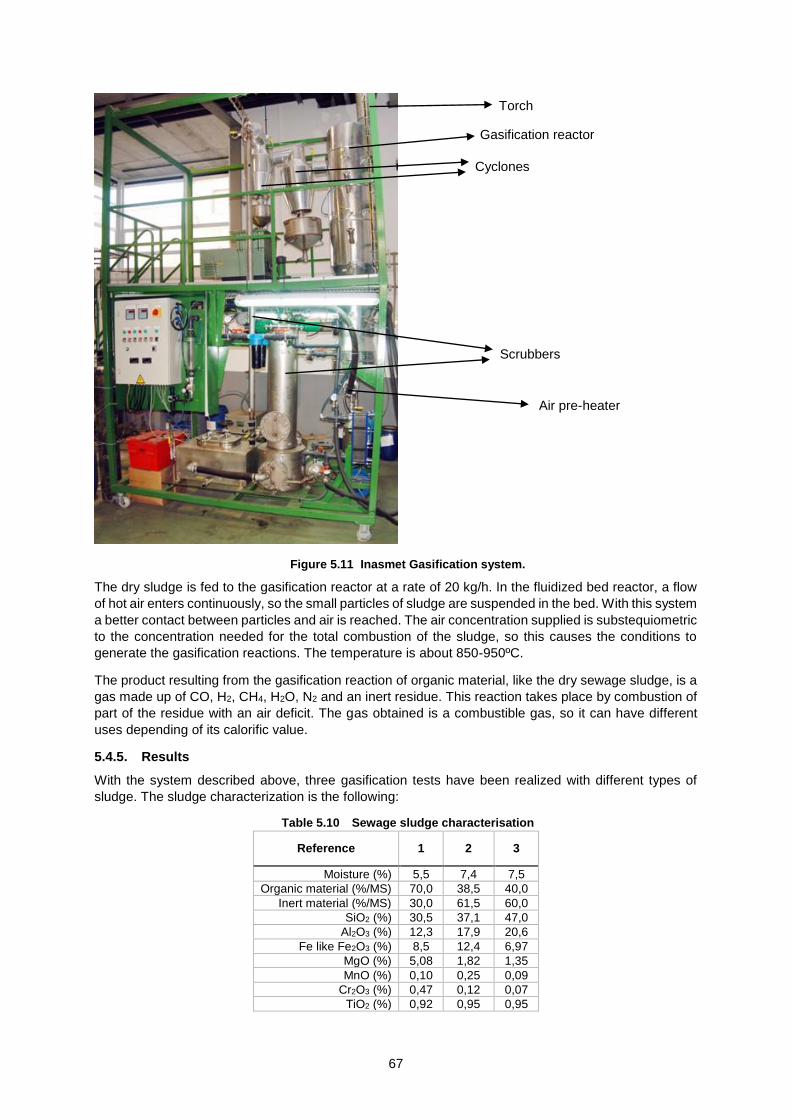
67
Figure 5.11 Inasmet Gasification system.
The dry sludge is fed to the gasification reactor at a rate of 20 kg/h. In the fluidized bed reactor, a flow
of hot air enters continuously, so the small particles of sludge are suspended in the bed. With this system
a better contact between particles and air is reached. The air concentration supplied is substequiometric
to the concentration needed for the total combustion of the sludge, so this causes the conditions to
generate the gasification reactions. The temperature is about 850-950ºC.
The product resulting from the gasification reaction of organic material, like the dry sewage sludge, is a
gas made up of CO, H2, CH4, H2O, N2 and an inert residue. This reaction takes place by combustion of
part of the residue with an air deficit. The gas obtained is a combustible gas, so it can have different
uses depending of its calorific value.
5.4.5. Results
With the system described above, three gasification tests have been realized with different types of
sludge. The sludge characterization is the following:
Table 5.10 Sewage sludge characterisation
Reference 1 2 3
Moisture (%) 5,5 7,4 7,5
Organic material (%/MS) 70,0 38,5 40,0
Inert material (%/MS) 30,0 61,5 60,0
SiO2 (%) 30,5 37,1 47,0
Al2O3 (%) 12,3 17,9 20,6
Fe like Fe2O3 (%) 8,5 12,4 6,97
MgO (%) 5,08 1,82 1,35
MnO (%) 0,10 0,25 0,09
Cr2O3 (%) 0,47 0,12 0,07
TiO2 (%) 0,92 0,95 0,95
Gasification reactor
Cyclones
Scrubbers
Air pre-heater
Torch
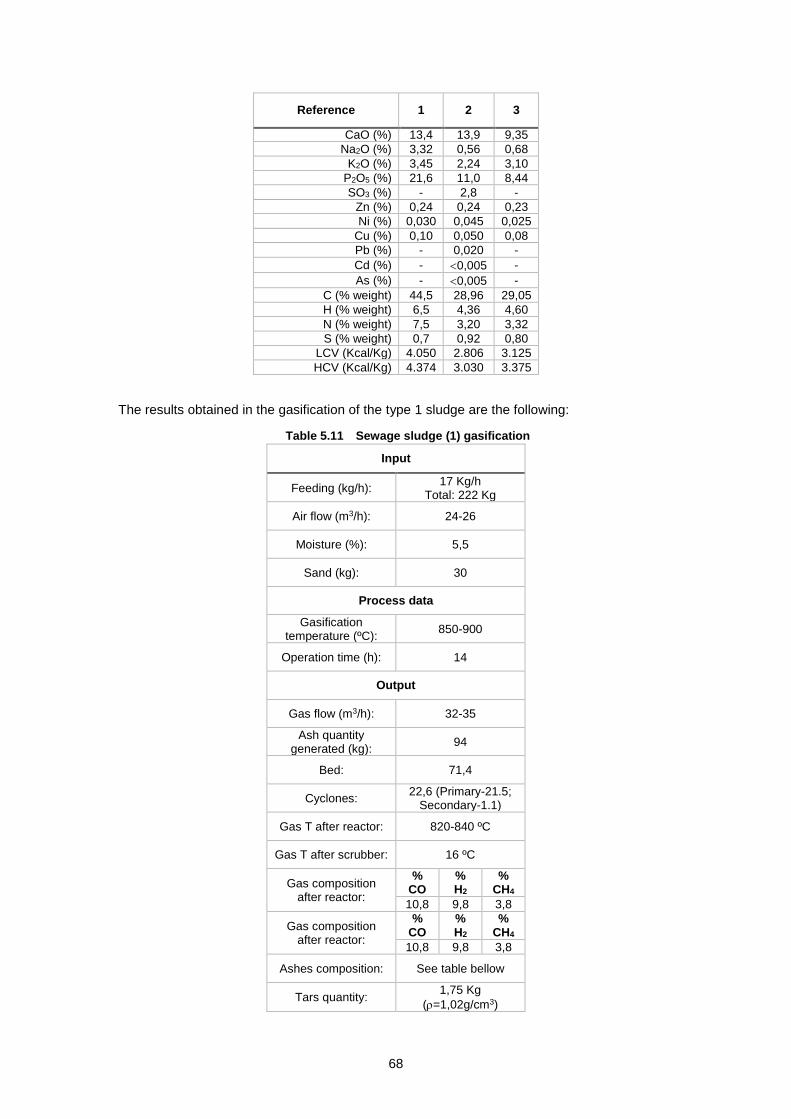
68
Reference 1 2 3
CaO (%) 13,4 13,9 9,35
Na2O (%) 3,32 0,56 0,68
K2O (%) 3,45 2,24 3,10
P2O5 (%) 21,6 11,0 8,44
SO3 (%) - 2,8 -
Zn (%) 0,24 0,24 0,23
Ni (%) 0,030 0,045 0,025
Cu (%) 0,10 0,050 0,08
Pb (%) - 0,020 -
Cd (%) - 0,005 -
As (%) - 0,005 -
C (% weight) 44,5 28,96 29,05
H (% weight) 6,5 4,36 4,60
N (% weight) 7,5 3,20 3,32
S (% weight) 0,7 0,92 0,80
LCV (Kcal/Kg) 4.050 2.806 3.125
HCV (Kcal/Kg) 4.374 3.030 3.375
The results obtained in the gasification of the type 1 sludge are the following:
Table 5.11 Sewage sludge (1) gasification
Input
Feeding (kg/h): 17 Kg/h
Total: 222 Kg
Air flow (m3/h): 24-26
Moisture (%): 5,5
Sand (kg): 30
Process data
Gasification temperature (ºC):
850-900
Operation time (h): 14
Output
Gas flow (m3/h): 32-35
Ash quantity generated (kg):
94
Bed: 71,4
Cyclones: 22,6 (Primary-21.5;
Secondary-1.1)
Gas T after reactor: 820-840 ºC
Gas T after scrubber: 16 ºC
Gas composition after reactor:
% CO
% H2
% CH4
10,8 9,8 3,8
Gas composition after reactor:
% CO
% H2
% CH4
10,8 9,8 3,8
Ashes composition: See table bellow
Tars quantity: 1,75 Kg
(=1,02g/cm3)
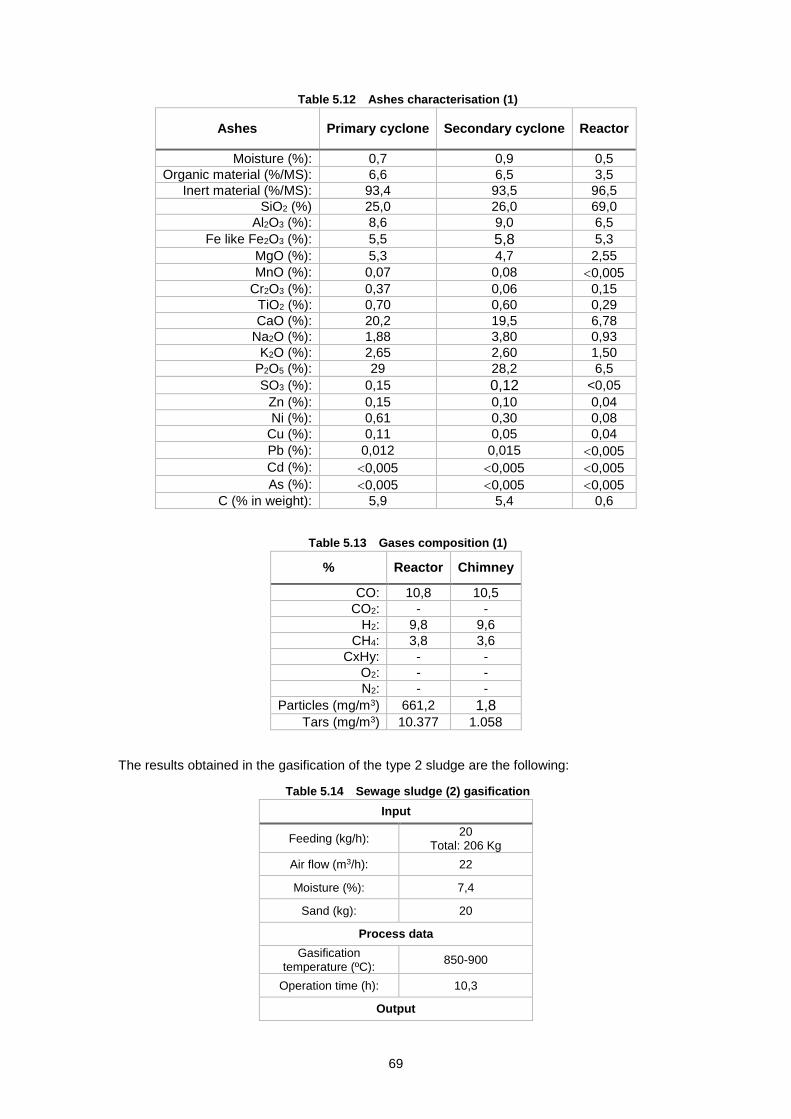
69
Table 5.12 Ashes characterisation (1)
Ashes Primary cyclone Secondary cyclone Reactor
Moisture (%): 0,7 0,9 0,5
Organic material (%/MS): 6,6 6,5 3,5
Inert material (%/MS): 93,4 93,5 96,5
SiO2 (%) 25,0 26,0 69,0
Al2O3 (%): 8,6 9,0 6,5
Fe like Fe2O3 (%): 5,5 5,8 5,3
MgO (%): 5,3 4,7 2,55
MnO (%): 0,07 0,08 0,005
Cr2O3 (%): 0,37 0,06 0,15
TiO2 (%): 0,70 0,60 0,29
CaO (%): 20,2 19,5 6,78
Na2O (%): 1,88 3,80 0,93
K2O (%): 2,65 2,60 1,50
P2O5 (%): 29 28,2 6,5
SO3 (%): 0,15 0,12 <0,05
Zn (%): 0,15 0,10 0,04
Ni (%): 0,61 0,30 0,08
Cu (%): 0,11 0,05 0,04
Pb (%): 0,012 0,015 0,005
Cd (%): 0,005 0,005 0,005
As (%): 0,005 0,005 0,005
C (% in weight): 5,9 5,4 0,6
Table 5.13 Gases composition (1)
% Reactor Chimney
CO: 10,8 10,5
CO2: - -
H2: 9,8 9,6
CH4: 3,8 3,6
CxHy: - -
O2: - -
N2: - -
Particles (mg/m3) 661,2 1,8 Tars (mg/m3) 10.377 1.058
The results obtained in the gasification of the type 2 sludge are the following:
Table 5.14 Sewage sludge (2) gasification
Input
Feeding (kg/h): 20
Total: 206 Kg
Air flow (m3/h): 22
Moisture (%): 7,4
Sand (kg): 20
Process data
Gasification temperature (ºC):
850-900
Operation time (h): 10,3
Output
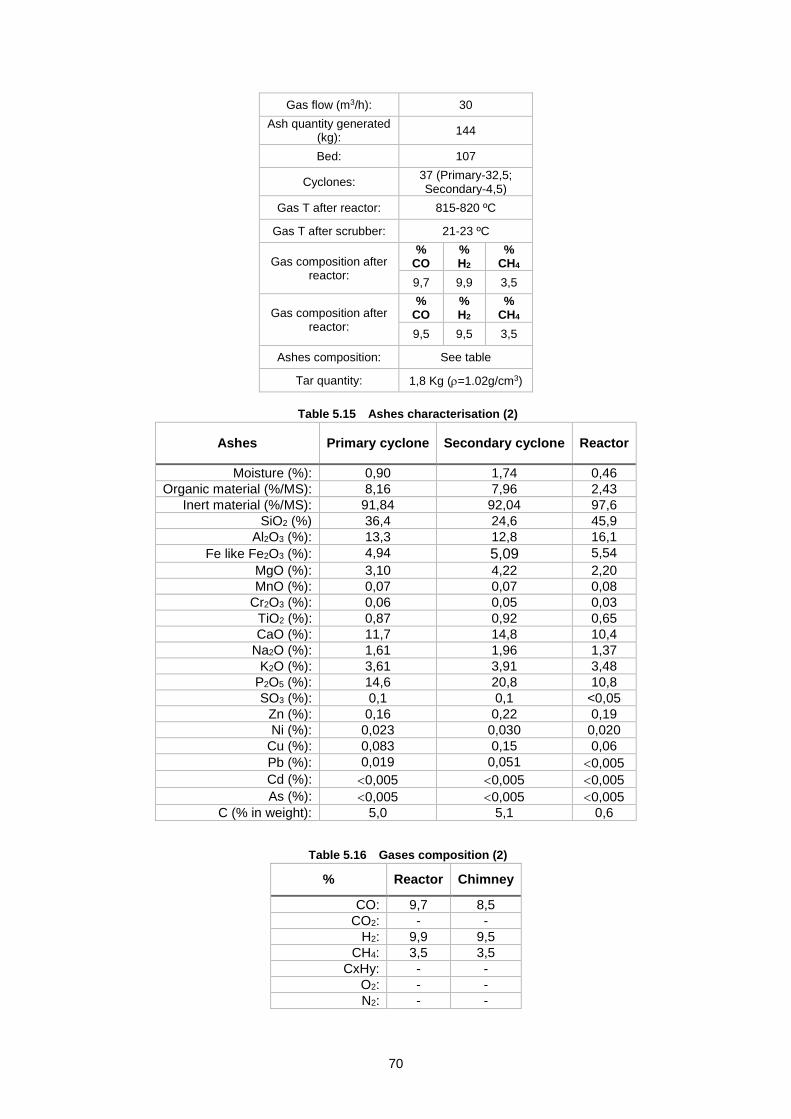
70
Gas flow (m3/h): 30
Ash quantity generated (kg):
144
Bed: 107
Cyclones: 37 (Primary-32,5; Secondary-4,5)
Gas T after reactor: 815-820 ºC
Gas T after scrubber: 21-23 ºC
Gas composition after reactor:
% CO
% H2
% CH4
9,7 9,9 3,5
Gas composition after reactor:
% CO
% H2
% CH4
9,5 9,5 3,5
Ashes composition: See table
Tar quantity: 1,8 Kg (=1.02g/cm3)
Table 5.15 Ashes characterisation (2)
Ashes Primary cyclone Secondary cyclone Reactor
Moisture (%): 0,90 1,74 0,46
Organic material (%/MS): 8,16 7,96 2,43
Inert material (%/MS): 91,84 92,04 97,6
SiO2 (%) 36,4 24,6 45,9
Al2O3 (%): 13,3 12,8 16,1
Fe like Fe2O3 (%): 4,94 5,09 5,54
MgO (%): 3,10 4,22 2,20
MnO (%): 0,07 0,07 0,08
Cr2O3 (%): 0,06 0,05 0,03
TiO2 (%): 0,87 0,92 0,65
CaO (%): 11,7 14,8 10,4
Na2O (%): 1,61 1,96 1,37
K2O (%): 3,61 3,91 3,48
P2O5 (%): 14,6 20,8 10,8
SO3 (%): 0,1 0,1 <0,05
Zn (%): 0,16 0,22 0,19
Ni (%): 0,023 0,030 0,020
Cu (%): 0,083 0,15 0,06
Pb (%): 0,019 0,051 0,005
Cd (%): 0,005 0,005 0,005
As (%): 0,005 0,005 0,005
C (% in weight): 5,0 5,1 0,6
Table 5.16 Gases composition (2)
% Reactor Chimney
CO: 9,7 8,5
CO2: - -
H2: 9,9 9,5
CH4: 3,5 3,5
CxHy: - -
O2: - -
N2: - -
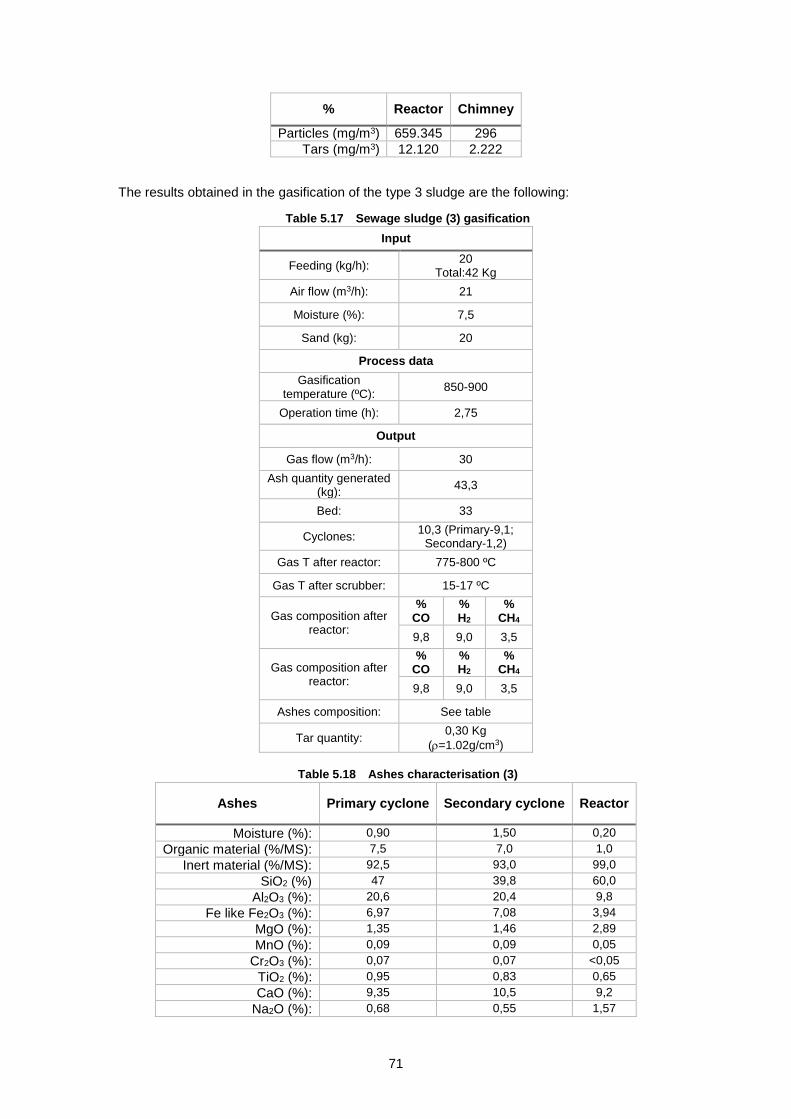
71
% Reactor Chimney
Particles (mg/m3) 659.345 296
Tars (mg/m3) 12.120 2.222
The results obtained in the gasification of the type 3 sludge are the following:
Table 5.17 Sewage sludge (3) gasification
Input
Feeding (kg/h): 20
Total:42 Kg
Air flow (m3/h): 21
Moisture (%): 7,5
Sand (kg): 20
Process data
Gasification temperature (ºC):
850-900
Operation time (h): 2,75
Output
Gas flow (m3/h): 30
Ash quantity generated (kg):
43,3
Bed: 33
Cyclones: 10,3 (Primary-9,1;
Secondary-1,2)
Gas T after reactor: 775-800 ºC
Gas T after scrubber: 15-17 ºC
Gas composition after reactor:
% CO
% H2
% CH4
9,8 9,0 3,5
Gas composition after reactor:
% CO
% H2
% CH4
9,8 9,0 3,5
Ashes composition: See table
Tar quantity: 0,30 Kg
(=1.02g/cm3)
Table 5.18 Ashes characterisation (3)
Ashes Primary cyclone Secondary cyclone Reactor
Moisture (%): 0,90 1,50 0,20
Organic material (%/MS): 7,5 7,0 1,0
Inert material (%/MS): 92,5 93,0 99,0
SiO2 (%) 47 39,8 60,0
Al2O3 (%): 20,6 20,4 9,8
Fe like Fe2O3 (%): 6,97 7,08 3,94
MgO (%): 1,35 1,46 2,89
MnO (%): 0,09 0,09 0,05
Cr2O3 (%): 0,07 0,07 <0,05
TiO2 (%): 0,95 0,83 0,65
CaO (%): 9,35 10,5 9,2
Na2O (%): 0,68 0,55 1,57
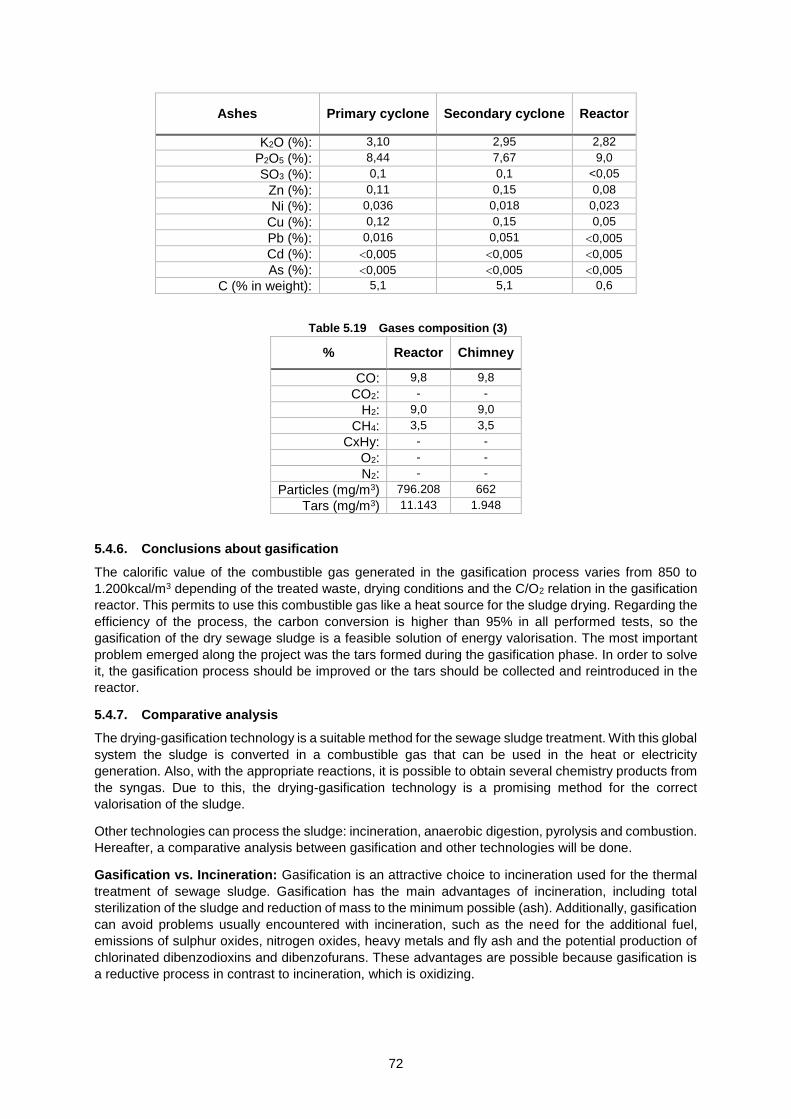
72
Ashes Primary cyclone Secondary cyclone Reactor
K2O (%): 3,10 2,95 2,82
P2O5 (%): 8,44 7,67 9,0
SO3 (%): 0,1 0,1 <0,05
Zn (%): 0,11 0,15 0,08
Ni (%): 0,036 0,018 0,023
Cu (%): 0,12 0,15 0,05
Pb (%): 0,016 0,051 0,005
Cd (%): 0,005 0,005 0,005
As (%): 0,005 0,005 0,005
C (% in weight): 5,1 5,1 0,6
Table 5.19 Gases composition (3)
% Reactor Chimney
CO: 9,8 9,8
CO2: - -
H2: 9,0 9,0
CH4: 3,5 3,5
CxHy: - -
O2: - -
N2: - -
Particles (mg/m3) 796.208 662
Tars (mg/m3) 11.143 1.948
5.4.6. Conclusions about gasification
The calorific value of the combustible gas generated in the gasification process varies from 850 to
1.200kcal/m3 depending of the treated waste, drying conditions and the C/O2 relation in the gasification
reactor. This permits to use this combustible gas like a heat source for the sludge drying. Regarding the
efficiency of the process, the carbon conversion is higher than 95% in all performed tests, so the
gasification of the dry sewage sludge is a feasible solution of energy valorisation. The most important
problem emerged along the project was the tars formed during the gasification phase. In order to solve
it, the gasification process should be improved or the tars should be collected and reintroduced in the
reactor.
5.4.7. Comparative analysis
The drying-gasification technology is a suitable method for the sewage sludge treatment. With this global
system the sludge is converted in a combustible gas that can be used in the heat or electricity
generation. Also, with the appropriate reactions, it is possible to obtain several chemistry products from
the syngas. Due to this, the drying-gasification technology is a promising method for the correct
valorisation of the sludge.
Other technologies can process the sludge: incineration, anaerobic digestion, pyrolysis and combustion.
Hereafter, a comparative analysis between gasification and other technologies will be done.
Gasification vs. Incineration: Gasification is an attractive choice to incineration used for the thermal
treatment of sewage sludge. Gasification has the main advantages of incineration, including total
sterilization of the sludge and reduction of mass to the minimum possible (ash). Additionally, gasification
can avoid problems usually encountered with incineration, such as the need for the additional fuel,
emissions of sulphur oxides, nitrogen oxides, heavy metals and fly ash and the potential production of
chlorinated dibenzodioxins and dibenzofurans. These advantages are possible because gasification is
a reductive process in contrast to incineration, which is oxidizing.
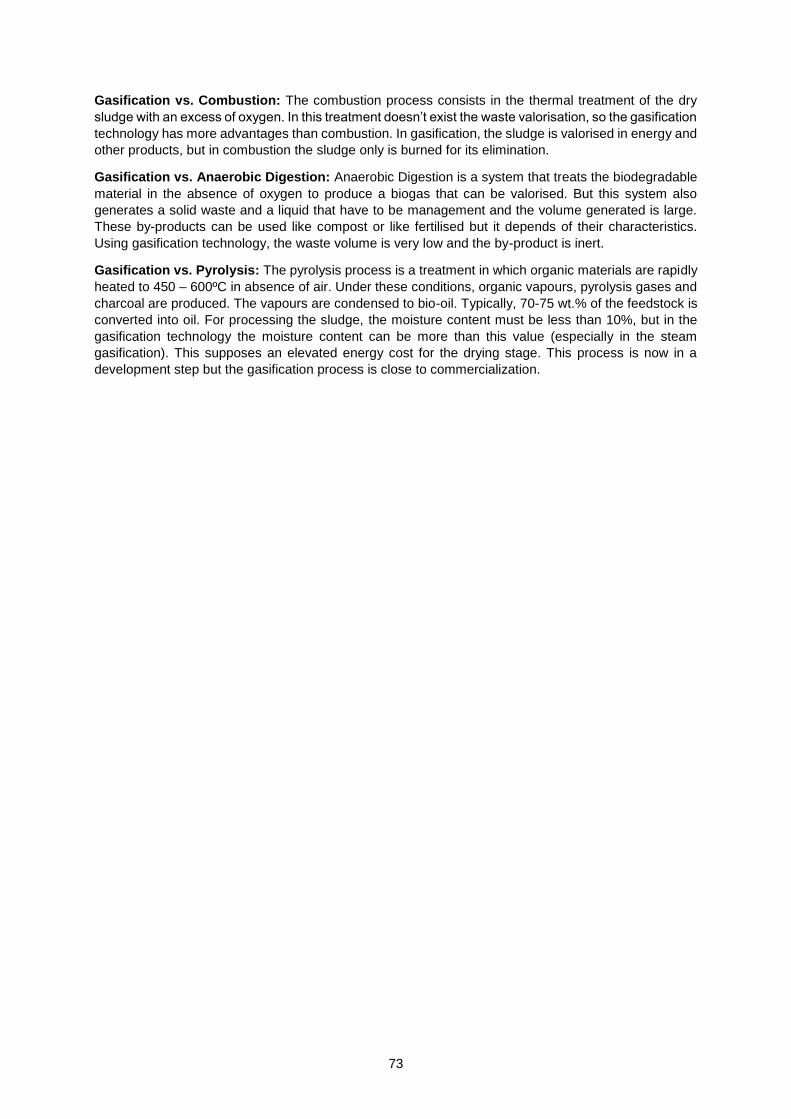
73
Gasification vs. Combustion: The combustion process consists in the thermal treatment of the dry
sludge with an excess of oxygen. In this treatment doesn’t exist the waste valorisation, so the gasification
technology has more advantages than combustion. In gasification, the sludge is valorised in energy and
other products, but in combustion the sludge only is burned for its elimination.
Gasification vs. Anaerobic Digestion: Anaerobic Digestion is a system that treats the biodegradable
material in the absence of oxygen to produce a biogas that can be valorised. But this system also
generates a solid waste and a liquid that have to be management and the volume generated is large.
These by-products can be used like compost or like fertilised but it depends of their characteristics.
Using gasification technology, the waste volume is very low and the by-product is inert.
Gasification vs. Pyrolysis: The pyrolysis process is a treatment in which organic materials are rapidly
heated to 450 – 600ºC in absence of air. Under these conditions, organic vapours, pyrolysis gases and
charcoal are produced. The vapours are condensed to bio-oil. Typically, 70-75 wt.% of the feedstock is
converted into oil. For processing the sludge, the moisture content must be less than 10%, but in the
gasification technology the moisture content can be more than this value (especially in the steam
gasification). This supposes an elevated energy cost for the drying stage. This process is now in a
development step but the gasification process is close to commercialization.

74
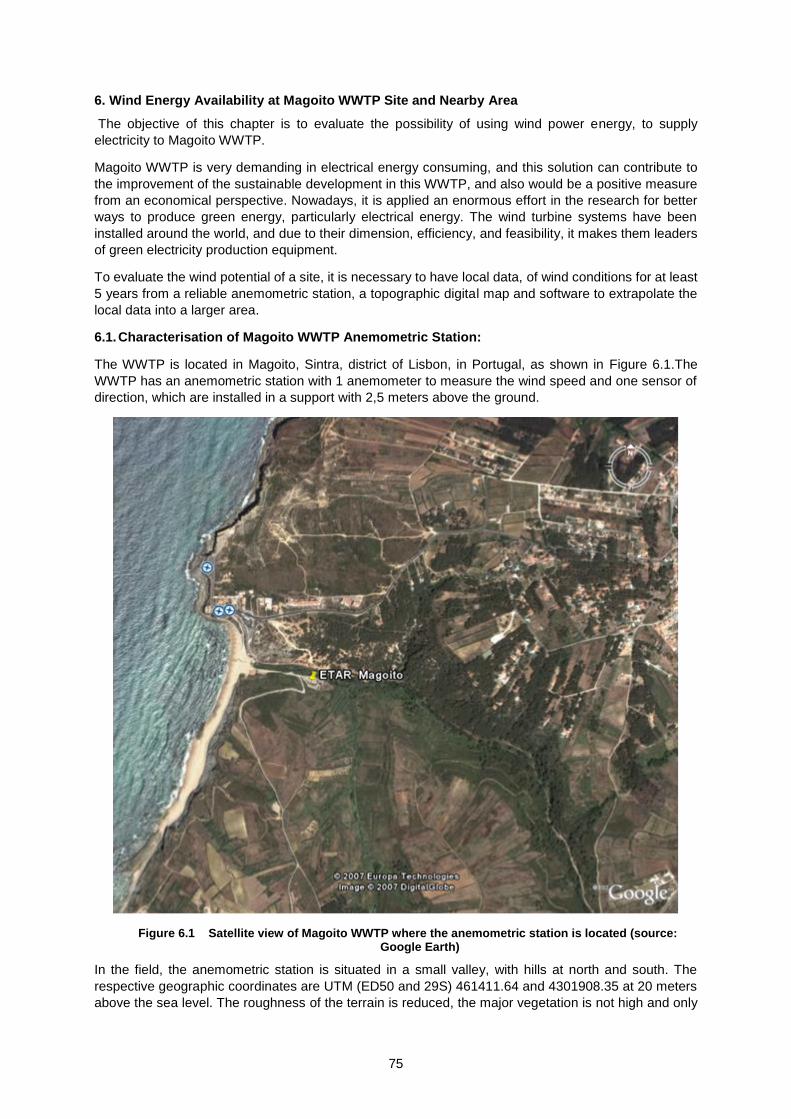
75
6. Wind Energy Availability at Magoito WWTP Site and Nearby Area
The objective of this chapter is to evaluate the possibility of using wind power energy, to supply
electricity to Magoito WWTP.
Magoito WWTP is very demanding in electrical energy consuming, and this solution can contribute to
the improvement of the sustainable development in this WWTP, and also would be a positive measure
from an economical perspective. Nowadays, it is applied an enormous effort in the research for better
ways to produce green energy, particularly electrical energy. The wind turbine systems have been
installed around the world, and due to their dimension, efficiency, and feasibility, it makes them leaders
of green electricity production equipment.
To evaluate the wind potential of a site, it is necessary to have local data, of wind conditions for at least
5 years from a reliable anemometric station, a topographic digital map and software to extrapolate the
local data into a larger area.
6.1. Characterisation of Magoito WWTP Anemometric Station:
The WWTP is located in Magoito, Sintra, district of Lisbon, in Portugal, as shown in Figure 6.1.The
WWTP has an anemometric station with 1 anemometer to measure the wind speed and one sensor of
direction, which are installed in a support with 2,5 meters above the ground.
Figure 6.1 Satellite view of Magoito WWTP where the anemometric station is located (source: Google Earth)
In the field, the anemometric station is situated in a small valley, with hills at north and south. The
respective geographic coordinates are UTM (ED50 and 29S) 461411.64 and 4301908.35 at 20 meters
above the sea level. The roughness of the terrain is reduced, the major vegetation is not high and only
76
at north there are some small trees dispersed, without any nearby obstacle which could shelter the
anemometric station.
Magoito WWTP anemometric station
Figure 6.2 Map with the zone in study for the wind energy potential
The data collected by the equipment was from June 2006 until March 2007. The measures were
collected on a daily basis with information of the wind intensity and direction (up to sixteen directions,
N, NEW, NE, ENE, etc.).
The result of this collection is shown in following pictures. The Figure 6.3 shows the wind roses and of
the studied location, the Figure 6.4 and Figure 6.5 shows the wind speed data, the with the histogram
of wind classes and Weibull distribution of the reference anemometric station.
The majority of the wind speed at that location are between 2,1 and 8,8m/s with an average of 4,9 m/s.
Was used the Weibull distribution to represent the wind speed histograms in a compact form.
f(u) =k
A(u
A)k−1
exp(− (u
A)k
) eq. (1)
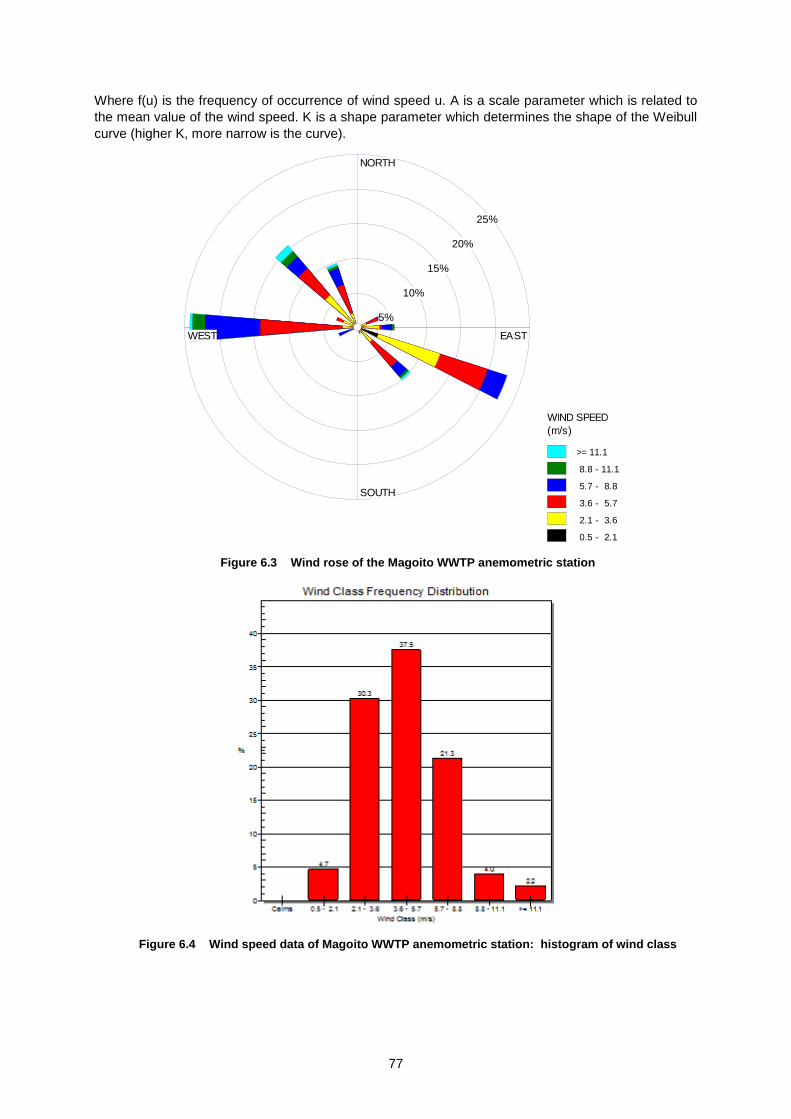
77
Where f(u) is the frequency of occurrence of wind speed u. A is a scale parameter which is related to
the mean value of the wind speed. K is a shape parameter which determines the shape of the Weibull
curve (higher K, more narrow is the curve).
Figure 6.3 Wind rose of the Magoito WWTP anemometric station
Figure 6.4 Wind speed data of Magoito WWTP anemometric station: histogram of wind class
NORTH
SOUTH
WEST EAST
5%
10%
15%
20%
25%
WIND SPEED
(m/s)
>= 11.1
8.8 - 11.1
5.7 - 8.8
3.6 - 5.7
2.1 - 3.6
0.5 - 2.1
Calms: 0.00%
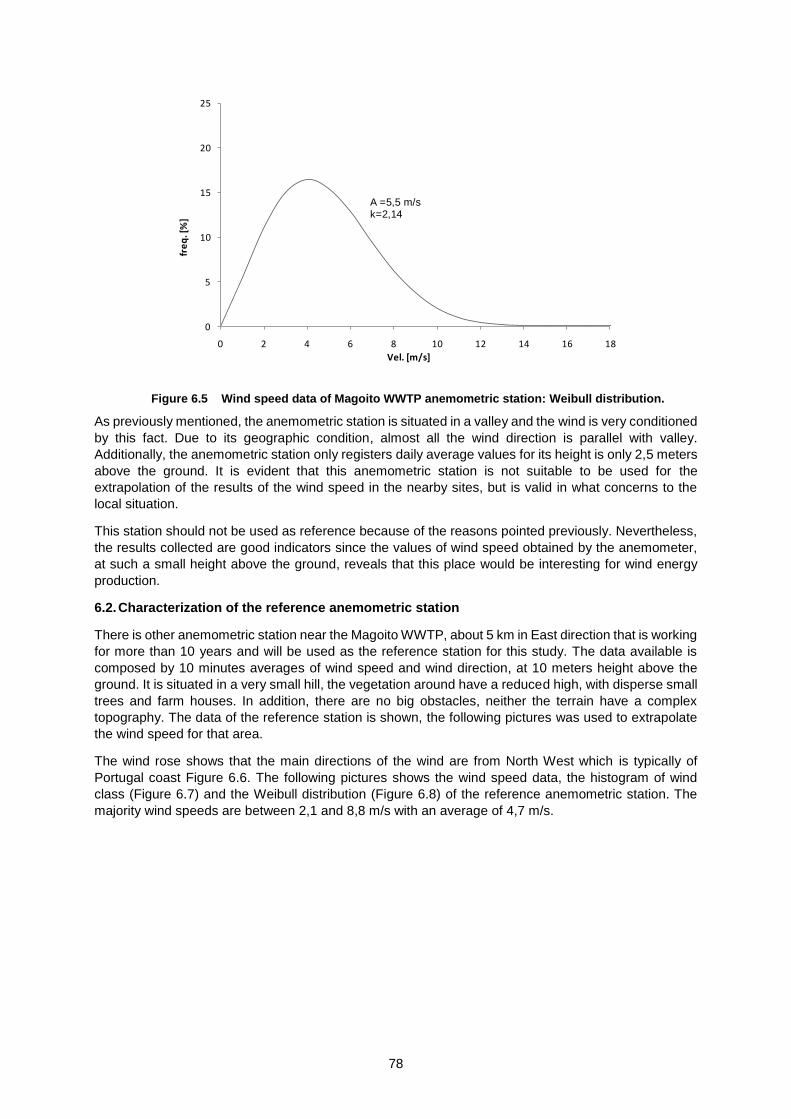
78
Figure 6.5 Wind speed data of Magoito WWTP anemometric station: Weibull distribution.
As previously mentioned, the anemometric station is situated in a valley and the wind is very conditioned
by this fact. Due to its geographic condition, almost all the wind direction is parallel with valley.
Additionally, the anemometric station only registers daily average values for its height is only 2,5 meters
above the ground. It is evident that this anemometric station is not suitable to be used for the
extrapolation of the results of the wind speed in the nearby sites, but is valid in what concerns to the
local situation.
This station should not be used as reference because of the reasons pointed previously. Nevertheless,
the results collected are good indicators since the values of wind speed obtained by the anemometer,
at such a small height above the ground, reveals that this place would be interesting for wind energy
production.
6.2. Characterization of the reference anemometric station
There is other anemometric station near the Magoito WWTP, about 5 km in East direction that is working
for more than 10 years and will be used as the reference station for this study. The data available is
composed by 10 minutes averages of wind speed and wind direction, at 10 meters height above the
ground. It is situated in a very small hill, the vegetation around have a reduced high, with disperse small
trees and farm houses. In addition, there are no big obstacles, neither the terrain have a complex
topography. The data of the reference station is shown, the following pictures was used to extrapolate
the wind speed for that area.
The wind rose shows that the main directions of the wind are from North West which is typically of
Portugal coast Figure 6.6. The following pictures shows the wind speed data, the histogram of wind
class (Figure 6.7) and the Weibull distribution (Figure 6.8) of the reference anemometric station. The
majority wind speeds are between 2,1 and 8,8 m/s with an average of 4,7 m/s.
0
5
10
15
20
25
0 2 4 6 8 10 12 14 16 18
fre
q. [
%]
Vel. [m/s]
A =5,5 m/sk=2,14
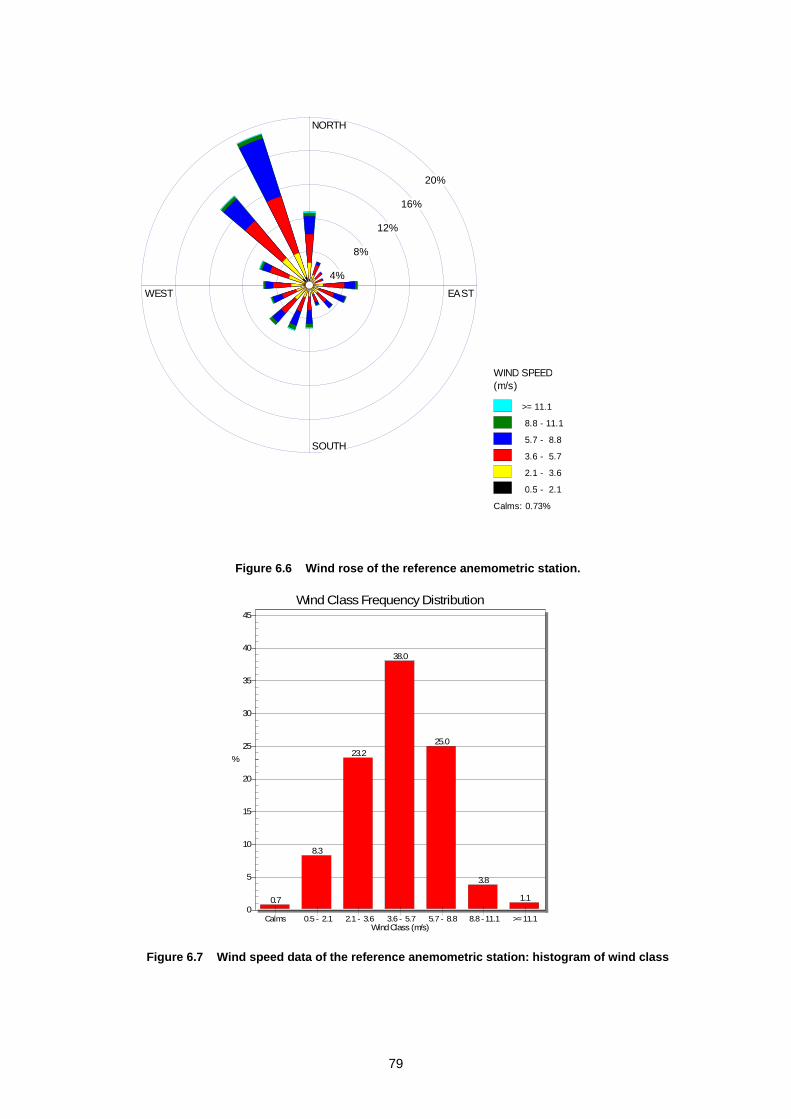
79
Figure 6.6 Wind rose of the reference anemometric station.
Figure 6.7 Wind speed data of the reference anemometric station: histogram of wind class
NORTH
SOUTH
WEST EAST
4%
8%
12%
16%
20%
WIND SPEED
(m/s)
>= 11.1
8.8 - 11.1
5.7 - 8.8
3.6 - 5.7
2.1 - 3.6
0.5 - 2.1
Calms: 0.73%
0.7
8.3
23.2
38.0
25.0
3.8
1.1
0
5
10
15
20
25
30
35
40
45
%
Wind Class Frequency Distribution
Wind Class (m/s)Calms 0.5 - 2.1 2.1 - 3.6 3.6 - 5.7 5.7 - 8.8 8.8 - 11.1 >= 11.1
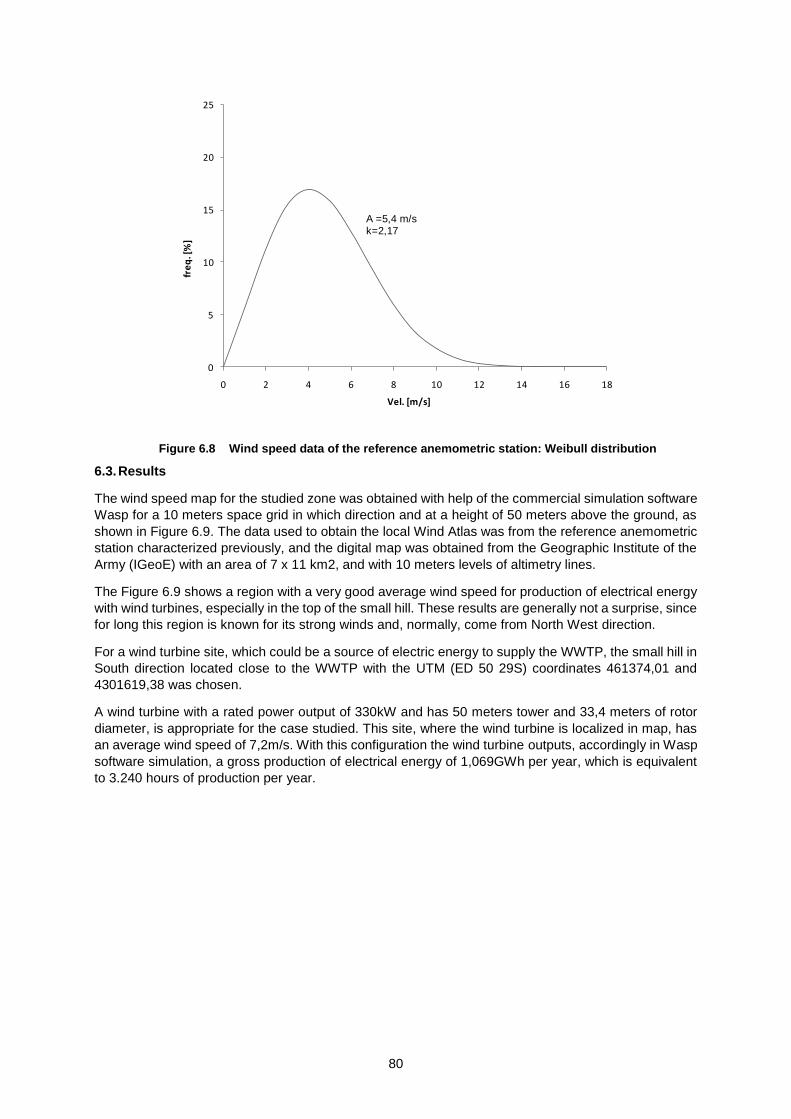
80
Figure 6.8 Wind speed data of the reference anemometric station: Weibull distribution
6.3. Results
The wind speed map for the studied zone was obtained with help of the commercial simulation software
Wasp for a 10 meters space grid in which direction and at a height of 50 meters above the ground, as
shown in Figure 6.9. The data used to obtain the local Wind Atlas was from the reference anemometric
station characterized previously, and the digital map was obtained from the Geographic Institute of the
Army (IGeoE) with an area of 7 x 11 km2, and with 10 meters levels of altimetry lines.
The Figure 6.9 shows a region with a very good average wind speed for production of electrical energy
with wind turbines, especially in the top of the small hill. These results are generally not a surprise, since
for long this region is known for its strong winds and, normally, come from North West direction.
For a wind turbine site, which could be a source of electric energy to supply the WWTP, the small hill in
South direction located close to the WWTP with the UTM (ED 50 29S) coordinates 461374,01 and
4301619,38 was chosen.
A wind turbine with a rated power output of 330kW and has 50 meters tower and 33,4 meters of rotor
diameter, is appropriate for the case studied. This site, where the wind turbine is localized in map, has
an average wind speed of 7,2m/s. With this configuration the wind turbine outputs, accordingly in Wasp
software simulation, a gross production of electrical energy of 1,069GWh per year, which is equivalent
to 3.240 hours of production per year.
0
5
10
15
20
25
0 2 4 6 8 10 12 14 16 18
fre
q. [
%]
Vel. [m/s]
A =5,4 m/sk=2,17
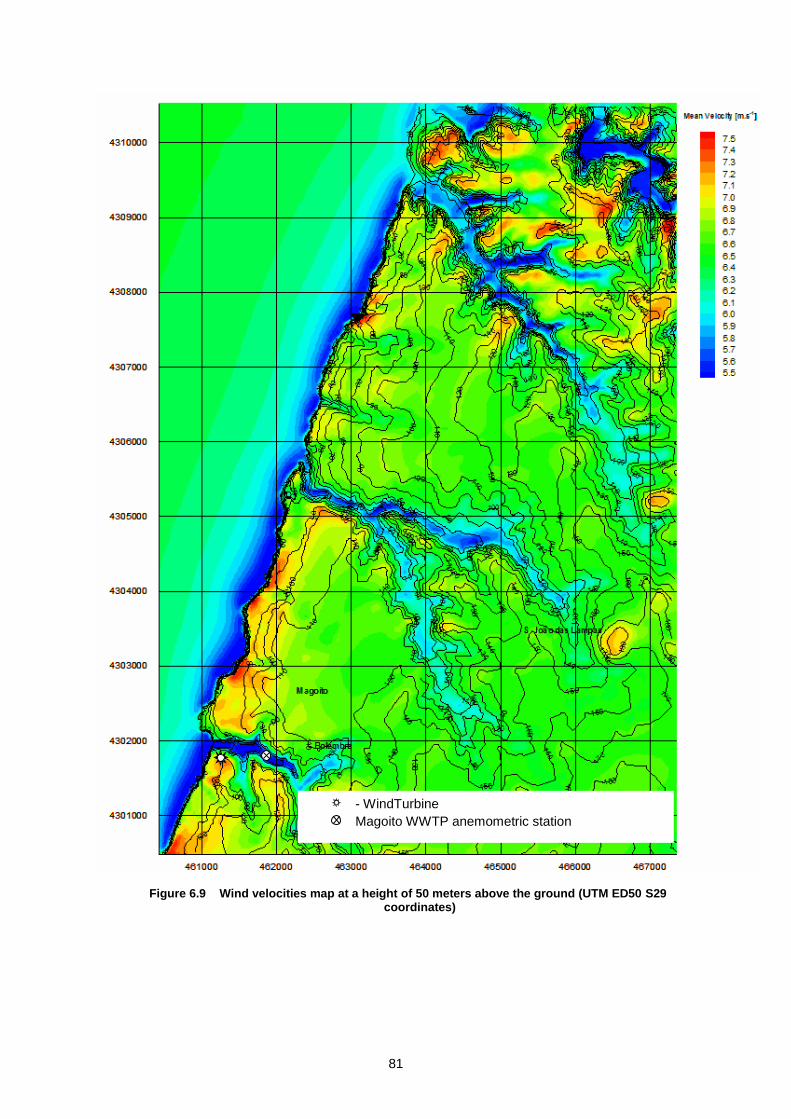
81
Figure 6.9 Wind velocities map at a height of 50 meters above the ground (UTM ED50 S29 coordinates)
- WindTurbine
Magoito WWTP anemometric station
82
6.4. Conclusion of the wind potential study
These achieved results are very encouraging to explore the wind power energy locally. The results
obtained are only guidelines and could reflect some uncertainties due the extrapolation of the expected
results from the reference station data. As previously described, the reference anemometric station is
located at 5km distance of the wind turbine site and at a diferent height, 10 meters above the ground
and wind turbine rotor would be at 50 meters above de ground. Nevertheless, these are good indicators
of the good quality of wind of the region for wind energy generation.
For this project to be implemented, it is recommended to install a 50 meters height above the ground
anemometric station (preference at same height of the wind turbine rotor) in the same local site of the
future wind turbine, at least for 6 months. This data will be essential to validate the preceding results for
the development the project.
83
7. Global conclusion and further investigation opportunities
Regarding the opportunities of improvement of the three Sintra’s WWTP, from environmental and energy
point of view, it is possible to conclude that several measures can be implemented to beneficiate these
3 WWTP. In all WWTP studied there are high level of nitrates on the effluent. This problem is typical of
a highly loaded affluent with high ammonia concentrations. Further studies should be made to identify
the origin of that pollution and in case of impossible identification, each WWPT should be modelled with
a pilot WWPT which simulate the process of the real WWTP and identify, by comparison, if the problem
is in an organ of the real WWTP or if the problem is the unsuitable treatment process for that specific
affluent.
Regarding the necessities of energy of a WWTP, it was demonstrated opportunities for energy
valorisation of the sludge by gasification. This process can produce from 850 to 1 200 kcal/m3 of sludge
depending of the treated waste, drying conditions and the C/O2 relation in the gasification reactor. This
permits to use this combustible gas like a heat source for the sludge drying. Relating to the efficiency of
the process, the carbon conversion is more than 95% in all the tests, so the gasification of the dry
sewage sludge is a feasible way of producing energy. The largest problem that emerged from the project
was the tars that were formed during the gasification phase. Therefore, the gasification process should
be improved or the tars should be collected and reintroduced in the reactor for their removal. If a
municipal service, could collect the combined sludge production of these 3 WWTP, it could be achieved
4.3191,4 m3 of sludge per year. Considering that the LCV of the dry sludge is 3.428kcal/kg, these 3
WWTP could produce more than 172.162,93kWh per year, which is more that its energy demand
162.908kWh per year).
In order to verify the possibility for the use of wind energy in a WWTP, a study of wind availability is
required for the local and for Magoito were achieved very encouraging. It is estimated a production of
1,069GWh per year, which is equivalent to 3.240 hours of production per year. For the implementation
of this project it is recommended the installation of a 50 meters height anemometric station (preference
at same height of the wind turbine rotor) in the same local site of the future wind turbine, at least for 6
months. The collected data will be essential to validate the preceding for the development the project.
There are other energy systems that should be explored in these WWTP like the valorisation of biogas
produced in anaerobic unitary operations. It will certainly be a field of investigations for these WWTP.

84
85
8. References
ISWA´s Working Group on sewage & waterworks “Sludge Sludge Treatment and Disposal”, European
Environmental Agency. 1997;
Altmann, E. Kellett, P., “Thermal MSW Gasification”, Irish Energy Centre, July 1999;
“Waste Gasification” Blue Ridge Environmental Defense League. April 1, 2002;
Brendan McAuley, Julie Kunkel, Stanley E. Manahan, “A new process for the drying and gasification of
sewage sludge”. Water Engineering & Management. May 2001;
Duarte, E. Reis, I. Martins, M. Trindade, C. “Otimização da gestão de lamas: tratamento,
armazenamento e destino final”; Departamento de Química Agrícola e Ambiental, Instituto superior de
Agronomia; AgroGes – Sociedade deEstudos e Projectos, Lda.; 2005;
Gonçalves J, Leitão J, Carvalho M, Matos JS. “Produção e destino final de lamas de ETAR em Portugal
- Situação actual e perspectiva de evolução” Lisboa. IST/UTL, 2001;
Antas A. Catarino, L. Carvalho, M. ”Soluções de gestão de lamas de ETAs e ETARs” Reciclamas;
Abreu, A. Pinheiro, A. “Compostagem de lamas da ETAR de Parada” SMEAS;
“INSAAR” - Apresentação pública dos resultados preliminares de 2002;
“Organic contaminants in sewage sludge for agricultural use” UMEG Centre for Environmental
Measurements, Environmental Inventories and Product Safety, Oct 2001;
“Disposal and recycling routes for sewage sludge”. Luxembourg: Office for Official Publications of the
European Communities, 2001;
A. M. Iruretagoyena “Lodos. Aprovechamiento de los lodos compostados de la EDAR de Crispijana de
Álava”, Departamento de Industria, Agricultura y Pesca del Gobierno Vasco. 1997;
“Aprovechamiento agrícola de los lodos de la depuradora de aguas residuales de Vitoria-Gasteiz como
abono orgánico en cultivos de trigo”, Universidad del País Vasco, 1988;
Glennie, E. B., Littlejohn, C., Gendebien, A., Hayes, A., Palfrey, R., Sivil, D. and Wright, K. “Phosphates
and Alternative Detergent Builders – Final Report”, EU Environment Directorate, Report No.: UC 4011;
(2002);
“Plano Estratégico de Abastecimento de Água e de Saneamento de Águas Residuais (2000-2006)”,
Ministério do Ambiente e do Ordenamento do Território. 2000;
“Ministério do Ambiente e Ordenamento do Território. Situação do Saneamento Básico em Portugal
Continental – Índices de atendimento”, INAG, Novembro 1999;
“Ministério do Ambiente e Ordenamento do Território. Directiva 91/271/CEE, Tratamento de Águas
Residuais Urbanas – Aglomerações, Sistemas de Drenagem, Estações de Tratamento”. INAG, Janeiro
2000;
“Inventário Nacional de Saneamento Básico de 1990”, Ministério do Ambiente e Ordenamento do
Território, INAG, 1994;
“Regulamento de Drenagem de Águas Residuais dos Serviços Municipalizados de Sintra”, Serviços
Municipalizados de Água e Saneamento de Sintra, Julho 1997;
“Regulamento de Distribuição de Água dos Serviços Municipalizados de Sintra”, Serviços
Municipalizados de Água e Saneamento de Sintra, Julho 1997;
“Commission report - Implementation of Council Directive 91/271/EEC of 21 May 1991 concerning urban
waste water treatment”, as amended by Commission Directive 98/15/EC of 27 February 1999”, Euopean
commission, Brussels, 2004