Embed Size (px)
Citation preview

Water accounts
Physical and monetary data connected to abstraction, use and discharge of water in the Swedish NAMEA
by Gunnar Brånvall, Marianne Eriksson, Ulf Johansson, Peter Svensson, Statistics Sweden, Environment Statistics
December 1999

2 (2)
CONTENTS 1. INTRODUCTION 4
1.1 Objectives of the project 4 1.2 Flows of water in Sweden 4
2. FRAMEWORK FOR THE TABLES ON ABSTRACTION, USE AND DISCHARGE TO WATER 8 3. RESULTS 10
3.1 Water abstraction/supply 10 3.2 Water use 12 3.3 Wastewater treatment and discharge 19 3.4 Monetary data 22 3.5 Environmental - economic profiles for some manufacturing industries 27
4 DATA SOURCES 29 4.1 Physical data 29 4.2 Monetary data 32
5. CONCLUSION AND FUTURE WORK 39 ANNEX 40 REFERENCES !!!! 41

3 (3)
PREFACE Statistics Sweden has developed physical environmental accounts since 1993. Accounts for the use of energy and emissions to air are now regularly compiled. This report pre-sents the first step to develop accounts for water. In a NAMEA framework accounts are presented for water abstraction, use and discharge of water. Available physical and monetary data referring to 1995 are recalculated and adjusted to the environmental ac-counts. The report is prepared on commission from Eurostat, who supports and co-ordinates development of environmental accounts in the EU member states. The European Com-mission (DG XI) has contributed financially to the project. Gunnar Brånvall, Marianne Eriksson, Ulf Johansson and Peter Svensson have all contributed in preparing this report.

4 (4)
1. INTRODUCTION
1.1 Objectives of the project
All societies are for survival dependent of clean water in sufficient quantities. In Sweden there will probably always be enough water but shortage can arise temporarily and be rather severe in some areas. But we have to keep a close eye on water quality and im-prove it. It goes without saying that there has to be effective treatment of wastewater from all major urban areas and yet much remains to be done.1 It is important that we improve the quality of the Swedish water and to prevent further pollution to the water. Since water is such an vital part of the environment and used in huge quantities in the economy and economic activities have a substantial impact on water quality it is essen-tial to include both the use of water and emission to water in the environmental accounts. Statistics Sweden is at present developing an economy-wide material flow account, but water is at present not included. This study of the flows of water in the society can also be seen as a supplement to the material flows account. This project, which is the first step to set up accounts for water, will focus on those wa-ter flows in the technosphere which may be referred to as water abstraction, use of water and emission to water. Both water which is market produced and sold as a commodity and self supply of water (non-market produced) will be included. In the account physical data and monetary data connected to the use of water and treatment of wastewater will be presented. Only already available data, in both physical and monetary units, will be used but will be recalculated if necessary to adjust to the accounts. Most of the data refer to a single year, 1995. A set of supply/use table in a NAMEA-type of frame work will be presented with an evaluation of the available data and recommendations for improve-ment and further development of the accounts. Data on water resources is not included in this first step of water accounts by may at a later stage be included. The report first contains an overview of the flows of water in Sweden. In section 2 there is a description of the used framework, section 3 shows the results and in section 4 there is information on the used data together with discussions on data quality and calculations methods. The last section sums up the experience gained in this pilot study together with recommendation for further work.
1.2 Flows of water in Sweden
In Sweden there are 95 700 lakes with an area of 42 000 km2, which is 9,3 per cent of the total land area. The total freshwater resources that can be utilised in activities based on running water have been estimated to178 000 Mm3, which is equal to the yearly run-off to the sea. The total abstraction amounts to 3 300 Mm3 per year.
1 National Atlas of Sweden, Climate, Lakes and Rivers. Page 171

5 (5
)
Figu
re 1
.Sw
edis
h w
ater
flow
s rel
ated
to te
chno
sphe
re (1
995)
, Mm
3
Hou
seho
lds
NA
CE
70
Gro
undw
ater
Surf
acew
ater
Se
awat
er
Col
lect
ion,
pur
ifica
tion
dist
ribut
ion
of w
ater
N
AC
E 41
Agr
icul
ture
NA
CE
01
Min
ing
and
man
ufac
turin
g in
dust
ries
NA
CE
10-3
9
Elec
trici
ty, g
as e
ct.
NA
CE
40
Oth
er in
dust
rial s
ecto
rs
N
AC
E 02
, 42-
99
Was
tew
ater
dis
posa
l N
AC
E 90
.001
Nuc
lear
pow
er
plan
ts
NA
CE
40.1
554
137
1478
69
?
88
541
79
88
528
? 19
05
117
87+?
0,
7
1360
936
96
7 87
52
8
2157
27
11
8 50
0
133
44
Surf
acew
ater
Se
awat
er
495
Urb
an R
un-o
ff
wat
er
Un
spec
ifi-
ed u
se
38
47
38
?

6 (6)
In Figure 1, the most important flows of water related to the technosphere are shown. The water resources in ground water, surface water and sea water are shown on the top of the figure in their role as reservoirs for water abstraction. We have taken the liberty to duplicate them at the bottom of the figure in their role as recipients of (more or less) polluted water. In between a few boxes are shown, representing the main human activi-ties relating to water. These are classified according to NACE codes. Flows between the boxes are measured in Mm3 and refer to the year 1995. Two of the activities are directly based on qualitative treatment of water: NACE 41 ab-stracts raw water, produces and distributes tap water which is sold to customers. NACE 90.001 represents the Municipal Waste Water Treatment Plants, (MWWTP:s), which produce the service of wastewater removal and treatment. Raw water for tap water production is taken both from ground water and surface water. Public waterworks serve about 7 860 000 persons or about 90 per cent of the population It is mostly in rural areas where the households have private water abstraction. The pub-lic waterworks supply 5 per cent of water used in the manufacturing industry and supply also for public use. As a total there are 2 100 public waterworks, of which 375 answer for 86 per cent of the water abstraction. There are 2 100 MWWTP:s, 7 779 000 persons or about 90 per cent of the population are connected. Almost 500 plants, which serve more than 2 000 persons, treat about 90 per cent of the total wastewater. Standard sewage water is of course produced in every economic activity and it is usually taken care of by the MWWTP:s. In addition to this, some process water is delivered from industries to MWWTP:s. The abundance of water in Sweden may also be noticed by the large industrial abstrac-tion of water, especially surface water - 1 500 Mm3. These activities are concentrated to a few water intensive process industries, notably the pulp and paper industry. Some large mining, steel and chemical plants are also quite water intensive. The purpose of the use of water is mainly for cooling or in the production process. All industries with intensive use of water are subject to rigorous environmental control, which imposes treatment programs for the process water. Data on their discharges to water can be found annually in environmental reports. However, it should be mentioned that around half of the total industrial abstraction is used, in stainless pipes, for the purpose of cooling. It is considered to be discharged almost without pollution. These large industrial water flows do not correspond to ”water products”, but are rather to be considered as ”auxiliary ac-tivities”, for example in the production of pulp. This makes it more difficult to study their economic implications. The largest of all flows shown in the figure is 8 500 Mm3 of sea water used for cooling in Swedish nuclear plants. This water is returned to the sea (almost) without pollution, but causes a local warming of the recipient. Water used by Swedish nuclear plants is excluded from the account since the resource of seawater is almost unlimited and the environmental impact is very small.

7 (7)
As seen from the Figure 1 the total abstraction for tap water production is around 940 Mm3. There of 133 Mm3 is estimated to be losses or measuring errors by water abstrac-tion or by use of water. The losses are presumed to come into the wastewater system by urban run off. The total amount of wastewater reaching the MWWTP:s is larger, around 1 300 Mm3. In order explain the difference, we have introduced a box for drainage and run-off water, some of which by tradition finds its way into the wastewater systems of Swedish MWWTP:s. (The present Swedish policy is to aim at a separate drainage net-work for this type of water.) The framework for the supply and use tables are based on flows of water illustrated in Figure 1. The different NACE groups are aggregated but in the tables presented in the following parts of the report the manufacturing industries have been disaggregated into 17 industries. For some sectors such as agriculture, households there is supplementary information in tables linked to the accounts. For all of the physical flows of water there are corresponding monetary transactions or more often internal expenditures involved. Water abstracted by the public waterworks is a commodity to be sold on a market and is referred to in the tables as market produced water, all other abstraction is for own final use. The MWWTP:s provide wastewater treatment services but there are also internal expenditures for the treatment of wastewa-ter. In section 3.1-3.3 physical data concerning abstraction and discharge to water are shown. In section 3.4 expenditures for abstraction and treatment of wastewater are shown. Section 3.5 shows some examples of indicators with both physical and monetary data.

8 (8)
2. FRAMEWORK FOR THE TABLES ON ABSTRACTION, USE AND DISCHARGE TO WATER
The logical structure of the tables is illustrated in Figure 2, which is a simplified version of Figure 1. There are four tables with physical data in the water accounts and one with monetary data. Table 1 and 2 deal with abstraction and use of water. Table 3-4 deal with production of wastewater and discharge to water. Table 5 (a and b) deal with costs for producing freshwater and wastewater treatment. For any cutting, crossing flows may be sorted either by their starting box (”supply”) or by the receiving box (”use”). The first four tables are defined by flows crossing the broken lines marked Table 1-4. Table 1 and 3 follow ‘in-arrows’ (supply from nature or production of wastewater). Table 2 and 4 follow ‘out-arrows’ (use of water and discharge to water). Table 5 (a and b) associate a monetary measure to flows. For any box, one may compute the difference between total out-flow and total in-flow. This difference represents water which disappears within the box and is sometimes re-garded as ”consumption”. For most industries - NACE 01 is an exception - it may be estimated to zero on our scale of accuracy and this applies also to the MWWTP:s. This concept of net ”consumption” (or ”production” in the case of a negative value) provides less trivial results when applied to the contents of various polluting substances in the water. Thus Supplementary table 4.1 estimates the removal of some pollutants from wastewater accomplished by Swedish MWWTP:s (The destiny of removed material - in the sludge - is out of scope for this report). In the Swedish National Accounts (SNA) the households expenditure for water and treatment of wastewater as well as expenditures for waste are accounted as expenditure in NACE 70 ‘Real estate sector’. These expenditures are regarded as expenditures con-nected to housing and not as private consumption. In the water accounts we have in ac-cordance with SNA chosen to report data for households in NACE 70. Table 1 shows the abstraction or supply of water by different NACE groups. The ab-straction is divided in groundwater, surface water and seawater. The table shows the total abstraction divided by public waterworks and private abstraction. Abstraction by the public waterworks (NACE 41) is referred to as market produced since it is produced to be a commodity to be sold on a market. For all other NACE groups water is ab-stracted only for own-use i.e. non-market produced. Only market produced water has an explicit price and the cost for production and expenditures for the buying sector are found in the input-output tables on SNA. Information on the internal cost for the self supply of water are not available except for irrigation in the agricultural sector. Table 2 shows the total use of water and use by purpose by different NACE groups. The total use of water is divided into the use of market produced water and non-market pro-duced. Which means that this table shows the users of water from the public water-works. Table 3 shows the total production of wastewater with information on the quantity of water sent to MWWTP:s and the quantity discharged direct from the industries.

9 (9)
Table 4 shows the quantity of water discharged to nature together with some informa-tion on quantities of polluting substances. Table 5a shows the estimated monetary data connected with the supply and use of water. Table 5b shows the estimated monetary data connected with treatment of waste water.
Figure 2. Supply and use of water and wastewater
Groundwater Surfacewater Seawater
Collection, purification distribution of water
NACE 41
”All” industries NACE 01-99, except 70 and 90.001
Households (NACE 70)
Wastewater disposal NACE 90.001
Surfacewater Seawater
Use of water Table 2
Supply of water Table 1
Generation of wastewater
Table 3
Discharge of wastewater
Table 4
Monetary data Table 5a
Monetary data Table 5b
Urban Run-off water

10 (10)
3. RESULTS
3.1 Water abstraction/supply
Table 1 Abstraction / supply of water (1995), 1000 m3
Market produced Non-market produced
Industry NACEGround
waterSurface
water TotalGround
waterSurface
waterSea
water Total
Agriculture 01 66 418 70 873 137 291Forestry 02Mining and Quarring 10-14 15 229 24 845 2 521 42 595
Manufacturing industriesof whichFood products and beverages, tob 15-17 10 600 7 709 29 802 48 111Textiles and textile products, leath 17-19 913 8 307 9 220W ood and wood products 20 946 15 924 1 661 18 531Pulp, paper and paper products 21 16 975 059 975 075Publishing, printing 22 3 42 19 64Coke, refined petrolium and nuclea 23 8 117 125Chemicals and chemical products 24 2 968 180 639 309 274 492 881Rubber and plastic products 25 450 11 286 5 045 16 781Non-metallic mineral products 26 3 947 6 305 1 923 12 175Basic metals 27 2 843 160 193 188 826 351 862Fabricated metal products, excep 28 721 11 366 38 12 125Machinery and equipment 29 270 19 545 19 815Office machinery and computers 30 42 24 2 68Electrical machinery and apparatu 31-32 1 303 1 990 1 753 5 046Instruments, watches and clocks 33 77 44 61 182Motor vehicles, transport equipme 34-35 238 9 885 7 10 130Other manufacturing 36-37 111 238 11 360Not possible to disaggregate by manufacturing sector 1 474 4 192 1 5 667
Electricity, gas ,steam and hot wa 40 897 68 480 44 174 113 551Collection, purification and distribu 41 444 948 491 353 936 301
Construction 45W holesale and retail trade 50-52Hotels and resturants 55Transport, storage and communic 60-64Financial intermediation 62Real estate 70 88 449 88 449Renting and buisness activities 71-74
Other, excl. 90.001 80-99Sewage disposal 90.001
Public administration 75
Tota l 444 948 491 353 936 301 197 923 1 577 063 585 118 2 360 104
The total abstraction of water in Sweden was 3 296 Mm3 in 1995, which is a little more than 1 000 litre per person and day. 65 per cent of the total water abstraction is surface water. Seawater amounts to 18 per cent of the total abstraction. The total abstraction of seawater is made as own abstraction by the manufacturing industries and used as cool-ing water. Seawater used by the nuclear powerplants is not included in the accounts. The use of seawater in nuclear power plant is estimated to 8 500 Mm3.
11 (11)
Figure 3 Abstraction of water by type of water (1995) ������������������������������������������������������������������������������������������������������������������������
������������������������������������������������������������������������������������������������������������������������������������������������������������������������
65%
17%
18%Seawater
Groundwater
Surfacewater
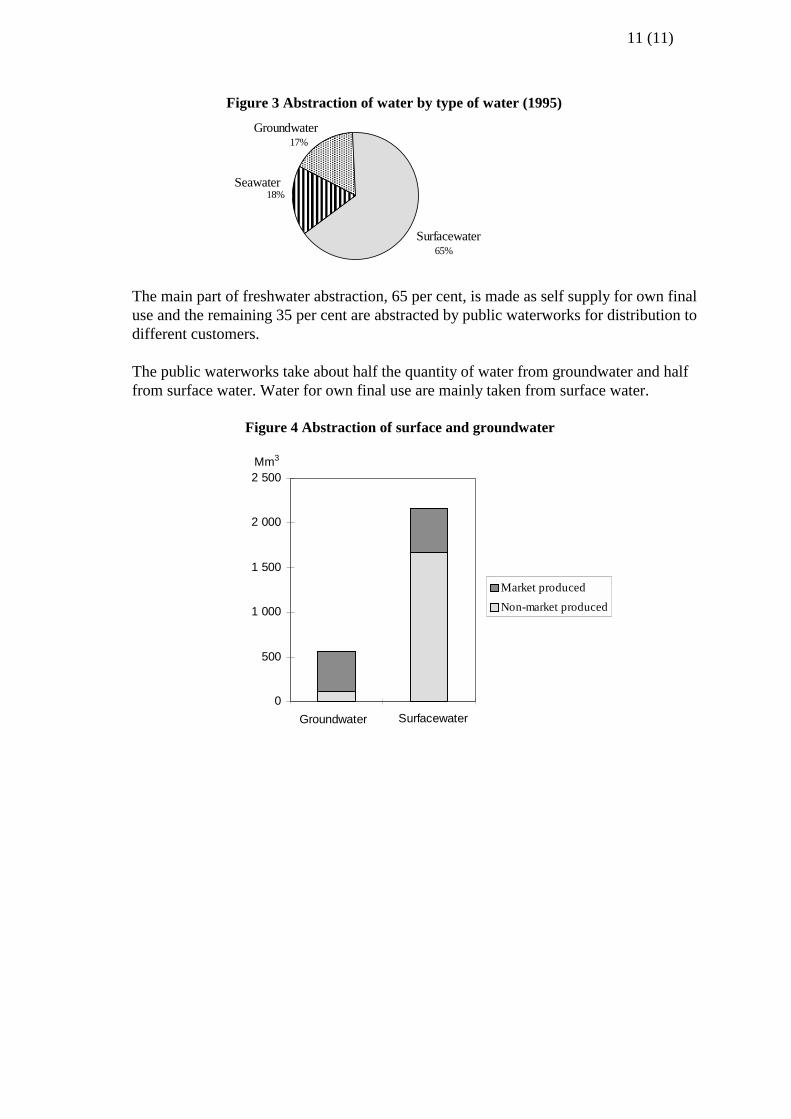
The main part of freshwater abstraction, 65 per cent, is made as self supply for own final use and the remaining 35 per cent are abstracted by public waterworks for distribution to different customers. The public waterworks take about half the quantity of water from groundwater and half from surface water. Water for own final use are mainly taken from surface water.
Figure 4 Abstraction of surface and groundwater
0
500
1 000
1 500
2 000
2 500
Market producedNon-market produced
Groundwater Surfacewater
Mm3

12 (12)
3.2 Water use
Table 2 Use of water (1995), 1000 m3
Use by purpose
Indus try NACEMarket
produced
Non-market
produced Totalt
Cooling water in produc-
tion of electricity
Other cooling
waterProduction processes Other use
Total intermediate consumption of indus tries
Agriculture 01 137 291 137 291 137 291Fores try 02Mining and Quarring 10-14 1 312 42 594 43 906 271 41 659 1 977
Food products and beverage 15-16 25 917 48 112 74 029 43 522 27 516 2 991Textiles and textile products 17-19 2 459 9 220 11 679 53 3 773 7 303 551W ood and wood products 20 1 249 18 531 19 780 669 18 256 855Pulp, paper and paper produ 21 3 327 975 075 978 402 24 615 279 730 665 309 8 748Publishing, printing 22 2 466 64 2 530 190 715 1 625Coke, refined petrolium and n 23 271 125 396 260 87 48Chemicals and chemical prod 24 18 891 492 881 511 772 996 482 419 21 305 7 051Rubber and plas tic products 25 995 16 782 17 777 15 267 1 844 666Non-metallic mineral product 26 2 716 12 175 14 891 7 796 5 492 1 602Basic metals 27 8 592 351 862 360 454 20 916 257 659 78 422 3 457Fabricated metal products , e 28 4 164 12 126 16 290 40 11 251 2 782 2 216Machinery and equipment 29 5 473 19 815 25 288 19 013 2 947 3 328Office machinery and compu 30 406 67 473 223 69 181Electrical machinery and app 31-32 3 385 5 045 8 430 3 473 3 593 1 364Ins truments , watches and cl 33 1 025 181 1 206 443 195 568Motor vehicles , transport eq 34-35 6 446 10 130 16 576 9 452 4 162 2 962Other manufacturing 36-37 695 360 1 055 137 480 438Not poss ible to disaggregate by sector 6 469 5 667 12 136 12 136
Electricity, gas ,s team and ho 40 6 681 113 551 120 232 105 880 4 866 6 057 3 429Collection, purification and d 41 180 596 180 596 180596 1)
Construction 45W holesale and retail trade 50-52Hotels and res turants 55Transport, s torage and comm 60-64 86 522 86 522 86 522Financial intermediation 62Renting and buisness activit 71-74Other, excl. 90.001 80-99Sewage disposal 90.001Public adminis tration 75
Real es tate 70 527 975 88 449 616 424 616 424Unspecified use 38 269 38 269 38 269
Total use 936 301 2 360 103 3 296 404 152 500 1 140 414 888 193 1 115 295
1) This figure represents the difference between abstracted and sold quantity. The total use of water by industry is shown in Table 2, with a separate account of the use of water from market produced water and non-market produced. When linking eco-nomic transaction in SNA with the use of water it is possible to get information on ex-penditure for water purchased as a commodity but expenditures for own abstraction can not be distinguished without special investigations. Of the total use of water 68 per cent was used by the manufacturing industry, including mining and electricity, 19 per cent by the households and only 4 per cent by agriculture. Information on use in other industrial sectors are not available by industry, but as a total it amounted to 9 per cent of the total use.

13 (13)
Figure 5 Use of water by industry (1995)
����������������������������������������������������������������������������������������������������������������������������������������������������������������������������������������������������������������������������������������������������������������������������������������������������������������������������������������������������������������������������������������������������������������������������������������������������������������������������������������������������������������������������������������
���������������������������������������������������������������������������������������������������������������������������������������
���������������������������������������������������������������������������
4%9%
19%
68%
Agriculture
Manufacturing industry (incl. mining and electricity)
Realestate/household
Other
For the manufacturing industry water from own abstraction cover 95 per cent of the total use of water and the public waterworks supply 5 per cent . For the households 86 per cent of the water are supplied by public waterworks and 16 per cent are from private withdrawal. The use of water in agriculture for irrigation and livestock are entirely from self supply. Data on self supply for other users is not available.
Figure 6 Percentage of water by self supply and by public waterworks
�����������������������������������������������������������������������������������������������������������������������������������������������������������������������������������������������������������������
����������������������������������������������������������������������������������������������������������������������������������������������������������������������������������������������������������������������������
������������������������������������������������������������
0%
20%
40%
60%
80%
100%
Agriculture Manufacturingindustry
Household
���� Own abstractionPublic waterworks
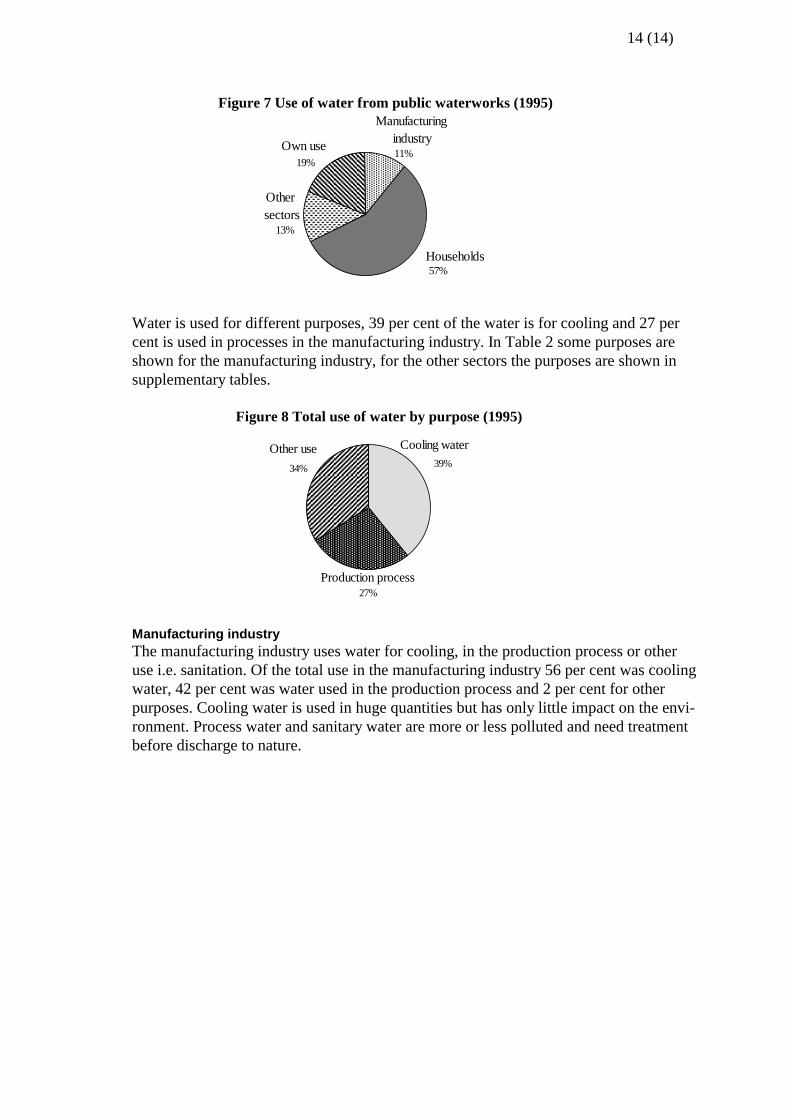
The public waterworks serves both households and the industrial sectors. More than half of the water is used by households and 11 per cent by the manufacturing industry. Of the abstracted water 19 per cent is recorded for own use in the waterworks. ”Own use” here refers to water used in the operation of the waterworks e.g. cleaning but also losses. Losses can be leakage in the distribution network or measuring errors. Losses are esti-mated to 14 per cent of the total water abstraction.
14 (14)
Figure 7 Use of water from public waterworks (1995)
�����������������������������������������������������������������������������������������������
������������������������������������������������������������������������������������������������������������
�������������������������������������������������������������������������������������������������������������������
11%19%
13%
57%
Manufacturing industry
Households
Other sectors
Own use
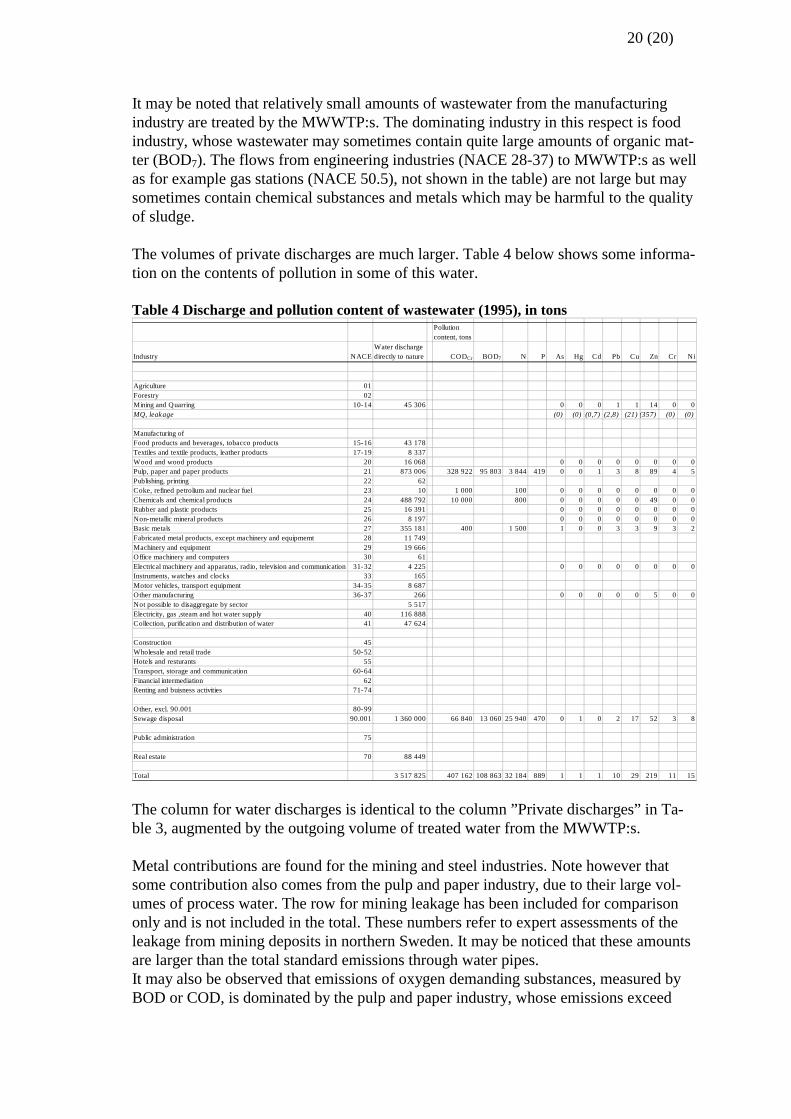
Water is used for different purposes, 39 per cent of the water is for cooling and 27 per cent is used in processes in the manufacturing industry. In Table 2 some purposes are shown for the manufacturing industry, for the other sectors the purposes are shown in supplementary tables.
Figure 8 Total use of water by purpose (1995)
��������������������������������������������������������������������������������������������������������������������������������������������������������������������������������������������������������
����������������������������������������������������������������������������������������������������������������������������������������������������������������������������������������������������������������������������������������
34%
27%
39%
Cooling water
Production process
Other use
Manufacturing industry The manufacturing industry uses water for cooling, in the production process or other use i.e. sanitation. Of the total use in the manufacturing industry 56 per cent was cooling water, 42 per cent was water used in the production process and 2 per cent for other purposes. Cooling water is used in huge quantities but has only little impact on the envi-ronment. Process water and sanitary water are more or less polluted and need treatment before discharge to nature.

15 (15)
Figure 9 Use of water by purpose in the manufacturing industries (1995), Mm3 ����������
����������������
����������������������������������������������������������������������������������������������������������������
������
����
��������������
������������������
0 200 400 600 800 1000
Foodproducts and
Wood andw ood
Publishing,printing
Chemicalsand chemical
Basic metals
Officemachinery
����Processw aterincl other use
Cooling w ater
Mm3
In the Swedish manufacturing industry there are three industries that use 90 per cent of the water, that is Pulp, paper and paper products (NACE 21), Chemicals and chemical products (NACE 24) and Basic metal (NACE 27). Pulp, paper and paper product indus-try uses 75 per cent of the total use of process water. Another way to look at the importance of water in the production is to set the use of water in relation to production value. The same three industries as in the previous dia-gram where water is very important e.g. the Pulp, paper and paper product industry uses 13 100 m3 per million SEK of production value. Disregarding the three water intensive industries, the average use of the remaining in-dustries is below 1 000 m3 per million SEK production value.

16 (16)
Figure 10 Use of water in relation to production value in the manufacturing industries (1995), in litres per SEK
0,00 2,00 4,00 6,00 8,00 10,00 12,00 14,00
Food products andbeverages
Wood and w oodproducts
Publishing, printing
Chemicals and chemicalproducts
Basic metals
Off ice machinery andcomputers, electrica
1000 m3/ milj SEK Energy production The use of water in the Electricity, gas steam and hotwater supply (NACE 40) amounts to 120 Mm3. In addition to this the nuclear power plants used 8 500 Mm3. Water used by the nuclear power plants is not included in the water accounts since the supply of sea-water is almost unlimited and the emission has a very small impact on the environment. In Sweden 47 per cent of the electrical production was produced by the nuclear power plants. Another important use of water in the Swedish economy is the use of water in Hydro-power stations. Hydropower stations produced 46 per cent of the electrical production in Sweden. Water in hydropower stations is not included in the water accounts since there is no abstraction of water but only use of potential energy from the water. Hydropower stations with water reservoirs and water regulations of the rivers will of course have other impact on the environment such as loss of biodiversity, loss of habitat and loss of pristine nature areas.
Figure 11 Production of electricity (1995)
������������������������������������������������������������������������������������������������������������������������������
0%
20%
40%
60%
80%
100%
Conv.thermalpower�������
������� Nuclerarpower
Hydro-power

17 (17)
Agriculture Water in agriculture is used for irrigation and livestock. The estimated use for irrigation relates to the amounts needed in a dry season. In an ordinary season the use for irrigation is about 40 per cent compared with a dry season. Areas with possibilities for irrigation is 4 per cent of the total arable area. Supplementary table 2.1 Use of water in agriculture (1985) Mm3 per cent Irrigation 94 69 Livestock 43 31 Total 137 100 Households Expenditures for water used by the households are in SNA counted as intermediate con-sumption in the real estate sector (NACE 70) i.e. it is part of the expenditure for housing and not looked upon as private consumption. In the environmental accounts for water the physical data for use of water by households are in the same way as in SNA linked to the real estate sector. The use of water by households amounts to 616 Mm3, which makes the average use of water in Sweden to 189 litre per person and day. Some estimates are available on the use of water for different purposes which shows that 30 per cent is used for personal hygiene and 20 per cent for dish-washing.
Figure 12 Use of water in households by purpose
������������������������������������������������������������������������������������������
������������������������������������������������������������������������������������������������������������������������������������������������������������������������
�������������������������������������������������������������������������������������������������������������������
������������������������������������������������������������������������������������������������������������������������
WC20%
Laundary15%
Dish-washing
20%
Cooking5%
Cleaning, carwash
10%Personal hygiene
30%
Source: www.smn.environ.se
In Sweden about 85 per cent of the population are connected to the public waterworks. For the households not connected to the public waterworks we have assumed the use of water to be the same as for persons connected to public waterworks. For leisure houses not connected to the public waterworks we have assumed the total use to be 1 per cent of the total use in households.

18 (18)
Figure 13 Total abstraction of water of the household sector (1995), 1 000 m3
1%13%
86%
Leisure housesPrivate abstraction
Permanet residentsconnected to public water works

19 (19)
3.3 Wastewater treatment and discharge
It was shown in the use Table 2 that large amounts of water are used in a few water in-tensive industries, notably the pulp and paper industry. Part of this water is delivered to the MWWTP:s but a larger part is treated and dis-charged by the industry itself. This can be studied Table 3 which also contains informa-tion on whether the water is discharged to inland waters or to the sea. Note, however, that these flows differ very much in pollution content. Cooling water as well as process water are included Table 3 Generation and discharge of wastewater (1995), 1 000 m3
Industry NACE
Discharge to public sewage
systemTotal private
discharge Thereof to
inland waters to sea Total
Agriculture 01Forestry 02Mining and Quarring 10-14 1 157 45 306 42 767 2 539 46 463
Manufacturing of
Food products and beverages, tobacco products 15-16 25 154 43 178 11 107 32 071 68 332Textiles and textile products, leather products 17-19 3 080 8 337 8 337 0 11 417Wood and wood products 20 1 327 16 068 13 989 2 079 17 395Pulp, paper and paper products 21 7 682 873 006 361 112 511 894 880 688Publishing, printing 22 2 282 62 41 21 2 344Coke, refined petrolium and nuclear fuel 23 357 10 6 4 367Chemicals and chemical products 24 5 352 488 792 159 999 328 793 494 144Rubber and plastic products 25 1 193 16 391 5 201 11 190 17 584Non-metallic mineral products 26 2 617 8 197 6 812 1 385 10 814Basic metals 27 3 972 355 181 159 521 195 660 359 153Fabricated metal products, except machinery and equipmemt 28 4 379 11 749 9 928 1 821 16 128Machinery and equipment 29 5 615 19 666 19 640 26 25 281Office machinery and computers 30 381 61 59 2 442Electrical machinery and apparatus, radio, television and communication 31-32 4 136 4 225 2 108 2 117 8 361Instruments, watches and clocks 33 1 023 165 59 106 1 188Motor vehicles, transport equipment 34-35 7 644 8 687 8 484 203 16 331Other manufacturing 36-37 623 266 220 46 889Not possible to disaggregate by sector 727 5 517 5 514 3 6 244
Electricity, gas ,steam and hot water supply 40 725 116 888 67 360 49 528 117 613Collection, purification and distribution of water 41 132 972 47 624 180 596
Construction 45Wholesale and retail trade 50-52Hotels and resturants 55Transport, storage and communication 60-64 86 522 86 522Financial intermediation 62Renting and buisness activities 71-74Other, excl. 90.001 80-99Sewage disposal 90.001
Public administration 75
Real estate 70 527 975 88 449 616 424Unspecified use 38 269 38 269Total 865 164 2 157 825 882 264 1 139 488 3 022 989
Urban run-off water 494 836 494 836
Total 1 360 000 2 157 825 882 264 1 139 488 3 517 825
20 (20)
It may be noted that relatively small amounts of wastewater from the manufacturing industry are treated by the MWWTP:s. The dominating industry in this respect is food industry, whose wastewater may sometimes contain quite large amounts of organic mat-ter (BOD7). The flows from engineering industries (NACE 28-37) to MWWTP:s as well as for example gas stations (NACE 50.5), not shown in the table) are not large but may sometimes contain chemical substances and metals which may be harmful to the quality of sludge. The volumes of private discharges are much larger. Table 4 below shows some informa-tion on the contents of pollution in some of this water. Table 4 Discharge and pollution content of wastewater (1995), in tons
Pollution content, tons
Industry NACEWater discharge directly to nature CODCr BOD7 N P As Hg Cd Pb Cu Zn Cr Ni
Agriculture 01Forestry 02Mining and Quarring 10-14 45 306 0 0 0 1 1 14 0 0MQ, leakage (0) (0) (0,7) (2,8) (21) (357) (0) (0)
Manufacturing ofFood products and beverages, tobacco products 15-16 43 178Textiles and textile products, leather products 17-19 8 337Wood and wood products 20 16 068 0 0 0 0 0 0 0 0Pulp, paper and paper products 21 873 006 328 922 95 803 3 844 419 0 0 1 3 8 89 4 5Publishing, printing 22 62Coke, refined petrolium and nuclear fuel 23 10 1 000 100 0 0 0 0 0 0 0 0Chemicals and chemical products 24 488 792 10 000 800 0 0 0 0 0 49 0 0Rubber and plastic products 25 16 391 0 0 0 0 0 0 0 0Non-metallic mineral products 26 8 197 0 0 0 0 0 0 0 0Basic metals 27 355 181 400 1 500 1 0 0 3 3 9 3 2Fabricated metal products, except machinery and equipmemt 28 11 749Machinery and equipment 29 19 666Office machinery and computers 30 61Electrical machinery and apparatus, radio, television and communication 31-32 4 225 0 0 0 0 0 0 0 0Instruments, watches and clocks 33 165Motor vehicles, transport equipment 34-35 8 687Other manufacturing 36-37 266 0 0 0 0 0 5 0 0Not possible to disaggregate by sector 5 517Electricity, gas ,steam and hot water supply 40 116 888Collection, purification and distribution of water 41 47 624
Construction 45Wholesale and retail trade 50-52Hotels and resturants 55Transport, storage and communication 60-64Financial intermediation 62Renting and buisness activities 71-74
Other, excl. 90.001 80-99Sewage disposal 90.001 1 360 000 66 840 13 060 25 940 470 0 1 0 2 17 52 3 8
Public administration 75
Real estate 70 88 449
Total 3 517 825 407 162 108 863 32 184 889 1 1 1 10 29 219 11 15 The column for water discharges is identical to the column ”Private discharges” in Ta-ble 3, augmented by the outgoing volume of treated water from the MWWTP:s. Metal contributions are found for the mining and steel industries. Note however that some contribution also comes from the pulp and paper industry, due to their large vol-umes of process water. The row for mining leakage has been included for comparison only and is not included in the total. These numbers refer to expert assessments of the leakage from mining deposits in northern Sweden. It may be noticed that these amounts are larger than the total standard emissions through water pipes. It may also be observed that emissions of oxygen demanding substances, measured by BOD or COD, is dominated by the pulp and paper industry, whose emissions exceed

21 (21)
those of the MWWTP:s. These two sources are totally dominating with regard to this type of pollution. Concerning phosphorus and especially nitrogen non-negligible contributions are also found for a few other industries. Nitrogen emissions stem from the mining and steel industries as well as some chemical industries, especially plants for production of nitro-gen fertilisers. No official estimates of these are available. The figures shown should be interpreted as a rough indication of the magnitude of these contributions. A few other industries discharge large quantities of water. Some chemical industries use huge amounts of cooling water which is discharged at a higher temperature than the incoming water but which is not believed to differ significantly in chemical composi-tion. In addition to this, much smaller amounts of process water are produced, which may be polluted in various ways. The contents of standard pollution parameters are however very small compared to the pulp and paper industry. Some remarks on the efficiency of Swedish MWWTP:s. The design of Swedish municipal wastewater treatment put high priority to reduction of phosphorus and oxygen demanding substances. Usually biological treatment steps are combined with chemical methods, resulting in great reductions of phosphorus and BOD. Reduction rates for nitrogen have been significantly lower and during the last years spe-cial steps have been taken introducing extra nitrogen reduction steps, especially by the largest plants. Traditionally no statistics has been compiled on incoming quantities. These were inves-tigated for the first time 1998. Results are being analysed just now. In the supplementary table 4.1 regarding 1995, it has been assumed that incoming quan-tities are equal to those of 1998 as measured by preliminary results from the 1998 sur-vey. Supplementary table 4.1 Efficiency of Swedish MWWTP:s with respect to removal of phophorus, nitrogen and oxygen demanding substances. Parameter, tons In (1 000 tons) Out (1 000 tons) Efficiency (1-In/Out) Ptot 7,2 0,47 0,93 BOD 207 13 0,94 Ntot 40 25,9 35 It may be remarked that the nitrogen results have been improved between 1995 and 1998.

22 (22)
3.4 Monetary data
The flows of water and wastewater described earlier in this report are accompanied by corresponding monetary flows. In this section the information available on the monetary flows will be presented using the same supply-use structure as for the physical flows. After discussions with SNA, it was decided that monetary data from The Swedish Water and Wastewater association (VAV) should be used in the calculation together with other surveys made by Statistics Sweden. The information from SNA should not. The reason is that those figures are based on an old edition of ”Statistics of intermediate con-sumption”, which makes them less reliable. Discussions regarding a co-operation be-tween SNA and environmental accounts have been initiated. The monetary data can be divided between market produced and non-market produced goods and services. Market produced In Sweden the price on water, supplied by the public waterworks, also cover costs for waste water treatment. Since there is only one meter for incoming water, the price is set in relation to the use of water. By using information from the VAV-survey it is possible to disaggregate production costs for water and wastewater treatment. Every year VAV make a rather detailed survey about the production costs and invest-ments within public waterworks and MWWTP:s in Sweden. From the 1995 survey in-formation on cost of production of both services have been used. Some adjustments and supplements have been necessary to do, e.g. because of partial non-response. The term market produced here relates to the trade of the good freshwater and the ser-vice wastewater treatment. Monetary data for the market part have been estimated ac-cordingly. • Total expenditure are taken from VAV. This data have then been adjusted because of
the existence of inter-public waterworks and non-response. • The expenditure have been broken down by NACE with information on the use of
water by NACE as a distribution key, after adjustments have been made for the pub-lic waterworks own use of water, and the fact that their revenues do not fully cover the costs

23 (23)
Supplementary table 5a.1 Total costs for watersupply and wastewater treatment (1995) in million SEK
Production costs; WaterworksSewage
treatment TotalTotal cost, million SEK 4 127 5 981 10 108Production 1 159 1 968 3 126Dis tribution 1 028 1 131 2 159Dis tribution (pressure intens ification) 99 299 397Adminis tration 375 479 854Consumption of fixed capital 1 466 2 105 3 571
Total inves tments , million SEK 583 1 220 1 803Distribution sys tem 373 563 936Reservoir 28 89 116W aterplants 178 563 742Purchased 4 6 9 The total cost of production of freshwater and wastewater treatment above have been distributed between the NACE groups by the physical data on the use of ”market pro-duced water” (Table 2) as distribution key. With the addition that the amounts of water used within public waterworks were not included in the calculations of a distribution key (Table 2). The reason is that the costs for this amount of water must also be covered through the fee for freshwater and wastewater management. The production costs in public waterworks and MWWTP:s for supplying freshwater and wastewater treatment shall (in principle) be financed through one fee for both services. But according to the ”Municipal accounts 1995” the gross receipts from the fee do not cover the total costs for producing the services. The difference of 7 per cent is a subsidy from municipalities to their customers. This has been taken into account in the distribu-tion of costs. Non-market produced Rather many enterprises/households also provide these goods and services by them-selves. They invest in water plants and equipment and therewith become both supplier and user at the same time. These costs of production are not incorporated in VAV:s sta-tistics. When it comes to wastewater treatment, useful information is available from the survey ”Environmental protection expenditure in industry 1997”. From this survey information about manufacturing industries’ own production costs for wastewater management has been used. But the information on payments to MWWTP:s for wastewater treatment has not been incorporated. Instead the calculations described above based on the figures from VAV have been used. There are no available statistics or information on how expensive the production of own water is. To get this information special surveys have to be done. In this report a calculation of costs for abstraction of irrigation water in the agricultural sector has been made. In the report ”Irrigation 2000” data about irrigation are available. Farmers mostly produce their own water for irrigation and therefor they are both suppli-ers and users of the water. The report indicated limited changes in used quantities of

24 (24)
water for irrigation within agriculture since 1985. Therefore the prognosis for supply and use in Sweden under 1996 is used as reference to 1995 in this report. The total cost for irrigation is calculated partly from expenses i.e. use of groundwater or surface water, and partly to the need of water if there was a dry summer. The combined fixed and vari-able price for abstraction of groundwater is 1 452 SEK per m3 and 1 362 SEK per m3 for surface water. This resulted in a total cost of 125 million SEK for irrigation during a dry season. The costs for market produced and non-market produced goods and services are de-scribed in Table 5a and 5b.

25 (2
5)
Tabl
e 5a
(fre
sh w
ater
) and
5b
(was
tew
ater
trea
tmen
t) M
onet
ary
data
(199
5) in
mill
ion
SEK
Ta
ble
5aTa
bel 5
bSu
pply
Use
Inve
stm
ents
Supp
lyU
seIn
dust
ryN
AC
EPu
blic
wat
erw
orks
Oth
ers
Publ
ic w
ater
wor
ksM
WW
TP:
sO
wn
(199
7)To
tal
MW
WT
P:s
Ow
n (1
997)
Tota
lIn
vest
men
tsA
gric
ultu
re01
**
Fore
stry
02M
inin
g an
d Q
uarr
ing
10-1
47
44
104
1413
Food
pro
duct
s an
d be
vera
ges
15-1
613
293
9319
193
284
48Te
xtile
s an
d te
xtile
pro
duct
s, le
athe
r pro
duct
s17
-19
128
818
826
15W
ood
and
woo
d pr
oduc
ts20
65
59
514
10Pu
lp, p
aper
and
pap
er p
rodu
cts
2117
383
383
2438
340
753
7Pu
blis
hing
, prin
ting
2213
11
181
1912
Coke
, ref
ined
pet
roliu
m a
nd n
ucle
ar fu
el23
111
112
1113
0Ch
emic
als
and
chem
ical
pro
duct
s24
9613
613
613
913
627
547
Rubb
er a
nd p
last
ic p
rodu
cts
255
11
71
82
Non
-met
allic
min
eral
pro
duct
s26
145
520
525
3Ba
sic
met
als
2744
102
102
6310
216
523
Fabr
icat
ed m
etal
pro
duct
s, e
xcep
t mac
hine
ry a
nd e
quip
mem
t28
2136
3631
3667
57M
achi
nery
and
equ
ipm
ent
2928
99
409
4929
Off
ice
mac
hine
ry a
nd c
ompu
ters
302
00
30
30
Elec
trica
l mac
hine
ry a
nd a
ppar
atus
, rad
io, t
elev
isio
n an
d co
mm
unic
atio
n31
-32
1740
4025
4065
16In
stru
men
ts, w
atch
es a
nd c
lock
s33
51
18
19
0M
otor
veh
icle
s, tr
ansp
ort e
quip
men
t34
-35
3357
5747
5710
411
Oth
er m
anuf
actu
ring
36-3
74
2121
521
263
Not
pos
sibl
e to
dis
aggr
egat
e by
sec
tor
3348
48El
ectri
city
, gas
,ste
am a
nd h
ot w
ater
sup
ply
4034
66
496
5515
Colle
ctio
n, p
urifi
catio
n an
d di
strib
utio
n of
wat
er41
4 12
758
3
Cons
truc
tion
45W
hole
sale
and
reta
il tr
ade
50-5
2H
otel
s an
d re
stur
ants
55Tr
ansp
ort,
stor
age
and
com
mun
icat
ion
60-6
472
810
5610
56Fi
nanc
ial i
nter
med
iatio
n62
Real
est
ate,
rent
ing
and
buis
ness
act
iviti
es71
-74
Publ
ic a
dmin
istr
atio
n75
Oth
er, e
xcl.
90.0
0180
-93
Sew
age
disp
osal
90.0
015
981
5981
1 22
0
Hou
seho
lds
7026
8138
8638
86U
nspe
cifie
d us
e19
428
228
2To
tal c
ost
4 12
74
127
583
5981
919
6900
5 98
191
96
900
2061
* C
ost f
or ir
riga
tion
is 1
25 m
illio
n SE
K a
t a d
ry s
easo
n

26 (26)
Table 5a shows the costs associated with the supply and use of freshwater. Here we see that the total cost of producing the 936,3 Mm3 (Table 2) of the market good freshwater is 4 127 million SEK. These production costs are referred to NACE 41. The second col-umn shows payments from other NACE to NACE 41 for the use of the freshwater. Please note that the lump sum for construction etc include a subsidy from the munici-palities to all other economic sectors of 256 million SEK. Table 5b shows costs associated with wastewater. It could be interpreted as costs asso-ciated with supply and use of the environmental protection service wastewater treat-ment. Total supply of this service consist of the marketed service provided by MWWTP:s and production for own account. The total value of the marketed service is 5 981 million SEK. This is the total cost of production in MWWTP:s for treatment of the total discharge to the public wastewater system. The use column MWWTP show the payments from the users of this service in industry and households, which finance this activity. Please note that the lump sum for construction etc include a subsidy from the municipalities to all other economic sectors of 371 million SEK. The total value of the non-marketed service (ancillary activity) is 919 million SEK and relates to the mining-, manufacturing- and energyindustry only. As this is own produc-tion for own use, by definition, these figures relate to supply and use at the same time and the same figures are therefore entered in both columns.

27 (27)
3.5 Environmental - economic profiles for some manufacturing industries
In this pilot project the focus has been on the framework and data availability for the water accounts. The analyse of the physical and economic data on the use of water and waste water treatment should be further elaborated. In the annex to this report data from SNA showing production value, value added and hours worked is presented for the same NACE groups as in tables 1-5 in the report. Because of the revision of the national accounts it is at the moment not possible to show the full National Accounting Matrix. But at a later stage we will be able to present the data on water together with the Na-tional Accounting Matrix. In this report we give an example of how to present economic and environmental data for the manufacturing industries using the concept with economic-environmental pro-files. The profiles are shown for the three industries which are the main users of water and for ‘all other manufacturing industries’. The results should be further analysed. In the profiles are shown economic data such as production value and value added and input factors such as hours worked, use of energy and use of water. Other data related to water is discharge to water and environmental expenditures and investments related to wastewater treatment. The profile shows the specific industry as part of the total for the whole manufacturing industry.

28 (28)
����������������������������������������������������������������������������
�����������������
0 20 40 60 80 100
�������������������������������������������������������������������������������������������������������������������������������������������������������������������������������������������������������������������������������������������
���������������������������������������������������������������0 20 40 60 80 100
Pulp, paper and paper productsNACE 21
EPE. internal expenditures
Hours worked
Own discharge of water m3
Discharge to MWW TP
Use of energy
EPE , payments to MW W TP
EPI for waste water
Use of non-market prod. water
Other use of water
Use of market prod. water
Use of cooling water
Use of process water
Production value
%
%
Value added
EPE. internal expenditures
Hours worked
Own discharge of water m3
Discharge to MWW TP m3
Use of energy
EPE , payments to MW W TP
EPI for waste water
Use of non-market prod. water
Other use of water
Use of market prod. water
Use of cooling water
Use of process water
Production value
Value added
Basic metalsNACE 27
��������������������������������������������������������������������������������������������������������������������������������������������������������
�������������������������������������������
0 20 40 60 80 100
�����������������������������������������������������������������������������������������������������������������������������������������������������������������������������������������������������������������������������������������������������������������������������������������������������
����������������������������������������������������������������������������������������������������������������������������������
0 20 40 60 80 100
Chemicals and chemical productsNACE 24
Other manufacturing industries
29 (29)
4 DATA SOURCES
4.1 Physical data
Water abstraction and water use The technical description of data sources, compilation methods and data quality is based on whether the water abstraction are made by public waterworks or by private abstrac-tion. Market produced water from public waterworks VAV is yearly collecting statistics on public waterworks and MWWTP:s. A question-naire is send to all municipalities with questions on: • total population • population connected to public water system • population connected to public wastewater system, • water abstraction from groundwater or surface water, • purchase or sale of water to other municipalities, • use of water in industry, households, public use e.g. schools or recreation purpose,
own use in the waterworks and losses • number of waterworks and wastewater treatment plants. • quantity on treated wastewater In the questionnaire for 1995 information was missing from 16 of the 286 municipalities in Sweden. For the missing data Statistics Sweden made estimations by using informa-tion on population and average abstraction and use in the country. In the same question-naire VAV asks about investments, production costs, distribution costs and capital ex-penditure separately for waterworks and wastewater treatment plants. Non-market produced / self supply Most of the water used by the manufacturing industry comes from own private with-drawals only 5 per cent are delivered by the public waterworks. In 1995 Statistics Swe-den carried out a survey to the manufacturing-, mining and electricity, gas, steam and hot water supply industry. The survey covered 930 establishment with 1 280 000 em-ployed and was sent to all industries with considerable water abstraction. For the rest of the establishments (7 512 with 470 900 employed) the abstraction and use of water was estimated by coefficients for industrial sector, among others the size of the establish-ment and use of water by employed . The coefficients are based on a survey on water use in 1983. Of the total use of water in the industry, 90 per cent was used by the 930 establishments in the survey. The results were presented in the Swedish industrial classification 1969, SNI69, and for adjusting the data to environmental accounts a recalculation to NACE rev 1 has been done.

30 (30)
For households not connected to public water systems, which are mostly population in rural areas, estimations on abstraction/use of water are made using the average use (189 litre /day) by person connected to public water supply. This might be a small overesti-mation. Estimation on water use in leisure houses are based on information in the real estate assessment register where there is information on type of real estate and connection to public water and wastewater system. Water abstraction /use of water is estimated by the following coefficients based on a research study by the Royal Institute of Technology in Stockholm. Supplementary table 2.2 Litre/person and day Connection to public
wastewater system Private wastewater system
No wastewater system
Private water supply 200 200 50 Summer water 100 100 50 No water 50 50 50 Each leisure house is assumed to be used by three person during 60 days per year. The use of water in leisure houses is probably underestimated mostly depending on dif-ficulties to enumerate the number of leisure houses. Leisure houses on real estate as-sessed as other type of real estate i.g farm estate, one-family houses, are missing. In the assessment there are 423 000 leisure houses assessed as real estate with buildings but approximately 600 000 buildings are used as leisure houses. In agriculture water is used for irrigation and for the livestock A survey on water used for irrigation in Swedish agriculture was carried out 1985. Af-ter that there has not been any full-scale survey. In 1991 the Swedish board of agricul-ture got an assignment to investigate the future need of irrigation in agriculture and a questionnaire was sent to about 800 farming enterprises. The result from the last survey indicated only limited changes in the quantities used for irrigation compared to 1985, so therefore we have in the statistics on use of water in Sweden used the data from 1985. The data refer to amounts needed in a dry summer. The monetary data on water abstrac-tion for irrigation are based on the preliminary assumptions on costs for irrigation during 1996. The water needed for the livestock is estimated by the number of different animals and their yearly water needs. Data on the number of animals are taken from agricultural sta-tistics

31 (31)
Supplementary table 2.3 Estimated need for water by different livestock m3/year
Dairy cow 30,0 Sucker cows, heifers, Calves 16,0 Horse 16,0 Boars, sows 13,0 Fattening pigs 0,875 Piglets 0,05 Sheep 2,5 Laying hens 0,1 Young fowls, slaughter chickens
0,04
Wastewater treatment and discharge to water By Swedish environmental protection law, all large point sources of emissions to air and water are required to report their main emission parameters in annual environmental reports to their supervision agency, which is generally a local authority. Estimates are generally based on measurement programs. Reporting unit is generally the local plant rather than the enterprise. The supervision agencies are required to deliver copies of the reports to the County administrative boards for the largest plants, referred to as A-plants. Such copies are also delivered to the Swedish Environmental Protection Agency (Swed-ish EPA). Routines for producing statistics from this material differs among industries. Results for the pulp and paper industry are assembled and published annually in a sur-vey conducted by Swedish EPA. These data have also been used in this report. (Swedish EPA 1996b). Emissions have been aggregated for 65 plants whose production methods differ quite a lot. Estimates of nitrogen discharges for some other industries were taken from Swedish EPA (1996b), which actually refers to the year 1994. MWWTP:s are required to produce an environmental report if they serve more than 2 000 persons (or rather i.e. which is in Sweden defined as 70 grams of BOD7 per day). There exist in Sweden almost 500 plants of this type and they are believed to treat more than 90 per cent of the total wastewater. The 25 largest, each serving more than 100 000 i.e. treat around half the water volume. A survey of these plants is usually made every second or third year. Data for this report was taken from such a survey (Statistics Swe-den 1997b). Actually, some treatment parameters are reported annually in the VAV survey on the municipality level, namely the total number of treatment plants (including the small ones), their total volume of treated water as well number of served i.e. In addition to this, VAV asks for the number of people permanently living in the community which are served by the treatment plants. In this report we have shown figures stemming from the large point sources but we have not tried to estimate the pollution content of smaller sources. We have already remarked that something like 10 per cent of the total amount of non-industrial wastewater may fall below the cut-off line for the surveys. Similarly, a non-negligible part of the private in-dustrial discharges might fall outside of the environmental reporting system. Concerning the former category, an effort to estimate its contents of pollution is intended to be made in the current MWWTP survey.

32 (32)
4.2 Monetary data
In Sweden, as in many other countries, the pricing system for freshwater and wastewater services is combined into one price for both services. Enterprises and households are charged a fee related to the amount of water they use, and in that fee the price for wastewater management is included. The fact that expenditure for both freshwater and wastewater are mixed together makes dividing of the costs for each type of service diffi-cult. Four different sources with monetary figures for water and/or wastewater have been analysed and used in the line of this project. • Information in SNA(1995) • Data collected by VAV (1995) • The survey ”Municipal accounts 1995”, made by Statistics Sweden. • The survey ”Environmental protection expenditure in industry 1997” made by Statis-
tics Sweden. The monetary data can be divided between market trade and non-market produced goods and services. Market produced As mentioned in chapter 3.4 the market produced services relate to the trade of the good freshwater and the service wastewater treatment. In SNA, the costs for freshwater and wastewater are mixed together and it is not possible to divide them. SNA uses data from VAV (for the current year) on total costs for freshwater and wastewater, and an old edi-tion of ”Statistics of intermediate consumption” (as distribution key) to divide the total costs between the NACE codes. This means that in SNA there are monetary data related to the total cost for the production of water and wastewater services, and the use of these services in different NACE classes. After discussions with representatives from SNA, it was decided that these are less reliable than the calculations based on physical informa-tion on the use of water made in this project. These could be used in the future for im-provement of SNA data. The procedure of estimating data for the market produced goods and services is summa-rised below. Then a more detailed description of the procedure follows. • Total expenditures are taken from VAV. These data have then been adjusted because
of the existence of inter-public waterworks and non-response. • The expenditures have been broken down by NACE with information on the use of
water by NACE as a distribution key, after adjustments have been made for the pub-lic waterworks own use of water, and the fact that their revenues do not fully cover the costs
VAV collects information on production costs for producing freshwater and wastewater treatment annually. The problem is that all municipalities do not report their costs to VAV, and some municipalities also buy these services from inter-municipal enterprises. So it was necessary to do some adjustments to the data from VAV.

33 (33)
First must all inter-municipal enterprises of freshwater be removed from the data. The reason is that they do not have any customers registered in VAV:s data. Instead they have the different municipalities as customers. It is important for the calculations to see how many registered customers there are to each municipality to be able to adjust the total production cost to those municipalities that do not account for some of the vari-ables. The registered customers are used as distribution key to these costs. Thereafter is it possible to calculate how the costs for public waterworks and MWWTP:s are distrib-uted. The total production costs are shown in Supplementary table 5a.1. These are the basis of the calculations. The distribution of the cost of production within public waterworks and MWWTP:s are on average 40 per cent for public waterworks and 60 per cent for MWWTP:s, and these shares are rather stable according to VAV. This might be used as a distribution key for splitting expenditure in SNA or in the municipal accounts.
Figure 15. Distribution of production costs according to VAV. ����������������������������������������������������������������������������������������������������������������������������������������������������������������������������������������������������������������������������������������
������������������������������������������������������������������������������������������������������������������������������������������������������������������������������������������������������������������������������������������������������������������������������������������������������������������������������������������������������������������������������������������
MWWTP:s59%
Public w aterw orks
41%
From Supplementary table 5a.1Production costs ; Total cos t, million SEK
W aterworks 4 127Sewage treatment 5 981
Total 10 108 The next step is to use the physical data on the use of market produced water as a distri-bution key to divide the costs from VAV between the NACE groups. The public water-works must get coverage for its total expenses though. Therefore own use of water and the rather big amounts of water lost through the water systems should be adjusted for. The amount of water registered on NACE group 41 (180 596 m3) was not incorporated in the total amount of market produced water (936 301 m3). Thereafter the use of mar-ket produced water within each NACE group was divided by the total amount of market produced water (without NACE 41) to get the percentage between the NACE groups as distribution key. The results are described in Table 5a and 5b. In the municipal accounts, data are divided according to purpose/function. One function is water and wastewater. Here there are information on total production costs divided into cost types, total revenue divided by revenue type, and capital expenditure and fi-nancing. The total production cost in the municipal accounts amounts to 9307 million SEK, which could be compared to the 10108 million from VAV. One possible explana-tion for this difference is the treatment of replacement investments. VAV include these in the production costs, while at least those financed via the capital budget is treated as capital expenditure in the municipal accounts. Another possible reason could be that inter-municipal enterprises are incorporated in VAV:s data and not in the municipal accounts.

34 (34)
Figure 16 and supplementary table 5b.1. Estimation of subsidy (1995), in million SEK
93%
7%
Total receipts
Subsidy
Costs and receipts (1995) in million SEKTotal costs 9306,9Total receipts 8659,5Of which:External fee 7332,0External rents 8,7Other external receipts 169,9Internal receipts 1148,8Subsidy 647,5
The production costs for supplying freshwater and wastewater treatment shall in princi-ple be covered through one fee for both services. In reality, the total receipts from the fee do not cover the total costs for producing both services. Information from the mu-nicipal accounts above show that the difference amounts to 7 per cent of the total pro-duction costs. The difference should be regarded as a subsidy and be treated as govern-ment final consumption. The figure below show the quantities and shares of total market produced water by NACE. The shares by NACE have then been adjusted for to take into account the sub-sidy of 7 per cent. This could be seen as a 7 per cent subsidy from the public sector to all other NACE categories. These shares have then been multiplied by the total costs for freshwater and wastewater respectively.

35 (35)
Supplementary table 5b.2; Total intermediate consumption (1995), in million SEK Industry NACE
Market produced water, in thousands m3
Per cent of total market produced
Per cent of total cos t
Cos t for freshwater
Cos t for was tewater Total cost
Agriculture 01Fores try 02Mining and Quarring 10-14 1312 0,002 0,002 7 10 16
Food products and beverages 15-16 25917 0,034 0,032 132 191 322Textiles and textile products , leather products 17-19 2459 0,003 0,003 12 18 31W ood and wood products 20 1249 0,002 0,002 6 9 16Pulp, paper and paper products 21 3327 0,004 0,004 17 24 41Publishing, printing 22 2466 0,003 0,003 13 18 31Coke, refined petrolium and nuclear fuel 23 271 0,000 0,000 1 2 3Chemicals and chemical products 24 18891 0,025 0,023 96 139 235Rubber and plastic products 25 995 0,001 0,001 5 7 12Non-metallic mineral products 26 2716 0,004 0,003 14 20 34Bas ic metals 27 8592 0,011 0,011 44 63 107Fabricated metal products , except machinery and equipmemt 28 4164 0,006 0,005 21 31 52Machinery and equipment 29 5473 0,007 0,007 28 40 68Office machinery and computers 30 406 0,001 0,000 2 3 5Electrical machinery and apparatus , radio, televis ion and communication 31-32 3385 0,004 0,004 17 25 42Instruments , watches and clocks 33 1025 0,001 0,001 5 8 13Motor vehicles , transport equipment 34-35 6446 0,009 0,008 33 47 80Other manufacturing 36-37 695 0,001 0,001 4 5 9Not possible to disaggregate by sector 6469 0,009 0,008 33 48 80Electricity, gas ,s team and hot water supply 40 6681 0,009 0,008 34 49 83Sum Manufacturing Industry 102939 523 758 1280Collection, purification and dis tribution of water 41
Cons truction 45W holesale and retail trade 50-52Hotels and resturants 55Transport, s torage and communication 60-64 86522 0,114 0,176 728 1056 1784Financial intermediation 62Real es tate, renting and buisness activities 71-74Public adminis tration 75Other, excl. 90.001 80-93Sewage disposal 90.001
Households 70 527975 0,699 0,650 2681 3886 6568Unspecified use 38269 0,051 0,047 194 282 476Total cost 755705 1,000 1,000 4127 5981 10108 Another possibility to calculate the costs for freshwater and wastewater distributed be-tween the NACE codes is to use information from VAV on the variable and fixed prices for freshwater. According to VAV the average variable price for freshwater (in 1999) is 13,31 SEK/m3, the fixed cost 2 000 SEK per meter and an assumption of one meter per household or establishment. Together with information on how many customers there are in each NACE group, and how much water they use, it is possible to calculate the distribution of costs within the manufacturing industry (see supplementary table 5b.3).

36 (36)
Supplementary table 5b.3 Calculation and distribution of total costs (1995), in million SEK NACE code Number of es tablishments Amount of water, in thousands m3 Fix cos t in Variable cos t Total cost10-14 153 1312 0 17 1815-16 847 25917 2 345 34717-19 310 2459 1 33 3320 668 1249 1 17 1821 246 3327 0 44 4522 850 2466 2 33 3523 13 271 0 4 424 350 18891 1 251 25225 304 995 1 13 1426 389 2716 1 36 3727 227 8592 0 114 11528 1174 4164 2 55 5829 1151 5473 2 73 7530 54 406 0 5 631-32 458 3385 1 45 4633 186 1025 0 14 1434-35 400 6446 1 86 8736-37 413 695 1 9 1040 207 6681 0 89 89Other NA CE 42 643 0 9 9Total 8442 97111 17 1293 1309 The distribution of freshwater and wastewater costs among the NACE codes vary only slightly between the different calculations. The information on how the costs are dis-tributed within the manufacturing industry is rather good, while a detailed distribution outside the manufacturing industry is much more difficult to make. Non-market produced Information on own produced services for own use are more difficult to get. For waste-water there is information in the survey of environmental protection expenditure in in-dustry 1997. This survey includes all current and capital expenditure in enterprises within the environmental domain wastewater. This includes expenditure for measures which aim to reduce emissions to water in general, not only expenditure related to wastewater treatment. Current expenditure includes both payments for external services (to MWWTP:s), and expenditure in the form of energy, chemicals and labour linked with own treatment. Total current expenditure amounted to 1094 million SEK. Expenditure for internal measures equalled 919 million, and payments of wastewater charges only amounted to 175 million SEK. The latter is an underestimation. This is partly because many enter-prises did not conceive of the water(wastewater) charges as part of environmental pro-tection expenditure, partly because of the difficulties to separate the wastewater part. The payments of 175 million could be compared with the calculations from VAV which equalled 758 million for these industries. But it should be noted that 35 per cent of the VAV expenditure relates to consumption of fixed capital. This was not included in the expenditure survey. In this project we have decided to use VAV as data source for payments, and comple-ment this with information on internal measures and investments from the 1997 industry survey. It might be possible to exclude payments of wastewater charges from the indus-try survey in the future, and instead calculate this in a similar fashion as presented in this report.

37 (37)
Supplementary table 5b.4 Data from "Environmental protection expenditure in industry" (1997), in million SEK Industry NACE Own Payed Total cos t Inves tmentsMining and Quarring 10-14 4 1 5 13
Food products and beverages 15-16 93 71 164 48Textiles and textile products , leather products 17-19 8 26 34 15W ood and wood products 20 5 3 8 10Pulp, paper and paper products 21 383 5 387 537Publishing, printing 22 1 1 2 12Coke, refined petrolium and nuclear fuel 23 11 0 11 0Chemicals and chemical products 24 136 11 148 47Rubber and plas tic products 25 1 2 3 2Non-metallic mineral products 26 5 4 9 3Basic metals 27 102 10 112 23Fabricated metal products , except machinery and equipmemt 28 36 7 43 57Machinery and equipment 29 9 6 15 29Office machinery and computers 30 0 0 1 0Electrical machinery and apparatus , radio, televis ion and communication 31-32 40 6 46 16Instruments , watches and clocks 33 1 3 4 0Motor vehicles , transport equipment 34-35 57 8 65 11Other manufacturing 36 21 6 28 3Not poss ible to disaggregate by sectorElectricity, gas ,s team and hot water supply 40 6 5 11 15Total cost 919 175 1094 840
Agriculture As mentioned in chapter 3.4 calculations of costs in the agricultural sector have been made. In the report ”Irrigation 2000” information about use of waster within agriculture is available. A survey on water used for irrigation in Swedish agriculture was carried out 1985. After that there has not been any full-scale survey. In 1991 the Swedish National Board of Agriculture got an assignment to investigate the future need of irrigation in agriculture and a questionnaire was sent to about 800 farming enterprises. The result from the last survey indicated only limited changes in the quantities used for irrigation since 1985. The figures used in this study, to estimate the cost for irrigation under 1995, are those estimated for a dry season under 1996 in ”Irrigation 2000”. The reason is that there are indications that changes between the years was limited. The area in 1996 which needed irrigation was estimated to 56 000 hectares at a normal year and around 90 000 at a dry year. The distribution between the types of water was estimated to be around ¾ surface water and ¼ groundwater.

38 (38)
Figure 17. Irrigated area (1996)
0100002000030000400005000060000700008000090000
100000
Normalyear
Dryyear
Type of year
Hec
tare
Ground water
Surfacewater
The total costs for irrigation depends partly on the variable and fixed costs and partly on type of water abstraction (surface water/groundwater). For surface water the fixed cost per hectare is 1 100 SEK and the variable cost is 262 SEK per hectare. For groundwater 1 200 SEK per hectare for fixed cost and 252 SEK per hectare for the variable cost. The total cost per hectare is then 1 362 SEK for surface water and 1 452 SEK for groundwa-ter. The total costs for irrigation could then be estimated to 78 million SEK for a normal year (minimum of irrigation) and 125 million SEK for a dry year (maximum of irriga-tion).
Figure 18. Total costs for irrigation (1996)
0
20000
40000
60000
80000
100000
120000
140000
Normalyear
Dryyear
Type of year
Tot
al c
ost
Groundwater
Surface water
1000 SEK

39 (39)
5. CONCLUSION AND FUTURE WORK The objective of the project has been to do pilot work on developing environmental ac-counts for water in Sweden. To set up and test a framework for abstraction and use of water, generation and treatment of wastewater, and to investigate data availability, both as regards physical and monetary data. We have used the NAMEA framework for the water accounts and found it a very useful tool to analyse the physical flows of water and to link economic data to the physical flows. In the project we have focused on setting up supply and use tables for physical and monetary data on water abstraction, use of water, waste water generation and waste water treatment. In the line of this project it has only been possible to give a few exam-ples of indicators combining physical and monetary data. These results have to be fur-ther analysed in follow-up work. By using available data from many different sources we have been able to evaluate defi-ciencies in the different statistical sources. One main result is that our work with physi-cal data on water use will most likely be used to improve the information in SNA on expenditures for intermediate consumption of water and wastewater treatment services. It is also likely that the estimations of payments of wastewater charges from the manu-facturing industries will be used as input into environmental protection expenditure sta-tistics in the near future. So far we have compiled data for one single year but the objec-tive is to develop time series combining physical and monetary data. This would allow a test of the soundness of some of the estimations made in this project, in particular as regards the monetary data. There are still data gaps on the use of water and discharge to water for other industries than the manufacturing industry. Some of these industries can be important regarding both use and discharge to water e.g. Petrol stations /car wash (NACE 50.5) and Live stock slaughtering (NACE 15.11). These industries do not have top priority in the na-tional surveys of environmental reports. There are no data on discharge to water from households not connected to the public wastewater system and we will have to further investigate if there are reliable coefficients that we can use for estimations of emissions of nitrogen and phosphorus. In future work on water accounts, we will continue to develop the supply and use tables. Having traced some of the deficiencies in the basic environmental statistics that have been used in the water accounts, it is in the future important to try to influence the forth-coming statistical investigations to be better adopted to the needs for the water accounts. Today there is no information on water resources, or water quality, or abstraction, linked to areas with excess or scarcity of water, this regional disaggregation would be very use-ful to develop in the accounts in the future.
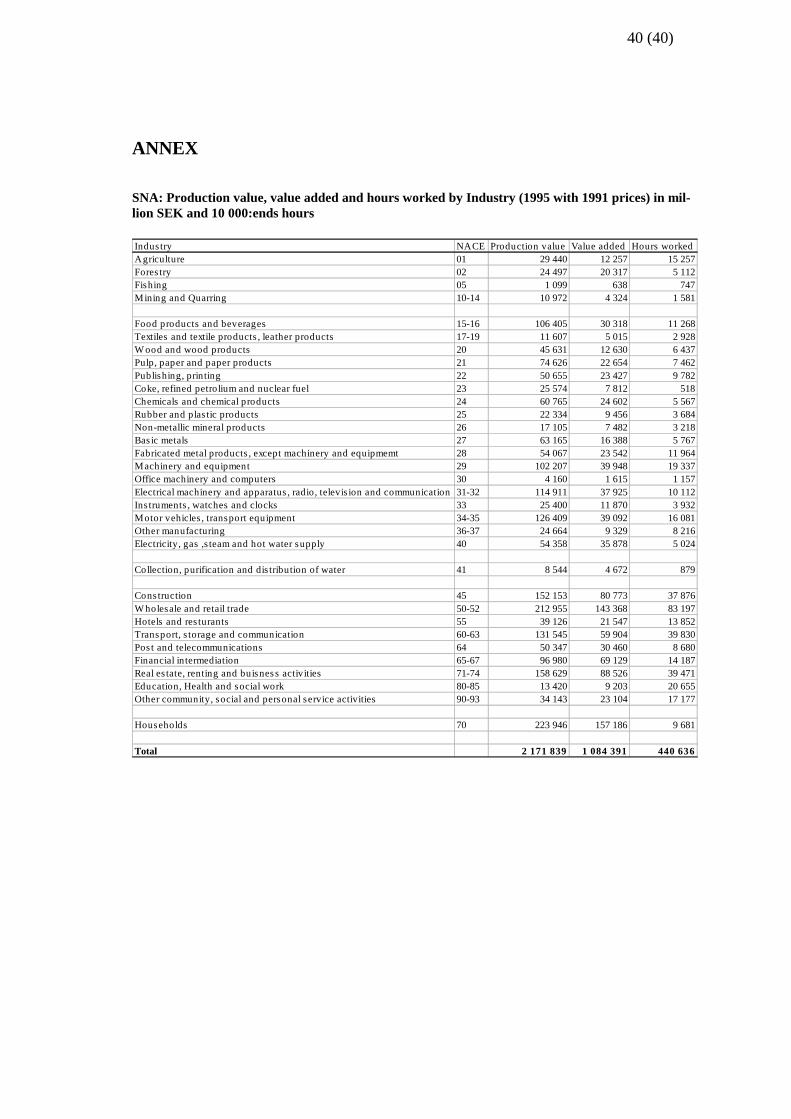
40 (40)
ANNEX SNA: Production value, value added and hours worked by Industry (1995 with 1991 prices) in mil-lion SEK and 10 000:ends hours Indus try NACE Production value Value added Hours workedAgriculture 01 29 440 12 257 15 257Fores try 02 24 497 20 317 5 112Fishing 05 1 099 638 747Mining and Quarring 10-14 10 972 4 324 1 581
Food products and beverages 15-16 106 405 30 318 11 268Textiles and textile products , leather products 17-19 11 607 5 015 2 928W ood and wood products 20 45 631 12 630 6 437Pulp, paper and paper products 21 74 626 22 654 7 462Publishing, printing 22 50 655 23 427 9 782Coke, refined petrolium and nuclear fuel 23 25 574 7 812 518Chemicals and chemical products 24 60 765 24 602 5 567Rubber and plas tic products 25 22 334 9 456 3 684Non-metallic mineral products 26 17 105 7 482 3 218Bas ic metals 27 63 165 16 388 5 767Fabricated metal products , except machinery and equipmemt 28 54 067 23 542 11 964Machinery and equipment 29 102 207 39 948 19 337Office machinery and computers 30 4 160 1 615 1 157Electrical machinery and apparatus , radio, televis ion and communication 31-32 114 911 37 925 10 112Ins truments , watches and clocks 33 25 400 11 870 3 932Motor vehicles , transport equipment 34-35 126 409 39 092 16 081Other manufacturing 36-37 24 664 9 329 8 216Electricity, gas ,s team and hot water supply 40 54 358 35 878 5 024
Collection, purification and dis tribution of water 41 8 544 4 672 879
Cons truction 45 152 153 80 773 37 876W holesale and retail trade 50-52 212 955 143 368 83 197Hotels and res turants 55 39 126 21 547 13 852Transport, s torage and communication 60-63 131 545 59 904 39 830Pos t and telecommunications 64 50 347 30 460 8 680Financial intermediation 65-67 96 980 69 129 14 187Real es tate, renting and buisnes s activities 71-74 158 629 88 526 39 471Education, Health and social work 80-85 13 420 9 203 20 655Other community, social and personal service activities 90-93 34 143 23 104 17 177
Households 70 223 946 157 186 9 681
Total 2 171 839 1 084 391 440 636

41 (41)
REFERENCES !!!! Books and publications National accounts (1995), Input-output tables - preliminary data National Atlas of Sweden (1995), Climte, Lakes and Rivers Statistics Denmark (1999), NAMEA with water extraction and use Statistics Sweden (1996a), Municipal accounts 1995 (in Swedish) Statistics Sweden (1996b), Water use in the Swedish industry 1995 Na 16 SM 9601 (in Swedish) Statistics Sweden (1997a), National accounts 1980-1996 N 10 SM 9701 (in Swedish) Statistics Sweden (1997b), Discharges to water and sludge production in 1995. Munici-pal waste water and some coastal industry. Na 22 SM 9701 (in Swedish) Statistics Sweden (1999), Environmental protection expenditure in industry 1997 - re-sults of a Swedish pilot study (in Swedish) Statistics Sweden (1999), Statistical Yearbook of Sweden 2000 (in Swedish) Statistics Sweden (1999), Waterwithdrawal and water use in Sweden 1995 Mi 27 SM9901 (in Swedish) Swedish EPA and Statistics Sweden (1998), State of environment in lakes and water-courses Na 39 SM 9801 (in Swedish) Swedish National Board of Agriculture (1992), Irrigation 2000 (in Swedish) Swedish Water and Wastewater Association (1997), Waterworks and wastewater treat-ment plants 1995 VAV S95 (in Swedish) Swedish EPA (1996a), Large Point Sources Report 4587 (in Swedish., Annex 1, page 3-4) Swedish EPA (1996b), Emissions to water and air from the pulp and paper industry in 1995 Report 4657 (in Swedish.) Internetaddresses Swedish EnviroNet (http://smn.environ.se) The Swedish Water and Wastewater association (http://www.vav.se)