Embed Size (px)
Citation preview
The World Health Organization was established in 1948 as a specialized agency of theUnited Nations serving as the directing and coordinating authority for international healthmatters and public health. One of WHO’s constitutional functions is to provide objectiveand reliable information and advice in the field of human health, a responsibility that itfulfils in part through its publications programmes. Through its publications, the Organi-zation seeks to support national health strategies and address the most pressing publichealth concerns.
The WHO Regional Office for Europe is one of six regional offices throughout theworld, each with its own programme geared to the particular health problems of thecountries it serves. The European Region embraces some 870 million people living in anarea stretching from Greenland in the north and the Mediterranean in the south to thePacific shores of the Russian Federation. The European programme of WHO thereforeconcentrates both on the problems associated with industrial and post-industrial societyand on those faced by the emerging democracies of central and eastern Europe and theformer USSR.
To ensure the widest possible availability of authoritative information and guidance onhealth matters, WHO secures broad international distribution of its publications andencourages their translation and adaptation. By helping to promote and protect health andprevent and control disease, WHO’s books contribute to achieving the Organization’sprincipal objective – the attainment by all people of the highest possible level of health.
The European Environment Agency is one of 12 specialized EU agencies located in thevarious member states. EEA and the related European Environmental Information andObservation Network (EIONET) were conceived to deliver improved data on theenvironment and to contribute to the availability of better information for environmentalpolicy-making.
EEA and EIONET were set up on the basis of EC Regulation 1210/ 90, adopted in May1990 and revised in 1999. EIONET includes five European Topic Centres covering water,air and climate change, waste and material flows, terrestrial environment, and natureprotection and biodiversity. Where necessary, EEA buys in expertise for projects from allover Europe.
According to its mission statement, “the Agency aims to support sustainable developmentand to help achieve significant and measurable improvement in Europe’s environmentthrough the provision of timely, targeted, relevant and reliable information to policy-making agents and the public”. This must be done using existing data and information,building on and improving existing capacities in member states and European institutions.
No matter how thoroughly data are logged and amassed, they cannot be useful untilselected, pooled and organized with known end-users in mind. The EEA acts as aninterface between data producers and information users by producing information thatcan then be put to work.
The geographical scope of the EEA’s work is not confined to the EU member states. Mostof the EFTA countries were members from the outset, and as of May 2002 most of theaccession countries have joined the EEA as full members, making the agency the first EUbody to include these countries. Enlargement will increase the number of EEA membercountries from 18 to 31. The Agency also maintains close cooperation with internationalorganizations such as UNEP and WHO.
Water and healthin Europe
A joint report from the European EnvironmentAgency and the WHO Regional Office for Europe
Text editing: David Breuer/Frank TheakstonCover design: Sven LundCover illustration: Patricija Kavaliauskaite, 5 years old, Kindergarten “Zilvitis”,Jonava, Lithuania. This school participates in the European Network of HealthPromoting Schools, a joint project of the European Commission, the Councilof Europe and the WHO Regional Office for Europe.
WHO Library Cataloguing in Publication Data
Water and health in Europe : a joint report from the EuropeanEnvironment Agency and the WHO Regional Office for Europe /edited by Jamie Bartram...[et al.]
(WHO regional publications. European series ; No. 93)
1.Water supply 2.Potable water 3.Water quality4.Water purification 5.Water microbiology 6.Water pollution,Chemical 7.Legislation 8.Europe I.Series II.Bartram, JamieIII.Thyssen, Niels IV.Gowers, Alison V.Pond, KathyVI.Lack, Tim
ISBN 92 890 1360 5 (NLM Classification: WA 675)ISSN 0378-2255
Water and healthin Europe
A joint report from the European EnvironmentAgency and the WHO Regional Office for Europe
Edited byJamie Bartram, Niels Thyssen, Alison Gowers,
Kathy Pond and Tim Lack
WHO Regional PublicationsEuropean Series, No. 93
The Regional Office for Europe of the World Health Organizationwelcomes requests for permission to reproduce or translate its pub-lications, in part or in full. Applications and enquiries should beaddressed to the Publications unit, WHO Regional Office for Eu-rope, Scherf igsvej 8, DK-2100 Copenhagen Ø, Denmark, whichwill be glad to provide the latest information on any changes madeto the text, plans for new editions, and reprints and translations al-ready available.
© World Health Organization 2002
Publications of the World Health Organization enjoy copyright pro-tection in accordance with the provisions of Protocol 2 of the Uni-versal Copyright Convention. All rights reserved.
The designations employed and the presentation of the material, in-cluding any maps, in this publication do not imply the expression ofany opinion whatsoever on the part of the Secretariat of the WorldHealth Organization or of the European Environment Agency con-cerning the legal status of any country, territory, city or area or of itsauthorities, or concerning the delimitation of its frontiers or bounda-ries. Dotted lines in maps represent approximate border lines forwhich there may not be full agreement. The names of countries orareas used in this publication are those that obtained at the time theoriginal language edition of the book was prepared.
The mention of specific companies or of certain manufacturers’ prod-ucts does not imply that they are endorsed or recommended by theWorld Health Organization in preference to others of a similar na-ture that are not mentioned. Errors and omissions excepted, the namesof proprietary products are distinguished by initial capital letters.
The views expressed in this publication are those of the authors/contributors and do not necessarily represent the decisions or thestated policy of the World Health Organization or the European En-vironment Agency.
PRINTED IN FINLAND
ISBN 92 890 1360 5ISSN 0378-2255
Page
Foreword ........................................................................................... vii
Executive summary .......................................................................... xi
Data collection ...............................................................................xvii
Acknowledgements ........................................................................xix
1. Introduction ................................................................................... 1
2. European water resources ............................................................ 7
3. Driving forces and pressures on water resources .................... 47
4. Access to safe water ................................................................... 75
5. Health effects ............................................................................103
6. Present policies .........................................................................161
7. International, administrative and legal initiatives ..................187
References ......................................................................................205
Contents
Profound pressures on Europe’s water resources affect health, theeconomy and sustainable development. Industrialization, intensifi-cation of agriculture, growing populations and increases in recrea-tional demands accentuate the necessity for sufficient high-qualitywater resources. Conflicts between uses and users, coupled with theoccurrence of natural disasters such as droughts and floods, high-light the need for sustainable management of water. Universal accessto safe drinking-water and sanitation that protect human health and theenvironment is of primary concern in the pursuit of health and develop-ment. Nevertheless, water-related diseases occur throughout Europe,to which rural populations, socially excluded people and populationsin areas affected by armed hostilities are especially vulnerable.
Although some aspects of water quality and supply have improvedin some countries over the last decade, progress has been variable.Renewed emphasis is being placed on microbial quality and the ac-knowledgement of previously unrecognized and re-emerging microbialand other hazards. Many of the suggested solutions are as applicabletoday as they were a decade ago. However, major changes in adminis-trative arrangements affected many countries in Europe in the 1990s,including the supply of water and sanitation services, land-use activi-ties, pollution control and activities related to public health surveillance.
WHO’S current health for all policy framework for the EuropeanRegion is based on solidarity and a multisectoral approach to health,
Foreword
vii
VIII
stating that “population exposure to physical, microbial and chemi-cal contaminants in water, air, waste and soil that are hazardous tohealth should be substantially reduced, according to the timetableand reduction rates stated in national environment and health ac-tion plans”. But health is also a human right, which presupposesthat the prerequisites for health – of which sufficient quantities ofgood-quality drinking-water is one – are also a human right.
The European Union’s fifth programme of policy and action in rela-tion to the environment and sustainable development, from 1993,set targets for groundwater protection up to 2000. These includepreventing permanent excess abstraction and all pollution by pointsources and reducing diffuse source pollution. Water resources acrossEurope are shared and connected across national boundaries, andinternational cooperation therefore needs to be promoted to sustainEurope’s water resources and to provide safe water for its inhabit-ants.
Partnerships and action were key themes of the Third MinisterialConference on Environment and Health, held in London in June1999. To this end the WHO Regional Office for Europe, in partner-ship with the United Nations Economic Commission for Europe, pre-pared a new Protocol on Water and Health to the 1992 Conventionon the Protection and Use of Transboundary Watercourses and In-ternational Lakes. The Protocol was approved at the Conferenceand requires its signatories to take account of human health, waterresources and sustainable development. This publication providesinformation on many of the issues covered by the Protocol, such asadequate supplies of drinking-water and sanitation, water for irri-gation and recreational use, monitoring of hazards, and public par-ticipation in decision-making. The evidence presented was collectedthrough an extensive coordinated data-gathering process, in whichmany organizations and individuals throughout the European Re-gion have cooperated.
This publication takes forward some of the issues raised in Environ-ment and health 1. Overview and main European issues, jointly pub-lished by the Regional Office and the European Environment Agency,which highlighted the importance of the quality and availability ofwater in improving health. It is aimed at a broad readership and is
IX
intended to present the key issues in a format that can be appreci-ated by policy-makers, professionals and the general public alike.
The 21st century will present a number of challenges to the aquaticenvironment. A coordinated approach to data collection, processingand management in Europe to support decision-making and to im-prove the reliability of environmental information will be essential tomeet these challenges. I look forward to continuing successful co-operation between the Regional Office and the European Environ-ment Agency.
Marc DanzonWHO Regional Directorfor Europe
Domingo Jiménez-BeltránExecutive DirectorEuropean Environment Agency
Shortage of water may be the most urgent health problem currentlyfacing some European countries, exacerbated by geography, geol-ogy and hydrology. In addition, climate change is predicted to havean influence, especially in coastal areas where flooding may disruptsanitation infrastructure and thereby contaminate watercourses. Al-though many parts of Europe are currently well provided with freshwater, the water resources are unevenly distributed between andwithin countries, leading to shortages in many areas. The countriesthat are heavily populated and receive only moderate rainfall areparticularly affected. Groundwater and surface water have a limitedcapacity for renewal, and pressures from agriculture, industry anddomestic users affect the quantity of water resources. Both waterquality and availability must therefore be integrated in long-termplanning and policy implications concerning water management.
The extent of provision of piped drinking-water supplies to house-holds varies across Europe and between urban and rural populations,with rural populations in the eastern part of the WHO EuropeanRegion least well provided. Continuity of supply is also a problemin some areas. Inefficient use of water resulting from factors such asnetwork leakage and inappropriate irrigation appears to be a signifi-cant problem.
The utilization of water for irrigation and for industry exerts pres-sure on water resources, which vary widely between countries and
Executive summary
xi
regions. One of the biggest pressures is agriculture and changes inirrigation practices. Agriculture accounts for approximately 30% oftotal water abstraction and about 55% of consumptive water use inEurope.
Population distribution and density are key factors influencing thequantity of water resources, through increased local demand for waterin areas of high population density or limited precipitation.
Although high standards have been reached in some countries, out-breaks of waterborne diseases continue to occur across Europe, andminor supply problems are encountered in all countries. The imme-diate area of public health concern is microbial contamination, whichcan affect large numbers of people. The standard of treatment anddisinfection of drinking-water is inconsistent across Europe and,especially where economic and political changes have led toinfrastructural deterioration, can be insufficient. It appears that anincreased number of outbreaks of waterborne diseases have occurredin countries and areas that have experienced recent breakdowns ofinfrastructure, resulting in discontinuous supply. Nevertheless, reli-able data are lacking on the quality of the source water and the drink-ing-water supplied, and the detection and investigation of outbreaksare generally poor in most countries.
Inadequate sewerage systems are a significant threat to public health.A number of countries identify private and small public supplies asthose most liable to receive insufficient treatment or to have insuffi-cient protection for groundwater sources, and thus to be of poorquality. Poor infrastructure may be associated with financial con-straints and/or organizational disruption. Nevertheless, the installa-tion of advanced treatment works in large supplies is increasing inmany countries, although occasional outbreaks of waterborne dis-eases are reported even in countries with high standards of supply.No clear trends are detectable, however, and international compara-bility of data is poor, hindering the development of regional assess-ments and evaluation of progress.
Numerous chemicals are found throughout the aquatic environment,but evidence of any effect on human health, except for effects aris-ing from accidental releases, is often difficult to obtain. Problems of
XII
significant chemical contamination are often localized and may beinfluenced by geology or anthropogenic contamination. Concernabout the effect of agriculture on the quality of water resources isoften related to diffuse sources – contamination by agricultural chemi-cals, nutrients and microbial pathogens in particular.
Eutrophication is a major threat to European surface waters. Com-mon fertilizers contain varying proportions of nitrogen, phosphorusand potassium. The use of fertilizers varies between countries, de-pending on the economic situation and predominant agriculturalpractices. Although such point sources of pollution as sewage dis-charges may contribute significantly to nutrient enrichment in someregions, diffuse sources – particularly agriculture – are the majorcontributors. In some countries, the proportion of water pollutioncaused by diffuse sources is steadily increasing.
Industrial demand and effects on water quality may be especiallypertinent to urban areas with high populations, as industry is tradi-tionally located in these areas. The amount of water used by indus-try and the proportion of total abstraction accounted for by industryvary greatly between countries. Abstraction for industrial purposesin Europe seems to have been decreasing since 1980. Industrial proc-esses produce contaminated wastewater that may be released intomarine and fresh surface waters, either directly or following treat-ment. Contamination may persist for several decades.
Considerable evidence has accrued linking the quality of bathingwater with minor illnesses. The use of water for recreational activi-ties is intrinsically linked to economics through the tourism indus-try, and the quality of such water is thus of considerable importanceto tourism-dependent communities.
Although some improvements have been made over the past dec-ade, coordinated efforts are still needed to ensure that Europe’s popu-lation is supplied with wholesome and clean drinking-water and hasaccess to safe recreational water. These include measures to controldemand and to prevent, contain and reduce contamination by im-proving water and sanitation management at the international, na-tional and local levels. One particular problem that has beenhighlighted in compiling this publication is the need to harmonize
XIII
monitoring procedures where possible. Incorporating education andawareness initiatives is pivotal to the success of improved and har-monized monitoring programmes and to ensuring the safe use ofwater.
Additional efforts are required to sustain the European Region’s waterresources and to provide safe water for its inhabitants, both for drink-ing and for other purposes. Irrigation, drinking-water supply, indus-try, agriculture and leisure make competing demands on the qualityand quantity of these resources, in addition to the need for water tomaintain the aquatic ecosystem per se. Management of water hasbecome fragmented because of the existence of diverse stakeholdersand regulatory perspectives. Pollution control measures have tradi-tionally targeted point rather than diffuse sources of pollution.
Trends in water management in Europe include moves towards catch-ment-level management, improved intersectoral coordination andcooperation, and frameworks facilitating stakeholder participation.This approach is developed by the European Union in its WaterFramework Directive, which sets targets for good ecological statusfor all types of surface water bodies and good quantitative status forgroundwater.
The roles of government and especially the private sector in watermanagement, and in drinking-water supply and sanitation in par-ticular, are being radically reappraised. The extent of this varies acrossEurope. International action plans and conventions have been agreedon, with targets for reducing pollution and measures necessary toreach the targets.
Partnerships and cooperation are needed between the environmentand health sectors at all levels of government to disseminate tech-nology, to improve management and to provide financial and insti-tutional support to ensure access to safe water and sanitation for all.Integrated management systems must be adopted to ensure that theconflicting uses are managed in an effective manner to ensure safeuse. Not only should long-term management be considered, but re-sponses are required to unexpected events such as natural disastersor accidents with large-scale effects that can heavily influence thequality and quantity of water used for consumption.
XIV
Experience suggests that international management agreements de-velop most rapidly when a body of water is shared or bordered by asmall number of countries at a similar level of economic develop-ment. The Convention on the Protection and Use of TransboundaryWaters and International Lakes provides a strong focus for futureintegrated management of water bodies.
This publication aims to integrate this information on the state of theraw water sources with information gathered on the quality and pro-vision of potable water and the impact on human health. The state ofwater resources in Europe has been reviewed, considering both avail-ability and quality. This book assesses the accessibility and qualityof potable supply across the Region and describes the public healthimplications of inadequate and contaminated sources.
XV
Published sources and collections of data were used to collate informa-tion on geographical features (land area, area under agriculture, irri-gated area), water resources (availability and use) and water and sewerageinfrastructures. EEA National Focal Points were asked to validate thedata collected on their countries and to fill in any gaps, where possible.
At the same time, a questionnaire in two parts was sent to WHO countrycontacts. The first part requested information relating to drinking-watersupply, including the regulatory infrastructure and monitoring require-ments. Detailed information on the concentrations of certain param-eters (nitrate, fluoride, arsenic, pesticides, total coliforms, faecal coliformsand faecal streptococci) was requested. General comments on contami-nants that posed particular problems and any problems affecting thequality or continuity of supply were also sought. The second part of thequestionnaire related to waterborne diseases. Detailed information wasrequested on the recorded incidence of and deaths from specific dis-eases (methaemoglobinaemia, dental and skeletal fluorosis,crytosporidiosis, giardiasis, hepatitis A, cholera, typhoid fever, amoebicdysentery, bacterial dysentery, amoebic meningo-encephalitis, severediarrhoea and gastroenteritis) and any outbreaks or cases linked todrinking-water. General comments on any major problems in prevent-ing waterborne diseases were also requested.
In countries where there was only one contact (EEA or WHO), thesewere asked to address both the questionnaire and the data on
Data collection
xvii

environmental features. In addition, contacts were asked to submitany reports or other information that would be of use in researchingthe project, and many volunteered information from their own ex-perience.
In addition to the data collected specifically for this book, existingdata holdings and published sources and texts were widely used asthe basis for the more general sections.
XVIII
Representatives of all Member States of the WHO European Regionwere invited to complete a questionnaire on aspects of drinking-water quality and waterborne diseases and to provide national re-ports, where available. Replies were received from just over half theMember States. Information on aspects of water resources and in-frastructure and general data relating to land use and populationwere also requested. Published literature and previous assessmentsby the European Environment Agency were used extensively in pre-paring this publication. The current members of the Agency are the15 European Union countries plus Iceland, Liechtenstein and Nor-way, whereas the WHO European Region is much larger (see tablebelow). Respondents to the questionnaire, together with other ex-perts from all Member States of the European Region were invited toreview the first draft; the contributions of the individuals concernedwere central to completion of the work and are much appreciated.
CONTRIBUTORS OF DATA
G. Deliu, National Environment Agency, AlbaniaB. Reme & M. Afezolli, Ministry of Health and Environment, AlbaniaC. Vendrell Serra & M. Coll, Ministry of Health and Welfare, AndorraJ.-P. Klein, Federal Ministry of Labour, Health and Social Affairs,
AustriaK. Kranner, Bundeskanzleramt, Austria
Acknowledgements
xix
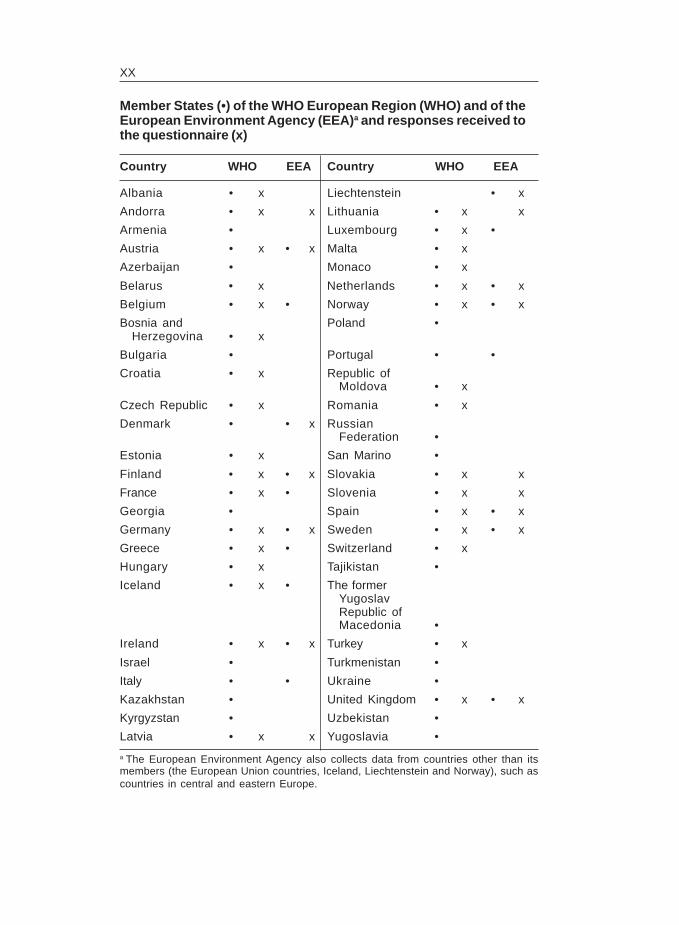
Member States (•) of the WHO European Region (WHO) and of theEuropean Environment Agency (EEA)a and responses received tothe questionnaire (x)
Country WHO EEA Country WHO EEA
Albania • x Liechtenstein • x
Andorra • x x Lithuania • x x
Armenia • Luxembourg • x •
Austria • x • x Malta • x
Azerbaijan • Monaco • x
Belarus • x Netherlands • x • x
Belgium • x • Norway • x • x
Bosnia and Poland •Herzegovina • x
Bulgaria • Portugal • •
Croatia • x Republic ofMoldova • x
Czech Republic • x Romania • x
Denmark • • x RussianFederation •
Estonia • x San Marino •
Finland • x • x Slovakia • x x
France • x • Slovenia • x x
Georgia • Spain • x • x
Germany • x • x Sweden • x • x
Greece • x • Switzerland • x
Hungary • x Tajikistan •
Iceland • x • The formerYugoslavRepublic ofMacedonia •
Ireland • x • x Turkey • x
Israel • Turkmenistan •
Italy • • Ukraine •
Kazakhstan • United Kingdom • x • x
Kyrgyzstan • Uzbekistan •
Latvia • x x Yugoslavia •
a The European Environment Agency also collects data from countries other than itsmembers (the European Union countries, Iceland, Liechtenstein and Norway), such ascountries in central and eastern Europe.
XX
F. Delloye, Direction générale des Ressources naturelles et del’Environnement, Belgium
K. De Schrijver, Health Inspection, BelgiumD. D’Hont Lin, Aminal-Water, BelgiumMinistry for the Wallonia Region, BelgiumA. Teller, Cellule interrégionale de l’Environnement, BelgiumB. Ljubic, Minister of Health, Bosnia and HerzegovinaK. Capak, S. Sobot & B. Borcic, Croatian National Institute of Public
Health, CroatiaR.N.B. Havlik, Ministry of Health, Czech RepublicT. Trei & S. Tarum, National Board for Health Protection, EstoniaP. Ahola, Ministry of Social Affairs and Health, FinlandO. Zacheus, National Public Health Institute, FinlandJ.L. Godet & M. Isnard, Ministry of Health, FranceB. Clark, H. Hoering & F. Schiller, Umweltbundesamt, GermanyM. Kramer, M. Exner & G. Quade, Rheinische Friedrich-Wilhelms-
Universität, GermanyH.M. Römer, Bundesministerium für Gesundheit, GermanyS. Kitsou & V. Karaouli, Ministry of Health and Welfare, GreeceM. Csanady, National Institute of Public Health, HungaryG. Steinn Jonsson, Environmental and Food Agency, IcelandT. Power, Department of Health, IrelandL. Drozdova, National Environmental Health Centre, LatviaMinistry of Welfare, LatviaAmt für Lebensmittelkontrolle, LiechtensteinI. Drulyte, National Nutrition Centre, LithuaniaR. Petkevicius, Institute of Hygiene, Centre of Environmental Medi-
cine, LithuaniaA. Zegrebneviene, Communicable Diseases Prevention and Control
Centre, LithuaniaP. Hau, Division of Sanitary Inspection, Directorate of Public Health,
LuxembourgL. Licari, Department of Health Policy and Planning, MaltaR. Fillon, Ministre d’Etat, MonacoC. Gastaud, Direction de l’Action sanitaire et sociale, MonacoMr Viora, Service du Contrôle technique et de la Circulation, MonacoJ.F.M. Versteegh, National Institute of Public Health and the Envi-
ronment, NetherlandsT. Krogh, C. F. Nordheim & V. Lund, National Institute of Public
Health, Norway
XXI
v
P. Torgersen, Norwegian Board of Health, NorwayI. Abreu, Ministry of Health, PortugalN. Opopol, Ministry of Health, Republic of MoldovaA. Dumitrescu & I. Iacob, Institute of Public Health, RomaniaH. Zajicova, Water Research Institute, SlovakiaMinistry of Health, SlovakiaM. Macarol-Hiti & M. Jereb, Ministry of Health, SloveniaO. Tello Anchuela, Istituto de Salud “Carlos III”, SpainP.A. Garcia González, Ministry of Health and Consumer Affairs, SpainM. Eriksson & H. Wahren, National Board of Health and Welfare,
SwedenB. de Jong, Swedish Institute for Infectious Diseases, SwedenM. Wiman, Swedish Environmental Protection Agency, SwedenP. Grolimund, Swiss Agency for the Environment, Forests and Land-
scape, SwitzerlandP. Studer, Swiss Federal Office of Public Health, SwitzerlandE. Mitchell, Department of Health and Social Services, Northern Ire-
land, United KingdomR. Scott, Drinking Water Inspectorate, Northern Ireland, United
KingdomT. Hooton, Agriculture, Environment and Fisheries Department, Scot-
tish Executive, Scotland, United KingdomS. Pescold, Water Services Unit, Scotland, United KingdomK. Andrews, S. Nixon & H. Horth, Water Research Centre, United
KingdomF. Pollitt, Department of Health, United KingdomO. Hydes & J. Hilton, Drinking Water Inspectorate, United KingdomM. Rutter, Public Health Laboratory Service, United Kingdom
REVIEWERS
The editors are grateful to the following organizations and individu-als for their comments.
B. Reme, Ministry of Health, AlbaniaJ. Grath, Austrian Working Group on WaterMinistry for the Wallonia Region, Water Division, BelgiumK. Capak, Croatian National Institute of Public Health, CroatiaJ.K. Fuksa, TGM Water Research Institute, Prague, Czech Republic
XXII
L. Romanovská, Ministry of Health, Czech RepublicP. Jantzen, National Board of Health, DenmarkB. Norup, DenmarkT. Säynätkäri, European Environment Agency National Focal Point,
FinlandO. Zacheus, FinlandM. Exener, Hygiene-Institut der Universität BonnH. Horing, Umweltbundesamt, Institut für Wasser-, Boden- und
Lufthygiene, GermanyA. Pintér, HungaryS. Velina, Department of Public Health, Ministry of Welfare, LatviaP. Bockmuehl, European Environment Agency National Focal Point,
LiechtensteinI. Drulyte, LithuaniaB. Kroes, European Science Foundation, NetherlandsZ. Kamienski, State Inspectorate for Environmental Protection, PolandI. Iacob, Water Hygiene Unit, Institute of Public Health, RomaniaJ. Jezny, European Environment Agency National Focal Point,
SlovakiaM. Kollárová, Ministry of Health, SlovakiaB. Metin, Ministry of Health, TurkeyG. Rees, Robens Centre for Public and Environmental Health, Uni-
versity of Surrey, United KingdomJ. Cotruvo, NSF International, USAR. Enderlein, United Nations Economic Commission for EuropeR. Bertollini, B. Menne & G. Klein, WHO Regional Office for EuropeP. Bourdeau, Chairman, Scientific Committee, European Environ-
ment AgencyR.A. Breach, European Union of National Associations of Water
Suppliers and Waste Water Services (EUREAU), Commission 1
Thanks are also due to Concha Lallana, Claudia Koreimann, HelenaHorth and Kevin Andrews, Water Research Centre, United King-dom; and to Francesco Mitis, Enrico Nasi, Nicoletta di Tanno, GraziaMotturi and Daniella Boehm, WHO European Centre for Environ-ment and Health, Rome Division, Italy.
XXIII
WATER – THE BASIS FOR DEVELOPMENT AND WEALTH
Over the centuries, proper management of the vital resource of wa-ter has led to developments and improvements in health across theEuropean Region. Effectively managed water-supply and resource-protection systems generate the indispensable basis for agricultural andindustrial production. Throughout the Region, urban and rural develop-ment have thrived where water sources have been effectively managed.In many growing cities in the Region this process started as early as the15th and 16th centuries, but at least five decades of the 19th centurysaw water as a central preoccupation of many state and industrial lead-ers. As a result, in the first half of the 20th century, life expectancyincreased, food became more healthy, infant mortality decreased and anumber of major diseases no longer posed a serious threat to health.Scientific and technical development has led to excellent water sup-plies for household, farming and industrial purposes all over the Re-gion. With a few exceptions, by the mid-1970s the Region as a wholewas on the way to eradicating water-related diseases and to guarantee-ing safe water for all.
Industrial development and wealth have depended on a safe, reliableand well managed water supply. It has been demonstrated to be thesingle most effective investment in economic and social development,and no other part of socioeconomic development has continued to beas incredibly cost-effective in relation to the wealth created. Over a wide
Introduction
1
1
2
range of income distributions, rich and poor countries alike have toinvest less than 1% of the average income to ensure excellent watersupply and resource management. This may be perceived as a majorsuccess, but it may also be the reason why the central role of water insocietal development and wellbeing has lost focus. Always present andcheap, water has been taken for granted, and efforts to build and main-tain both technical and human resources have lost their visibility andpolitical weight. Instead of sustainable development, the responsibilityof individuals, industry and civil servants has been progressively eroded.
Many countries have tried to loosen their ties to public water services,which were often seen as ineffective, bureaucratic and expensive. Thenew approach should release public budgets by transferring variousresponsibilities to private business. In so doing there is a certain risk thatonly the financially attractive portions of the supply systems will be“bought” by private companies. In some instances this may lead to wellmanaged private water treatment facilities depending on ineffectivelyprotected resources and badly maintained distribution systems. Oncethese responsibilities have been split and public services have beendownsized it is much more difficult to re-establish a holistic approach towater management from the source to the customer.
In the western part of the Region, countries were entering this experi-ment from a comfortable situation, with improving resource protection,a well established legal framework and an educated democratic society.Those in the east, on the other hand, were confronted with completepolitical reorganization, with pressure to downsize their public servicesand at the same time to open their countries to strong market forces; thiswas not always to the benefit of the citizens, and in many countriesthere was no chance of keeping governmental control over the socialand public health consequences of rapid investment.
COMBATING THE CREEPING CRISIS IN FRESH WATER –COMPETITION OR PARTNERSHIP?
As populations have increased and economies have grown, the com-petition among agriculture, industry and urban areas for limited watersupplies has intensified. Modern forestry practices, the intensificationof agriculture and the diversion of water for irrigation place additional
3
stress on water resources. Widespread mismanagement of water re-sources in the past among all sectors – industry, farming, large urbanpopulations and small communities alike – has contributed to a grow-ing crisis in the management of fresh water resources. The worseninglocal conditions in the privatized water supply in the United Kingdomhave been scarcely recognized, whereas water abuse in cotton farmingunder the Soviet regime was publicly known. The continuing water cri-sis in farming regions in southern Europe remains largely unchanged,even though considerable quantities of water diverted or pumped forirrigation are wasted. The abuse of large water systems such as the SyrDarya and Amu Darya Rivers (which feed 60 billion cubic metres an-nually into the Aral Sea basin), the irreversible deterioration in surfacewater quality by urban and industrial waste, saline intrusion of coastalaquifers, and contamination of groundwater by nitrates are all exam-ples of avoidable stress on water resources.
PUBLIC OR PRIVATE?
Inconsistent legislation, ineffective implementation of existing laws,loss of responsibility and staff in public supervisory agencies, andthe weakening or destruction of the sanitary–epidemiological insti-tutions in the eastern part of the Region have accelerated the destruc-tion of resources. At the same time, the collapse of industry in easternEurope relieved rivers, lakes and groundwater of some of the con-tinuous discharge of pollutants. Incoherent and inconsistent Euro-pean Union (EU) directives and disparate national policies havecreated a huge administrative burden, yet have only reduced the speedat which water resources are being destroyed. Despite a broad rangeof political action, the second assessment of Europe’s environmentconducted by the European Environment Agency (1) was unable toidentify substantial improvements in water quality in Europe.
Technical requirements demanded by legislation have lagged far be-hind many inexpensive and effective means of improving waterquality based on local awareness and interest. Examples such asresolving the ecological crisis in the Ruhr (Germany) between 1910and 1960, to implementation of advanced wastewater treatment inSweden and Switzerland in the 1970s and 1980s, and cooperationbetween water suppliers and farmers in several areas across the Region
4
have given rise to the hope that partnership will prove cheaper andmore effective than competition.
PRICE OR VALUE – THE PRECIOUS PUBLIC GOOD
Economic stability – rather than blind economic growth – is an im-portant development objective in many countries. The financial bur-den on users to pay for water and sanitation is incredibly lowcompared to the health cost incurred by failure to provide safe waterto everyone. In the overall context of increasing health care costs,water has to be highlighted as a central political issue. Over 30 mil-lion cases of water-related disease could be avoided annually throughwater and sanitation interventions. Investing in water supply andsanitation has produced benefits far greater than those directly re-lated to the cost of treatment for water-related diseases.
The organizational structure of water services in the Region has seenan increasing trend towards the private sector. The services in Eng-land and Wales are wholly privatized, while France has a partly pri-vate system. A variety of other approaches can also be found, rangingfrom direct operation and management by local authorities to pri-vate enterprises governed separately by public administrations. Theeffectiveness of some of these privatization approaches still needsto be evaluated in terms of public health and economic criteria.
Services in central and eastern European countries are now predomi-nantly operated by local administrations that have lost status andresources. International funding agencies find it difficult to invest inlocal sustainable water and sanitation services, partly because low(or no) prices for water cannot provide enough funds for the neededreconstruction of damaged networks and treatment facilities. Basicissues still need to be addressed, such as the provision of a continu-ous supply of water of adequate microbial quality.
PUBLIC VALUATION AND PARTICIPATION
Consumers are extremely willing to pay for water of good quality.Consumption of bottled water is growing in a number of countries.
5
Many people lack conf idence in the quality of their tap waterand have therefore invested in household filtering devices, with-out knowing that most of these filters do not effectively controlcontaminants or pathogens. Public pressure and greater awarenesshave helped to create and carry out a number of pollution controlprogrammes in recent decades in several European countries.Nevertheless, people are increasingly seeking cleaner water for rec-reation and are prepared to travel to find recreational water of goodquality.
Participation by nongovernmental organizations and the businessworld is crucial to improving the management of water resources.Many nongovernmental organizations originate from local initiativesand are independent and self-managed. Their knowledge of localissues and conditions and their local contacts aid the motivation andawareness of local communities in advocating change. The coop-eration of such organizations with public efforts at the communityor national level is essential in providing an improved environmentfor human health. Public policies require the consent and sometimesthe active participation of individuals. Accepting responsibility is animportant and basic element.
BUILDING NEW COMMITMENT
Having recognized the problem of conflicting requirements imposedby different pieces of legislation, the EU countries agreed to de-velop the Water Framework Directive (2) in order to produce aninstrument for integrated water management, aiming to create a ho-listic framework for the protection of inland surface waters, transi-tional water (shallow water), coastal waters and groundwater. At thesame time, the obvious need for action also outside the EU resultedin the decision by the European Member States of WHO to embarkon developing a legally binding pan-European instrument. Focus-ing on health and wellbeing targets in all Member States, the Proto-col on Water and Health (3) will foster partnerships in order to improvethe outcome of water supply and resource management. Intersectoralaction has been placed at the centre of the HEALTH21 policy frame-work adopted by the Member States of the European Region in1998 (4).
6
This type of action requires a well established and widely agreeddatabase – not only about health concerns, but much more aboutways of developing sustainable, healthy and economically soundwater management systems. This publication gives an overview frommany perspectives:
� comparison between countries of the availability of water re-sources;
� variation in data collection and density in various parts of theRegion;
� different types of stress on water quality and quantity; and� differences in economic valuation and pricing of water use and
services.
The compilation of country reports hides a most important aspect ofwater management and health in Europe: almost every country in-cludes a large variety of good and poor approaches to solving orcreating problems related to water and health. Further work is neededto develop the general essence of many case studies of environmen-tal excellence.
This publication can be a starting point for identifying excellent ap-proaches. Most of these have been proven to be not only good forhealth and wellbeing but also economically sound and sustainable.There is no reason to implement “average” performance mechanismswhen there are good opportunities to develop awareness and com-mitment for the best solutions. The motivation and expectations ofindividuals is high and must be encouraged and realized. The suc-cessful management of water resources depends on the ability andwillingness of the regulators to meet those expectations.
7
2
DISTRIBUTION OF RESOURCES
Geographical distributionThe water resources of a country are determined by a number offactors, including the amount of water received from precipitation,inflow and outflow in rivers and the amount lost by evaporation andtranspiration (evaporation of water through plants). The potential forstorage in aquifers and bodies of surface water is important in facili-tating the exploitation of this resource by humans. These factors de-pend on geography, geology and climate.
Freshwater resources are continuously replenished by the naturalprocesses of the hydrological cycle. Approximately 65% of precipi-tation falling on land returns to the atmosphere through evaporationand transpiration; the remainder, or runoff, recharges aquifers, streamsand lakes as it flows to the sea.
Methods for calculating the availability of freshwater resources varyconsiderably from country to country, making comparison difficult.To overcome this, Rees et al. (5) have developed a method of esti-mating the renewable freshwater resources across the EU. This methoduses data from hydrometric (river gauging) networks, supplementedby an empirical freshwater balance model that relates runoff to pre-cipitation and potential evaporation. Freshwater resources vary con-siderably across the European Region: annual runoff ranges from
European water resources
8
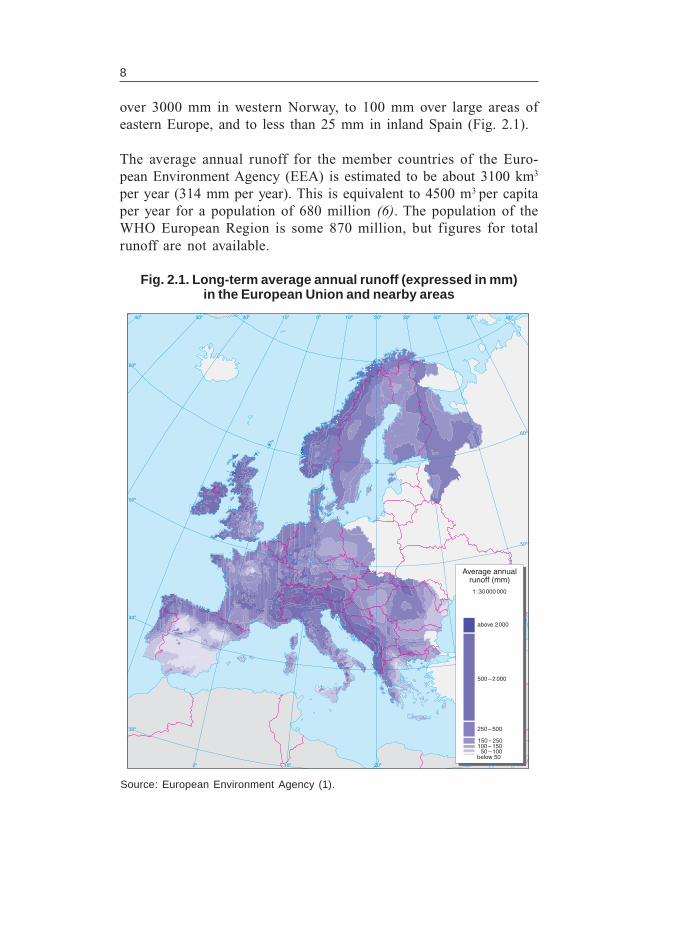
over 3000 mm in western Norway, to 100 mm over large areas ofeastern Europe, and to less than 25 mm in inland Spain (Fig. 2.1).
The average annual runoff for the member countries of the Euro-pean Environment Agency (EEA) is estimated to be about 3100 km3
per year (314 mm per year). This is equivalent to 4500 m3 per capitaper year for a population of 680 million (6). The population of theWHO European Region is some 870 million, but figures for totalrunoff are not available.
Source: European Environment Agency (1).
Fig. 2.1. Long-term average annual runoff (expressed in mm)in the European Union and nearby areas
20º10º0º
30º
40º
50º
60º
40º 30º 20º 10º 0º 10º 20º 30º 40º 50º 60º
60º
50º
Average annualrunoff (mm)1:30 000 000
below 5050 – 100
100 – 150150 – 250
250 – 500
above 2000
500 – 2 000
9
Sustainable use of the freshwater resources can only be assured ifthe rate of use does not exceed the rate of renewal. The total abstrac-tion of a country or area must not exceed the net water balance(precipitation plus inflow minus evaporation and transpiration). Anexcess of water abstraction over water use is especially prominent inthe central Asian republics, the Russian Federation and Ukraine (7).Achieving the correct balance between use and renewal requiresreliable quantitative assessment of the water resources and a thor-ough understanding of the hydrological regime. Available resourcesmust be managed carefully to ensure that abstraction to satisfy thevarious demands for water does not threaten the long-term avail-ability of water. Sustainability also implies management to protectthe quality of the water resources, which may include measures suchas preventing contaminants from entering the water, and maintain-ing river flows so that any discharges are sufficiently diluted to pre-vent adverse effects on water quality and ecological status.
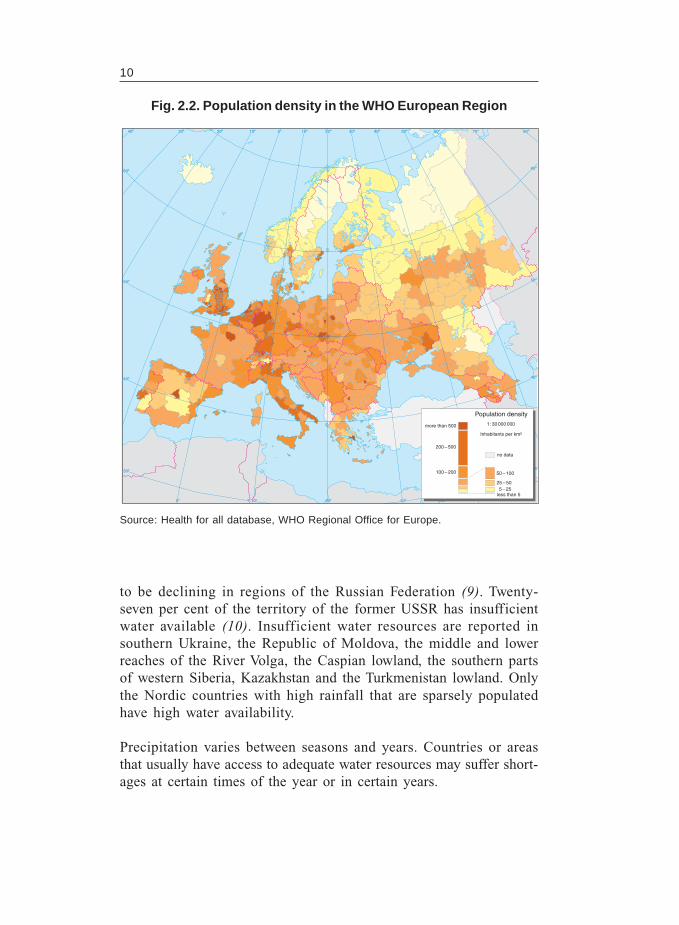
Population density also determines the availability of water per per-son. Population density varies widely across Europe, from fewer than10 inhabitants per km2 in Iceland, the Russian Federation and someof the central Asian republics (Kazakhstan and Turkmenistan) to over300 per km2 in the Benelux countries and San Marino and over 1000per km2 in Malta (Fig. 2.2).
On the continental scale, Europe appears to have abundant waterresources. Latvia, for example, consumes only 1.3% of the naturalrenewable resources annually. However, these resources are unevenlydistributed, both between and within countries (8). Once populationdensity is taken into account, the unevenness in the distribution ofwater resources per inhabitant is striking.
Many European countries have relatively little water available. South-ern countries are particularly affected, with Malta having only 100 m3
per capita per year (less than 5000 m3 per capita is regarded as low;less than 1000 m3 is extremely low and is commonly used as a bench-mark of water scarcity; and above 20 000 m3 per capita is consid-ered high). Heavily populated countries with moderate rainfall inwestern Europe, such as Belgium, Denmark and the United King-dom, are also affected, as are the Czech Republic and Poland incentral Europe. Water resources are unevenly distributed and reported
10
to be declining in regions of the Russian Federation (9). Twenty-seven per cent of the territory of the former USSR has insufficientwater available (10). Insufficient water resources are reported insouthern Ukraine, the Republic of Moldova, the middle and lowerreaches of the River Volga, the Caspian lowland, the southern partsof western Siberia, Kazakhstan and the Turkmenistan lowland. Onlythe Nordic countries with high rainfall that are sparsely populatedhave high water availability.
Precipitation varies between seasons and years. Countries or areasthat usually have access to adequate water resources may suffer short-ages at certain times of the year or in certain years.
Fig. 2.2. Population density in the WHO European Region
Source: Health for all database, WHO Regional Office for Europe.
20º10º0º
30º
40º
50º
60º
40º 30º 20º 10º 0º 10º 20º 30º 40º 50º 60º 70º 80º
60º
50º
40º
more than 500
200 – 500
100 – 200
Population density
1:30 000 000
Inhabitants per km²
50 – 100
25 – 505 – 25
less than 5
no data
30º
11
Local demand for water in areas of high population density or lim-ited precipitation may exceed the local availability of water. Exces-sive exploitation of groundwater sources in such cases not onlythreatens the future adequacy of the water supply but also affectsthe local environment: for example, the loss of wetlands,desertification, low river flow and, in the case of coastal aquifers,intrusion of salt water.
Most water used for all purposes in Europe is abstracted from sur-face water sources (1). Groundwater comprises most of the remain-der, with only a minor contribution from desalination of seawater,mainly in Italy, Malta and Spain.
There are some exceptions. Denmark abstracts 99% of its water fromextensive groundwater reserves. In Latvia, groundwater and sur-face water are abstracted in approximately equal quantities. Wheresufficient groundwater reserves are available, these are generallypreferred as the source of public water supplies and, in many coun-tries, provide the majority of drinking-water. Groundwater is gener-ally of higher quality than surface water, and therefore requires lesstreatment before being suitable for public water supply. Protectinggroundwater against contamination and excessive exploitation istherefore of great strategic importance.
Distribution in time – floods and droughtsExtreme hydrological events, such as floods and droughts, are a naturalcharacteristic of hydrometeorological variability. Despite the progressin science and technology and increasing expenditure on drought amel-ioration and flood control, people are still vulnerable to extreme hy-drological events, both in industrialized and in developing countries.
FloodsFloods can cause heavy damage. Seasonal fluctuations in water leveland discharge, as well as inundation of riparian areas, are naturalfeatures of running water. However, the areas liable to flooding areoften settled, and flooding interferes with human land use; damagecan be enormous and many lives can be lost (Box 2.1).
Floods have been reported since ancient times, but during the 1990s inEurope and other parts of the world episodes of flooding, threatening
12
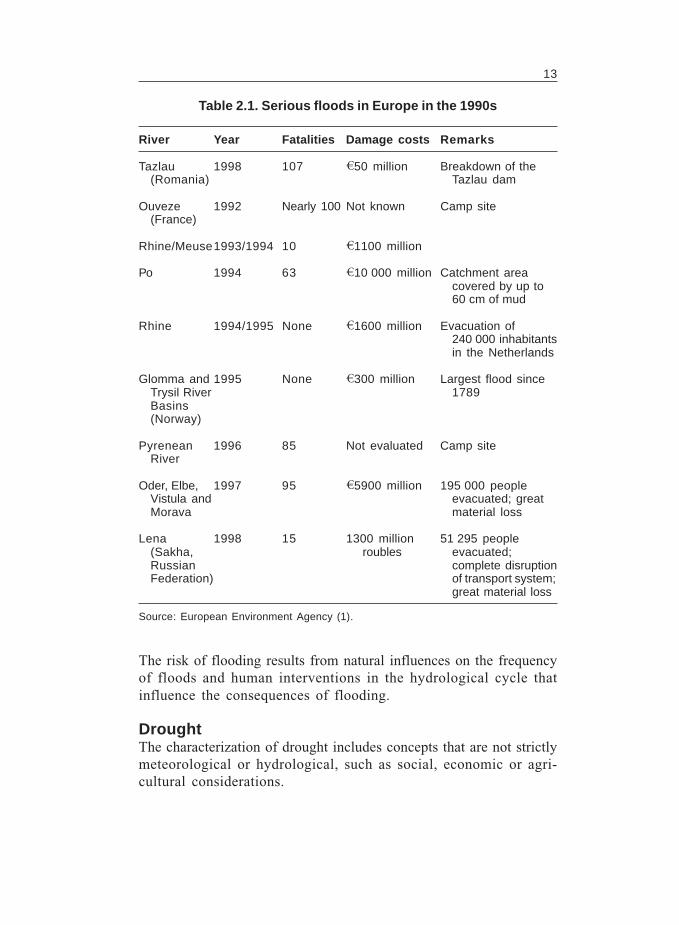
human lives, property and infrastructure, seem to have increased.The effects are made worse by the expansion of human settlementsand infrastructure to flood-prone areas. The trends have yet to beestablished unequivocally. Serious floods in Europe during the 1990sare shown in Table 2.1.
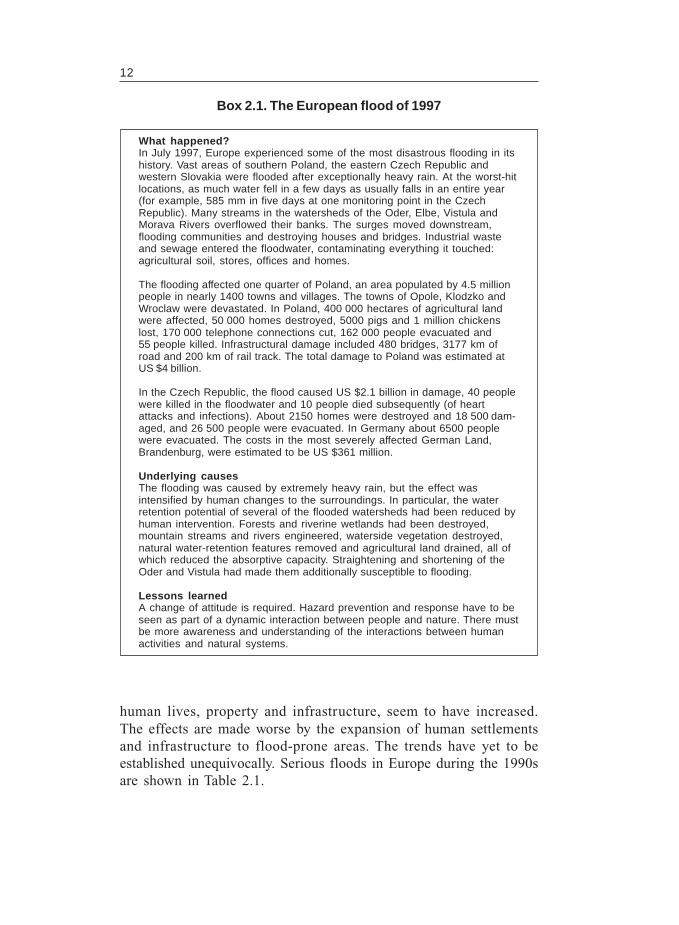
What happened?In July 1997, Europe experienced some of the most disastrous flooding in itshistory. Vast areas of southern Poland, the eastern Czech Republic andwestern Slovakia were flooded after exceptionally heavy rain. At the worst-hitlocations, as much water fell in a few days as usually falls in an entire year(for example, 585 mm in five days at one monitoring point in the CzechRepublic). Many streams in the watersheds of the Oder, Elbe, Vistula andMorava Rivers overflowed their banks. The surges moved downstream,flooding communities and destroying houses and bridges. Industrial wasteand sewage entered the floodwater, contaminating everything it touched:agricultural soil, stores, offices and homes.
The flooding affected one quarter of Poland, an area populated by 4.5 millionpeople in nearly 1400 towns and villages. The towns of Opole, Klodzko andWroclaw were devastated. In Poland, 400 000 hectares of agricultural landwere affected, 50 000 homes destroyed, 5000 pigs and 1 million chickenslost, 170 000 telephone connections cut, 162 000 people evacuated and55 people killed. Infrastructural damage included 480 bridges, 3177 km ofroad and 200 km of rail track. The total damage to Poland was estimated atUS $4 billion.
In the Czech Republic, the flood caused US $2.1 billion in damage, 40 peoplewere killed in the floodwater and 10 people died subsequently (of heartattacks and infections). About 2150 homes were destroyed and 18 500 dam-aged, and 26 500 people were evacuated. In Germany about 6500 peoplewere evacuated. The costs in the most severely affected German Land,Brandenburg, were estimated to be US $361 million.
Underlying causesThe flooding was caused by extremely heavy rain, but the effect wasintensified by human changes to the surroundings. In particular, the waterretention potential of several of the flooded watersheds had been reduced byhuman intervention. Forests and riverine wetlands had been destroyed,mountain streams and rivers engineered, waterside vegetation destroyed,natural water-retention features removed and agricultural land drained, all ofwhich reduced the absorptive capacity. Straightening and shortening of theOder and Vistula had made them additionally susceptible to flooding.
Lessons learnedA change of attitude is required. Hazard prevention and response have to beseen as part of a dynamic interaction between people and nature. There mustbe more awareness and understanding of the interactions between humanactivities and natural systems.
Box 2.1. The European flood of 1997
13
River Year Fatalities Damage costs Remarks
Tazlau 1998 107 50 million Breakdown of the(Romania) Tazlau dam
Ouveze 1992 Nearly 100 Not known Camp site(France)
Rhine/Meuse1993/1994 10 1100 million
Po 1994 63 10 000 million Catchment areacovered by up to60 cm of mud
Rhine 1994/1995 None 1600 million Evacuation of240 000 inhabitantsin the Netherlands
Glomma and 1995 None 300 million Largest flood sinceTrysil River 1789Basins(Norway)
Pyrenean 1996 85 Not evaluated Camp siteRiver
Oder, Elbe, 1997 95 5900 million 195 000 peopleVistula and evacuated; greatMorava material loss
Lena 1998 15 1300 million 51 295 people(Sakha, roubles evacuated;Russian complete disruptionFederation) of transport system;
great material loss
Source: European Environment Agency (1).
Table 2.1. Serious floods in Europe in the 1990s
The risk of flooding results from natural influences on the frequencyof floods and human interventions in the hydrological cycle thatinfluence the consequences of flooding.
DroughtThe characterization of drought includes concepts that are not strictlymeteorological or hydrological, such as social, economic or agri-cultural considerations.
14
A drought is an extreme hydrological event, whereas aridity is re-stricted to regions with low rainfall and is a permanent feature ofclimate. Recent European droughts have emphasized that the haz-ard is not limited to semi-arid countries and is a normal part of cli-mate in all countries. Drought has a number of effects: loss of humanlives (directly through thirst or indirectly through starvation or dis-ease); loss of crops and animal stock; water supply problems, in-cluding shortages and deterioration of quality; increased pollutionof freshwater ecosystems by concentration of pollutants; regionalextinction of animal species by the absence of biotopes in droughtperiods; forest fires; wetland degradation; desertification; effects onaquifers; and other environmental consequences.
Climate changeAlthough regional differences are relatively high, most of Europeexperienced increases in temperature of about 0.8 °C on average inthe 20th century (12–15) and climate models predict global meansurface temperatures could rise by about 1–3.5 °C by 2100 (16).Annual precipitation trends in the 20th century included enhancedprecipitation in the northern half of Europe (north of the Alps to theNordic countries), with increases ranging from 10% to close to 50%.The region stretching from the Mediterranean Sea through centralEurope into the European part of the Russian Federation and Ukraine,by contrast, experienced decreases in precipitation by as much as20% in some areas.
Predictions of climate change are subject to huge uncertainty. Evenwhere the likely global trend appears to be clear, the response inindividual regions may vary substantially from this. Thus, althoughglobal temperatures are predicted to increase by 1–3.5 °C by theyear 2100 (14), the actual rise in individual areas will differ signifi-cantly, and some regions may become cooler.
Similarly, global average precipitation is predicted to rise, but thisincrease is also likely to be regional. It is predicted that winter andspring precipitation will increase in Europe and summer precipita-tion will decrease, although the Mediterranean region and centraland eastern Europe are expected to experience reduced precipitation(17). The incidence of drought and heavy precipitation events is alsotherefore predicted to increase, which suggests implications not only
15
for increased contamination resulting from run-off but also decreasedgroundwater recharge and an increased incidence of flooding.
Effects of climate change on the quantity of waterresourcesComplex interactions in time and space between precipitation, evapo-ration, discharge, storage in reservoirs, groundwater and soil make itdifficult to model and analyse the influence of climate change on thehydrological cycle.
One of the basic mechanisms is that higher temperatures lead to higherpotential evaporation and decreased discharge (which is also a func-tion of precipitation, storage and topography). The storage in the soilserves as a buffer; in winter and spring, increasing precipitation nor-mally generates higher discharges because the buffer is full andevaporation is low (18). During the summer, storage is reduced byevaporation and transpiration, and the soil must be refilled beforedischarge begins. Changes in the hydrological cycle are much morevariable than changes in other climatic factors. Seasonal to interannualvariability in precipitation and temperature also accounts for someof the variability in hydrological characteristics in European riverbasins. Predictions about hydrology are difficult in Europe becauseanthropogenic factors, such as changes in land-use patterns and thedrainage conditions of rivers and an increasing proportion of imperme-able areas, strongly influence the European hydrological cycle (18).
Predictions of the effect of climate change on river flow are uncer-tain, and the results of different models are highly variable. Arnell &Reynard (19), for example, modelled river flows in the United King-dom under various climate change scenarios and found that, underall scenarios, the concentration of flow was greater in winter. Themodels predicted that monthly flow would change by a greater per-centage than annual flow, and different catchment areas would re-spond differently to the same scenario. The models indicated thatprogressive change would be small compared with variability over ashort time scale, but that it would be noticeable on a decade-to-decadebasis.
Cooper et al. (20) found that the effect of various climate changescenarios on aquifer recharge depended on the aquifer type, and
16
that a scenario incorporating high evaporation produced the greatestchange in hydrological regime.
The central emission scenario of the Intergovernmental Panel on Cli-mate Change predicts a rise in sea level of 0.5 m by the year 2100.However, the predicted rise will not be uniform around the world.Polders, such as lowlands in the Netherlands and northern Germany,will be submerged. Catchment areas in flatlands depend ongroundwater recharge, and changes in percolation can change thesize of catchment areas (21). On a local catchment scale, the distribu-tion of water in the landscape can change even if annual dischargeremains unchanged: whereas hilltops are severely stressed by droughts,areas with high groundwater levels may remain largely unaffected (18).
Although the debate about changes in the frequency of floods is stillopen, an increase in rainfall during periods when soils are saturated(winter and spring) could increase the frequency and severity offloods. An increase in large-scale precipitation might lead to increasedflood risks on large river basins in western Europe in winter (18).
Hotter summers would lead to increased demand for water for irriga-tion purposes in already sensitive regions (such as the Mediterra-nean basin and central Asian republics), especially for soil with lowstorage capacity to handle summer water shortages (18).
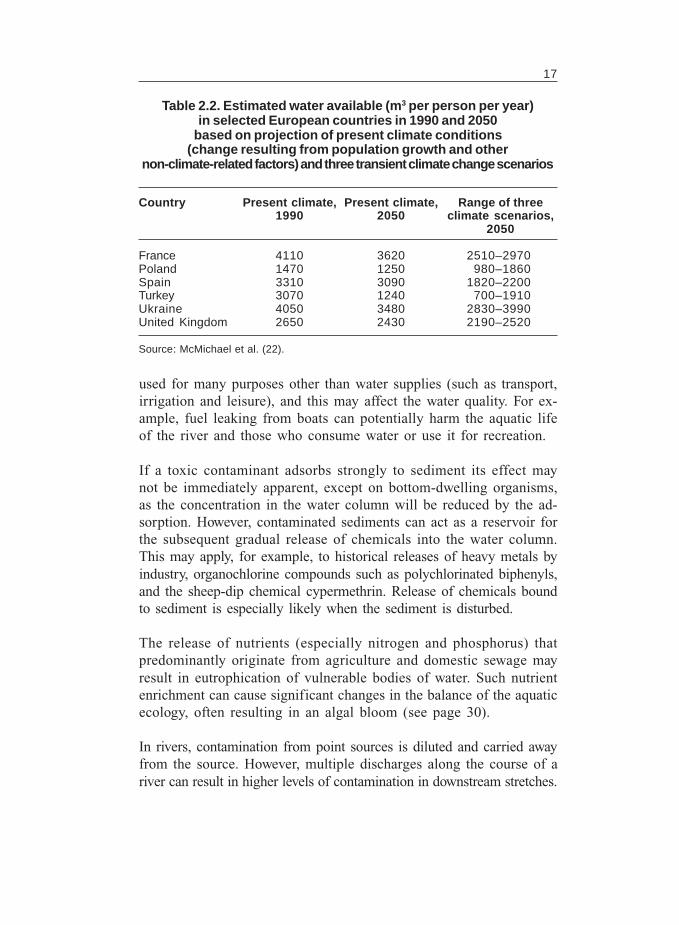
Water demand is likely to increase in some countries because of in-creasing irrigation, population growth or increased use of domestic ap-pliances. If decreased water availability, because of climate change, isalso considered, then an imbalance of supply and demand is likely. Thepotential influence of climate change on water resources (m3 per capitaper year) in some European countries is demonstrated in Table 2.2, al-though the variation between different climate scenarios should be noted.
RIVERS
Surface water is vulnerable to contamination from many sources. Po-tential contaminants include agricultural chemicals and micro-organisms inrun-off from agricultural land, chemicals in industrial discharges, andnutrients and pathogens from domestic sewage. Surface water is often
17
Country Present climate, Present climate, Range of three1990 2050 climate scenarios,
2050
France 4110 3620 2510–2970Poland 1470 1250 980–1860Spain 3310 3090 1820–2200Turkey 3070 1240 700–1910Ukraine 4050 3480 2830–3990United Kingdom 2650 2430 2190–2520
Table 2.2. Estimated water available (m3 per person per year)in selected European countries in 1990 and 2050
based on projection of present climate conditions(change resulting from population growth and other
non-climate-related factors) and three transient climate change scenarios
Source: McMichael et al. (22).
used for many purposes other than water supplies (such as transport,irrigation and leisure), and this may affect the water quality. For ex-ample, fuel leaking from boats can potentially harm the aquatic lifeof the river and those who consume water or use it for recreation.
If a toxic contaminant adsorbs strongly to sediment its effect maynot be immediately apparent, except on bottom-dwelling organisms,as the concentration in the water column will be reduced by the ad-sorption. However, contaminated sediments can act as a reservoir forthe subsequent gradual release of chemicals into the water column.This may apply, for example, to historical releases of heavy metals byindustry, organochlorine compounds such as polychlorinated biphenyls,and the sheep-dip chemical cypermethrin. Release of chemicals boundto sediment is especially likely when the sediment is disturbed.
The release of nutrients (especially nitrogen and phosphorus) thatpredominantly originate from agriculture and domestic sewage mayresult in eutrophication of vulnerable bodies of water. Such nutrientenrichment can cause significant changes in the balance of the aquaticecology, often resulting in an algal bloom (see page 30).
In rivers, contamination from point sources is diluted and carried awayfrom the source. However, multiple discharges along the course of ariver can result in higher levels of contamination in downstream stretches.
18
Microbial contaminationEvery effort should be made to achieve water quality that is as highas practicable. Protection of water supplies from contamination isthe first line of defence. The microbial quality of surface water var-ies widely both temporally and spatially, and European countriesreport different trends without any consistent geographical pattern.Many rivers in Europe are significantly contaminated with microbes,arising from municipal wastewater and/or animal husbandry, thatare of public health concern. In the bodies of water situated aroundthe Aral Sea, especially in the Kzyl-Orda region of Kazakhstan andthe Karakalpakstan Autonomous Republic in Uzbekistan, the hightotal microbe numbers present a risk of infectious waterborne dis-eases (23). A comparative study (1981–1985 and 1986–1990) ofthe microbial pollution of the River Danube revealed that it is char-acterized by a high percentage of frequencies exceeding 100 000 col-iform bacteria per litre. The high frequency of non-compliantdrinking-water samples and presence of enterobacteriophages coin-cided with incidents of acute diarrhoea and viral hepatitis type A inthe localities of Turnu-Magurele, Braila, Tulcea and Cernavoda (24).
Waterborne sewage that is not exhaustively treated inevitably re-quires treatment for drinking and irrigation and may be unsuitablefor recreational use. As far as possible, water sources must be pro-tected from contamination by human and animal waste, which cancontain a variety of viral, bacterial and protozoan pathogens andhelminth parasites. Failure to provide suitable protection and adequatetreatment will expose the community to the risk of outbreaks of in-testinal and other infectious diseases.
Organic matterThe organic matter content of water is usually measured as the bio-chemical oxygen demand (BOD) and/or the chemical oxygen de-mand (COD). These terms are not directly comparable, but giventhe dual approach across Europe, general comparisons have to beattempted. In undisturbed rivers, typical BOD values are less than2 mg oxygen per litre and those of COD 20 mg oxygen per litre.
In the rivers of Nordic countries, the organic matter content of an-thropogenic origin is generally low. In many other countries of theEuropean Region, BOD measurements exceeding 5 mg oxygen per
19
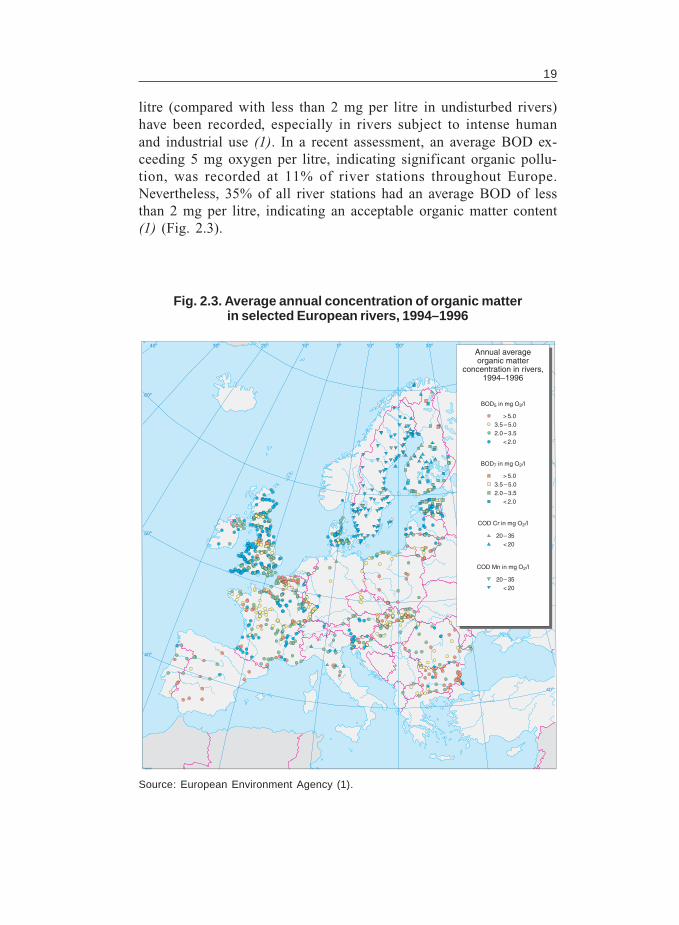
litre (compared with less than 2 mg per litre in undisturbed rivers)have been recorded, especially in rivers subject to intense humanand industrial use (1). In a recent assessment, an average BOD ex-ceeding 5 mg oxygen per litre, indicating significant organic pollu-tion, was recorded at 11% of river stations throughout Europe.Nevertheless, 35% of all river stations had an average BOD of lessthan 2 mg per litre, indicating an acceptable organic matter content(1) (Fig. 2.3).
Fig. 2.3. Average annual concentration of organic matterin selected European rivers, 1994–1996
Source: European Environment Agency (1).
30º
40º
50º
60º
40º 30º 20º 10º 0º 10º 20º 30º
40º
Annual averageorganic matter
concentration in rivers,1994–1996
BOD5 in mg O2/l
2.0 – 3.5 < 2.0
3.5 – 5.0 > 5.0
BOD7 in mg O2/l
2.0 – 3.5 < 2.0
3.5 – 5.0 > 5.0
COD Cr in mg O2/l
< 2020– 35
COD Mn in mg O2/l
< 2020– 35
20
Data on BOD and COD values in the former USSR show variationin different hydrographic regions. In the Baltic hydrological region,the Neman River is considerably polluted, with the trend for BODand COD showing increased pollution in the late 1980s and 1990scompared with the 1970s. The River Lena in northern Siberia hashigh BOD and COD values, and no obvious decrease in organicpollution trends have been reported over time (25).
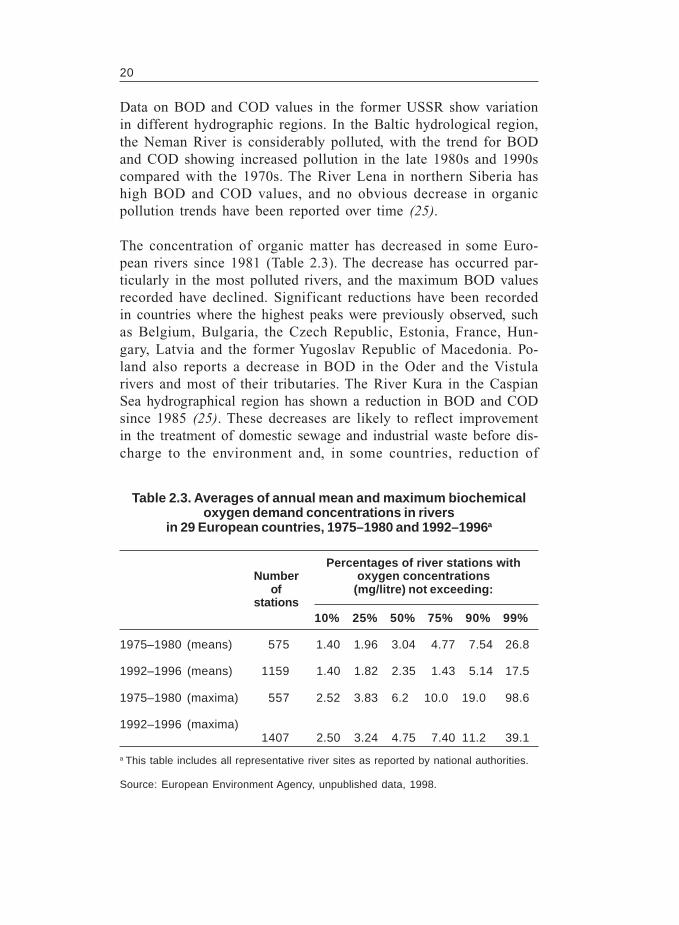
The concentration of organic matter has decreased in some Euro-pean rivers since 1981 (Table 2.3). The decrease has occurred par-ticularly in the most polluted rivers, and the maximum BOD valuesrecorded have declined. Significant reductions have been recordedin countries where the highest peaks were previously observed, suchas Belgium, Bulgaria, the Czech Republic, Estonia, France, Hun-gary, Latvia and the former Yugoslav Republic of Macedonia. Po-land also reports a decrease in BOD in the Oder and the Vistularivers and most of their tributaries. The River Kura in the CaspianSea hydrographical region has shown a reduction in BOD and CODsince 1985 (25). These decreases are likely to reflect improvementin the treatment of domestic sewage and industrial waste before dis-charge to the environment and, in some countries, reduction of
10% 25% 50% 75% 90% 99%
1975–1980 (means) 575 1.40 1.96 3.04 4.77 7.54 26.8
1992–1996 (means) 1159 1.40 1.82 2.35 1.43 5.14 17.5
1975–1980 (maxima) 557 2.52 3.83 6.2 10.0 19.0 98.6
1992–1996 (maxima)1407 2.50 3.24 4.75 7.40 11.2 39.1
Percentages of river stations withoxygen concentrations
(mg/litre) not exceeding:Number
ofstations
Table 2.3. Averages of annual mean and maximum biochemicaloxygen demand concentrations in rivers
in 29 European countries, 1975–1980 and 1992–1996a
a This table includes all representative river sites as reported by national authorities.
Source: European Environment Agency, unpublished data, 1998.
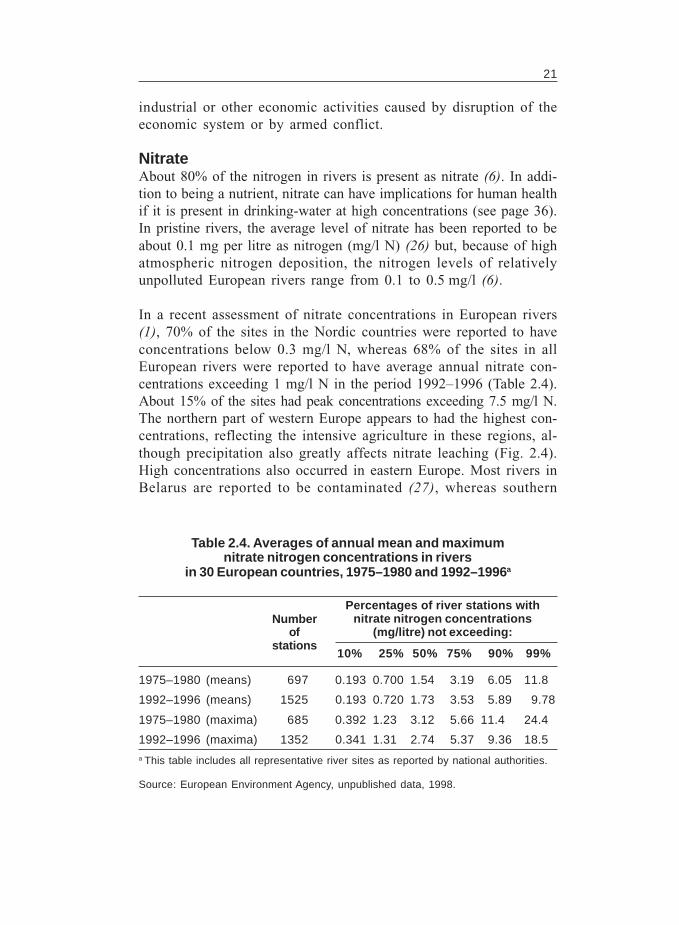
21
industrial or other economic activities caused by disruption of theeconomic system or by armed conflict.
NitrateAbout 80% of the nitrogen in rivers is present as nitrate (6). In addi-tion to being a nutrient, nitrate can have implications for human healthif it is present in drinking-water at high concentrations (see page 36).In pristine rivers, the average level of nitrate has been reported to beabout 0.1 mg per litre as nitrogen (mg/l N) (26) but, because of highatmospheric nitrogen deposition, the nitrogen levels of relativelyunpolluted European rivers range from 0.1 to 0.5 mg/l (6).
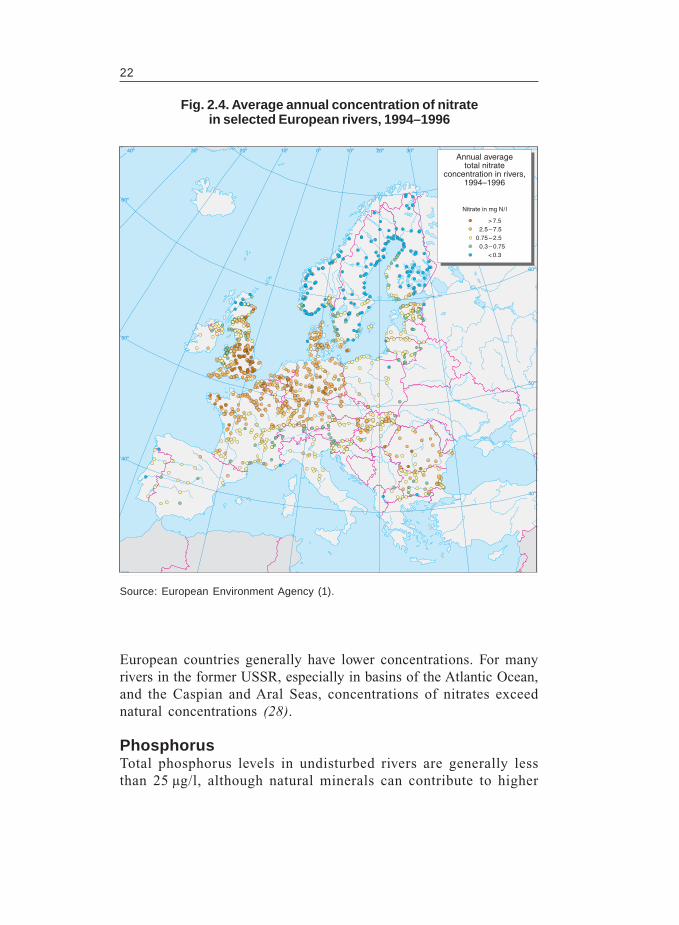
In a recent assessment of nitrate concentrations in European rivers(1), 70% of the sites in the Nordic countries were reported to haveconcentrations below 0.3 mg/l N, whereas 68% of the sites in allEuropean rivers were reported to have average annual nitrate con-centrations exceeding 1 mg/l N in the period 1992–1996 (Table 2.4).About 15% of the sites had peak concentrations exceeding 7.5 mg/l N.The northern part of western Europe appears to had the highest con-centrations, reflecting the intensive agriculture in these regions, al-though precipitation also greatly affects nitrate leaching (Fig. 2.4).High concentrations also occurred in eastern Europe. Most rivers inBelarus are reported to be contaminated (27), whereas southern
10% 25% 50% 75% 90% 99%
1975–1980 (means) 697 0.193 0.700 1.54 3.19 6.05 11.8
1992–1996 (means) 1525 0.193 0.720 1.73 3.53 5.89 9.78
1975–1980 (maxima) 685 0.392 1.23 3.12 5.66 11.4 24.4
1992–1996 (maxima) 1352 0.341 1.31 2.74 5.37 9.36 18.5a This table includes all representative river sites as reported by national authorities.
Source: European Environment Agency, unpublished data, 1998.
Table 2.4. Averages of annual mean and maximumnitrate nitrogen concentrations in rivers
in 30 European countries, 1975–1980 and 1992–1996a
Numberof
stations
Percentages of river stations withnitrate nitrogen concentrations
(mg/litre) not exceeding:
22
European countries generally have lower concentrations. For manyrivers in the former USSR, especially in basins of the Atlantic Ocean,and the Caspian and Aral Seas, concentrations of nitrates exceednatural concentrations (28).
PhosphorusTotal phosphorus levels in undisturbed rivers are generally lessthan 25 µg/l, although natural minerals can contribute to higher
Fig. 2.4. Average annual concentration of nitratein selected European rivers, 1994–1996
Source: European Environment Agency (1).
30º
40º
50º
60º
40º 30º 20º 10º 0º 10º 20º 30º
60º
50º
40º
Annual averagetotal nitrate
concentration in rivers,1994–1996
Nitrate in mg N/l
0.75 – 2.50.3 – 0.75
2.5 – 7.5 > 7.5
< 0.3
23
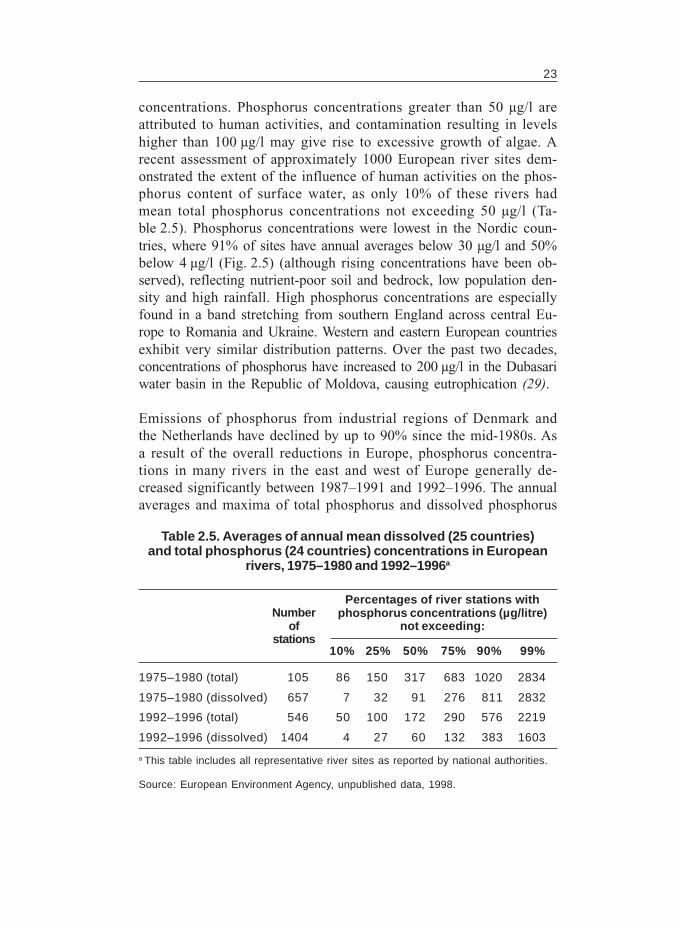
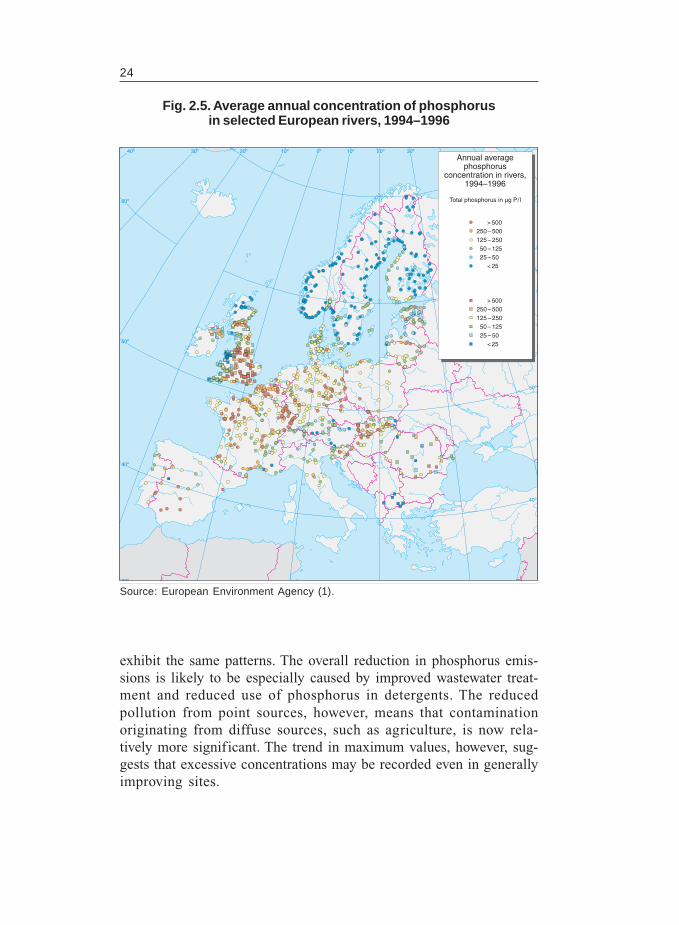
concentrations. Phosphorus concentrations greater than 50 µg/l areattributed to human activities, and contamination resulting in levelshigher than 100 µg/l may give rise to excessive growth of algae. Arecent assessment of approximately 1000 European river sites dem-onstrated the extent of the influence of human activities on the phos-phorus content of surface water, as only 10% of these rivers hadmean total phosphorus concentrations not exceeding 50 µg/l (Ta-ble 2.5). Phosphorus concentrations were lowest in the Nordic coun-tries, where 91% of sites have annual averages below 30 µg/l and 50%below 4 µg/l (Fig. 2.5) (although rising concentrations have been ob-served), reflecting nutrient-poor soil and bedrock, low population den-sity and high rainfall. High phosphorus concentrations are especiallyfound in a band stretching from southern England across central Eu-rope to Romania and Ukraine. Western and eastern European countriesexhibit very similar distribution patterns. Over the past two decades,concentrations of phosphorus have increased to 200 µg/l in the Dubasariwater basin in the Republic of Moldova, causing eutrophication (29).
Emissions of phosphorus from industrial regions of Denmark andthe Netherlands have declined by up to 90% since the mid-1980s. Asa result of the overall reductions in Europe, phosphorus concentra-tions in many rivers in the east and west of Europe generally de-creased significantly between 1987–1991 and 1992–1996. The annualaverages and maxima of total phosphorus and dissolved phosphorus
10% 25% 50% 75% 90% 99%
1975–1980 (total) 105 86 150 317 683 1020 2834
1975–1980 (dissolved) 657 7 32 91 276 811 2832
1992–1996 (total) 546 50 100 172 290 576 2219
1992–1996 (dissolved) 1404 4 27 60 132 383 1603
Table 2.5. Averages of annual mean dissolved (25 countries)and total phosphorus (24 countries) concentrations in European
rivers, 1975–1980 and 1992–1996a
a This table includes all representative river sites as reported by national authorities.
Source: European Environment Agency, unpublished data, 1998.
Percentages of river stations withphosphorus concentrations (µg/litre)
not exceeding:Number
ofstations
24
exhibit the same patterns. The overall reduction in phosphorus emis-sions is likely to be especially caused by improved wastewater treat-ment and reduced use of phosphorus in detergents. The reducedpollution from point sources, however, means that contaminationoriginating from diffuse sources, such as agriculture, is now rela-tively more significant. The trend in maximum values, however, sug-gests that excessive concentrations may be recorded even in generallyimproving sites.
Fig. 2.5. Average annual concentration of phosphorusin selected European rivers, 1994–1996
Source: European Environment Agency (1).30º
40º
50º
60º
40º 30º 20º 10º 0º 10º 20º 30º
50º
40º
Annual averagephosphorus
concentration in rivers,1994–1996
Total phosphorus in µg P/l
125 – 25050 – 125
250 – 500> 500
25 – 50 < 25
125 – 25050 – 125
250 – 500> 500
25 – 50 < 25
25
In Belarus the amount of wastewater discharged from point sourcesdeclined by about 40% between 1991 and 1995, and the amount ofinadequately treated water discharged to rivers declined by 75% (27).In Ukraine, industrial wastewater discharge declined from 9813 mil-lion m3 in 1992 to 7381 million m3 in 1996 (30).
LAKES AND RESERVOIRS
Europe has approximately 500 000 still bodies of water of over 1 hec-tare (6). These comprise both natural lakes and artificial reservoirs.Limnicity (the total freshwater surface area of a region as a percent-age of the total area of the region) is nearly always related to thedensity of lakes in the 10–100-km2 range. Limnicity ranges fromover 9% in countries such as Sweden (31) to about 1% in the UnitedKingdom and less than 0.5% in Greece (32).
LakesMost countries have natural lakes, but their distribution is very un-even, with a large proportion concentrated in Finland, Norway, Swe-den and parts of the Russian Federation. The former USSR had nearly2.9 million lakes with a total surface area, including the CaspianSea, of 892 850 km2, about 4% of the total (10). Iceland, Ireland andScotland have significant numbers of natural lakes, but most of thelargest European lakes are located in the Nordic countries and in theAlpine regions. In Albania, lakes occupy a surface area of 1150 km2.Geological processes such as fluvial damming, volcanic activity andglacial events form natural lakes.
ReservoirsArtificial reservoirs, usually formed by damming rivers, are con-structed for a number of purposes, the most obvious being to com-pensate for spatial or temporal deficiencies in the natural waterresource in relation to water demand. Reservoirs are built to providewater for irrigation, public supply and industrial use. Dams may alsobe built for the purposes of fisheries, electricity generation, floodcontrol, low flow enhancement, transport, recreation or the storageof mining spoils (33). The importance of the quality of the dammedwater depends on the intended reservoir use, and is extremely im-portant in reservoirs used for public supply, some industrial uses
26
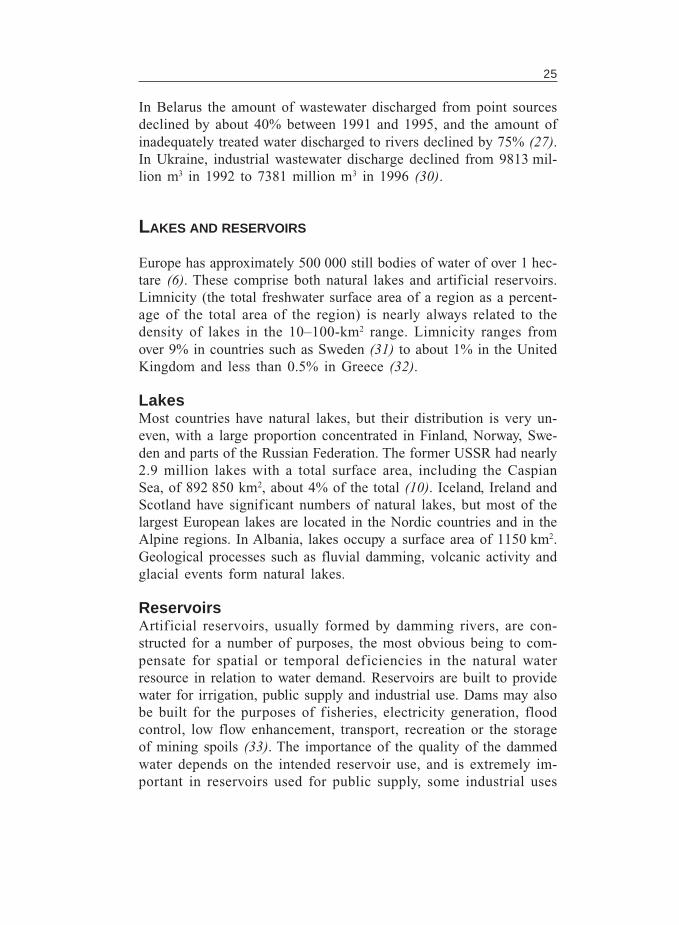
(such as food production), fisheries and recreation (33). Many res-ervoirs have more than one purpose in practice, which can lead toconflicting priorities for different water uses. Fig. 2.6 compares popu-lation and total reservoir capacities in some European countries.
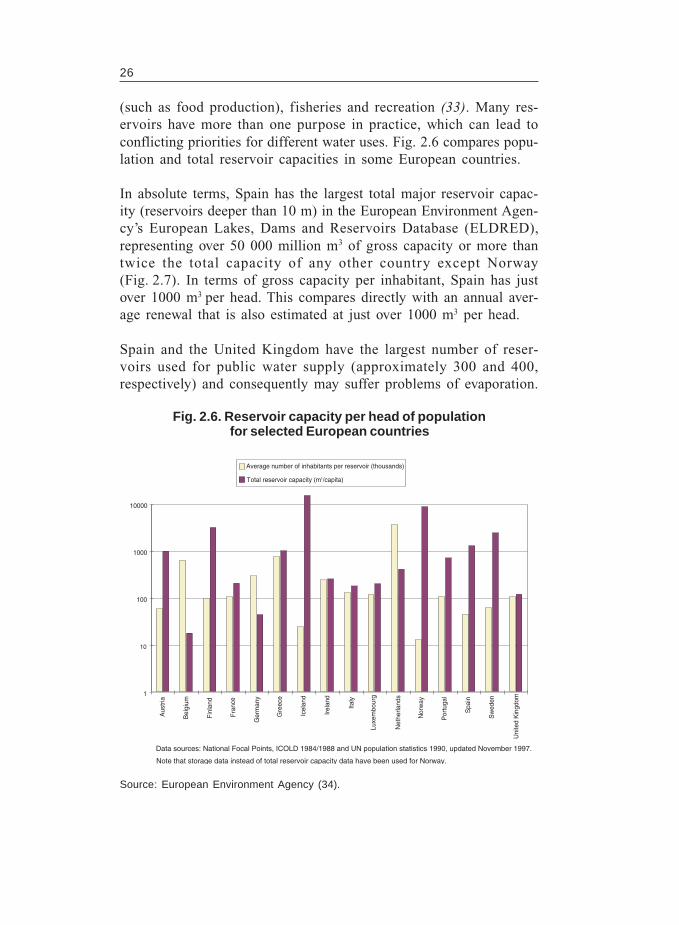
In absolute terms, Spain has the largest total major reservoir capac-ity (reservoirs deeper than 10 m) in the European Environment Agen-cy’s European Lakes, Dams and Reservoirs Database (ELDRED),representing over 50 000 million m3 of gross capacity or more thantwice the total capacity of any other country except Norway(Fig. 2.7). In terms of gross capacity per inhabitant, Spain has justover 1000 m3 per head. This compares directly with an annual aver-age renewal that is also estimated at just over 1000 m3 per head.
Spain and the United Kingdom have the largest number of reser-voirs used for public water supply (approximately 300 and 400,respectively) and consequently may suffer problems of evaporation.
Fig. 2.6. Reservoir capacity per head of populationfor selected European countries
Source: European Environment Agency (34).
1
10
100
1000
10000
Aus
tria
Bel
gium
Fin
land
Fra
nce
Ger
man
y
Icel
and
Irel
and
Italy
Luxe
mbo
urg
Net
herla
nds
Nor
way
Por
tuga
l
Spa
in
Sw
eden
Uni
ted
Kin
gdom
Average number of inhabitants per reservoir (thousands)
Data sources: National Focal Points, ICOLD 1984/1988 and UN population statistics 1990, updated November 1997.
Note that storage data instead of total reservoir capacity data have been used for Norway.
Total reservoir capacity (m /capita)3
Gre
ece
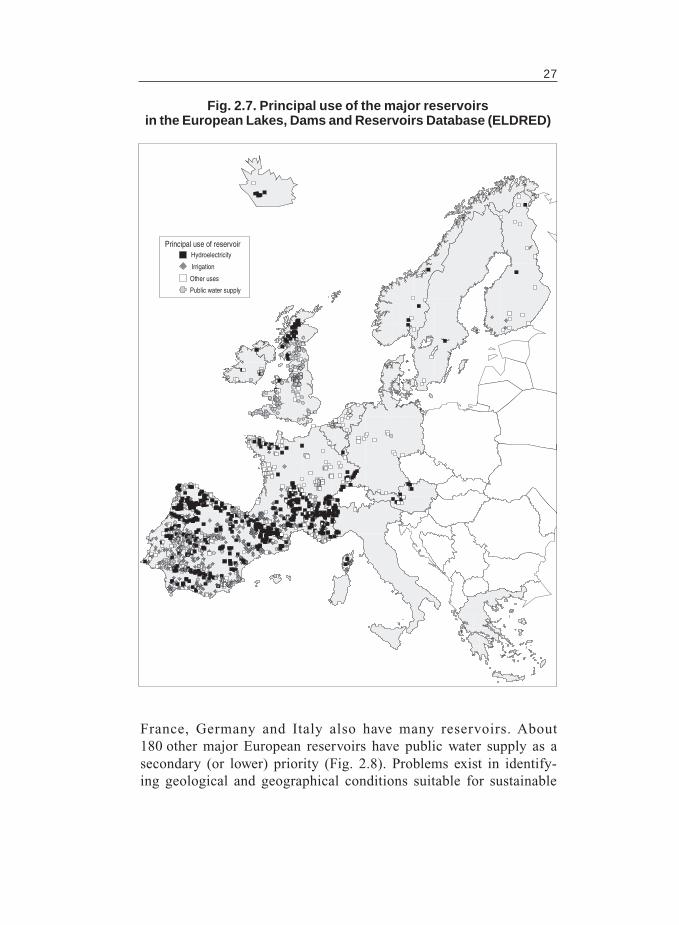
27
Fig. 2.7. Principal use of the major reservoirsin the European Lakes, Dams and Reservoirs Database (ELDRED)
Principal use of reservoirHydroelectricity
Irrigation
Other uses
Public water supply
France, Germany and Italy also have many reservoirs. About180 other major European reservoirs have public water supply as asecondary (or lower) priority (Fig. 2.8). Problems exist in identify-ing geological and geographical conditions suitable for sustainable
28
water management. In many countries agricultural activities createmajor quality problems, while in southern Europe problems existbecause of high evaporation. The total capacity of European reser-voirs used for public water supply (as their primary or lower-prioritypurpose) is about 32 000 million m3, representing approximately20% of total European reservoir capacity (33,35,36). Many important
Fig. 2.8. Reservoirs and lakes in ELDREDused for public water supply
29
public water supply reservoirs in Europe are relatively shallow (lessthan 10 m deep) and are therefore not part of the major reservoirdata set contained in ELDRED; this may influence the apparent dis-tribution of these reservoirs (33).
Increasing reservoir capacityThe use of storage reservoirs overcomes the uneven distribution ofnatural water resources over time. Run-off in seasons of high rain-fall can be held back to be used in drier seasons (seasonal regula-tion), and water available in wet years can be stored and used in dryyears (interannual regulation). Increasing reservoir capacity is, there-fore, a potential tool for meeting demand.
The reservoirs of Europe serve many functions other than providingdrinking-water, such as electricity, irrigation, flood defence, recrea-tion, navigation, fish farming and industrial supply (Fig. 2.7). Con-sequently, there is already a large storage capacity in a number ofEuropean countries.
Total reservoir capacity in Europe increased most between 1955 and1985. The potential for the construction of further storage reservoirsin Europe is not likely to be large, since most suitable dam sites havealready been selected and reservoir schemes implemented. Conse-quently, future dams will face higher economic and environmentalcosts (33).
Water qualityWater quality is a prime consideration in lakes and reservoirs usedfor public water supply. Such bodies of water are often more vulner-able and sensitive to pollution than watercourses or marine waters,since water volumes are not frequently renewed and lake morphol-ogy tends to lead to accumulation of pollution. Acidification, result-ing from atmospheric deposition, and eutrophication caused byexcessive nutrient loading are the main problems affecting the qual-ity of European lakes (Box 2.2). Only lakes in sparsely populatedareas or mountainous regions away from populated areas have lownutrient levels. In densely populated areas such as western and cen-tral Europe, many lakes have elevated phosphorus levels as a resultof human activities (Fig. 2.9). Lakes and reservoirs situated in low-land regions are most likely to be subject to higher nutrient loads.
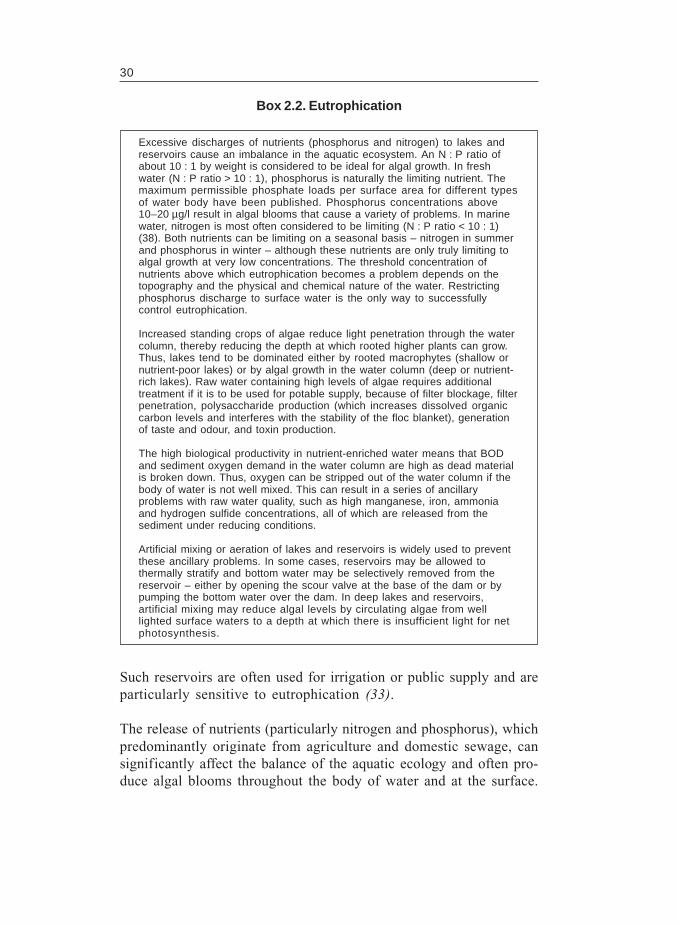
30
Excessive discharges of nutrients (phosphorus and nitrogen) to lakes andreservoirs cause an imbalance in the aquatic ecosystem. An N : P ratio ofabout 10 : 1 by weight is considered to be ideal for algal growth. In freshwater (N : P ratio > 10 : 1), phosphorus is naturally the limiting nutrient. Themaximum permissible phosphate loads per surface area for different typesof water body have been published. Phosphorus concentrations above10–20 µg/l result in algal blooms that cause a variety of problems. In marinewater, nitrogen is most often considered to be limiting (N : P ratio < 10 : 1)(38). Both nutrients can be limiting on a seasonal basis – nitrogen in summerand phosphorus in winter – although these nutrients are only truly limiting toalgal growth at very low concentrations. The threshold concentration ofnutrients above which eutrophication becomes a problem depends on thetopography and the physical and chemical nature of the water. Restrictingphosphorus discharge to surface water is the only way to successfullycontrol eutrophication.
Increased standing crops of algae reduce light penetration through the watercolumn, thereby reducing the depth at which rooted higher plants can grow.Thus, lakes tend to be dominated either by rooted macrophytes (shallow ornutrient-poor lakes) or by algal growth in the water column (deep or nutrient-rich lakes). Raw water containing high levels of algae requires additionaltreatment if it is to be used for potable supply, because of filter blockage, filterpenetration, polysaccharide production (which increases dissolved organiccarbon levels and interferes with the stability of the floc blanket), generationof taste and odour, and toxin production.
The high biological productivity in nutrient-enriched water means that BODand sediment oxygen demand in the water column are high as dead materialis broken down. Thus, oxygen can be stripped out of the water column if thebody of water is not well mixed. This can result in a series of ancillaryproblems with raw water quality, such as high manganese, iron, ammoniaand hydrogen sulfide concentrations, all of which are released from thesediment under reducing conditions.
Artificial mixing or aeration of lakes and reservoirs is widely used to preventthese ancillary problems. In some cases, reservoirs may be allowed tothermally stratify and bottom water may be selectively removed from thereservoir – either by opening the scour valve at the base of the dam or bypumping the bottom water over the dam. In deep lakes and reservoirs,artificial mixing may reduce algal levels by circulating algae from welllighted surface waters to a depth at which there is insufficient light for netphotosynthesis.
Box 2.2. Eutrophication
Such reservoirs are often used for irrigation or public supply and areparticularly sensitive to eutrophication (33).
The release of nutrients (particularly nitrogen and phosphorus), whichpredominantly originate from agriculture and domestic sewage, cansignificantly affect the balance of the aquatic ecology and often pro-duce algal blooms throughout the body of water and at the surface.
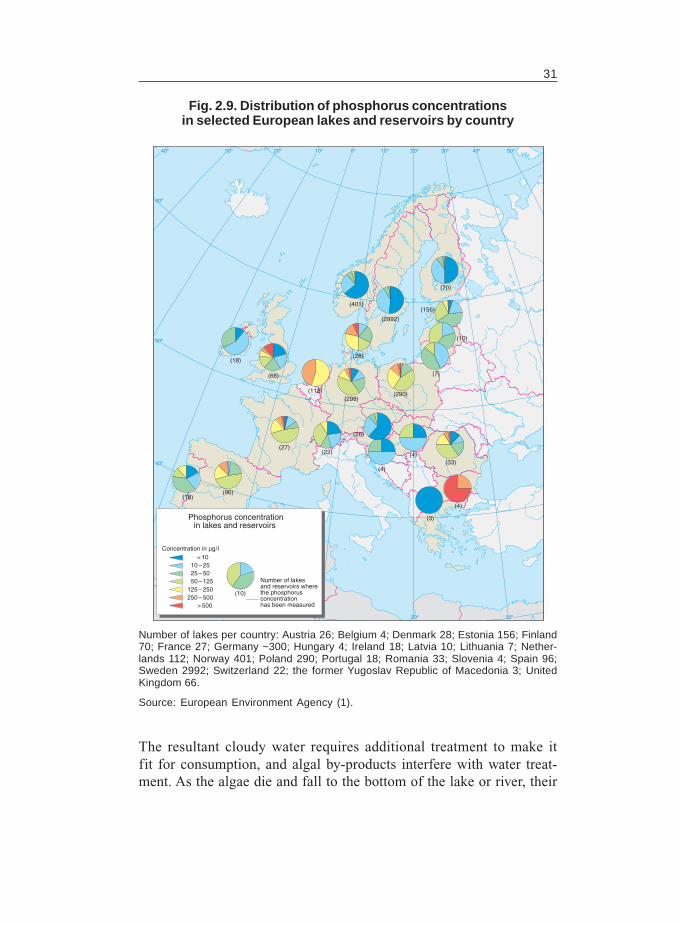
31
The resultant cloudy water requires additional treatment to make itfit for consumption, and algal by-products interfere with water treat-ment. As the algae die and fall to the bottom of the lake or river, their
Number of lakes per country: Austria 26; Belgium 4; Denmark 28; Estonia 156; Finland70; France 27; Germany ~300; Hungary 4; Ireland 18; Latvia 10; Lithuania 7; Nether-lands 112; Norway 401; Poland 290; Portugal 18; Romania 33; Slovenia 4; Spain 96;Sweden 2992; Switzerland 22; the former Yugoslav Republic of Macedonia 3; UnitedKingdom 66.
Source: European Environment Agency (1).
Fig. 2.9. Distribution of phosphorus concentrationsin selected European lakes and reservoirs by country
40º
50º
60º
40º 30º 20º 10º 0º 10º 20º 30º 40º 50º
Phosphorus concentrationin lakes and reservoirs
Concentration in µg/l< 10
10 – 2525 – 5050 – 125
125 – 250250 – 500
> 500
(10)
Number of lakesand reservoirs wherethe phosphorusconcentrationhas been measured
20º 30º
(18)
(66)
(401)
(2992)
(70)
(156)
(10)
(7)
(28)
(112)(298)
(290)
(27)(22)
(96)(18)
(26)
(4)
(4)(33)
(4)
(3)
32
decay exerts an oxygen demand that can deplete the dissolved oxy-gen in the water column (Box 2.2). Significant amounts of phos-phorus can be contained in sediment, and its release can significantlyinfluence the quality of the body of water. In addition, some speciesof cyanobacteria produce toxins (37).
The pollution of surface water by other organic matter often increasesoxygen demand. Much organic matter, such as that contained indomestic wastewater, is easily decomposed in the presence of oxy-gen. The oxygen required for the biological degradation of organicpollutants (measured as BOD) or complete decomposition by allprocesses (COD) is often used as a measure of the contamination ofwater by organic matter. In addition to de-oxygenating the water,decomposition can release high concentrations of ammonia, whichis toxic to aquatic life, and the microbial nitrification of ammoniaexerts an additional oxygen demand.
Eutrophication has become a widespread and severe problem acrossthe European Region, and there has been considerable interest infinding methods to improve affected lakes and in preventing furtherpollution by nutrients (Boxes 2.3 and 2.4). Although there have beensome notable successes in improving water quality by nutrient strip-ping, such as at the Wahnbach Talsperre near Berlin, successful res-toration is not easy. The differences in the properties of lakes andthe changes in the ecosystems that result from eutrophication pre-clude a generic approach that can be applied to all lakes.
GROUNDWATERThe presence of groundwater resources depends largely on the ge-ology of a country. The arrangement of permeable and imperme-able layers of rock and impermeable glacial or glaciofluvial depositsand the presence of underground caverns determine the water stor-age capacity. Groundwater is recharged primarily by percolation ofwater through the soil.
Groundwater is generally of higher quality than surface water sinceit is, except in some karstic horizons, less vulnerable to anthropo-genic contamination. Less treatment is therefore required to make itsafe for use as drinking-water. Nevertheless, groundwater is
33
susceptible to contamination by certain chemicals, with particularproblems occurring from nitrate, pesticides and volatile organic sol-vents. The virtual lack of any losses from volatilization, often mini-mal biodegradation and a long recharge time mean that groundwatersources are very slow to recover from contamination.
Abstraction from groundwaterAquifers can be an efficient natural solution to seasonal water scar-city. Groundwater acts as a year-round resource and, if rechargeduring wet periods is sufficient, can be used to supply water duringtimes of low precipitation. Water quality is often good, and aquifers
Strategies to reduce the nutrient loading of lakes include measures to reducelevels of nutrients entering the tributary streams. These might target diffusesources by, for example, reducing fertilizer application rates or the density ofanimal stocks. However, greater success has been achieved to date bytackling point sources, such as by installing nutrient stripping at wastewatertreatment plants or by reducing the phosphorus content of detergents.Alternative (but much less common) approaches include stripping nutrientsfrom reservoir feeder streams before the water enters the lake, or circulatingnutrient-rich reservoir water through a phosphorus stripping plant andreturning the treated water to the reservoir. Metal salts, such as ferric sulfate,can be dosed to the lakes as flocculants to precipitate the dissolved phos-phorus, but the heavy metals build up in the sediment where they may havea toxic effect.
Unfortunately, water quality is not likely to improve and the ecosystem is notlikely to be restored immediately after any of these measures. Phosphorusstored in the sediment of lakes is released into the water column, and highdissolved concentrations can result from this internal source. Even when thishas stabilized at a lower rate, the ecological balance of the lake may havebeen altered so that, even if phosphorus concentrations are reduced to onethird of their previous level, algal densities may show little change. To reducethis lag, many lake restoration schemes involve either sediment removal orsediment sealing, or inactivation to prevent or inhibit phosphorus release.
Because eutrophication changes ecosystems, the aquatic life in the lake mayneed to be manipulated in addition to addressing the nutrient loading directly.This appears to be especially true for shallow lakes. Removal of the fishspecies that prey on zooplankton such as Daphnia spp. is a commonly usedstrategy, thereby increasing the standing crop of zooplankton and increasinggrazing pressure on the algal population.
There are numerous examples of restoration schemes for lakes or reser-voirs, such as Wahnbach Talsperre (Box 2.4), Finjasjön and Lake Geneva(39,40). The success of different approaches and individual restorationprogrammes varies greatly. The economic and ecological effects ofeutrophication are high, in terms either of additional water treatment or ofrestoration schemes. Prevention is better than cure.
Box 2.3. Restoration of eutrophic lakes
34
can provide quality reserves in areas where surface runoff in sum-mer proves insufficient to maintain acceptable standards of waterquality. The proportion of freshwater demand from groundwater ab-straction varies from country to country. In the EEA area, about18% of the total water abstraction is from groundwater, ranging from91% in Iceland to less than 10% in Belgium. Groundwater abstrac-tion accounts for 90% of total freshwater demand in Georgia (42)and 57% of total abstraction in Belarus (27). The use of aquifersdepends on annual recharge and requires effective management ifsustainability is to be guaranteed. In countries with suff icient
Lake Zurich Lower Basin, SwitzerlandProblem. Improvements to wastewater treatment facilities were originallyconcentrated on reducing organic loadings. Nutrient enrichment was thenconsidered a target for action, although Secchi depths were quite high at 3–11 m.
Action undertaken. Phosphorus removal has been progressively undertakenat wastewater treatment plants in the catchment area since the 1970s. Anational ban on phosphates in detergents was introduced in 1986.
Results. Little change in the Secchi depth of phytoplankton levels despitesubstantial reductions in phosphorus levels.
Lessons. Reducing the in-lake phosphorus concentrations by a factor ofabout 3 from 1974 levels has had relatively little effect on standingpopulations of algae.
Wahnbach Talsperre, GermanyProblem. The reservoir received strongly increased phosphate loadings inthe 1960s and became eutrophic, with blooms of cyanobacteria.
Action undertaken. From 1969 the deep part of the lake received artificialaeration. A full restoration programme was started in 1977. This involvedremoving phosphorus from the tributary by precipitation with iron (III) chlorideand subsequent filtration of the precipitate.
Results. Nutrient removal of the feeder river removed most incomingparticulate phosphorus, which is mainly of mineral composition and wouldotherwise have significantly contributed to the fixation of phosphorus in thesediment. After about 5 years, measurements of chlorophyll concentrationand opacity of the lake water indicated that the restoration has been suc-cessful in decreasing the algal population. Measurements of phosphorusconcentrations confirm a successful reduction of nutrient concentrations.
Lessons. The principal populations of cyanobacteria decreased very rapidlyafter the onset of the phosphate removal, but another mobile species wasable to utilize the phosphorus in the upper layers of the sediment for about5 years after the restoration started, until this phosphorus was also depleted.
Box 2.4. Controlling eutrophication – case studies
Sources: Klapper (41); Ryding & Rast (39); Sas (40).
35
groundwater reserves (Austria, Denmark, Iceland, Portugal and Swit-zerland) more than 75% of the water for public supply is abstractedfrom groundwater. In other countries with scarce groundwater re-serves or with abundant, clean, surface water reserves the propor-tion abstracted for drinking-water falls to below 50%.
Over-exploitation and saline intrusionAquifers vary in size, and many of those exploited for abstractioncontain large volumes of water. However, aquifers usually rechargeslowly, and current abstraction levels may, in some cases, not besustainable. In many cases, determining whether over-exploitationis occurring is difficult. It is often thought of as being a relativelystraightforward question of water taken out of the aquifer and waterfiltering back into it. Difficulties in estimating long-term rechargeconfound this simple approach.
Exploitation of groundwater sources beyond a sustainable level canaffect the environment (such as loss of wetlands and effects on riverecosystems) and reduce the future availability of the resource. Whenaquifers near the coast are over-exploited, salt water may intrude,reducing the quality of the groundwater. In some coastal regions insouthern Europe in particular, aquifers have very limited annual re-charge and saline intrusion has occurred (1), reducing the flexibilityof water resources for required uses. Over-exploitation is most likelyto occur in arid or semi-arid regions where recharge is low, but thereare nevertheless a number of over-exploited aquifers in temperateclimates. The rural aquifer north of Nottingham in the United King-dom is experiencing over-exploitation, causing wetlands to dry out.Irregular surface water resources and an increasing water demandhave led to dependence on groundwater. Aquifers supplying Barce-lona, Marseilles, Athens and the French Riviera, for example, arealready stressed and are expected to deteriorate further (43).
Aquifer rechargingArtificial recharging of aquifers is used to avoid or rectify problemsof over-exploitation. Surface water and wastewater are both poten-tial sources of water for artificial recharging. Direct injection of waterinto the groundwater zone is one method of recharging and can beused to create a barrier against saltwater intrusion in coastal areas.Surface spreading or dune or bank filtration are more often used; as
36
the water percolates downwards, the soil or sand acts as a naturalfilter to remove particulate matter, microorganisms and some dis-solved compounds. Depending on the soil characteristics and theextent and type of contamination of the water used for recharging,the groundwater may become polluted. Where reclaimed wastewateris used, treatment may be necessary to eliminate microorganisms.
In the Netherlands, where depletion of groundwater resources is rec-ognized as a problem (44), a significant proportion of the waterabstracted from surface sources is used to artificially rechargegroundwater using such methods as dune filtration. Artificial re-charging is also common in Germany, where water is treated (suchas by coagulation) to reduce contamination by microorganisms andorganic compounds before it is used for recharging.
Bank-filtered water may also be used for drinking-water. In this case,water from a contaminated surface water source (usually a river) isallowed to filter into the groundwater zone through the river bankand to travel through the aquifer to an extraction well some distancefrom the river. In some cases there is a very short residence time inthe aquifer, perhaps as little as 20–30 days, and there is almost nodilution by natural groundwater (45).
NitratesThe natural level of nitrate in groundwater is generally below10.0 mg/l. Elevated nitrate levels are especially caused by the agri-cultural use of nitrogen fertilizers and manure in excess of plantrequirements, or by their application at the wrong time of the year.Local pollution from municipal or industrial sources can also beimportant. On-site sanitation and leaky sewer pipes in urban areasmay also contribute to increased nitrate levels. Certain types of aq-uifer, such as alluvial and shallow aquifers, are more vulnerable tonitrate pollution than others because of differences in such featuresas hydrogeology and land use. Deep or confined aquifers are gen-erally better protected.
Nitrate moves relatively slowly through the ground, so there can bea significant time lag between the polluting activity and the detec-tion of the pollutant in groundwater (typically between 1 and20 years). The general intensification of agriculture over the last
37
30 years has only relatively recently been reflected in increasingnitrate concentrations in groundwater.
The WHO guideline value for nitrate in water intended for humanconsumption is 50 mg/l NO
3 (46). The EU Drinking Water Directive
(47,48) permits the same concentrations. The results fromgroundwater monitoring programmes in 17 European countriesshowed high levels of nitrate (greater than 25 mg/l) in groundwaterin 50% of the sampling sites in Slovenia. In eight countries this levelwas exceeded in about 25% of the sites and, in one country (Roma-nia) 35% exceeded 50 mg/l (1). In Denmark, for example, about 2%of all supply wells have been closed since 1986 because nitrate con-centrations were above 50 mg/l. Fig. 2.10 provides an overview ofthe regions in Europe where groundwater is affected by high nitrateconcentrations.
High nitrate concentrations can be localized, largely depending onland use. This is the case in Latvia, for example, where groundwateris polluted by agricultural land regionally. At sites with intensifieduse of agricultural chemicals, nitrate concentrations increased in 55%of boreholes between 1988 and 1990. In the newly independentstates of the former USSR, 20% of groundwater sites are contami-nated with agricultural contaminants (7). The Republic of Moldovareports that half the drinking-water supplies from groundwater inthe Prut River basin have nitrate concentrations exceeding 45 mg/l(29). High nitrate concentrations (in excess of 50 mg/l) are found in15% of sampling sites in Austria, and in 28% of sites more than30 mg/l was found.
In many countries, nitrate concentrations in groundwater have in-creased since the middle of the 20th century, following the intensifi-cation of farming methods and an increase in the area used forfarming. Nitrate levels are currently above maximum permissiblelevels in 76% of wells in Belarus, with concentrations up to 300–600 mg/l (27). In a number of countries in the eastern part of theRegion, such as Hungary and Romania, nitrate levels have declined.This is probably related to a reduced economic potential for pur-chasing agricultural chemicals. Monitoring data show different trendsin a number of western European countries, even over a short periodin the 1990s, although a much longer period of time is needed to
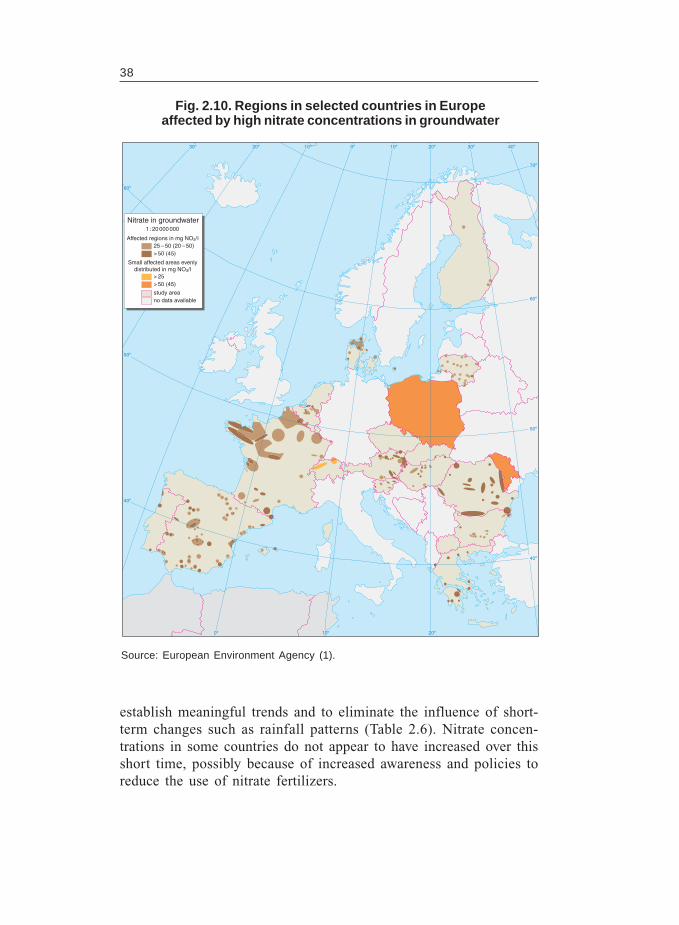
38
establish meaningful trends and to eliminate the influence of short-term changes such as rainfall patterns (Table 2.6). Nitrate concen-trations in some countries do not appear to have increased over thisshort time, possibly because of increased awareness and policies toreduce the use of nitrate fertilizers.
Fig. 2.10. Regions in selected countries in Europeaffected by high nitrate concentrations in groundwater
Source: European Environment Agency (1).
50º
60º
70º
40º30º20º10º0º10º20º30º
60º
50º
40º
0º 10º 20º
40º
Nitrate in groundwater1: 20 000 000
no data availablestudy area
> 50 (45)> 25
Small affected areas evenlydistributed in mg NO3/l
> 50 (45)25 – 50 (20 – 50)
Affected regions in mg NO3/l
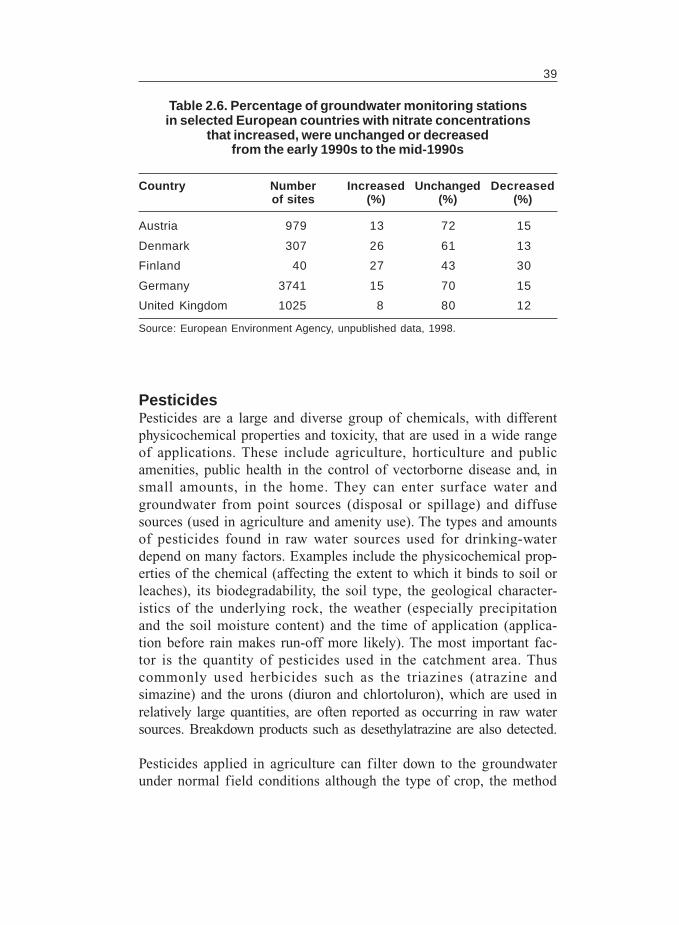
39
Country Number Increased Unchanged Decreasedof sites (%) (%) (%)
Austria 979 13 72 15
Denmark 307 26 61 13
Finland 40 27 43 30
Germany 3741 15 70 15
United Kingdom 1025 8 80 12
Source: European Environment Agency, unpublished data, 1998.
Table 2.6. Percentage of groundwater monitoring stationsin selected European countries with nitrate concentrations
that increased, were unchanged or decreasedfrom the early 1990s to the mid-1990s
PesticidesPesticides are a large and diverse group of chemicals, with differentphysicochemical properties and toxicity, that are used in a wide rangeof applications. These include agriculture, horticulture and publicamenities, public health in the control of vectorborne disease and, insmall amounts, in the home. They can enter surface water andgroundwater from point sources (disposal or spillage) and diffusesources (used in agriculture and amenity use). The types and amountsof pesticides found in raw water sources used for drinking-waterdepend on many factors. Examples include the physicochemical prop-erties of the chemical (affecting the extent to which it binds to soil orleaches), its biodegradability, the soil type, the geological character-istics of the underlying rock, the weather (especially precipitationand the soil moisture content) and the time of application (applica-tion before rain makes run-off more likely). The most important fac-tor is the quantity of pesticides used in the catchment area. Thuscommonly used herbicides such as the triazines (atrazine andsimazine) and the urons (diuron and chlortoluron), which are used inrelatively large quantities, are often reported as occurring in raw watersources. Breakdown products such as desethylatrazine are also detected.
Pesticides applied in agriculture can filter down to the groundwaterunder normal field conditions although the type of crop, the method
40
and rate of applying the pesticide and the equipment used may in-fluence the infiltration rate. During application in the spring andsubsequently through the summer months, the moisture deficit withinthe soil profile restricts the vertical movement of pesticides throughit. Adsorption onto organic carbon further retards movement throughthe profile, and degradation by soil microbial processes reducesthe concentration of pesticides available for leaching. In wettermonths water will start to migrate through the unsaturated zone.The solute will be subject to further biochemical decay as it movesthrough the aquifer matrix, moving slowly via intergranular flowpaths. Where there are karstic conditions (f issure flow) or highflux rates due to blind ditches or topography, however,groundwater recharge pathways tend to be highly developed and,under these conditions, pesticides have the potential to migratethrough thick layers of unsaturated material to inf iltrategroundwater quickly. Infiltration of pesticides can occur year roundfollowing heavy rainfall, especially when this follows soon afterapplication.
Because of the huge number of pesticides (over 800 are approvedfor use in Europe), efficient monitoring of residues in the environ-ment is complex and expensive. The most cost-effective basis for amonitoring programme is likely to be restricting analysis to the pes-ticides most likely to be used in the area. However, this approachrenders difficult the comparison of data from different sites and coun-tries and at different points in time. Such differences in reportingconcentrations as exceeding a specific limit or being above the limitof detection also make comparison difficult. In addition, monitor-ing may concentrate on sites that are suspected or known to be con-taminated, therefore producing a non-representative sample ofmonitoring results. Table 2.7 provides an overview of selected pesti-cides at the country and regional levels and the percentage of sam-pling sites where the average annual pesticide concentration exceeds0.1 µg/l.
Much of the monitoring of pesticides in groundwater in EU coun-tries has been carried out solely to comply with the EU DrinkingWater Directive (47,48). Current monitoring is not sufficient to es-tablish the extent of contamination of groundwater with pesticidesor to establish any trend in concentrations (49).
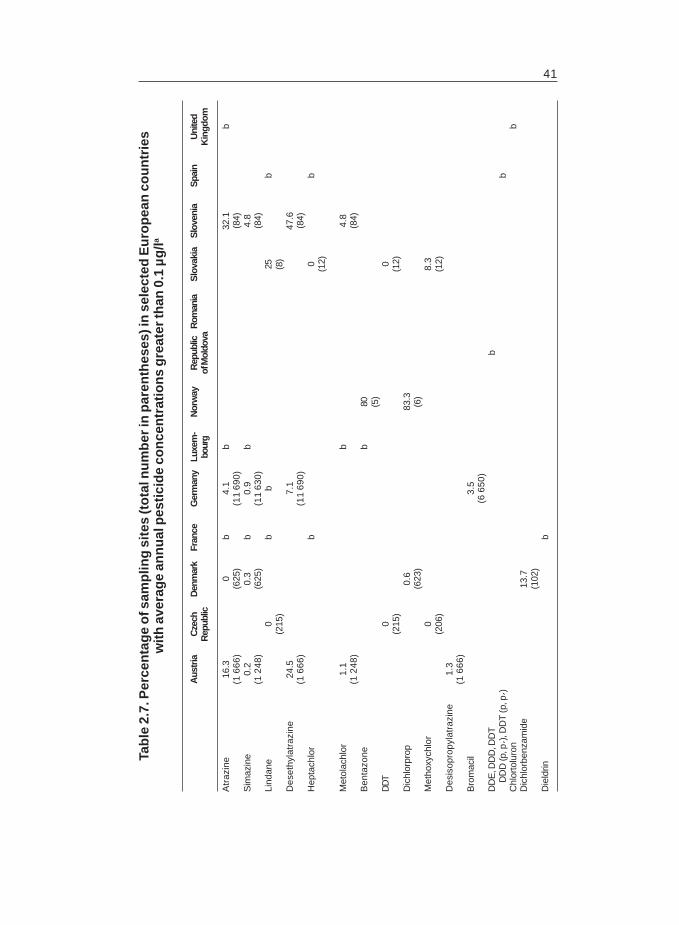
41
Aus
tria
Cze
chD
enm
ark
Fran
ceG
erm
any
Luxe
m-
Nor
way
Rep
ublic
Rom
ania
Slo
vaki
aS
love
nia
Spa
inU
nite
dR
epub
licbo
urg
of M
oldo
vaK
ingd
om
Atr
azin
e16
.30
b4.
1b
32.1
b(1
666
)(6
25)
(11
690)
(84)
Sim
azin
e0.
20.
3b
0.9
b4.
8(1
248
)(6
25)
(11
630)
(84)
Lind
ane
0b
b25
b(2
15)
(8)
Des
ethy
latr
azin
e24
.57.
147
.6(1
666
)(1
1 69
0)(8
4)H
epta
chlo
rb
0b
(12)
Met
olac
hlor
1.1
b4.
8(1
248
)(8
4)B
enta
zone
b80 (5
)D
DT
00
(215
)(1
2)D
ichl
orpr
op0.
683
.3(6
23)
(6)
Met
hoxy
chlo
r0
8.3
(206
)(1
2)D
esis
opro
pyla
traz
ine
1.3
(1 6
66)
Bro
mac
il3.
5(6
650
)D
DE
, DD
D, D
DT
bD
DD
(p,p
), D
DT
(p,p
)b
Chl
orto
luro
nb
Dic
hlor
benz
amid
e13
.7(1
02)
Die
ldrin
b
Tab
le 2
.7. P
erce
nta
ge
of s
amp
ling
sit
es (t
ota
l nu
mb
er in
par
enth
eses
) in
sel
ecte
d E
uro
pea
n c
ou
ntr
ies
wit
h a
vera
ge
ann
ual
pes
tici
de
con
cen
trat
ion
s g
reat
er th
an 0
.1 µ
g/la
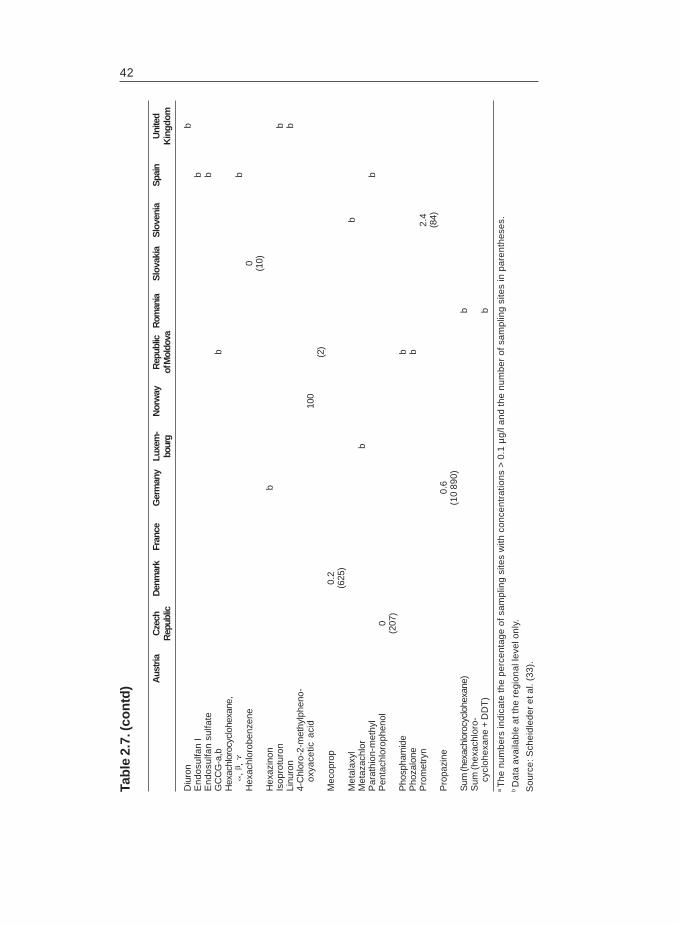
42
aT
he n
umbe
rs in
dica
te th
epe
rcen
tage
of s
ampl
ing
site
s w
ith c
once
ntra
tions
>0.
1 µ
g/l a
nd th
e nu
mbe
r of
sam
plin
g si
tes
in p
aren
thes
es.
bD
ata
avai
labl
e at
the
regi
onal
leve
l onl
y.
Sou
rce
: Sch
eidl
eder
et a
l. (3
3).
Aus
tria
Cze
chD
enm
ark
Fran
ceG
erm
any
Luxe
m-
Nor
way
Rep
ublic
Rom
ania
Slo
vaki
aS
love
nia
Spa
inU
nite
dR
epub
licbo
urg
of M
oldo
vaK
ingd
om
Diu
ron
bE
ndos
ulfa
n I
bE
ndos
ulfa
n su
lfate
bG
CC
G-a
,bb
Hex
achl
oroc
yclo
hexa
ne,
α,
β ,γ
bH
exac
hlor
oben
zene
0(1
0)H
exaz
inon
bIs
opro
turo
nb
Linu
ron
b4-
Chl
oro-
2-m
ethy
lphe
no-
oxya
cetic
aci
d10
0(2
)M
ecop
rop
0.2
(625
)M
etal
axyl
bM
etaz
achl
orb
Par
athi
on-m
ethy
lb
Pen
tach
loro
phen
ol0
(207
)P
hosp
ham
ide
bP
hoza
lone
bP
rom
etry
n2.
4(8
4)P
ropa
zine
0.6
(10
890)
Sum
(hex
achl
oroc
yclo
hexa
ne)
bS
um (h
exac
hlor
o-cy
cloh
exan
e +
DD
T)
b
Tab
le 2
.7. (
con
td)
43
The pesticides that have been detected most frequently in groundwaterare the triazine herbicides, especially atrazine and simazine, and theirbreakdown products. These are broad-spectrum herbicides that havebeen used extensively in both agricultural and non-agricultural situ-ations. Because they frequently appear in groundwater, several coun-tries have banned or restricted the use of products containing theseactive ingredients, and a recent assessment (49) revealed a statisti-cally significant downward trend in the contamination of groundwaterwith atrazine and its metabolites in a number of countries, includingAustria and Switzerland and parts of France, Germany and Latvia.In Baden-Württemberg in Germany, however, where atrazine con-centrations in groundwater appear to be decreasing, concentrationsof another triazine herbicide, hexazinon, show an upward trend (49).
Limited data are available on contamination of surface water withpesticides. On the island of Fyn in Denmark, for example, watersamples taken in 1994 and 1995 from six streams showed 25 differ-ent substances in concentrations exceeding the detection limit. Thehighest concentrations were found in the spring, coinciding withpesticide application in the fields (1).
Hydrocarbons and chlorinated hydrocarbonsHydrocarbons and chlorinated hydrocarbons are important contami-nants of groundwater in a number of European countries. Chlorin-ated hydrocarbons are widely distributed in groundwater in westernEurope, where they have been extensively used as solvents. Be-cause of their volatility, chlorinated solvents that are accidentallyreleased to surface water may be rapidly removed by evaporationand are not a significant pollution problem. In contrast, contamina-tion of groundwater is extremely persistent. A number of studieshave investigated the extent of contamination of aquifers by chlo-rinated organic solvents, such as trichloroethene and tetra-chloroethene, in western Europe. The picture that emerges is ofwidespread, low-level contamination in aquifers under industrial-ized areas, with localized high levels of contamination.
Groundwater contamination by hydrocarbons from petrol stations,petrochemical plants and pipelines and military sites, in particular,is a problem throughout Europe. Groundwater in Estonia, for exam-ple, is polluted by leakage from fuel tanks (50).
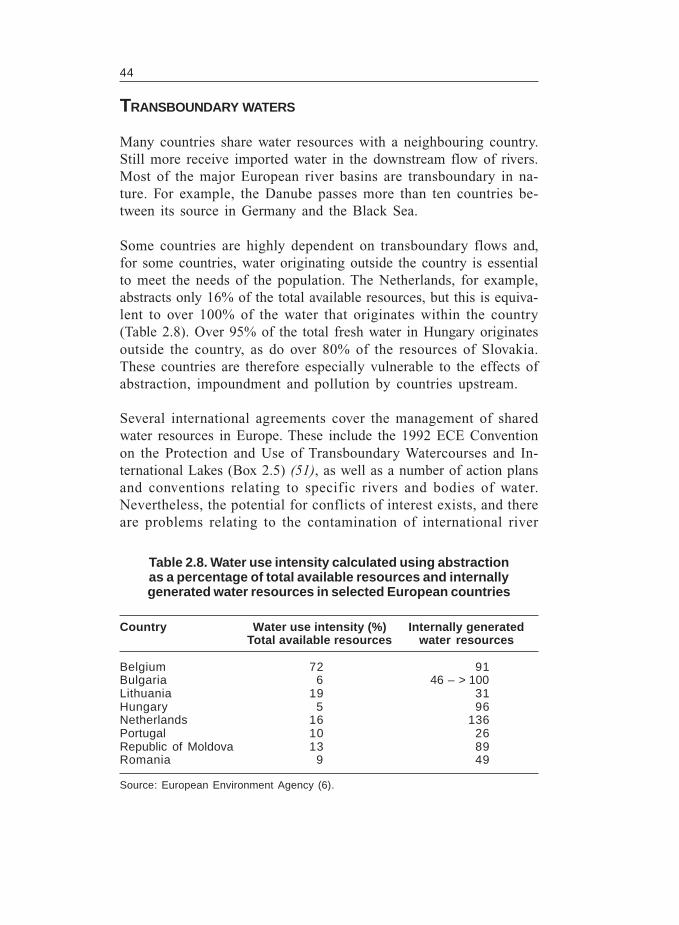
44
TRANSBOUNDARY WATERS
Many countries share water resources with a neighbouring country.Still more receive imported water in the downstream flow of rivers.Most of the major European river basins are transboundary in na-ture. For example, the Danube passes more than ten countries be-tween its source in Germany and the Black Sea.
Some countries are highly dependent on transboundary flows and,for some countries, water originating outside the country is essentialto meet the needs of the population. The Netherlands, for example,abstracts only 16% of the total available resources, but this is equiva-lent to over 100% of the water that originates within the country(Table 2.8). Over 95% of the total fresh water in Hungary originatesoutside the country, as do over 80% of the resources of Slovakia.These countries are therefore especially vulnerable to the effects ofabstraction, impoundment and pollution by countries upstream.
Several international agreements cover the management of sharedwater resources in Europe. These include the 1992 ECE Conventionon the Protection and Use of Transboundary Watercourses and In-ternational Lakes (Box 2.5) (51), as well as a number of action plansand conventions relating to specific rivers and bodies of water.Nevertheless, the potential for conflicts of interest exists, and thereare problems relating to the contamination of international river
Country Water use intensity (%) Internally generatedTotal available resources water resources
Belgium 72 91Bulgaria 6 46 – > 100Lithuania 19 31Hungary 5 96Netherlands 16 136Portugal 10 26Republic of Moldova 13 89Romania 9 49
Source: European Environment Agency (6).
Table 2.8. Water use intensity calculated using abstractionas a percentage of total available resources and internallygenerated water resources in selected European countries
45
Source: United Nations Economic Commission for Europe (51).
Objectives• To prevent, control and reduce pollution of waters causing or likely to
cause transboundary impact.
• To ensure that transboundary waters are used with the aim of ecologi-cally sound and rational water management, conservation of waterresources and environmental protection.
• To ensure that transboundary waters are used in a reasonable andequitable way, taking into particular account their transboundary charac-ter, in the case of activities that cause or are likely to causetransboundary impact.
• To ensure conservation and, where necessary, restoration of ecosys-tems.
Actions achieved• Measures required for preventing, controlling and reducing water
pollution.
• Ratified by 31 Parties (30 countries plus the European Union) as of 28September 2000.
• Convention came into force on 6 October 1996.
Box 2.5. The 1992 Convention on the Protection and Use ofTransboundary Watercourses and International Lakes
catchment areas and aquifers. Important international monitoringprogrammes also exist for large lakes where international commis-sions have been set up to coordinate action programmes. Notableexamples of such programmes are:
• Lake Geneva – France and Switzerland (protection, navigation,monitoring and abstraction);
• Lake Constance – Austria, Switzerland and Germany (protectionand abstraction);
• Inari – Finland and Norway (regulation of hydroelectric power);• Lugano – Italy and Switzerland (regulated by the Convention)
(1); and• GEMS/Water – an international programme on water quality moni-
toring and assessment.
The last mentioned is jointly implemented by WHO, the World Me-teorological Organization, the United Nations Environment Pro-gramme and the United Nations Educational, Scientific and Cultural
46
Organization. It aims to assist countries in establishing and strength-ening their water quality monitoring operations, and provides meth-odological and quality assurance support to the sustainablemanagement of freshwater resources.
EFFECTS OF CLIMATE CHANGE ON THE QUALITY OF WATERRESOURCES
Saline may intrude into groundwater supplies as a result of a risingsea level. Water quality will be most affected where salinity is al-ready a problem because aquifers are being over-exploited (22). Lessobvious effects of a rising water table may include the release ofcontaminants from septic systems and of pollutants from under-ground waste-disposal sites. Coastal flooding is likely to be the mostimmediate and significant short-term effect, however, causing dis-ruption of the sanitation infrastructure and potential contaminationof watercourses by sewage.
The predicted increase in episodes of heavy rainfall will result inincreased contamination of surface water by runoff, especially byeroded soil, microorganisms, pesticides and fertilizers (22). Areaswith no vegetation cover are especially vulnerable to run-off of soiland particulate matter during heavy rainfall.
The resulting poorer water quality will require more robust watertreatment measures, although the effectiveness of water treatmentmay also be compromised by some of the predicted changes. Heavyrainfall and high winter river flows will result in source water withless dissolved salts and lower alkalinity. Greater variability of riverflows (increased winter flow, reduced summer flow and increasedvariability between years) will make it more difficult to plan anddesign appropriate facilities for treating and distributing drinking-water.
3Driving forces and pressures
on water resources
47
The water resources of a country depend on many factors, includ-ing its climate, geography and geology. The pressures on these re-sources are determined by the population density and the agricultural,industrial and domestic practices of the population.
The water resources of the European Region as a whole are suffi-cient to supply the requirements of the population. Comparisons oftotal freshwater abstraction with the resources available suggest thatmost European countries have sufficient resources to meet the na-tional needs (Fig. 3.1 and 3.2). Nevertheless, water resources areunevenly distributed and are reported to be insufficient in southernUkraine, the Republic of Moldova, the middle and lower reaches ofthe River Volga, the Caspian lowland, the southern parts of westernSiberia, Kazakhstan and the Turkmenistan lowland (7).
Data relating to the relative demands exerted by different sectors ona country’s water resources vary significantly, depending on thesource of the data (52). These differences largely result from differ-ing approaches to data collection (such as including industries sup-plied by the public water networks in statistics on municipal wateruse, and including cooling water in power plants or water used forhydroelectric power production in the definition of industrial use).Nevertheless, in many cases, especially in southern Europe (Greece,Italy, Portugal and Spain), agricultural water use (mainly for irriga-tion and livestock) is highly significant and can account for more
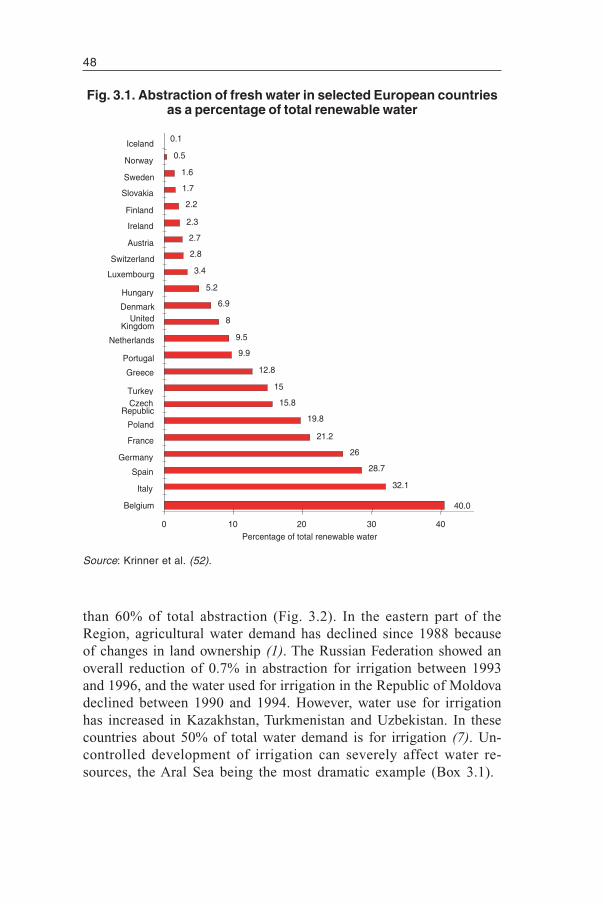
48
Fig. 3.1. Abstraction of fresh water in selected European countriesas a percentage of total renewable water
40.0
32.1
28.7
26
21.2
19.8
15.8
15
12.8
9.9
9.5
8
6.9
5.2
3.4
2.8
2.7
2.3
2.2
1.7
1.6
0.5
0.1
0 10 20 30 40
Belgium
Germany
France
Poland
Turkey
Portugal
Netherlands
Hungary
Switzerland
Austria
Ireland
Finland
Sweden
Norway
Iceland
Slovakia
Luxembourg
DenmarkUnited
Kingdom
Greece
CzechRepublic
Spain
Italy
Percentage of total renewable water
Source: Krinner et al. (52).
than 60% of total abstraction (Fig. 3.2). In the eastern part of theRegion, agricultural water demand has declined since 1988 becauseof changes in land ownership (1). The Russian Federation showed anoverall reduction of 0.7% in abstraction for irrigation between 1993and 1996, and the water used for irrigation in the Republic of Moldovadeclined between 1990 and 1994. However, water use for irrigationhas increased in Kazakhstan, Turkmenistan and Uzbekistan. In thesecountries about 50% of total water demand is for irrigation (7). Un-controlled development of irrigation can severely affect water re-sources, the Aral Sea being the most dramatic example (Box 3.1).
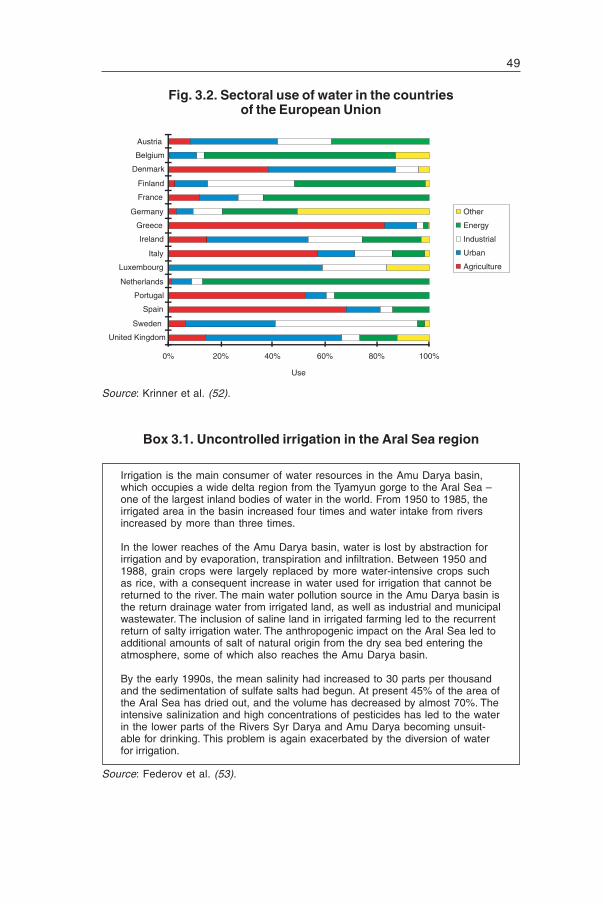
49
Fig. 3.2. Sectoral use of water in the countriesof the European Union
Source: Krinner et al. (52).
Irrigation is the main consumer of water resources in the Amu Darya basin,which occupies a wide delta region from the Tyamyun gorge to the Aral Sea –one of the largest inland bodies of water in the world. From 1950 to 1985, theirrigated area in the basin increased four times and water intake from riversincreased by more than three times.
In the lower reaches of the Amu Darya basin, water is lost by abstraction forirrigation and by evaporation, transpiration and infiltration. Between 1950 and1988, grain crops were largely replaced by more water-intensive crops suchas rice, with a consequent increase in water used for irrigation that cannot bereturned to the river. The main water pollution source in the Amu Darya basin isthe return drainage water from irrigated land, as well as industrial and municipalwastewater. The inclusion of saline land in irrigated farming led to the recurrentreturn of salty irrigation water. The anthropogenic impact on the Aral Sea led toadditional amounts of salt of natural origin from the dry sea bed entering theatmosphere, some of which also reaches the Amu Darya basin.
By the early 1990s, the mean salinity had increased to 30 parts per thousandand the sedimentation of sulfate salts had begun. At present 45% of the area ofthe Aral Sea has dried out, and the volume has decreased by almost 70%. Theintensive salinization and high concentrations of pesticides has led to the waterin the lower parts of the Rivers Syr Darya and Amu Darya becoming unsuit-able for drinking. This problem is again exacerbated by the diversion of waterfor irrigation.
0% 20% 40% 60% 80% 100%
United Kingdom
Sweden
Spain
Portugal
Netherlands
Luxembourg
Italy
Ireland
Greece
Germany
France
Finland
Denmark
Belgium
Austria
Use
Other
Energy
Industrial
Urban
Agriculture
Box 3.1. Uncontrolled irrigation in the Aral Sea region
Source: Federov et al. (53).
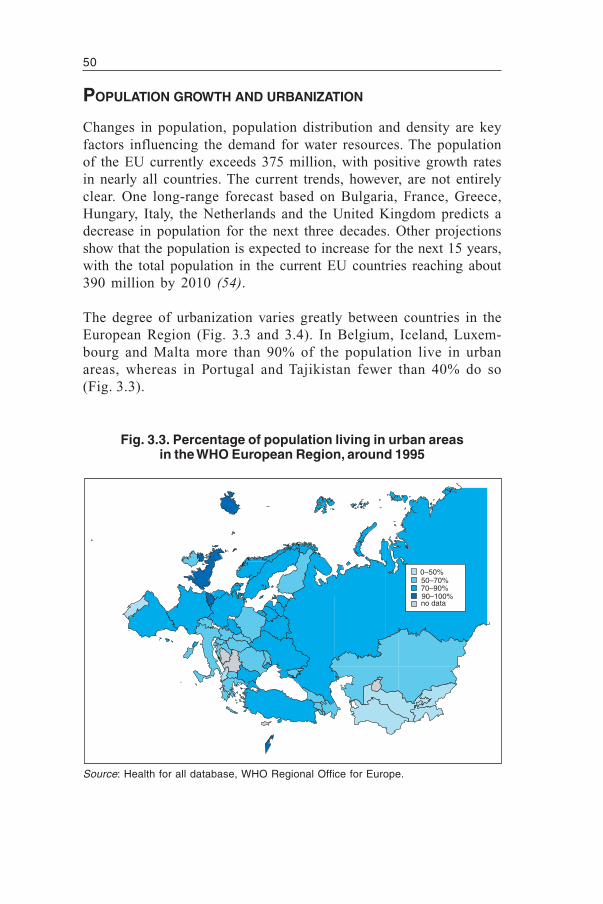
50
POPULATION GROWTH AND URBANIZATION
Changes in population, population distribution and density are keyfactors influencing the demand for water resources. The populationof the EU currently exceeds 375 million, with positive growth ratesin nearly all countries. The current trends, however, are not entirelyclear. One long-range forecast based on Bulgaria, France, Greece,Hungary, Italy, the Netherlands and the United Kingdom predicts adecrease in population for the next three decades. Other projectionsshow that the population is expected to increase for the next 15 years,with the total population in the current EU countries reaching about390 million by 2010 (54).
The degree of urbanization varies greatly between countries in theEuropean Region (Fig. 3.3 and 3.4). In Belgium, Iceland, Luxem-bourg and Malta more than 90% of the population live in urbanareas, whereas in Portugal and Tajikistan fewer than 40% do so(Fig. 3.3).
Fig. 3.3. Percentage of population living in urban areasin the WHO European Region, around 1995
0–50%50–70%70–90%90–100%no data
Source: Health for all database, WHO Regional Office for Europe.
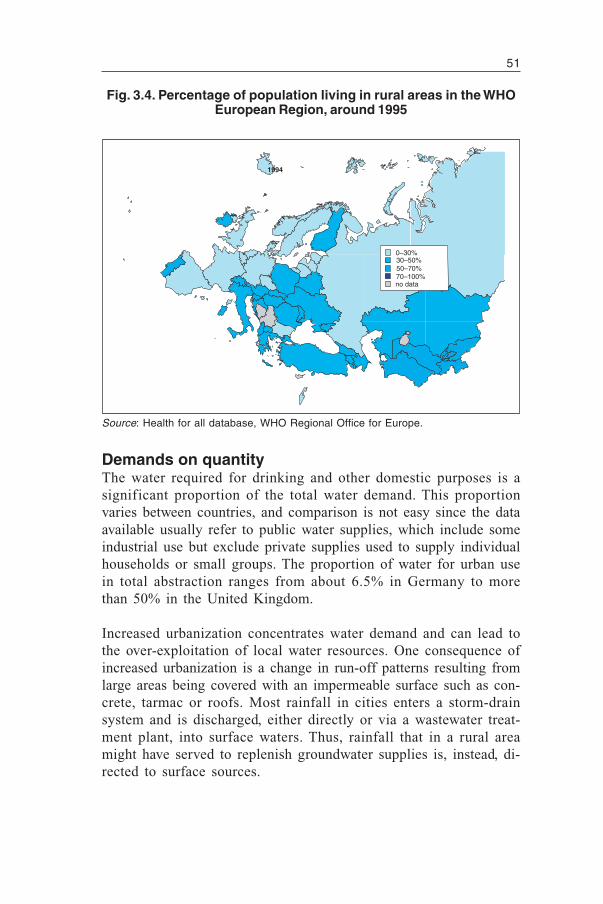
51
0–30%30–50%50–70%70–100%no data
1994
Fig. 3.4. Percentage of population living in rural areas in the WHOEuropean Region, around 1995
Demands on quantityThe water required for drinking and other domestic purposes is asignificant proportion of the total water demand. This proportionvaries between countries, and comparison is not easy since the dataavailable usually refer to public water supplies, which include someindustrial use but exclude private supplies used to supply individualhouseholds or small groups. The proportion of water for urban usein total abstraction ranges from about 6.5% in Germany to morethan 50% in the United Kingdom.
Increased urbanization concentrates water demand and can lead tothe over-exploitation of local water resources. One consequence ofincreased urbanization is a change in run-off patterns resulting fromlarge areas being covered with an impermeable surface such as con-crete, tarmac or roofs. Most rainfall in cities enters a storm-drainsystem and is discharged, either directly or via a wastewater treat-ment plant, into surface waters. Thus, rainfall that in a rural areamight have served to replenish groundwater supplies is, instead, di-rected to surface sources.
Source: Health for all database, WHO Regional Office for Europe.
52
Urbanization often, though not always, accompanies increased in-dustrialization and economic activity. The resulting rise in the stand-ard of living is generally associated with increased water demand,for example from the use of water-consuming household appliances.However, urban water demand is expected to stabilize as a result ofthe development and use of appliances that are more water-efficient.
Threats to qualityIn most European cities, human waste is removed from the house orlatrine by a water-flush system. This wastewater enters a network ofpipes along with other household wastewater. This wastewater may re-ceive varying degrees of treatment to remove contaminants, or no treat-ment at all, depending on the country and the location before discharge.Wastewater in public systems is treated at municipal treatment plants,which often receive industrial wastewater as well as domestic sewage.
Although the concentration of large numbers of people in close prox-imity simplifies the processes of water supply and wastewater col-lection, disposal of the large amounts of waste generated cancompromise the water quality in the recipient body of water. Therelease of untreated or partly treated wastewater to surface waterproduces contamination by microorganisms and nutrients and in-creases the BOD (see Chapter 2). The conventional mechanical (pri-mary) and biological (secondary) wastewater treatment methods donot remove microorganisms or nutrients such as nitrogen and phos-phorus. Additional (tertiary) treatment to remove phosphorus hasbeen common in Finland and Sweden since the mid-1970s and isbecoming more common in other western and northern Europeancountries. In much of Europe, however, effluents discharged fromwastewater treatment plants contain nutrients that contribute toeutrophication (see page 30).
Wastewater effluent is the most significant contributor of phospho-rus to surface water, and detergent adds significantly to the phos-phorus content of domestic sewage. Bans or voluntary agreementshave been successful in reducing the use of phosphate-based deter-gents in a number of European countries.
Evidence also suggests that domestic sewage is a source of endocrine-disrupting chemicals in the aquatic environment. Studies of sewage
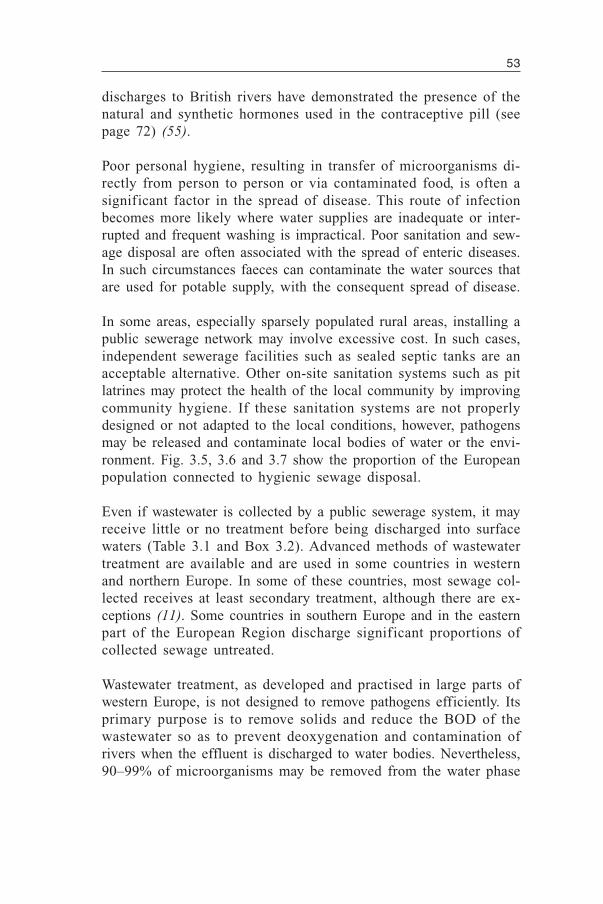
53
discharges to British rivers have demonstrated the presence of thenatural and synthetic hormones used in the contraceptive pill (seepage 72) (55).
Poor personal hygiene, resulting in transfer of microorganisms di-rectly from person to person or via contaminated food, is often asignificant factor in the spread of disease. This route of infectionbecomes more likely where water supplies are inadequate or inter-rupted and frequent washing is impractical. Poor sanitation and sew-age disposal are often associated with the spread of enteric diseases.In such circumstances faeces can contaminate the water sources thatare used for potable supply, with the consequent spread of disease.
In some areas, especially sparsely populated rural areas, installing apublic sewerage network may involve excessive cost. In such cases,independent sewerage facilities such as sealed septic tanks are anacceptable alternative. Other on-site sanitation systems such as pitlatrines may protect the health of the local community by improvingcommunity hygiene. If these sanitation systems are not properlydesigned or not adapted to the local conditions, however, pathogensmay be released and contaminate local bodies of water or the envi-ronment. Fig. 3.5, 3.6 and 3.7 show the proportion of the Europeanpopulation connected to hygienic sewage disposal.
Even if wastewater is collected by a public sewerage system, it mayreceive little or no treatment before being discharged into surfacewaters (Table 3.1 and Box 3.2). Advanced methods of wastewatertreatment are available and are used in some countries in westernand northern Europe. In some of these countries, most sewage col-lected receives at least secondary treatment, although there are ex-ceptions (11). Some countries in southern Europe and in the easternpart of the European Region discharge significant proportions ofcollected sewage untreated.
Wastewater treatment, as developed and practised in large parts ofwestern Europe, is not designed to remove pathogens efficiently. Itsprimary purpose is to remove solids and reduce the BOD of thewastewater so as to prevent deoxygenation and contamination ofrivers when the effluent is discharged to water bodies. Nevertheless,90–99% of microorganisms may be removed from the water phase
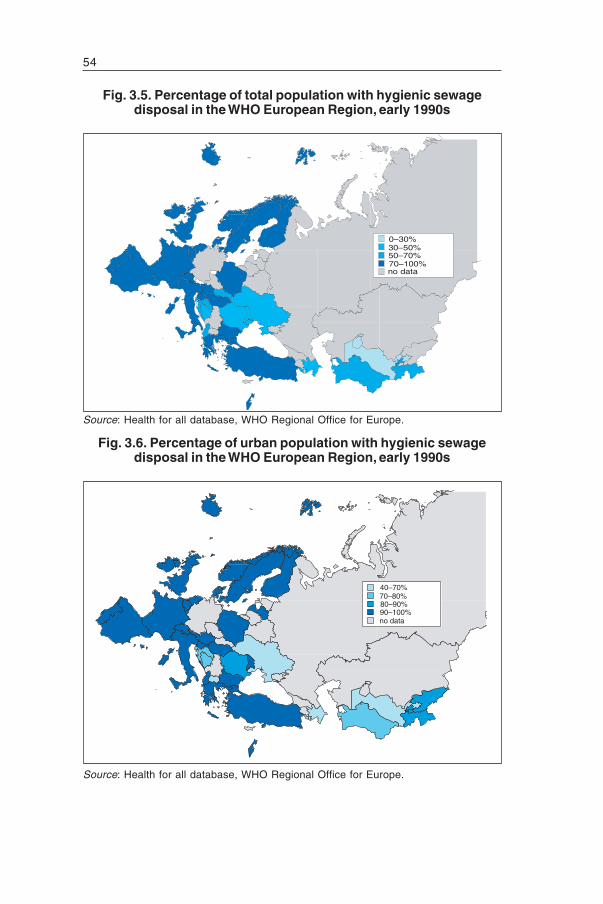
54
Fig. 3.5. Percentage of total population with hygienic sewagedisposal in the WHO European Region, early 1990s
0–30%
no data
30–50%50–70%70–100%
40–70%70–80%80–90%90–100%no data
Fig. 3.6. Percentage of urban population with hygienic sewagedisposal in the WHO European Region, early 1990s
Source: Health for all database, WHO Regional Office for Europe.
Source: Health for all database, WHO Regional Office for Europe.
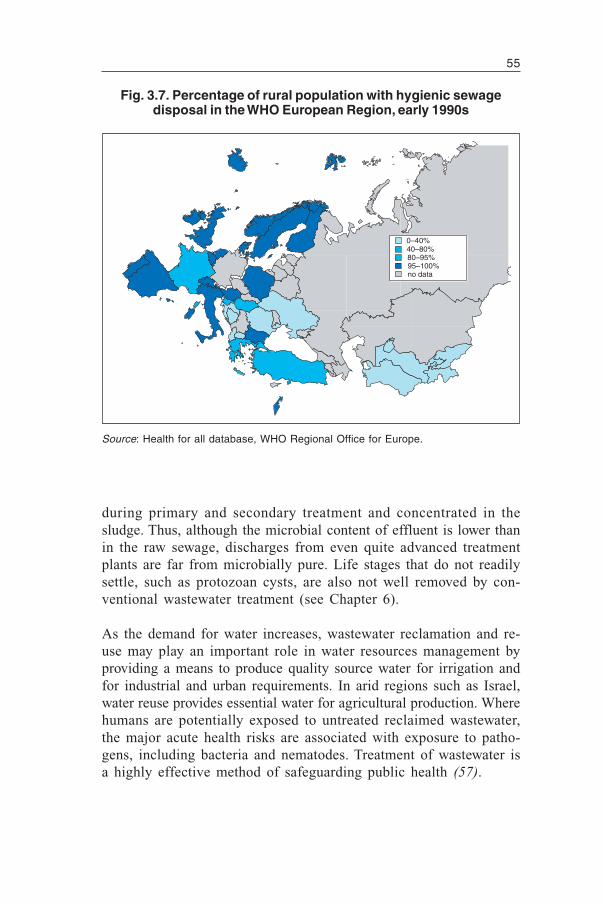
55
0–40%40–80%80–95%95–100%no data
Fig. 3.7. Percentage of rural population with hygienic sewagedisposal in the WHO European Region, early 1990s
during primary and secondary treatment and concentrated in thesludge. Thus, although the microbial content of effluent is lower thanin the raw sewage, discharges from even quite advanced treatmentplants are far from microbially pure. Life stages that do not readilysettle, such as protozoan cysts, are also not well removed by con-ventional wastewater treatment (see Chapter 6).
As the demand for water increases, wastewater reclamation and re-use may play an important role in water resources management byproviding a means to produce quality source water for irrigation andfor industrial and urban requirements. In arid regions such as Israel,water reuse provides essential water for agricultural production. Wherehumans are potentially exposed to untreated reclaimed wastewater,the major acute health risks are associated with exposure to patho-gens, including bacteria and nematodes. Treatment of wastewater isa highly effective method of safeguarding public health (57).
Source: Health for all database, WHO Regional Office for Europe.
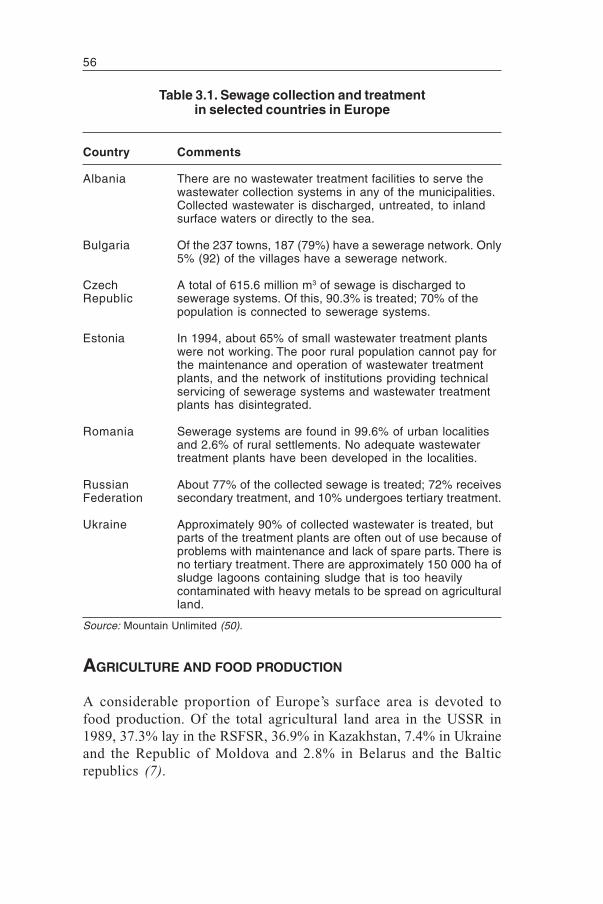
56
AGRICULTURE AND FOOD PRODUCTION
A considerable proportion of Europe’s surface area is devoted tofood production. Of the total agricultural land area in the USSR in1989, 37.3% lay in the RSFSR, 36.9% in Kazakhstan, 7.4% in Ukraineand the Republic of Moldova and 2.8% in Belarus and the Balticrepublics (7).
Country Comments
Albania There are no wastewater treatment facilities to serve thewastewater collection systems in any of the municipalities.Collected wastewater is discharged, untreated, to inlandsurface waters or directly to the sea.
Bulgaria Of the 237 towns, 187 (79%) have a sewerage network. Only5% (92) of the villages have a sewerage network.
Czech A total of 615.6 million m3 of sewage is discharged toRepublic sewerage systems. Of this, 90.3% is treated; 70% of the
population is connected to sewerage systems.
Estonia In 1994, about 65% of small wastewater treatment plantswere not working. The poor rural population cannot pay forthe maintenance and operation of wastewater treatmentplants, and the network of institutions providing technicalservicing of sewerage systems and wastewater treatmentplants has disintegrated.
Romania Sewerage systems are found in 99.6% of urban localitiesand 2.6% of rural settlements. No adequate wastewatertreatment plants have been developed in the localities.
Russian About 77% of the collected sewage is treated; 72% receivesFederation secondary treatment, and 10% undergoes tertiary treatment.
Ukraine Approximately 90% of collected wastewater is treated, butparts of the treatment plants are often out of use because ofproblems with maintenance and lack of spare parts. There isno tertiary treatment. There are approximately 150 000 ha ofsludge lagoons containing sludge that is too heavilycontaminated with heavy metals to be spread on agriculturalland.
Table 3.1. Sewage collection and treatmentin selected countries in Europe
Source: Mountain Unlimited (50).
57
Most drinking-water in Slovenia is derived from groundwater. One of the mostimportant sources is the Karats, an area of permeable limestone with manyunderground caves and streams that covers 44% of Slovenian territory.Because underground water flows very rapidly in this region, contaminationcan spread quickly and affect water sources some distance from the origin.Many surface waters in Slovenia are contaminated.
Only 44% of the Slovenian population is connected to the public seweragesystem, and only 36% of the wastewater in the public sewerage system istreated before it is discharged into streams. Much of this water enters theKarats underground caves and waters. The lack of wastewater treatmentextends even to the largest towns, including Mariner and the capitalLjubljana, despite a comprehensive and expensive plan implemented severalyears ago under which over 100 treatment plants were constructed. Unfortu-nately, the plants built incorporated inappropriate technology or were poorlymaintained and, in general, only the primary mechanical treatment stageworked effectively.
Sewage from domestic sources, from public institutions such as schools andhospitals and from industry and agriculture causes significant pollution inSlovenia, with intensive pig farms being notable point-source polluters. Anestimated 5000 wastewater treatment plants need to be constructed. Someof these would be very small, and it has been suggested that reed-bedtreatments might be an effective and less expensive alternative for smalltowns and villages.
Box 3.2. Wastewater disposal in Slovenia
Source: Pucelj (56).
The proportion of agricultural land that is irrigated tends to be higherin southern European countries, although this is not exclusively thecase: a large proportion of agriculture in Denmark and the Nether-lands uses irrigation. About 2% of the land area in western Europeas a whole is irrigated (1).
Demands on quantityThe development and intensification of agriculture in recent dec-ades has implications for both the quantity and quality of watersources. Agricultural demand for water in Europe is dominated byits use for irrigation. Thus in recent decades the trend in agriculturalwater use has, in general, been upwards, although the rate of in-crease in irrigated areas seems to have diminished more recently inseveral countries. From 1990, the irrigated area tended to be stablein Austria, Denmark, Finland, Ireland, the Netherlands and Portugal;the area has been decreasing in Germany, Italy and the United King-dom, but has shown growth in France, Greece and Spain.
58
Freshwater aquaculture makes fewer demands on the quantity ofwater but can, if not carefully regulated and managed, severely af-fect water and ecological quality. Unlike agriculture, where much ofthe irrigation water is lost to evaporation and transpiration or movedbetween compartments, water abstracted for freshwater aquacultureis returned to the watercourse shortly after abstraction, with verylittle loss in quantity (58). Some forms of freshwater aquaculture(caged fish farming) are undertaken in lakes and estuaries, wherethere is no need for abstraction, but a deterioration in quality maybecome apparent if the quantity of fish produced is not regulated.
The global aquaculture production statistics reported for 1984–1996are noticeably higher than those between 1984 and 1995, owing tounderreporting of Chinese production figures. By 1996, Europe wasthe second largest contributor, with 4.7% of world production. Thetransition to a market economy adversely affected aquaculture de-velopment in the republics of the former USSR, with total productiondeclining at an average of 21% per year in all countries between1990 and 1996. Between 1990 and 1996 Armenia reported a 13%decline in aquaculture output and Tajikistan 47%. Aquaculture pro-duction in the newly independent states is dominated by the Rus-sian Federation and Ukraine, which accounted for 83% of totalproduction in 1996 (59).
Threats to qualityConcerns about the impact of agriculture on the quality of waterresources are often related to the leaching and run-off of agricul-tural chemicals applied to crops and soil. Some agricultural con-tamination can originate from point sources, but most stems fromdiffuse sources. The use of agricultural chemicals depends on thetype of agriculture practised within a country and the market priceof the crops grown. The economic conditions of the country and theagricultural subsidies available to farmers also strongly influencethe extent of use. Contamination of water by nutrients and microbialpathogens from farm waste and animal slurry are also concerns.
MicroorganismsFarmyard waste or run-off from fields on which animal manure hasbeen spread can contain microorganisms that are human pathogens.These include the bacterium Escherichia coli, some strains of which
59
are enteropathogenic, and the protozoan Cryptosporidium. Diseasescaused by both these pathogens, originating in agriculture, have bro-ken out in the United Kingdom recently, with significant numbersof people affected. Cryptosporidium outbreaks have occurred fol-lowing contamination of water sources used for abstraction for po-table water. Diarrhoeal diseases caused by E. coli strain 0157,resulting in death in some cases, have been linked to consumptionof infected meat or contact with contaminated mud.
Agricultural land has been used as a recipient for sludge producedby wastewater treatment for many years. The practice is increasingin some countries as disposal to the marine environment is beingreduced, and was prohibited in the EU as of 31 December 1998under the Urban Wastewater Treatment Directive (60). Domesticwastewater has also been used to irrigate crops in parts of the worldthat historically have fewer water resources than Europe. As well asproviding water for irrigation, this also supplies nutrients to the cropand reduces the release of nutrients to surface waters in effluent.Within Europe, Germany and the United Kingdom have practisedwastewater reuse, and its use has been increasing in some countries.
NutrientsOne of the major threats to the quality of surface waters in Europe iseutrophication as a result of excessive nutrient loading (see Chap-ter 2). The intensification of agriculture in many areas has resultedin large quantities of inorganic fertilizer being applied to arable land,resulting in eutrophication of lakes, rivers and coastal waters (61).Intensification of livestock farming practices has also resulted inincreased production of livestock waste, which is used as organicfertilizer (62).
The application of organic fertilizers, such as animal manure, to ar-able land and run-off of slurry from farmyards may be another sourceof pollution by nutrients. Animal feeds are often high in nutrients toencourage rapid growth, and the excess is excreted.
Common inorganic fertilizer formulations contain nitrogen, phos-phorus and potassium in varying proportions. Use of inorganic fer-tilizers varies between countries, depending on the economic situationand predominant agricultural practices (Fig. 3.8).
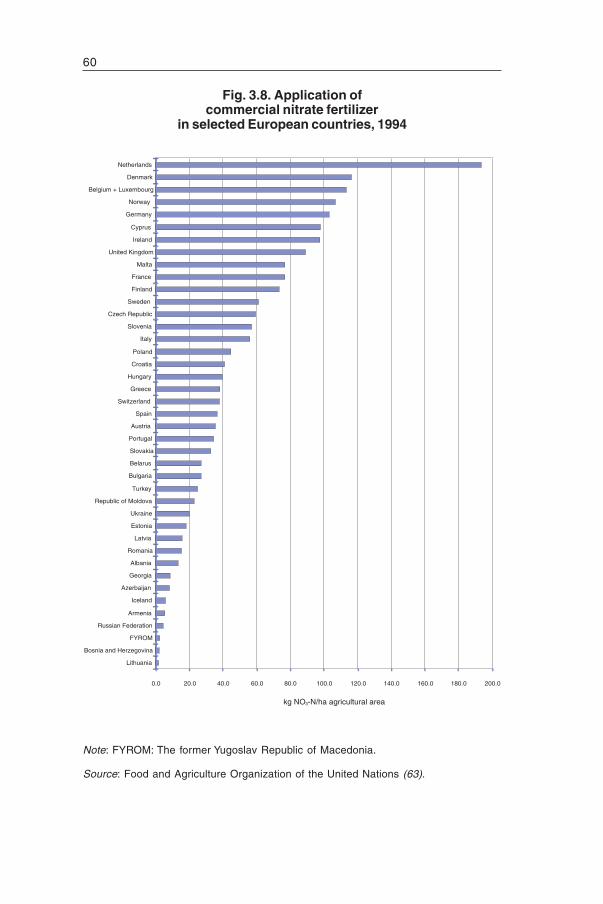
60
Note: FYROM: The former Yugoslav Republic of Macedonia.
Source: Food and Agriculture Organization of the United Nations (63).
Fig. 3.8. Application ofcommercial nitrate fertilizer
in selected European countries, 1994
0.0 20.0 40.0 60.0 80.0 100.0 120.0 140.0 160.0 180.0 200.0
Lithuania
Bosnia and Herzegovina
FYROM
Russian Federation
Armenia
Iceland
Azerbaijan
Georgia
Albania
Romania
Latvia
Estonia
Ukraine
Republic of Moldova
Turkey
Bulgaria
Belarus
Slovakia
Portugal
Austria
Spain
Switzerland
Greece
Hungary
Croatia
Poland
Italy
Slovenia
Czech Republic
Sweden
Finland
France
Malta
United Kingdom
Ireland
Cyprus
Germany
Norway
Belgium + Luxembourg
Denmark
Netherlands
kg NO -N/ha agricultural area3
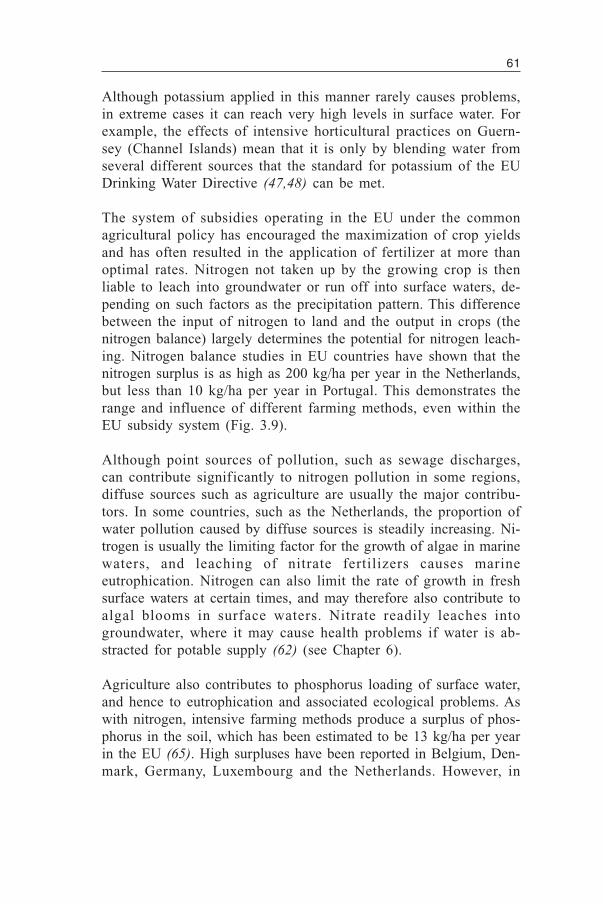
61
Although potassium applied in this manner rarely causes problems,in extreme cases it can reach very high levels in surface water. Forexample, the effects of intensive horticultural practices on Guern-sey (Channel Islands) mean that it is only by blending water fromseveral different sources that the standard for potassium of the EUDrinking Water Directive (47,48) can be met.
The system of subsidies operating in the EU under the commonagricultural policy has encouraged the maximization of crop yieldsand has often resulted in the application of fertilizer at more thanoptimal rates. Nitrogen not taken up by the growing crop is thenliable to leach into groundwater or run off into surface waters, de-pending on such factors as the precipitation pattern. This differencebetween the input of nitrogen to land and the output in crops (thenitrogen balance) largely determines the potential for nitrogen leach-ing. Nitrogen balance studies in EU countries have shown that thenitrogen surplus is as high as 200 kg/ha per year in the Netherlands,but less than 10 kg/ha per year in Portugal. This demonstrates therange and influence of different farming methods, even within theEU subsidy system (Fig. 3.9).
Although point sources of pollution, such as sewage discharges,can contribute significantly to nitrogen pollution in some regions,diffuse sources such as agriculture are usually the major contribu-tors. In some countries, such as the Netherlands, the proportion ofwater pollution caused by diffuse sources is steadily increasing. Ni-trogen is usually the limiting factor for the growth of algae in marinewaters, and leaching of nitrate fertilizers causes marineeutrophication. Nitrogen can also limit the rate of growth in freshsurface waters at certain times, and may therefore also contribute toalgal blooms in surface waters. Nitrate readily leaches intogroundwater, where it may cause health problems if water is ab-stracted for potable supply (62) (see Chapter 6).
Agriculture also contributes to phosphorus loading of surface water,and hence to eutrophication and associated ecological problems. Aswith nitrogen, intensive farming methods produce a surplus of phos-phorus in the soil, which has been estimated to be 13 kg/ha per yearin the EU (65). High surpluses have been reported in Belgium, Den-mark, Germany, Luxembourg and the Netherlands. However, in
62
densely populated areas this contribution has largely been insignifi-cant compared with phosphorus from point sources, predominantlysewage discharges. As the control of pollution from urban wastewaterimproves, phosphorus from agricultural sources may become moresignificant.
Aquaculture is another major source of nutrients in some lakes andrivers. Although reported nutrient export rates from fish farms canvary substantially, most values appear to be about 20–100 kg of
Fig. 3.9. Nitrogen balances for the soil surface of agricultural landin the 12 EU countries in 1993:
countries ranked by surplus of input over output
Note: Input includes fertilizer and manure. Output includes harvest.
Source: Eurostat (64).
0 50 100 150 200 250 300 350 400 450 500
Portugal
UnitedKingdom
Spain
Ireland
France
Greece
Germany
Italy
Denmark
Luxembourg
Belgium
Netherlands
Output
Input
Electro
nic
publi
catio
n
not
autho
rized
63
phosphorus per tonne of salmonid fish (66,67). It might be expectedthat the advent of fish food low in phosphorus would have reducedthese export coefficients, but how widely farmers have adopted thesefeeds is not known.
PesticidesThe use of pesticides in agriculture has become commonplace overthe last half century. In arable cropping, herbicides are used in thegreatest quantities, and this type of pesticide has been detected mostfrequently in European groundwater (see Chapter 2). Fungicides areused to prevent plant diseases, and insecticides are applied both toprevent direct damage by insects and to prevent the spread of viraldiseases for which insects are vectors. Modern animal husbandryalso involves the use of veterinary products such as insecticides foruse in animal houses, and dips used to prevent infestation of theanimals by ectoparasites.
As with fertilizers, pesticide use depends on economic conditions,the market price for the crop being grown and the subsidies avail-able, as well as accepted practice in the country concerned. Usevaries widely across Europe (Fig. 3.10).
Within the EU, a decreasing quantity of pesticide active ingredientshas been sold since 1985 (Fig. 3.11). This may result, in part, fromchanges in the pattern of use of established pesticides, but it alsoreflects the increased activity of recently introduced pesticides, whichenables them to be effective at lower application rates. Long-termmonitoring of water bodies in Armenia, Azerbaijan and Georgia hasshown an overall decreasing trend in concentrations of organochlorinepesticides since 1978 (24).
Groundwater is usually regarded as being most vulnerable to pollu-tion by pesticides, because of the long residence time and minimaldegradation. However, pollution by pesticides can also affect sur-face water and can have toxic effects on aquatic life. Lowland sur-face water is particularly likely to contain pesticides, although someproducts, such as those used in sheep-dips, may find specific use inupland areas. Some pesticides, such as the sheep-dip chemicalcypermethrin, bind very strongly to sediment, and this can act as areservoir that will slowly release the chemical over a long period.
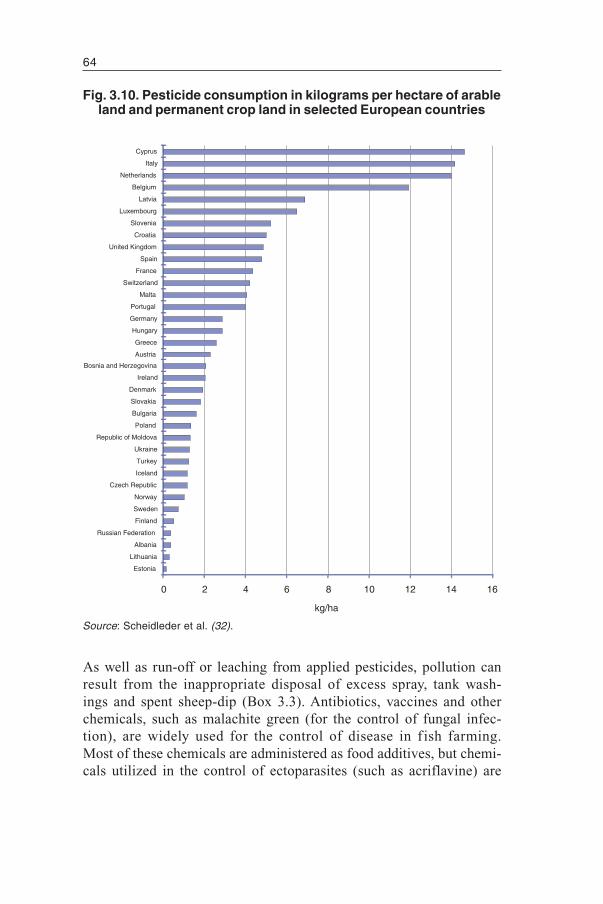
64
Fig. 3.10. Pesticide consumption in kilograms per hectare of arableland and permanent crop land in selected European countries
As well as run-off or leaching from applied pesticides, pollution canresult from the inappropriate disposal of excess spray, tank wash-ings and spent sheep-dip (Box 3.3). Antibiotics, vaccines and otherchemicals, such as malachite green (for the control of fungal infec-tion), are widely used for the control of disease in f ish farming.Most of these chemicals are administered as food additives, but chemi-cals utilized in the control of ectoparasites (such as acriflavine) are
0 2 4 6 8 10 12 14 16
Estonia
Lithuania
Albania
Russian Federation
Finland
Sweden
Norway
Czech Republic
Iceland
Turkey
Ukraine
Republic of Moldova
Poland
Bulgaria
Slovakia
Denmark
Ireland
Bosnia and Herzegovina
Austria
Greece
Hungary
Germany
Portugal
Malta
Switzerland
France
Spain
United Kingdom
Croatia
Slovenia
Luxembourg
Latvia
Belgium
Netherlands
Italy
Cyprus
kg/ha
Source: Scheidleder et al. (32).
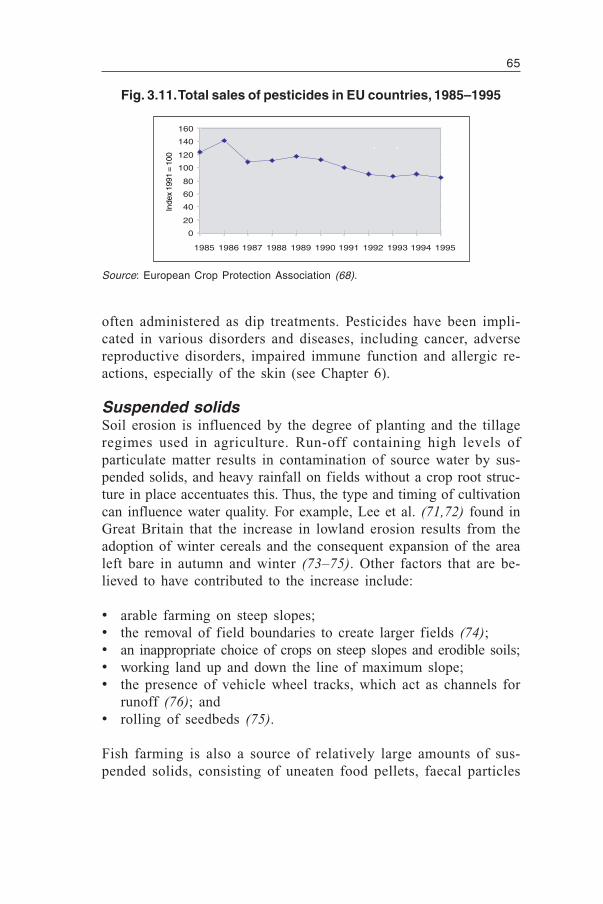
65
Fig. 3.11. Total sales of pesticides in EU countries, 1985–1995
often administered as dip treatments. Pesticides have been impli-cated in various disorders and diseases, including cancer, adversereproductive disorders, impaired immune function and allergic re-actions, especially of the skin (see Chapter 6).
Suspended solidsSoil erosion is influenced by the degree of planting and the tillageregimes used in agriculture. Run-off containing high levels ofparticulate matter results in contamination of source water by sus-pended solids, and heavy rainfall on fields without a crop root struc-ture in place accentuates this. Thus, the type and timing of cultivationcan influence water quality. For example, Lee et al. (71,72) found inGreat Britain that the increase in lowland erosion results from theadoption of winter cereals and the consequent expansion of the arealeft bare in autumn and winter (73–75). Other factors that are be-lieved to have contributed to the increase include:
• arable farming on steep slopes;• the removal of field boundaries to create larger fields (74);• an inappropriate choice of crops on steep slopes and erodible soils;• working land up and down the line of maximum slope;• the presence of vehicle wheel tracks, which act as channels for
runoff (76); and• rolling of seedbeds (75).
Fish farming is also a source of relatively large amounts of sus-pended solids, consisting of uneaten food pellets, faecal particles
Source: European Crop Protection Association (68).
0
20
40
60
80
100
120
140
160
1985 1986 1987 1988 1989 1990 1991 1992 1993 1994 1995
Inde
x 19
91 =
100
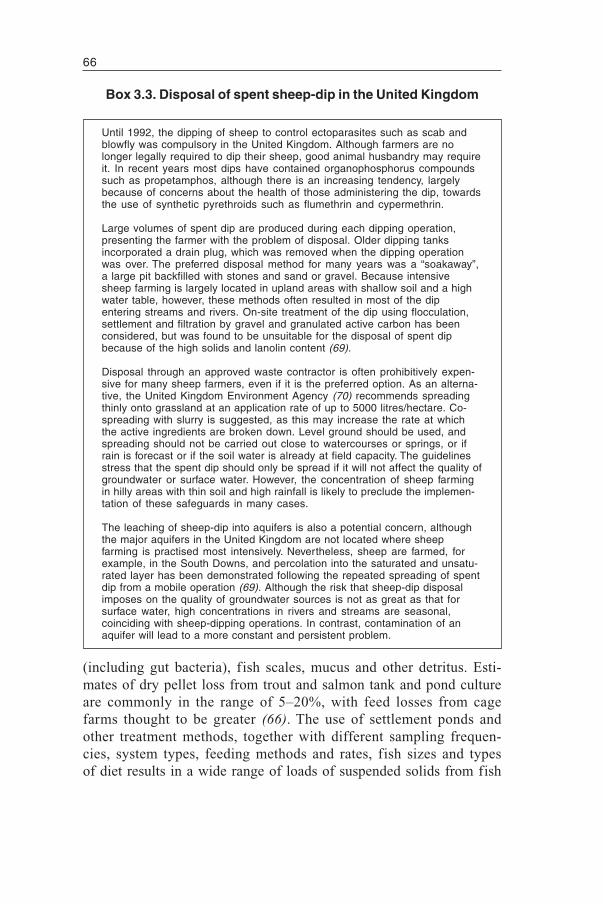
66
Until 1992, the dipping of sheep to control ectoparasites such as scab andblowfly was compulsory in the United Kingdom. Although farmers are nolonger legally required to dip their sheep, good animal husbandry may requireit. In recent years most dips have contained organophosphorus compoundssuch as propetamphos, although there is an increasing tendency, largelybecause of concerns about the health of those administering the dip, towardsthe use of synthetic pyrethroids such as flumethrin and cypermethrin.
Large volumes of spent dip are produced during each dipping operation,presenting the farmer with the problem of disposal. Older dipping tanksincorporated a drain plug, which was removed when the dipping operationwas over. The preferred disposal method for many years was a “soakaway”,a large pit backfilled with stones and sand or gravel. Because intensivesheep farming is largely located in upland areas with shallow soil and a highwater table, however, these methods often resulted in most of the dipentering streams and rivers. On-site treatment of the dip using flocculation,settlement and filtration by gravel and granulated active carbon has beenconsidered, but was found to be unsuitable for the disposal of spent dipbecause of the high solids and lanolin content (69).
Disposal through an approved waste contractor is often prohibitively expen-sive for many sheep farmers, even if it is the preferred option. As an alterna-tive, the United Kingdom Environment Agency (70) recommends spreadingthinly onto grassland at an application rate of up to 5000 litres/hectare. Co-spreading with slurry is suggested, as this may increase the rate at whichthe active ingredients are broken down. Level ground should be used, andspreading should not be carried out close to watercourses or springs, or ifrain is forecast or if the soil water is already at field capacity. The guidelinesstress that the spent dip should only be spread if it will not affect the quality ofgroundwater or surface water. However, the concentration of sheep farmingin hilly areas with thin soil and high rainfall is likely to preclude the implemen-tation of these safeguards in many cases.
The leaching of sheep-dip into aquifers is also a potential concern, althoughthe major aquifers in the United Kingdom are not located where sheepfarming is practised most intensively. Nevertheless, sheep are farmed, forexample, in the South Downs, and percolation into the saturated and unsatu-rated layer has been demonstrated following the repeated spreading of spentdip from a mobile operation (69). Although the risk that sheep-dip disposalimposes on the quality of groundwater sources is not as great as that forsurface water, high concentrations in rivers and streams are seasonal,coinciding with sheep-dipping operations. In contrast, contamination of anaquifer will lead to a more constant and persistent problem.
Box 3.3. Disposal of spent sheep-dip in the United Kingdom
(including gut bacteria), fish scales, mucus and other detritus. Esti-mates of dry pellet loss from trout and salmon tank and pond cultureare commonly in the range of 5–20%, with feed losses from cagefarms thought to be greater (66). The use of settlement ponds andother treatment methods, together with different sampling frequen-cies, system types, feeding methods and rates, fish sizes and typesof diet results in a wide range of loads of suspended solids from fish
67
farms. Values reviewed by the Nature Conservancy Council (66)range from 110 kg to 2153 kg per tonne of fish produced. This loadof solids has an associated oxygen demand, usually accounting forat least half of the total BOD (particulate and dissolved) from salmonidfish farms. Fish farm effluent does not usually significantly affectdissolved oxygen levels in running water, but organic enrichmentbelow caged fish farms in lakes is often detrimental to the sedimentinvertebrate community.
INDUSTRY AND TRANSPORT
Industrial demand and effects on water quality can directly affectthe water supplies of a large number of people where industry co-exists with highly populated urban areas.
Demands on quantitySome industries, especially traditional heavy industries, require largeamounts of water for cleaning or cooling and therefore compete forwater resources. The amount of water abstracted for cooling usuallyfar exceeds that used during industrial processes, but this is oftenregarded as a non-consumptive use, as the water is returned to itssource virtually unchanged except for an increase in temperatureand, in some instances, the presence of a biocide. The amount ofwater required also depends on the type of process used; in general,more modern plants would be expected to incorporate more water-saving measures.
The amount of water used by industry and its significance as a pro-portion of total abstraction varies greatly between countries (seeFig. 3.2). Figures vary according to the different methods used torecord specific uses. For example, some countries include coolingwater in the figure for industrial use while others do not. Abstractionfor industrial purposes in Europe has been decreasing since 1980,largely because of industrial recession in many countries in the east-ern part of the Region and changes in the predominant industriesand industrial practices in northern and western Europe. In the lattercountries traditional industries such as textiles, iron and steel havedeclined, and this is coupled with technological improvements inwater-using equipment and increased recycling.
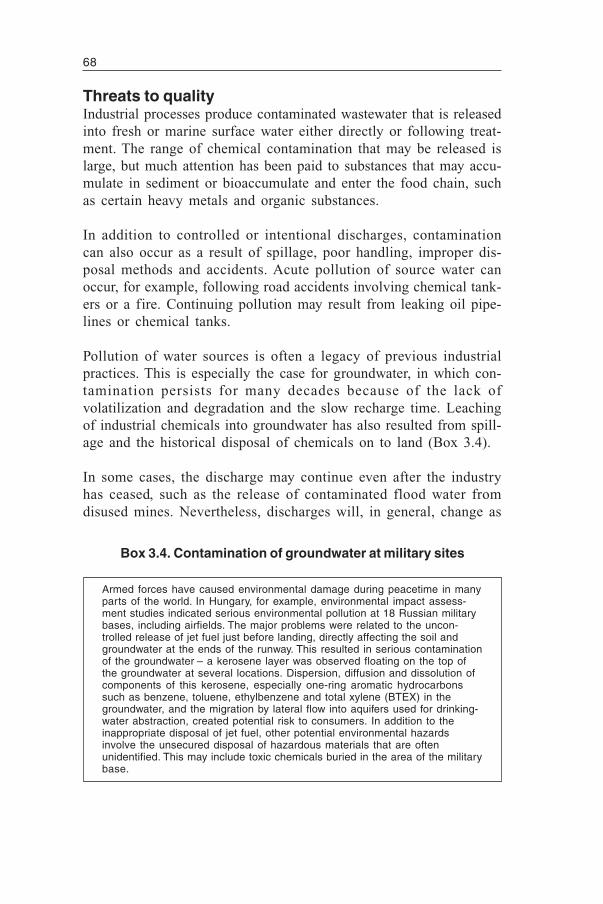
68
Threats to qualityIndustrial processes produce contaminated wastewater that is releasedinto fresh or marine surface water either directly or following treat-ment. The range of chemical contamination that may be released islarge, but much attention has been paid to substances that may accu-mulate in sediment or bioaccumulate and enter the food chain, suchas certain heavy metals and organic substances.
In addition to controlled or intentional discharges, contaminationcan also occur as a result of spillage, poor handling, improper dis-posal methods and accidents. Acute pollution of source water canoccur, for example, following road accidents involving chemical tank-ers or a fire. Continuing pollution may result from leaking oil pipe-lines or chemical tanks.
Pollution of water sources is often a legacy of previous industrialpractices. This is especially the case for groundwater, in which con-tamination persists for many decades because of the lack ofvolatilization and degradation and the slow recharge time. Leachingof industrial chemicals into groundwater has also resulted from spill-age and the historical disposal of chemicals on to land (Box 3.4).
In some cases, the discharge may continue even after the industryhas ceased, such as the release of contaminated flood water fromdisused mines. Nevertheless, discharges will, in general, change as
Armed forces have caused environmental damage during peacetime in manyparts of the world. In Hungary, for example, environmental impact assess-ment studies indicated serious environmental pollution at 18 Russian militarybases, including airfields. The major problems were related to the uncon-trolled release of jet fuel just before landing, directly affecting the soil andgroundwater at the ends of the runway. This resulted in serious contaminationof the groundwater – a kerosene layer was observed floating on the top ofthe groundwater at several locations. Dispersion, diffusion and dissolution ofcomponents of this kerosene, especially one-ring aromatic hydrocarbonssuch as benzene, toluene, ethylbenzene and total xylene (BTEX) in thegroundwater, and the migration by lateral flow into aquifers used for drinking-water abstraction, created potential risk to consumers. In addition to theinappropriate disposal of jet fuel, other potential environmental hazardsinvolve the unsecured disposal of hazardous materials that are oftenunidentified. This may include toxic chemicals buried in the area of the militarybase.
Box 3.4. Contamination of groundwater at military sites
69
the dominant industries change and industrial practices and disposaltechniques improve.
Many newly independent states recognize that industrial pollutionis poorly controlled, and detrimental effects on health have beenreported. In the Russian Federation, for example, illnesses have beenlinked with drinking-water polluted by industry in the Perm’-Krasnokamsk industrial zone, the cities of Kemerovo and Yurga,and near the Ust’-Ilimsk plant (77).
Heavy metalsHistorically, heavy metals have been common contaminants, beingreleased from a range of industries. Many accumulate in the bodyand can persist in sediment, being released into the water columnwhen the sediment is disturbed. However, measures undertakenin the Nordic and western European countries to reduce heavymetal emissions to inland waters and marine areas have been suc-cessful.
Petrochemicals and volatile organic compoundsPetrochemicals are among the most widely used of all industrial prod-ucts because of their use in transport and power generation. Pollu-tion incidents arising from spills from tanker disasters in the marineenvironment have, perhaps, been the most widely publicized inci-dents involving this industry. However, freshwater sources have beencontaminated by leakage from petrochemical plants and pipelines,military sites and fuel tanks at filling stations (Box 3.5). Groundwateris vulnerable, and contamination by hydrocarbons is a particularproblem in parts of eastern Europe. In the Czech Republic, for ex-ample, approximately 50% of accidental water pollution incidentsinvolve petroleum (78). Some regions of Estonia also report con-tamination of surface water and groundwater by phenols and petro-leum products.
Contamination of aquifers with hydrocarbons may also influencethe distribution of other contaminants within the aquifer. The Lutonand Dunstable aquifer in the United Kingdom, for example (Box 3.5),was found to be contaminated with hydrocarbons as well as organicsolvents. The hydrocarbons formed a layer at the top of the aquiferinto which the solvents were preferentially dissolved (79).
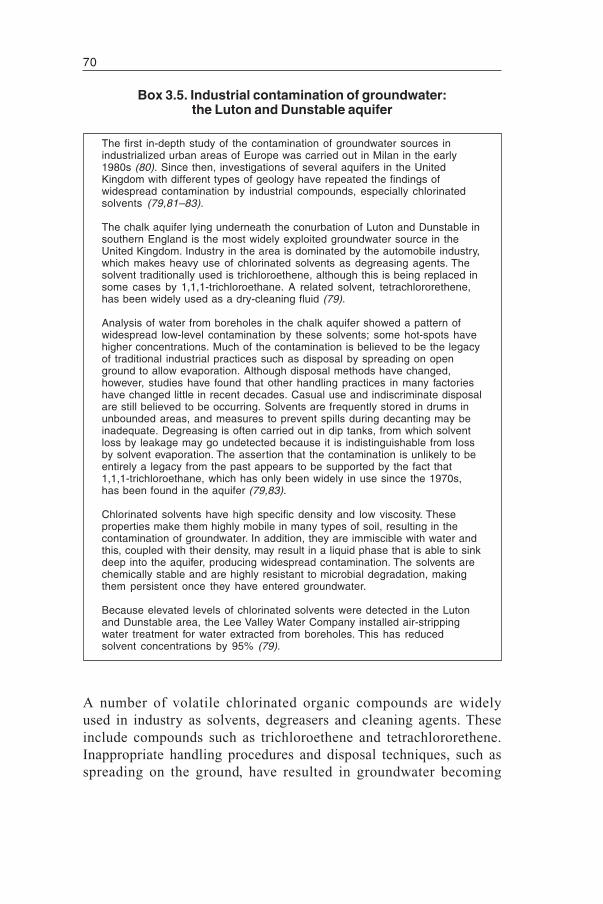
70
A number of volatile chlorinated organic compounds are widelyused in industry as solvents, degreasers and cleaning agents. Theseinclude compounds such as trichloroethene and tetrachlororethene.Inappropriate handling procedures and disposal techniques, such asspreading on the ground, have resulted in groundwater becoming
The first in-depth study of the contamination of groundwater sources inindustrialized urban areas of Europe was carried out in Milan in the early1980s (80). Since then, investigations of several aquifers in the UnitedKingdom with different types of geology have repeated the findings ofwidespread contamination by industrial compounds, especially chlorinatedsolvents (79,81–83).
The chalk aquifer lying underneath the conurbation of Luton and Dunstable insouthern England is the most widely exploited groundwater source in theUnited Kingdom. Industry in the area is dominated by the automobile industry,which makes heavy use of chlorinated solvents as degreasing agents. Thesolvent traditionally used is trichloroethene, although this is being replaced insome cases by 1,1,1-trichloroethane. A related solvent, tetrachlororethene,has been widely used as a dry-cleaning fluid (79).
Analysis of water from boreholes in the chalk aquifer showed a pattern ofwidespread low-level contamination by these solvents; some hot-spots havehigher concentrations. Much of the contamination is believed to be the legacyof traditional industrial practices such as disposal by spreading on openground to allow evaporation. Although disposal methods have changed,however, studies have found that other handling practices in many factorieshave changed little in recent decades. Casual use and indiscriminate disposalare still believed to be occurring. Solvents are frequently stored in drums inunbounded areas, and measures to prevent spills during decanting may beinadequate. Degreasing is often carried out in dip tanks, from which solventloss by leakage may go undetected because it is indistinguishable from lossby solvent evaporation. The assertion that the contamination is unlikely to beentirely a legacy from the past appears to be supported by the fact that1,1,1-trichloroethane, which has only been widely in use since the 1970s,has been found in the aquifer (79,83).
Chlorinated solvents have high specific density and low viscosity. Theseproperties make them highly mobile in many types of soil, resulting in thecontamination of groundwater. In addition, they are immiscible with water andthis, coupled with their density, may result in a liquid phase that is able to sinkdeep into the aquifer, producing widespread contamination. The solvents arechemically stable and are highly resistant to microbial degradation, makingthem persistent once they have entered groundwater.
Because elevated levels of chlorinated solvents were detected in the Lutonand Dunstable area, the Lee Valley Water Company installed air-strippingwater treatment for water extracted from boreholes. This has reducedsolvent concentrations by 95% (79).
Box 3.5. Industrial contamination of groundwater:the Luton and Dunstable aquifer
71
contaminated through leaching. These compounds evaporate read-ily, and their release to surface water affects water quality less.
Hormonally active chemicalsMuch public attention in recent years has been paid to the presencein the aquatic environment of chemicals that mimic natural hormones,together with concerns that they may be linked to reported increasesin testicular and breast cancer and decreasing sperm counts. In somecases in Europe, adverse endocrine effects or reproductive toxicityin birds and mammals have coincided with high levels of anthropo-genic chemicals that have been shown to have endocrine-disruptingproperties (84). Evidence for this association is limited, but somesubstances have been shown to cause feminization of male fish withthe production of vitellogenin, an egg-yolk protein normally onlyfound in sexually mature female fish, and oocytes. A wide range ofindustrial chemicals has been shown to trigger this activity (Box 3.6).
TOURISM
Tourism is an important source of income in certain areas – includ-ing a number of Mediterranean countries, Austria, Hungary, Irelandand Switzerland (87). The seasonal influx of large numbers of peo-ple can significantly affect water resources and greatly increase thevolume of wastewater requiring treatment and disposal.
Demands on quantityDomestic water use by tourists is often twice that of residents, andlarge volumes of water are also required for recreational facilitiessuch as swimming pools, water parks and golf courses. Areas popu-lar for tourism are often warm areas, thus concentrating the demandin an area where water resources may already be limited (such as theMediterranean coast of Spain), and demand often peaks during peri-ods when the renewal of water resources is low. Localized shortagesof water may therefore be common in areas used for tourism. Sup-plying sufficient water at the time of peak demand, often at the driesttime of year, may require the construction of additional reservoirs.
Threats to qualityA large seasonal influx of tourists can produce challenges in thedesign and operation of water supply systems and facilities for
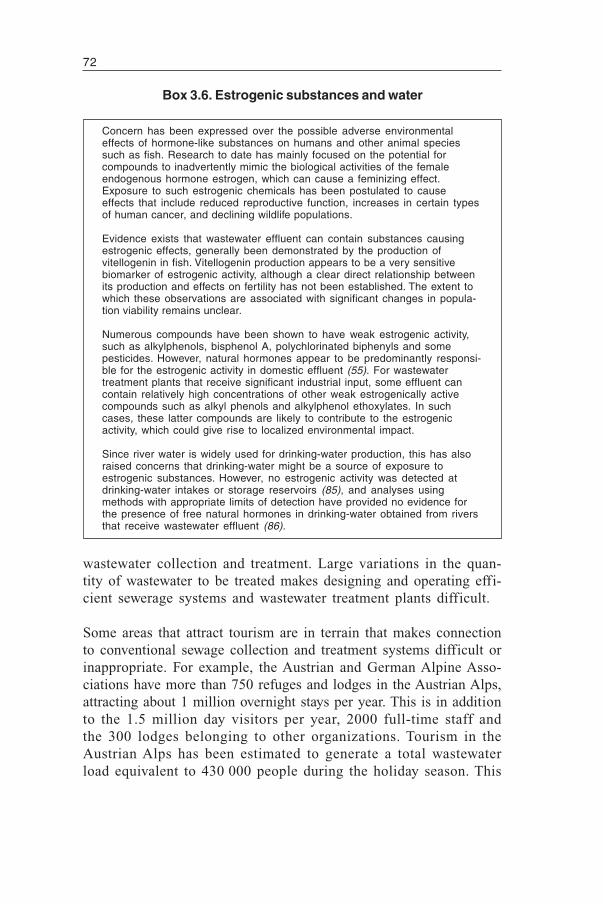
72
wastewater collection and treatment. Large variations in the quan-tity of wastewater to be treated makes designing and operating effi-cient sewerage systems and wastewater treatment plants difficult.
Some areas that attract tourism are in terrain that makes connectionto conventional sewage collection and treatment systems difficult orinappropriate. For example, the Austrian and German Alpine Asso-ciations have more than 750 refuges and lodges in the Austrian Alps,attracting about 1 million overnight stays per year. This is in additionto the 1.5 million day visitors per year, 2000 full-time staff andthe 300 lodges belonging to other organizations. Tourism in theAustrian Alps has been estimated to generate a total wastewaterload equivalent to 430 000 people during the holiday season. This
Concern has been expressed over the possible adverse environmentaleffects of hormone-like substances on humans and other animal speciessuch as fish. Research to date has mainly focused on the potential forcompounds to inadvertently mimic the biological activities of the femaleendogenous hormone estrogen, which can cause a feminizing effect.Exposure to such estrogenic chemicals has been postulated to causeeffects that include reduced reproductive function, increases in certain typesof human cancer, and declining wildlife populations.
Evidence exists that wastewater effluent can contain substances causingestrogenic effects, generally been demonstrated by the production ofvitellogenin in fish. Vitellogenin production appears to be a very sensitivebiomarker of estrogenic activity, although a clear direct relationship betweenits production and effects on fertility has not been established. The extent towhich these observations are associated with significant changes in popula-tion viability remains unclear.
Numerous compounds have been shown to have weak estrogenic activity,such as alkylphenols, bisphenol A, polychlorinated biphenyls and somepesticides. However, natural hormones appear to be predominantly responsi-ble for the estrogenic activity in domestic effluent (55). For wastewatertreatment plants that receive significant industrial input, some effluent cancontain relatively high concentrations of other weak estrogenically activecompounds such as alkyl phenols and alkylphenol ethoxylates. In suchcases, these latter compounds are likely to contribute to the estrogenicactivity, which could give rise to localized environmental impact.
Since river water is widely used for drinking-water production, this has alsoraised concerns that drinking-water might be a source of exposure toestrogenic substances. However, no estrogenic activity was detected atdrinking-water intakes or storage reservoirs (85), and analyses usingmethods with appropriate limits of detection have provided no evidence forthe presence of free natural hormones in drinking-water obtained from riversthat receive wastewater effluent (86).
Box 3.6. Estrogenic substances and water
73
produces technical and financial difficulties associated with treat-ing fluctuating discharges at low temperatures (1).
In summer, mass tourism concentrates along coastal areas. The in-crease in visitors to coastal areas at specific times of the year createsdemanding health problems. Discharged urban storm water andwastewater are the main source of sea pollution that affects the qual-ity of coastal seawater and can make it unsuitable for swimming anda threat to human health. If municipal sewage constitutes a signifi-cant source of phosphorus pollution, phosphorus must be removedat treatment plants. Heavy seasonal tourism increases the demandon the capacity of treatment plants and sewerage and also causessubstantial fluctuation in the sewage load. Sewerage and treatmentfor fluctuating amounts of sewage present specific technical diffi-culties. Lake Balaton is an example of such a situation, where thenumber of tourists during July and August is twice that of the localpopulation (88).
If domestic wastewater is used in agriculture, health risks should beavoided by following the WHO guidelines for the use of wastewaterin agriculture and aquaculture (89). Areas with low population thatare affected by tourism may need special consideration because thepopulation may increase temporarily by several times and overloadwastewater treatment capacities. In temperate regions, the tourismseason may coincide with the cyanobacterial growth season (37).
Access to safe water
75
A reliable supply of clean drinking-water is essential to protect the healthof individuals and communities. Both the quantity and the quality ofsupply are important. An adequate quantity of water is of primary im-portance in public health, since diseases are more easily transferreddirectly from person to person or via contaminated food when poorhygienic practices occur because of insufficient water. The potentialconsequences of microbial pollution are such that control of drinking-water quality must never be compromised. A number of serious dis-eases can be spread via contaminated drinking-water, such as choleraand typhoid fever, as well as common enteric diseases such as gastroen-teritis. A supply containing high levels of chemical contaminants mayalso significantly affect the health of a whole community.
COVERAGE OF THE DRINKING-WATER SUPPLY
A reliable and adequate source of clean drinking-water is considered tobe a basic human right and is one of the highest priorities of any country. Theway in which people obtain their water depends on the natural and financialresources of a country and historical influences. The population density andpattern of habitation also influence the extent to which consumers are sup-plied by piped networks or rely on local sources for drinking-water.
The residents of the towns and cities of Europe are generally wellsupplied with running water (Fig. 4.1–4.3, Table 4.1). Installing a
4
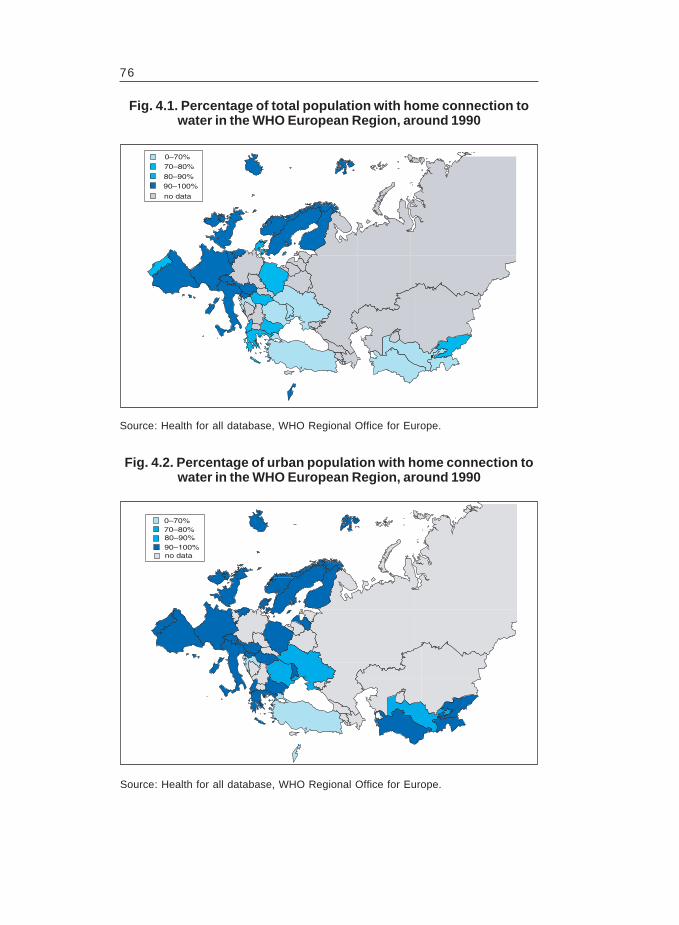
76
0–70%70–80%
80–90%90–100%
no data
Fig. 4.1. Percentage of total population with home connection towater in the WHO European Region, around 1990
80–90%
0–70%70–80%
90–100%no data
Fig. 4.2. Percentage of urban population with home connection towater in the WHO European Region, around 1990
Source: Health for all database, WHO Regional Office for Europe.
Source: Health for all database, WHO Regional Office for Europe.
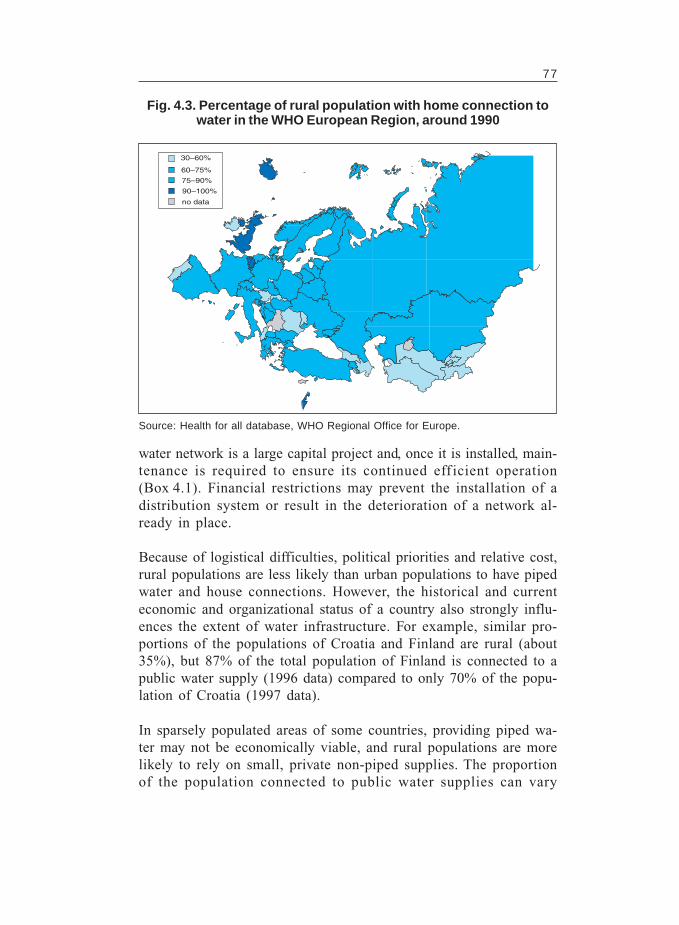
77
Fig. 4.3. Percentage of rural population with home connection towater in the WHO European Region, around 1990
30–60%
60–75%
75–90%
90–100%
no data
water network is a large capital project and, once it is installed, main-tenance is required to ensure its continued eff icient operation(Box 4.1). Financial restrictions may prevent the installation of adistribution system or result in the deterioration of a network al-ready in place.
Because of logistical difficulties, political priorities and relative cost,rural populations are less likely than urban populations to have pipedwater and house connections. However, the historical and currenteconomic and organizational status of a country also strongly influ-ences the extent of water infrastructure. For example, similar pro-portions of the populations of Croatia and Finland are rural (about35%), but 87% of the total population of Finland is connected to apublic water supply (1996 data) compared to only 70% of the popu-lation of Croatia (1997 data).
In sparsely populated areas of some countries, providing piped wa-ter may not be economically viable, and rural populations are morelikely to rely on small, private non-piped supplies. The proportionof the population connected to public water supplies can vary
Source: Health for all database, WHO Regional Office for Europe.
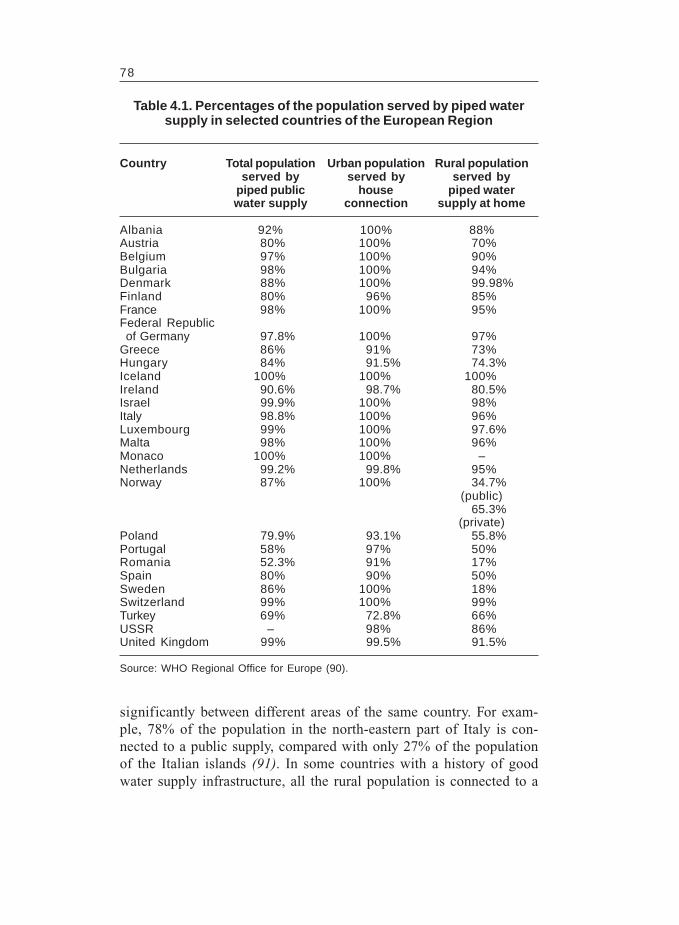
78
Table 4.1. Percentages of the population served by piped watersupply in selected countries of the European Region
Country Total population Urban population Rural populationserved by served by served by
piped public house piped waterwater supply connection supply at home
Albania 92% 100% 88%Austria 80% 100% 70%Belgium 97% 100% 90%Bulgaria 98% 100% 94%Denmark 88% 100% 99.98%Finland 80% 96% 85%France 98% 100% 95%Federal Republicof Germany 97.8% 100% 97%
Greece 86% 91% 73%Hungary 84% 91.5% 74.3%Iceland 100% 100% 100%Ireland 90.6% 98.7% 80.5%Israel 99.9% 100% 98%Italy 98.8% 100% 96%Luxembourg 99% 100% 97.6%Malta 98% 100% 96%Monaco 100% 100% –Netherlands 99.2% 99.8% 95%Norway 87% 100% 34.7%
(public)65.3%
(private)Poland 79.9% 93.1% 55.8%Portugal 58% 97% 50%Romania 52.3% 91% 17%Spain 80% 90% 50%Sweden 86% 100% 18%Switzerland 99% 100% 99%Turkey 69% 72.8% 66%USSR – 98% 86%United Kingdom 99% 99.5% 91.5%
Source: WHO Regional Office for Europe (90).
significantly between different areas of the same country. For exam-ple, 78% of the population in the north-eastern part of Italy is con-nected to a public supply, compared with only 27% of the populationof the Italian islands (91). In some countries with a history of goodwater supply infrastructure, all the rural population is connected to a
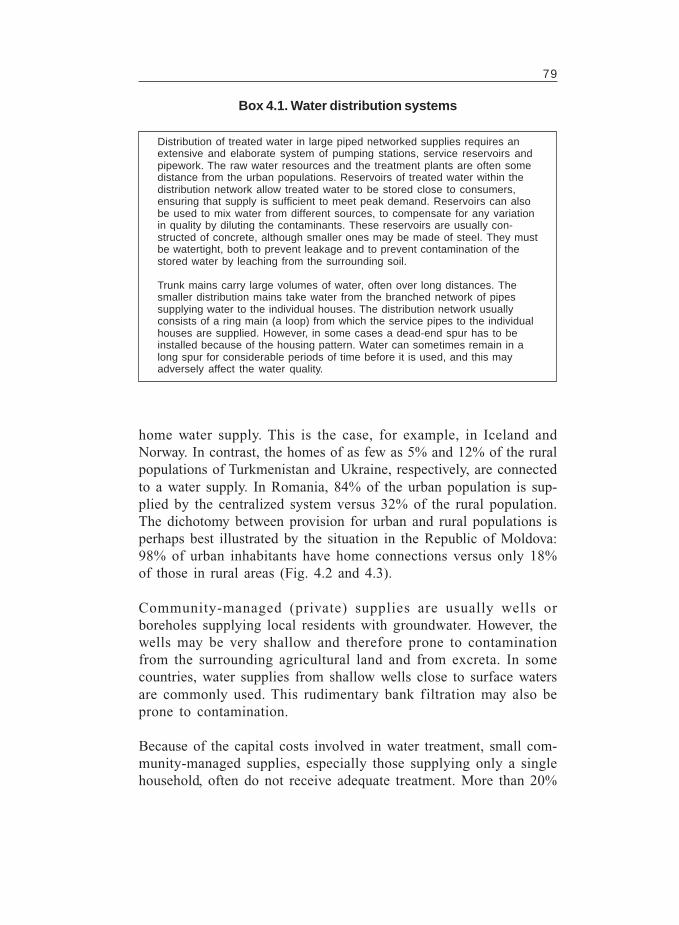
79
Distribution of treated water in large piped networked supplies requires anextensive and elaborate system of pumping stations, service reservoirs andpipework. The raw water resources and the treatment plants are often somedistance from the urban populations. Reservoirs of treated water within thedistribution network allow treated water to be stored close to consumers,ensuring that supply is sufficient to meet peak demand. Reservoirs can alsobe used to mix water from different sources, to compensate for any variationin quality by diluting the contaminants. These reservoirs are usually con-structed of concrete, although smaller ones may be made of steel. They mustbe watertight, both to prevent leakage and to prevent contamination of thestored water by leaching from the surrounding soil.
Trunk mains carry large volumes of water, often over long distances. Thesmaller distribution mains take water from the branched network of pipessupplying water to the individual houses. The distribution network usuallyconsists of a ring main (a loop) from which the service pipes to the individualhouses are supplied. However, in some cases a dead-end spur has to beinstalled because of the housing pattern. Water can sometimes remain in along spur for considerable periods of time before it is used, and this mayadversely affect the water quality.
Box 4.1. Water distribution systems
home water supply. This is the case, for example, in Iceland andNorway. In contrast, the homes of as few as 5% and 12% of the ruralpopulations of Turkmenistan and Ukraine, respectively, are connectedto a water supply. In Romania, 84% of the urban population is sup-plied by the centralized system versus 32% of the rural population.The dichotomy between provision for urban and rural populations isperhaps best illustrated by the situation in the Republic of Moldova:98% of urban inhabitants have home connections versus only 18%of those in rural areas (Fig. 4.2 and 4.3).
Community-managed (private) supplies are usually wells orboreholes supplying local residents with groundwater. However, thewells may be very shallow and therefore prone to contaminationfrom the surrounding agricultural land and from excreta. In somecountries, water supplies from shallow wells close to surface watersare commonly used. This rudimentary bank filtration may also beprone to contamination.
Because of the capital costs involved in water treatment, small com-munity-managed supplies, especially those supplying only a singlehousehold, often do not receive adequate treatment. More than 20%
80
of the population of Slovakia uses drinking-water from domesticwells, and an estimated 80–85% of such wells do not comply withnational drinking-water standards (92). Nitrate and phosphate con-centrations in almost 17% of Latvian wells exceed 50 mg/l, espe-cially the shallow ones. This is primarily the result of poor abstractionmanagement and poor construction.
CONTINUITY OF DRINKING-WATER
Access to a supply of drinking-water goes beyond the presence of awell or a connection to a supply network. Most public water sup-plies within the EU and other countries in the western part of theRegion maintain a continuous supply of water. A number of coun-tries in central and eastern Europe, including some newly independ-ent states, also provide continuous public water supplies.Nevertheless, some areas in a number of European countries do notreceive a continuous supply of water. This may be for reasons suchas shortage of source water (which may be seasonal), demand ex-ceeding the capacity of the source or the supply system, accidentsand emergencies, leakage and misuse. Discontinuity in supply mayhave implications for human health comparable to those where thereis inadequate water. This is made worse if the disruption is unpre-dictable or unannounced. Discontinuity is often caused by the poordesign and condition of the waterworks, and inadequate operation,maintenance and management. Financial constraints may also beresponsible for interrupted supply and may be linked to a discon-tinuous electricity supply that prevents the continuous pumping andtreatment of water (Table 4.2). In Latvia, poor infrastructure, no regu-lar maintenance and financial constraints on collective farms thatmaintain the water pipes and on the responsible municipalities haveresulted in an insufficient domestic water supply for rural populations.
The quality of the water being supplied may also be affected bydiscontinuous supply, as contaminants will enter through leaks inthe network when the pressure drops. This is clearly illustrated inArmenia, where faults in the network when the supply is switchedoff have been associated with contamination and outbreaks ofwaterborne disease (Box 4.2) (93). In the Russian Federation, about50% of the population uses water that does not meet national quality
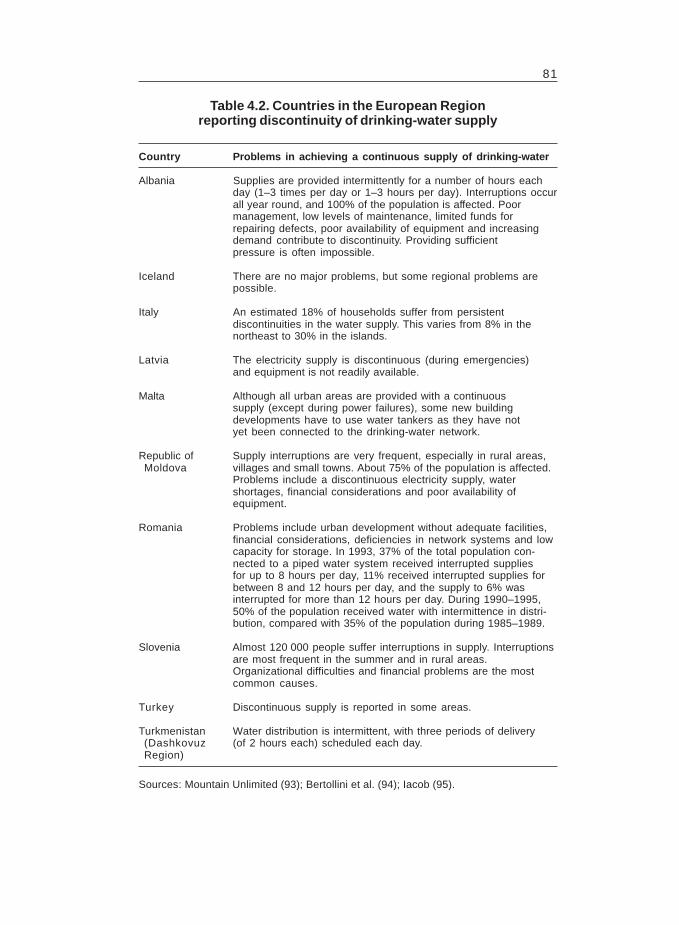
81
Country Problems in achieving a continuous supply of drinking-water
Albania Supplies are provided intermittently for a number of hours eachday (1–3 times per day or 1–3 hours per day). Interruptions occurall year round, and 100% of the population is affected. Poormanagement, low levels of maintenance, limited funds forrepairing defects, poor availability of equipment and increasingdemand contribute to discontinuity. Providing sufficientpressure is often impossible.
Iceland There are no major problems, but some regional problems arepossible.
Italy An estimated 18% of households suffer from persistentdiscontinuities in the water supply. This varies from 8% in thenortheast to 30% in the islands.
Latvia The electricity supply is discontinuous (during emergencies)and equipment is not readily available.
Malta Although all urban areas are provided with a continuoussupply (except during power failures), some new buildingdevelopments have to use water tankers as they have notyet been connected to the drinking-water network.
Republic of Supply interruptions are very frequent, especially in rural areas,Moldova villages and small towns. About 75% of the population is affected.
Problems include a discontinuous electricity supply, watershortages, financial considerations and poor availability ofequipment.
Romania Problems include urban development without adequate facilities,financial considerations, deficiencies in network systems and lowcapacity for storage. In 1993, 37% of the total population con-nected to a piped water system received interrupted suppliesfor up to 8 hours per day, 11% received interrupted supplies forbetween 8 and 12 hours per day, and the supply to 6% wasinterrupted for more than 12 hours per day. During 1990–1995,50% of the population received water with intermittence in distri-bution, compared with 35% of the population during 1985–1989.
Slovenia Almost 120 000 people suffer interruptions in supply. Interruptionsare most frequent in the summer and in rural areas.Organizational difficulties and financial problems are the mostcommon causes.
Turkey Discontinuous supply is reported in some areas.
Turkmenistan Water distribution is intermittent, with three periods of delivery(Dashkovuz (of 2 hours each) scheduled each day.Region)
Table 4.2. Countries in the European Regionreporting discontinuity of drinking-water supply
Sources: Mountain Unlimited (93); Bertollini et al. (94); Iacob (95).
82
standards. Water supply is frequently interrupted, especially in re-gions of the southern Russian Federation, where water may only besupplied for a few hours per day. In Romania, supply is discontinu-ous in many regions and affects up to 60% of supply systems, lead-ing to the distribution of water that is of dubious quality at best.Some interruptions exceed 12 hours per day. In Armenia, 50% ofpiped supplies do not meet quality standards. In a 5-year periodmore than 500 cases of dysentery and salmonellosis were reportedfrom inadequate and poor-quality water supplies (96).
Restrictions of supply can also be imposed in times of drought, asexperienced in Romania and the United Kingdom, resulting in re-duced access to water and, potentially, reduced quality caused bydiscontinuous supply.
Since 1988, Albania has had insufficient financial resources to maintaindrinking-water quality and sanitation. There have been several knownoutbreaks of waterborne disease, and it is believed that water also contrib-utes significantly to background rates of enteric diseases.
Although a number of aspects of water quality and supply need to beaddressed, one of the principal problems is the poor state of Albania’sdrinking-water networks. High rates of water loss (up to 70%) occur, and thisdecreases the amount of drinking-water available and can compromise itsquality by allowing ingress of contaminants. Although 100% of the populationof Tirana, for example, has a networked supply, this figure is reduced to 73%in more rural areas. Public wells are used by 5%, public fountains by 22%and local springs by 0.7% of the population in these areas (97).
Although Albania has high-quality groundwater sources available, the cost ofpumping this water prevents a continuous supply. In the peripheral areas ofTirana, for example, 77% of the population has water supplied for only2–3 hours per day and 33% of the population has water for 1 hour per day(97). The poor condition of the supply network is further compounded byintermittent distribution at low pressure, which results in microbial contamina-tion of the water in the supply system. High chlorine dosing is necessary toensure that there is sufficient residual chlorine to secure a microbially safesupply. Nevertheless, 21% of the population receive insufficiently chlorinatedwater. This is attributed to financial restrictions and lack of specializedequipment. In addition, many of the raw water sources used are contami-nated (coliform bacteria are found in 34% of water samples in Tirana), partlybecause treatment plants do not receive sufficient electricity (98).
Box 4.2. Influence of network integrity and discontinuous supplyon outbreaks of waterborne disease in Albania
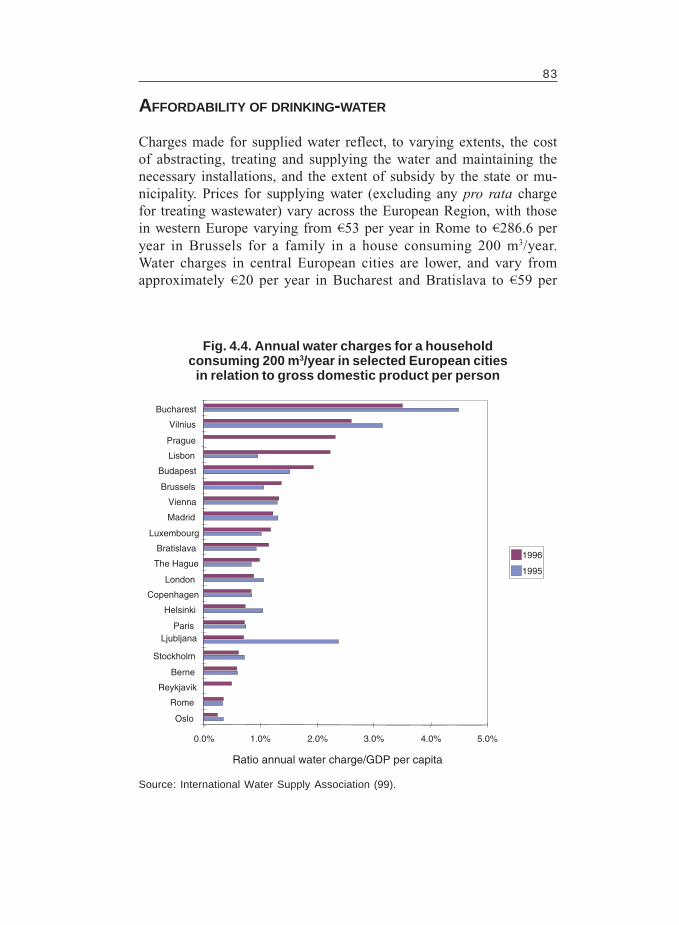
83
AFFORDABILITY OF DRINKING-WATER
Charges made for supplied water reflect, to varying extents, the costof abstracting, treating and supplying the water and maintaining thenecessary installations, and the extent of subsidy by the state or mu-nicipality. Prices for supplying water (excluding any pro rata chargefor treating wastewater) vary across the European Region, with thosein western Europe varying from 53 per year in Rome to 286.6 peryear in Brussels for a family in a house consuming 200 m3/year.Water charges in central European cities are lower, and vary fromapproximately 20 per year in Bucharest and Bratislava to 59 per
Source: International Water Supply Association (99).
Fig. 4.4. Annual water charges for a householdconsuming 200 m3/year in selected European citiesin relation to gross domestic product per person
0.0% 1.0% 2.0% 3.0% 4.0% 5.0%
Oslo
Rome
Reykjavik
Berne
Stockholm
LjubljanaParis
Helsinki
Copenhagen
London
The Hague
Bratislava
Luxembourg
Madrid
Vienna
Brussels
Budapest
Lisbon
Prague
Vilnius
Bucharest
Ratio annual water charge/GDP per capita
1996
1995
84
year in Prague (99). However, when these annual charges arecompared with the gross domestic product per person, the propor-tional costs in Bucharest, Vilnius and Prague are among the highest(Fig. 4.4).
Producing and providing clean water to consumers is expensive ininitial capital outlay and the ongoing costs of maintenance, manage-ment and extension of services. Payment for water, however, is anemotive issue. Water is a basic human need, and the long-termsustainability of water supply requires that costs are recovered sothat the infrastructure does not deteriorate, leading to a breakdownof the system. The costs of treating and disposing of wastewatershould also be recovered.
In many countries in the eastern part of the Region, water priceshave risen at a rate much higher than inflation since 1989, whenstate subsidies were reduced. Water storage and distribution systemsin the eastern part of Germany and in Hungary, for example, arenow fully financed from fees, with no state subsidy. The tariffs alsoinclude a portion for reconstruction and developing new schemes(52). Tariffs remain low in some countries: Albania has a fixed chargeof 5 lek (about 0.037) per m3 for domestic consumers, andTurkmenistan has no charge (93).
For all countries, cost containment should be an important objectiveof public utilities. Risk-taking and deficit-spending measures, basedon high technology and the assumption that consumers or the gov-ernment will pay at some future time, cannot be afforded and shouldbe discouraged (100).
CONSUMPTION OF BOTTLED WATER
Some countries in Europe have a tradition of consuming bottledwater, especially mineral water (Table 4.3). Consumption of bottledwater is increasing in these countries, and the market has widenedto include other countries where bottled water is not traditionallyconsumed in large quantities. In Austria, France, Germany, Italy,Spain and Switzerland, consumption of bottled water increased bybetween 139% and 248% from 1983 to 1992 (101).
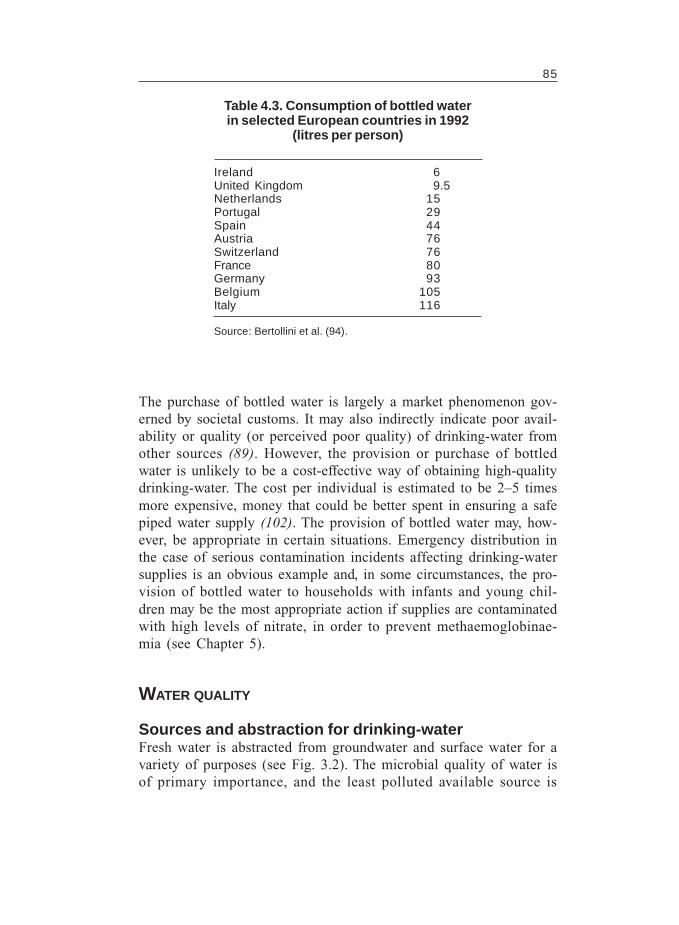
85
Ireland 6United Kingdom 9.5Netherlands 15Portugal 29Spain 44Austria 76Switzerland 76France 80Germany 93Belgium 105Italy 116
Source: Bertollini et al. (94).
Table 4.3. Consumption of bottled waterin selected European countries in 1992
(litres per person)
The purchase of bottled water is largely a market phenomenon gov-erned by societal customs. It may also indirectly indicate poor avail-ability or quality (or perceived poor quality) of drinking-water fromother sources (89). However, the provision or purchase of bottledwater is unlikely to be a cost-effective way of obtaining high-qualitydrinking-water. The cost per individual is estimated to be 2–5 timesmore expensive, money that could be better spent in ensuring a safepiped water supply (102). The provision of bottled water may, how-ever, be appropriate in certain situations. Emergency distribution inthe case of serious contamination incidents affecting drinking-watersupplies is an obvious example and, in some circumstances, the pro-vision of bottled water to households with infants and young chil-dren may be the most appropriate action if supplies are contaminatedwith high levels of nitrate, in order to prevent methaemoglobinae-mia (see Chapter 5).
WATER QUALITY
Sources and abstraction for drinking-waterFresh water is abstracted from groundwater and surface water for avariety of purposes (see Fig. 3.2). The microbial quality of water isof primary importance, and the least polluted available source is
86
generally preferred for potable supply. Groundwater is generally ofbetter microbial and of more stable chemical quality than surfacewater, although at a local level some substances naturally occurringin groundwater, such as fluoride and arsenic, may be hazardous tohuman health. Shallow wells, in particular, are vulnerable to con-tamination. Upland surface waters are generally less contaminatedthan lowland ones.
The availability of natural resources largely determines the propor-tions of a country’s drinking-water derived from surface water andgroundwater. The convenience and practicality of using the sources(distance from the centres of population) are also influential. In somecountries (Albania, Denmark and Turkmenistan, for example) al-most all the drinking-water supply is provided by groundwater (93),whereas in others the majority has to be abstracted from surfacewater. Throughout most of Latvia, over 50% of the drinking-water isderived from groundwater. About 50% of the rural population ofLatvia use shaft or frame shallow wells (no deeper than 10–15 m),although in recent years the number of wells for collective use hasdecreased. In contrast, about 72% of the drinking-water in the UnitedKingdom and 87% of that in Norway is derived from surface water(Fig. 4.5). In Sweden, the largest cities use surface water, but nation-ally 50% of the population connected to a municipal area use sur-face water, 25% use surface water that has passed through gravelridges and 25% use groundwater. Sweden also has about 400 000 pri-vate wells supplying permanent homes and between 200 000 and400 000 wells supplying “recreation accommodation” (103). In Es-tonia, 60% of drinking-water is derived from surface water or shal-low wells and 40% from deep groundwater sources (104).
Some countries have a policy of trying to reduce the proportion ofdrinking-water supplied from aquifers. This may be to redress theover-exploitation of aquifers that has occurred in the past, as in theNetherlands, or because of concern about contamination ofgroundwater, as in the Republic of Moldova (24).
Drinking-water treatmentThe type and degree of treatment required to make water whole-some differs according to the quality of the raw water source. De-pending on the geology of the area, the groundwater may be
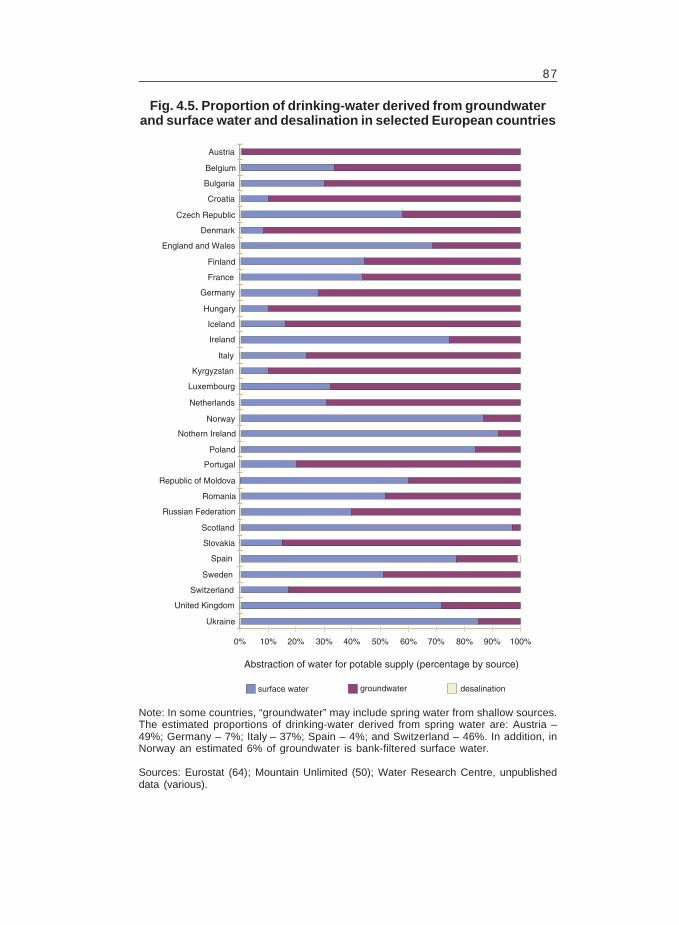
87
Note: In some countries, “groundwater” may include spring water from shallow sources.The estimated proportions of drinking-water derived from spring water are: Austria –49%; Germany – 7%; Italy – 37%; Spain – 4%; and Switzerland – 46%. In addition, inNorway an estimated 6% of groundwater is bank-filtered surface water.
Sources: Eurostat (64); Mountain Unlimited (50); Water Research Centre, unpublisheddata (various).
Fig. 4.5. Proportion of drinking-water derived from groundwaterand surface water and desalination in selected European countries
Abstraction of water for potable supply (percentage by source)
0% 10% 20% 30% 40% 50% 60% 70% 80% 90% 100%
Ukraine
United Kingdom
Switzerland
Sweden
Spain
Slovakia
Scotland
Russian Federation
Romania
Portugal
Poland
Nothern Ireland
Norway
Netherlands
Luxembourg
Kyrgyzstan
Italy
Ireland
Iceland
Hungary
Germany
France
Finland
England and Wales
Denmark
Czech Republic
Croatia
Bulgaria
Belgium
Austria
surface water groundwater desalination
Republic of Moldova
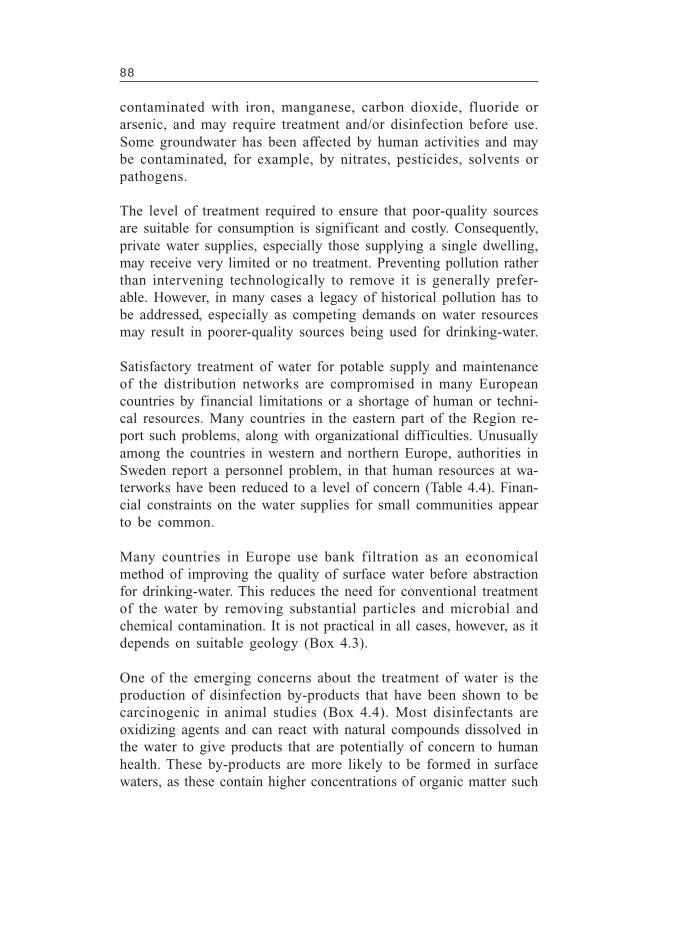
88
contaminated with iron, manganese, carbon dioxide, fluoride orarsenic, and may require treatment and/or disinfection before use.Some groundwater has been affected by human activities and maybe contaminated, for example, by nitrates, pesticides, solvents orpathogens.
The level of treatment required to ensure that poor-quality sourcesare suitable for consumption is significant and costly. Consequently,private water supplies, especially those supplying a single dwelling,may receive very limited or no treatment. Preventing pollution ratherthan intervening technologically to remove it is generally prefer-able. However, in many cases a legacy of historical pollution has tobe addressed, especially as competing demands on water resourcesmay result in poorer-quality sources being used for drinking-water.
Satisfactory treatment of water for potable supply and maintenanceof the distribution networks are compromised in many Europeancountries by financial limitations or a shortage of human or techni-cal resources. Many countries in the eastern part of the Region re-port such problems, along with organizational difficulties. Unusuallyamong the countries in western and northern Europe, authorities inSweden report a personnel problem, in that human resources at wa-terworks have been reduced to a level of concern (Table 4.4). Finan-cial constraints on the water supplies for small communities appearto be common.
Many countries in Europe use bank filtration as an economicalmethod of improving the quality of surface water before abstractionfor drinking-water. This reduces the need for conventional treatmentof the water by removing substantial particles and microbial andchemical contamination. It is not practical in all cases, however, as itdepends on suitable geology (Box 4.3).
One of the emerging concerns about the treatment of water is theproduction of disinfection by-products that have been shown to becarcinogenic in animal studies (Box 4.4). Most disinfectants areoxidizing agents and can react with natural compounds dissolved inthe water to give products that are potentially of concern to humanhealth. These by-products are more likely to be formed in surfacewaters, as these contain higher concentrations of organic matter such
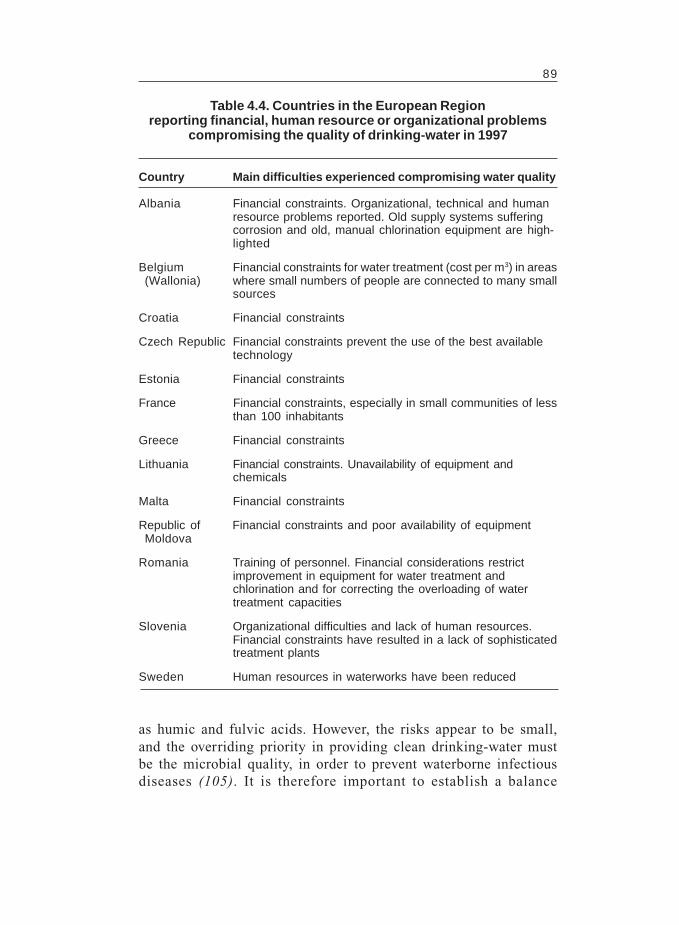
89
Country Main difficulties experienced compromising water quality
Albania Financial constraints. Organizational, technical and humanresource problems reported. Old supply systems sufferingcorrosion and old, manual chlorination equipment are high-lighted
Belgium Financial constraints for water treatment (cost per m3) in areas(Wallonia) where small numbers of people are connected to many small
sources
Croatia Financial constraints
Czech Republic Financial constraints prevent the use of the best availabletechnology
Estonia Financial constraints
France Financial constraints, especially in small communities of lessthan 100 inhabitants
Greece Financial constraints
Lithuania Financial constraints. Unavailability of equipment andchemicals
Malta Financial constraints
Republic of Financial constraints and poor availability of equipmentMoldova
Romania Training of personnel. Financial considerations restrictimprovement in equipment for water treatment andchlorination and for correcting the overloading of watertreatment capacities
Slovenia Organizational difficulties and lack of human resources.Financial constraints have resulted in a lack of sophisticatedtreatment plants
Sweden Human resources in waterworks have been reduced
Table 4.4. Countries in the European Regionreporting financial, human resource or organizational problems
compromising the quality of drinking-water in 1997
as humic and fulvic acids. However, the risks appear to be small,and the overriding priority in providing clean drinking-water mustbe the microbial quality, in order to prevent waterborne infectiousdiseases (105). It is therefore important to establish a balance
90
Bank filtration is extensively used in a number of European countries,including Germany, Hungary and the Netherlands. Water from a surfacewater source, usually a river, is allowed to filter into the groundwater zonethrough the riverbank and to travel through the aquifer to an extraction wellsome distance from the river. In some cases there is a short residence timein the aquifer, perhaps as little as 20–30 days, and there is almost no dilutionby natural groundwater (44).
Bank filtration is often very effective in improving the microbial quality ofwater, and also removes gross contamination such as suspended solids.Some chemical contaminants may also be removed by adsorption andcomplex formation in the filtration medium, although the extent of removaldepends on the chemical involved and the geology of the area. Conversely,certain contaminants may be mobilized, resulting in an increased concentra-tion. This is especially so in agricultural areas, where the concentrations ofpesticides and fertilizers may be high. Depending on the geology, thequantities of elements such as iron and manganese may also be increased,particularly under anoxic conditions.
Bank-filtered water is often classified as groundwater, despite its recentorigin in a surface source. This can produce problems in interpreting data onthe relative quality of groundwater and surface water, since many of theassumptions regarding groundwater (such as low levels of contaminants anda long recharge time) may not apply to some bank-filtered water, dependingon the quality of the surface water, the geology of the area and the residencetime before abstraction.
Box 4.3. Bank filtration
between maintaining effective disinfection and the need to reducedisinfection by-products to an acceptable level, which clearly fa-vours chemical disinfection.
The prevailing treatment and disinfection methods in European coun-tries are influenced by the quality of source water, financial resources,available technology and historical practice. In the newly independ-ent states, chlorine disinfection is most commonly used, often by anindirect chlorine gas procedure (Box 4.5) (107). Ultraviolet radia-tion is commonly used in some countries of Europe, for examplewith groundwater from the alpine regions of Liechtenstein (wherefaecal contamination from cattle is a concern) and for the 6% ofthe Icelandic population whose supplies are derived from sur-face water.
A number of different approaches are normally used within the samecountry (Table 4.5). In Poland, chlorination is the main method of
91
Chlorine is the most widely used drinking-water disinfectant in Europe. Thereaction of chlorine with water results in hypochlorous acid, which dissoci-ates to produce the hypochlorite ion. Alternatively, sodium hypochlorite canbe added as a disinfectant. Chlorine reacts with natural organic chemicalsdissolved in the water (humic and fulvic acids) to form chloroform (trichlo-romethane). In addition, hypochlorous acid oxidizes bromide present in thewater to form hypobromous acid, which also reacts with humic and fulviccompounds to produce bromoform. Mixed trihalomethanes(dibromochloromethane and bromodichloromethane) are also produced.
Animal studies using high doses of these compounds have indicated theircarcinogenic potential, and many countries regulate their levels in drinking-water. There are other disinfection by-products, some of unknown toxicity,and the presence of trihalomethanes is considered to provide a broadindicator for these other chlorination by-products. Other by-products includechlorinated acetic acids, chloral hydrate, chloroacetones, halogenatedacetonitriles, cyanogen chloride and chloropicrin (105). Some other disinfec-tion by-products, especially chlorophenols, impart an unpleasant taste andodour to the water.
Ozone is often used as an alternative where the natural water containssubstances that would produce adverse taste and odour if chlorine wereused. This is a preferred method of disinfection in some countries (such asFrance and Germany) and has been shown to be effective against Giardiacysts and Cryptosporidium. It is expensive, however, and there is no residualdisinfection action within the water supply mains. Biological growth maysubsequently occur within the piping. To prevent this, low-level chlorination isoften used after ozonation to impart a residual disinfectant action. A by-product of ozonation is bromate, formed by the oxidation of the bromidepresent in water, which has been shown to be carcinogenic in laboratoryanimals.
Chlorine dioxide is a further option, used in Belgium, France, Germany andItaly. Although fewer trihalomethanes are produced with chlorine dioxide thanwith chlorine, the concentrations of chlorite and chlorate may be higher insome water. Sodium chlorite has no known adverse physiological effects onhumans, but methaemoglobinaemia, anuria, abdominal pain and renal failureare associated with chlorate poisoning. Chlorine dioxide is more effectivethan chlorine in inactivating Giardia cysts and Cryptosporidium oocysts, butthe residual is unstable (106).
Ultraviolet radiation is used to disinfect water supplies, alone or in conjunctionwith chemical disinfectants. As with ozone, the disadvantage is the lack ofresidual disinfection in the distribution, and chlorination may therefore also berequired. It is effective against bacteria and many viruses, but not againstGiardia cysts and Cryptosporidium oocysts (106).
Box 4.4. Disinfection procedures and by-products
water disinfection in public water supply systems. In wells and indi-vidual water supply systems, chloramine and chlorinated lime (con-taining up to 30% of active chlorine) are commonly used. Chlorinedioxide is in wide use in France, Germany and Italy, but ozone is
92
For various reasons, including the pollution of surface water and sometimesgroundwater, providing drinking-water in sufficient quantities and of sufficientquality has become an acute problem in many regions of the newly independ-ent states. The countries with the largest percentages of water samples thatfail to comply with national standards are Azerbaijan, Estonia, Kazakhstan,Kyrgyzstan and Turkmenistan. Drinking-water has historically been ab-stracted mainly from surface resources. The most severely affected areas interms of tap water quality are in regions of central Asia around the Aral Sea.Up to 60% of the water samples from municipal water supply systems andapproximately 38% from rural supply systems in the Kyzyl-Orda region donot comply with national standards. Established water quality standards arenot always met because of the high degree of pollution, inadequate treatment,and secondary bacterial pollution in the supply networks. About one third ofthe population uses water from untreated local sources. These factors havecontributed to an increase in outbreaks of acute digestive infections. In 1993there were 17 outbreaks, including 10 of dysentery. An outbreak ofgastrointestinal infections and typhoid was also recorded in 1993 inRostovskaya oblast, where 300 people became ill in Volgodonsk.
Box 4.5. Drinking-water problems in the newly independent states
Sources: State Committee of the Russian Federation on Environmental Protection (9);Abakumov & Talayeva (23).
preferred at some sites in France and Germany and is also commonin the Netherlands.
Water quality may be threatened (through recontamination) wherediscontinuous chlorination occurs – Albania, Armenia, Estonia,Greece, Lithuania, the Republic of Moldova, Romania, Turkmenistanand Ukraine reported such problems (50,93). In many cases this isattributed to old, broken or manual equipment or a lack of chlorine(108). Automatic equipment for continuous chlorination using so-dium hypochlorite has now been installed in a number of cities inAlbania.
Insufficient treatment of water, especially disinfection, is a particu-lar problem in small supplies. Many small waterworks in Norway,for example, do not have suff icient disinfection, and problems ofmicrobial contamination are reported in small supplies in the Walloniaregion of Belgium because of discontinuous chlorination or no dis-infection. Achieving high-quality drinking-water (microbial andchemical) in small communities of less than 100 inhabitants, at areasonable price, is also regarded as a problem in France.
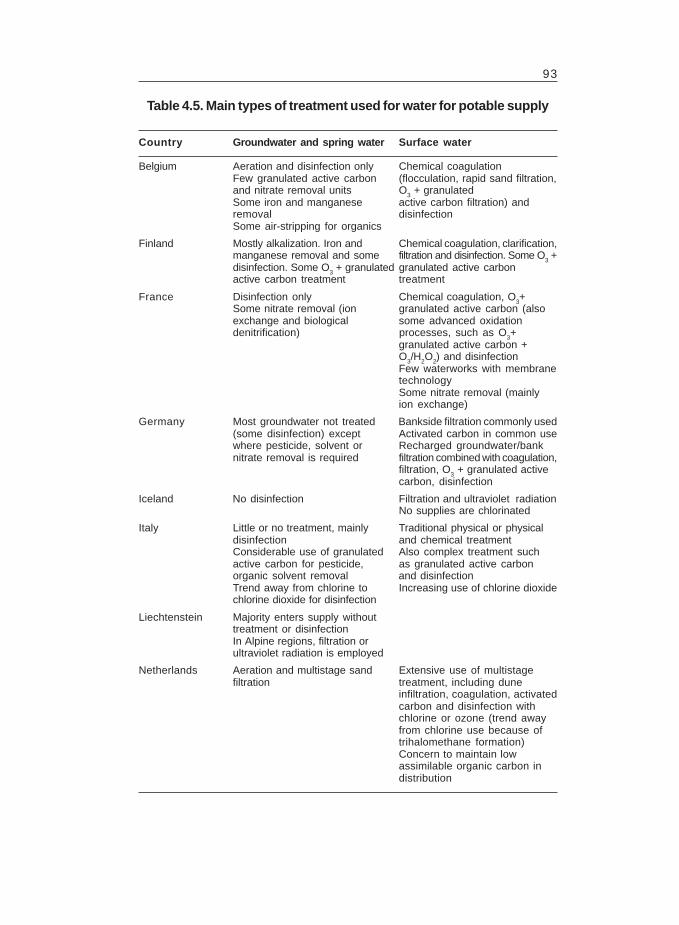
93
Country Groundwater and spring water Surface water
Belgium Aeration and disinfection only Chemical coagulationFew granulated active carbon (flocculation, rapid sand filtration,and nitrate removal units O3 + granulatedSome iron and manganese active carbon filtration) andremoval disinfectionSome air-stripping for organics
Finland Mostly alkalization. Iron and Chemical coagulation, clarification,manganese removal and some filtration and disinfection. Some O3 +disinfection. Some O3 + granulated granulated active carbonactive carbon treatment treatment
France Disinfection only Chemical coagulation, O3+Some nitrate removal (ion granulated active carbon (alsoexchange and biological some advanced oxidationdenitrification) processes, such as O3+
granulated active carbon +O3/H2O2) and disinfectionFew waterworks with membranetechnologySome nitrate removal (mainlyion exchange)
Germany Most groundwater not treated Bankside filtration commonly used(some disinfection) except Activated carbon in common usewhere pesticide, solvent or Recharged groundwater/banknitrate removal is required filtration combined with coagulation,
filtration, O3 + granulated activecarbon, disinfection
Iceland No disinfection Filtration and ultraviolet radiationNo supplies are chlorinated
Italy Little or no treatment, mainly Traditional physical or physicaldisinfection and chemical treatmentConsiderable use of granulated Also complex treatment suchactive carbon for pesticide, as granulated active carbonorganic solvent removal and disinfectionTrend away from chlorine to Increasing use of chlorine dioxidechlorine dioxide for disinfection
Liechtenstein Majority enters supply withouttreatment or disinfectionIn Alpine regions, filtration orultraviolet radiation is employed
Netherlands Aeration and multistage sand Extensive use of multistagefiltration treatment, including dune
infiltration, coagulation, activatedcarbon and disinfection withchlorine or ozone (trend awayfrom chlorine use because oftrihalomethane formation)Concern to maintain lowassimilable organic carbon indistribution
Table 4.5. Main types of treatment used for water for potable supply
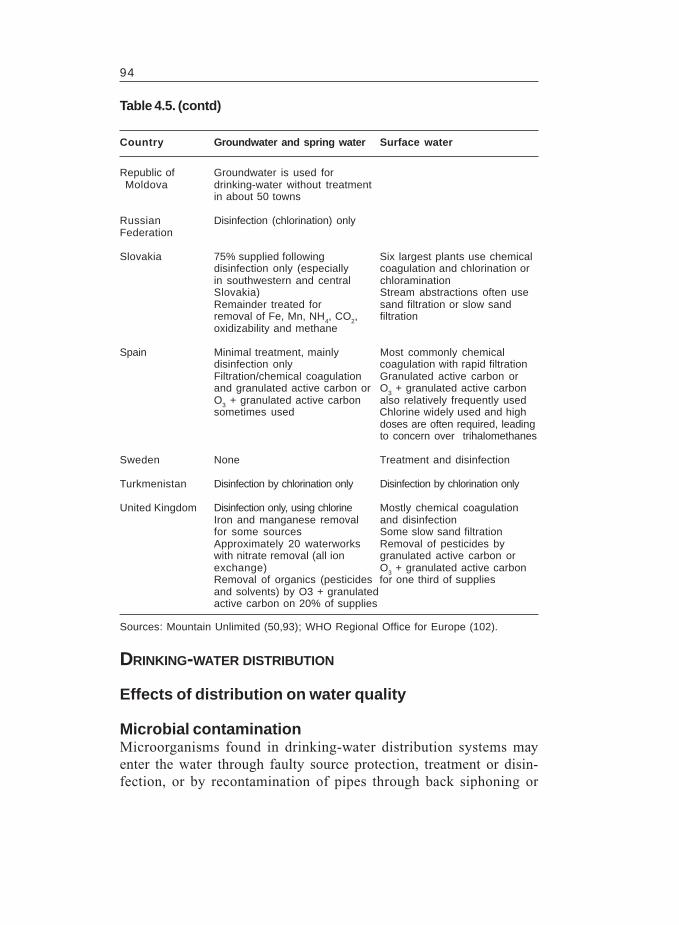
94
Republic of Groundwater is used forMoldova drinking-water without treatment
in about 50 towns
Russian Disinfection (chlorination) onlyFederation
Slovakia 75% supplied following Six largest plants use chemicaldisinfection only (especially coagulation and chlorination orin southwestern and central chloraminationSlovakia) Stream abstractions often useRemainder treated for sand filtration or slow sandremoval of Fe, Mn, NH4, CO2, filtrationoxidizability and methane
Spain Minimal treatment, mainly Most commonly chemicaldisinfection only coagulation with rapid filtrationFiltration/chemical coagulation Granulated active carbon orand granulated active carbon or O3 + granulated active carbonO3 + granulated active carbon also relatively frequently usedsometimes used Chlorine widely used and high
doses are often required, leadingto concern over trihalomethanes
Sweden None Treatment and disinfection
Turkmenistan Disinfection by chlorination only Disinfection by chlorination only
United Kingdom Disinfection only, using chlorine Mostly chemical coagulationIron and manganese removal and disinfectionfor some sources Some slow sand filtrationApproximately 20 waterworks Removal of pesticides bywith nitrate removal (all ion granulated active carbon orexchange) O3 + granulated active carbonRemoval of organics (pesticides for one third of suppliesand solvents) by O3 + granulatedactive carbon on 20% of supplies
Table 4.5. (contd)
Country Groundwater and spring water Surface water
Sources: Mountain Unlimited (50,93); WHO Regional Office for Europe (102).
DRINKING-WATER DISTRIBUTION
Effects of distribution on water quality
Microbial contaminationMicroorganisms found in drinking-water distribution systems mayenter the water through faulty source protection, treatment or disin-fection, or by recontamination of pipes through back siphoning or
95
regrowth. When the water pressure in the mains is not sufficient,such as when water supplies are discontinuous, microorganisms canenter the distribution system through leaks and contaminate the wa-ter. This is most serious when mains pipes are laid alongside sewer-age systems. Loss of pressure may also result in back-siphoning ofwater through the plumbing system from sources of contaminationsuch as taps. In Albania, the corrosion of old pipework also contrib-utes to the contamination of drinking-water.
The growth of bacteria in distribution systems can result in discol-oration and the imparting of taste and odour to the water. It can alsolead to the proliferation of microorganisms and even higher organ-isms such as Asellus aquaticus (water louse). The growth of mostbacteria is limited by the concentration of assimilable organic car-bon in the water and/or the concentration and type of disinfectantresidual. Even where disinfection is practised, biofilm slimes canharbour bacterial and protozoal pathogens that can be released intothe distribution system when parts of the biofilm slough off. Thiscan occur during and after chlorination. Pathogens may also be pro-tected from the action of chlorine (and other disinfectants) in thebiofilm. The presence of biofilms may also initiate and promote cor-rosion in water distribution systems. This may be considered an in-direct risk if the corrosion leads to a failure of the pipe system andingress of material from the surrounding environment.
Conventional water treatment processes such as coagulation, sedimen-tation and filtration can reduce assimilable organic carbon, but concen-trations are increased by oxidants such as chlorine and ozone. To achievethe very low concentrations required to limit regrowth in the absence ofa residual disinfectant, multi-stage treatment is required, including someform of biologically active process such as slow-sand or granulatedactive carbon filtration with intermediate stages of oxidation (109).
Despite efforts to minimize carbon sources, concentrations can stillbe sufficient to allow the regrowth of microbes in long distributionsystems. Finland, for example, reports such problems.
Chemical contaminationThe materials used in constructing distribution systems, the integ-rity of the systems and the maintenance of positive water pressure
96
within the system can all affect the quality of the water supplied.The choice of pipes and materials depends on the size of the pipesand has changed with time. Large trunk mains have historically beenconstructed of iron, steel or asbestos cement. Asbestos cement hasnow largely been phased out and plastics such as unplasticized poly-vinyl chloride and polyethylenes such as medium-densitypolyethylene are supplementing the use of iron and steel. Neverthe-less, there are concerns about the leaching of antioxidants, stabiliz-ers and plasticizers from these products into water and leaching testsmay be carried out on materials to be used in contact with drinking-water. Contamination can be better controlled by focusing on thematerials rather than on the water quality.
Until the middle of the 20th century, lead was favoured as the con-struction material for service pipes in many countries. However, be-cause of the recognized need to reduce exposure to lead and, inparticular, concerns about the effects of dissolved lead on the devel-opment of the nervous system in children, lead piping is no longerinstalled in many countries and is gradually being removed from thedistribution system. Newly laid polyvinyl chloride pipes with leadas a stabilizer are reported to contaminate drinking-water sup-plies with lead, although such leaching appears to be a short-term problem. The WHO guideline value (105) and the new EUstandard (48) for lead in drinking-water are both 10 µg/l; the pre-vious EU standard was 50 µg/l. The main remedy is to removelead piping, which is expensive and time-consuming, and it maytherefore take time before drinking-water in general meets thestandard. The EU allows until 2013 for implementation to be com-pleted.
In the past, iron distribution pipes were often coated internally withcoal tar to reduce corrosion. Such linings contain relatively highlevels of polycyclic aromatic hydrocarbons, a number of which arecarcinogenic. The smaller, more water-soluble polycyclic aromatichydrocarbons such as fluoranthene leach into the carried water. Al-though these polycyclic aromatic hydrocarbons are generally notregarded as carcinogenic, the use of such linings is now widely pro-hibited. Metal pipes now often receive instead an internal coating ofbitumen, which contains very low levels of polycyclic aromatichydrocarbons.
97
LeakageThe efficiency of water transfer within supply networks directly af-fects water demand. Leakage in water distribution networks may besignificant and can account for over 50% of the water entering thenetwork (Table 4.6). However, poor metering and monitoring in somecountries makes accurate estimation difficult.
Leakage may be reduced by a number of methods such as:
• repairing visible leaks;• establishing leakage control zones;• becoming aware of, locating and repairing leaks not visible from
the surface;• conducting telemetry of zone flows;• reducing pressure;• replacing mains;• subsidizing the detection and repair of leaks in supply pipes for
domestic customers or businesses;• repairing leakage through the maintenance of service reservoirs;• minimizing service reservoir overflow losses; and• detecting and repairing leakage in trunk mains.
Estimates of future network efficiency in France range from 78% inurban areas and 72% in rural areas to 80% for both. Nevertheless,improvement is not the overall trend throughout Europe.
Many countries are attempting to reduce leakage rates, often en-couraged by government concern. Water companies in the UnitedKingdom have statutory targets (with financial penalties) for reduc-ing leakage, and this has proved successful in some regions (Ta-ble 4.7). Yorkshire Water Services in the United Kingdom considersthat there is little scope for further reductions by repairing visibleleaks and establishing leakage control zones. Nevertheless, optionssuch as telemetry of zone flows, reducing pressure, subsidizing thedetection and repair of customer supply pipes, repairing leakagethrough the maintenance of service reservoirs and replacing mainscould bring about further reduction (52).
A potential conflict of interest has arisen recently in the United King-dom, as reduction in mains pressure to reduce leakage has raised
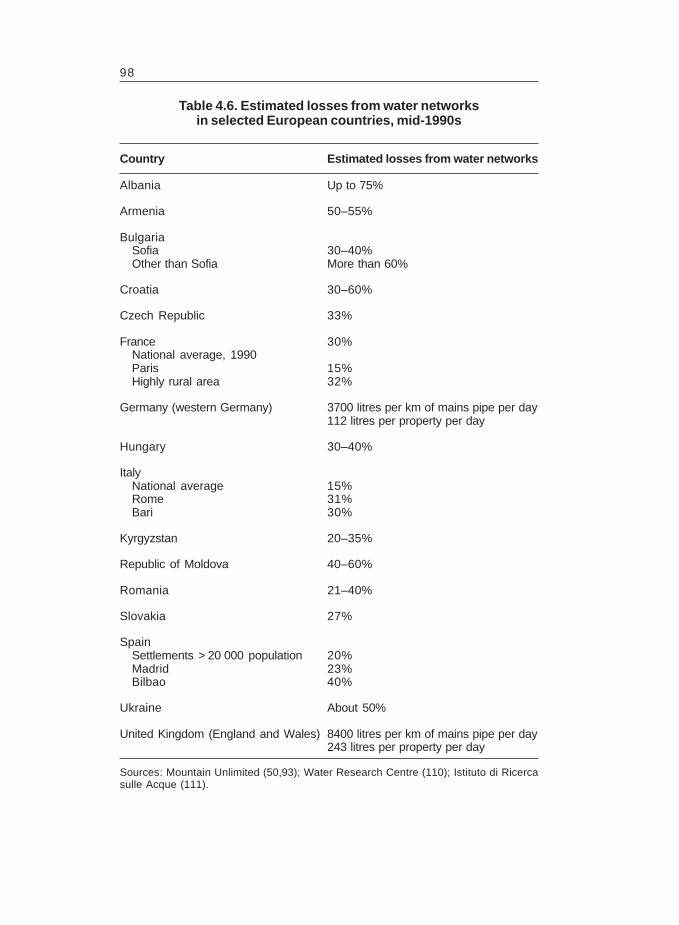
98
Country Estimated losses from water networks
Albania Up to 75%
Armenia 50–55%
BulgariaSofia 30–40%Other than Sofia More than 60%
Croatia 30–60%
Czech Republic 33%
France 30%National average, 1990Paris 15%Highly rural area 32%
Germany (western Germany) 3700 litres per km of mains pipe per day112 litres per property per day
Hungary 30–40%
ItalyNational average 15%Rome 31%Bari 30%
Kyrgyzstan 20–35%
Republic of Moldova 40–60%
Romania 21–40%
Slovakia 27%
SpainSettlements > 20 000 population 20%Madrid 23%Bilbao 40%
Ukraine About 50%
United Kingdom (England and Wales) 8400 litres per km of mains pipe per day243 litres per property per day
Table 4.6. Estimated losses from water networksin selected European countries, mid-1990s
Sources: Mountain Unlimited (50,93); Water Research Centre (110); Istituto di Ricercasulle Acque (111).
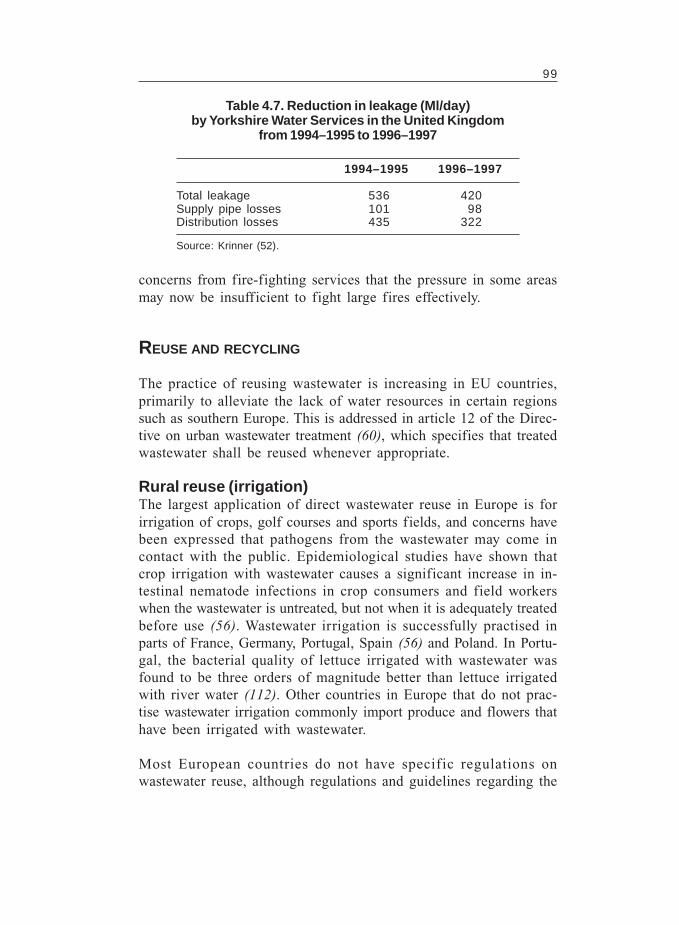
99
1994–1995 1996–1997
Total leakage 536 420Supply pipe losses 101 98Distribution losses 435 322
Table 4.7. Reduction in leakage (Ml/day)by Yorkshire Water Services in the United Kingdom
from 1994–1995 to 1996–1997
Source: Krinner (52).
concerns from fire-fighting services that the pressure in some areasmay now be insufficient to fight large fires effectively.
REUSE AND RECYCLING
The practice of reusing wastewater is increasing in EU countries,primarily to alleviate the lack of water resources in certain regionssuch as southern Europe. This is addressed in article 12 of the Direc-tive on urban wastewater treatment (60), which specifies that treatedwastewater shall be reused whenever appropriate.
Rural reuse (irrigation)The largest application of direct wastewater reuse in Europe is forirrigation of crops, golf courses and sports fields, and concerns havebeen expressed that pathogens from the wastewater may come incontact with the public. Epidemiological studies have shown thatcrop irrigation with wastewater causes a significant increase in in-testinal nematode infections in crop consumers and field workerswhen the wastewater is untreated, but not when it is adequately treatedbefore use (56). Wastewater irrigation is successfully practised inparts of France, Germany, Portugal, Spain (56) and Poland. In Portu-gal, the bacterial quality of lettuce irrigated with wastewater wasfound to be three orders of magnitude better than lettuce irrigatedwith river water (112). Other countries in Europe that do not prac-tise wastewater irrigation commonly import produce and flowers thathave been irrigated with wastewater.
Most European countries do not have specific regulations onwastewater reuse, although regulations and guidelines regarding the
100
uses of water may apply. WHO (57) has developed quality guide-lines for the use of treated wastewater in irrigation. These specifythe following.
• Treated wastewater to be used for restricted irrigation (that is, theirrigation of all crops except those eaten uncooked), should con-tain no more than 1 human intestinal nematode (human round-worm, whipworm or hookworm) egg per litre.
• Treated wastewater to be used for unrestricted irrigation (that is,the irrigation of crops eaten uncooked) should contain no morethan 1 human intestinal nematode (human roundworm, whipwormor hookworm) egg per litre and should contain no more than1000 faecal coliform bacteria per 100 ml.
Effluents complying with standards can be produced by treatingwastewater in waste stabilization ponds (113). Conventional treat-ment processes, such as activated sludge, can achieve the guidelineon nematodes because of the two periods of primary and secondarysedimentation, but a tertiary treatment process such as maturation(“polishing”) ponds, ultraviolet light or chemical disinfection is re-quired to meet the guideline on faecal coliform bacteria.
Spray irrigation using treated wastewater is not recommended, as itmay constitute a risk to operators and adjacent communities by theinhalation of pathogens in aerosol droplets.
The potential for water reuse and recycling has not been fully ex-ploited in many areas, and economic or regulatory incentives arelikely to be required to encourage its use. Experience in water reuseis therefore lacking in much of Europe. In many circumstances, thelimiting factors can be the quality of the water available, the poten-tial hazards for secondary users and public perception.
DesalinationThe desalination of seawater costs approximately 0.7 per m3, in-cluding energy cost and depreciation, and its contribution to thetotal water supply in Europe is very limited. In Monaco and Spain,desalination contributes 0.45% and 0.33% of the water supply, re-spectively. In Malta and the Balearic Islands, characterized by a
101
comparatively dry climate and relatively limited surface water re-sources, desalination is of greater importance, contributing 46% ofthe total water in Malta (114) and one third of the total urban watersupply (91 500 m3/day) in the Balearics (52).
The viability of desalination as a more widespread option for thefuture will depend on technological advances, the cost of energyand the cost of using alternative sources.
WATER TRANSFER
There are several large-scale, inter-basin water transfer schemes inEurope. The Rhône-Languedoc transfer and the Canal de Provencein France, with capacities of 75 and 40 m3/s, respectively, are two ofthe largest. Smaller schemes exist in Belgium, Greece and the UnitedKingdom. Spain has about 50 small inter-basin water schemes ableto transfer about 1.5 km3/year. For inter-basin transfers to be an effi-cient, cost-effective and acceptable means of satisfying water de-mand in regions with low water resources, the environmentalsustainability and economic viability need to be assessed carefully(52). Schemes to carry water from one catchment area to anotherhave encountered considerable resistance from local populations insome regions, especially if there is evidence or suspicion of watershortage in the donor region.
The removal of large volumes of water from natural watercoursesfor water transfer may have detrimental environmental effects andaffect water availability in downstream regions. Such effects wereexperienced in Turkmenistan and Uzbekistan, where water has beendiverted from the two major rivers that feed the freshwater Aral Seato areas that were being developed to allow intensive cotton produc-tion. These water transfers have seriously harmed water resourceswithin the basin. The sea has shrunk significantly, and the quality ofthe rivers and groundwater in the area has seriously deteriorated(see Box 3.1).
Health effects
103
RESTRICTED ACCESS TO DRINKING-WATER
Access to a sufficient supply of safe water is essential in maintain-ing public health. Situations with inadequate water directly and in-directly affect health. Poor hygiene caused by the lack of water resultsin the increased transmission of infectious diseases (115). Wherethe sources of potable water are of poor quality, or the financing,staffing and other infrastructure to maintain the distribution systemare lacking, mortality rates attributable to infectious diseases, to theavailability of sanitation services and to general hygiene may in-crease. Inadequate water supplies increase the likelihood of person-to-person disease transmission and can compromise the effectivenessand efficiency of water-based sewage collection and treatment proc-esses, posing an additional risk of disease.
In recent years the privatization of water supplies in some countrieshas resulted in an increase in the number of households discon-nected from water supplies. In the United Kingdom, for example,the number of domestic disconnections rose from 8000 to over21 000 between 1989 and 1992 following privatization of the waterindustry. Water has become an increasingly expensive commodityand evidence indicates that, where water meters have been intro-duced, those with lower incomes use less water (116). Few studieshave examined the social and health effects of water disconnectionor of excessively low water use to save money (117). One study
5
104
showed a significant correlation between the number of disconnectedhouseholds and the incidence of hepatitis A and shigellosis in someareas of the United Kingdom. This study also implicated involun-tary reduction in water use because of economic deprivation as thecause of the increase in disease (118).
DRINKING-WATER QUALITY
The quality of drinking-water in supply depends on many factors,including the quality of the raw water source, the extent and type oftreatment and disinfection used, the materials and integrity of thedistribution system, and the maintenance of positive pressure withinthe network. Excessive abstraction and mineral excavation can alsolead to contamination of the groundwater supply. In Kyrgyzstan,the groundwater supply has suffered saline intrusion and toxin con-tamination. Surface water is of equally or even poorer quality inKyrgyzstan. Spring floods lead to annual outbreaks of hepatitis, ty-phoid and diarrhoeal disease (96).
A number of chemical compounds are produced during disinfec-tion of drinking-water, some of which have been shown to be car-cinogens in animal studies. Standards and/or guidelines have beenset for known by-products, but the toxicity of by-products that havenot yet been identified is also of potential concern. The microbialsafety of drinking-water is the overriding concern, and should notbe compromised because of concern about possible risks to healthfrom the presence of disinfection by-products.
Microbial qualityThe provision of a microbially safe drinking-water supply is the mostimportant step that can be taken to improve the health of a commu-nity, by preventing the spread of waterborne disease (105). Monitor-ing the microbial quality of drinking-water is therefore aimed atverifying that it is free from such contamination. The pathogenicorganisms directly responsible for the spread of disease are of con-cern, but detecting them is difficult, expensive and time-consuming.Pathogen detection is therefore not appropriate for routine monitor-ing. In addition, not all pathogens have as yet been characterizedand methods for detection of some others remain unavailable.
105
Instead, water is examined for bacteria that indicate the presence offaecal contamination (105) (Box 5.1).
The ideal indicators of faecal contamination should be universally present inthe faeces of humans and warm-blooded animals and should not grow innatural bodies of water. They should be easy to detect and enumerate inwater. Their persistence and removal during water treatment should besimilar to those of waterborne pathogens, so that they not only act asindicators of faecal contamination but also monitor the effectiveness of anywater treatment measures in removing pathogens from the supply (105).
Escherichia coli and the thermotolerant (“faecal”) coliform bacteria are theorganisms most commonly used to indicate faecal contamination. Faecalstreptococci are more persistent than E. coli and coliform bacteria; they aremonitored regularly in fewer European countries than coliform bacteria andmay be used as a supplementary measure to investigate supplies wherecoliform bacteria measurements have indicated microbial contamination.Faecal streptococci have been shown to be good indicators of microbialcontamination of a network system with discontinuities in water supply (119).
Box 5.1. Microbial indicators of faecal contamination
WHO guidelines for drinking-water quality recommend that indica-tors of faecal contamination (E. coli or thermotolerant coliform bac-teria) should not be detectable in any 100-ml sample of any waterintended for drinking (105). For treated water entering the distribu-tion system, neither faecal indicators nor total coliform bacteriashould be detectable in any 100-ml sample. For water within thedistribution system, the recommendation is again that no faecal in-dicators should be detectable in any 100-ml sample. The same ap-plies to total coliform bacteria, although the guideline indicates that,for large supplies for which a large number of samples are exam-ined, total coliform bacteria should not be present in 95% of sam-ples taken throughout any 12-month period (105). Fig. 5.1 and 5.2show the percentage of drinking-water samples exceeding the na-tional standards for total and faecal coliform bacteria (the nationalstandards are specified in the figures).
Many European countries have standards for both total coliformbacteria and faecal indicators of zero per 100 ml. Although no coun-tries permit the supply of drinking-water containing faecal indica-tors, a number of countries in the eastern part of the Region permitsome evidence of microbial contamination, as detected by total col-iform bacteria (0–3 per 100 ml).
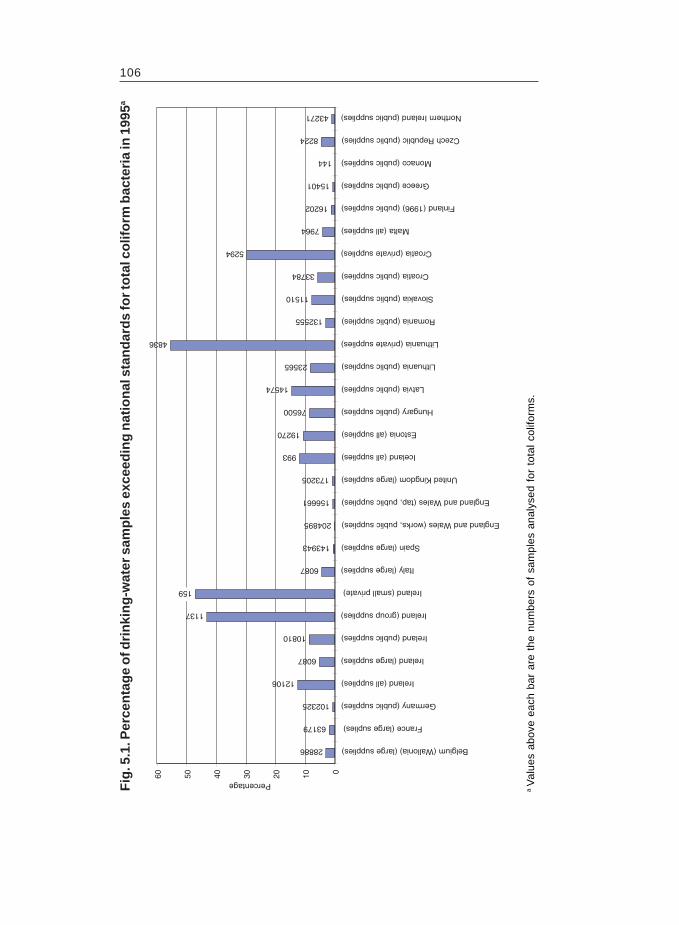
106
Fig
. 5.1
. Per
cen
tag
e o
f dri
nki
ng
-wat
er s
amp
les
exce
edin
g n
atio
nal
sta
nd
ard
s fo
r to
tal c
olif
orm
bac
teri
a in
199
5a
8224
15401
144
43271
28886
63179
102325
12106
6087
10810
1137
159
6087
143943
204895
156661
173205
993
19270
76500
14574
23565
4836
132555
11510
33784
5294
7964
16202
0102030405060
Belgium (Wallonia) (large supplies)
France (large suplies)
Germany (public supplies)
Ireland (all supplies)
Ireland (large supplies)
Ireland (public supplies)
Ireland (group supplies)
Ireland (small private)
Italy (large supplies)
Spain (large supplies)
England and Wales (works, public supplies)
England and Wales (tap, public supplies)
United Kingdom (large supplies)
Iceland (all supplies)
Estonia (all supplies)
Hungary (public supplies)
Latvia (public supplies)
Lithuania (public supplies)
Lithuania (private supplies)
Romania (public supplies)
Slovakia (public supplies)
Croatia (public supplies)
Croatia (private supplies)
Malta (all supplies)
Finland (1996) (public supplies)
Greece (public supplies)
Monaco (public supplies)
Czech Republic (public supplies)
Northern Ireland (public supplies)
Percentage
aV
alue
s ab
ove
each
bar
are
the
num
bers
of
sam
ples
ana
lyse
d fo
r to
tal
colif
orm
s.
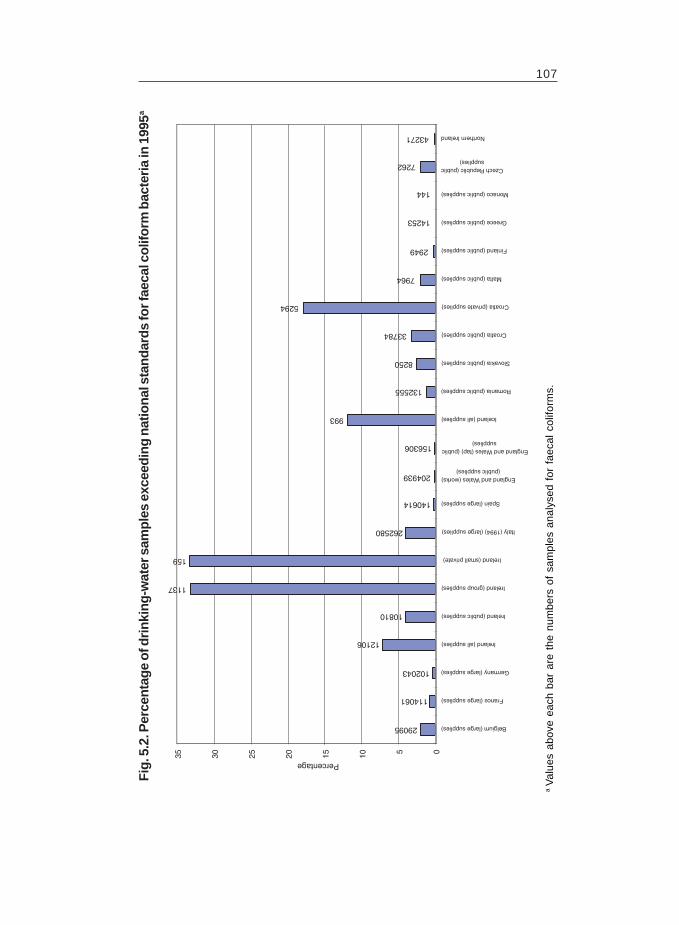
107
Fig.
5.2
. Per
cent
age
of d
rink
ing-
wat
er s
ampl
es e
xcee
ding
nat
iona
l sta
ndar
ds fo
r fae
cal c
olifo
rm b
acte
ria
in 1
995a
aV
alue
s ab
ove
each
bar
are
the
num
bers
of
sam
ples
ana
lyse
d fo
r fa
ecal
col
iform
s.
43271
7262
144
14253
2949
7964
5294
33784
8250
132555
993
156306
204939
140614
262580
159
1137
10810
12106
102043
114061
29095
05101520253035
Belgium (large supplies)
France (large supplies)
Germany (large supplies)
Ireland (all supplies)
Ireland (public supplies)
Ireland (group supplies)
Ireland (small private)
Italy (1994) (large supplies)
Spain (large supplies)
England and Wales (works)(public supplies)
England and Wales (tap) (publicsupplies)
Iceland (all supplies)
Romania (public supplies)
Slovakia (public supplies)
Croatia (public supplies)
Croatia (private supplies)
Malta (public supplies)
Finland (public supplies)
Greece (public supplies)
Monaco (public supplies)
Czech Republic (publicsupplies)
Northern Ireland
Percentage
108
Community-managed supplies may not be subject to such stringentstandards as public supplies, and the quality of community-managed supplies may therefore be compromised. In Lithuania, forexample, the standard for total coliform bacteria in public suppliesis 0.3 per 100 ml, whereas 1 per 100 ml is permitted in community-managed supplies. Microbial contamination is reported to be a par-ticular problem in private wells. Community-managed supplies maynot be examined as part of a routine monitoring programme andmay only, as in Ireland, be examined on an emergency basis in re-sponse to reported problems. Thus samples will not be representa-tive of the supplies as a whole, and the reported proportion thatexceed the standard will be higher than would be the case for ran-dom sampling.
Indicators of microbial contamination are among the parametersfound most frequently at levels of concern in the drinking-water ofmany European countries. These include Andorra, Croatia, the CzechRepublic, Estonia, Germany, Greece, Iceland, Liechtenstein, Malta,Norway, Slovakia, Slovenia, Sweden, Turkey, Turkmenistan andUkraine. In parts of Belgium and France, microbial contaminationis reported to be a particular concern in small supplies.
The bacterial quality of drinking-water depends on a number of fac-tors – the depth of the aquifer, the condition of the distribution net-work, the eff iciency of treatment and disinfection in particular.Diseases can also be contracted by exposure to microbially con-taminated water during recreation, and potentially as a result of theuse of contaminated water for irrigation. Spray irrigation, in particu-lar, is a potential hazard to agricultural workers, and disease can bespread via foodstuffs, especially produce eaten uncooked, that havebeen irrigated with water containing pathogens.
Agricultural activities, often coupled with poor source protection, arewidely regarded as contributing to microbial contamination of watersources; this is reported as a factor in Liechtenstein. Where the watersource is open to animals or there is widespread use of septic tanks, thedrinking-water supplies are more likely to be contaminated (120).
Poor sewerage systems and the discharge of untreated sewage arelikely to affect source water quality (92). Some organisms, such as
109
Cryptosporidium oocytes (121), are more resistant to treatment thanothers and can be discharged into surface waters in sewage effluent.Lack of chemical pretreatment, improper backwashing procedures,poor application of raw water to the filter and failure to monitorplant conditions have been implicated in outbreaks of waterbornegiardiasis (122) and cryptosporidiosis (123,124).
Public supplies may be at risk if financial or technical constraintsresult in discontinuous chlorination. Technical faults and faulty con-nections may result in wastewater infiltrating into the supply net-work, potentially contaminating the drinking-water. Individual wellsare vulnerable to contamination from adjacent sewage ditches. Thisis considered to have caused between 2 and 10 outbreaks of diseasein small communities each year in Sweden (103).
INFECTIONS
A number of serious infectious diseases, such as hepatitis A, choleraand typhoid fever, can be spread via contaminated drinking-water,as can more common intestinal diseases such as gastroenteritis. Bac-teria cause cholera (Vibrio cholerae), typhoid fever (Salmonellatyphi), bacillary dysentery or shigellosis (Shigella spp.) andcampylobacteriosis (Campylobacter spp.). Viruses cause others, suchas hepatitis. In addition, protozoa cause parasitic diseases.
Waterborne infectious diseases not only cause preventable illnessand death but may also have substantial economic effects on theaffected people and their families and society as a whole, includingexpenses for health care and loss of productivity.
SurveillanceAvailable data on waterborne diseases and outbreaks are often in-complete and inconsistent. Most diseases that can be spread by wa-ter are also spread through faecal contamination by other routes suchas person-to-person contact and on contaminated food. Recordedcases of diseases could therefore have resulted from any of theseroutes of infection. Differences in recording (Table 5.1) and report-ing procedures, disease classification and financial restrictions, andvariation in the legal basis for reporting between countries, also
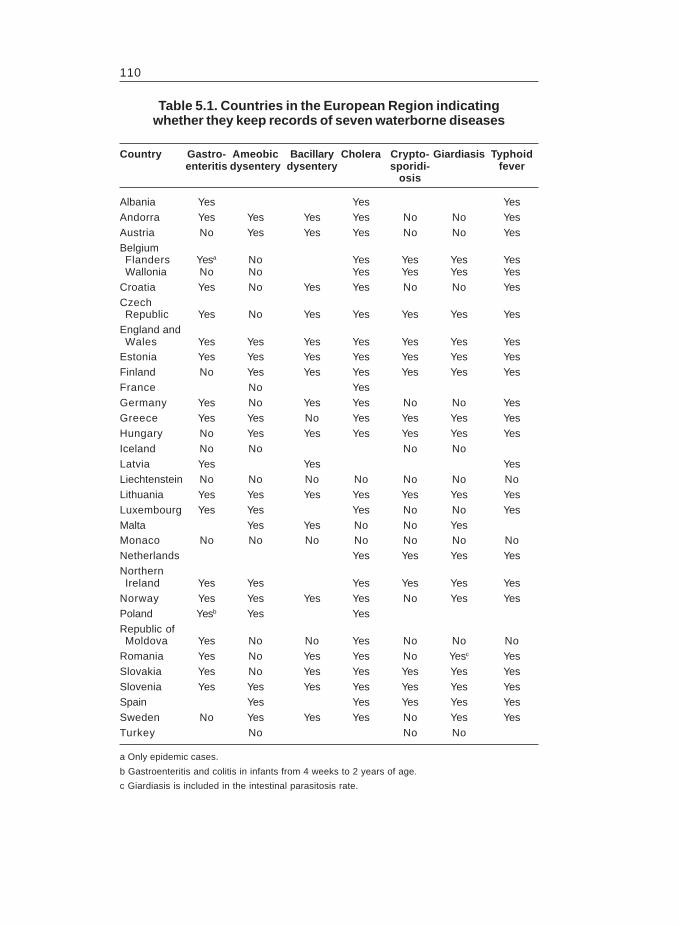
110
Country Gastro- Ameobic Bacillary Cholera Crypto- Giardiasis Typhoidenteritis dysentery dysentery sporidi- fever
osis
Albania Yes Yes YesAndorra Yes Yes Yes Yes No No YesAustria No Yes Yes Yes No No YesBelgiumFlanders Yesa No Yes Yes Yes YesWallonia No No Yes Yes Yes Yes
Croatia Yes No Yes Yes No No YesCzechRepublic Yes No Yes Yes Yes Yes Yes
England andWales Yes Yes Yes Yes Yes Yes Yes
Estonia Yes Yes Yes Yes Yes Yes YesFinland No Yes Yes Yes Yes Yes YesFrance No YesGermany Yes No Yes Yes No No YesGreece Yes Yes No Yes Yes Yes YesHungary No Yes Yes Yes Yes Yes YesIceland No No No NoLatvia Yes Yes YesLiechtenstein No No No No No No NoLithuania Yes Yes Yes Yes Yes Yes YesLuxembourg Yes Yes Yes No No YesMalta Yes Yes No No YesMonaco No No No No No No NoNetherlands Yes Yes Yes YesNorthernIreland Yes Yes Yes Yes Yes Yes
Norway Yes Yes Yes Yes No Yes YesPoland Yesb Yes YesRepublic ofMoldova Yes No No Yes No No No
Romania Yes No Yes Yes No Yesc YesSlovakia Yes No Yes Yes Yes Yes YesSlovenia Yes Yes Yes Yes Yes Yes YesSpain Yes Yes Yes Yes YesSweden No Yes Yes Yes No Yes YesTurkey No No No
Table 5.1. Countries in the European Region indicatingwhether they keep records of seven waterborne diseases
a Only epidemic cases.
b Gastroenteritis and colitis in infants from 4 weeks to 2 years of age.
c Giardiasis is included in the intestinal parasitosis rate.
111
often complicate the picture. In Spain, for example, records of dis-ease incidence are based on the findings of investigations by micro-biological laboratories, whereas data on diseases transmitted by waterare based on notification during outbreaks. Some countries mayrecord cases of gastroenteritis, for example, whereas others main-tain records of diseases caused by individual organisms. The patho-gen responsible for gastrointestinal disturbances is often not traced,and most records of these diseases do not associate the case with acause. This is well illustrated by data from Albania, where Shigellaspp. are known to cause 10–12% of cases of gastroenteritis, Salmo-nella spp. 2% and E. coli 20–25%, but the origin of the rest is un-known.
Different approaches to recording make immediate epidemiologicalfollow-up difficult, and the exchange of information between cen-tral authorities, waterworks and local health authorities may be poor.The reports of waterborne cases of a disease often exceed the totalnumber of laboratory-confirmed cases, leading to difficulties in in-terpreting the data and assessing the extent of the contribution ofdrinking-water to total disease incidence.
Visitors who contract diseases while on holiday contribute a signifi-cant proportion of cases of such illness in a number of Europeancountries. Tourists are especially likely to contract enteric diseases,such as gastroenteritis, from pathogens the resident population maybe able to tolerate. Other factors such as trade and societal customsmay also distort the picture of disease incidence. For example, ahigher incidence of bacillary dysentery in Norway in 1994 (abouttwice as many cases as in the previous year) was due to an outbreakcaused by imported contaminated lettuce. Calculations of diseaseincidence based on the resident population can therefore be mis-leading. Statistics relating to the incidence of these diseases have tobe interpreted with care.
For the period 1986–1996, surveillance data from 17 countries inthe European Region (Table 5.2) reported a total of 2 567 210 casesof gastrointestinal disease, 2.0% of which were linked to drinking-water. These 17 countries (estimated population 220 million) had anaverage of 233 383 reported cases of gastrointestinal diseases peryear. This is much lower than the estimated 6–80 million cases of
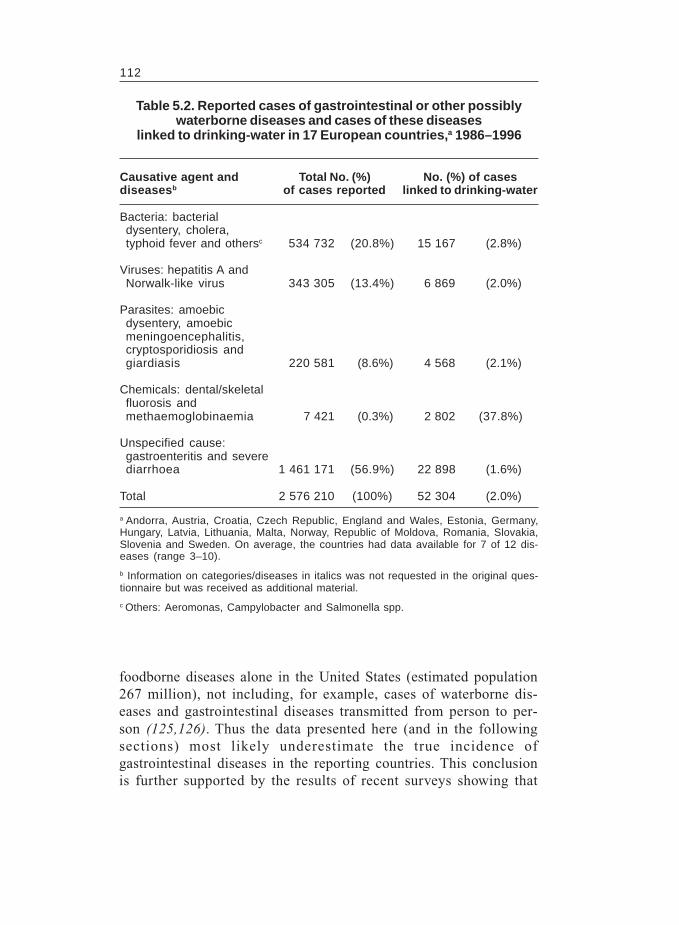
112
Causative agent and Total No. (%) No. (%) of casesdiseasesb of cases reported linked to drinking-water
Bacteria: bacterialdysentery, cholera,typhoid fever and othersc 534 732 (20.8%) 15 167 (2.8%)
Viruses: hepatitis A andNorwalk-like virus 343 305 (13.4%) 6 869 (2.0%)
Parasites: amoebicdysentery, amoebicmeningoencephalitis,cryptosporidiosis andgiardiasis 220 581 (8.6%) 4 568 (2.1%)
Chemicals: dental/skeletalfluorosis andmethaemoglobinaemia 7 421 (0.3%) 2 802 (37.8%)
Unspecified cause:gastroenteritis and severediarrhoea 1 461 171 (56.9%) 22 898 (1.6%)
Total 2 576 210 (100%) 52 304 (2.0%)
Table 5.2. Reported cases of gastrointestinal or other possiblywaterborne diseases and cases of these diseases
linked to drinking-water in 17 European countries,a 1986–1996
a Andorra, Austria, Croatia, Czech Republic, England and Wales, Estonia, Germany,Hungary, Latvia, Lithuania, Malta, Norway, Republic of Moldova, Romania, Slovakia,Slovenia and Sweden. On average, the countries had data available for 7 of 12 dis-eases (range 3–10).
b Information on categories/diseases in italics was not requested in the original ques-tionnaire but was received as additional material.
c Others: Aeromonas, Campylobacter and Salmonella spp.
foodborne diseases alone in the United States (estimated population267 million), not including, for example, cases of waterborne dis-eases and gastrointestinal diseases transmitted from person to per-son (125,126). Thus the data presented here (and in the followingsections) most likely underestimate the true incidence ofgastrointestinal diseases in the reporting countries. This conclusionis further supported by the results of recent surveys showing that
113
foodborne diseases may be 300–350 times more frequent than re-ported cases tend to indicate (127); no such estimates are availablefor waterborne diseases.
For the 11 years from 1986 to 1996, 710 waterborne disease out-breaks were reported, an average of 3.8 outbreaks per year and coun-try (Table 5.3). For 208 outbreaks, details about the causative agentand the type of water system were available. For 142 (68%) of the208 waterborne disease outbreaks, the causative agent could be iden-tified; 86 (55%) of 155 waterborne disease outbreaks occurred inrural and 69 (45%) in urban areas; 55 (36%) of 154 outbreaks wereassociated with networked public water supplies, 27 (18%) with in-dividual water systems, 9 (6%) with standpipe public supplies and63 (41%) with unspecif ied supplies or recreational water; and79 (66%) of 120 outbreaks were associated with groundwater,27 (22%) with surface water and 14 (12%) with mixed-source water.
Each outbreak for which such information was available affected anaverage of 220 people (range 2–3500). The wide range of waterbornedisease outbreaks reported for the different countries is remarkable:during the 11-year period, none was reported in Germany, Lithua-nia or Norway, whereas some countries reported more than 50 suchoutbreaks: Spain (208), Malta (162) and Sweden (53). These differ-ences most likely reflect not only actual differences in the incidenceof waterborne disease outbreaks but also differences in detection,investigation and reporting in the different countries. For example,some countries do not have a surveillance system for waterbornedisease outbreaks and do not require the reporting of waterbornediseases as such.
Although a disease outbreak may be linked to a particular source(such as drinking-water), linking a single case of (gastrointestinal)disease to a particular source is normally impossible (or imprac-ticable). Thus, in addition to the general under-reporting of gastro-intestinal diseases, the data presented here most likely underestimateby far the actual incidence of waterborne diseases in the reportingcountries. Using the cases reported through surveillance systemsfor waterborne disease outbreaks, in order to estimate the magni-tude of waterborne disease for a country or region, requires account-ing for the following factors.
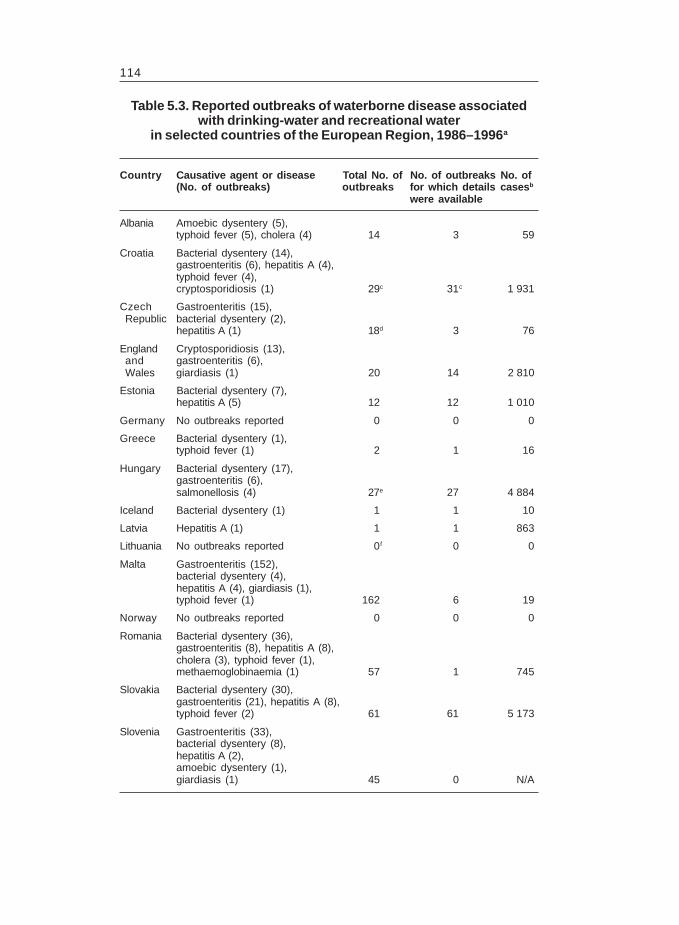
114
Country Causative agent or disease Total No. of No. of outbreaks No. of(No. of outbreaks) outbreaks for which details casesb
were available
Albania Amoebic dysentery (5),typhoid fever (5), cholera (4) 14 3 59
Croatia Bacterial dysentery (14),gastroenteritis (6), hepatitis A (4),typhoid fever (4),cryptosporidiosis (1) 29c 31c 1 931
Czech Gastroenteritis (15),Republic bacterial dysentery (2),
hepatitis A (1) 18d 3 76
England Cryptosporidiosis (13),and gastroenteritis (6),Wales giardiasis (1) 20 14 2 810
Estonia Bacterial dysentery (7),hepatitis A (5) 12 12 1 010
Germany No outbreaks reported 0 0 0
Greece Bacterial dysentery (1),typhoid fever (1) 2 1 16
Hungary Bacterial dysentery (17),gastroenteritis (6),salmonellosis (4) 27e 27 4 884
Iceland Bacterial dysentery (1) 1 1 10
Latvia Hepatitis A (1) 1 1 863
Lithuania No outbreaks reported 0f 0 0
Malta Gastroenteritis (152),bacterial dysentery (4),hepatitis A (4), giardiasis (1),typhoid fever (1) 162 6 19
Norway No outbreaks reported 0 0 0
Romania Bacterial dysentery (36),gastroenteritis (8), hepatitis A (8),cholera (3), typhoid fever (1),methaemoglobinaemia (1) 57 1 745
Slovakia Bacterial dysentery (30),gastroenteritis (21), hepatitis A (8),typhoid fever (2) 61 61 5 173
Slovenia Gastroenteritis (33),bacterial dysentery (8),hepatitis A (2),amoebic dysentery (1),giardiasis (1) 45 0 N/A
Table 5.3. Reported outbreaks of waterborne disease associatedwith drinking-water and recreational water
in selected countries of the European Region, 1986–1996a
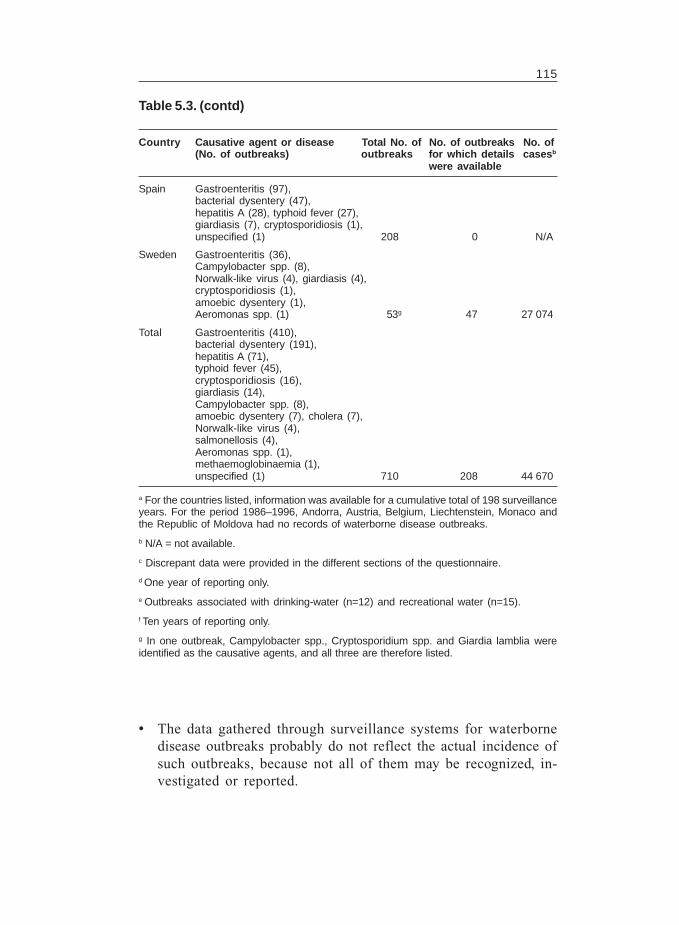
115
Spain Gastroenteritis (97),bacterial dysentery (47),hepatitis A (28), typhoid fever (27),giardiasis (7), cryptosporidiosis (1),unspecified (1) 208 0 N/A
Sweden Gastroenteritis (36),Campylobacter spp. (8),Norwalk-like virus (4), giardiasis (4),cryptosporidiosis (1),amoebic dysentery (1),Aeromonas spp. (1) 53g 47 27 074
Total Gastroenteritis (410),bacterial dysentery (191),hepatitis A (71),typhoid fever (45),cryptosporidiosis (16),giardiasis (14),Campylobacter spp. (8),amoebic dysentery (7), cholera (7),Norwalk-like virus (4),salmonellosis (4),Aeromonas spp. (1),methaemoglobinaemia (1),unspecified (1) 710 208 44 670
Table 5.3. (contd)
a For the countries listed, information was available for a cumulative total of 198 surveillanceyears. For the period 1986–1996, Andorra, Austria, Belgium, Liechtenstein, Monaco andthe Republic of Moldova had no records of waterborne disease outbreaks.
b N/A = not available.
c Discrepant data were provided in the different sections of the questionnaire.
d One year of reporting only.
e Outbreaks associated with drinking-water (n=12) and recreational water (n=15).
f Ten years of reporting only.
g In one outbreak, Campylobacter spp., Cryptosporidium spp. and Giardia lamblia wereidentified as the causative agents, and all three are therefore listed.
Country Causative agent or disease Total No. of No. of outbreaks No. of(No. of outbreaks) outbreaks for which details casesb
were available
� The data gathered through surveillance systems for waterbornedisease outbreaks probably do not reflect the actual incidence ofsuch outbreaks, because not all of them may be recognized, in-vestigated or reported.
116
� The availability and utilization of laboratory services, and theexpertise of the people responsible for and the resources allo-cated to surveillance activities, may vary among countries.
� Recognition of waterborne disease outbreaks depends on severalother characteristics, such as the severity of disease, the relativesize of the outbreak and the type of water system (128).
� The ratio of outbreaks to “sporadic” cases of waterborne diseaseis unknown and most likely varies among countries.
Hence, the data collected through the EEA/WHO questionnaire can-not be used to estimate the incidence of waterborne diseases in Eu-rope. Nevertheless, the data imply that a large proportion of thereported gastrointestinal disease in Europe is waterborne.
Analysis of data from waterborne disease outbreaks implies that,depending on the factors mentioned previously, a high proportion ofan affected population usually has to be affected before an outbreakis detected. For example, the 1993 outbreak of crypto-sporidiosis inMilwaukee, Wisconsin affected more than 400 000 people but wasnot detected before more than half of them had already fallen ill(129,130). A retrospective epidemiological study of an outbreak ofcryptosporidiosis among people with AIDS in Las Vegas in 1994showed that nearly half the employees of two randomly selected agen-cies had had gastrointestinal illness during the outbreak period. Thisindicated that the outbreak had also affected the general population(131,132), but no such outbreak was reported. These examples showthat waterborne diseases break out even in countries with sophisti-cated water treatment facilities, and that even large waterborne dis-ease outbreaks may not be detected.
Improved protection of source water and water treatment have mark-edly reduced gastrointestinal diseases in industrialized countries overthe last century (133). Studies and data from other parts of the world,however, suggest that much gastrointestinal illness in Europe mayalso still be waterborne. For example, epidemiological studies inCanada, a country with a high standard of drinking-water quality,indicate that up to 40% of reported gastrointestinal diseases (dependingon the type of source water, water treatment method and distribution
117
system) may be related to water (134,135). In countries with lessprotected source water, less sophisticated water treatment facilitiesand less well maintained water distribution systems, the proportionof water-related gastrointestinal diseases is probably even higher.
The data collected by the EEA/WHO questionnaire has a number oflimitations, such as differences in surveillance activities and report-ing, but also limitations in data collection. The actual magnitude ofwaterborne diseases in Europe is therefore difficult to estimate mean-ingfully. Surveillance systems for waterborne disease outbreaks aswell as proper networks for regulation and command (46) are ur-gently needed in the countries that do not yet have them, and thesystems and surveillance definitions used in different countries needto be harmonized. The data gathered through surveillance systemsfor waterborne disease outbreaks will be useful in identifying thecausal agents, in determining why the outbreaks occurred, in evalu-ating the adequacy of the water treatment technologies currently usedin the different countries, and in characterizing the epidemiology of theoutbreaks (128). Further research is needed to be able to better estimatethe burden of waterborne diseases not (obviously) related to outbreaks.
Nonspecific gastroenteritisGastroenteritis is an intestinal disease that can be caused by a rangeof microorganisms. Many countries keep records of gastroenteritisoutbreaks (Table 5.1), but recording in different countries varies.Some record any incident of severe diarrhoea as gastroenteritis, whileothers include it in the definition of infectious intestinal diseases.Many cases of gastroenteritis are self-limiting and/or self-treated andtherefore not identified by some surveillance systems.
Few countries report links of cases of gastroenteritis to drinking-wa-ter and, if they do, the cases reported are generally a small propor-tion of the total incidence (Table 5.2). However, this may be relatedto inefficient detection of outbreaks. Nevertheless, a number of coun-tries in the European Region regard waterborne gastroenteritis as aserious problem.
Amoebic dysenteryAmeobic dysentery is a debilitating disease caused by the proto-zoan Entamoeba histolytica. The symptoms include abdominal pain,
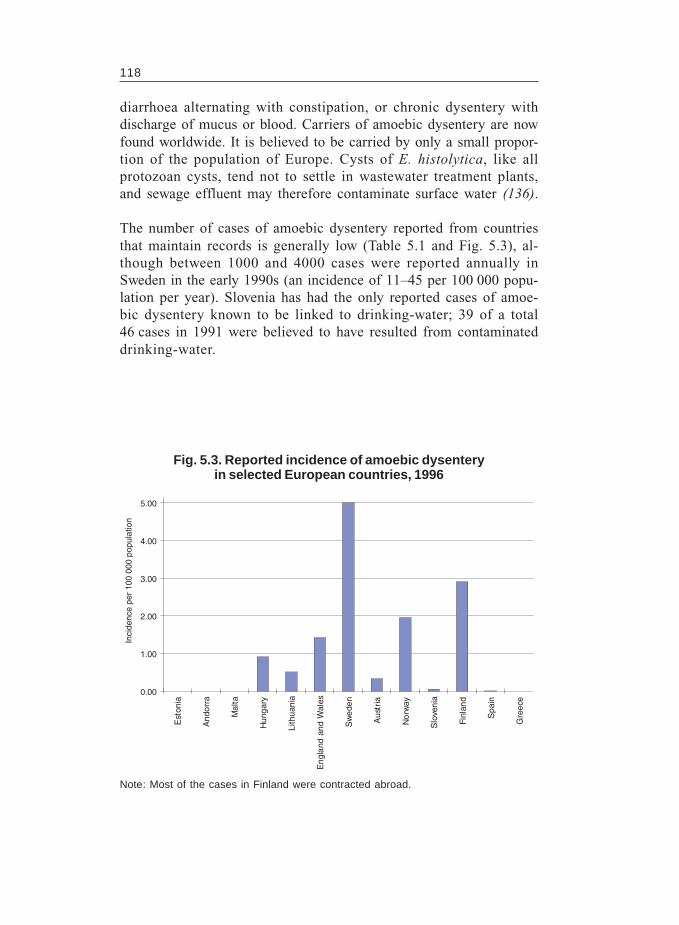
118
diarrhoea alternating with constipation, or chronic dysentery withdischarge of mucus or blood. Carriers of amoebic dysentery are nowfound worldwide. It is believed to be carried by only a small propor-tion of the population of Europe. Cysts of E. histolytica, like allprotozoan cysts, tend not to settle in wastewater treatment plants,and sewage effluent may therefore contaminate surface water (136).
The number of cases of amoebic dysentery reported from countriesthat maintain records is generally low (Table 5.1 and Fig. 5.3), al-though between 1000 and 4000 cases were reported annually inSweden in the early 1990s (an incidence of 11–45 per 100 000 popu-lation per year). Slovenia has had the only reported cases of amoe-bic dysentery known to be linked to drinking-water; 39 of a total46 cases in 1991 were believed to have resulted from contaminateddrinking-water.
Note: Most of the cases in Finland were contracted abroad.
Fig. 5.3. Reported incidence of amoebic dysenteryin selected European countries, 1996
0.00
1.00
2.00
3.00
4.00
5.00
Est
onia
And
orra
Mal
ta
Hun
gary
Lith
uani
a
Eng
land
and
Wal
es
Sw
eden
Aus
tria
Nor
way
Slo
veni
a
Finl
and
Spa
in
Gre
ece
Inci
denc
e pe
r 10
0 00
0 po
pula
tion
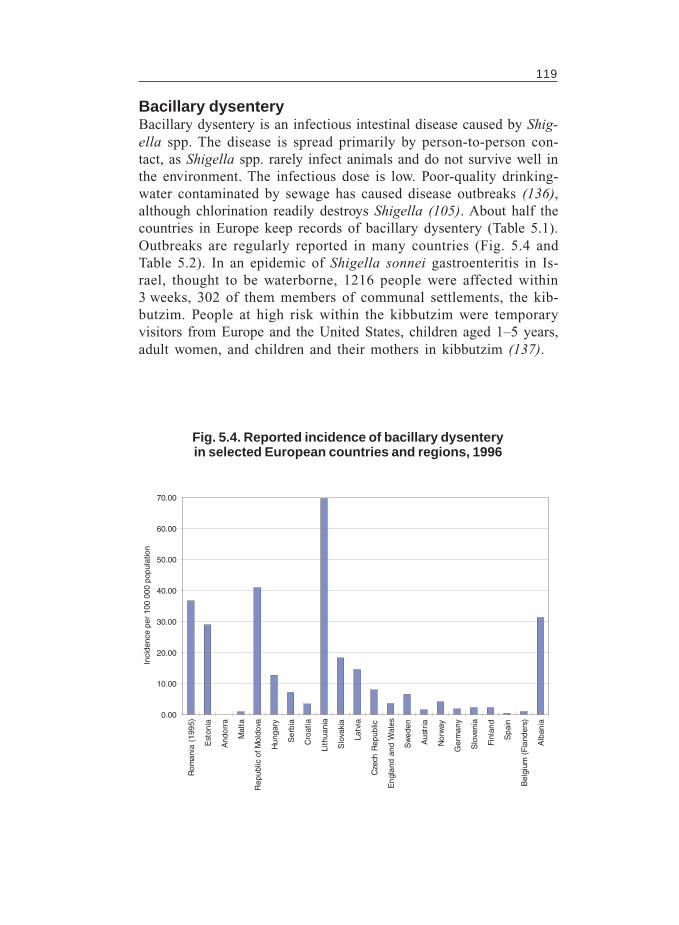
119
Fig. 5.4. Reported incidence of bacillary dysenteryin selected European countries and regions, 1996
0.00
10.00
20.00
30.00
40.00
50.00
60.00
70.00
Rom
ania
(19
95)
Est
onia
And
orra
Mal
ta
Rep
ublic
of M
oldo
va
Hun
gary
Ser
bia
Cro
atia
Lith
uani
a
Slo
vaki
a
Latv
ia
Cze
ch R
epub
lic
Eng
land
and
Wal
es
Sw
eden
Aus
tria
Nor
way
Ger
man
y
Slo
veni
a
Finl
and
Spa
in
Bel
gium
(Fl
ande
rs)
Alb
ania
Inci
denc
e pe
r 10
0 00
0 po
pula
tion
Bacillary dysenteryBacillary dysentery is an infectious intestinal disease caused by Shig-ella spp. The disease is spread primarily by person-to-person con-tact, as Shigella spp. rarely infect animals and do not survive well inthe environment. The infectious dose is low. Poor-quality drinking-water contaminated by sewage has caused disease outbreaks (136),although chlorination readily destroys Shigella (105). About half thecountries in Europe keep records of bacillary dysentery (Table 5.1).Outbreaks are regularly reported in many countries (Fig. 5.4 andTable 5.2). In an epidemic of Shigella sonnei gastroenteritis in Is-rael, thought to be waterborne, 1216 people were affected within3 weeks, 302 of them members of communal settlements, the kib-butzim. People at high risk within the kibbutzim were temporaryvisitors from Europe and the United States, children aged 1–5 years,adult women, and children and their mothers in kibbutzim (137).
120
The contribution of known waterborne cases to total morbidity var-ies between the countries for which data are available and betweenyears, but it is significant in some cases. In Spain between 1986 and1995, a number of cases (between 83 and 1327) annually were linkedto drinking-water. A number of countries, including Albania, Greeceand Spain, regard bacillary dysentery as one of the most seriouswaterborne disease problems.
CampylobacteriosisCampylobacter spp. are spiral bacteria that cause severe acute diar-rhoea. They have been isolated from surface water contaminated bysewage from farm animals and wildlife, especially birds, although theyare susceptible to chlorination (105). However, the most important res-ervoirs of the bacterium are meat and unpasteurized milk. Householdpets can also carry the bacterium. Campylobacter can remain viable forextended periods in the environment, particularly at relatively low tem-peratures, and survival in excess of 12 months is possible at 4 °C(105,136). Six waterborne outbreaks were recorded in Sweden between1986 and 1996. Campylobacter has been reported to be widespread inthe River Moskva and its tributaries in the newly independent states (23).
CHOLERA
The symptoms of cholera are sudden diarrhoea with watery faeces,accompanied by vomiting, and the resulting dehydration and col-lapse are fatal in over half of untreated cases. The main routes oftransmission are waterborne or foodborne. Direct person-to-personcontact is uncommon.
Vibrio cholerae causes cholera. There are about 139 knownO serotypes, of which only two are known to be responsible for epi-demics of cholera (serotypes O1 and O139) (138).
The epidemiology of cholera is characterized by its tendency tospread throughout the world in pandemics. The first six pandemicsbegan in Bangladesh. The seventh started in 1961 in Indonesia andspread to the Indian subcontinent, the USSR, Iran and Iraq duringthe 1960s (138). In the USSR, 11 republics reported 10 723 choleracases and carriers between 1965 and 1989. Since then the epidemiological
121
situation in the newly independent states has been unstable, andcases of cholera and the isolation of virulent stains from surfacewater are reported every year (139). Cholera epidemics have re-emerged since 1991, both in the continents where the disease isepidemic and in traditionally cholera-free areas (140), although thenumber of reported cases in most European countries is low. Chol-era has basically been controlled in Europe by improved water andsewage treatment and improved food hygiene, although nontoxigenicV. cholerae is not uncommon in European surface water (141). Allpathogenic Vibrio spp. are halophilic and survive better in moder-ately saline water. Temperatures of at least 10 °C for several con-secutive weeks are also important for the survival of V. cholerae inthe environment. The organism is highly susceptible to chlorine andis readily eliminated from water by proper disinfection.
Tourism by western Europeans in the western Pacific, South-EastAsia and other areas is likely to have led to the significant increasein the proportion of those populations carrying the organism. Allcases reported from Andorra, England and Wales, Finland, Greeceand Sweden between 1986 and 1996 were in individuals who hadcontracted the disease abroad. Most cases recorded in Spain are alsoimported. However, several countries in central and eastern Europeappear to have domestic cases. In Romania, where records on chol-era as a notifiable disease have been kept since 1986, drinking-wa-ter caused an estimated 286 cases between 1991 and 1993. Theseoccurred in three outbreaks, one each year, and all occurred withinthe Danube delta. In Albania, 626 cases of cholera were reported in1994, 25 of which were fatal. All of these were linked to drinking-water, with four outbreaks of waterborne cholera reported in thatyear. The incidence of cases of cholera in the Republic of Moldovarose from 1 in 1991 to 240 in 1995. Although none was reported tobe linked to drinking-water, cases were concentrated in particularareas (Slobozia, Stefan Voda and Tiraspol districts). A cholera epi-demic in Ukraine in 1994 and 1995, with 1370 recorded cases, re-sulted in 32 fatalities. The environmental sources of the causativeagent included sewage, seawater and surface water.
CryptosporidiosisCryptosporidium is a coccidial protozoan parasite. About 20 spe-cies are now known, of which C. parvum is pathogenic for humans.
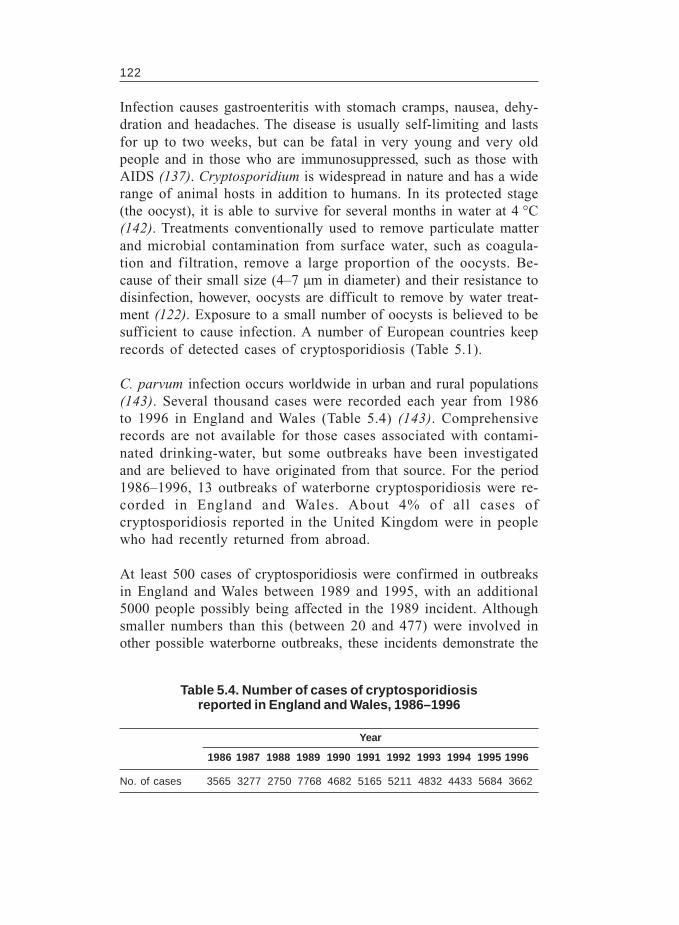
122
Infection causes gastroenteritis with stomach cramps, nausea, dehy-dration and headaches. The disease is usually self-limiting and lastsfor up to two weeks, but can be fatal in very young and very oldpeople and in those who are immunosuppressed, such as those withAIDS (137). Cryptosporidium is widespread in nature and has a widerange of animal hosts in addition to humans. In its protected stage(the oocyst), it is able to survive for several months in water at 4 °C(142). Treatments conventionally used to remove particulate matterand microbial contamination from surface water, such as coagula-tion and filtration, remove a large proportion of the oocysts. Be-cause of their small size (4–7 µm in diameter) and their resistance todisinfection, however, oocysts are difficult to remove by water treat-ment (122). Exposure to a small number of oocysts is believed to besufficient to cause infection. A number of European countries keeprecords of detected cases of cryptosporidiosis (Table 5.1).
C. parvum infection occurs worldwide in urban and rural populations(143). Several thousand cases were recorded each year from 1986to 1996 in England and Wales (Table 5.4) (143). Comprehensiverecords are not available for those cases associated with contami-nated drinking-water, but some outbreaks have been investigatedand are believed to have originated from that source. For the period1986–1996, 13 outbreaks of waterborne cryptosporidiosis were re-corded in England and Wales. About 4% of all cases ofcryptosporidiosis reported in the United Kingdom were in peoplewho had recently returned from abroad.
At least 500 cases of cryptosporidiosis were confirmed in outbreaksin England and Wales between 1989 and 1995, with an additional5000 people possibly being affected in the 1989 incident. Althoughsmaller numbers than this (between 20 and 477) were involved inother possible waterborne outbreaks, these incidents demonstrate the
1986 1987 1988 1989 1990 1991 1992 1993 1994 1995 1996
No. of cases 3565 3277 2750 7768 4682 5165 5211 4832 4433 5684 3662
Table 5.4. Number of cases of cryptosporidiosisreported in England and Wales, 1986–1996
Year
123
potential for contaminated supplies to cause the disease in a significantnumber of people. All outbreaks in the United Kingdom detailed in theEEA/WHO questionnaire were in networked public supplies.
Cryptosporidium oocysts have been found to be widespread in wa-ter resources in Great Britain, and they have been shown to be presentat higher concentrations in lakes and rivers receiving wastewaterthan in pristine streams (136). The source of environmental con-tamination can be both human sewage and animals. Most probableor possible waterborne outbreaks in England and Wales have beenassociated with supplies derived from surface-water sources, as mightbe expected given their greater likelihood of contamination by run-off from agricultural land, wildlife faeces and sewage discharges.The seasonal presence of the organisms in the source water supply-ing the treatment plant involved in the 1989 incident was particu-larly associated with the grazing of young lambs (136). Nevertheless,at least three outbreaks have been linked to groundwater sources.
Investigations into a number of waterborne outbreaks have estab-lished that the water supplied was free of indicators of faecal con-tamination. This emphasizes the resilience of the oocysts todisinfection. Water suppliers face difficulties in detecting and effi-ciently removing Cryptosporidium (121,136,144). Recycling of fil-ter backwash water has also been shown to contribute to the build-upof oocysts in wastewater treatment plants. Proper treatment ofwashwater before recycling may prevent such a build-up (131). Rec-reational water use, contact with farm animals and old piping havealso been identified as risk factors for cryptosporidiosis (145,146).
GiardiasisGiardia lamblia is found in its free-living form in a wide range ofhost animals. Its cysts can survive in unchlorinated water for longperiods, especially in cold weather. Symptoms of giardiasis developin the first few weeks after infection and include severe, watery,foul-smelling diarrhoea, gas in the stomach or intestines, nausea andloss of appetite. Water is probably not the primary mode of trans-mission of giardiasis, but it is a common transmitter (124,136).
The reported incidence of giardiasis in European countries variesenormously, and people returning from travel abroad probably import
124
a significant proportion of cases in some countries. One known in-cident in the United Kingdom involved a community-managedgroundwater supply in a rural area supplying 260 people. Of these,31 (12%) contracted the disease.
In countries where giardiasis has been known to be spread throughwater supplies, the contribution of waterborne infection to the totaldisease burden varies significantly between years. In Sweden, forexample, 3500 waterborne cases were recorded in 1986. This wasan exceptional outbreak caused by an overflow of sewage into thedrinking-water system at a ski resort (147). Between 1990 and 1996,more than 23 000 cases were reported in Sweden. Known waterborneinfections comprised less than 1% of infections in 1990 and 1996;this f igure was as high as 14% in 1991, although no cases werelinked to drinking-water in most years of the 10 years up to 1996.
Similar variation was reported in Slovenia, where the number of casesof giardiasis reported annually varied between 329 and 1299 in the10 years up to 1996. In 1992, 40% of these cases (520 of 1299)were linked to drinking-water. Several cases in Spain have also beenlinked to drinking-water.
HelminthiasisThe helminths, or parasitic worms, belong to two unrelated groupsof organism: roundworms and flatworms (flukes and tapeworms).Their distribution is limited geographically, and few of significanceto human health are found in Europe. In sub-Saharan Africa, drink-ing-water is a primary mode of transmission only for the guineaworm (Dracunculus medinensis), a roundworm whose distributionis limited to certain countries. Other helminths may also be transmit-ted by drinking-water, but this is unlikely to be the most importantroute of infection (105).
Schistosoma spp. can affect the intestine, causing intestinal schistosomia-sis, or the blood vessels around the bladder, causing urinary schisto-somiasis. Organisms causing both forms of the disease occur in theEastern Mediterranean Region of WHO but are not found in the Euro-pean Region. The infective larvae are able to penetrate the human skinor mucous membranes, and contaminated water used for washing, irri-gation or recreation is the main hazard rather than drinking-water (105).
125
Other helminths that could potentially be transmitted through drinking-water include Fasciola spp. (flukes), which are parasites of farmand domestic animals. The eggs of the pork tapeworm (Taenia solium)may survive in the environment after they are excreted in faeces,and will infect humans if ingested. The usual route of infection is theconsumption of undercooked pork (105).
Infection by waterborne helminths is not a significant risk in mostparts of the European Region, although it is of potential concernfollowing the use of wastewater in agricultural irrigation. Epidemio-logical studies have shown that crop ir rigation with untreatedwastewater causes a significant increase in intestinal nematode in-fections in consumers and field workers, but that this is not the casewhen wastewater is adequately treated before being used for irriga-tion. WHO guidelines for the microbial quality of treated wastewaterintended for crop irrigation recommend that the treated wastewatercontain less than one viable intestinal nematode egg per litre.Wastewater complying with this guideline will contain few, if any,protozoan cysts, and no (or, exceptionally, very few) T. solium eggs,so consumers and field workers will also be protected from proto-zoan and tapeworm infections (89).
Infectious hepatitisViral hepatitis is an inflammation of the liver caused by one of sev-eral different viruses. Two of these, hepatitis virus A and hepatitisvirus E, have been regularly associated with waterborne outbreaksof disease. Hepatitis virus A is common throughout the world and isvery infectious. It causes nausea, vomiting, muscle ache and jaun-dice and is spread by faecal contamination of food, drinking-wateror water used for bathing and swimming. Hepatitis virus E is lesscommon and is restricted to tropical and subtropical countries.
Most countries keep records of reported cases of hepatitis A (Ta-ble 5.1). The number of cases varies enormously between countries,with the incidence in the central Asian republics and other newlyindependent states being particularly high. The incidence in the EU,Norway and Iceland is much lower (Fig. 5.5).
Some cases have been linked to contaminated drinking-water (Ta-ble 5.2). The extent to which the origin of a case is traced is also
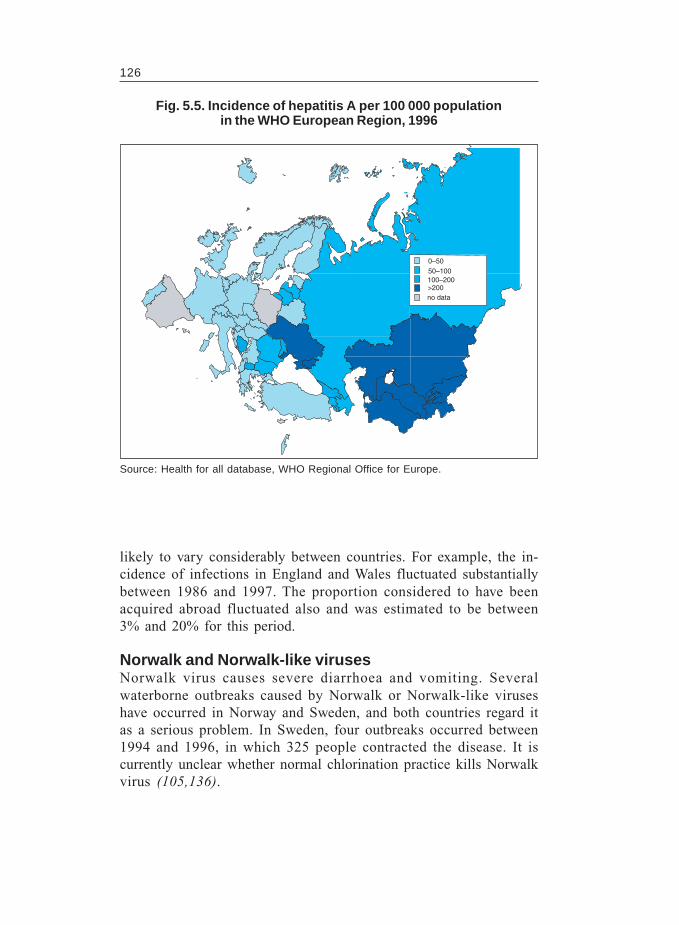
126
likely to vary considerably between countries. For example, the in-cidence of infections in England and Wales fluctuated substantiallybetween 1986 and 1997. The proportion considered to have beenacquired abroad fluctuated also and was estimated to be between3% and 20% for this period.
Norwalk and Norwalk-like virusesNorwalk virus causes severe diarrhoea and vomiting. Severalwaterborne outbreaks caused by Norwalk or Norwalk-like viruseshave occurred in Norway and Sweden, and both countries regard itas a serious problem. In Sweden, four outbreaks occurred between1994 and 1996, in which 325 people contracted the disease. It iscurrently unclear whether normal chlorination practice kills Norwalkvirus (105,136).
Fig. 5.5. Incidence of hepatitis A per 100 000 populationin the WHO European Region, 1996
0–5050–100100–200>200no data
Source: Health for all database, WHO Regional Office for Europe.
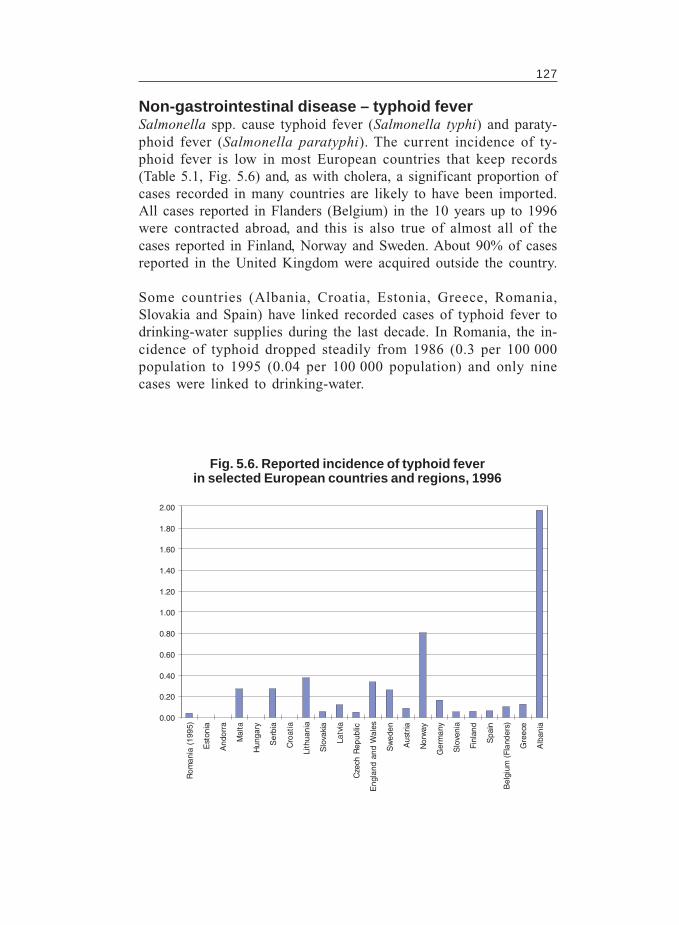
127
Fig. 5.6. Reported incidence of typhoid feverin selected European countries and regions, 1996
0.00
0.20
0.40
0.60
0.80
1.00
1.20
1.40
1.60
1.80
2.00
Rom
ania
(19
95)
Est
onia
And
orra
Mal
ta
Hun
gary
Ser
bia
Cro
atia
Lith
uani
a
Slo
vaki
a
Latv
ia
Cze
ch R
epub
lic
Eng
land
and
Wal
es
Sw
eden
Aus
tria
Nor
way
Ger
man
y
Slo
veni
a
Finl
and
Spa
in
Bel
gium
(Fl
ande
rs)
Gre
ece
Alb
ania
Non-gastrointestinal disease – typhoid feverSalmonella spp. cause typhoid fever (Salmonella typhi) and paraty-phoid fever (Salmonella paratyphi). The current incidence of ty-phoid fever is low in most European countries that keep records(Table 5.1, Fig. 5.6) and, as with cholera, a significant proportion ofcases recorded in many countries are likely to have been imported.All cases reported in Flanders (Belgium) in the 10 years up to 1996were contracted abroad, and this is also true of almost all of thecases reported in Finland, Norway and Sweden. About 90% of casesreported in the United Kingdom were acquired outside the country.
Some countries (Albania, Croatia, Estonia, Greece, Romania,Slovakia and Spain) have linked recorded cases of typhoid fever todrinking-water supplies during the last decade. In Romania, the in-cidence of typhoid dropped steadily from 1986 (0.3 per 100 000population to 1995 (0.04 per 100 000 population) and only ninecases were linked to drinking-water.
128
Tajikistan had an outbreak of typhoid fever (identification based onclinical observations) in 1996. This was the result of heavy rainfallcausing overflow from the poorly maintained sewerage systems, withsubsequent contamination of drinking-water sources. Nearly4000 cases were reported between mid-May and the beginning ofJuly, and the outbreaks were still continuing. Ten districts in twoprovinces were affected and a number of deaths occurred, mainlyamong people between 10 and 29 years of age. The fatality ratesreported in the two provinces were 1.2% and 8.2% (107).
HEALTH PROBLEMS ASSOCIATED WITH WATERBORNECHEMICALS
LeadLead is a cumulative, general toxic substance that can affect a largenumber of processes in the body. Exposure to relatively low levelsof lead impairs the development of the nervous system in children,leading to reduced performance on standardized intelligence tests.This is the effect of greatest concern for low-level exposure. Effectson gestational age and fetal weight are also important, as are bloodpressure and some biochemical effects. Infants, children up to 6 yearsof age, the fetus and pregnant women are the most susceptible to theadverse health effects of lead. Endemic diseases of the nervous sys-tem, gingivitis and hypermenorrhoea have been observed in theDebet River basin in Armenia, where concentrations of lead in fresh-water ecosystems are 5–200 times higher than normal (148).
Concerns about the potential health effects of dissolved lead haveresulted in considerable efforts to reduce lead concentrations in water.Nevertheless, lead piping is retained in some properties. It is thispipework, owned by and the responsibility of the householder, thathas been responsible for most of the failures of drinking-water sam-ples to meet the standard of the EU Drinking Water Directive (until1998) of 50 µg/l (47) and the WHO guideline value of 10 µg/l (105).In the years 1990–1995, 2.7–3.4% of drinking-water samples testedin England and Wales exceeded 50 µg/l. The revised Drinking Wa-ter Directive that entered into force on 25 December 1998 (48)adopted a new standard identical to the WHO guideline value of10 µg/l, and a greater proportion of samples are therefore likely to
129
exceed this standard. Nevertheless, the EU countries do not have tofully implement the new standard until 2013.
Several water suppliers in the United Kingdom, especially those dis-tributing water with a low mineral content, use orthophosphate dos-ing to reduce the dissolution of lead (Box 5.2).
Concern in Hungary has been caused by lead leaching out of newlylaid polyvinyl chloride pipes, in which it had been used as a stabi-lizer. Such leaching appears to be a short-term problem, however,with concentrations falling to below the national standard of 50 µg/la few weeks after the pipes are first used.
ArsenicInorganic arsenic is a known human carcinogen and is classified byIARC in Group 1 (a known human carcinogen). The WHO provi-sional guideline for arsenic is 0.01 mg/l (101) and this has beenadopted as the standard in a number of European countries, althoughthe standard in most remains at the previous WHO provisional guide-line value of 0.05 mg/l (149). The guideline value of 0.01 mg/l isprovisional because suitable testing methods are lacking. Based onhealth concerns alone, the guideline would be even lower. Data fromBelgium, Croatia, Greece, Monaco, Slovakia and the United King-dom (England, Wales and Northern Ireland) indicate that arsenic indrinking-water does not generally exceed the national standard of0.05 mg/l in these countries. In France, only 0.06% of samples testedin 1995 exceeded this standard, and the figure for the Czech Repub-lic in 1996 was 0.25%.
Between 1994 and 1996, several areas of England and Wales undertook toreduce the leaching of lead into drinking-water, usually by orthophosphatedosing or by adjusting the pH. In 1996, 2.2% of drinking-water samplestested exceeded the national standard, compared with 2.7–3.4% between1990 and 1995. Concentrations of lead in drinking-water are also a concernin Scotland, where the predominant soft, acidic water readily dissolves lead.Several educational drives have been mounted to minimize the exposure tolead of children living in housing with lead piping, for example by advisinghouseholders to avoid using water that has been standing in the pipework forseveral hours.
Box 5.2. Treatment to reduce the concentration of leadin drinking-water supplies in the United Kingdom
130
Consumption of drinking-water containing high levels of arsenic hasbeen associated with increased skin cancer and possibly internal typesof cancer (105). Concentrations exceeding the WHO guideline valueare found in some countries in central Europe, especially where thereare natural sources of arsenic in minerals (Box 5.3). In south-easternHungary and in the adjoining areas of Romania, especially in indi-vidual and public wells in Bihor and Arad Counties, 3000 peoplewere exposed to levels exceeding the national standard (Institute ofPublic Health, Cluj-Napoca). In Bulgaria, high concentrations havebeen found in both surface and well water near a copper smelter atSrednorgie. The south-western parts of Poland have naturally highlevels of arsenic, although concentrations in drinking-water do notgenerally exceed the national standard.
Arsenic is not routinely monitored in all countries. Sweden, for ex-ample, does not routinely monitor for arsenic, and 17% of the sam-ples taken during two surveys in 1986 exceeded the national standardof 0.01 mg/l. These were in water from private wells. Nevertheless,the percentage for Sweden as a whole is much lower; arsenic causesan estimated 0.3–3 cases of cancer per year (103). Some areas ofFinland have naturally elevated arsenic concentrations in thegroundwater: local drilled wells serving fewer than 50 people andprivate drilled wells for single households.
FluorosisFluorides exist naturally in a number of minerals; the most commonare fluorspar, cryolite and fluorapatite (105). Where the geology isrich in such minerals, groundwater sources may contain high levelsof fluoride, with levels of up to 10 mg/l in well water (105). Fluoridecan enter surface water as a result of industrial discharge, although thelevels are usually lower than the highest that can be found in groundwater.The section of the River Meuse in France, for example, has concentra-tions fluctuating between 0.2 mg/l and 1.3 mg/l as a result of variationin industrial processes (105). Ingesting high levels of fluoride can causemottling of developing teeth; such dental fluorosis does not affect thestrength of teeth, however, and is often regarded as a cosmetic ratherthan a toxic effect. The more serious toxic effect of excessive fluorideintake is skeletal fluorosis, in which the size of the bone mass increases.This restricts movement, both mechanically and because nerves thatpass through bones are constricted. In severe cases, paralysis can result.
131
Groundwater in some areas of Hungary contains high natural concentrationsof arsenic. This problem came to light in 1981, when a countrywide surveyindicated that more than 400 000 people were exposed to drinking-watercontaining arsenic at levels above the national standard of 0.05 mg/l. Measureswere rapidly taken to address the situation and to reduce the number of peopleexposed to concentrations above the health-based standard.
A number of different approaches have been used, depending on the size ofthe supply and the properties of the source water. In some smaller villages andin a bigger plant (10 000 m3 per day) serving two towns, co-precipitationtechnology was used to remove the arsenic. Trivalent arsenic, As(III), isoxidized to the pentavalent form, As(V), usually by chlorine. Iron(III) salts aredosed and the pH corrected using lime, to coagulate and precipitate thearsenic, and the water filtered to remove the precipitated salts. Where thewater also contains humic material, a second oxidation and flocculation wasundertaken using permanganate, and the water refiltered.
A simpler solution is possible where the natural concentration of arsenic is notmuch higher than the standard (such as 0.060–0.075 mg/l) and the water alsohas a natural iron content of 0.6–0.7 mg/l. Only pre-oxidation using chlorinationis required to induce co-precipitation prior to filtration, and this treatment hasthe added benefit of removing the iron, which would otherwise have requiredaeration and filtration. This procedure has been used in several Hungarianvillages.
Where possible, such treatments are avoided by using an alternative watersource to supply the population. New abstractions have been established tosupply water from aquifers some distance from the settlements. A new regionalwaterworks has been established to supply water from this alternative sourceto about 20 settlements, including a large town of some 80 000 inhabitants. Themajority of the older, contaminated wells have remained in operation and, inmost cases, this water is mixed with the uncontaminated water to producewater containing a reduced level of arsenic.
These solutions were successful in reducing the concentrations of arsenic indrinking-water supplies to below the old standard of 0.05 mg/l. The number ofpeople estimated to be exposed to concentrations exceeding this level hadbeen reduced from 400 000 to 20 000 by the end of 1995. However, Hungaryhas recently revised the standard for arsenic in drinking-water to 0.01 mg/l, inline with the most recent provisional WHO guideline (105), and the solutionscurrently used to reduce arsenic levels are not adequate to ensure compliancewith this level. A new countrywide survey, begun in 1997, is under way toestablish how many people may be exposed to concentrations higher than this.The preliminary results suggest that, although less than 0.5% of the populationis exposed to arsenic concentrations higher than 0.05 mg/l, 10–12% mayreceive drinking-water with a concentration higher than 0.01 mg/l.
Box 5.3. Reducing arsenic levels in drinking-water in Hungary
Source: M. Csanady, personal communication, 1998.
Fluorine is probably an essential element for humans but this hasnot been demonstrated unequivocally, and no data indicating theminimum nutritional requirements are available. Many epidemio-logical studies of possible adverse effects of the long-term ingestion
132
of fluoride via drinking-water have been carried out and clearly es-tablish that fluoride primarily affects skeletal tissue. Nevertheless,low concentrations provide protection against dental caries, espe-cially in children. This protective effect increases with concentra-tions up to about 2 mg/l; the minimum concentration required is about0.5 mg/l (105). Some countries and cities add fluoride to drinking-water at low levels to promote dental health. In these cases, a finalconcentration of about 1 mg/l is generally considered desirable.Populations in south-eastern Slovenia, where the concentrations are< 0.8 mg/l, report a high rate of dental caries.
The WHO maximum guideline value is 1.5 mg/l (105), and mostEuropean countries have adopted this or a similar figure (Hungary 1.7,Ireland 1.0, Italy 1.5–0.7,1 the Netherlands 1.1, Romania 1.2 andSweden 1.3 mg/l) as the standard for fluoride in drinking-water. InPoland the recommended fluoride concentration is 0.3 mg/l or higher.
Most countries do not keep records of fluorosis. In France, 1.3% ofsamples from supplies covering over 5000 people exceeded the na-tional standard in recent years, but in all these cases the level wasbelow 4.5 mg/l. In other countries, a significant proportion of drinking-water samples contain fluoride at levels exceeding the national stand-ard, although the estimated population exposed may be relativelysmall (Fig. 5.7). In Estonia, for example, 25–35% of the drinking-water samples analysed for fluoride since 1988 contained levelsexceeding the national standard, but the number of people exposedto these high levels was estimated to be 0.7% of the total population.Incidents of dental fluorosis in Sweden are scattered around the coun-try, depending on the underlying geology, and an estimated 2.4% ofthe population is affected.
About 50 000 wells in Sweden are estimated to have levels of fluo-ride higher than 1.3 mg/l, and 1200 wells exceed 6 mg/l (103). Skel-etal fluorosis is very rare, but a few cases have occurred nearglassworks, where wells have become contaminated with fluorine-based acid used for etching glass. An estimated 35% of the popula-tion of the Republic of Moldova is exposed to drinking-watercontaining fluoride at concentrations above the national standard.
1 Temperature-dependent: 1.5 mg/l at 8–12 °C and 0.7 mg/l at 25–30 °C.
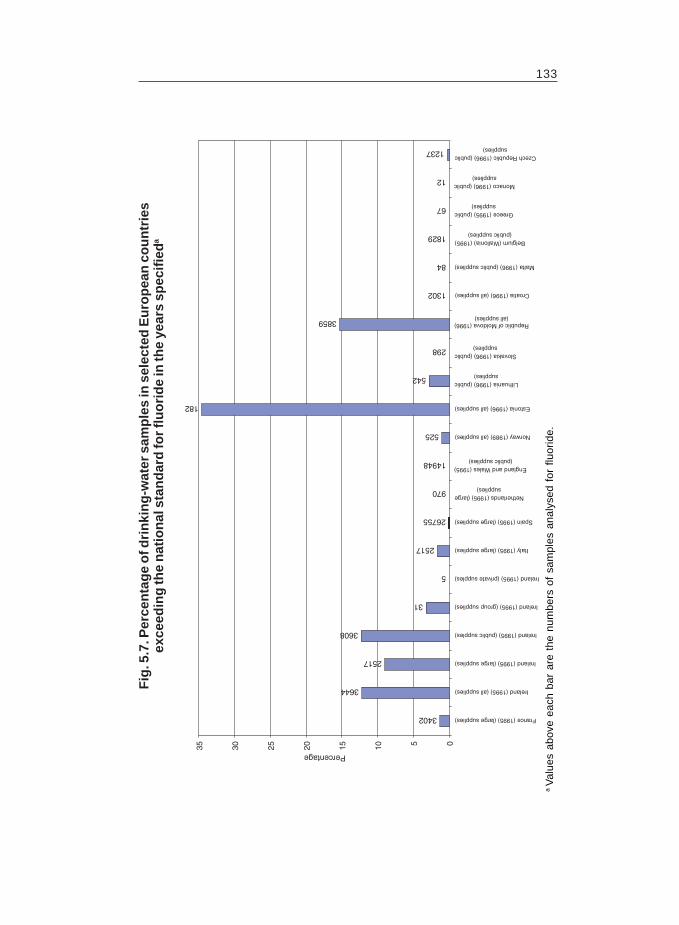
133
Fig
. 5.7
. Per
cen
tag
e o
f dri
nki
ng
-wat
er s
amp
les
in s
elec
ted
Eu
rop
ean
co
un
trie
sex
ceed
ing
the
nat
ion
al s
tan
dar
d fo
r fl
uo
rid
e in
the
year
s sp
ecif
ieda
3402
3644
2517
3608
31
5
2517
26755
970
14948
525
182
542
298
3859
1302
84
1237
12
67
1829
05101520253035France (1995) (large supplies)
Ireland (1995) (all supplies)
Ireland (1995) (large supplies)
Ireland (1995) (public supples)
Ireland (1995) (group supplies)
Ireland (1995) (private supples)
Italy (1995) (large supplies)
Spain (1995) (large supplies)
Netherlands (1995) (largesupplies)
England and Wales (1995)(public supplies)
Norway (1989) (all supplies)
Estonia (1996) (all supplies)
Lithuania (1996) (publicsupplies)
Slovakia (1996) (publicsupplies)
Republic of Moldova (1996)(all supplies)
Croatia (1996) (all supplies)
Malta (1996) (public supplies)
Belgium (Wallonia) (1995)(public supplies)
Greece (1995) (publicsupplies)
Monaco (1996) (publicsupplies)
Czech Republic (1996) (publicsupplies)
Percentage
aV
alue
s ab
ove
each
bar
are
the
num
bers
of
sam
ples
ana
lyse
d fo
r flu
orid
e.
134
In the Czech Republic, an estimated 1600 cases of dental fluorosiswere reported annually between 1991 and 1993 in parts of centraland northern Bohemia, of which 100 annually were linked to drinking-water. The area receives water from the central Bohemian chalk.About 30 cases per year of skeletal fluorosis were recorded between1991 and 1993. Although these were not directly linked to drinking-water, they are concentrated in the same area.
Fluoridation is widely practised in Ireland. The national standard forfluoride in Ireland is reported to be exceeded, as the addition offluoride to public water supplies is poorly controlled. None of thefive samples from community-managed supplies exceeded the stand-ard in 1995, and fewer group supplies (3.2%) exceeded the standardthan public supplies (12.3%). The percentage of samples exceedingthe standard for fluoride in Ireland has dropped from 15.9% to 12.2%(all supplies), as many authorities are addressing shortcomings inthe process of adding the fluoride during the water treatment proc-ess (120).
Cyanobacterial toxinsThe eutrophication of surface water often results in blooms of algaein the surface layers. Cyanobacteria (blue-green algae) threaten thequality of drinking-water by causing physical effects on drinking-water treatment equipment, and some blooms contain species thatcan produce toxins (37).
Blooms of toxin-producing algae are a particular hazard to users ofrecreational water. The toxins are normally retained within the algalcells and normally present no immediate danger to drinking-watersupplies, since the algal scum is readily removed by filters. If thebloom begins to break down or the filters become blocked, how-ever, the toxin may be released directly into the water. Conventionalcoagulation treatment does not remove cyanobacterial toxins. Ad-vanced treatments such as powdered or granulated active carbon,ozonation, potassium permanganate or nanofiltration can be effec-tive in removing or breaking down cyanobacteria (37,150–152).
Several toxic compounds produced by these algae have been iden-tified and characterized according to their effects. The most com-monly encountered toxins are hepatotoxins. The most potent of these
135
is a cyclic septa-peptide termed microcystin-LR, which on acute ex-posure has been shown to cause the death of laboratory animalsfrom massive hepatic haemorrhage. More than 40 variants of thistoxin have been discovered, and a related hepatotoxic cyclic pep-tide, nodularin, has also been identified. Microcystin-LR has notbeen adequately investigated as a chronic toxin, but there is evi-dence that it can produce cellular changes that could promote tu-mour formation (153).
The principal neurotoxin identified is anatoxin-a, which is up to twoorders of magnitude more potent than nicotine. This appears to beof concern only as an acute toxin, whereby it can induce paralysisof respiratory muscles. Two others, saxitoxin and anatoxin-a(s) havealso been identified; these inhibit nervous system function. Anatoxin-a(s) is unstable in water.
A third class of toxic compound associated with some algal bloomshas also been identified. Some lipopolysaccharides are capable ofcausing skin disorders, including irritation, rashes and wheals.Gastrointestinal effects have also been recorded.
Authorities in Sweden are very concerned about the presence ofalgal toxins in drinking-water, as progressive eutrophication has al-lowed dense algal blooms to develop in surface water almost annu-ally. Similar problems have been reported in many countriesworldwide (154), including many in Europe (155–157).
Methaemoglobinaemia, nitrate and nitriteSeveral European countries report high nitrate concentrations indrinking-water, including Austria, Belgium, Croatia, the Czech Re-public, England and Wales, Estonia, France, Germany, Malta, theNetherlands, the Republic of Moldova, Slovakia, Slovenia, Turkeyand Ukraine. In France, an estimated 3.5% of the population is ex-posed to concentrations of nitrate between 50 and 150 mg of N perlitre in drinking-water (50). Fig. 5.8 shows the percentage of drinking-water samples exceeding the national standard for nitrate in someEuropean countries in 1995.
High concentrations of nitrate in drinking-water are of con-cern because nitrate can be reduced to nitrite, which can cause
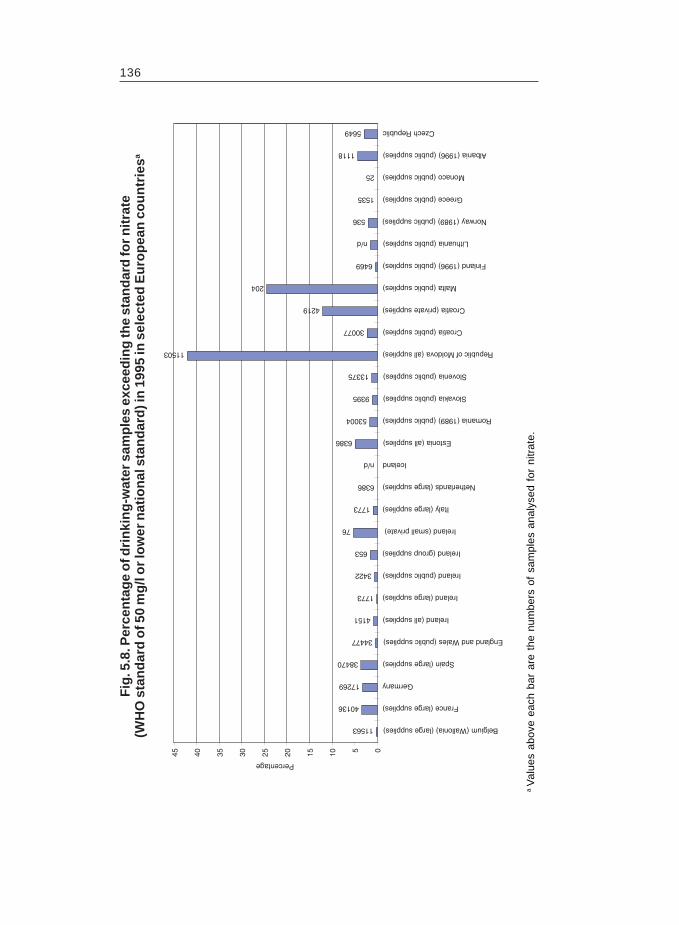
136
Fig
. 5.8
. Per
cen
tag
e o
f dri
nki
ng
-wat
er s
amp
les
exce
edin
g th
e st
and
ard
for
nit
rate
(WH
O s
tan
dar
d o
f 50
mg
/l o
r lo
wer
nat
ion
al s
tan
dar
d) i
n 1
995
in s
elec
ted
Eu
rop
ean
co
un
trie
sa
5649
1118
25
1535
536
n/d
6469
204
4219
30077
11503
13375
9395
53004
6386
n/d
6386
1773
76
653
3422
1773
4151
34477
38470
17269
40136
11563
051015202530354045
Belgium (Wallonia) (large supplies)
France (large supplies)
Germany
Spain (large supplies)
England and Wales (public supplies)
Ireland (all supplies)
Ireland (large supplies)
Ireland (public supplies)
Ireland (group supplies)
Ireland (small private)
Italy (large supplies)
Netherlands (large supplies)
Iceland
Estonia (all supplies)
Romania (1989) (public supplies)
Slovakia (public supplies)
Slovenia (public supplies)
Republic of Moldova (all supplies)
Croatia (public supplies)
Croatia (private supplies)
Malta (public supplies)
Finland (1996) (public supplies)
Lithuania (public supplies)
Norway (1989) (public supplies)
Greece (public supplies)
Monaco (public supplies)
Albania (1996) (public supplies)
Czech Republic
Percentage
aV
alue
s ab
ove
each
bar
are
the
num
bers
of
sam
ples
ana
lyse
d fo
r ni
trat
e.
137
methaemoglobinaemia. The haemoglobin of young children is par-ticularly susceptible to methaemoglobinaemia and this, coupled withthe increased ratio of water consumption to body weight, makesinfants especially vulnerable to the disorder. When methaemoglobinlevels rise to about 10% of the total haemoglobin, the so-called blue-baby syndrome develops. Progressive symptoms are stupor, comaand, in some cases, death.
Methaemoglobinaemia is unusual in older children, even where ni-trate levels are quite high. Infants fed on breast-milk are not at risk,unlike those bottle-fed on feed made using nitrate-rich water. Nev-ertheless, populations supplied by properly disinfected drinking-water have had few, if any, cases of methaemoglobinaemia. An infantwith a bacterial infection, such as gastroenteritis, is more likely tosuffer from methaemoglobinaemia than is a healthy child. It isthought that this is because the enhanced bacterial activity associ-ated with an infection increases the reduction of nitrate to nitrite.Few countries keep records of methaemoglobinaemia (Table 5.5),and incidents are few (Fig. 5.9). Most reported cases of methaemoglo-binaemia associated with drinking-water are caused by well water orcommunity-managed water supplies of poor microbial quality (105).
Groundwater sources, especially those fed by percolation from in-tensively farmed agricultural land, are liable to be contaminated bynitrate. The vulnerability of infants receiving drinking-water fromshallow groundwater sources is emphasized by data from Hungary,where between 9 and 41 cases of methaemoglobinaemia associatedwith drinking-water are reported annually. All cases are related toindividual private wells, and almost the whole country is affectedexcept for the south-eastern part, where deep well water is used. Asimilar number of water-related incidents are recorded annually inSlovakia and, as in Hungary, most of these are associated with drink-ing-water. In both Hungary and Slovakia, more than 80% of therecorded cases of methaemoglobinaemia are reported to be linkedto drinking-water. In Albania, all 43 cases reported in 1996 werelinked to nitrate in drinking-water.
The vulnerability of rural populations supplied by community-managed supplies to high concentrations of nitrates is illustrated bydata from Romania (Box 5.4) and Lithuania (Fig. 5.10 and 5.11). In
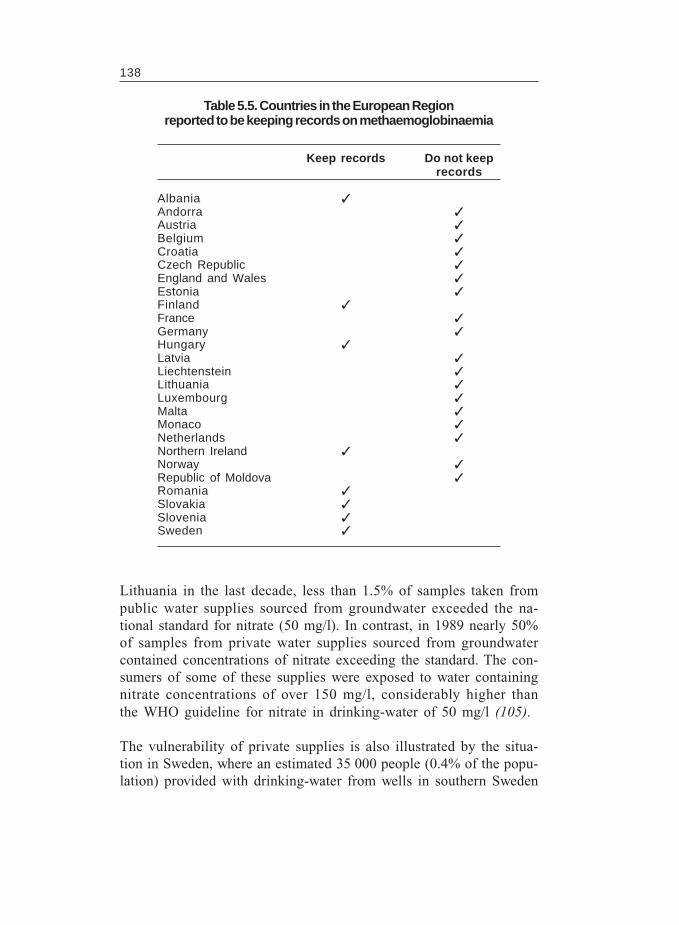
138
Keep records Do not keeprecords
Albania ✓Andorra ✓Austria ✓Belgium ✓Croatia ✓Czech Republic ✓England and Wales ✓Estonia ✓Finland ✓France ✓Germany ✓Hungary ✓Latvia ✓Liechtenstein ✓Lithuania ✓Luxembourg ✓Malta ✓Monaco ✓Netherlands ✓Northern Ireland ✓Norway ✓Republic of Moldova ✓Romania ✓Slovakia ✓Slovenia ✓Sweden ✓
Table 5.5. Countries in the European Regionreported to be keeping records on methaemoglobinaemia
Lithuania in the last decade, less than 1.5% of samples taken frompublic water supplies sourced from groundwater exceeded the na-tional standard for nitrate (50 mg/l). In contrast, in 1989 nearly 50%of samples from private water supplies sourced from groundwatercontained concentrations of nitrate exceeding the standard. The con-sumers of some of these supplies were exposed to water containingnitrate concentrations of over 150 mg/l, considerably higher thanthe WHO guideline for nitrate in drinking-water of 50 mg/l (105).
The vulnerability of private supplies is also illustrated by the situa-tion in Sweden, where an estimated 35 000 people (0.4% of the popu-lation) provided with drinking-water from wells in southern Sweden
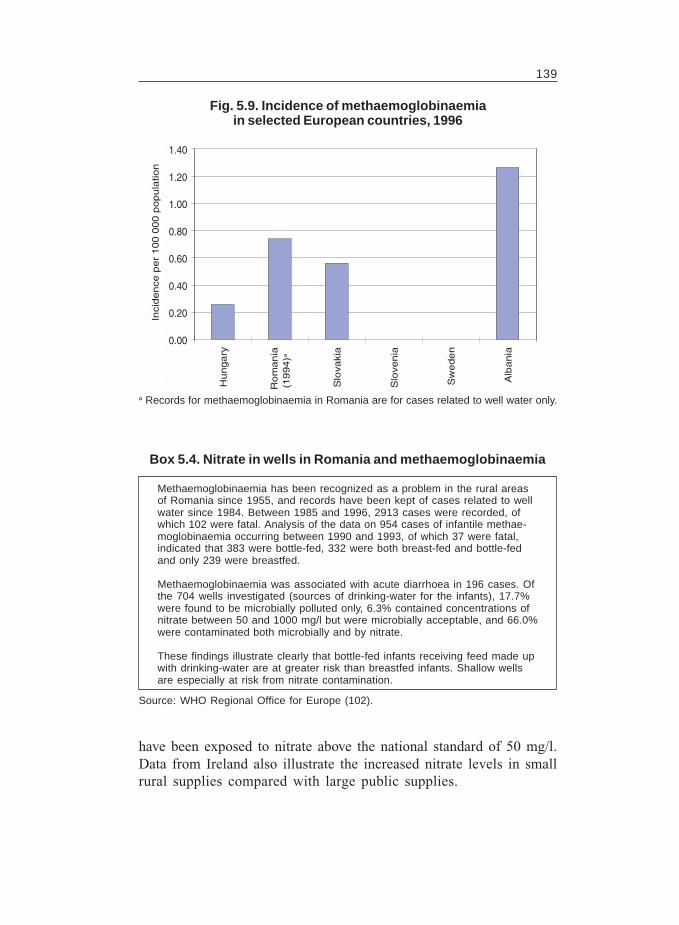
139
Fig. 5.9. Incidence of methaemoglobinaemiain selected European countries, 1996
0.00
0.20
0.40
0.60
0.80
1.00
1.20
1.40
Hu
nga
ry
Ro
man
ia(1
994)a
Slo
vaki
a
Slo
ven
ia
Sw
ede
n
Alb
ania
Inci
dence
per
100 0
00 p
opula
tion
a Records for methaemoglobinaemia in Romania are for cases related to well water only.
Methaemoglobinaemia has been recognized as a problem in the rural areasof Romania since 1955, and records have been kept of cases related to wellwater since 1984. Between 1985 and 1996, 2913 cases were recorded, ofwhich 102 were fatal. Analysis of the data on 954 cases of infantile methae-moglobinaemia occurring between 1990 and 1993, of which 37 were fatal,indicated that 383 were bottle-fed, 332 were both breast-fed and bottle-fedand only 239 were breastfed.
Methaemoglobinaemia was associated with acute diarrhoea in 196 cases. Ofthe 704 wells investigated (sources of drinking-water for the infants), 17.7%were found to be microbially polluted only, 6.3% contained concentrations ofnitrate between 50 and 1000 mg/l but were microbially acceptable, and 66.0%were contaminated both microbially and by nitrate.
These findings illustrate clearly that bottle-fed infants receiving feed made upwith drinking-water are at greater risk than breastfed infants. Shallow wellsare especially at risk from nitrate contamination.
Box 5.4. Nitrate in wells in Romania and methaemoglobinaemia
Source: WHO Regional Office for Europe (102).
have been exposed to nitrate above the national standard of 50 mg/l.Data from Ireland also illustrate the increased nitrate levels in smallrural supplies compared with large public supplies.
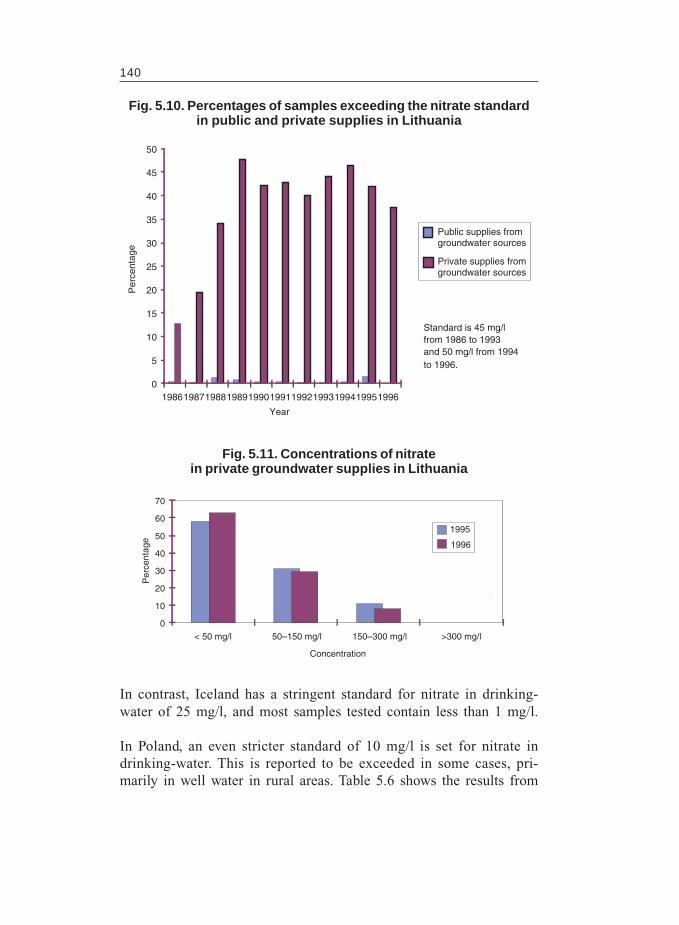
140
In contrast, Iceland has a stringent standard for nitrate in drinking-water of 25 mg/l, and most samples tested contain less than 1 mg/l.
In Poland, an even stricter standard of 10 mg/l is set for nitrate indrinking-water. This is reported to be exceeded in some cases, pri-marily in well water in rural areas. Table 5.6 shows the results from
Fig. 5.10. Percentages of samples exceeding the nitrate standardin public and private supplies in Lithuania
0
5
10
15
20
25
30
35
40
45
50
19861987198819891990199119921993199419951996
Public supplies fromgroundwater sources
Private supplies fromgroundwater sources
Standard is 45 mg/lfrom 1986 to 1993 and 50 mg/l from 1994 to 1996.
Year
Per
cent
age
Fig. 5.11. Concentrations of nitratein private groundwater supplies in Lithuania
0
10
20
30
40
50
60
70
< 50 mg/l 50–150 mg/l 150–300 mg/l >300 mg/l
1995
1996
Per
cent
age
Concentration
141
Nitrates (> 10 mg/l) Nitrites (> 0.1 mg/l)
Klaj 39 5Drwina 56 10Niepolomice 19 3
Table 5.6. Percentage of wells exceeding the national standardfor nitrates and nitrites in three towns
in Cracow voivodship, Poland, 1988–1993
Town Percentage of wellsexceeding the national standards
the monitoring of 399 samples of well water from three communi-ties located in the Cracow voivodship in 1988–1993. In a group ofeight infants with acute toxic methaemoglobinaemia treated in Cra-cow between 1980 and 1994, six had been exposed to nitrates inwell water and two to nitrates in carrot soup.
Surface water can also be polluted by nitrate from agricultural run-off and sewage discharges. In a number of countries, a significantpercentage of the drinking-water samples tested contained concen-trations higher than permitted under drinking-water legislation (usu-ally 45–50 mg/l). In Latvia, nitrate levels rarely exceed 20 mg/l,although at sites of intensive agrochemical use, 55% of boreholesare reported to show an increase compared with natural levels.
RadioactivityRadioactivity is ionizing radiation released in the form of energy orparticles from a material, and chemicals that exhibit this effect aretermed radionuclides. When ionizing radiation passes through liv-ing tissue, it can interact with the genetic material of the cell, caus-ing mutations that may ultimately lead to cancer. The rate at whichthe radiation is released from a radionuclide is termed the activity(measured in becquerels, Bq) and the manner in which it is releaseddetermines the type of radioactivity: alpha, beta or gamma. The dif-ferent forms of radiation cause different degrees of biological dam-age, alpha and beta being most damaging, and different types oftissue vary in susceptibility to damage from radiation.
142
The contribution of drinking-water to the annual average exposureto natural radiation is very small. Most is naturally occurringradionuclides in the uranium and thorium decay series, includingradon. Human activities may increase natural radioactivity levels inwater locally, but this is usually from regulated discharges.
Naturally occurring uranium isotopes (uranium-235 and uranium-238) have low radioactivity. Uranium causes inflammation of thekidney at high concentrations, and this chemical toxicity occurs atlevels lower than those at which there is a significant carcinogenicrisk from uranium radiation. Thus, the radioactivity of uranium is ofsecondary importance, as a risk to human health, to its chemicaltoxicity. The provisional WHO guideline level for uranium in drink-ing-water is 0.002 mg/l (46).
To take account of the spectrum of radionuclides that may be present,the varying biological effectiveness of each type of radiation andthe widely varying activity levels of radionuclides, WHO recom-mends guideline activity concentrations of 0.1 Bq/l for gross alphaactivity and 1.0 Bq/l for gross beta activity to screen water for radio-activity (105). If these levels are exceeded, more detailed analysisshould be undertaken to determine which radionuclides are respon-sible and appropriately qualified personnel should assess the risk.Nevertheless, levels of radioactivity much higher than this wouldstill be considered safe for short-term consumption and are prefer-able to cessation of supply. The method of detection used for grossalpha and beta emitters will not detect volatile radionuclides such asradon, and standard measurement techniques will not detect low-energy beta emitters such as tritium.
Radon-222 is produced as part of the uranium and thorium decayseries; where these elements occur in the soil, radon is naturallyreleased from the ground. Radon is an insoluble gas readily releasedfrom surface water, which usually has low radon concentrations.Groundwater can contain high levels of radon, especially small pri-vate supplies, which may utilize small aquifers unsuitable for publicsupply and very high in natural radionuclides. Groundwater oftenundergoes less treatment than surface water, so there is much lessopportunity for degassing to occur before the water reaches the tap.The risk from drinking radon in water is considered low, as radon
143
gas and its decay progeny are very short-lived. However, radon hasbeen implicated as a carcinogen when inhaled on a continual basis.Theoretical calculations from Sweden (population about 9 million)suggest that radon in water may cause 35–75 cases of cancer peryear. Between 10 and 20 of these are attributed to drinking the waterand the remainder to breathing radon gas emitted by water (103). InJuly 1997, Sweden set new standards for radon in drinking-water.These impose a recommended upper limit of 100 Bq/l and classifywater containing more than 1000 Bq/l as unfit for human consump-tion. As many as 46% of drinking-water samples tested in Swedencontained levels of radon-derived radioactivity above 100 Bq/l, and3% were higher than 1000 Bq/l.
The contribution of radon from drinking-water to radon concentra-tions within a house is difficult to determine because of numerousconfounding factors such as building construction, the level of ven-tilation and local geology. One study (158) estimated that only 1%of lung cancer in Finland could be attributed to indoor radon, de-spite a very high mean radon concentration compared with the restof the world. Exposure to radon via drinking-water may, however,be significant in some local areas, and WHO recommends that totalexposure via inhalation and ingestion be taken into account in eachsituation (105).
PesticidesAnalysis for pesticides is expensive, and the extent of analysis islikely to vary widely, including the number of samples taken andthe type of pesticide looked for, both within and between countries(Tables 5.7 and 5.8). No method exists to analyse the “total amountof pesticides”.
The EU countries are bound by the Drinking Water Directive (47,48).The Directive sets limits for individual pesticides at 0.1 µg/l and fortotal pesticides at 0.5 µg/l, and the revised Directive from 1998 (48)introduces more stringent ones for aldrin, dieldrin, heptachlor andheptachlor epoxide of 0.03 µg/l.
Triazines are among the pesticides detected most frequently at lev-els exceeding the national standards in Belgium, England & Wales,France, Germany, Romania and Sweden. In the United Kingdom,
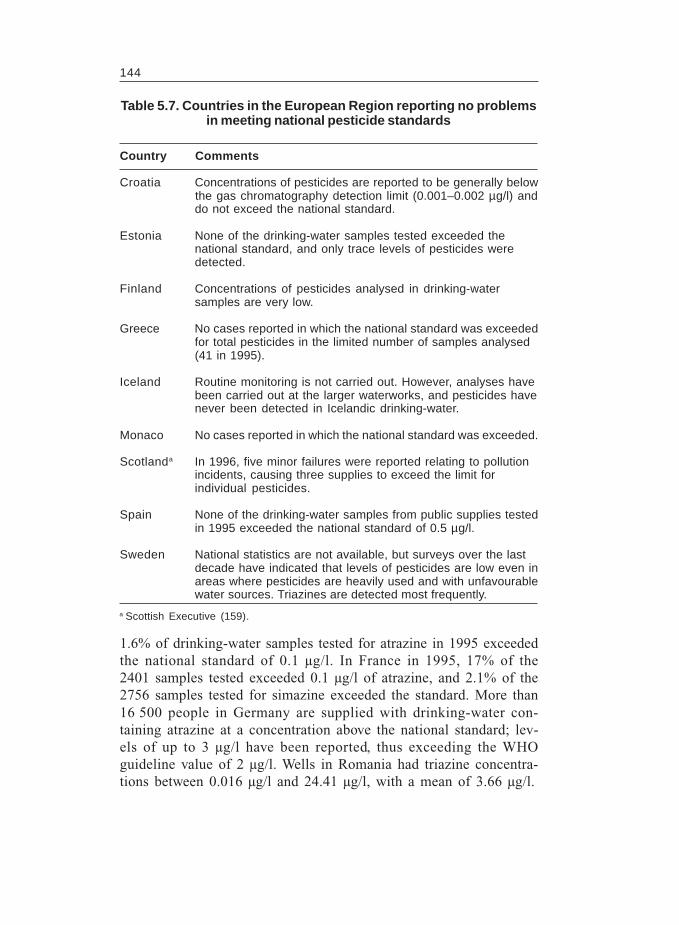
144
Country Comments
Croatia Concentrations of pesticides are reported to be generally belowthe gas chromatography detection limit (0.001–0.002 µg/l) anddo not exceed the national standard.
Estonia None of the drinking-water samples tested exceeded thenational standard, and only trace levels of pesticides weredetected.
Finland Concentrations of pesticides analysed in drinking-watersamples are very low.
Greece No cases reported in which the national standard was exceededfor total pesticides in the limited number of samples analysed(41 in 1995).
Iceland Routine monitoring is not carried out. However, analyses havebeen carried out at the larger waterworks, and pesticides havenever been detected in Icelandic drinking-water.
Monaco No cases reported in which the national standard was exceeded.
Scotlanda In 1996, five minor failures were reported relating to pollutionincidents, causing three supplies to exceed the limit forindividual pesticides.
Spain None of the drinking-water samples from public supplies testedin 1995 exceeded the national standard of 0.5 µg/l.
Sweden National statistics are not available, but surveys over the lastdecade have indicated that levels of pesticides are low even inareas where pesticides are heavily used and with unfavourablewater sources. Triazines are detected most frequently.
Table 5.7. Countries in the European Region reporting no problemsin meeting national pesticide standards
a Scottish Executive (159).
1.6% of drinking-water samples tested for atrazine in 1995 exceededthe national standard of 0.1 µg/l. In France in 1995, 17% of the2401 samples tested exceeded 0.1 µg/l of atrazine, and 2.1% of the2756 samples tested for simazine exceeded the standard. More than16 500 people in Germany are supplied with drinking-water con-taining atrazine at a concentration above the national standard; lev-els of up to 3 µg/l have been reported, thus exceeding the WHOguideline value of 2 µg/l. Wells in Romania had triazine concentra-tions between 0.016 µg/l and 24.41 µg/l, with a mean of 3.66 µg/l.
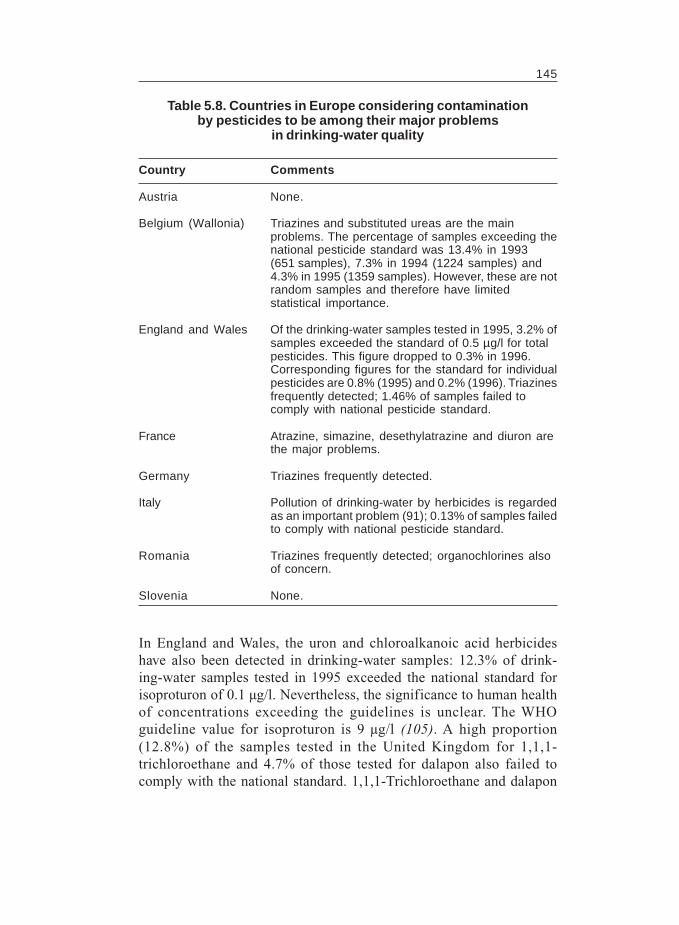
145
Country Comments
Austria None.
Belgium (Wallonia) Triazines and substituted ureas are the mainproblems. The percentage of samples exceeding thenational pesticide standard was 13.4% in 1993(651 samples), 7.3% in 1994 (1224 samples) and4.3% in 1995 (1359 samples). However, these are notrandom samples and therefore have limitedstatistical importance.
England and Wales Of the drinking-water samples tested in 1995, 3.2% ofsamples exceeded the standard of 0.5 µg/l for totalpesticides. This figure dropped to 0.3% in 1996.Corresponding figures for the standard for individualpesticides are 0.8% (1995) and 0.2% (1996). Triazinesfrequently detected; 1.46% of samples failed tocomply with national pesticide standard.
France Atrazine, simazine, desethylatrazine and diuron arethe major problems.
Germany Triazines frequently detected.
Italy Pollution of drinking-water by herbicides is regardedas an important problem (91); 0.13% of samples failedto comply with national pesticide standard.
Romania Triazines frequently detected; organochlorines alsoof concern.
Slovenia None.
Table 5.8. Countries in Europe considering contaminationby pesticides to be among their major problems
in drinking-water quality
In England and Wales, the uron and chloroalkanoic acid herbicideshave also been detected in drinking-water samples: 12.3% of drink-ing-water samples tested in 1995 exceeded the national standard forisoproturon of 0.1 µg/l. Nevertheless, the significance to human healthof concentrations exceeding the guidelines is unclear. The WHOguideline value for isoproturon is 9 µg/l (105). A high proportion(12.8%) of the samples tested in the United Kingdom for 1,1,1-trichloroethane and 4.7% of those tested for dalapon also failed tocomply with the national standard. 1,1,1-Trichloroethane and dalapon
146
can both be by-products of chlorination. In Northern Ireland, 4-chloro-2-methylphenooxyacetic acid, mecoprop, isoproturon, simazine andatrazine are the pesticides found most frequently at levels exceed-ing the national standard.
A number of studies have been carried out on the presence oforganochlorine insecticides (α-, β- and γ-hexachlorocyclohexane(HCH), aldrin, dieldrin, heptachlor, DDT and DDE) in drinking-wa-ter in Romania. Only 27% of samples from 80 towns in southernRomania contained less than 0.1 µg/l. Concentrations of 0.1–1 µg/lwere reported in 6% of the samples, and 37% contained between1 µg/l and 5 µg/l, 17% 5–10 µg/l and 13% over 10 µg/l. All the16 samples from Bucharest exceeded the national standard, with arange of 0.54–1.95 µg/l and a mean of 0.92 µg/l. Well water is alsocontaminated: 64% of samples contained organochlorines at levelsabove the national standard, with a mean of 0.74 µg/l (range 0.001–4.81 µg/l). For comparison, the WHO guidelines (and the EU limitsfrom 1998) for aldrin and dieldrin are 0.03 µg/l, and the WHO guide-line for DDT is 2 µg/l (105).
The Netherlands reports bentazone, atrazine, bromacil, amino-methylphosphonic acid (a metabolite of glyphosate), 4-chloro-2-methylphenooxyacetic acid and diuron as the pesticides mostfrequently detected at levels exceeding the EU standards under theold Drinking Water Directive.
In Flanders (Belgium), atrazine, simazine, diuron and isoproturonare reported as occurring frequently in raw surface water. Althoughpesticide pollution is regarded as a problem in achieving high-qual-ity drinking-water, however, pesticides are not reported to be foundin drinking-water because it is treated with activated carbon.
Disinfection by-productsThe by-products of chlorination have been well investigated and in-clude trihalomethanes and chloroacetic acids. Although several dis-infection by-products have been shown to be carcinogenic in animalstudies, the overriding priority in providing clean drinking-water mustbe good microbial quality, to prevent waterborne diseases. Disin-fection is the most important step in the treatment of water for publicsupply and microbial quality should not be compromised in attempting
147
to minimize the formation of disinfection by-products. The level ofdisinfection by-products can be reduced, however, by optimizingthe treatment process. Removing organic substances prior to disin-fection reduces the formation of potentially harmful by-products.
WHO guideline values are set for carcinogenic disinfectant by-products. Of greatest importance are those for chloramines (3 mg/l) andchlorine when used as a disinfectant (5 mg/l), bromoform (100 µg/l),dibromochloro-methane (100 µg/l), bromodichloromethane (60 µg/l)and chloroform (200 µg/l). Provisional guideline values have been setfor chloral hydrate (10 µg/l), chlorite (100 µg/l), bromate (25 µg/l),dichloroacetic acid (50 µg/l) and trichloroacetic acid (100 µg/l) (101).
The revised EU Drinking Water Directive (48) now contains spe-cific standards for disinfection by-products, including 100 µg/l fortotal trihalomethanes and 0.10 µg/l for epichlorohydrin (see Box 5.5).
In 1995, 3.6% of samples in the United Kingdom contained totaltrihalomethanes at concentrations above the national standard of100 µg/l. In the Wallonia region of Belgium, the frequency of con-centrations exceeding the national standard was 3.5% (41 in1171 samples) in 1993 and 9.8% (212 in 2169 samples) in 1995. InItaly, the standard for organohalogenated compounds is 30 µg/l, butan estimated 5% of the population is supplied with water to which awaiver allowing concentrations of up to 50 µg/l is applied (91).
SolventsMany countries do not have standards for solvents and monitoringis, therefore, unlikely to be carried out regularly. Several countries(Croatia, England and Wales, Hungary and Slovakia) indicate thatchlorinated solvents such as trichloroethene and tetrachloroethenemay be occasionally detected in drinking-water. However, the con-centrations rarely, if ever, exceed the national standards substan-tially or reach levels considered to be a health concern. In the UnitedKingdom, only 0.06% of samples tested for tetrachloroethene in 1995exceeded the national (and EU) standard of 10 µg/l, and no concen-trations of trichloroethene exceeding the national standard were re-corded. In Hungary, some data indicate the presence oftrichloroethene and tetrachloroethene, but at levels that are not con-sidered a health hazard. Dichloroethane is present at the waterworks
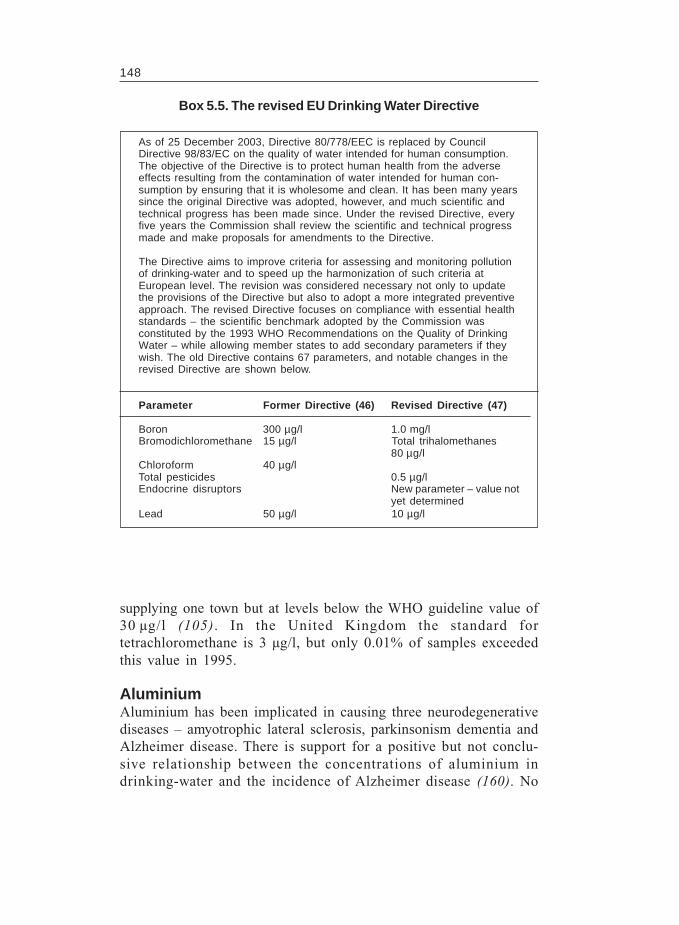
148
supplying one town but at levels below the WHO guideline value of30 µg/l (105). In the United Kingdom the standard fortetrachloromethane is 3 µg/l, but only 0.01% of samples exceededthis value in 1995.
AluminiumAluminium has been implicated in causing three neurodegenerativediseases – amyotrophic lateral sclerosis, parkinsonism dementia andAlzheimer disease. There is support for a positive but not conclu-sive relationship between the concentrations of aluminium indrinking-water and the incidence of Alzheimer disease (160). No
As of 25 December 2003, Directive 80/778/EEC is replaced by CouncilDirective 98/83/EC on the quality of water intended for human consumption.The objective of the Directive is to protect human health from the adverseeffects resulting from the contamination of water intended for human con-sumption by ensuring that it is wholesome and clean. It has been many yearssince the original Directive was adopted, however, and much scientific andtechnical progress has been made since. Under the revised Directive, everyfive years the Commission shall review the scientific and technical progressmade and make proposals for amendments to the Directive.
The Directive aims to improve criteria for assessing and monitoring pollutionof drinking-water and to speed up the harmonization of such criteria atEuropean level. The revision was considered necessary not only to updatethe provisions of the Directive but also to adopt a more integrated preventiveapproach. The revised Directive focuses on compliance with essential healthstandards – the scientific benchmark adopted by the Commission wasconstituted by the 1993 WHO Recommendations on the Quality of DrinkingWater – while allowing member states to add secondary parameters if theywish. The old Directive contains 67 parameters, and notable changes in therevised Directive are shown below.
Parameter Former Directive (46) Revised Directive (47)
Boron 300 µg/l 1.0 mg/lBromodichloromethane 15 µg/l Total trihalomethanes
80 µg/lChloroform 40 µg/lTotal pesticides 0.5 µg/lEndocrine disruptors New parameter – value not
yet determinedLead 50 µg/l 10 µg/l
Box 5.5. The revised EU Drinking Water Directive
149
health-based guideline is derived, but WHO recommends a maxi-mum concentration of aluminium in drinking-water of 0.2 mg/l (105).
Aesthetic aspectsIron and manganese can be found in groundwater, depending onthe local geology. In addition, iron salts may be used as coagulantsin drinking-water treatment. The ions of both metals can be removedby correctly adjusting the pH in the coagulation procedure. Never-theless, this stage of treatment is often not applied to groundwaterthat may contain naturally high levels. Where iron salts are used incoagulation, excessive dosing and poor control of the pH may bethe cause of high concentrations in the finished water. The primaryconcern with excessive levels of these metals in water supplies istheir detrimental effect on the aesthetic qualities of the water. Bothcause “dirty water” problems, forming insoluble precipitates whenthey are oxidized.
Owing to the limitations of the animal data as a model for humans,and the uncertainty surrounding the human data, a health-basedguideline value for aluminium cannot be derived at this time. Thebeneficial effects of the use of aluminium as a coagulant in watertreatment are recognized. Taking this into account, and consideringthe health concerns about aluminium (i.e. its potential neurotoxic-ity), a practicable level is derived based on optimization of the co-agulation process in drinking-water plants using aluminium-basedcoagulants, to minimize aluminium levels in finished water. Thus0.2 mg/l or less is set as a practicable level for aluminium in finishedwater (161).
Drinking-water in some areas of Belgium, Finland, Latvia, Lithua-nia, the Netherlands and Northern Ireland is reported to contain natu-rally high concentrations of iron and manganese because of the localgeology. In Latvia, over half the groundwater intakes are not equippedwith filters to remove excess iron, and thus up to 50% of testedwater samples do not meet the organoleptic quality requirements. InHungary, Lithuania, the Republic of Moldova and Sweden, poor watertreatment and the unavailability of appropriate treatment technol-ogy contribute to elevated levels of iron and manganese in drinking-water. High levels of aluminium and iron in drinking-water inFrance are attributed to malfunctioning treatment plants. In parts of
150
Belgium and England and Wales, high levels generally result fromiron dissolving in the distribution system. Corrosion of metal pipingis also a problem in distribution systems in Norway. In the UnitedKingdom, 2.4% of samples tested in 1995 exceeded the nationalstandard for iron of 0.2 mg/l, as compared with 5.3% in Ireland.Between 1994 and 1997, about 3% of samples tested in Slovakiaexceeded the national standard for iron of 0.3 mg/l. Manganese lev-els above the national standard of 0.05 mg/l were found in 4.2% ofthe drinking-water samples tested in Ireland in 1995.
High concentrations of other ions, such as sulfate and chloride, canalso impart an unpleasant taste to drinking-water. The total dissolvedsolids or conductivity is commonly measured in assessing the aes-thetic quality of water supplies. Although a high level of dissolvedsolids does not inherently pose a health hazard, the risk occurs ifwater intake is substantially decreased because it is not as palatable.Similarly, excessive quantities of iron and manganese, which alsoaffect the aesthetic quality of the water, might be expected to havesimilar effects.
FLOODING, DROUGHT AND DISEASE
FloodsMuch of the effect of flooding on mortality and ill health may beattributed to the distress and the mental effects of the event. Follow-ing flooding in Bristol, United Kingdom, a 50% increase in mortal-ity was reported among those whose homes had been flooded. Inaddition, primary care attendance rose by 53% and referrals andadmissions to hospital more than doubled (162). Similar mental ef-fects were found following floods in Brisbane in 1974 (163). Mentalsymptoms and post-traumatic stress disorder increased, including50 flood-linked suicides, in the two months following major floodsin Poland in 1997 (164).
During and following both catastrophic and non-catastrophic flood-ing, health is at risk if the floodwater becomes contaminated withhuman or animal waste. Floods in Europe are associated with anincreased risk of leptospirosis. An epidemic of leptospirosis was as-sociated with floods in the Ukraine in 1997. Flooding in Lisbon in
151
1967 was associated with a small outbreak of leptospirosis (165).Analysis of surveillance data following the major floods in the CzechRepublic in 1997 suggests an increase in cases of leptospirosis (166).
Several studies have established a link between dampness in thehome, including occasional flooding, and a variety of respiratorysymptoms. For example, flooding has been significantly linked tochildhood experience of cough, wheeze, asthma, bronchitis, chestillness, upper respiratory symptoms, eye irritation and non-respiratorysymptoms (167). Very little is known about the occurrence of otherdiseases, such as skin diseases.
As a general rule in Europe, the floods that bring about the highestmaterial losses are different from those that claim the highest numberof deaths. Floods responsible for a high number of deaths largelytake place in open spaces in mountainous basins, where there islittle time to respond (in many cases less than 3 hours) and wherethe surprise factor is the main cause of death. However, these phe-nomena rarely cause major material losses. Floods in urban areas donot generally occur suddenly, and there is usually capacity for real-time forecasting, so that the population can be alerted and evacu-ated in advance.
Mainland Spain has experienced an average of five floods per yearover the last five centuries and the average cost of material damageper year is estimated to be US $6 billion (168). Recent devastatingfloods in central Europe affecting the Czech Republic, Germanyand Poland killed over 400 people and left many thousands desti-tute. Some 160 000 were evacuated from their homes in Poland anda further 50 000 in the Czech Republic (164).
DroughtNo deaths have been caused directly by a shortage of water in Eu-rope over the last 50 years. Nevertheless, severe restrictions mayresult in a lack of hygiene and the use of resources that are notsubject to sanitation control. Not only is there a lack of statistics onthis type of effect, but the quality and quantity of the water are oftennot considered holistically. The absence of statistics is in part theresult of the lack of a uniform definition of drought and, unlike floods,evaluating or quantifying a drought is difficult. Criteria are needed
152
that would clearly distinguish between and def ine drought,desertification, water shortage and water scarcity.
RECREATIONAL WATER, HEALTH AND DISEASE
Recreational water environments have a diverse range of hazards tohuman health. These include factors associated with accidents (re-sulting in drowning and near drowning and spinal injuries), micro-bial pollution, exposure to toxic algal products and occasionalexposure to chemical pollution (159). Hazards exist even in unpol-luted environments – eye infections in bathers probably occur as aresult of a reduction in the eye’s natural defences through contactwith water (169).
Drowning and physical injuriesInformation on accidents is not systematically collected in all coun-tries throughout Europe. Deaths from drowning are available fromthe WHO mortality database, but the accidents related to bathingwater are not separately recorded in most cases (Table 5.9) (105).Data suggest that males are more likely to drown than females, butit is not clear whether this is because more males swim (Fig. 5.12)(157).
The greater consumption of alcohol by men is one contributing fac-tor (171). However, heart attack, sea currents and surf also contrib-ute to drowning accidents. Private pools, lakes and other bodies offresh water contribute significantly to drowning statistics, especiallyin children. In Denmark, for example, 63% of all drownings among0- to 14-year-olds between 1989 and 1993 occurred in these typesof water body. In terms of all accidental deaths in the EuropeanRegion, drowning accounts for less than 10% of the 280 000 deathsdue to accidents (170).
Permanent paralysis may occur as a result of diving into a shallowbody of water or swimming pool. A spinal cord injury can result inparaplegia or quadriplegia, the latter being more common. Thenumber of spinal injuries sustained as a result of swimming acci-dents does not appear to be widely available. Data available fromthe Czech Republic suggest that spinal injuries are more frequently
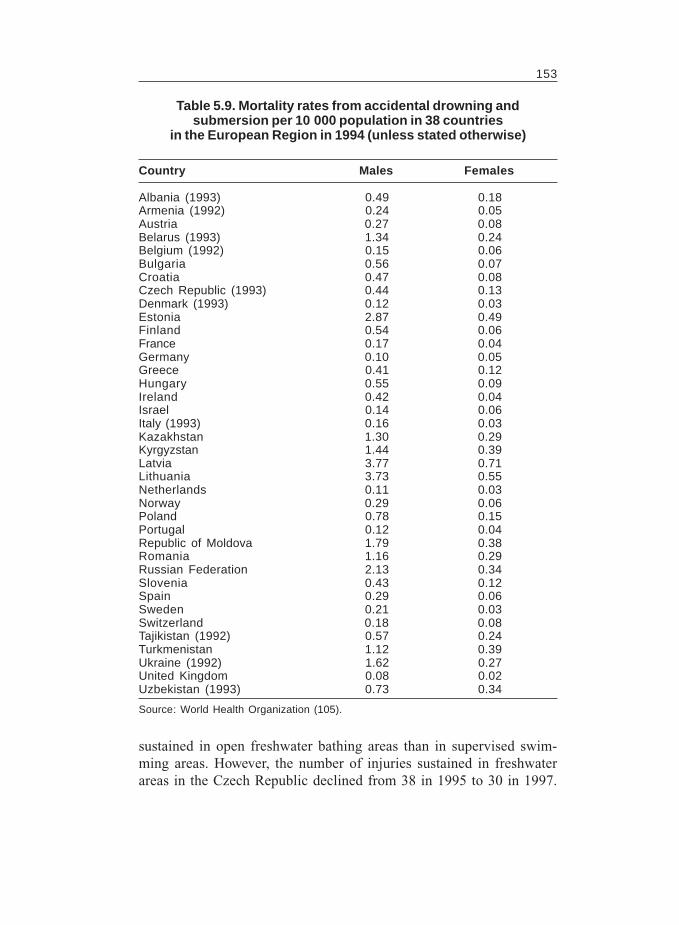
153
Country Males Females
Albania (1993) 0.49 0.18Armenia (1992) 0.24 0.05Austria 0.27 0.08Belarus (1993) 1.34 0.24Belgium (1992) 0.15 0.06Bulgaria 0.56 0.07Croatia 0.47 0.08Czech Republic (1993) 0.44 0.13Denmark (1993) 0.12 0.03Estonia 2.87 0.49Finland 0.54 0.06France 0.17 0.04Germany 0.10 0.05Greece 0.41 0.12Hungary 0.55 0.09Ireland 0.42 0.04Israel 0.14 0.06Italy (1993) 0.16 0.03Kazakhstan 1.30 0.29Kyrgyzstan 1.44 0.39Latvia 3.77 0.71Lithuania 3.73 0.55Netherlands 0.11 0.03Norway 0.29 0.06Poland 0.78 0.15Portugal 0.12 0.04Republic of Moldova 1.79 0.38Romania 1.16 0.29Russian Federation 2.13 0.34Slovenia 0.43 0.12Spain 0.29 0.06Sweden 0.21 0.03Switzerland 0.18 0.08Tajikistan (1992) 0.57 0.24Turkmenistan 1.12 0.39Ukraine (1992) 1.62 0.27United Kingdom 0.08 0.02Uzbekistan (1993) 0.73 0.34
Source: World Health Organization (105).
Table 5.9. Mortality rates from accidental drowning andsubmersion per 10 000 population in 38 countries
in the European Region in 1994 (unless stated otherwise)
sustained in open freshwater bathing areas than in supervised swim-ming areas. However, the number of injuries sustained in freshwaterareas in the Czech Republic declined from 38 in 1995 to 30 in 1997.
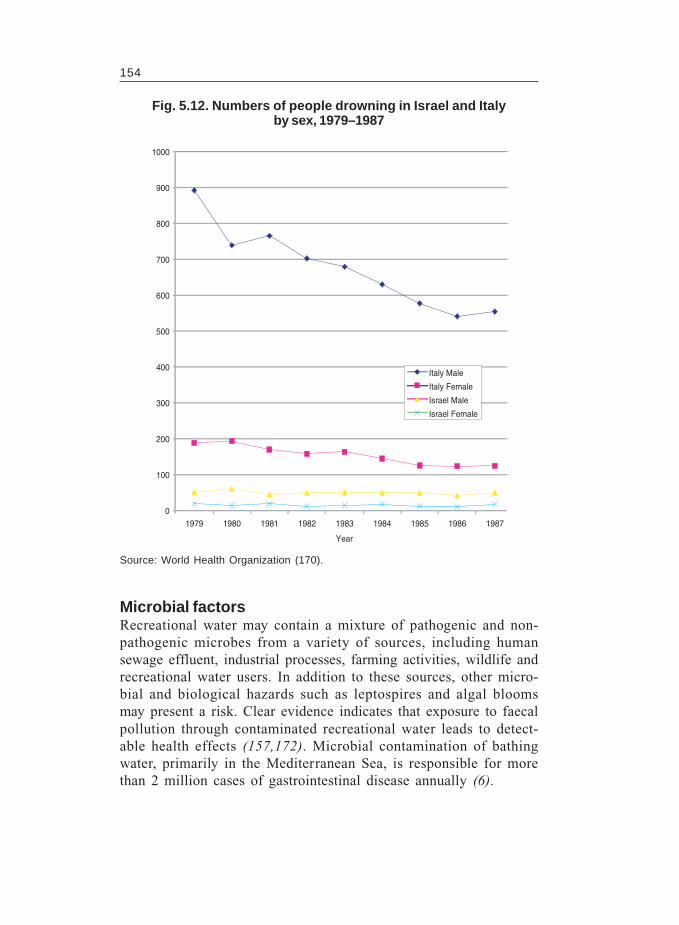
154
Microbial factorsRecreational water may contain a mixture of pathogenic and non-pathogenic microbes from a variety of sources, including humansewage effluent, industrial processes, farming activities, wildlife andrecreational water users. In addition to these sources, other micro-bial and biological hazards such as leptospires and algal bloomsmay present a risk. Clear evidence indicates that exposure to faecalpollution through contaminated recreational water leads to detect-able health effects (157,172). Microbial contamination of bathingwater, primarily in the Mediterranean Sea, is responsible for morethan 2 million cases of gastrointestinal disease annually (6).
Fig. 5.12. Numbers of people drowning in Israel and Italyby sex, 1979–1987
Source: World Health Organization (170).
0
100
200
300
400
500
600
700
800
900
1000
1979 1980 1981 1982 1983 1984 1985 1986 1987
Year
Italy Male
Italy Female
Israel Male
Israel Female
155
Several studies have provided evidence of a dose–response rela-tionship between enteric and nonenteric illnesses and faecal pollu-tion (172–175). Enteric illness, such as self-limiting gastroenteritis,is the most frequently reported adverse health outcome investigated,and evidence suggests a causal relationship between increasing rec-reational exposure to faecal contamination and frequency of gastro-enteritis (157). Associations between ear infections and microbialindicators of faecal pollution and bather load have been reported,and increased rates of eye symptoms have been reported amongbathers. Evidence also exists for more severe health outcomes. Al-though the probability of contracting acute febrile respiratory ill-ness is generally lower than that of contracting gastroenteritis, faecalpollution and acute febrile respiratory illness may have a cause-and-effect relationship. There is reason to believe that other severe infec-tious diseases such as typhoid fever and viral diseases such ashepatitis A and E may be transmitted to susceptible bathers whomake recreational use of polluted water (158).
Monitoring of the quality of bathing water in the WHO EuropeanRegion is based on the definition of the bathing area as passing orfailing a defined microbial standard. This approach has severe limi-tations, as an identified bathing area can vary widely in spatial andtemporal factors. Data on the microbial quality of recreational waterare collected mainly by regulatory agencies to assess compliance.Problems of analytical reproducibility and interlaboratory compara-bility, and variations in the number of water bodies monitored, sam-pling frequencies and temporal conditions make comparison betweencountries difficult.
An improved approach to the regulation of recreational water isneeded that better reflects the health risk and provides enhancedscope for effective management intervention. EU member statesmonitor designated bathing waters for compliance with the direc-tive on the quality of bathing water (176), and some non-EU coun-tries monitor routinely (Table 5.10). Published water quality dataare always retrospective because of the nature and frequency of analy-sis undertaken. An alternative approach to monitoring and assess-ment is to classify a beach based on health risk, as opposed to thecurrent pass-or-fail approach in place in the EU. The health risk ap-proach is more flexible than the pass-or-fail approach, and allows
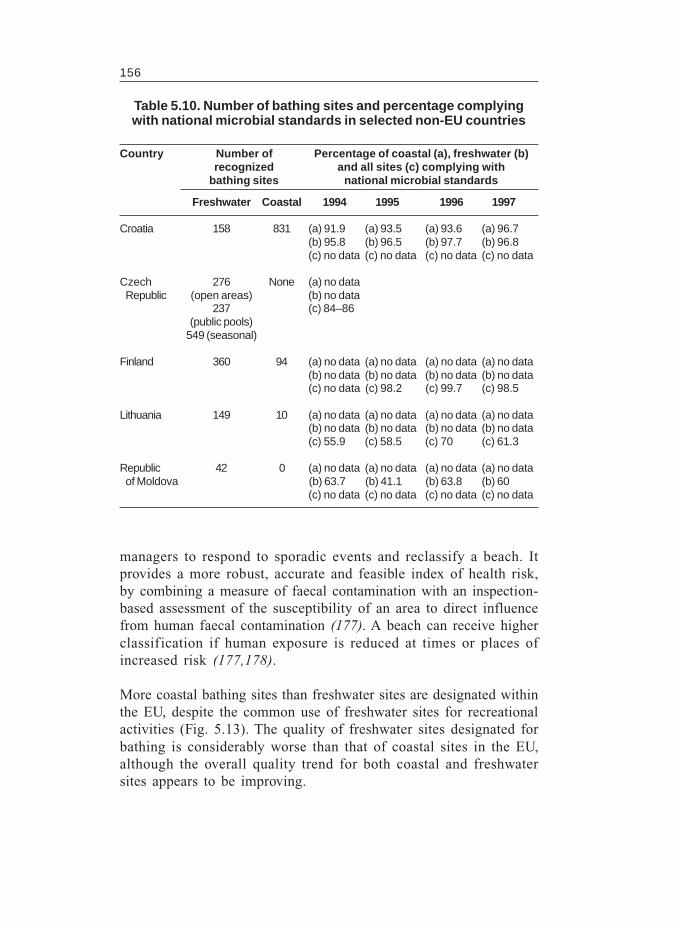
156
managers to respond to sporadic events and reclassify a beach. Itprovides a more robust, accurate and feasible index of health risk,by combining a measure of faecal contamination with an inspection-based assessment of the susceptibility of an area to direct influencefrom human faecal contamination (177). A beach can receive higherclassification if human exposure is reduced at times or places ofincreased risk (177,178).
More coastal bathing sites than freshwater sites are designated withinthe EU, despite the common use of freshwater sites for recreationalactivities (Fig. 5.13). The quality of freshwater sites designated forbathing is considerably worse than that of coastal sites in the EU,although the overall quality trend for both coastal and freshwatersites appears to be improving.
Freshwater Coastal 1994 1995 1996 1997
Croatia 158 831 (a) 91.9 (a) 93.5 (a) 93.6 (a) 96.7(b) 95.8 (b) 96.5 (b) 97.7 (b) 96.8(c) no data (c) no data (c) no data (c) no data
Czech 276 None (a) no dataRepublic (open areas) (b) no data
237 (c) 84–86(public pools)
549 (seasonal)
Finland 360 94 (a) no data (a) no data (a) no data (a) no data(b) no data (b) no data (b) no data (b) no data(c) no data (c) 98.2 (c) 99.7 (c) 98.5
Lithuania 149 10 (a) no data (a) no data (a) no data (a) no data(b) no data (b) no data (b) no data (b) no data(c) 55.9 (c) 58.5 (c) 70 (c) 61.3
Republic 42 0 (a) no data (a) no data (a) no data (a) no dataof Moldova (b) 63.7 (b) 41.1 (b) 63.8 (b) 60
(c) no data (c) no data (c) no data (c) no data
Table 5.10. Number of bathing sites and percentage complyingwith national microbial standards in selected non-EU countries
Country Number of Percentage of coastal (a), freshwater (b)recognized and all sites (c) complying with
bathing sites national microbial standards
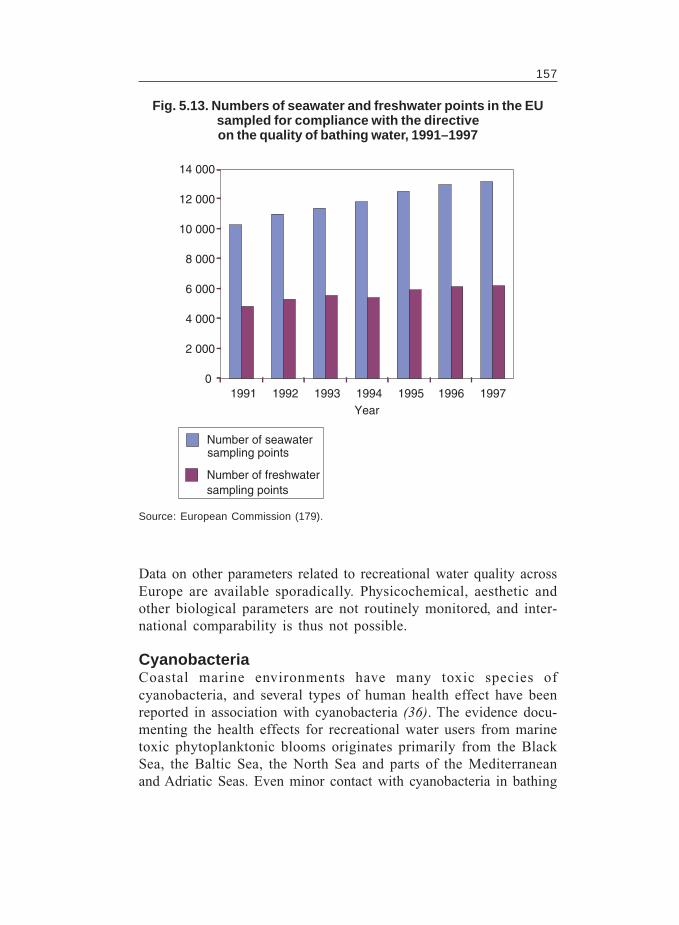
157
Fig. 5.13. Numbers of seawater and freshwater points in the EUsampled for compliance with the directiveon the quality of bathing water, 1991–1997
Source: European Commission (179).
0
2 000
4 000
6 000
8 000
10 000
12 000
14 000
1991 1992 1993 1994 1995 1996 1997Year
Number of seawater sampling points
Number of freshwatersampling points
Data on other parameters related to recreational water quality acrossEurope are available sporadically. Physicochemical, aesthetic andother biological parameters are not routinely monitored, and inter-national comparability is thus not possible.
CyanobacteriaCoastal marine environments have many toxic species ofcyanobacteria, and several types of human health effect have beenreported in association with cyanobacteria (36). The evidence docu-menting the health effects for recreational water users from marinetoxic phytoplanktonic blooms originates primarily from the BlackSea, the Baltic Sea, the North Sea and parts of the Mediterraneanand Adriatic Seas. Even minor contact with cyanobacteria in bathing
158
water can lead to skin irritation and an increased risk ofgastrointestinal symptoms (180). Observations of human deathsthrough cyanobacterial toxins have been limited to exposure throughrenal dialysis (157), but there are many reports of animal deathsfrom cyanobacterial toxicity in North and South America, Europe,Australia and Africa (181,182). The human health implications areprimarily known from anecdotal reports of irritations of the skin and/or mucous membranes. Marine cyanobacterial dermatitis may occurafter swimming in seas containing blooms of certain species of ma-rine cyanobacteria (183). Inhalation of sea spray aerosol containingfragments of marine dinoflagellate cells and/or toxins released intothe surf by lysed algae can be harmful (184,185). As the evidenceof risks to human health associated with the presence of cyanobacteriaduring recreational activities is limited, there are currently no guide-line values (157).
ShellfishThe main types of human exposure to pathogenic microorganismsin the marine environment are through direct contact with pollutedseawater, sand or sediment and through consumption of contami-nated shellfish. The potential health risks arising from consumptionof shellfish relate to the quality of the water in which the shellfishare grown or harvested and the quality of the shellfish when theyreach the market. The link between shellfish water quality and thehealth effects on humans as the final consumers is more complexthan that applying to bathing water. The extent of faecal contamina-tion that can be tolerated in the growing water is complex, and thereis no satisfactory correlation either between bacterial indicator lev-els in shellfish and those in the growing water, or between the indi-cators and pathogens in the shellfish themselves (186).
Overall morbidity statistics are insufficient, as practically all dis-eases caused by pathogens are capable of being contracted throughmedia other than the marine environment. For example, in 1974, alarge outbreak of cholera affected several areas of Portugal. Therewere 2467 bacteriologically confirmed cases leading to hospitaladmission, and 48 deaths. The most significant risk factor for thenational outbreak was the consumption of raw or semi-cooked shell-fish, although epidemiological investigations in Lisbon showed thatvisitors to the local spa had a much higher attack rate (187).
159
Artificial purif ication of mussels is widely practised throughoutEurope. One method involves the use of chlorine to disinfect theseawater, which must then be dechlorinated before it can be used todepurate contaminated shellfish. Although this method is relativelyexpensive, it is used widely in Spain and France. Disinfection byozone is now the depuration method of choice in large shellfish-cleaning stations in France, but a considerable amount of shellfishthroughout Europe is still not subject to strict depuration proceduresor proper control of storage after harvest (188).
VECTOR-BORNE DISEASES
MalariaMalaria is by far the most important water-related, vector-borne dis-ease, in terms of both numbers of sufferers and of directly attribut-able deaths. The causative agents in humans are four species ofPlasmodium protozoa. Of these, P. falciparum accounts for mostinfections and is the most lethal.
The geographical area affected by malaria shrank considerably dur-ing the second half of the twentieth century, but control is becomingmore difficult. Increased risk of the disease is associated with changesin land use linked to activities such as road-building, mining, log-ging and agricultural and irrigation projects. Other causes of its spreadinclude global climate change, disintegration of health services,armed conflicts and mass movements of refugees. Increasing travelis causing malaria to re-emerge in areas from which it had previ-ously been eradicated, such as Azerbaijan and Tajikistan. In theUnited Kingdom, 2364 cases of malaria were registered in 1997, allimported by travellers. Malaria is currently epidemic in Armenia,Azerbaijan, Tajikistan, Turkey and Turkmenistan.
Present policies
161
6
Both the quantity and quality of water need to be considered in achiev-ing sustainable water management. A balance has to be achievedbetween the abstractive uses of water, in-stream uses such as recrea-tion and ecosystem maintenance, the discharge of effluents and theimpact of diffuse sources of pollution. Surface water systems arenow often highly regulated in efforts to control water availability,whether for direct use in irrigation, for hydroelectric generation ordrinking-water, or for protecting against the consequences of floodsor droughts. Changes in the nature and scale of human activitiesinfluence both the qualitative and quantitative properties of waterresources. The change in trends in water use from rural areas andagriculture to urban areas and industry is reflected in patterns of de-mand and water pollution. It is unclear whether this shift will con-tinue in the future; irrigated agriculture demands increasing amounts ofwater, a process that already accounts for around 70% of water demandworldwide. Many industries have successfully developed processes withsubstantial water economy measures. Development of appliances thatuse less water and control of losses from water mains may thereforestabilize or even reduce total demand for water in the future (37).
QUANTITY MANAGEMENT
Water consumption has been high in recent decades, stemming fromthe perception that water is abundant and inexpensive. This perception
162
is changing in the light of increasing water pollution, drought orwater stress and rising water prices. In many countries, the enforce-ment of EU or national legislation and the rising cost of water areleading municipalities and industries to reduce water use and to in-vest in water-saving processes and equipment.
The two main approaches to increasing the efficiency of the supplyand use of water are demand management, which includes economicincentives to reduce use and increase the efficiency of use, and in-frastructure changes. These changes may take the form of improv-ing the network, increasing storage capacity, improving industrialefficiency, using low-consumption devices and new sources, recy-cling and water transfer.
Use of available resourcesThe EU’s f ifth programme of policy and action in relation to theenvironment and sustainable development of 1993 (189) encour-ages member states to employ environmental taxes and charges toachieve a more cost-effective environmental policy. This has led toan increase in the application of a wide range of different chargingor taxation policies in the member states, including charges for wa-ter abstraction and use.
Abstraction chargesA system of licensing has traditionally been applied to try to achievethe required balance between the various demands on the aquaticenvironment: the command and control approach. Nevertheless, aswater resources of adequate quality become more scarce and thepublic interest in the aquatic environment (in terms of minimum flow,quality and aesthetic appearance) increases, economic instrumentsare increasingly being applied to complement the licensing system.
The charges made for abstracting water must be set at a rate thatreduces abstraction without causing undesirable economic or socialeffects, such as reducing the competitiveness of industry or stand-ards of hygiene in poor households.
The purpose and design of charging schemes for water abstractionvary widely in different countries, reflecting different institutionalarrangements and geographical conditions (Table 6.1) (190). The
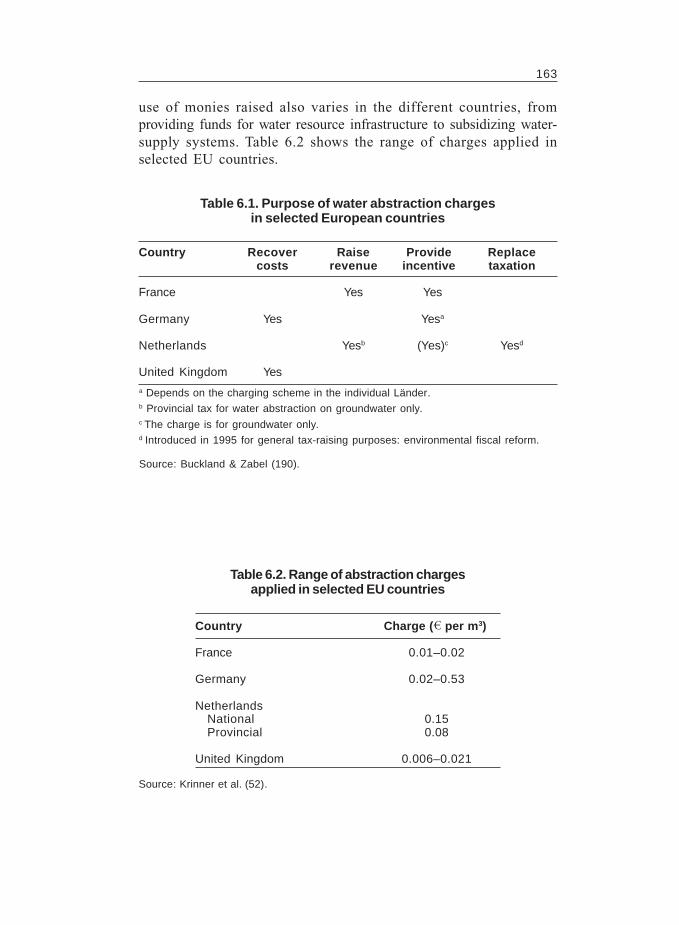
163
Country Charge ( per m3)
France 0.01–0.02
Germany 0.02–0.53
NetherlandsNational 0.15Provincial 0.08
United Kingdom 0.006–0.021
Table 6.2. Range of abstraction chargesapplied in selected EU countries
Source: Krinner et al. (52).
use of monies raised also varies in the different countries, fromproviding funds for water resource infrastructure to subsidizing water-supply systems. Table 6.2 shows the range of charges applied inselected EU countries.
Country Recover Raise Provide Replacecosts revenue incentive taxation
France Yes Yes
Germany Yes Yesa
Netherlands Yesb (Yes)c Yesd
United Kingdom Yesa Depends on the charging scheme in the individual Länder.b Provincial tax for water abstraction on groundwater only.c The charge is for groundwater only.d Introduced in 1995 for general tax-raising purposes: environmental fiscal reform.
Source: Buckland & Zabel (190).
Table 6.1. Purpose of water abstraction chargesin selected European countries
164
Variation in the charges made for abstraction from different types ofwater source or for different uses can be an additional instrument formanaging demand, and can encourage changes in the pattern of waterabstraction (Table 6.3). In Germany, for example, higher charges aregenerally applied to abstraction from groundwater than from surfacewater, especially for uses other than potable supply; in some Ländercharges are made only for groundwater abstraction. Charges mayalso vary according to the availability of the water, the season ofabstraction and how much of the abstracted water is returned to thesource, as in the United Kingdom; in France, however, the chargesvary according to the quality and vulnerability of the source (52).
Where the abstraction charges are relatively low compared with the priceof drinking-water, such as in England and Wales, France, Germany andthe Netherlands, the incentive to reduce the volume of water used islow. Current water abstraction charging schemes are best described asfinancial instruments to raise revenue to cover costs or to fund specifiedactivities, rather than as economic instruments to change the behaviourof water users. None of the charging schemes attempts to set the chargesbased on the site-specific real value of the water resource.
Although water abstracted for irrigation is increasingly becoming amajor issue, charges for such water use tend to be very low – muchlower than charges for other uses – and do not represent the realvalue of the water, especially as irrigation tends to be practised in thesummer when water resources are under the greatest threat (51).
Water pricing and meteringCharging can undoubtedly influence the volume of water used. Ithas been shown that when water charges are raised, consumptiondecreases. In eastern Germany the consumer price index increasedfrom 1985 to 1992 by approximately 14% for households and 9%for other consumers. Water consumption dropped 10% per annumbetween 1980 and 1991. Between 1990 and 1995 water consump-tion per person declined by 9% in Germany as a whole, and theobserved drop in water consumption is influenced by changes inconsumer behaviour as well as changes in water prices (52). In Croatia,average consumption has fallen from 266 to 150 litres per person perday because of the introduction of higher prices (50). In contrast, watertariffs in Albania are very low, and this has been identified as a factor in
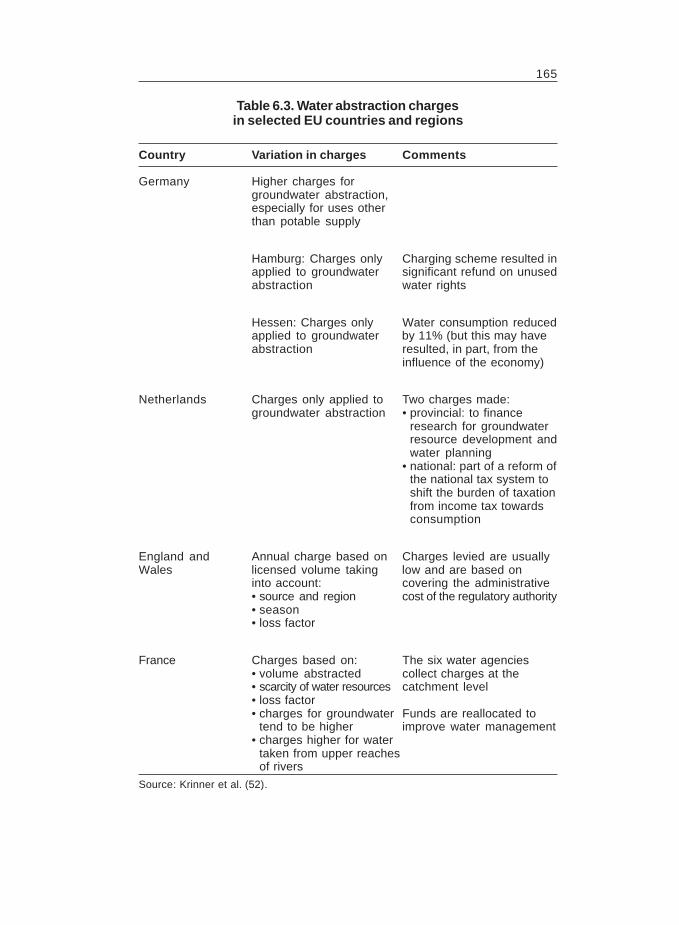
165
Country Variation in charges Comments
Germany Higher charges forgroundwater abstraction,especially for uses otherthan potable supply
Hamburg: Charges only Charging scheme resulted inapplied to groundwater significant refund on unusedabstraction water rights
Hessen: Charges only Water consumption reducedapplied to groundwater by 11% (but this may haveabstraction resulted, in part, from the
influence of the economy)
Netherlands Charges only applied to Two charges made:groundwater abstraction • provincial: to finance
research for groundwaterresource development andwater planning
• national: part of a reform ofthe national tax system toshift the burden of taxationfrom income tax towardsconsumption
England and Annual charge based on Charges levied are usuallyWales licensed volume taking low and are based on
into account: covering the administrative• source and region cost of the regulatory authority• season• loss factor
France Charges based on: The six water agencies• volume abstracted collect charges at the• scarcity of water resources catchment level• loss factor• charges for groundwater Funds are reallocated to
tend to be higher improve water management• charges higher for water
taken from upper reachesof rivers
Table 6.3. Water abstraction chargesin selected EU countries and regions
Source: Krinner et al. (52).
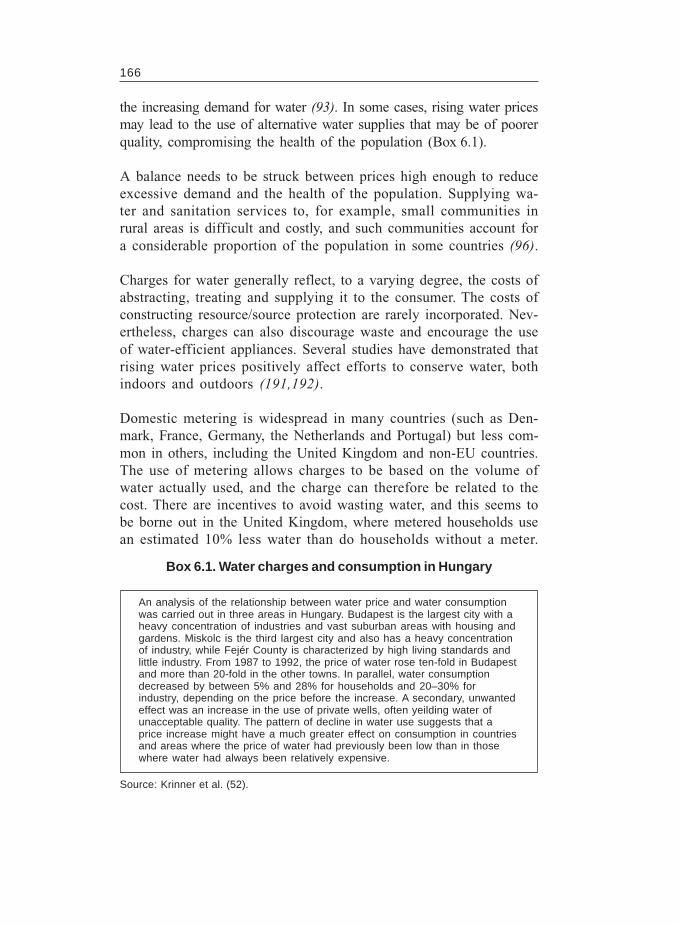
166
the increasing demand for water (93). In some cases, rising water pricesmay lead to the use of alternative water supplies that may be of poorerquality, compromising the health of the population (Box 6.1).
A balance needs to be struck between prices high enough to reduceexcessive demand and the health of the population. Supplying wa-ter and sanitation services to, for example, small communities inrural areas is difficult and costly, and such communities account fora considerable proportion of the population in some countries (96).
Charges for water generally reflect, to a varying degree, the costs ofabstracting, treating and supplying it to the consumer. The costs ofconstructing resource/source protection are rarely incorporated. Nev-ertheless, charges can also discourage waste and encourage the useof water-efficient appliances. Several studies have demonstrated thatrising water prices positively affect efforts to conserve water, bothindoors and outdoors (191,192).
Domestic metering is widespread in many countries (such as Den-mark, France, Germany, the Netherlands and Portugal) but less com-mon in others, including the United Kingdom and non-EU countries.The use of metering allows charges to be based on the volume ofwater actually used, and the charge can therefore be related to thecost. There are incentives to avoid wasting water, and this seems tobe borne out in the United Kingdom, where metered households usean estimated 10% less water than do households without a meter.
An analysis of the relationship between water price and water consumptionwas carried out in three areas in Hungary. Budapest is the largest city with aheavy concentration of industries and vast suburban areas with housing andgardens. Miskolc is the third largest city and also has a heavy concentrationof industry, while Fejér County is characterized by high living standards andlittle industry. From 1987 to 1992, the price of water rose ten-fold in Budapestand more than 20-fold in the other towns. In parallel, water consumptiondecreased by between 5% and 28% for households and 20–30% forindustry, depending on the price before the increase. A secondary, unwantedeffect was an increase in the use of private wells, often yeilding water ofunacceptable quality. The pattern of decline in water use suggests that aprice increase might have a much greater effect on consumption in countriesand areas where the price of water had previously been low than in thosewhere water had always been relatively expensive.
Source: Krinner et al. (52).
Box 6.1. Water charges and consumption in Hungary
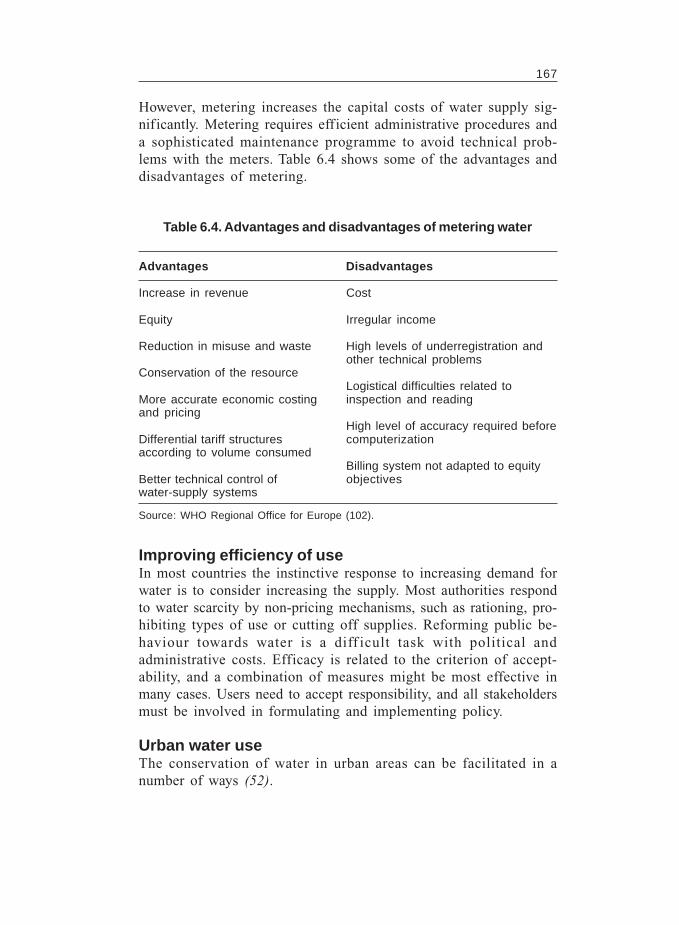
167
However, metering increases the capital costs of water supply sig-nificantly. Metering requires efficient administrative procedures anda sophisticated maintenance programme to avoid technical prob-lems with the meters. Table 6.4 shows some of the advantages anddisadvantages of metering.
Advantages Disadvantages
Increase in revenue Cost
Equity Irregular income
Reduction in misuse and waste High levels of underregistration andother technical problems
Conservation of the resourceLogistical difficulties related to
More accurate economic costing inspection and readingand pricing
High level of accuracy required beforeDifferential tariff structures computerizationaccording to volume consumed
Billing system not adapted to equityBetter technical control of objectiveswater-supply systems
Table 6.4. Advantages and disadvantages of metering water
Source: WHO Regional Office for Europe (102).
Improving efficiency of useIn most countries the instinctive response to increasing demand forwater is to consider increasing the supply. Most authorities respondto water scarcity by non-pricing mechanisms, such as rationing, pro-hibiting types of use or cutting off supplies. Reforming public be-haviour towards water is a diff icult task with political andadministrative costs. Efficacy is related to the criterion of accept-ability, and a combination of measures might be most effective inmany cases. Users need to accept responsibility, and all stakeholdersmust be involved in formulating and implementing policy.
Urban water useThe conservation of water in urban areas can be facilitated in anumber of ways (52).
168
� Infrastructure programmes. Losses from the distribution systemare reduced by improving the network, repairing weak points orinstalling measuring devices.
� Programmes to improve efficiency. Water consumption is loweredby technically modifying installations, such as by improving sani-tary equipment and designing public and private gardens in away that allows water demand to be reduced.
� Substitution programmes. Alternative sources of water are foundfor uses other than drinking, rather than supplying drinking-water from the public network.
� Water conservation programmes. Water consumption is reducedthrough user education, public awareness, tariff systems and in-formation campaigns.
� Management programmes. These comprise municipal regulations,tariff systems, commercial incentives and discounts for economicwater use, hydraulic audits, and loans and subsidies for improve-ment measures.
Various countries have used combinations of these measures(Box 6.2), which contributes to the expectation that water demandin much of the WHO European Region will stabilize or decline.
Agricultural water useThe main use of water for agriculture in the WHO European Regionis for irrigation, and this comprises a significant proportion of thetotal demand in some countries. Some irrigation systems are small-scale, belonging to and managed by an individual farm. The de-mand for groundwater may be reduced in these cases by constructingindividual reservoirs to store winter rainfall, which can then be usedfor irrigation during the summer. Farmers in south-eastern Englandare increasingly following this approach.
Large-scale irrigation systems may include storage reservoirs andmajor canal distribution networks, and their administration often in-volves public bodies. The efficiency of water use differs greatlyamong irrigation systems, for example between earth canals and
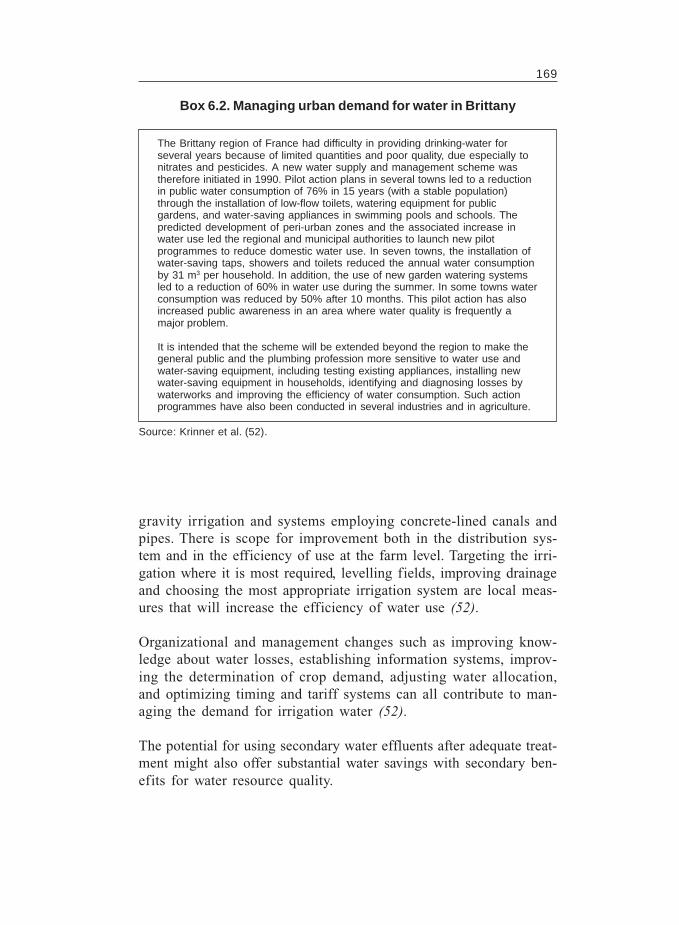
169
The Brittany region of France had difficulty in providing drinking-water forseveral years because of limited quantities and poor quality, due especially tonitrates and pesticides. A new water supply and management scheme wastherefore initiated in 1990. Pilot action plans in several towns led to a reductionin public water consumption of 76% in 15 years (with a stable population)through the installation of low-flow toilets, watering equipment for publicgardens, and water-saving appliances in swimming pools and schools. Thepredicted development of peri-urban zones and the associated increase inwater use led the regional and municipal authorities to launch new pilotprogrammes to reduce domestic water use. In seven towns, the installation ofwater-saving taps, showers and toilets reduced the annual water consumptionby 31 m3 per household. In addition, the use of new garden watering systemsled to a reduction of 60% in water use during the summer. In some towns waterconsumption was reduced by 50% after 10 months. This pilot action has alsoincreased public awareness in an area where water quality is frequently amajor problem.
It is intended that the scheme will be extended beyond the region to make thegeneral public and the plumbing profession more sensitive to water use andwater-saving equipment, including testing existing appliances, installing newwater-saving equipment in households, identifying and diagnosing losses bywaterworks and improving the efficiency of water consumption. Such actionprogrammes have also been conducted in several industries and in agriculture.
Source: Krinner et al. (52).
Box 6.2. Managing urban demand for water in Brittany
gravity irrigation and systems employing concrete-lined canals andpipes. There is scope for improvement both in the distribution sys-tem and in the efficiency of use at the farm level. Targeting the irri-gation where it is most required, levelling fields, improving drainageand choosing the most appropriate irrigation system are local meas-ures that will increase the efficiency of water use (52).
Organizational and management changes such as improving know-ledge about water losses, establishing information systems, improv-ing the determination of crop demand, adjusting water allocation,and optimizing timing and tariff systems can all contribute to man-aging the demand for irrigation water (52).
The potential for using secondary water effluents after adequate treat-ment might also offer substantial water savings with secondary ben-efits for water resource quality.
170
Industrial water useThe mechanisms to reduce demand for water by industry are similarto those that apply to urban water supply, and improving infrastruc-ture and reducing consumption by increasing efficiency and tariffscan thus be beneficial. Recycling and reusing water are important insaving water in industry.
Legal and regulatory frameworks and economic incentives are themeasures that are likely to achieve the most success in reducing theindustrial demand for water. In addition, programmes aimed at pro-moting water reuse and recycling can lead to major savings. Ration-alizing production in larger units also tends to reduce the consumptionof water per product unit (52).
QUALITY MANAGEMENT
Water pollution controlHigh-quality drinking-water demands that the contamination of sourcewater is avoided. Source protection is often less expensive and morereliable than treatment, and is universally relevant to providing safedrinking-water. In other areas, where advanced treatment is possible,high-quality source water reduces the cost of providing drinking-water.
Many countries in the WHO European Region identify the problemof poor protection of source water from contamination by agricul-tural activities and industrial or domestic discharges, resulting inmicrobial or chemical contamination. Both surface water andgroundwater are regarded as poorly protected in Sweden; in Hun-gary, shallow aquifers and bank-filtered supplies are considered par-ticularly vulnerable.
Various measures can be used to prevent microbial and chemicalpollution of water resources from both diffuse and point sources,but financial or regulatory incentives may be necessary to ensuretheir implementation.
Agricultural pollutionAgriculture is carried out over much of Europe’s land mass, andagricultural land constitutes an extensive area that is a potentially
171
diffuse source of chemical and microbial pollution. The intensifica-tion of agriculture that occurred in the middle decades of the 20thcentury was encouraged in EU countries by the common agricul-tural policy, which continues to subsidize production and has sub-stantially increased agricultural production in the EU.
The common agricultural policy was revised in 1992 and produc-tion-based subsidies were replaced with direct grants related, for ex-ample, to cultivated area. Payments for land to be taken out ofproduction (set aside) were also introduced as an incentive to re-duce the intensiveness of agriculture. In addition, a number of otherEU environmental schemes related to agriculture are specific incen-tives to prevent the pollution of water bodies.
The cost of agrochemicals and the economic situation of a country aremajor determinants of the cost–effectiveness and extent of use ofagrochemicals. Taxation or levies on the purchase of pesticides andinorganic fertilizers are another potential management tool. Paymentsfor conversion to organic agriculture are available in some Europeancountries. The economic balance of organic farms is frequently goodbecause of reduced expenditure on agrochemicals and, in some cases,better prices for the product. Cooperation between water supply agen-cies and farmers in Germany has supported this trend (37).
A change of attitude and community awareness of quality criteriaand the ecological effects of products are important in controllingpollution. Governments can use a wide array of measures to encour-age this, such as training and advising farmers, conducting “eco-audits” on products, subsidizing the setting aside of land, providingsubsidies or tax exemptions during periods of transition to organicfarming, imposing pollution taxes, and enacting legislation to en-force water protection (37).
PesticidesAvoiding the direct spraying of pesticides on to bodies of water is abasic precaution in avoiding contamination. Except for those usedto control aquatic weeds or insects, pesticides should not be used ina way that makes contamination of water likely. The conditions ofuse for some pesticides approved in the EU impose a minimum dis-tance between spraying operations and water. Establishing protection
172
zones around the water sources and regulating practices allowed orprohibited within these zones will reduce the likelihood of contami-nation. In the Netherlands it is predicted that this method, along withmeasures to reduce atmospheric deposition and leaching, will re-duce water pollution by pesticides by 70–90%.
Reduced pesticide use will result in a lower potential for run-off andleaching. Application rates can sometimes be reduced, without com-promising efficacy, by improved application methods such as low-volume spraying and placement applications.
Integrated pest management allows pests to be controlled with fewerchemicals, by integrating a number of pest control techniques. Inte-grated pest management methods include using crop varieties thatare resistant to pests and encouraging populations of beneficial in-sects that prey on crop pests. Cultivation methods that reduce theneed for pesticides, such as the use of reduced sowing rates to re-duce the incidence of fungal diseases, are also used.
FertilizersCodes of good agricultural practice have been developed in manycountries, and most include recommendations designed to reducethe potential for leaching of nutrients from fertilizers. Recommendedmeasures include (33):
� timing fertilizer applications to avoid high-risk times such as au-tumn, winter and before heavy rainfall;
� applying fertilizers when uptake by the crop is greatest;� measuring the nutrient balance of the field to allow an informed
assessment of the fertilizer required;� using cover crops during winter months to fix soil nitrogen and
cover bare soil;� using straw fertilization during the winter, as carbon-rich sub-
stances in the straw tend to immobilize the soluble soil nitrogen;� limiting irrigation during high-risk periods;� using appropriate methods and timing of tillage;� rotating crops; and� observing buffer zones alongside watercourses, preferably
planted or overgrown, to take up nutrients and reduce surfacewater contamination.
173
Animal husbandryAs with agricultural chemicals, the spreading of animal wastes on toland should be timed to minimize the likelihood of run-off and leach-ing of nutrients and microorganisms. Using less dense stocking regimes(“extensive” farming) alongside watercourses is a measure designed toreduce the contamination of surface water by animal faeces.
Many animal feeds contain concentrations of nutrients that are higherthan required by the animals and the excess, rather than being as-similated, is excreted. Optimizing the nutrient content of feeds is anapproach that may contribute to successfully reducing the nutrientsreaching surface water and causing problems of eutrophication.
Economic instruments
AgricultureSeveral countries have introduced tariffs and incentives to encour-age the use of farming methods that reduce the potential for con-tamination of water sources by agricultural chemicals or animal wastes(Boxes 6.3 and 6.4). Prosecution in the case of contamination andincentive schemes to encourage less intensive and/or organic farm-ing are some examples.
Industrial contaminationRegulatory powers and economic incentives are required to reducethe contamination of water resources by industrial activities. Manycountries make charges for the discharge of industrial effluent bothto sewers and to surface waters and, in EU countries, the dischargeof industrial wastewater to surface waters requires a permit from aregulatory body. The permit takes into account the amount and tox-icity of the contaminants contained in the wastewater. However, thecharges levied may not always reflect these factors, and the effluentcharging schemes applied in the different EU countries vary widely(Table 6.5).
LOCAL MANAGEMENT
In most countries, local (municipal) authorities are responsible foroperating and managing the water supply. In a few countries, notably
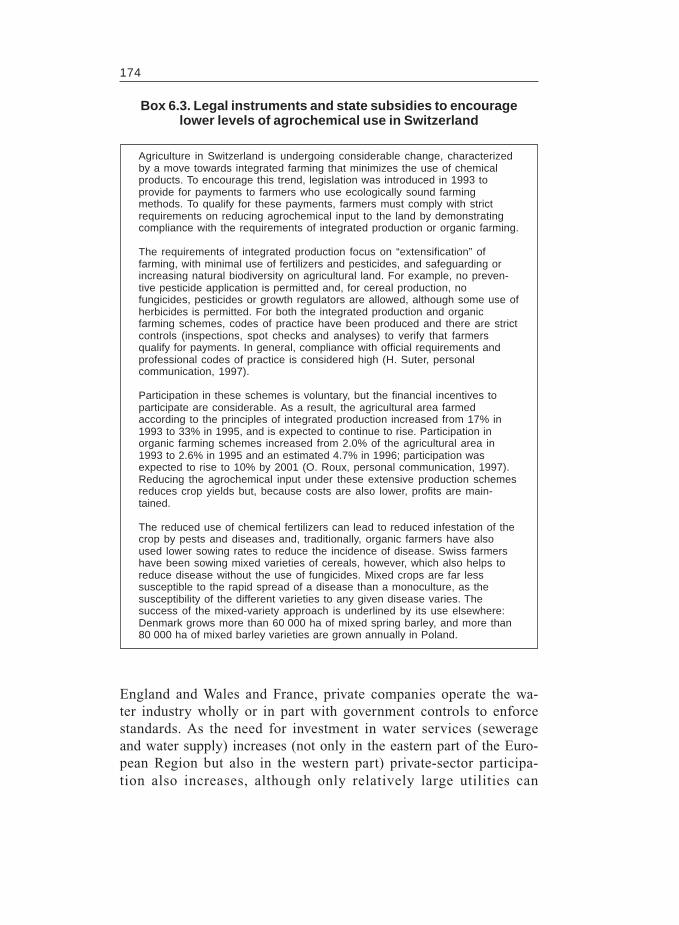
174
Agriculture in Switzerland is undergoing considerable change, characterizedby a move towards integrated farming that minimizes the use of chemicalproducts. To encourage this trend, legislation was introduced in 1993 toprovide for payments to farmers who use ecologically sound farmingmethods. To qualify for these payments, farmers must comply with strictrequirements on reducing agrochemical input to the land by demonstratingcompliance with the requirements of integrated production or organic farming.
The requirements of integrated production focus on “extensification” offarming, with minimal use of fertilizers and pesticides, and safeguarding orincreasing natural biodiversity on agricultural land. For example, no preven-tive pesticide application is permitted and, for cereal production, nofungicides, pesticides or growth regulators are allowed, although some use ofherbicides is permitted. For both the integrated production and organicfarming schemes, codes of practice have been produced and there are strictcontrols (inspections, spot checks and analyses) to verify that farmersqualify for payments. In general, compliance with official requirements andprofessional codes of practice is considered high (H. Suter, personalcommunication, 1997).
Participation in these schemes is voluntary, but the financial incentives toparticipate are considerable. As a result, the agricultural area farmedaccording to the principles of integrated production increased from 17% in1993 to 33% in 1995, and is expected to continue to rise. Participation inorganic farming schemes increased from 2.0% of the agricultural area in1993 to 2.6% in 1995 and an estimated 4.7% in 1996; participation wasexpected to rise to 10% by 2001 (O. Roux, personal communication, 1997).Reducing the agrochemical input under these extensive production schemesreduces crop yields but, because costs are also lower, profits are main-tained.
The reduced use of chemical fertilizers can lead to reduced infestation of thecrop by pests and diseases and, traditionally, organic farmers have alsoused lower sowing rates to reduce the incidence of disease. Swiss farmershave been sowing mixed varieties of cereals, however, which also helps toreduce disease without the use of fungicides. Mixed crops are far lesssusceptible to the rapid spread of a disease than a monoculture, as thesusceptibility of the different varieties to any given disease varies. Thesuccess of the mixed-variety approach is underlined by its use elsewhere:Denmark grows more than 60 000 ha of mixed spring barley, and more than80 000 ha of mixed barley varieties are grown annually in Poland.
Box 6.3. Legal instruments and state subsidies to encouragelower levels of agrochemical use in Switzerland
England and Wales and France, private companies operate the wa-ter industry wholly or in part with government controls to enforcestandards. As the need for investment in water services (sewerageand water supply) increases (not only in the eastern part of the Euro-pean Region but also in the western part) private-sector participa-tion also increases, although only relatively large utilities can
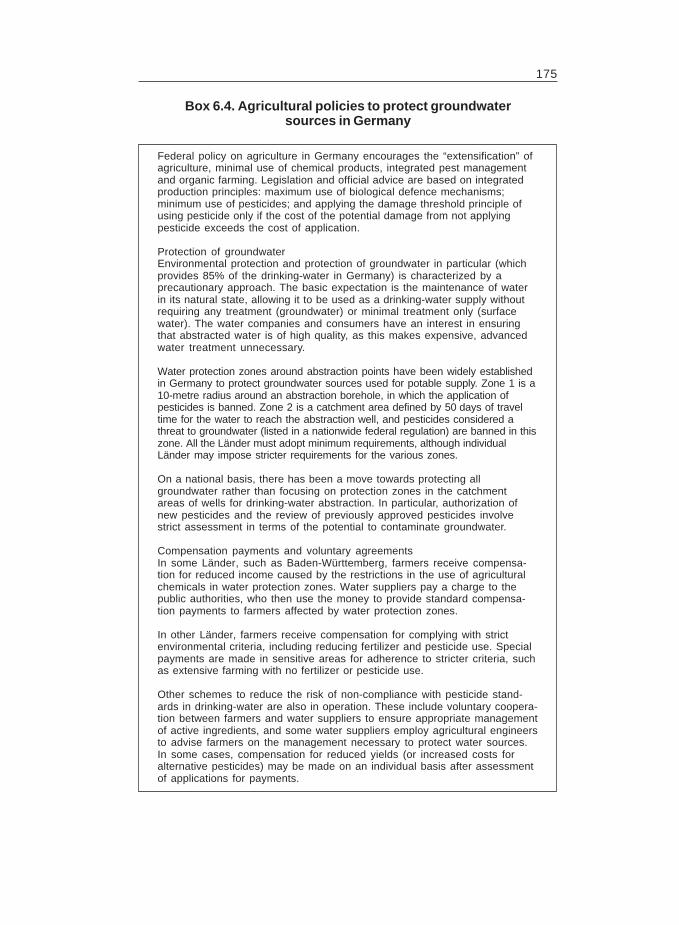
175
Federal policy on agriculture in Germany encourages the “extensification” ofagriculture, minimal use of chemical products, integrated pest managementand organic farming. Legislation and official advice are based on integratedproduction principles: maximum use of biological defence mechanisms;minimum use of pesticides; and applying the damage threshold principle ofusing pesticide only if the cost of the potential damage from not applyingpesticide exceeds the cost of application.
Protection of groundwaterEnvironmental protection and protection of groundwater in particular (whichprovides 85% of the drinking-water in Germany) is characterized by aprecautionary approach. The basic expectation is the maintenance of waterin its natural state, allowing it to be used as a drinking-water supply withoutrequiring any treatment (groundwater) or minimal treatment only (surfacewater). The water companies and consumers have an interest in ensuringthat abstracted water is of high quality, as this makes expensive, advancedwater treatment unnecessary.
Water protection zones around abstraction points have been widely establishedin Germany to protect groundwater sources used for potable supply. Zone 1 is a10-metre radius around an abstraction borehole, in which the application ofpesticides is banned. Zone 2 is a catchment area defined by 50 days of traveltime for the water to reach the abstraction well, and pesticides considered athreat to groundwater (listed in a nationwide federal regulation) are banned in thiszone. All the Länder must adopt minimum requirements, although individualLänder may impose stricter requirements for the various zones.
On a national basis, there has been a move towards protecting allgroundwater rather than focusing on protection zones in the catchmentareas of wells for drinking-water abstraction. In particular, authorization ofnew pesticides and the review of previously approved pesticides involvestrict assessment in terms of the potential to contaminate groundwater.
Compensation payments and voluntary agreementsIn some Länder, such as Baden-Württemberg, farmers receive compensa-tion for reduced income caused by the restrictions in the use of agriculturalchemicals in water protection zones. Water suppliers pay a charge to thepublic authorities, who then use the money to provide standard compensa-tion payments to farmers affected by water protection zones.
In other Länder, farmers receive compensation for complying with strictenvironmental criteria, including reducing fertilizer and pesticide use. Specialpayments are made in sensitive areas for adherence to stricter criteria, suchas extensive farming with no fertilizer or pesticide use.
Other schemes to reduce the risk of non-compliance with pesticide stand-ards in drinking-water are also in operation. These include voluntary coopera-tion between farmers and water suppliers to ensure appropriate managementof active ingredients, and some water suppliers employ agricultural engineersto advise farmers on the management necessary to protect water sources.In some cases, compensation for reduced yields (or increased costs foralternative pesticides) may be made on an individual basis after assessmentof applications for payments.
Box 6.4. Agricultural policies to protect groundwatersources in Germany
176
Box 6.4. (contd)
The Munich Water Company pays farmers interim compensation paymentsduring a 3-year transition period to organic farming. The Mangfall Valleysouth-east of Munich was designated as a target area for conversion toorganic farming in 1992–1993, to halt the trend of increasing levels ofpesticides and nitrate fertilizers in groundwater. By 1996, 70% of the agricul-tural land in the area was being farmed organically. The high uptake of thescheme is encouraged by the financial support and advice available, butawareness of the importance of ecological soil protection, especially amongthe younger generation of farmers, is also an important factor (Munich WaterCompany, unpublished data). A cooperative has been formed to market theorganic produce, using promotional slogans such as “one litre of organic milkcontributes to protecting 4000 litres of Munich’s drinking-water”.
Since the scheme started, nitrate levels in groundwater, formerly 14 mg/l,have decreased by about 14%, and pesticides are not detected at levels thatwould violate national drinking-water standards.
normally attract private investment. When international funding agen-cies contribute significantly to investment, they also apply pressureto get the services more effectively managed and to impose realisticcharges on the users, thereby promoting private investment and op-eration of the utilities.
The water industry in England and Wales is the only example inEurope of complete privatization. Water service companies coverwater supply and sewerage services for entire river basin catchments,except for some smaller water companies operating within thesecatchments. These companies wholly own the facilities. Local au-thorities have some involvement in supervising the service and deal-ing with consumer complaints, but the main supervision iscentralized, with the Drinking Water Inspectorate overseeing com-pliance with quality standards. The companies analyse their ownwater quality (self-monitoring), but the Drinking Water Inspectoratestrictly supervises this.
In France, 50% of wastewater treatment plants are privately oper-ated, and private water companies supply 60% of consumers. Withthe exception of the Paris water supply company and sewerage ser-vices, which the municipal authority wholly owns and manages, theremainder are numerous, mainly small, community services man-aged directly by local councils or by syndicates of several munici-palities. Rural areas still have many individual private suppliers.
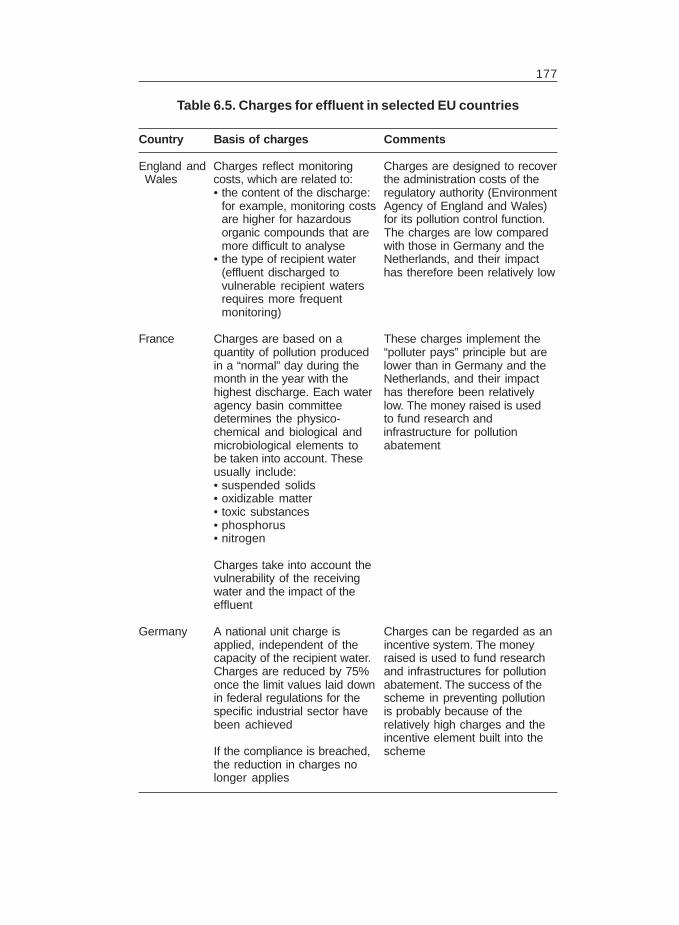
177
Country Basis of charges Comments
England and Charges reflect monitoring Charges are designed to recoverWales costs, which are related to: the administration costs of the
• the content of the discharge: regulatory authority (Environmentfor example, monitoring costs Agency of England and Wales)are higher for hazardous for its pollution control function.organic compounds that are The charges are low comparedmore difficult to analyse with those in Germany and the
• the type of recipient water Netherlands, and their impact(effluent discharged to has therefore been relatively lowvulnerable recipient watersrequires more frequentmonitoring)
France Charges are based on a These charges implement thequantity of pollution produced “polluter pays” principle but arein a “normal” day during the lower than in Germany and themonth in the year with the Netherlands, and their impacthighest discharge. Each water has therefore been relativelyagency basin committee low. The money raised is useddetermines the physico- to fund research andchemical and biological and infrastructure for pollutionmicrobiological elements to abatementbe taken into account. Theseusually include:• suspended solids• oxidizable matter• toxic substances• phosphorus• nitrogen
Charges take into account thevulnerability of the receivingwater and the impact of theeffluent
Germany A national unit charge is Charges can be regarded as anapplied, independent of the incentive system. The moneycapacity of the recipient water. raised is used to fund researchCharges are reduced by 75% and infrastructures for pollutiononce the limit values laid down abatement. The success of thein federal regulations for the scheme in preventing pollutionspecific industrial sector have is probably because of thebeen achieved relatively high charges and the
incentive element built into theIf the compliance is breached, schemethe reduction in charges no longer applies
Table 6.5. Charges for effluent in selected EU countries
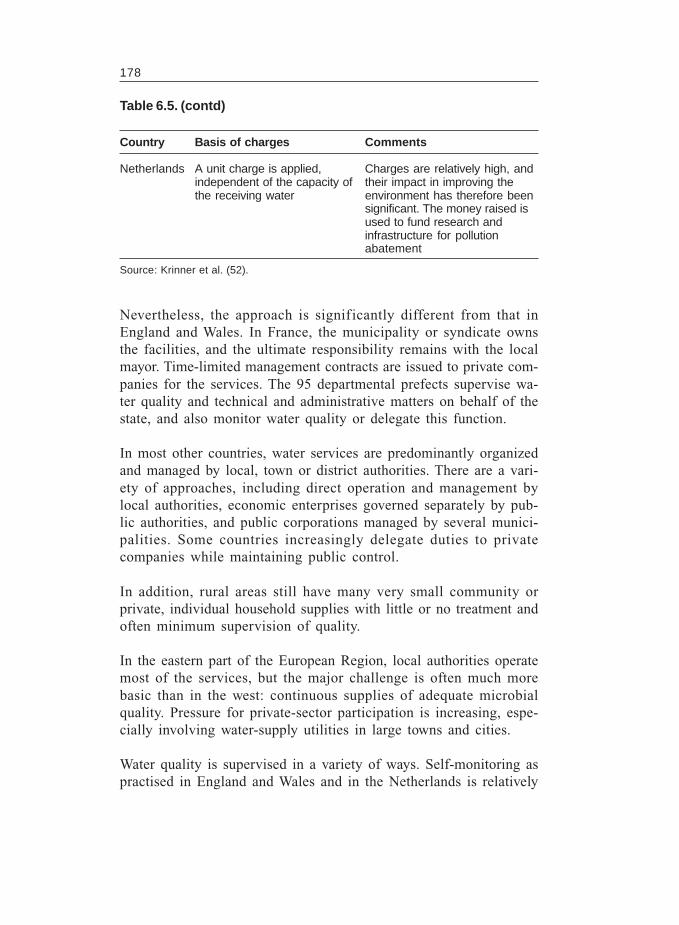
178
Table 6.5. (contd)
Country Basis of charges Comments
Netherlands A unit charge is applied, Charges are relatively high, andindependent of the capacity of their impact in improving thethe receiving water environment has therefore been
significant. The money raised isused to fund research andinfrastructure for pollutionabatement
Source: Krinner et al. (52).
Nevertheless, the approach is significantly different from that inEngland and Wales. In France, the municipality or syndicate ownsthe facilities, and the ultimate responsibility remains with the localmayor. Time-limited management contracts are issued to private com-panies for the services. The 95 departmental prefects supervise wa-ter quality and technical and administrative matters on behalf of thestate, and also monitor water quality or delegate this function.
In most other countries, water services are predominantly organizedand managed by local, town or district authorities. There are a vari-ety of approaches, including direct operation and management bylocal authorities, economic enterprises governed separately by pub-lic authorities, and public corporations managed by several munici-palities. Some countries increasingly delegate duties to privatecompanies while maintaining public control.
In addition, rural areas still have many very small community orprivate, individual household supplies with little or no treatment andoften minimum supervision of quality.
In the eastern part of the European Region, local authorities operatemost of the services, but the major challenge is often much morebasic than in the west: continuous supplies of adequate microbialquality. Pressure for private-sector participation is increasing, espe-cially involving water-supply utilities in large towns and cities.
Water quality is supervised in a variety of ways. Self-monitoring aspractised in England and Wales and in the Netherlands is relatively
179
rare; government health laboratories or other government-appointedlaboratories more typically carry this out. These laboratories are notalways the best equipped or resourced to deal with the considerabletechnical demands of the full range of water quality analyses. Forexample, the EU Drinking Water Directive (48) and the WHO guide-lines for drinking-water quality (46) prescribe low concentrations oforganic contaminants. In addition, the laboratories are often poorlyequipped to assess, interpret and report on issues related to accessand continuity. These problems have been recognized in some in-stances. In Germany, for example, the authorities certify some labo-ratories of water suppliers to analyse compliance on their behalf,but the laboratories are only permitted to monitor the compliance ofother water suppliers and not their own.
The organizational arrangements aimed at ensuring compliance withthe requirements of legislation, standards or codes of practice mustprovide for surveillance to be shared between the water-supplyagency and a separate, preferably independent, surveillance agency.The water-supply agency carries out routine testing and monitoring(quality control) and the surveillance agency separate checking andtesting. Both types of testing should be applied to all types of wateravailable to the community.
The surveillance agency should be established with national sup-port and operate at the central, regional and local levels. It should beconcerned with the public health aspects of drinking-water suppliesand have overall responsibility for ensuring that all such suppliesunder its jurisdiction are free from health hazards. To this end, peri-odic sanitary inspections and analyses of water samples should becarried out to ensure that the suppliers are fulfilling their responsi-bilities.
COSTS AND BENEFITS
Many economic consequences follow from the quality of water andsanitation facilities available in a country. Improvements in the levelof service will lead to improved health but also involve a cost, as thefunds devoted to improving water and sanitation are not availablefor other purposes. Costs can be viewed from many perspectives,
180
depending on who incurs the costs and who pays them – the peoplewho directly benefit or lose, their families, the health care system orsociety generally. Reductions in disease produce benefits, primarilybut not exclusively by avoiding such costs. Water supply and sani-tation services also accrue non-health-related costs and benefits suchas convenience and time saved and increased employment.
Whether, to what extent and how rapidly interventions to improvewater supply and sanitation conditions should be pursued dependson the costs of such interventions and the consequent benefits, aswell as the importance society places on averting avoidable healtheffects and on the convenience provided by high-quality services.Ignorance of how poor water supply and sanitation systems lead tohealth and other problems increases the risk of inadequate invest-ment. The balance of costs and benefits differs according to localconditions. One consequence of programmes to control and pre-vent water-related disease across the European Region could be anarrowing of the gap between countries in the western and easternparts of the Region. Nevertheless, the western part of the Regionstill has a significant burden of disease, and this should not be ig-nored. In Sweden, for example, 90 water-related disease outbreaks,mainly caused by Campylobacter spp. and leading to 50 000 casesand two deaths, were reported between 1980 and 1995 (193).
Substantial problems exist in obtaining reliable data, and estimatesof costs and benefits are necessarily broad approximations. For thepurposes of analysing the issues, the European Region can be splitinto an eastern and a western part, with the eastern part including thecountries of central and eastern Europe and the newly independentstates.
Cost models were developed to predict the annual cost of improvingwater and sanitation service provision to levels consistent with thosein the western part of the Region. Cost estimates were based on:
• the existing level of coverage as reported in data on the percent-age of the population with a home water supply (access to waterwithin 200 m of the home) and hygienic sanitation (any systemthat effectively breaks faecal–oral transmission);
• the proportion of existing services that might need to be upgraded;
181
• the demographic characteristics of the population (degree of ur-banization); and
• the characteristics of the investment needed, including level oftreatment and other factors.
These calculations are necessarily coarse approximations and arelikely to overestimate actual costs because they are engineering-basedcalculations that ignore more cost-effective local solutions. They arealso supply-side costs and ignore what can be achieved by moreeffectively managing water resources and improving health educa-tion. They are blanket measures that ignore cost savings that may beachieved through targeting. The estimated annual costs for the east-ern part of the WHO European Region are about 30–50 per per-son. In all regions except the central Asian republics, these costs area small proportion (1–2%) of gross domestic product.
From a socioeconomic perspective, the net costs (costs net of anysubsequent benefits) are important. The above gross costs overesti-mate the actual societal costs of the interventions in several ways.First, from a societal perspective they are relevant only if they re-flect opportunity costs. The degree of under-utilization of resourcesin the eastern part of the Region (especially labour) means that theopportunity costs are lower. Second, benefits (some of which can bequantified) offset the estimated costs. The quantifiable benefits in-clude a reduced burden of disease to individuals and society. Froma societal perspective, the health benefits need to be valued at whatsociety is willing to pay to secure them (generally measured as thesum of individual willingness to pay). In the absence of primaryresearch on the value society attaches to reducing the level of water-related disease, less accurate empirical methods need to be employed.The most common form of assessment is the cost-of-illness approach.This method attempts to assess the economic implications of dis-ease morbidity and mortality in terms of the costs of the resourceslost or required to deal with the disease. Table 6.6 summarizes infor-mation from over 25 studies on the economic burden associatedwith common water-related diseases.
The studies vary widely in their perspectives, many being based onthe evaluation of immunization efficacy or on post-outbreak evalua-tion of resource costs. Few of the studies are based directly on collated
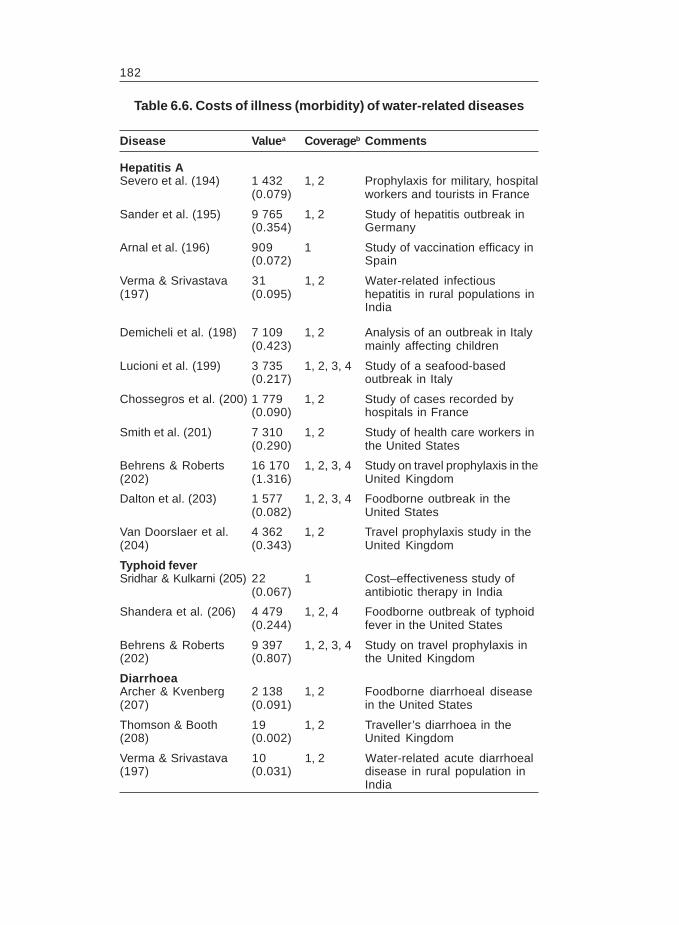
182
Disease Valuea Coverageb Comments
Hepatitis ASevero et al. (194) 1 432 1, 2 Prophylaxis for military, hospital
(0.079) workers and tourists in France
Sander et al. (195) 9 765 1, 2 Study of hepatitis outbreak in(0.354) Germany
Arnal et al. (196) 909 1 Study of vaccination efficacy in(0.072) Spain
Verma & Srivastava 31 1, 2 Water-related infectious(197) (0.095) hepatitis in rural populations in
India
Demicheli et al. (198) 7 109 1, 2 Analysis of an outbreak in Italy(0.423) mainly affecting children
Lucioni et al. (199) 3 735 1, 2, 3, 4 Study of a seafood-based(0.217) outbreak in Italy
Chossegros et al. (200) 1 779 1, 2 Study of cases recorded by(0.090) hospitals in France
Smith et al. (201) 7 310 1, 2 Study of health care workers in(0.290) the United States
Behrens & Roberts 16 170 1, 2, 3, 4 Study on travel prophylaxis in the(202) (1.316) United Kingdom
Dalton et al. (203) 1 577 1, 2, 3, 4 Foodborne outbreak in the(0.082) United States
Van Doorslaer et al. 4 362 1, 2 Travel prophylaxis study in the(204) (0.343) United Kingdom
Typhoid feverSridhar & Kulkarni (205) 22 1 Cost–effectiveness study of
(0.067) antibiotic therapy in India
Shandera et al. (206) 4 479 1, 2, 4 Foodborne outbreak of typhoid(0.244) fever in the United States
Behrens & Roberts 9 397 1, 2, 3, 4 Study on travel prophylaxis in(202) (0.807) the United Kingdom
DiarrhoeaArcher & Kvenberg 2 138 1, 2 Foodborne diarrhoeal disease(207) (0.091) in the United States
Thomson & Booth 19 1, 2 Traveller’s diarrhoea in the(208) (0.002) United Kingdom
Verma & Srivastava 10 1, 2 Water-related acute diarrhoeal(197) (0.031) disease in rural population in
India
Table 6.6. Costs of illness (morbidity) of water-related diseases
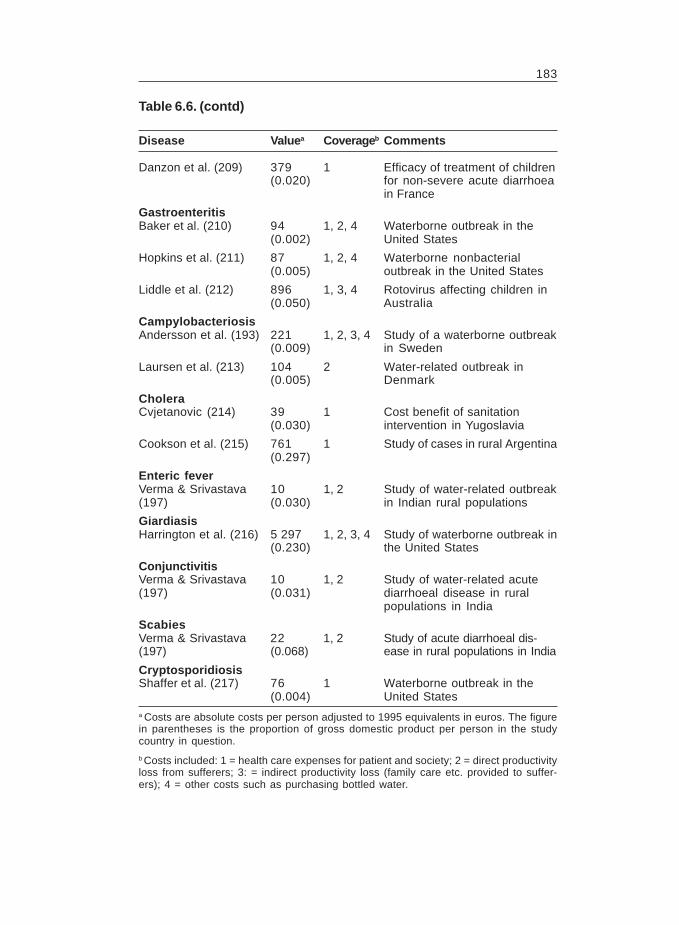
183
Table 6.6. (contd)
Disease Valuea Coverageb Comments
Danzon et al. (209) 379 1 Efficacy of treatment of children(0.020) for non-severe acute diarrhoea
in France
GastroenteritisBaker et al. (210) 94 1, 2, 4 Waterborne outbreak in the
(0.002) United States
Hopkins et al. (211) 87 1, 2, 4 Waterborne nonbacterial(0.005) outbreak in the United States
Liddle et al. (212) 896 1, 3, 4 Rotovirus affecting children in(0.050) Australia
CampylobacteriosisAndersson et al. (193) 221 1, 2, 3, 4 Study of a waterborne outbreak
(0.009) in Sweden
Laursen et al. (213) 104 2 Water-related outbreak in(0.005) Denmark
CholeraCvjetanovic (214) 39 1 Cost benefit of sanitation
(0.030) intervention in Yugoslavia
Cookson et al. (215) 761 1 Study of cases in rural Argentina(0.297)
Enteric feverVerma & Srivastava 10 1, 2 Study of water-related outbreak(197) (0.030) in Indian rural populations
GiardiasisHarrington et al. (216) 5 297 1, 2, 3, 4 Study of waterborne outbreak in
(0.230) the United States
ConjunctivitisVerma & Srivastava 10 1, 2 Study of water-related acute(197) (0.031) diarrhoeal disease in rural
populations in India
ScabiesVerma & Srivastava 22 1, 2 Study of acute diarrhoeal dis-(197) (0.068) ease in rural populations in India
CryptosporidiosisShaffer et al. (217) 76 1 Waterborne outbreak in the
(0.004) United Statesa Costs are absolute costs per person adjusted to 1995 equivalents in euros. The figurein parentheses is the proportion of gross domestic product per person in the studycountry in question.
b Costs included: 1 = health care expenses for patient and society; 2 = direct productivityloss from sufferers; 3: = indirect productivity loss (family care etc. provided to suffer-ers); 4 = other costs such as purchasing bottled water.
184
information on costs from individuals experiencing the disease. Thestudies differ substantially in the costs examined – many are restrictedto health care costs and few treat non-marketed labour satisfactorily.
Despite these deficiencies, however, the studies do indicate the rela-tive burden of the morbidity associated with water-related disease.For the more severe diseases (hepatitis A, typhoid fever and chol-era) the costs are high at about 10–40% of gross domestic productper person. For less severe diseases, such as diarrhoea and gastroen-teritis, the costs are much lower – generally less than 5% of grossdomestic product per person.
Data on the incidence of water-related disease were compiled fromquestionnaires completed by the countries in the WHO EuropeanRegion. Under-reporting is a significant problem because of poorsurveillance systems and, for the less acute diseases, the high numberof cases that do not involve the health care services and hence gounreported. These data, adjusted to reflect unreported cases, havebeen combined with the estimates of the percentage of cases that areconsidered avoidable through water and sanitation improvements,to estimate the number of avoidable cases in each area in the easternpart of the European Region. Estimates of the excess disease associ-ated with poor water supply and sanitation conditions must recog-nize the multiple pathways associated with water-related disease.Given the multiple infection pathway, an estimated 60–80% ofwaterborne disease is avoidable by improving water and sanitation.
These data indicate that more than 30 million cases of water-relateddisease could be avoided annually through water and sanitation in-terventions. Based on the cost-of-illness calculations, the economicburden is estimated at about 25 per person in the eastern part of theEuropean Region. These are the benefits associated with avoiding asmall subset of all water-related disease and do not include the ben-efits associated with other important water-related problems: hy-giene-related diseases such as scabies, pediculosis and conjunctivitis;skin infections, dermatophytes, etc.; and chemical contaminants suchas nitrate, arsenic and lead.
Avoided costs of illness are, however, only one aspect of the healthbenefits of water-supply and sanitation interventions. The estimated
185
costs of illness ignore the social factors associated with the disease.In addition, improvements in the health status of the general popula-tion are likely to positively alter economic conditions at the macro-economic level: for example, by improving educational attendance,future human capital and savings and investment rates, and by at-tracting tourism and investment. Specific disease outbreaks can haveimportant macroeconomic effects. In the Peru cholera epidemic in1991, for example, the lost income from trade and tourism com-prised an estimated 34% of the total costs (218).
Investing in water supply and sanitation will produce benefits overand above those associated directly with health. Individuals also valueimprovements to the conditions and quality of the water supplied,such as the added convenience of a home water connection andfewer restrictions on water use through more continuous supply.Improvements to sanitation will generate environmental benef itsthrough a cleaner environment – raising the quality of the condi-tions under which the water is used for applications other than drink-ing, such as aquaculture, recreation, industrial abstraction andirrigation.
Thus the benefits of improving water supply and sanitation condi-tions in the eastern part of the European Region are probably im-mense. Although the gross costs are also high, given the importanceof the benefits that have not been estimated and the likely overesti-mation of costs, on balance such investments are likely to producesubstantial net benefits. The benefits are likely to increase wherewell targeted and locally effective strategies are pursued.
International, administrativeand legal initiatives
187
7
PROTOCOL ON WATER AND HEALTH TO THE 1992CONVENTION ON THE PROTECTION ANDUSE OF TRANSBOUNDARY WATERCOURSES ANDINTERNATIONAL LAKES
The WHO Regional Office for Europe and the United Nations Eco-nomic Commission for Europe, with the involvement of the UnitedNations Environment Programme and the European Union, devel-oped the Protocol on Water and Health to the 1992 Convention onthe Protection and Use of Transboundary Watercourses and Inter-national Lakes (3).
The Protocol is based on the aims of universal access to drinking-water and sanitation protective of human health and the environ-ment, and of sustainable use of water resources. The aims of theProtocol are:
� universal access to drinking-water� provision of sanitation for everyone� sustainable use of water resources.
To achieve these aims, countries should establish, publish and peri-odically revise national or local targets, ensuring public participa-tion and taking account of: relevant recommendations of internationalbodies; national and local capacities and resources; and available
188
knowledge related to priorities for the improvement of public healthand the protection of the environment, concerning:
� the quality of the drinking-water supplied;� the area of their territory, or the size or proportion of the popula-
tion, that should be served by collective systems for the supplyof drinking-water, or where the supply of drinking-water by othermeans should be improved;
� the area of their territory, or the size or proportion of the popula-tion, that should be served by collective systems of sanitation, orwhere sanitation by other means should be improved;
� the standards of performance to be achieved by these systemsand by other means of water supply and sanitation;
� the application of recognized good practice to the managementof water supply and sanitation;
� the quality of discharge of wastewater to waters within the scopeof the Protocol from wastewater collection systems andwastewater treatment installations;
� the disposal or reuse of sewage sludge from collective systemsof sanitation or other sanitation installations;
� the quality of waters used as a source of drinking-water or forbathing, irrigation, the production of fish by aquaculture and theproduction or harvesting of shellfish;
� the application of recognized good practice to the managementof enclosed waters generally available for bathing; and
� the performance of systems for the management and protectionof water resources, including the application of recognized goodpractice to the control of pollution from sources of all kinds.
International cooperation will be necessary in many cases, and par-ties to the Protocol will be required to assist each other in imple-menting national and local plans. Unexpected events may influencethe quality and quantity of water, and precautionary measures andemergency responses should be considered, including:
� improving the security of water supply by abstraction from dif-ferent water bodies if possible;
� making connections to alternative water supply systems if possible;� ensuring the availability of equipment for water purification and
for the transport of drinking-water from unaffected areas;
189
� ensuring the availability of equipment to assess the quality ofdrinking-water; and
� promoting the storage of bottled water in households.
NATIONAL FRAMEWORKS
National legislation and institutional frameworks vary across the WHOEuropean Region and have changed significantly in the last decadein some countries.
European Union countriesIn most EU countries, national ministries (often the ministry of envi-ronment or ministry of health) are ultimately responsible for enforc-ing the legislation on water resources and supply. Responsibilitymay be shared by two ministries, each covering different aspects ofwater supply. For example, the ministry of the environment may beresponsible for water resources (quality and quantity), abstractionlicences and discharge permits, while the ministry of health or offoods may take responsibility for drinking-water, bathing water andirrigation water. In some federal countries, however, the responsi-bilities are divided between the federal level and the individual states,such as in Germany. In practice, supervision of compliance is oftenfragmented, with much of the responsibility delegated to the regionallevel and more frequently to the local level.
There are some exceptions, however: notably England and Wales,Ireland and the Netherlands, which have centralized controls on watersupply and quality. For England and Wales, where the water indus-try is fully privatized, the Drinking Water Inspectorate supervisescompliance with quality standards of all water companies, the Of-fice of Water Services is in charge of the economic/financial aspectsand consumer interests, and the Department of Environment, Trans-port and the Regions and the Environment Agency of England andWales (with regional offices based on catchment areas) are respon-sible for permits for abstraction and discharge. Similar provisionshave recently been adopted in Ireland to supervise publicly ownedwater suppliers. Similarly, in the Netherlands, although somewhatless centralized in practice, regional public health inspectors super-vise all water service utilities in their respective regions, and one of
190
the inspectors acts as national coordinator to ensure consistency ofapproach throughout the regions.
The EU Drinking Water Directive (47,48) provides the frameworkfor drinking-water quality standards in the EU. The first Directivewas issued in 1980, with member states required to transpose it intonational legislation by 1986. They were required to transpose the newDirective into national legislation by 25 December 2000. Issues of thequality of water resources are covered by a variety of directives (andcorresponding national legislation). Some of these have beenincorporated into the Water Framework Directive, which will aim toestablish a framework for protecting and managing water resources.
Although transposing directives into national legislation and subse-quent implementation, organizing drinking-water supplies and im-plementing institutional mechanisms to control compliance with thestandards vary considerably in the different EU members, there is acommon goal to achieve certain standards. The WHO guidelines fordrinking-water quality (46) are used as the scientific point of depar-ture in setting individual standards.
All current EU members have transposed the 1980 Drinking WaterDirective into national legislation (some albeit with considerabledelay) and other relatively new members, such as Austria, are stilladjusting to the EU requirements. On the whole, the EU standardshave been adopted with minor variation and some additional orstricter national standards in some countries. Many countries stillexperience problems with certain parameters and are still not fullycomplying with monitoring requirements and reporting.
Although the system for monitoring and enforcement of compli-ance in England and Wales has proved effective in raising compli-ance with drinking-water quality standards, the EuropeanCommission has recently challenged the legality of (and started courtaction on) the approach taken by the Drinking Water Inspectorate incases where water companies breach standards without compromis-ing public health. The approach involves the use of legally bindingundertakings, which are improvement programmes agreed betweenthe Drinking Water Inspectorate and water companies, with cleartargets and time limits for achieving these. Many EU members take
191
similar but less formal approaches to enforcement or have, in thepast, issued legislation permitting standards to be exceeded tempo-rarily (such as France and Italy); this clearly contravenes the Drink-ing Water Directive. The Netherlands takes an approach very similarto the enforcement practice of the Drinking Water Inspectorate. Ex-cept for one private operator, water services are directly under pub-lic control; compliance controls are also carried out throughself-monitoring, and the approach to enforcement action taken bypublic health inspectors is much more informal than in England andWales but equally successful in achieving improved compliance.Ironically, the revised EU Drinking Water Directive (48) now sanc-tions an approach similar to that currently practised in England andWales and in the Netherlands.
Gathering and collating information on compliance with the EUDrinking Water Directive are difficult, since few countries publishdetailed annual reports on drinking-water quality. Even where re-ports are produced or data are otherwise available, comparing com-pliance precisely is difficult because data are presented differently:for example, data may be presented in terms of the percentage ofsamples analysed, the population or volume of water supplied, sup-ply regions, or compliance with individual parameters or with allparameters measured.
On the whole, supply is continuous in the EU, except for certainlocalized, seasonal problems resulting from drought. The most fre-quently reported compliance problems in water quality relate to mi-crobial parameters, nitrate, pesticides and sometimes toxic metals.Similar but more severe problems are encountered in countries incentral Europe and particularly in eastern Europe, where supply isstill frequently interrupted.
Consumers in France have successfully sued and have been awardedcompensation from water suppliers breaching water quality stand-ards. Moreover, France’s own public auditing office, the Court desComptes, in a report in 1997 on water service management, criti-cized municipalities, utility companies and the relevant state agen-cies for a lack of transparency, insuff icient competition betweenprivate operators, inadequate information for consumers and a lackof monitoring of delegated public services.
192
Enforcement has exerted significant pressure towards implementa-tion of environmental measures, such as stricter controls on pesti-cide application and designation of water protection zones. Thisapproach has undoubtedly improved the environment in the EU atconsiderable expense. In addition, expensive treatment technology isfrequently needed to remove traces of pesticides from drinking-water atgreat expense to consumers, while conferring dubious benefits in termsof health effects. The fairness of this approach in terms of violating thepolluter-pays principle has often been criticized.
Such debate is particularly pertinent in countries (such as many inthe eastern part of the WHO European Region) where continuity ofsupply and microbial quality are the prime concerns. Considerablecare should be exercised in giving priority to investment primarilyaimed at securing continuous, safe supplies while, in the short term,avoiding undue emphasis on complying with parameters with littlehealth significance.
Pollution of water sources may in time be affected by the EU WaterFramework Directive. In the short term, however, costly treatmentoptions and investment in distribution facilities, as well as effectivecontrols, are widely needed to provide a safe and uninterrupted supplyof drinking-water. This results in pressure to attract investment throughprivatization, which in turn reinforces the need for effective controlsto adequately supervise such private operators. These include stronglegislation and institutional mechanisms backed by staff training,and adequate resources to allow effective monitoring of drinking-water quality and enforcement of compliance with quality standards.At the same time, overuse of legislation and prosecution of watersuppliers for breaching standards can be very costly – ultimately tothe consumers – while being likely to provide few or no public healthbenefits.
Other western European countriesWestern European countries that are not members of the EU, such asNorway and Switzerland, have similar national frameworks and leg-islation in place, with drinking-water quality standards based on acombination of EU limits and WHO guideline values. As these coun-tries are not subject to the legal requirements of the EU, the approachtends to be more pragmatic and focused on health-based criteria.
193
Switzerland, for example, has two sets of standards: mandatory health-based limits, and non-health-based guideline or target values thatare less strictly enforced but ultimately to be aimed towards.
Countries in the eastern part of theWHO European RegionCountries in the eastern part of the WHO European Region haveexperienced many changes in the past decade. Previous legislationin the USSR and other countries contained numerous strict stand-ards for drinking-water quality, but these were often poorly enforcedbecause institutional mechanisms and resources were lacking. (Anotable exception to this was Czechoslovakia.) For most parameters,methods of analysis were inadequate and there was no clear distinc-tion between those responsible for providing services and those re-sponsible for supervising standards and enforcing the law. Moreover,drinking-water quality was often severely compromised by inten-sive industrial activity without any concern for the environment and,consequently, inadequate protection of water resources. A lack ofinvestment in treatment and distribution facilities also contributed tosignificant problems.
Many of these countries are preparing or have recently introducednew legislation closely linked to the WHO guidelines and/or the EUDrinking Water Directive, especially candidate countries for mem-bership of the EU. Although some countries, such as the Czech Re-public, inherited a relatively sound system of legislation andenforcement, including publication of reports on drinking-waterquality, the Czech Republic delayed adopting its revised draft legis-lation pending adoption of the revised Drinking Water Directive andprogress with the Water Framework Directive. Meanwhile, there areconcerns that the legislation and enforcement mechanisms have aloophole that could be exploited, especially by newly emerging,inexperienced private water service operators.
As with the EU member states, ministries are responsible for overallwater supply in these countries. Although suitable legislation is be-ing prepared and, to some extent, responsibilities are being allo-cated in most countries, resources and experience are often lackingto enforce the standards effectively. Many countries require consid-erable investment to improve the infrastructure.
194
LEGISLATION AND GUIDELINES
Despite the fact that legislation on safe water quality is in place in allWHO European Member States, as well as basic rules on water re-source management, there is still an incredible lack of implementa-tion resulting from inconsistencies between legal systems.Successfully conducted case studies on water resource managementhave shown that space for manoeuvring within the regulations is akey prerequisite for achieving standards above the minimum legalrequirements without increasing costs above those that consumersare willing to pay.
EU directives
Nitrates DirectiveEU members are required, under the Nitrates Directive (219), to iden-tify bodies of water that may be affected by pollution from nitrate(vulnerable zones) and establish action programmes to prevent pol-lution in these areas. The Directive is intended both to safeguarddrinking-water supplies and to prevent ecological damage, byreducing or preventing the pollution of water caused by the ap-plication and storage of inorganic fertilizers and manure on farm-land.
Waters covered by the Directive include surface bodies of fresh wa-ter (in particular those used for the abstraction of drinking-water),groundwater actually or potentially containing more than 50 mg/lnitrate, and water bodies (lakes, other freshwater bodies, estuaries,coastal water and marine waters) that are, or may become, eutrophic.Action programmes must include periods when applying certaintypes of fertilizer is prohibited, limits on the quantities of fertilizerapplied, a limit on the application of livestock manure, conditionsrelating to the available storage capacity on farms for livestock ma-nure, and a code of good agricultural practice.
Dangerous Substances DirectiveThe Dangerous Substances Directive (220) sets a framework foreliminating or reducing pollution of inland, coastal and territorialwaters by particularly dangerous substances. The regulation of spe-cific substances is promulgated in daughter directives.
195
The Directive requires EU members to eliminate or reduce pollutionof water bodies by certain substances contained in an annex to thedirective, and to set standards for their occurrence in water. The dan-gerous substances to be controlled are contained in two lists, List I(the “black list”) of priority chemicals and List II (the “grey list”).Discharges to water of substances on either list must be authorizedprior to release. Procedures for determining acceptable levels ofrelease differ between the two lists. List I chemicals are control-led by community-wide emission standards specif ied in daugh-ter directives, whereas individual EU members are responsiblefor setting standards for the List II substances that require con-trol.
Groundwater DirectiveThe Groundwater Directive (221) aims to protect exploitablegroundwater sources by prohibiting or regulating direct and indirectdischarges of dangerous substances. The dangerous substances cov-ered by the directive are those controlled by the Dangerous Sub-stances Directive (220). Member States are required to prevent theintroduction of List I substances into groundwater and to limit theintroduction of List II substances.
Bathing Water DirectiveThe Bathing Water Directive (176) sets out the quality requirementsfor identified bathing waters in each EU member country to “reducethe pollution of bathing water and to protect such water against fur-ther deterioration”. The standards were set in order “to protect theenvironment and public health”. The Directive specifies minimumsampling frequencies – every two weeks for most parameters. How-ever, the current mandatory and guideline standards of microbialdeterminants set in the Directive were published before many of themajor epidemiological studies had been carried out. The water qual-ity standards of the 1976 Bathing Water Directive are currently be-ing revised after a considerable period of consultation.
Urban Wastewater Treatment DirectiveThe Urban Wastewater Treatment Directive (60) sets minimum stand-ards for the collection, treatment and discharge of urban wastewater,with the aim of reducing the pollution of raw water by domesticsewage, industrial wastewater and rainwater run-off. It introduces
196
controls over the disposal of sewage sludge and prohibits the prac-tice of dumping sewage sludge at sea.
Under the Directive, all towns and villages with a population of 2000or more are required to have sewage collection systems. Thewastewater is subject to treatment requirements; a minimum ofsecondary treatment is normally required. Tertiary treatment isrequired for discharge to particularly sensitive areas (as desig-nated by Member States), including waters subject toeutrophication and surface waters intended for abstraction fordrinking-water that have high nitrate levels. Exceptions and dero-gation are made for specif ic circumstances; for example, septictanks giving the same degree of protection as sewage collectionmay be used if the installation of sewerage systems involves “ex-cessive cost”.
The Directive requires that all discharges of industrial wastewaterinto collecting systems and treatment plants be subject to regulationor specific authorization, and is being implemented progressivelyuntil 2005.
Drinking-water supplyThe EU sets minimum standards for drinking-water quality, sup-ported by monitoring and legal enforcement, and regulations alsogovern the quality of surface waters abstracted for potable supplyand the extent of treatment required.
Such regulations would appear to be necessary to ensure that drink-ing-water is of acceptable quality and that suitable sources of waterare used and sufficient treatment is applied. Nevertheless, the disad-vantage of this type of legislation and the concomitant financialpenalties for supply companies that breach the quality requirementsis that the consumer, and not the polluter, ultimately pays for thetreatment to remove the pollution.
Drinking Water DirectiveThe Drinking Water Directive (48) specifies quality standards forwater intended for drinking and use in food or drink production.Standards are set for six different categories of parameter:
197
� organoleptic quality (such as colour, odour and taste) and physi-cochemical parameters (such as pH and conductivity);
� parameters concerning substances undesirable in excessiveamounts (such as nitrates and nitrites);
� toxic substances (such as mercury, lead and pesticides);� microbial contaminants (such as coliform bacteria and faecal strep-
tococci); and� the minimum required concentrations for softened water intended
for human consumption (such as hardness and alkalinity).
The Directive sets maximum admissible concentrations and mini-mum required levels for most parameters, which must be incorpo-rated into the legislation of EU members, and includes guidelinesfor other parameters. The standards are backed up by monitoringand legal enforcement, and regulations also govern the quality ofsurface water abstracted for potable supply and the extent of treat-ment required.
The Directive has recently been reviewed and updated. The numberof parameters to be regulated were reduced, only those consideredto indicate a significant risk to human health being specified.
Surface Water for Drinking DirectiveThe Surface Water for Drinking Directive (222) is intended to en-sure that surface water abstracted for use as drinking-water reachescertain standards and receives adequate treatment before being putinto public supply. It requires the classification of rivers based onquality (A1, A2 or A3) corresponding to the degree of treatmentrequired to render the surface water fit for supply. Physical, chemi-cal and microbial characteristics are used to define the quality of thewater. The 46 parameters include temperature, the f ive-day BODtest (BOD
5), nitrates, lead and faecal coliform bacteria. Sampling at
abstraction points must demonstrate a high degree of compliancewith the values required.
The Directive prohibits the use of surface water of a quality worsethan A3 for drinking-water except in exceptional circumstances, andrequires a plan of action for the improvement of surface water qual-ity, especially A3 water.
198
WHO GUIDELINES
WHO guidelines for the safe use of wastewater andexcreta in agriculture and aquacultureThe WHO guidelines for the safe use of wastewater and excreta inagriculture and aquaculture (57) were developed to protect the healthof both workers and consumers. They specify that wastewater shouldbe treated to attain certain microbial standards before use, and dif-ferentiate between the more stringent quality required for restricteduse (on edible crops, sports fields and public parks) and that accept-able for unrestricted use (irrigation of trees, fodder and industrialcrops, fruit trees and pasture). Excreta that have not received suffi-cient treatment to remove the risk of infection should only be ap-plied by subsurface injection or in covered trenches before the startof the growing season. Where waste is used as a nutrient inaquaculture, measures should be implemented to reduce the risk toconsumers of fish. These include keeping fish in clean water for atleast 2–3 weeks before harvest (57). Plans are being made to updatethese guidelines.
WHO guidelines for safe recreational-water environmentsWHO is developing guidelines for safe recreational-water environ-ments with the primary aim of protecting public health. The guide-lines are in two volumes – the first on coastal and fresh waters (157)and the second on swimming pools, spas and similar recreational-water environments. Faecal pollution of recreational waters is one ofthe major hazards facing users, although microbial contaminationfrom other sources as well as chemical and physical aspects alsoaffect the suitability of water for recreation. The guidelines do notprovide mandatory limits but recommend measuring the safety of arecreational water environment and promote the adoption of a risk–benefit approach. This approach can then lead to the adoption ofmeasurable standards that can be implemented and enforced, forexample to deal with water quality.
WHO guidelines for drinking-water qualityWHO has derived guideline values for a large number of drinking-water parameters (46). These include measures of microbial andchemical contamination and also organoleptic quality. A guidelinevalue for a chemical parameter represents the concentration of a
199
constituent that does not result in any significant risk to the health ofthe consumer over a lifetime of consumption. The guidelines areintended to set achievable goals that can be used as a basis for thedevelopment of national standards that will ensure the safety of drink-ing-water supplies. They are not intended to be mandatory and shouldbe considered in the context of local or national environmental, so-cial, economic and cultural conditions. The guidelines are reconsid-ered periodically in the light of new evidence and may be revised ifnecessary. The ability to achieve the recommended levels is takeninto account when setting guidelines.
The guidelines emphasize the overriding importance of ensuring thatdrinking-water supplies are protected from microbial contamination.The potential consequences of microbial contamination of watersupplies are severe, including the simultaneous infection of a largeproportion of the population, especially infants and young children,elderly people and people already debilitated by illness. Becausechemical contamination is not normally associated with acute ef-fects (except in cases of massive contamination of supplies), chemi-cal standards for drinking-water may be of secondary considerationin a supply subject to severe microbial contamination. Similarly, therisks to health from disinfection by-products are extremely small incomparison with those associated with inadequate disinfection ofmicrobially contaminated supplies.
The guidelines are supported by a series of documents relating togood practice and generally oriented towards specific health haz-ards or management issues. These documents include a guide tomonitoring bathing waters (177) and an authoritative review con-cerning cyanobacteria (37).
INTERNATIONAL INITIATIVES AND RESPONSES
World Health OrganizationWHO has undertaken several initiatives to improve the health of thepopulation of Europe and to contribute to ensuring that drinking-water and recreational water are of sufficient quality. These includethe global guidelines described in the previous section and strate-gies for health for all.
200
Health for allThe WHO health for all movement began with the International Con-ference on Primary Health Care, held in Alma-Ata in 1978 (223).The Member States of the WHO European Region adopted the firstset of European targets for health in 1984 (224), updated them in1991 (225) and adopted HEALTH21, the health for all policy frame-work for the WHO European Region, in 1998 (4). The targets ofHEALTH21 include all aspects of health, from achieving environmentsand lifestyles that are conducive to good health to providing healthcare.
Target 10 on a healthy and safe physical environment states:
By the year 2015, people in the Region should live in a safer physicalenvironment, with exposure to contaminants hazardous to health at levelsnot exceeding internationally agreed standards. In particular: populationexposure to physical, microbial and chemical contaminants in water, air,waste and soil that are hazardous to health should be substantially reduced,according to the timetable and reduction rates stated in national environ-ment and health action plans; [and] people should have universal access tosufficient quantities of drinking-water of a satisfactory quality.
This target can be achieved if:
� steps are taken to ensure supply to every home of drinking-waterthat meets WHO guideline standards for drinking-water quality;
� global water management practices, including pollution controlmeasures, are strengthened;
� proper wastewater management systems are provided for the col-lection, treatment and final disposal or re-use of all wastewater;
� international conventions, such as those on transboundary wa-ters, are implemented;
� adequate capacities are built up for the inspection and monitor-ing of health risks in the environment; and
� data collection and monitoring of environmental contaminationand health effects are undertaken on a regular basis and theirresults made freely available.
The problems highlighted in HEALTH21 (underinvestment, poormanagement of water leading to water shortages, poor managementof sanitation and waste services, inadequate treatment of sewage,
201
contamination of water by waste and (particularly in rural areas) bypesticides and nitrates, leakage from drinking-water supplies, inter-rupted supplies and inefficient use of water supplies) are still verymuch present in some areas of the European Region.
Although improvements have been made in some aspects and somecountries, many of the suggested solutions are as relevant today asthey were in 1991. These include: investment in infrastructure, par-ticularly in sewage disposal and treatment plants; urban wastewatertreatment; protection of water sources from agricultural, communityand industrial wastes; fiscal policies to control pollution; and effec-tive water sector legislation. Investment is required not only for na-tional issues but also for the protection of international waters.
The WHO Regional Director for Europe noted in 1993 that the coun-tries of central and eastern Europe faced the most dramatic chal-lenges in achieving health for all, and considered that adopting theWHO health for all targets as national policies would be the mosteffective means of creating a cohesive framework for development(225). The 21 current health for all targets together comprise theframework for developing national health policies in the EuropeanRegion.
European UnionEuropean Community policy addressed environmental and healthissues related to water at a time when the Treaty of Rome did notinclude a mandate for such issues. Thus as early as 1973 the Euro-pean Community adopted its first environmental action programme,to be followed by others. The 1976 Bathing Water Directive (176)directly addressed an issue important for human health: setting cri-teria for bathing water and obliging European Community membersto take the necessary action where the criteria had not yet been met.The 1980 Drinking Water Directive (47) for the first time estab-lished health-related criteria for drinking-water at the tap, thus pro-viding security for the consumer and a basis for technical andfinancial planning for the water suppliers. This legislation has beencomplemented by emission-oriented legislation addressing pollu-tion at the source, such as the Urban Wastewater Treatment Direc-tive in 1991 (60), the Nitrates Directive in 1991 (219) and theIntegrated Pollution and Prevention Control Directive in 1996 (226).

202
Nevertheless, European water policy and water legislation still lackedan overall coherence that also contributed to the protection of hu-man health.
Following an initiative taken by the European Commission, a majorprocess of restructuring European water policy is under way, theissue to be addressed by the Water Framework Directive (2). Thenew policy and legislation have as their main objectives:
• expanding the scope of water protection to all waters, includingsurface water and groundwater, fresh water, estuaries and marinewater;
• achieving good status for all waters by a certain deadline;• water management based on river basins, by applying the com-
bined approach of limit values and environmental quality stand-ards to the control of discharges and by controlling waterabstraction from both surface water and groundwater (EU mem-bers would designate river basin authorities to administer andimplement the proposed directive, and transboundary coopera-tion will be required in many instances);
• a combined approach of emission limit values and quality stand-ards;
• getting the prices right;• involving the citizen more closely; and• streamlining legislation.
The aim of the Water Framework Directive is to provide an overallframework for the management of water, in terms of both qualityand quantity, thus enabling an integrated approach to be taken toachieve the objective of sustainable water management. The pro-posed directive aims to reconcile all human activities within a catch-ment, using command and control measures, planning and economicinstruments.
The proposed directive incorporates the requirements of a numberof current directives, including the Groundwater Directive (221),the Surface Water Directive (222) and the Dangerous SubstancesDirective (220), which are likely to be repealed. Some other direc-tives, such as the Urban Wastewater Treatment Directive (60), theNitrates Directive (219), the Bathing Water Directive (176) and the
203
Integrated Pollution and Prevention Control Directive (226) are likelyto remain in force and will provide some of the tools required toimplement the Water Framework Directive.
Current legislation on water is often fragmented and inconsistent.Pursuing an integrated policy on water resources and quality man-agement is essential. Sustainable improvements in protecting hu-man health can only be achieved if policies on drinking-water qualitytake account of wider issues of pollution control, water resourcemanagement and social planning.
There is a need to develop and expand local management at theappropriate level, with effective communication at the policy-making level. Intersectoral cooperation is needed in planning, in-frastructure, agricultural practices and pollution control (87).
Management of surface water and wastewater quality is of increas-ing importance in protecting human health. Management tools suchas guidelines, quality objectives, discharge permits and cost recov-ery options must be developed in an appropriate institutional frame-work.
205
References
1. EUROPEAN ENVIRONMENT AGENCY. Europe’s environment. The sec-ond assessment. Amsterdam, Elsevier Science, 1998.
2. Directive 2000/60/EC of the European Parliament and of theCouncil of 23 October 2000 establishing a framework forCommunity action in the field of water policy. Official journalof the European Communities, 43(L 327): 1–72 (2000).
3. Protocol on Water and Health to the 1992 Convention on theProtection and Use of Transboundary Watercourses and Inter-national Lakes (http://www.who.dk/london99/water02e.htm).Copenhagen, WHO Regional Office for Europe, 1999 (accessed1 February 2000).
4. HEALTH21. The health for all policy framework for the WHO Eu-ropean Region. Copenhagen, WHO Regional Office for Europe,1999 (European Health for All Series, No. 6).
5. REES, H.G. ET AL. Estimating the renewable water resource. In:Rees, H.G. & Cole, G.A., ed. Estimation of renewable water re-sources in the European Union. Wallingford, Institute of Hydrol-ogy, 1997, pp. 38–73 (document SUP-COM95, 95/5-441931EN).
6. STANNERS, D. & BOURDEAU, P., ED. Europe’s environment: the Dobrísassessment. An overview. Copenhagen, European EnvironmentAgency, 1995.
7. CHERNOGAEVA, G.M. ET AL. Water use and the influence of anthro-pogenic activity. In: Kimstach, V. et al., ed. A water quality as-sessment of the former Soviet Union. London, E. & F.N. Spon,1998, pp. 69–94.
206
8. GLEICK, P.H. An introduction to global fresh water issues. In:Gleick, P.H., ed. Water in crisis – a guide to the world’s freshwater resources. Stockholm, Pacific Institute for Studies in De-velopment, Environment and Security – Stockholm EnvironmentInstitute, 1993, p. 473.
9. State of the environment: country overview – Russia. Moscow,State Committee of the Russian Federation on Environmental Pro-tection, 1998, pp. 17–20.
10. SHIKLOMANOV, I.A. ET AL. Natural water resources. In: Kimstach, V.et al., ed. A water quality assessment of the former Soviet Union.London, E. & F.N. Spon, 1998, pp. 1–23.
11. OECD environmental data compendium 1997. Paris, Organisa-tion for Economic Co-operation and Development, 1997.
12. SCHOENWIESE, C.-D. ET AL. Klimatrend Atlas Europa 1891–1990.Frankfurt-am-Main, ZUF Verlag, 1993.
13. BRAZDIL, R. ET AL. Trends in minimum and maximum daily tem-peratures in central and southeastern Europe. International jour-nal of climatology, 16: 765–782 (1996).
14. NICHOLLS, N. ET AL. Observed climate variability and change. In:Houghton, J.T. et al., ed. Climate change 1995. The science of cli-mate change. Contribution of Working Group I to the Second As-sessment Report of the Intergovernmental Panel on Climate Change.Cambridge, Cambridge University Press, 1996, pp. 133–192.
15. ONATE, J.J. & POU, A. Temperature variations in Spain since 1901:a preliminary analysis. International journal of climatology, 16:805–816 (1996).
16. WATSON, R.T. ET AL., ED. Climate change 1995. Impacts, adapta-tions and mitigation of climate change: scientific-technical analy-ses. Cambridge, New York, Melbourne, Cambridge UniversityPress, 1966.
17. KOVATS, S. ET AL., ED. Climate change and stratospheric ozonedepletion. Early effects on our health in Europe. Copenhagen,WHO Regional Office for Europe, 2000 (WHO Regional Pub-lications, European Series, No. 88).
18. BENISTON, M. ET AL. An analysis of regional climate change inSwitzerland. Theoretical and applied climatology, 49: 135–159(1994).
19. ARNELL, N.W. & REYNARD, N.S. The effects of climate change dueto global warming on river flows in Great Britain. Journal ofhydrology, 183: 397–424 (1996).
207
20. COOPER, D.M. ET AL. The effects of climate changes on aquiferstorage and river baseflow. Hydrological sciences journal, 40:615–631 (1995).
21. HOERMANN, G. ET AL. Auswirkungen einer Temperaturerhöhung aufden Wasserhaushalt der Bornhöveder Seenkette. EcoSys, 5: 27–49 (1995).
22. MCMICHAEL, A.J. ET AL., ED. Climate change and human health. Anassessment prepared by a Task Group on behalf of the World HealthOrganization, the World Meteorological Organization and theUnited Nations Environment Programme. Geneva, World HealthOrganization, 1996 (document WHO/EHG/96.7).
23. ABAKUMOV, V.A. & TALAYEVA, Y.G. Microbial pollution. In:Kimstach, V. et al., ed. A water quality assessment of the formerSoviet Union. London, E. & F.N. Spon, 1998, pp. 267–292.
24. DANUBE PROGRAMME CO-ORDINATION UNIT. Workshop on DrinkingWater Related Environmental Health Aspects in the CatchmentArea of the River Danube, Bratislava, Slovak Republic, 16–19 De-cember 1993. Vol. II. Country reports. WHO Regional Office forEurope, European Centre for Environment and Health and UnitedNations Development Programme, 1993 .
25. PETROSYAN, V.S. ET AL. Organic pollutants. In: Kimstach, V. et al.,ed. A water quality assessment of the former Soviet Union. Lon-don, E. & F.N. Spon, 1998, pp. 211–240.
26. MEYBECK, M. Carbon, nitrogen and phosphorus transport by worldrivers. American journal of science, 282: 402–450 (1982).
27. State of the environment: country overview – Belarus. Minsk,Ministry of Natural Resources and Environmental Protection ofBelarus, 1998.
28. TSIRKUNOV, V.V. Water quality monitoring systems. In: Kimstach,V. et al., ed. A water quality assessment of the former Soviet Un-ion. London, E. & F.N. Spon, 1998, pp. 95–112.
29. State of the environment: country overview – Moldova. Chisinau,Ministry of Environment of the Republic of Moldova, 1998.
30. State of the environment: country overview – Ukraine. Kiev, Min-istry of the Environment of Ukraine, 1998.
31. BERNES, C. & GRUNDSTEN, C. The environment. Stockholm, Na-tional Atlas of Sweden, 1992.
32. KOUSSOURIS, T.S. ET AL. Water quality evaluation in lakes of Greece.In: Watershed 89. Proceedings of the IAWPRC conference, Guildford,UK, 17–20 April 1989. Oxford, Pergamon Press, 1989, pp. 119–128.
208
33. SCHEIDLEDER, A. ET AL. Groundwater quality and quantity. Dataand basic information. Copenhagen, European EnvironmentAgency, 1999 (Technical Report No. 22).
34.EUROPEAN ENVIRONMENT AGENCY. Environment in EU at the turnof the century. Copenhagen, European Environment Agency,1999.
35. World register of dams. Complete register. Paris, InternationalCommission on Large Dams, 1984.
36. World register of dams. Revision volume. Paris, International Com-mission on Large Dams, 1988.
37. CHORUS, I. & BARTRAM, J., ED. Toxic cyanobacteria in water. Lon-don, E. & F.N. Spon, 1999.
38. KLEIN, G. Application of the OECD eutrophication model in theprocess of ogliotrophication in eutrophied waters. Vom Wasser,73: 365–373 (1989).
39. RYDING, S.-O. & RAST, W. The control of eutrophication of lakesand reservoirs. New York, Parthenon Publishing Group, 1989.
40. SAS, H. Lake restoration by reduction of nutrient loading: expec-tations, experiences, extrapolations. St Augustin, AcademiaVerlag, 1989.
41. KLAPPER, H. Control of eutrophication in inland waters. Chiches-ter, Ellis Horwood, 1991.
42. State of the environment: country overview – Georgia. Tbilisi,Ministry of Environment of Georgia, 1998.
43. MARGAT, J. L’eau dans le bassin Méditerranéen. Situation et pro-spective. Les Fascicules du Plan Bleu 6. Paris, Economica, 1992.
44. MINISTRY OF TRANSPORT AND PUBLIC WORKS. Report on the Dutchaquatic outlook: future for water. The Hague, Directorate-General of Public Works and Water Management, 1996.
45. CROOK, J. ET AL. Guidelines for water reuse. Cambridge, MA, CampDresser & McKee, Inc., 1992.
46. Guidelines for drinking-water quality, 2nd ed. Geneva, WorldHealth Organization, 1993–1998.
47. Council directive 80/778/EEC of 15 July 1980 relating to thequality of water intended for human consumption. Official jour-nal of the European Communities, L229: 11–29 (1980).
48. Council directive 98/83/EC of 3 November 1998 on the qualityof water intended for human consumption. Official journal ofthe European Communities, L330(05/12/1998): 32–54 (1998)(accessed 5 March 2000).
209
49. FIELDING, M. ET AL. Pesticides in groundwater. Final report to Eu-ropean Crop Protection Association. Medmenham, Water Re-search Centre, 1998.
50. Water supply and sanitation in central and east European coun-tries, new independent states and Mongolia. Hall/Tirol, Moun-tain Unlimited, 1995.
51. Convention on the Protection and Use of Transboundary Water-courses and International Lakes. Geneva, United Nations Eco-nomic Commission for Europe, 1992.
52. KRINNER, W. ET AL. Sustainable water use in Europe. Part 1.Sectoral use of water. Copenhagen, European EnvironmentAgency, 1999 (Environmental Assessment Report No. 1).
53. FEDEROV, Y.A. ET AL. The Amu Darya. In: Kimstach, V. et al., ed. Awater quality assessment of the former USSR. London, E. & F.N.Spon, 1998, pp. 413–433.
54. KOHSIEK, L.H.M., ED. Backdrop on the 1995 environmental bal-ance. Bilthoven, National Institute of Public Health and Envi-ronmental protection, 1995 (Report 251701023).
55. DESBROW, C. ET AL. The identification and assessment of oestro-genic substances in sewage treatment effluents. Bristol, Envi-ronment Agency, 1996 (Report P2-i490/7).
56. PUCELJ, G. Will less technology solve sewage problems? Danubewatch, 2(4): 10–11 (1996).
57. Health guidelines for the use of wastewater in agriculture andaquaculture. Report of a WHO Scientific Group. Geneva, WorldHealth Organization, 1989 (Technical Report Series, No. 778).
58. MAINSTONE, C. ET AL. The environmental impact of fish farming – areview. Medmenham, Water Research Centre, 1989 (Report No.PRS 2243-M).
59. RANA, K. & IMMINK, A. Trends in global aquaculture production:1984–1996. Rome, Food and Agriculture Organization of theUnited Nations, 1999.
60. Council directive 91/271/EEC of 21 May 1991 concerning ur-ban wastewater treatment. Official journal of the European Com-munities, L135: 40–52 (1991).
61. KAUPPI, L. ET AL. Impacts of agricultural nutrient loading on Finnishwatercourses. Water science and technology, 28: 461–471 (1993).
62. SIMS, J.T. Agricultural and environmental issues in the manage-ment of poultry wastes: recent innovations and long-term chal-lenges. ACS symposium series, 668: 72–90 (1997).
210
63. FAOSTAT statistics database (agriculture – irrigation). Rome,Food and Agriculture Organization of the United Nations, 1996.
64. HANSEN, J. Nitrogen balances in agriculture. Luxembourg,EUROSTAT, 2000.
65. SIBBESEN, E. & RUNGE-METZGER, A. Phosphorus balance in Euro-pean agriculture – status and policy options. SCOPE, 54: 43–60(1995).
66. Fish farming and the Scottish freshwater environment. Reportprepared for the Nature Conservancy Council by the Institute ofAquaculture. Stirling, University of Stirling, 1990.
67. FOY, R.H. & ROSELL, R. Loadings of nitrogen and phosphorusfrom a Northern Ireland fish farm. Aquaculture, 96: 17–30 (1991).
68. European crop protection: trends in volumes sold, 1985–95.Brussels, European Crop Protection Association, 1996.
69. BLACKMORE, J. & CLARK, L. The disposal of sheep dip waste: ef-fects on water quality. Bristol, National Rivers Authority, 1994.
70. Sheep dipping: pollution prevention guidelines. Bristol, Envi-ronment Agency, 1997.
71. LEE, E.M. ET AL. The occurrence and significance of erosion, depo-sition and flooding in Great Britain. London, H.M. StationeryOffice, 1995.
72. LEE, E.M. ET AL. The investigation and management of erosion,deposition and flooding in Great Britain. London, H.M. Station-ery Office, 1995.
73. BOARDMAN, J. & ROBINSON, D.A. Soil erosion, climate vagarity andagricultural change on the Downs around Lewes and Brighton,autumn 1982. Applied geography, 5: 243–258 (1985).
74. EVANS, R. & COOK, S. Soil erosion in Britain. SEESOIL, 3: 28–58(1986).
75. SPIERS, R.B. & FROST, C.A. Soil water erosion on arable land inthe United Kingdom. Research and development in agriculture,4: 1–11 (1987).
76. REED, A.H. Soil loss from tractor wheelings. Soil and water, 14:12–14 (1986).
77. State of the environment of the Russian Federation. 1993 na-tional report. Moscow, Ministry of Environmental Protection andNatural Resources, 1994.
78. CZECH ENVIRONMENTAL INSTITUTE, ED. Statistical environmental year-book of the Czech Republic 1996. Prague, Ministry of the Envi-ronment, 1996.
211
79. LONGSTAFF, S.L. ET AL. Contamination of the chalk aquifer by chlo-rinated solvents: a case study of the Luton and Dunstable area.Journal of the Institute of Water and Environmental Manage-ment, 6: 541–550 (1992).
80. CAVELLERO, A. ET AL. Underground water pollution in Milan byindustrial chlorinated organic compounds. In: De L.G. Solbe, J.F.,ed. Effects of land use on fresh waters: agriculture, forestry, min-eral exploitation, urbanisation. Chichester, Ellis Horwood, 1985,pp. 65–84.
81. BAXTER, K.M. The effects of a hazardous and a domestic wastelandfill on the trace organic quality of chalk groundwater at asite in East Anglia. Science of the total environment, 47: 93–98(1985).
82. LERNER, D.N. & TELLAM, J.H. The protection of urban groundwaterfrom pollution. Journal of the Institution of Water and Environ-mental Management, 6(1): 28–36 (1992).
83. RIVETT, M.O. ET AL. Chlorinated solvents in UK aquifers. Journalof the Institute of Water and Environmental Management, 4: 242–250 (1990).
84. Proceedings of the European Workshop on the Impact of Endo-crine Disrupters on Human Health and Wildlife, Weybridge, 2–4 December 1996. Copenhagen, European Environment Agency,1997.
85. HARRIES, J.E. ET AL. Effects of trace organics on fish – phase 2.Marlow, Foundation for Water Research, 1995 (Report FR/D0022).
86. JAMES, H.A. ET AL. Steroid concentrations in treated sewage effluentsand water courses – implications for water supplies. Medmenham,Water Research Centre, 1998 (Report No. 98 TX011).
87. WHO EUROPEAN CENTRE FOR ENVIRONMENT AND HEALTH. Concern forEurope’s tomorrow. Health and the environment in the WHO Eu-ropean Region. Stuttgart, Wissenschaftliche Verlagsgesellschaft,1995.
88. SOMLYÓDY, L. & JOLÁNKAI, G. Nutrient loads. In: Somlyódy, L. &van Straten, G., ed. Modeling and managing shallow lakeeutrophication. Berlin, Springer, 1986, pp. 125–156.
89. MARA, D. & CAIRNCROSS, S. Guidelines for the safe use ofwastewater and excreta in agriculture and aquaculture. Meas-ures for public health protection. Geneva, World Health Organi-zation, 1989.
212
90. Water and sanitation services in Europe, 1981–1990. Copenha-gen, WHO Regional Office for Europe, 1989 (document EUR/ICP/CWS 011).
91. Environment and health in Italy. Rome, WHO European Centrefor Environment and Health, Rome Division, 1995.
92. BRTKO, J. ET AL. National report, Slovak Republic. Bratislava, WaterResearch Institute, 1997.
93. Water supply and sanitation in central and east European coun-tries, new independent states and Mongolia. Vol. II, draft ver-sion. Hall/Tirol, Mountain Unlimited, 1997.
94. BERTOLLINI, R. ET AL., ED. Ambiente e salute in Italia [Environmentand health in Italy]. Rome, Il Pensiero Scientifico Editore, 1997.
95. IACOB, I. A decade of drinking water surveillance in Romania. In:Proceedings of the XXXII International 70th Anniversary Confer-ence of the Institute of Public Health, Bucharest, Romania, May 8–9, 1997. Bucharest, Institute of Public Health, 1997, pp. 122–123.
96. Eradication of water-related diseases. Report on a joint UNECE/WHO consultation. Copenhagen, WHO Regional Office for Eu-rope, 1997 (document EUR/ICP/EHSA 02 02 03).
97. PALOMBI, L. ET AL. Tirana survey on water facilities. Tirana, Com-munity of S. Edido, 1997.
98. Epidemiological aspects of investigation of outbreaks of com-municable diseases and surveillance and control of water qual-ity. Report on a WHO workshop. Copenhagen, WHO RegionalOffice for Europe, 1997 (document EUR/ICP/CORD 02 06 01).
99. International statistics for water supply. Nancy, InternationalWater Supply Association, 1997.
100. Financial management of water supply and sanitation. A hand-book. Geneva, World Health Organization, 1994.
101. Dix ans de croissance pour l’industrie européenne des eauxminérales naturelles. Madrid, GISEM-UNESEM, 1993.
102. Joint WHO/German Regional Seminar on Drinking-Water Qual-ity. Report on a WHO seminar. Copenhagen, WHO Regional Of-fice for Europe, 1994 (document EUR/ICP/EHAZ 94 11/WS03).
103. Environment for sustainable health development – an actionplan for Sweden. Report on the proposals presented by the Com-mission on Environmental Health. Stockholm, SOU, 1996.
104. RAUKAS, A. Estonian environment: past, present and future.Tallinn, Ministry of the Environment of Estonia, EnvironmentInformation Centre, 1996.
213
105. Guidelines for drinking-water quality, 2nd ed. Vol. 2. Healthcriteria and supporting information. Geneva, World Health Or-ganization, 1996.
106. HALL, T., ED. Water treatment processes and practices, 2nd ed.Swindon, Water Research Centre, 1997.
107. Outbreak of typhoid fever in Tajikistan. Report of a WHO ex-pert team visit to Tajikistan, 1–9 July 1996. Copenhagen, WHORegional Office for Europe, 1996 Policy aspects of water-related issues. Report on a WHO consensus meeting. Copen-hagen, WHO Regional Office for Europe, 1997 (document EUR/ICP/CORD 02 06 01(A)).
108. SIBILLE, I. Biological stability in drinking water distribution sys-tems : a review. L’année biologique, 37(3): 117–161 (1998).
109.VAN DER HOEK, J.P. ET AL. RO treatment: selection of a pre-treatment scheme based on fouling characteristics abndoperationg conditions based on environmental impact.Desalination, 127: 89–101 (2000).
110. WATER RESEARCH CENTRE. International comparison of the de-mand for water: a comparison of the demand for water in threeEuropean countries: England and Wales, France and Germany.London, Office of Water Services, 1997.
111. ISTITUTO DI RICERCA SULLE ACQUE. Evoluzione dei fabbisogni idricicivili ed industriali [Development of human and industrial wa-ter requirements]. Cosenza, Editoriale Bios, 1996.
112. DA C. VARGAS, S.M.V. & MARA, D.D. The bacterial quality of let-tuce and alfalfa spray-irrigated with trickling filter effluent. In:Implementing water re-use (Water Re-use Symposium IV).Denver, CO, American Water Works Association Research Foun-dation, 1987, pp. 793–802.
113. MARA, D.D. & PEARSON, H.W. Design manual for wastestabilisation ponds in Mediterranean countries. Leeds, LagoonTechnology International, 1998.
114. Workshop on Water Demands Management, Frejus, 12–13 Sep-tember, 1997. Valbonne, Plan Bleu, 1997.
115. BLACK, R.E. ET AL. Handwashing to prevent diarrhoea in day-carecentres. American journal of epidemiology, 113: 445–451 (1981).
116. MCNEISH, D. Liquid gold. The cost of water in the 90’s. Ilford,Barnardos, 1993.
117. MIDDLETON, J.D. ET AL. Water disconnection and disease. Lancet,344: 62 (1994).
214
118. FEWTRELL, L. ET AL. Infectious diseases and water-supplydisconnections. Lancet, 343: 1370 (1994).
119. Annual national report on drinking water quality in urban ar-eas. Bucharest, Institute of Public Health, 1986–1996.
120. The quality of drinking water in Ireland. A report for the year1995 with a review of the period 1993–1995. Wexford, Envi-ronmental Protection Agency, 1996.
121. MAGUIRE, H.C. ET AL. An outbreak of cryptosporidiosis in SouthLondon – what value the P value? Epidemiology and infection,115: 279–287 (1995).
122. BRAIDECH, T.E. & KARLIN, R.J. Causes of a waterborne giardiasisoutbreak. Journal of the American Water Works Association, 77:48–51 (1985).
123. FURTADO, C. ET AL. Outbreaks of waterborne infectious disease inEngland and Wales, 1992–95. Epidemiology and infection, 121:109–119 (1998).
124. KARANIS, P. ET AL. Distribution and removal of Giardia andCryptosporidium in water supplies in Germany. Water scienceand technology, 37: 9–18 (1998).
125. Foodborne pathogens: risks and consequences. Ames, IA,Council for Agricultural Science and Technology, 1994 (TaskForce Report No. 122).
126. HELMICK, C.G. ET AL. Infectious diarrheas. In: Everhart, J.E., ed.Digestive diseases in the United States: epidemiology and im-pact. Bethesda, MD, National Institutes of Health, 1994, pp.85–120 (Publication No. 94-1447).
127. Food safety and foodborne diseases. World health statistics quar-terly, 50(1/2): 3–154 (1997).
128. KRAMER, M.H. ET AL. Waterborne disease: 1993–1994. Journalof the American Water Works Association, 88(3): 66–80 (1996).
129. MACKENZIE, W.R. ET AL. A massive outbreak in Milwaukee ofCryptosporidium infection transmitted through the public watersupply. New England journal of medicine, 331: 161–167 (1994).
130. PROCTOR, M.E. ET AL. Surveillance data for waterborne illnessdetection: an assessment following a massive waterborne out-break of Cryptosporidium infection. Epidemiology and infec-tion, 120(1):43–54 (1998).
131. GOLDSTEIN, S.T. ET AL. Cryptosporidiosis: an outbreak associatedwith drinking water despite state-of-the-art water treatment.Annals of internal medicine, 124: 459–468 (1996).
215
132. ROEFER, P.A. ET AL. The Las Vegas cryptosporidiosis outbreak.Journal of the American Water Works Association, 88(9): 95–106 (1996).
133. EXNER, M. Infektionskrankheiten aus hygienischer Sicht mitbesonderer berücksichtigung umweltbedingter Infektionen –Rückblick und Ausblick. Zentralblatt für Hygiene undUmweltmedizin, 197: 134–161 (1995).
134. PAYMENT, P. ET AL. A prospective epidemiological study of drink-ing water related gastrointestinal illnesses. Water science andtechnology, 24(2): 27–28 (1991).
135. PAYMENT, P. ET AL. A randomized trial to evaluate the risk ofgastrointestinal disease due to consumption of drinking watermeeting current microbiological standards. American journalof public health, 81: 703–708 (1991).
136. GRAY, N.F., ED. Drinking water quality: problems and solutions.Chichester, John Wiley & Sons, 1994.
137. SIMCHEN, E. ET AL. An epidemic of waterborne Shigella gastroen-teritis in kibbutzim of western Galilee in Israel. Internationaljournal of epidemiology, 20: 1081–1087 (1991).
138. HUNTER, P.R., ED. Waterborne disease. Epidemiology and ecol-ogy. Chichester, John Wiley & Sons, 1997.
139. NARKEVICH, M.I. ET AL. The seventh pandemic of cholera in theUSSR, 1961–1989. Bulletin of the World Health Organization,71: 189–196 (1993).
140. GRASSI, E. ET AL. The control of cholera epidemics: continuity ordiscordance in the health interventions. Igiene moderna, 109:541–556 (1998).
141. SCHIRALDI, O. Tourist health and enteric infections – cholera. In:Pasini, W., ed. Tourist health. Proceedings of the Second Inter-national Conference on Tourist Health, Rimini, 15–18 March1989. Rimini, WHO Collaborating Centre for Tourist Health andTourist Medicine, 1990, pp. 95–97.
142. SMITH, H.V. ET AL. The effect of free chlorine on the viability ofCryptosporidium spp. oocysts. Medmenham, Water ResearchCentre, 1988 (Report PRU 2023-M).
143. CRANE, G.F. ET AL. Waterborne outbreaks of cryptosporidiosis. Journalof the American Water Works Association, 90(9): 81–91 (1998).
144. RICHARDSON, A.J. ET AL. An outbreak of waterbornecryptosporidiosis in Swindon and Oxfordshire. Epidemiologyand infection, 107: 485–495 (1991).
216
145. FEWTRELL, L. & DELAHUNTY, A. The incidence of cryptosporidiosisin comparison with other gastro-intestinal illnesses in Black-pool, Wyre and Fylde. Journal of the Chartered Institution ofWater and Environmental Management, 9: 598–601 (1995).
146. DUKE, L.A. ET AL. A mixed outbreak of Cryptosporidium andCampylobacter infection associated with a private water sup-ply. Journal of epidemiology and infection, 116: 303–308(1996).
147. LJUNGSTRØM, I. & CASTOR, B. Immune response to Giardia lambliain a water-borne outbreak of giardiasis in Sweden. Journal ofmedical microbiology, 36: 347–352 (1992).
148. ZHULIDOV, A.V. & EMETZ, V.M. Heavy metals, natural variabilityand anthropogenic impacts. In: Kimstach, V. et al., ed. A waterquality assessment of the former Soviet Union. London, E. &F.N. Spon, 1998, pp. 179–202.
149. Guidelines for drinking-water quality. Vol. 1. Geneva, WorldHealth Organization, 1984.
150. FAWELL, J.K. ET AL. Toxins from blue-green algae: toxicologicalassessment of microcystin-LR and a method for its determina-tion in water. Medmenham, Water Research Centre, 1994 (Re-port FR 0359/ DoE 3358/2).
151. HART, J. & STOTT, P. Microcystin-LR removal from water. Marlow,Foundation for Water Research, 1993 (Report FR 0367).
152. LAHTI, K. & HIISVIRTA, L. Removal of cyanobacterial toxins inwater treatment processes: review of studies conducted in Fin-land. Water supply, 7: 149–154 (1989).
153. WROATH, A. & FAWELL, J.K. The toxicity and significance of toxinsfrom blue-green algae. Medmenham, Water Research Centre, 1995.
154. FALCONER, I.R. Health problems from exposure to cyanobacteriaand proposed safety guidelines for drinking and recreationalwater. In: Codd, G.A. et al., ed. Detection methods forcyanobacterial toxins. London, Royal Society of Chemistry,1994, pp. 3–30.
155. CRONBERG, G. Phytoplankton changes in Lake Trummen inducedby restoration. Folia limnologica scandinavica, 18: 119 (1982).
156. TURNER, P.C. ET AL. Pneumonia associated with cyanobacteria.British medical journal, 200: 1440–1441 (1990).
157. Guidelines for safe recreational-water environments. Vol. 1.Coastal and fresh-waters. Geneva, World Health Organization,1998 (document EOS/DRAFT/98.14).
217
158. AUVINEN, A. ET AL. Indoor radon exposure and risk of lung can-cer: a nested case-control study in Finland. Journal of the Na-tional Cancer Institute, 88: 966–972 (1996).
159. Drinking water quality in Scotland, 1996. Edinburgh, ScottishExecutive, 1997.
160. MARTYN, C.N. ET AL. Geographical relation between Alzheimer’s dis-ease and aluminium in drinking-water. Lancet, 1: 59–62 (1989).
161. Aluminium. Geneva, World health Organization, 1997 (Envi-ronmental Health Criteria, No. 194).
162. BENNET, G. Bristol floods 1968: controlled survey of effects ofhealth on local community disaster. British medical journal, 3:454–458 (1970).
163. ABRAHAMS, M.J. ET AL. The Brisbane floods, January 1974: theirimpact on health. Medical journal of Australia, 2: 936–939(1976).
164. INTERNATIONAL FEDERATION OF RED CROSS AND RED CRESCENT SOCIE-TIES. World disaster report 1997. New York, Oxford UniversityPress, 1998.
165. SIMOES, J. ET AL. [Some aspects of Weil’s disease epidemiologybased on a recent epidemic after a flood in Lisbon (1967).]Anais da Escola Nacional de Saude Publica e de Medicina Tropi-cal, 3: 19–32 (1969).
166. KRIZ, B. Infectious disease consequences of the massive 1997summer floods in the Czech Republic. Copenhagen, EWHO Re-gional Office for Europe, 1998 (document EUR/ICP/EHRO020502/12).
167. DALES, R.E. ET AL. Adverse health effects among adults exposedto home dampness and molds. American review of respiratorydiseases, 143: 505–509 (1991).
168. ESTRELA, T. ET AL. Water resources problems in southern Europe.An overview report. Copenhagen, European EnvironmentAgency, 1996.
169. Microbiological quality of coastal recreational waters. Reporton a joint WHO/UNEP meeting. Copenhagen, WHO RegionalOffice for Europe, 1994 (document EUR/ICP/CEH/039(1).
170. World health statistics annual 1995. Geneva, World Health Or-ganization, 1996.
171. CENTERS FOR DISEASE CONTROL AND PREVENTION. Surveillance forwaterborne disease outbreaks – United States, 1995–1996. Sur-veillance summaries, December 11, pp. 1–34 (1999).
218
172. PIKE, E.B. Health effects of sea bathing. Medmenham, WaterResearch Centre, 1994 (Report No. DoE 3412/2).
173. FEWTRELL, L. ET AL. Pathogenic microorganisms in temperateenvironmental waters. Dyfed, Samara Publishing, 1994.
174. FLEISHER, J.M. ET AL. Marine waters contaminated with domesticsewage: nonenteric illnesses associated with bather exposurein the United Kingdom. American journal of public health, 86:1228–1234 (1996).
175. PRUSS, A. A review of epidemiological studies from exposure torecreational water. International journal of epidemiology, 27:1–9 (1998).
176. Council directive 76/160/EEC of 8 December 1975 concern-ing the quality of bathing water. Official journal of the Euro-pean Communities, L031: 1–7 (1976).
177. BARTRAM, J. & REES, G. Approaches to microbiological monitor-ing. In: Monitoring bathing waters: a practical guide to thedesign and implementation of assessments and monitoring pro-grammes. London, E. & F.N. Spon, 2000, pp. 169–218.
178. Health-based monitoring of recreational waters: the feasibilityof a new approach (the “Annapolis Protocol”). Outcome of anexpert consultation, Annapolis, USA. Geneva, World Health Or-ganization, 1999 (document WHO/SDE/WSH/99.1).
179. Quality of bathing water (1997 bathing season). Luxembourg,European Commission, 1998 (EUR 18166).
180. PILOTTO, L.S. ET AL. Health effects of recreational exposure tocyanobacteria (blue-green) algae during recreational water-re-lated activities. Australia and New Zealand journal of publichealth, 21: 562–566 (1997).
181. PEARSON, M.J. ET AL. Toxic blue-green algae. London, NationalRivers Authority, 1990 (Water Quality Series, No. 2).
182. GUNN, G. ET AL. Fatal canine neurotoxicosis attributed to blue-green algae (cyanobacteria). Veterinary record, 130: 301–302(1992).
183. GRAUER, F. Seaweed dermatitis. Archives of dermatology, 84: 720–732 (1961).
184. BADEN, D.G. ET AL. Toxins from Florida’s red tide dinoflagellates,Ptychodiscus brevis. In: Regelis, E.P., ed. Seafood toxins. Wash-ington, DC, American Chemical Society, 1984, pp. 359–367.
185. SCOGING, A.C. Illness associated with seafood. Communicabledisease report, England and Wales, 1: 117–122 (1991).
219
186. Assessment of the state of microbiological pollution of the Medi-terranean Sea. Nairobi, United Nations Environment Pro-gramme, 1996 (document UNEP(OCA)/MED WG. 104/Inf.9).
187. BLAKE, P.A. ET AL. Cholera in Portugal, 1974. I. Modes of transmis-sion. American journal of epidemiology, 105: 337–343 (1977).
188. Health risks from marine pollution in the Mediterranean. 2.Review of hazards and health risks. Copenhagen, WHO Re-gional Office for Europe, 1995 (document EUR/ICP/EHAZ 9401/MTO1(2)).
189. Towards sustainability: a European Community programme ofpolicy and action in relation to the environment and sustain-able development. Brussels, Commission of the European Com-munities, 1992 (COM(92) 23).
190. BUCKLAND, J. & ZABEL, T. Economic instruments of water man-agement and financing of infrastructure. Bristol, EnvironmentAgency, 1996 (R&D Technical Report E10).
191. AGTHE, D.E. & BILLINGS, R.B. Water price effect on residentialand apartment low flow fixtures. Journal of water resourcesplanning and management, 122(1): 20–23 (1996).
192. Long range study on water supply and demand in Europe –level A – France. London, International Water Association, 1996.
193. ANDERSSON, Y. ET AL. Waterborne Campylobacter in Sweden: thecost of an outbreak. Water science and technology, 35(11–12):11–14 (1997).
194. SEVERO, C.-A. ET AL. Cost effectiveness of hepatitis A preventionin France. Pharmacoeconomics, 8: 46–61 (1995).
195. SANDER, G. ET AL. Zur Problematik der Kostendarstellungübertragbarer Krankheiten. IV. Anwendungsversuch einerKostenrechnung bei Hepatitis infectiosa am Beispiel einerHepatitisepidemie im zwei Kreisen. Zeitschrift für ärztlicheFortbildung (Jena), 72: 194–200 (1978).
196. ARNAL, J.-M. ET AL. Cost effectiveness of hepatitis A virus im-munisation in Spain. Pharmacoeconomics, 12: 361–373 (1997).
197. VERMA, B.L. & SRIVASTAVA, R.N. Measurement of the personalcost of illness due to some major water-related diseases in anIndian rural population. International journal of epidemiology,19: 169–176 (1990).
198. DEMICHELI, V. ET AL. Economic aspects of a small epidemic ofhepatitis A in a religious community in northern Italy. Journalof infection, 33: 87–90 (1996).
220
199. LUCIONI, C. ET AL. Cost of an outbreak of hepatitis A in Puglia,Italy. Pharmocoeconomics, 13: 257–266 (1998).
200. CHOSSEGROS, P. ET AL. Coût en France des hepatites A aïgues del’adulte. Presse medicale, 23: 561–564 (1994).
201. SMITH, S. ET AL. Cost-effectiveness of hepatitis A vaccination inhealthcare workers. Infection control and hospital epidemiol-ogy, 18: 688–691 (1997).
202. BEHRENS, R.H. & ROBERTS, J.A. Is travel prophylaxis worth while?Economic appraisal of prophylactic measures. British medicaljournal, 309: 918–922 (1994).
203. DALTON, C.B. ET AL. The cost of a food-borne outbreak of hepa-titis A in Denver, Colorado. Archives of internal medicine, 156:1013–1016 (1996).
204. VAN DOORSLAER, E. ET AL. Cost-effectiveness analysis of vacci-nation against hepatitis A in travellers. Journal of medical vi-rology, 44(4): 463–469 (1994).
205. SRIDHAR, C.B. & KULKARNI, R.D. Reassessment of frequency ofoccurrence of typhoid fever and cost efficacy analysis of anti-biotic therapy. Journal of the Association of Physicians – In-dia, 43: 679–684 (1995).
206. SHANDERA, W.Z. ET AL. An analysis of the economic costs associ-ated with an outbreak of typhoid fever. American journal ofpublic health, 75: 71–73 (1985 ).
207. ARCHER, D.L. & KVENBERG, J.E. Incidence and cost of foodbornediarrhoeal disease in the United States. Journal of food protec-tion, 48: 887–894 (1985).
208. THOMSON, M.A. & BOOTH, I.W. Treatment of traveller’s diarrhoea.Economic aspects. Pharmacoeconomics, 9: 382–391 (1996).
209. DANZON, A. ET AL. Prise en charge des diarrhées aïgues non gravesdu nourrisson: approche socio-économique. Revued’épidémiologie et de santé publique, 35: 451–457 (1987).
210. BAKER, E.L. JR. ET AL. Economic impact of a community widewaterborne outbreak of gastrointestinal illness. American jour-nal of public health, 69: 501–502 (1979).
211. HOPKINS, R.S. ET AL. Gastroenteritis: case study of a Coloradooutbreak. Journal of the American Water Works Association,78(1): 40–44 (1986).
212. LIDDLE, J.L. ET AL. Rotavirus gastroenteritis: impact on youngchildren, their families and the health care system. Medical jour-nal of Australia, 167: 304–307 (1997).
221
213. LAURSEN, E. ET AL. Gastroenteritis: a waterborne outbreak affect-ing 1600 people in a small Danish town. Journal of epidemiol-ogy and community health, 10: 453–458 (1994).
214. CVJETANOVIC, B. Sanitation versus immunization in the controlof enteric and diarrhoeal diseases. Progress in water technol-ogy, 11: 81–87 (1979).
215. COOKSON, S.T. ET AL. A cost-benefit analysis of programmaticuse of CVD 103-HgR live oral cholera vaccine in a high riskpopulation. International journal of epidemiology, 26: 212–219(1997).
216. HARRINGTON, W. ET AL. The economic losses of a waterborne dis-ease outbreak. Journal of urban economics, 25: 116–138(1989).
217. SHAFFER, P.A. ET AL. The impact of a community-wide waterborneoutbreak of cryptosporidiosis on local health-care resources(abstract). In: Abstracts of the 13th AHSR-FHSR Annual Meet-ing, 1996. Washington, DC, AHSR-FHSR, 1996, p. 99.
218. The economic impact of the cholera epidemic, Peru, 1991. Epi-demiology bulletin, 13(3): 9–11 (1992).
219. Council directive 91/676/EEC of 12 December 1991 concern-ing the protection of waters against pollution caused by nitratesfrom agricultural sources. Official journal of the European Com-munities, L375: 1–8 (1991).
220. Council directive 76/464/EEC of 4 May 1976 on pollutioncaused by certain dangerous substances discharged into theaquatic environment of the Community. Official journal of theEuropean Communities, L129: 23–29 (1976).
221. Council directive 80/68/EEC of 17 December 1979 on the pro-tection of groundwater against pollution caused by certain dan-gerous substances. Official journal of the EuropeanCommunities, L020: 43–48 (1980).
222. Council directive 75/440/EEC of 16 June 1975 concerning thequality required of surface water intended for the abstraction ofdrinking water in the Member States. Official journal of theEuropean Communities, L194: 26–31 (1975).
223. Alma-Ata 1978: primary health care. Geneva, World HealthOrganization, 1978 (“Health for All” Series, No. 1).
224. Targets for health for all. Targets in support of the Europeanregional strategy for health for all. Copenhagen, WHO RegionalOffice for Europe, 1985 (European Health for All Series, No. 1).

222
225. Health for all targets. The health policy for Europe. Copenha-gen, WHO Regional Office for Europe, 1993, p. 228 (Euro-pean Health for All Series, No. 4).
226. Council directive 96/61/EC of 24 September 1996 concerningintegrated pollution prevention and control. Official journal ofthe European Communities, L257: 26–40 (1996).