Embed Size (px)
Citation preview

MURRAY-DARLING BASIN AUTHORITY
Water Audit Monitoring Report 2010–11
Report of the Murray–Darling Basin Authority on the Cap on Diversions
March 2012

Water Audit Monitoring Report 2010–11
Report of the Murray–Darling Basin Authority on the Cap on Diversions
March 2012

ii
Murray–Darling Basin Authority
Water audit Monitoring report 2010–11
Murray–darling Basin authority
Postal Address: GPO Box 1801, Canberra ACT 2601
Office location: Level 4, 51 Allara Street, Canberra City, Australian Capital Territory
Tel: (02) 6279 0100, international + 61 2 6279 0100 Fax: (02) 6248 8053, international + 61 2 6248 8053
E‑mail: [email protected] Website: http://www.mdba.gov.au
For further information contact the Murray‑Darling Basin Authority office on (02) 6279 0100
MDBA Publication No. 44/12 ISBN (on‑line) 978–1–922068–52–1 ISBN (print) 978–1–922068–53–8
© Copyright Murray‑Darling Basin Authority (MDBA), on behalf of the Commonwealth of Australia 2012.
With the exception of the Commonwealth Coat of Arms, the MDBA logo, all photographs, graphics and trademarks, this publication is provided under a Creative Commons Attribution 3.0 Australia Licence.
http://creativecommons.org/licenses/by/3.0/au
The MDBA’s preference is that you attribute this publication (and any material sourced from it) using the following wording:
Title: Water Audit Monitoring Report 2010–11
Source: Licensed from the Murray–Darling Basin Authority, under a Creative Commons Attribution 3.0 Australia Licence.
The MDBA provides this information in good faith but to the extent permitted by law, the MDBA and the Commonwealth exclude all liability for adverse consequences arising directly or indirectly from using any information or material contained within this publication.
Australian Government Departments and Agencies are required by the Disability Discrimination Act 1992 (Cth) to ensure that information and services can be accessed by people with disabilities. If you encounter accessibility difficulties or the information you require is in a format that you cannot access, please contact us.
AcknowledgmentsThe development of the Murray–Darling Basin Authority’s ‘2010–11 Water Audit Monitoring Report’ has involved the valuable input, support and commitment of many people. Each stage of the development of the report was overseen by the members of the inter–Governmental working groups and committees. Without naming each particular contributor, thanks are due to the following agencies:• Australian Government—Bureau of Meteorology, Australia;• Australian Government—Department of Sustainability, Environment, Water, Population and
Communities • ACT—Department of Environment, Climate Change, Energy and Water;• NSW—Office of Water and Energy• QLD—Department of Environment and Resources Management;• SA—Department of Water, Land and Biodiversity Conservation;• VIC—Department of Sustainability and Environment; and• VIC—Goulburn—Murray Rural Water Corporation.

iiiWater audit Monitoring report 2010–11
Foreword
March 2012
The Hon Tony Bourke, MP Minister for Sustainability, Environment, Water, Population and Communities Parliament House CANBERRA ACT 2600
Dear Minister
I have pleasure in submitting to you the Water Audit Monitoring Report 2010–11. The Council established the Cap in 1995 and set the operating framework in 1996. The Council formalised the operating rules for the Cap in the form of Schedule E (Former Schedule F) to the Murray–Darling Basin Agreement in 2000. The Water Audit Monitoring Report 2010–11 is the fifteenth in a series of the reports on the Cap on Diversion and has been produced as a requirement of Schedule E to the Murray–Darling Basin Agreement.
The Water Audit Monitoring Report 2010–11 complements the Independent Audit Group Report 2010–11. Whereas the focus of the Independent Audit Group Report is the Cap compliance and the activities related to it, this report provides a broader picture of the Cap compliance, water use, accuracy of water use figures, climatic overview for the water year, water availability through allocations, off–allocations and water trading, storages losses, and groundwater use.
Schedule E requires the Authority to maintain a Diversion Cap Register. The updated Diversion Cap Register is appended to the Water Audit Monitoring Report. The Diversion Cap Register provides details for every designated Cap valley and for every reporting year since 1997–98 of annual Cap adjustments for trade and Environment Use, trade and environment adjusted annual Cap targets, annual diversions, annual Cap credits and cumulative Cap credits since 1997–98. This Register is the formal record of diversions and Cap compliance in the Basin.
The text in chapters 4 to 8 and data published in this report have been supplied by the States and Territory. The published data are considered to be the best available estimates for Water Diversion, Water Trade, Cap targets and other data. If better estimates become available in future, the Diversion Cap Register will be amended accordingly. The Diversion and Trade figures in this Report are considered to be the latest figures for the water year and supersede those reported in the Independent Audit Group Report 2010–11.
The Authority appreciates the co–operation received from the States and Territory Governments’ Officers in compiling this Report.
Yours sincerely
Rhondda Dickson Chief Executive

Murray–Darling Basin Authority

vWater audit Monitoring report 2010–11
Contents
1. IntroduCtIon................................................................................................................ 1
2. BACkground.................................................................................................................. 4
2.1 Audit of Water Use in the Murray–Darling Basin, June 1995 ...................................................42.2 The Cap ..........................................................................................................................................42.3 IAG Review of Cap Implementation 2010–11 ..............................................................................5
3. theyeArInrevIew...................................................................................................... 6
3.1 Water Diversions ...........................................................................................................................63.2 Accuracy of Measurement ...........................................................................................................93.3 Climatic Overview 2010–11 .........................................................................................................11
3.3.1 Rainfall ..............................................................................................................................113.3.2 Temperature .....................................................................................................................11
3.4 Definition of Cap ..........................................................................................................................153.5 Comparison of 2010–11 Water Use with the Cap .....................................................................16
3.5.1 New South Wales .............................................................................................................163.5.2 Victoria ..............................................................................................................................173.5.3 South Australia ................................................................................................................173.5.4 Queensland ......................................................................................................................173.5.5 Australian Capital Territory ............................................................................................173.5.6 Basin comparison of actual diversions with the annual Cap targets ........................17
3.6 Measurement of Land–surface (Floodplain Harvesting) Diversions ....................................17
4. revIewoF2010–11wAteruseInnewsouthwAles.......................................... 21
4.1 Water Management Overview ....................................................................................................214.2 Water Use Overview ....................................................................................................................214.3 Environmental Water Recovery .................................................................................................214.4 Border Rivers ...............................................................................................................................224.5 Gwydir ...........................................................................................................................................224.6 Namoi–Peel .................................................................................................................................234.7 Macquarie–Castlereagh–Bogan ...............................................................................................244.8 Barwon–Upper Darling ..............................................................................................................244.9 Lachlan .........................................................................................................................................254.10 Murrumbidgee .............................................................................................................................254.11 Lower Darling ..............................................................................................................................264.12 Murray ..........................................................................................................................................26

vi
Murray–Darling Basin Authority
Water audit Monitoring report 2010–11
5. revIewoF2010–11wAteruseInvICtorIA............................................................ 28
5.1 Overview .......................................................................................................................................285.1.1 Water Use Capping Measures ........................................................................................285.1.2 Volumes Diverted.............................................................................................................295.1.3 Off–Quota ..........................................................................................................................295.1.4 Deliveries .........................................................................................................................295.1.5 Trading ..............................................................................................................................295.1.6 Environmental Flows ......................................................................................................29
5.2 Goulburn .......................................................................................................................................305.3 Broken ..........................................................................................................................................315.4 Loddon ..........................................................................................................................................315.5 Campaspe ....................................................................................................................................315.6 Wimmera–Mallee ........................................................................................................................325.7 Kiewa ............................................................................................................................................325.8 Ovens ............................................................................................................................................325.9 Murray (including Mitta Mitta) ...................................................................................................32
6. revIewoF2010–11wAteruseInsouthAustrAlIA............................................ 34
6.1 Overview .......................................................................................................................................346.2 Impact of recovery from drought conditions............................................................................346.3 River Murray Water Management .............................................................................................356.4 River Murray Water Use .............................................................................................................356.5 Metropolitan Adelaide and Associated Country Areas ...........................................................356.6 Country Towns .............................................................................................................................366.7 Lower Murray Swamps ..............................................................................................................366.8 All Other Purposes of water from the River Murray ...............................................................366.9 Water Trade ..................................................................................................................................376.10 Environmental Watering .............................................................................................................38
7. revIewoF2010–11wAteruseInQueenslAnd.................................................... 39
7.1 Water Planning and Management Overview ............................................................................397.1.1 Moonie, Warrego, and Paroo Rivers and Nebine Creek .............................................397.1.2 Border Rivers ...................................................................................................................397.1.3 Condamine and Balonne.................................................................................................407.1.4 Metering ............................................................................................................................407.1.5 Water Use Efficiency (WUE)............................................................................................40
7.2 Stream Flow and Water Use Overview .....................................................................................407.3 Warrego ....................................................................................................................................... 437.4 Paroo ........................................................................................................................................... 447.5 Nebine .......................................................................................................................................... 447.6 Moonie ......................................................................................................................................... 447.7 Queensland Border Rivers .........................................................................................................457.8 Condamine–Balonne ..................................................................................................................46
7.8.1 Condamine .......................................................................................................................467.8.2 Balonne and Maranoa .....................................................................................................47

viiWater audit Monitoring report 2010–11
8. revIewoF2010–11wAteruseInACt...................................................................... 49
8.1 Review of Water Use in the ACT ................................................................................................498.2 Progress of Water Reforms in the ACT ....................................................................................49
9. wAtertrAdIngIntheMurrAy–dArlIngBAsIn.................................................. 50
9.1 History of Water Trading .............................................................................................................50
10. wAterAvAIlABIlItyFortheyeAr2010–11............................................................ 52
10.1 Water Availability .........................................................................................................................5210.1.1 Volumetric Allocations ....................................................................................................5210.1.2 Continuous Accounting ...................................................................................................5210.1.3 Allocation Transferred into Valley ..................................................................................5210.1.4 Carryover from the Previous Year .................................................................................52
10.2 Allocated Water ..........................................................................................................................5310.3 Access to Water Not in the Allocation System ........................................................................53
10.3.1 Supplementary Access (Off‑allocation) and Water–harvesting .................................5310.3.2 Area Licences on Unregulated Streams .......................................................................5310.3.3 Irrigation System Losses ................................................................................................53
10.4 Comparison of Use of Allocated Water with the Allocated Volume ......................................53
11. envIronMentAlwAterAndCApAdjustMents................................................. 59
12. CoMpArIsonoFACtuAlFlowswIthnAturAlFlows...................................... 64
13. IMpoundMentsAndlossesInMAjoron–streAMstorAges........................ 71
14. groundwAteruseIntheBAsIn............................................................................. 75
14.1 Context ..........................................................................................................................................7514.2 Groundwater Data for 2010–11 ..................................................................................................7514.3 Groundwater Use since 1999–2000 ...........................................................................................75
ConClusIon.......................................................................................................................... 78
glossAry.............................................................................................................................. 79
AppendICes
Appendix A: Cap Register—Annual Cap Adjustments for Trade (GL) ......................................................82Appendix B: Cap Register—Annual Cap Targets (GL) Adjusted for Trade and
Environmental Allocations ......................................................................................................84Appendix C: Cap Register—Annual Diversions (GL) ..................................................................................86Appendix D: Cap Register—Annual Cap Credits (GL) ................................................................................88Appendix E: Cap Register—Cumulative Cap Credits (GL) .........................................................................90Appendix F: Cap Register for Metropolitan Adelaide .................................................................................92Appendix G: Cap Register—Annual Cap Adjustments (GL) for Environmental Use ..............................93Appendix H: Cap Register—Difference in Cumulative Cap Credits between
Cap Register 2009–10 and Cap Register 2010–11 .................................................................94

viii
Murray–Darling Basin Authority
Water audit Monitoring report 2010–11
tablesandFigures
tables
Table 1: 2010–11 Cap Compliance by State ...............................................................................................2Table 2: Murray–Darling Basin Diversions in 2010–11 ............................................................................7Table 3: Accuracy of Diversion Estimates in 2010–11 ............................................................................10Table 4: Comparison of Diversions with Cap Levels in 2010–11 ...........................................................19Table 5: Comparison of diversions with Cap levels in 2010–11 for Metro–Adelaide &
Associated Country Areas, South Australia .............................................................................20Table 6: Water Diversions in Queensland since 1993–94 ......................................................................48Table 7: Net Water Entitlement Transfers (excluding environmental transfers) in 2010–11.............51Table 8: Water Allocated in 2010–11.........................................................................................................55Table 9: Carryovers for 2010–11 ...............................................................................................................56Table 10: Use of Allocated Water (excluding environmental water) in 2010–11 ....................................57Table 11: Use of Valley Allocations (excluding environmental allocations) in 2010–11 ........................58Table 12: Environmental Water Entitlements in 2010–11 ........................................................................60Table 13: Environmental Water Allocations in 2010–11 ...........................................................................61Table 14: Environmental Water Use in 2010–11........................................................................................62Table 15: Cap Adjustment for Environmental Water Use in 2010–11 .....................................................63Table 16: Comparison of 2010–11 Actual and Natural Annual Flows for Key Sites within
the Murray–Darling Basin ..........................................................................................................65Table 17: Impoundments and Losses in Major On–Stream Storages (greater than
10 GL capacity) in 2010–11 ..........................................................................................................72Table 18: Basin–wide Groundwater data for 2010–11 aligned along the designated Cap valleys .....76
Figures
Figure 1: Murray–Darling Basin Diversions—1983–84 to 2010–11 ..........................................................8Figure 2: Murray–Darling Basin Diversions—1983–84 to 2010–11 (usage under 1600 GL/yr) .............8Figure 3: Rainfall Deciles for the Murray–Darling Basin for the July 2010 to June 2011 Period ......13Figure 4: Rainfall Deciles for the Murray–Darling Basin for the November 2010 to
April 2011 Period .........................................................................................................................13Figure 5: Temperature Anomaly for the 12 Month Period July 2010 to June 2011 ...............................14Figure 6: Temperature Anomaly for the 3 Month Period December 2010 to February 2011 ..............14Figure 7: Utilisation of allocated water as percentage of the allocated volume since 1997–98 .........54Figure 8: Plots of Flows at Selected Sites Showing 2010–11 Actual and Natural (Modelled)
Flows in Victoria ..........................................................................................................................66Figure 9: Plots of Flows at Selected Sites Showing 2010–11 Actual and Natural (Modelled)
Flows in Murray River .................................................................................................................69Figure 10: Groundwater use in the Basin since 1999–2000 ......................................................................77

1Water audit Monitoring report 2010–11
1. Introduction
1. IntroduCtIon
In June 1995, in response to an audit of water use in the Murray–Darling Basin, the Murray–Darling Basin Ministerial Council agreed to cap water use within the Basin. To ensure that the development, management and the operation of the Cap is an open and transparent process, the Ministerial Council agreed that a Water Audit Monitoring Report should be produced and published annually. Subsequently the Cap arrangements were formalised in the form of Schedule E (Former Schedule F1) to the Murray–Darling Basin Agreement in 2000.
This report has been produced as a requirement of Schedule E to the Murray–Darling Basin Agreement.
The water year for the Cap accounting in the Murray–Darling Basin is July to June.
This report outlines water usage in the Basin states by designated river valley (section3.1), includes estimates of the accuracy of water use figures presented (section3.2), provides a climatic overview for the water year (section3.3), defines the Cap for each Basin state (section3.4) and reviews Cap compliance of Basin states (section3.5).
In addition to detailing water use, this report also contains information on the Basin states’ implementation of management rules in designated river valleys that impact on water use within the Basin. Each State has provided a description of their major activities occurring in 2010–11 and further actions that each State plans to undertake over the coming years (sections4to8).
1 In 2008, the amended Murray–Darling Basin Agreement was appended to the Commonwealth Water Act 2007. As part of the amendment, Schedule F was renamed as Schedule E.
Other information provided within this report includes water trading throughout the Basin (section9), water availability for the year (section10), environmental water (section11) a comparison of actual and natural flows at key sites within the Basin (section12), and impoundments and losses in major on–stream storages (above 10 GL capacity) (section13).
section14 provides information on the use of groundwater in the Basin.
The Diversion Cap Register, which is, maintained in accordance with the requirements of Schedule E, is reported in AppendixA–h.
To permit rapid assessment of the findings of this report, table1 summarises the compliance of each of the Basin States with the objectives of the Cap.

2
Murray–Darling Basin Authority
Water audit Monitoring report 2010–11
table1:2010–11CapCompliancebystate
stateterritory 2010–11CapCompliance
newsouthwales
Intersecting Streams A Cap is yet to be defined. The valley is unregulated. The 2010–11 diversion was estimated to be 3 GL.
Border Rivers The New South Wales Border Rivers Cap, was approved by Murray–Darling Basin Ministerial Council in November 2011. NSW is yet to submit the Cap model for audit and approval. The 2010–11 diversion of 192 GL was less than the annual Cap target of 240 GL. The Valley has a cumulative Cap credit of 375 GL since 1997–98.
Gwydir An IQQM Cap model approved by the Authority is available to determine the Cap compliance. The 2010–11 diversion of 271 GL was below the annual Cap target of 383 GL. The Valley has a cumulative Cap credit of 282 GL since 1997–98.
Namoi–Peel An IQQM model approved by the Authority is available to determine Cap compliance for the Namoi–Peel valley. The 2010–11 diversion of 270 GL was below the annual Cap target of 381 GL. The Valley has a cumulative Cap credit of 251 GL since 1997–98.
Macquarie–Castlereagh– Bogan
An IQQM model audited and ready for approval is available to determine Cap compliance. The 2010–11 diversion of 183 GL was below the annual Cap target of 592 GL. The Valley has a cumulative Cap credit of 757 GL since 1997–98.
Barwon–Darling–Lower Darling
An IQQM (Interim) model for the Barwon–Darling has been submitted for audit and The Lower Darling MSM Cap model is being prepared to be resubmitted for audit. These 2 models are used to determine Cap compliance. The combined Barwon–Darling–Lower Darling valley diversion of 123 GL was below its annual Cap target of 297 GL. The valley has a cumulative Cap credit of 215 GL since 1997–98.
Lachlan An IQQM model approved by the Authority is available to determine Cap compliance. The 2010–11 diversion of 90 GL was below the annual Cap target of 120 GL. The Lachlan valley has a cumulative Cap credit of 204 GL since 1997–98.
Murrumbidgee An IQQM model approved by the Authority is available to determine the Cap compliance. The 2010–11 diversion of 1,461 GL for the Murrumbidgee valley was above its Cap target of 1,090 GL. The Valley has a cumulative Cap credit of 658 GL since 1997–98.
Murray The Murray Simulation model (MSM) approved by the Authority is available to determine Cap compliance. The 2010–11 diversion of 689 GL for the Murray valley was below its annual Cap of 978 GL. The Valley has a cumulative Cap credit of 580 GL since 1997–98.
victoria
Goulburn–Broken– Loddon An approved Cap model known as Goulburn Simulation model (GSM REALM) is available to determine Cap compliance. The 2010–11 diversion of 544 GL for the Goulburn–Broken–Loddon system was below its Cap target of 1265 GL. The Valley has a cumulative Cap credit of 1177 GL since 1997–98.
Campaspe An approved Cap model, the GSM REALM, is available to determine Cap compliance. The diversion of 18 GL for the Campaspe in 2010–11 was below its Cap target of 59 GL. The Valley has a cumulative credit of 184 GL since 1997–98.
Wimmera–Mallee A Cap Model approved by the Authority is available to determine Cap compliance. The diversion of 10 GL for the Wimmera Mallee in 2010–11 was below its Cap target of 42 GL and the valley has a cumulative Cap credit of 9 GL since 1997–98.

3Water audit Monitoring report 2010–11
1. Introduction
stateterritory 2010–11CapCompliance
Murray–Kiewa–Ovens The Murray Simulation model (MSM) approved by the Authority is available to determine Cap compliance. The 2010–11 diversion of 563 GL for the Murray–Kiewa–Ovens Cap valley was below its Cap target of 1211 GL and the Valley has a cumulative credit of 1737 GL since 1997–98.
southAustralia
Metro–Adelaide & Associated Country Areas
The 2010‑11 diversions for the Metro Adelaide and Associated Country Areas was 56 GL. The 5 year rolling diversion upto and including 2010‑11 was 555 GL. This was below the 5 year rolling Cap of 650 GL. Pending final decision, a separate ‘first use licence’ has been created to accommodate growth in Metro Adelaide diversions. The five–year total diversion under the ‘first use licence’ was zero.
Lower Murray Swamps The 2010–11 diversion of 14 GL for the Lower Murray Swamps was below its annual Cap target of 35 GL for 2010–11. The valley has a cumulative credit of 27 GL since 1997–98.
Country Towns The 2010–11 diversion of 34 GL for the Country Towns was below its annual Cap target of 36 GL. The Country Towns valley has a cumulative credit of 63 GL since 1997–98.
All Other Purposes A regression model approved by the Authority is available to determine Cap compliance. The 2010–11 diversion of 257 GL for the All Other Purposes was below its annual Cap target of 266 GL. The Valley has a cumulative credit of 771 GL since 1997–98.
Queensland
Condamine and Balonne The Cap proposal for Condamine–Balonne was endorsed by the Authority in March 2011. The Cap model for this valley has been submitted for audit and approval. The 2010–11 diversion of 1064 GL was below its annual Cap target of 1728 GL. The Valley has a cumulative credit of 665 GL since 1997–98.
Border Rivers–Macintyre Brook
An IQQM model yet to be approved is available to determine the Cap compliance. The 2010–11 diversion of 421 GL was below its annual Cap target of 601 GL. The Valley has a cumulative credit of 260 GL since 1997–98.
Moonie An IQQM model approved by the Authority is available to determine the Cap compliance. The 2010–11 diversion of 29 GL was below its annual Cap target of 77 GL. As per its Cap definition, the Valley cannot accumulate Cap credit.
Nebine An IQQM model approved by the Authority is available to determine the Cap compliance. The 2010–11 diversion of 0.2 GL was below its annual Cap target of 3 GL. As per its Cap definition, the Valley cannot accumulate Cap credit.
Warrego An IQQM model approved by the Authority is available to determine the Cap compliance. The 2010–11 diversion of 11 GL was below its annual Cap target of 94 GL. As per its Cap definition, the Valley cannot accumulate Cap credit.
Paroo An IQQM model approved by the Authority is available to determine the Cap compliance. The 2010–11 diversion of 0.1 GL was equal to its annual Cap target of 0.1 GL. As per its Cap definition, the Valley cannot accumulate Cap credit.
AustralianCapitalterritory The ACT long‑term Cap has been agreed, But a Cap model is not yet available to determine Cap compliance. The 2010–11 diversion was 6 GL.

4
Murray–Darling Basin Authority
Water audit Monitoring report 2010–11
2. BACkground
2.1 AuditofwateruseintheMurray–darlingBasin,june1995
In June 1995, the former Commission (now Authority) completed an audit of water use in the Murray–Darling Basin (An Audit of Water Use in the Murray–Darling Basin, Murray–Darling Basin Ministerial Council, Canberra, 1995). This audit revealed that water diversions from the rivers within the Basin had increased by 8% in the previous six years and were averaging 10,800 GL/year.
This level of diversion had significantly reduced the flows in the bottom end of the River Murray. It is currently estimated that median annual flow from the Basin to the sea is only 27% of the flow that would have occurred prior to development. The reduction in flow had occurred most significantly for the small to medium size flood events. Many of these events were completely harvested and the frequency of these flood events had been significantly reduced. It was also found that the end of the river system was experiencing severe drought–like flows in over 60% of years compared with 5% of years under natural conditions.
The change in flow regime has had a significant impact on river health. There has been a contraction in the areas of healthy wetland, native fish numbers have declined in response to the reduction in flow triggers for spawning, salinity levels have risen and algal blooms have increased in frequency in line with the increased frequency of periods of low flow. Further deterioration in river health could be expected if diversion levels were to increase.
The audit examined the scope for diversions to grow further under the water allocation system that existed prior to the Cap. The water allocation system evolved at a time when water managers were trying to encourage development of the water resources of the Basin. As such the system rationed water during periods of shortage but was not effective for controlling diversion
during normal non–drought conditions. It was reported that, in the five years before the water audit, only 63% of the water that was permitted to be used was used. The audit found that average diversions could increase by a further 15% if all existing water entitlements were fully developed. Such an increase would reduce the security of supply to existing water users as well as exacerbating river health problems.
2.2 theCapThe water audit report was presented to the Murray–Darling Basin Ministerial Council in June 1995. The Council determined that a balance needed to be struck between the significant economic and social benefits that have been obtained from the development of the Basin’s water resources on the one hand, and the in‑stream uses of water in the rivers on the other. The Council agreed that diversions in the Basin had to be capped. An Independent Audit Group (IAG) was appointed to report on the level at which diversions should be capped. In doing so, the Group took into account the equity issues between the States.
In December 1996, Council considered the Independent Audit Group’s report and agreed that:
• For New South Wales and Victoria the Cap is the volume of water that would have been diverted under 1993–94 levels of development plus allowances in the Border Rivers for Pindari Dam (New South Wales) and in the Goulburn–Broken–Loddon system for Lake Mokoan (Victoria);
• For South Australia, All Other Purposes diversions were capped at 440.6 GL. This represents an increase in diversions over 1993–94 levels of development but they are below allocations which were established in 1969 when a state cap was imposed; and

5Water audit Monitoring report 2010–11
2. Background
• The Cap for Queensland would be determined after the independently audited Water Allocation and Management Planning (WAMP) and Water Management Planning (WMP) processes had been completed.2
Subsequently, the Australian Capital Territory joined the Murray–Darling Basin Initiative under a Memorandum of Understanding (MoU) and agreed to participate in the Cap following the completion of discussions with the then Murray–Darling Basin Commission (MDBC), the IAG and other jurisdictions. The ACT is now a full member of Murray–Darling Basin Initiative.
Through capping diversions at the 1993–94 levels of development in the two major water using states coupled with the Caps for South Australia, and Queensland and the ACT, the Ministerial Council effectively established a new framework for water sharing in the Basin. Because of the value placed on water rights, it is important that each State is only using water in line with its Cap. For this reason, the implementation of the Cap required an integrated reporting framework including significant improvements to the way that diversions are monitored and reported.
The Council in 2000 formalised the Cap arrangements by adopting a new schedule (Schedule F) to the Murray–Darling Basin Agreement. Subsequently Schedule F was amended by the Council in 2008. Key amendments include:
• The elaboration of the purpose clause to enable all forms of consumptive surface water use including water from waterways and distributed surface waters (e.g. floodplain harvesting) to be included in the Cap;
• Adoption of a protocol authorising the former Commission (Authority) to adjust the Cap for recovery and use of environmental water;
• Formal inclusion of the Diversions Formula Register in the Schedule;
• Caps for Queensland and ACT defined; and
• Updated definitions for the South Australia Caps.
2 Subsequently named as Water Resources Planning
Following an Intergovernmental Agreement reached in July 2009, the Murray–Darling Basin Agreement was amended and made part of the amended Water Act (Commonwealth) 2007. Schedule F was renamed as Schedule E as part of the amendments to the Murray–Darling Basin Agreement.
This report is a part of the ongoing Cap monitoring process under Schedule E. Given the major change in attitude to the allocation and use of water that has occurred as a result of the Cap, there has been need for significant development of monitoring and reporting systems by the State agencies. In particular, some of the technology based support systems (e.g. improved river modelling), are proving to be more involved, time consuming and labour intensive than originally anticipated.
Thus required outcomes, including water user and catchment community understanding and acceptance, are taking longer to be achieved. As such, this report does not present a complete and final picture, rather it presents information currently available, highlights areas where information is still unavailable and directions proposed to improve monitoring and reporting performance.
2.3 IAgreviewofCapImplementation2010–11
As required by Schedule E, the Independent Audit Group audited the performance of each State and Territory in progressing the implementation of the Cap during 2010–11 (Review of Cap Implementation 2010–11, published by the Murray–Darling Basin Authority, October 2010, Canberra).
The present report represents the fifteenth in a series of annual reports and complements the report of the IAG. The data presented herein are the latest figures for the 2010–11 water year and supersede the data reported by the IAG. Most notably, the Murray–Darling Basin diversions in 2010–11 reported in this present report (table2) supersede those reported by the IAG in October 2011 (table19 of that report).

6
Murray–Darling Basin Authority
Water audit Monitoring report 2010–11
3. theyeArInrevIew
3.1 waterdiversionsThe data presented in this report has been collected by the relevant State agencies and collated by the Murray Darling Basin Authority. Accurate diversion data is difficult to obtain, as it requires the collection and collation of thousands of individual water use figures. table2 presents the overall water diversion figures for the Basin in 2010–11.
The figures indicate that Basin water use in 2010–11 was 6,311 GL, representing the fifth lowest on record (27 years of record since 1983–84). Water diversions were lowest on record in South Australia, Victoria and the ACT, fifth lowest on record in New South Wales, whilst diversions were highest on record in Queensland.
Figure1 shows the water diversions (by State) for the period 1983–84 – 2010–11 which enables a comparison of 2010–11 water diversion with that of previous years.
Figure2 shows the same data as Figure1 but has the vertical axis rescaled so that the variation for States with lower overall diversions is visible.
Not all diversions are metered and some diversions have to be estimated based on area irrigated or duration of diversion. section3.2 provides some indication as to the accuracy of the measurements.

7Water audit Monitoring report 2010–11
3. The year in review
table2:Murray–darlingBasindiversionsin2010–11
systemIrrigationdiversion
(gl)otherdiversion1
(gl)totaldiversion
(gl)
newsouthwales2
Intersecting Streams 3 0 3
Border Rivers 191 1 192
Gwydir 268 3 271
Namoi–Peel 265 5 270
Macquarie–Castlereagh–Bogan 173 10 183
Barwon–Darling 95 0 95
Lachlan 82 8 90
Murrumbidgee4 1,415 46 1,461
Lower Darling 27 1 28
Murray 662 27 689
totalnewsouthwales3 3,182 102 3,283
victoria2
Goulburn 480 33 513
Broken 4 1 6
Loddon 23 2 25
Campaspe 9 10 18
Wimmera–Mallee 0 9 10
Kiewa 1 0 1
Ovens 1 5 6
Murray 523 33 556
totalvictoria 1,041 94 1,136
southAustralia
Metro–Adelaide & Associated Country Areas
0 56 56
Lower Murray Swamps5 14 0 14
Country Towns 0 34 34
All Other Purposes 247 10 257
totalsouthAustralia 260 101 361
Queensland2
Condamine–Balonne 1,061 2 1,064
Border Rivers 410 1 411
Macintyre Brook 10 0 10
Moonie 29 0 29
Nebine 0 0 0
Warrego 11 0 11
Paroo 0 0 0
totalQueensland 1,522 3 1,525
AustralianCapitalterritory6 0 6 6
totalBasin 6,005 306 6,311
1. “Other Diversion” includes domestic & stock, town & industrial uses (Qld figures included with Irrigation Diversion).
2. New South Wales, Victoria and Queensland diversions include an estimate of unregulated stream diversions.
3. An estimate of New South Wales floodplain diversions is not available for 2010–11.
4. Lowbidgee diversions are included in the Murrumbidgee valley diversions.
5. Some water use by Lower Murray Swamp irrigators is based on an estimate of water use, while for farms that have meters the metered volume is used. The metering of diversions is currently being implemented.
6. ACT diversions are reported as a net figure. The primary usage in the ACT is for urban supply, which has a high return component (approximately 50%).

8
Murray–Darling Basin Authority
Water audit Monitoring report 2010–11
Figure1:Murray–darlingBasindiversions—1983–84to2010–11
Figure2:Murray–darlingBasindiversions—1983–84to2010–11(usageunder1600gl/yr)
14000
12000
10000
8000
6000
4000
2000
0
1984
1985
1986
1987
1988
1989
1990
1991
1992
1993
1994
1995
1996
1997
1998
1999
2000
2001
2002
2003
2004
2005
2006
2007
2008
2009
2010
2011
Year Ending June
Ann
ual D
iver
sion
(GL)
Victoria ACT Total BasinNew South Wales South Australia Queensland
1800
1600
1400
1200
1000
800
600
400
200
0
1984
1985
1986
1987
1988
1989
1990
1991
1992
1993
1994
1995
1996
1997
1998
1999
2000
2001
2002
2003
2004
2005
2006
2007
2008
2009
2010
2011
Year Ending June
Ann
ual D
iver
sion
(GL)
QueenslandSouth Australia ACT

9Water audit Monitoring report 2010–11
3. The year in review
3.2 AccuracyofMeasurementAn attempt has been made to assess the accuracy of the diversion estimates in each river valley. Many of the diversions are measured reliably using either metered pumps or gauged off–take channels. However, a second category of diversions is estimated from regional surveys of areas planted and a third category of estimates is based only on user returns which have proved to be very inaccurate.
table3 outlines the indicative confidence the States have in their diversion estimates as reported in table2. To derive the accuracy figures in table3, metered diversions have been assumed to have an accuracy of ± 5%, regional surveys ± 20% and user returns ± 40%. Accuracy for individual valleys has been calculated by volumetrically weighting the accuracy of bulk off–takes (direct diversion points) in that valley.
Analysis of reported diversions for 2010–11 indicates that the accuracy of measurement is 14%. In comparison to 2009–10, it has gone down. This is due to relatively higher volume of diversion in valleys (e.g. Queensland Cap valleys), where the accuracy of diversion is lower.
Diversions in the Lower Murray Swamps, South Australia, were previously not metered; however a rehabilitation program was implemented by the State Government in order to meter all properties. Ninety eight percent of these diversions are metered now. It is expected that the accuracy of measurement will improve over time as volumetric conversion is implemented in Queensland and metering is extended to areas in New South Wales (unregulated) and Queensland which are not currently metered.
It is to be noted that the estimates of accuracy in table3 are indicative accuracy of bulk diversions only and do not in any way, indicate the accuracy of farm gate diversion measurement in an irrigation area. A Murray–Darling Basin Authority (former Commission) study (2006) found that accuracy data on the majority of individual bulk off‑takes were not available. Accuracy estimates presented here are based on the assumptions mentioned above, rather than actual data. States are currently developing plans to implement new metering standards developed under the National Water Initiative. These state plans provide input to a national metering plan. Under the national metering plan developed by the Australian Government Department of Sustainability, Environment, Water Population and Communities (formerly the Australian Government Department of Environment, Water, Heritage and the Arts), the bulk‑off‑takes measurements get a priority. This will provide an opportunity to re‑assess the accuracy figures in table3 when new metering standards has been applied.

10
Murray–Darling Basin Authority
Water audit Monitoring report 2010–11
table3:Accuracyofdiversionestimatesin2010–11
systemdiversion
(gl)Accuracy
+/–glAccuracy
+/–%
newsouthwales
Intersecting Streams 3 1 40%
Border Rivers 192 18 10%
Gwydir 271 29 11%
Namoi–Peel 270 53 20%
Macquarie–Castlereagh–Bogan 183 22 12%
Barwon–Darling 95 19 20%
Lachlan 90 10 11%
Murrumbidgee 1,461 118 8%
Lower Darling 28 4 13%
Murray 689 98 14%
totalnewsouthwales 3,283 372 11%
victoria
Goulburn 513 26 5%
Broken 6 1 10%
Loddon 25 1 5%
Campaspe 18 1 5%
Wimmera–Mallee 10 0 5%
Kiewa 1 0 11%
Ovens 6 0 4%
Murray 556 59 11%
totalvictoria 1,136 89 8%
southAustralia
Metro–Adelaide & Associated Country Areas 56 3 5%
Lower Murray Swamps 14 1 5%
Country Towns 34 2 5%
All Other Purposes 257 16 6%
totalsouthAustralia 361 21 6%
Queensland
Condamine–Balonne 1,064 302 28%
Border Rivers 411 97 24%
Macintyre Brook 10 1 5%
Moonie 29 12 40%
Nebine 0 0 40%
Warrego 11 4 37%
Paroo 0 0 40%
totalQueensland 1,525 416 27%
AustralianCapitalterritory 6 0 5%
totalBasin 6,311 899 14%

11Water audit Monitoring report 2010–11
3. The year in review
3.3 Climaticoverview2010–11
3.3.1 rainfallFigure3shows the rainfall deciles for the period of July 2010 to June 2011 inclusive. The whole of the Basin received average or higher than average rainfall.
A continuous strip on the northern periphery of the Basin extending up to the Queensland–New South Wales border, with the exception of a small pocket surrounding the town of Condamine in Queensland, received highest on the record rainfall. Two other regions also received highest on the record rainfall. The first region was a large continuous area encompassing the towns of Menindee in New South Wales and Mildura, Bendigo and Maryborough in Victoria. The second region was three small pockets surrounding the town of Albury in New South Wales, Mt Barker in South Australia, and a small area in Danggali Conservation Park in South Australia.
Approximately three fourths of the Basin received very much above average rainfall.
With the exception of two small pockets, a large irregular shaped area encompassing the towns of Cunnamulla and St George in Queensland and Brewarrina and Narrabri in NSW received above average rainfall. Five areas on the eastern periphery of the Basin surrounding the towns of Gulgong, Cassillis, Oberon, Goulburn and Cooma in NSW and another near the mouth of the Basin also received above average rainfall.
Two small pockets surrounding the towns of Thallon and Noorama in Queensland received average rainfall.
Figure4 shows the rainfall deciles for the period of November 2010 to April 2011 inclusive. During this period also, the whole of the Basin received average or higher than above average rainfall.
Most of the southern connected Basin experienced highest on the record rainfall. A narrow strip on the northern periphery of the north of the Basin encompassing the towns of Roma, Miles and Toowoomba in Queensland also experienced highest on the record rainfall.
One thirds of the Basin comprising the middle and northern experienced very much above average rainfall. A large continuous area extending from the north of the Basin encompassing the towns of Quilpie, Mitchell, Tara and Warwick in Queensland and most of the west and south of NSW experienced very much above average rainfall. Few small patches surrounding towns of Dubbo and Coonamble in NSW; Canberra in ACT; Omeo and Benalla in Victoria and Murray Bridge and Burra in South Australia also experienced very much above average rainfall.
A large continuous and irregular shaped area in the northern central Basin encompassing the towns of Charleville, Eula and Goondiwindi in Queensland and Tamworth, Walgett, Parkes and Oberon in NSW received above average rainfall.
Three areas in the northern part of the Basin, a continuous irregular shaped area encompassing the towns of Cunnamulla in Queensland and Narrabri in New South Wales; two small pockets surrounding the town of Bargunyah in Queensland and Coolabah in NSW received average rainfall.
3.3.2 temperatureFigure5 shows the temperature anomaly (the difference between the recorded temperatures and the long–term average temperatures) for the period of July 2010 to June 2011 inclusive. Lower than the average temperatures were experienced in the whole of the Basin.
A large continuous area encompassing the towns of Charleville and St George in Queensland and a small pocket surrounding the town of Wilcannia in New South Wales experienced extremely lower (between ‑2.0˚C and ‑1.5˚C) than average temperatures.
A significantly large continuous irregular area in the north west of the Basin in Queensland and New South Wales extending to the border of NSW–Victoria in the Basin experienced significant lower (between ‑1.5˚C and ‑1.0˚C) than average temperatures.
A continuous area extending from east of the Basin in Queensland and NSW to the south of the Basin covering most of Victoria and South Australia experienced mildly lower (between –1.0˚C and ‑0.5˚C) than the average temperature.
12
Murray–Darling Basin Authority
Water audit Monitoring report 2010–11
A continuous strip in the east of Basin encompassing the towns of Tamworth in NSW and Canberra in ACT experienced slightly lower (between ‑0.5˚C and 0.0˚C) than the average temperature. Two isolated pockets encompassing the towns of Horsham in Victoria and Murray Bridge in South Australia also experienced slightly lower (between ‑0.5˚C and 0.0˚C) than the average temperature.
A small area encompassing the towns of Mudgee and Bathurst in NSW experienced slightly higher (between +0.0˚C and +0.5˚C) than the average temperature.
Figure6 shows the temperature anomaly for the period of December 2010 to February 2011 inclusive (the primary irrigation season). Most of the Basin experienced slightly lower (between 0˚C and ‑1˚C) than average temperature.
An irregular shaped area encompassing the town of Roma in Queensland experienced extremely lower (between ‑2˚C and ‑3˚C) than average temperature.
The north of the Basin in Queensland and a large pocket in the south of the Basin along the border of NSW and Victoria experienced mildly lower (between ‑1˚C and ‑2˚C) than average temperature. Two isolated pockets surrounding the towns of Bourke and Ivanhoe in NSW also experienced mildly lower (between ‑1˚C and 2˚C) than average temperature.
A small continuous strip in the east of the Basin encompassing the towns of Tamworth and Goulburn in NSW experienced slightly higher (between 0˚C to +1˚C) than average temperature. An isolated pocket near the town of Hillston in NSW also experienced slightly higher (between 0˚C to +1˚C) than average temperature.
The irrigation demand during the growing season was decreased due to cooler than average temperatures in the southern Basin.

13Water audit Monitoring report 2010–11
3. The year in review
Figure3:rainfalldecilesfortheMurray–darlingBasinforthejuly2010tojune2011period
Figure4:rainfalldecilesfortheMurray–darlingBasinforthenovember2010toApril2011period
10
8-9
4-7
2-3
1
Highest on Record
Very MuchAbove Average
Above Average
Average
Below Average
Very Much BelowAverage
Lowest on Record
Rainfall Decile Ranges
Issued 07/07/2011http://www.bom.gov.au© Commonwealth of Australia 2011, Australian Bureau of Meteorology
10
8-9
4-7
2-3
1
Highest on Record
Very MuchAbove Average
Above Average
Average
Below Average
Very Much BelowAverage
Lowest on Record
Rainfall Decile Ranges
Issued 07/07/2011http://www.bom.gov.au© Commonwealth of Australia 2011, Australian Bureau of Meteorology

14
Murray–Darling Basin Authority
Water audit Monitoring report 2010–11
Figure5:temperatureAnomalyforthe12Monthperiodjuly2010tojune2011
Figure6:temperatureAnomalyforthe3Monthperioddecember2010toFebruary2011
3.0ºC
2.5ºC
2.0ºC
1.5ºC
1.0ºC
0.5ºC
0.0ºC
-0.5ºC
-1.0ºC
-1.5ºC
-2.0ºC
-2.5ºC
-3.0ºC
DARWIN ◆
PERTH ◆
ADELAIDE ◆
◆ HOBART
MELBOURNE
◆ BRISBANE
◆ SYDNEYCANBERRA
Wyndham ◆
◆ DerbyBroome ◆
Pt Hedland ◆
Carnarvon ◆ Meekatharra
Geraldton ◆
◆ Wiluna
◆ Laverton
◆ Kalgoorlie
◆ Wagin
◆ Albany
Eucla Ceduna
Cook◆ Tarcoola
◆ Marree
◆ Oodnadatta
Port Augusta
Horsham ◆ ◆ Albury
◆ Mildura
◆DubboTamworth
◆ GraftonBourke ◆
Portland ◆
Strahan ◆
◆ Burnie
◆ Sale
◆ Wollongong
◆ Newcastle
◆ Bega
◆ Esperance
Giles ◆
◆ Katherine
◆ Halls Creek
Tennant Creek
◆ Alice Springs
◆ Birdsville◆ Charleville
◆ Longreach
◆ Bundaberg
◆ Rockhampton
◆ Mackay◆ Hughenden
◆ Mt Isa
◆ Normanton
◆ Townsville
◆ Cairns
◆ Cooktown
Weipa ◆◆ Gove
QUEENSLAND
NORTHERNTERRITORY
WESTERNAUSTRALIA
VICTORIA
NEW SOUTH WALES
TASMANIA
SOUTH AUSTRALIA
◆
◆
◆
◆
◆
◆ ◆
◆
◆
Maximum Temperature Anomaly (°C)1 July 2010 to 30 June 2011Product of the National Climate Centre
Australian Government Bureau of Meteorology
http://www.bom.gov.au© Commonwealth of Australia 2011, Australian Bureau of Meteorology Issued 04/07/2011
3.0ºC
2.5ºC
2.0ºC
1.5ºC
1.0ºC
0.5ºC
0.0ºC
-0.5ºC
-1.0ºC
-1.5ºC
-2.0ºC
-2.5ºC
-3.0ºC
DARWIN ◆
PERTH ◆
ADELAIDE ◆
◆ HOBART
MELBOURNE
◆ BRISBANE
◆ SYDNEYCANBERRA
Wyndham ◆
◆ DerbyBroome ◆
Pt Hedland ◆
Carnarvon ◆ Meekatharra
Geraldton ◆
◆ Wiluna
◆ Laverton
◆ Kalgoorlie
◆ Wagin
◆ Albany
Eucla Ceduna
Cook◆ Tarcoola
◆ Marree
◆ Oodnadatta
Port Augusta
Horsham ◆ ◆ Albury
◆ Mildura
◆DubboTamworth
◆ GraftonBourke ◆
Portland ◆
Strahan ◆
◆ Burnie
◆ Sale
◆ Wollongong
◆ Newcastle
◆ Bega
◆ Esperance
Giles ◆
◆ Katherine
◆ Halls Creek
Tennant Creek
◆ Alice Springs
◆ Birdsville◆ Charleville
◆ Longreach
◆ Bundaberg
◆ Rockhampton
◆ Mackay◆ Hughenden
◆ Mt Isa
◆ Normanton
◆ Townsville
◆ Cairns
◆ Cooktown
Weipa ◆◆ Gove
QUEENSLAND
NORTHERNTERRITORY
WESTERNAUSTRALIA
VICTORIA
NEW SOUTH WALES
TASMANIA
SOUTH AUSTRALIA
◆
◆
◆
◆
◆
◆ ◆
◆
◆
Maximum Temperature Anomaly (°C)
1 December 2010 to 28 February 2011
Product of the National Climate Centre
Australian Government Bureau of Meteorology
http://www.bom.gov.au© Commonwealth of Australia 2011, Australian Bureau of Meteorology Issued 01/03/2011

15Water audit Monitoring report 2010–11
3. The year in review
3.4 definitionofCapThe Council formalised its 1996 decision to set the Cap by adopting in 2000 a new Schedule (Schedule F) to the Murray–Darling Basin Agreement. Schedule F was subsequently amended in 2009. Following an Intergovernmental Agreement reached in July 2009, the Murray–Darling Basin Agreement was amended and made part of the amended Water Act (Commonwealth) 2007. Schedule F was renamed as Schedule E as part of the amendments to the Murray–Darling Basin Agreement.
Schedule E defines the States’ long‑term Cap for:
• New South Wales as the volume of water that would have been diverted under 1993–94 levels of development plus an allowance in the Border Rivers for Pindari Dam;
• Victoria as the volume of water that would have been diverted under 1993–94 levels of development plus an allowance (initially 22 GL/year) for Lake Mokoan in the Goulburn–Broken–Loddon system;
• South Australia at:
− a total of 650 GL over any five–year period for urban water supply delivered to Metropolitan Adelaide and Associated Country Areas;
− 50 GL/year to supply water to Country Towns;
− 94.2 GL/year for the Lower Murray Swamps comprising (i) 72.0 GL/year for swamp use with unrestricted trade and (ii) 22.2 GL/year non‑tradable environmental entitlement; and
− a long‑term average diversion for ‘All Other Purposes’ of Water from the River Murray of 449.9 GL/year.
• Queensland as the volume of water that would have been diverted under the conditions set out for each river valley in the Resource Operation Plan first adopted by the Government of Queensland in that river valley and published in the Queensland Government Gazette; and
• The Australian Capital Territory as 40 GL plus an allowance for population growth beyond 2006–07. The growth allowance is to be calculated by multiplying 0.75, the per capita consumption of 2006–07 and population growth beyond 2006–07 of the ACT and Queanbeyan. The ACT Cap was agreed by the Council in May 2009.
Queensland finalised the Resource Operations Plans for the Warrego, Paroo, Nebine, and Moonie valleys in early 2006 and submitted Cap proposals for these valleys. Council in 2007 agreed to the Caps for these valleys to apply from 2007–08. Following the completion of the Resource Operation Plan for the Border Rivers in March 2009, Queensland submitted a Cap proposal in October 2009, which was endorsed by the Authority in April 2009. On the completion of Resource Operations Plan, Queensland submitted the Cap proposal for Condamine Balonne in November 2010, which was endorsed by the Authority in March 2011. With the submission of the Cap proposal for Condamine Balonne, capping process for all Queensland Murray–Darling Basin valleys is now complete.
The Cap in New South Wales and Victoria is not the volume of water that was used in 1993–94. Rather, the Cap in any year is the water that would have been used with the infrastructure (pumps, dams, channels, areas developed for irrigation, management rules, etc.) that existed in 1993–94, taking into account the climatic and hydrologic conditions that were experienced during the year under consideration. A primary task in monitoring the Cap in these States is determining the size of the Cap target for each year. This calculation is done at the end of each year and uses the observed climatic and hydrologic data. In the south of the Basin, this will tend to result in lower Cap targets in years when there is significant rainfall in the irrigation areas and larger Cap targets in years with less rainfall when demand is higher. However, the annual Cap target will also be affected by the availability of water. In very dry years in the south of the Basin, the annual Cap target will reflect the resource constraints. In the north of the Basin, the Cap target will be very much affected by the opportunities to harvest water into on–farm storages.

16
Murray–Darling Basin Authority
Water audit Monitoring report 2010–11
Because of these complexities, the calculation of the Cap targets is made by use of computer models with relationships for water use that include a range of climatic factors and detailed modelling of flows and storage behaviour. Auditing and approving these models is a major task. Cap models have been developed for most of Cap valleys, for which Caps have been agreed. Out of 24 Cap valleys, Caps have not been defined in 1 valley and 2 other valleys do not require a Cap model. The remaining 21 Cap valleys have 23 models as two valleys comprise 2 sub valleys and have separate Cap models. Out of 23 Cap models, 16 Cap valley models have been audited and 15 approved (1 more, Macquarie ready for approval), 4 Cap models are being audited and 3 models (NSW Border Rivers, Metro Adelaide and ACT) are yet to be submitted for audit.
The annual Cap targets, calculated with the help of Cap models are adjusted for water trades and environmental use of water if applicable.
The calculation for the Cap in South Australia is relatively straight forward; although the Cap for the fourth category of South Australian diversions described above is a long–term climate–adjusted annual average of 449.9 GL. A regression–based accredited model calculates the annual Cap target, which is then adjusted for trade. In the calculation of the Metro–Adelaide Cap, the allocation of 650 GL over 5 years is designed to provide a water supply with 99% security to a major urban city of over 1 million people. This allocation has been based on a 200–year simulation of the amount needed from the River Murray to supplement the primary source from the Mount Lofty Ranges. Actual demand will vary from between about 20 GL (or 10% of Adelaide’s needs) to about 190 GL (or about 95% of demand).
Water diversions for 2010–11 are for the fifteenth water year to be covered by the Cap in the Murray–Darling Basin.
The Ministerial Council has agreed that a State’s compliance with the Cap will be tested against the cumulative difference between actual diversions and the calculated Cap targets from 1 July 1997 onwards (Appendixe). If that difference exceeds the trigger provisions specified in Schedule E to the Murray–Darling Basin Agreement, the Authority must direct
the IAG to conduct a special audit of the performance of that State Government in implementing the long–term diversion Cap in the relevant designated river valley. Upon receiving a special audit report from the IAG, which contains a determination that a State has exceeded the long–term diversion Cap in a designated river valley, the Authority must then declare that the State has exceeded the Murray–Darling Basin diversion Cap and must report the matter to the next meeting of the Ministerial Council.
A slightly different approach for Queensland’s Warrego, Paroo, Nebine and Moonie Cap valleys has been agreed by the Council. A special audit will be triggered if the annual diversions exceed the calculated Cap target for the water year. This is in response to the different climatic conditions in the upper Murray–Darling Basin and the rules–based approach to Cap setting agreed to for Queensland.
3.5 Comparisonof2010–11waterusewiththeCap
A comparison of 2010–11 water use with the Cap for each State is as follows:
3.5.1 newsouthwalesCap compliance in 2010–11 within New South Wales varied between valleys (table4).All New South Wales valleys are in cumulative credit since 1997–98.
The Cap models for all New South Wales valleys , where Cap is defined, are available now. The Lachlan, Namoi, the NSW Murray (contained in the Murray Simulation Model (MSM) suite of Cap models), Gwydir and Murrumbidgee Cap models, after an independent audit, were approved by the Authority under Schedule E. The Macquarie Cap model after the audit has been submitted to the Authority for its approval. Lower Darling Cap model will be resubmitted for audit and expected to be accredited by the Authority during 2012. Barwon‑Darling Cap model is currently being audited. The New South Wales Border Rivers Cap was approved by Murray–Darling Basin Ministerial Council in November 2011. NSW has yet to submit this Cap model for audit.

17Water audit Monitoring report 2010–11
3. The year in review
3.5.2 victoriaThe diversions in all Victorian Cap valleys were within their annual Cap target for 2010–11 (table4). All Cap valleys are in cumulative credit since 1997–98.
The Cap models for all designated Victorian valleys have been approved by the MDBA.
Victoria remains committed to the ongoing development and improvement of Cap models, and to the implementation of Bulk Entitlements to ensure compliance with the Cap.
3.5.3 southAustraliaSouth Australian diversions were within their Cap targets for All Other Purposes of water from River Murray, the Country Towns (table4) and the Metro–Adelaide and Associated Country Areas (table5). All Cap valleys in South Australia have substantial cumulative Cap credits.
Cap model for All Other Purposes has been approved by MDBA while Lower Murray Swamps and Country towns do not require a Cap Model. The Cap model for Metropolitan Adelaide and Associated Country Areas is in the advanced stages of development. This is likely to be submitted for audit by August 2012. South Australia continues to undertake improvement programs and forward–moving management initiatives for the sustainability of River Murray water resources and to ensure long–term compliance with the Cap.
3.5.4 QueenslandDiversions in the Border Rivers, Warrego, Paroo, Moonie, and Nebine valleys of Queensland were within their annual Cap targets for 2010–11 (table4). As per its Cap definition, Warrego, Paroo, Moonie, and Nebine valleys cannot accumulate Cap credit. With the finalisation of the Cap for Condamine Balonne, capping process for all Queensland Murray–Darling Basin valleys is now complete.
3.5.5 AustralianCapitalterritoryThe Australian Capital Territory Cap has been agreed but a Cap model to determine its annual Cap target has not yet been developed. There are differences between the Authority and the ACT on the interpretation of the ACT Cap, which are being resolved. Once these differences are resolved, ACT Cap model will be finalised. Diversion in the ACT was within its long term Cap of 40 GL.
3.5.6 BasincomparisonofactualdiversionswiththeannualCaptargets
table4 presents a comparison of actual diversions with the annual Cap targets for New South Wales, Victoria, South Australia (except Metropolitan Adelaide & Associated Country Areas), Queensland and the Australian Capital Territory. The last column in table4is the difference between the modelled and the observed storage at the end of 2010–11.
Usage below the Cap will typically result in the observed storage being greater than the modelled storage. If subsequent years are dry, it is likely that the observed usage will catch up with the Cap as this extra water in storage is allocated and used. If subsequent years are wet, storage may spill and the influence of under–use or over–use will be lost. The storage information therefore qualifies any conclusions that can be drawn on the degree of compliance with the Cap.
table5 presents a comparison of actual diversions with Cap target for Metro–Adelaide & Associated Country Areas, Cap Valley of South Australia.
3.6 Measurementofland–surface(Floodplainharvesting)diversions
The Council Meeting 29–25 August 2000 agreed to the recommendations of the Review of Operation of Cap, which included that “diversions from floodplain and overland flows are included in Cap accounting arrangements as a matter of priority”(recommendation 14).

18
Murray–Darling Basin Authority
Water audit Monitoring report 2010–11
The Authority is committed to bringing the floodplain diversions within the Cap as per the Council’s above decision. It has taken several statutory and administrative measures to this end. These measures include amendments to Schedule E (former Schedule F) and Diversion Formula Register and establishment of two investigation projects to develop a method to estimate land–surface diversions. Significant progress was made and methods and models were developed to estimate the land–surface diversions. Subsequently, the Authority completed the following two projects to improve the estimation, monitoring and reporting of Land Surface Diversions (LSD):
• Estimating Land Surface diversions by on–ground monitoring
• Estimating Land surface diversions using Remote Sensing Techniques.
The projects undertaken demonstrated that an estimation method based upon remotely sensed evapo–transpiration (ET) aided by some on–ground measurement is more practical than that based upon on‑ground monitoring alone. Subject to budgetary constraints, the Authority aims to establish a pilot project in collaboration with NSW and Queensland jurisdictions, for developing and implementing a remote sensing based method for estimating land surface diversion in one catchment each in NSW and Queensland.

19Water audit Monitoring report 2010–11
3. The year in review
Table 4: Comparison of Diversions with Cap Levels in 2010–11
System
Cap Target
from Cap
Model (GL)
Adjustment to Cap
Target for Trade1
(GL)
Adjustment to Cap
Target for Environment
(GL)
Cap Target Adjusted for
Trade and Environment
(GL)
Total Diversion
(GL)
Cap Credit4
(GL)
Cumulative Cap Credit
since 1997–984
(GL)
Cap Target Exceedance
Trigger (20% of
Long–Term Diversion
Cap)5 (GL)
Cumulative Difference (Modelled
minus Observed)
Storage7 (GL)
New South Wales
Intersecting Streams3 n/a 0 0 n/a 3 n/a 0 n/a n/a
Border Rivers3 259 -20 0 240 192 48 375 -39 0
Gwydir 400 0 -17 383 271 111 282 -70 -104
Namoi–Peel 381 0 0 381 270 111 251 -73 -30
Macquarie–Castlereagh–Bogan
652 0 -60 592 183 409 757 -98 -250
Barwon Darling– Lower Darling
468 37 -209 297 123 173 215 -66 379
Lachlan 131 0 -12 120 90 29 204 -67 -107
Murrumbidgee 1,481 -57 -334 1,090 1,461 -372 658 -472 -246
Murray 1,386 -50 -359 978 689 289 580 -382 -91
Total New South Wales 5,159 -89 -991 4,079 3,283 799 3,323 -1,267 -450
Victoria
Goulburn Broken Loddon2 1,427 -135 -27 1,265 544 721 1,177 -407 -68
Campaspe 59 0 0 59 18 41 184 -24 11
Wimmera–Mallee3 87 0 -44 42 10 33 9 -32 64
Kiewa Ovens Murray 987 325 -101 1,211 563 648 1,737 -340 -46
Total Victoria 2,560 190 -172 2,578 1,136 1,443 3,107 -803 -38
South Australia
Metro–Adelaide & Associated Country Areas6
Lower Murray Swamps 94 -60 0 35 14 21 27 -19 n/a
Country Towns 33 2 0 36 34 1 63 -10 n/a
All Other Purposes 404 -68 -70 266 257 9 771 -90 n/a
Total South Australia 532 -125 -70 336 305 32 860 -119 n/a
Queensland
Condamine–Balonne3 1,728 0 0 1,728 1,064 665 665 -146 n/a
Border Rivers & Macintyre Brook3
587 20 -6 601 421 180 260 -50 n/a
Moonie3 77 0 0 77 29 48 n/a AT n/a
Nebine3 3 0 0 3 0 3 n/a AT n/a
Warrego3 94 0 0 94 11 82 n/a AT n/a
Paroo3 0 0 0 0 0 0 n/a AT n/a
Total Queensland 2,489 20 -6 2,503 1,525 978 925 n/a n/a
Australian Capital Territory3
n/a n/a n/a n/a 6 n/a 141 n/a n/a
Note: The sign convention is that a negative Cap credit value denotes an exceedance of the Cap target adjusted for trade in 2010–11. A negative cumulative Cap credit value indicates an exceedance of the Cap target adjusted for trade on a cumulative basis (since 1997–98).
1. Adjustment to Cap target for trade includes exchange rate adjustments for permanent interstate trade and water recovered for environment.
2. Excludes Cap Target for Lake Mokoan.
3. “n/a” denotes Cap model is not completed or Cap target has not been able to be determined.
4. Cap credit is reported as positive and debit as negative
5. Cap target exceedance trigger values are reported as negative values. The 20% cumulative debit trigger for special audit does not apply to the Moonie, Nebine, Warrego and Paroo Cap valleys, where an annual trigger (AT) applies. In these valleys, whenever the annual diversions exceed the annual Cap targets by any amount, a special audit will be triggered.
6. See Table 5.
7. See previous page for explanation on the last column.

20
Murray–Darling Basin Authority
Water audit Monitoring report 2010–11
table5:ComparisonofdiversionswithCaplevelsin2010–11forMetro–Adelaide&AssociatedCountryAreas,southAustralia
southAustralia
totaldiversion
2010–11
totaldiversion—5
yearsuptoandincluding
2010–11
5yearCapdiversion
target
differencebetween
diversionandCap
(gl) (gl) (gl) (gl)
Gross Metro Adelaide and Associated Country Areas
56 555
First Use License 0 0 0 0
Net Metro‑Adelaide & Associated Country Areas against 650 GL 5‑year Rolling Cap
56 555 650 95

21Water audit Monitoring report 2010–11
4. Review of 2010–11 water use in New South Wales
4. revIewoF2010–11wAteruseInnewsouthwAles
4.1 waterManagementoverviewAt the commencement of the 2010–11 water year drought conditions were still continuing across much of NSW. Low or no allocations and low dam levels meant that on–going drought contingency measures were still in place across much of NSW. However the drought was broken in early 2010–11 with substantial and widespread rainfall across the state. The focus swiftly moved from critical water supply under drought conditions to dealing with floods, filling dams and the increasing of water allocations.
The breaking of the drought enabled almost all sharing and management rules under the suspended regulated Water Sharing Plans to recommence. These suspended plans included the NSW Murray, Lower Darling, Murrumbidgee, Lachlan and Macquarie–Cudgegong. In addition, other suspensions and restrictions were able to be lifted including suspensions on individual water accounts and restrictions on the delivery of water to some areas.
Valley Water Sharing Plans are the primary instrument for sharing and managing water resources in NSW. Each Plan includes a long–term diversion management limit (the Plan limit) and rules for adjusting water–sharing if diversions grow beyond the limit set out in the Plan. In all major regulated rivers in the NSW portion of the Basin these Plan limits are below Cap.
The Plan rules are intended to produce environmental benefits, while also ensuring that long–term average diversions do not exceed those which would result from 1993–94 development levels. Assessments of long–term diversions are undertaken annually, and management actions will be undertaken whenever required to ensure that the Plan limit is not exceeded
4.2 wateruseoverviewHigh rainfall resulted in major flooding in most valleys with many storages filling and spilling. This resulted in full allocations in most valleys, and large volumes of allocated water being carried over into 2011–12.
There was also a significant increase in environmental water use in 2010–11 at 601 GL which is more than five times the amount in 2009–10. Most of this environmental water use (77%) was in the Murray and Murrumbidgee Valleys.
Assessment of Cap performance for the 2010–11 water year using computer simulation models indicated that actual diversions were significantly less than the modelled Cap target for each valley. The exception is the Murrumbidgee which had a debit of 372 GL but still maintains a cumulative credit. The cumulative diversions in the Barwon–Darling component of the combined Barwon–Darling and Lower Darling valley remain over Cap, but the combined valley, as used for Cap reporting purposes, remains in credit. No Cap reporting valleys required a special audit.
All diversions are reported using a July to June water year, and are in accordance with the MDBA Register of Diversion Definitions to the extent that availability of information allows.
4.3 environmentalwaterrecoveryThis report now includes information on water recovered for the environment from either water savings projects or the purchase of water entitlements. Over the last few years substantial volumes of water entitlements have been recovered through The Living Murray initiative, NSW’s Riverbank program, projects undertaken by Water for Rivers for the Snowy River, and the Commonwealth entitlement purchase program. The entitlements reported

22
Murray–Darling Basin Authority
Water audit Monitoring report 2010–11
here are those that are formally owned by government for environmental use. There may be further entitlement purchases not reported here where contracts have been exchanged, but the process to list the changed ownership on the NSW Water Access Licence Register is not yet complete.
However, there is additional water made available for environmental purposes through the rules of Water Sharing Plans within NSW. These significant volumes of water are not included in this report, as they do not relate to entitlements and are not accountable under Cap. Whilst work is underway to appropriately reflect these volumes of water for the environment in future reporting, readers need to be aware that this reporting does not yet represent all water committed to environmental purposes within NSW.
4.4 BorderriversA Continuous Accounting allocation system has been used in the NSW Border Rivers since 2001–02. The system provides general security licensees with an individual account, which can be credited with water up to 100% of entitlement and allows the continuous carryover of any unused water. Throughout the year and dependent on resource availability, licensees may receive an allocation increment (Available Water Determination), however the maximum that an individual general security licensee can hold in their account at any time is 100%. In any particular season, the volume of water that each licensee can use from their account is also limited to a maximum of 100%, which is equivalent to a maximum diversion of 246 GL (table8) for the valley.
NSW Border Rivers general security licensees commenced the season with an average of 11% of licensed entitlement in individual accounts, and received multiple increases to allocations throughout the year as more water became available. Total allocations for B class general security licences were around 105% however licensees were still limited to the maximum 100% use and account limits. There was a net inter–valley transfer of 23.3 GL out of the NSW Border Rivers to the Queensland Border Rivers.
Within the regulated river system a total of 164 GL was diverted during 2010–11 in the Border Rivers regulated system, including 94 GL of diversions by supplementary access licences.
Diversions in the unregulated sections of the catchment are not currently monitored in general. However, some users outside of the regulated system in the lower valley are metered. At the time of writing this information was unavailable. For the majority of unregulated users without meters, a volume of 23 GL, representing estimated average use, has been included as an estimate of unregulated diversions in 2010–11. This provided a total diversion of 192 GL from the regulated section of the NSW Border Rivers (table 2).
NSW is preparing a Cap model report for submission to the MDBA for accreditation. Interim modelling results, subject to approval of the proposed Cap for the Border Rivers, indicate a long–term Cap of 195 GL and a 2010–11 Cap target of 240 GL. Modelled results also indicate a cumulative credit since 1997–98.
4.5 gwydirA Continuous Accounting (CA) allocation system is used for general security licences in the regulated section of the Gwydir Valley which provides licensees with an individual account that can hold up to 150% of entitlement and allows continuous carryover of any unused water. At any time they may receive a new allocation increment (dependent on resource availability) up to a maximum account limit of 150%. In any particular season, the volume of water that each licensee can use from their account is limited to a maximum of 125% of licensed entitlement with no more than 300% over any three years.
The Gwydir Valley commenced the season with an average of 2% of licensed entitlement in individual accounts, and received a further of 83% of licensed entitlement as further resources became available during the water year.
Within the regulated river system a total of 227 GL was diverted during 2010–11, including 134 GL of diversions by supplementary access licences.

23Water audit Monitoring report 2010–11
4. Review of 2010–11 water use in New South Wales
Diversions in the unregulated sections of the catchment are not currently monitored in general. However, some users outside of the regulated system in the lower valley are metered. At the time of writing this information was unavailable. For the majority of unregulated users without meters, a volume of 44 GL, representing estimated average use, has been included as an estimate of unregulated diversions in 2010–11. This provided a total diversion of 271 GL for the Gwydir Valley (table 2).
The Gwydir IQQM model has been accredited following independent review of the model. The Cap target is estimated for the regulated system each year using the Gwydir Valley IQQM. This target is the diversion that would have occurred during 2010–11 with management rules and irrigation development at 1993–94 levels. It is not currently possible to assess a 2010–11 Cap target for the unregulated sections of the valley, and the estimated average annual unregulated diversion is also used to represent the unregulated Cap target each year. After adjustments for Licences purchased for the environment are made, the overall Cap Target for 2010‑11 was 383 GL. Under the Murray–Darling Basin agreement, annual Cap performances are cumulated from the 1997–98 water year. For the period from 1997–98 this indicates a cumulative Cap credit of 282 GL (table 4).
4.6 namoi–peelA Continuous Accounting (CA) allocation system is used for general security licences in the regulated section of the Lower Namoi Valley, which provides licensees with an individual account that can hold up to 200% allocation and allows continuous carryover of any unused allocation. At any time they may receive an allocation increment (dependent on resource availability) up to a maximum account limit of 200%. In any particular season, the volume of water that each licensee can use from their account is limited to a maximum of 125% of licensed entitlement with a maximum of 300% over any 3 years.
All high security licences and general security licences in the regulated section of the Peel valley are managed using annual accounts, which are forfeited at the end of each water year. The maximum allocation is 100% of licensed entitlement, which is 48 GL.
In 2010–11 Lower Namoi Valley licensees commenced with an average of 14% of licensed entitlement in individual accounts, and received allocation increases of 109% entitlement during the water year. Peel valley licensees commenced the season with zero allocation and ultimately received an allocation of 100% in early December. The Upper Namoi valley licensees commenced the season with zero allocation however carryover was available. Upper Namoi licensees received a 100% allocation before summer commenced.
Within the regulated river systems a total of 157 GL was diverted during 2010–11, with regulated river licences diverting 147 GL in the Lower Namoi Valley, 3 GL in the Upper Namoi Valley, and 7 GL in the Peel Valley. This includes supplementary access licence diversions of 87 GL in the Lower Namoi Valley during periods of high river flows.
Diversions in the unregulated sections of the catchment are not currently monitored and, a volume of 113 GL, representing estimated average use, has been included as an estimate of unregulated diversions in the Namoi and Peel Valleys. This provided a total diversion of 270 GL for the greater Namoi Valley (table 2).
The Cap target is estimated for the regulated system each year using the Namoi Valley IQQM, which has been accredited for Cap purposes by the MDBA‑appointed independent auditor. This target is the estimated diversion that would have occurred during 2010–11 with management rules and irrigation development at 1993–94 levels.
An IQQM for the Peel Valley regulated system has also been developed and used to assess preliminary Cap performance. The Peel Valley IQQM has also been accredited following independent review of the model. It is not currently possible to assess a 2010–11 Cap target for the unregulated sections of the valley, and the estimated average annual unregulated diversion is also used to represent the unregulated Cap target each year. The combined Cap target for 2010–11 is 381 GL. Under the Murray–Darling Basin agreement, annual Cap performances are cumulated from the 1997–98 water year. For the fourteen water years of Cap accounting since 1997–98, this indicates a cumulative Cap credit of 251 GL (table 4).

24
Murray–Darling Basin Authority
Water audit Monitoring report 2010–11
4.7 Macquarie–Castlereagh–BoganLicensees in the regulated section of the Macquarie Valley commenced the season with an average of 5% of licensed entitlement in individual accounts, and received a further increase of 100% of entitlement through the water year. The Licensees in the regulated section of the Cudgegong Valley commenced the season with an average of 47% of licensed entitlement in individual accounts, and received further allocations totalling 100% throughout the water year. High security licences received their full allocations being 100% of their licensed entitlements.
Within the regulated river systems a total of 143 GL was diverted during 2010–11. This includes diversion by supplementary access licences of 35 GL in the Macquarie Valley.
Diversions in the unregulated sections of the catchment are not currently monitored in general. However, some users outside of the regulated system in the lower valley are metered. At the time of writing this information was unavailable although the volume is not thought to be significant. For the majority of unregulated users without meters, a volume of 35 GL, representing estimated average use, has been included as an estimate of diversions in 2010–11. This provided a total diversion of 183 GL in the Macquarie Valley (table 2).
The Cap for the regulated sections of the Macquarie Valley has been audited using the Macquarie Valley IQQM that has been recommended for accreditation by the independent model auditor.
The Cap target is estimated for the regulated system each year using the Macquarie Valley IQQM. This target is the diversion that would have occurred during 2010–11 with management rules and irrigation development at 1993–94 levels. It is not currently possible to assess a 2010–11 Cap target for the unregulated sections of the valley, and the estimated average annual unregulated diversion is also used to represent the unregulated Cap target each year. After adjustments for Licences purchased for the environment are made, the overall Cap Target for 2010‑11 was 592 GL. Under the Murray–Darling Basin agreement, annual Cap performances are cumulated from the 1997–98 water year. For the period since 1997–98 this indicates a cumulative Cap credit of 757 GL (table 4).
4.8 Barwon–upperdarlingMajor flooding in southern Queensland combined with significant inflows from NSW tributaries have provided substantial flows for the Barwon–Darling throughout 2010–11. The total volume of extractions in the Barwon–Darling in 2010–11 was 95 GL (table 2).
The Cap target is estimated each year using the Barwon–Darling Valley IQQM, which has now been presented for accreditation by the independent auditor. This target is the diversion that would have occurred during 2010–11 with management rules and irrigation development at 1993–94 levels. After adjustments for Licences purchased for the environment are made, the overall Cap Target for 2010‑11 was 156 GL. Under the Murray–Darling Basin agreement, annual Cap performances are cumulated from the 1997–98 water year and since this point in time the cumulative Cap debit for the Barwon–Upper Darling is 93 GL. This exceeds the trigger for Special Auditing of 40 GL.
For Cap auditing purposes however, the Barwon–Darling and Lower Darling valleys are treated as one valley. The combined annual Cap performances totalled from the 1997–98 water year show a cumulative Cap credit of 215 GL (table4).
In recognition of a cumulative Cap debit in previous years, NSW has implemented a Cap Management Strategy to ensure Cap compliance in the Barwon–Darling sub–catchment. The restructured water entitlements and access rules have operated since 2007, and will ensure that long–term average diversions do not exceed the long–term Cap. As the Barwon–Darling is an unregulated river it is acknowledged that water availability will vary significantly between years.
The new Cap arrangements that applied from 1 July 2007 include the reduction of licensed entitlements to the volume of the (then) estimated long–term diversion Cap of 173 GL, and unlimited carryover of allocated water from one water year to the next.
NSW has also previously indicated that if the trend towards increasing Cap debits continued, it would further reduce water made available each year from 173 GL to 143 GL. As an interim measure for 2010–11, access to water in accounts that was carried over from previous water years was suspended, and water users

25Water audit Monitoring report 2010–11
4. Review of 2010–11 water use in New South Wales
were limited to the 173 GL annual allocation. NSW will continue to review the Cap modelling and consider if this proposed reduction in water availability remains appropriate.
The Barwon–Darling IQQM has recently undergone a review and an upgrade to incorporate new information covering the drought–dominated years of the last decade. As a result, the modelled figures have changed and the model is now estimating that the long–term Cap is 198 GL, and the Cap debits are now significantly lower than previously reported. The interim arrangements for 2010–11 will continue for 2011–12, with the exception that the limit for extractions is increased to 198 GL for the 2011–12 water year. Because the model is yet to be accredited, it is anticipated that these interim arrangements will apply for the 2011–12 water only.
4.9 lachlanThe Lachlan valley commenced the 2010–11 water year like numerous immediately preceding years with severely restricted allocations for even high security licences. Domestic and stock licences commenced the water year with an allocation of only 15% of entitlement. High security entitlements only received an initial allocation of 10% and local water utilities were restricted to an initial 50% allocation. General security licensees initially had zero allocations and no access to any carry over water.
Substantial inflows into Wyangla Dam and flooding from downstream tributaries during the year resulted in significant improvements to all allocations by early December. All licensees eventually received an allocation of 100% and in the case of general security licensees, their allocations reached 117%.
A total of 75 GL was diverted from the Lachlan regulated river system during the 2010–11 water year. Diversions in the unregulated sections of the catchment are not currently monitored and, a volume of 15 GL, representing estimated average use, has been included as an estimate of unregulated diversions in the Lachlan Valley. This provided a total diversion of 90 GL for the Lachlan Valley (table2).
The Cap target for the year is estimated for the regulated system each year using the Lachlan Valley IQQM, which was the first model to be accredited for Cap purposes by the independent auditor. This target is the estimated diversion that would have occurred during 2010–11 with management rules and irrigation development at 1993–94 levels. It is not currently possible to assess a 2010–11 Cap target for the unregulated sections of the valley, and the estimated average annual unregulated diversion is also used to represent the unregulated Cap target each year. After adjustments for licences purchased for the environment are made, the overall Cap target is 120 GL. Under the Murray–Darling Basin agreement, annual Cap performances are cumulated from the 1997–98 water year, and the Lachlan valley has accumulated a Cap credit of 204 GL (table4) over this period.
4.10 MurrumbidgeeThe 2010–11 water year in the Murrumbidgee commenced with critically low water availability. In a similar fashion to the Lachlan, high reliability licensees received significantly reduced allocations under drought management arrangements. Domestic and stock licensees and local water utility licensees received initial allocations of 50% whilst high security licensees commenced the water year with an allocation of 20% of entitlement. Improvements in water availability early in the water year enabled these allocations to return to more normal levels before eventually reaching full allocations. Modest allocations were also then able to be made to general security users.
Whilst the general security licensees in the regulated section of the Murrumbidgee Valley commenced the season with zero allocation, they eventually received their full allocations in mid December 2010.
A total of 1036 GL was diverted from the Murrumbidgee regulated river system during 2010–11 including supplementary access licence diversions of 141 GL. For the Lowbidgee Flood Control and Irrigation District, a total of 383 GL was diverted.

26
Murray–Darling Basin Authority
Water audit Monitoring report 2010–11
Diversions in the unregulated sections of the catchment are not currently monitored and, a volume of 42 GL, representing estimated average use, has been included as an estimate of unregulated diversions in the Murrumbidgee Valley. This provided a total diversion of 1,461 GL for the Murrumbidgee Valley (table2). Net trade from the Murrumbidgee valley to other valleys in the southern Basin during 2010–11 was 49 GL.
The Cap target is estimated for the regulated system (including Lowbidgee) each year using the Murrumbidgee Valley IQQM, which has now been accredited for Cap purposes by the Authority. This target is the diversion that would have occurred during 2010–11 with management rules and irrigation development at 1993–94 levels. It is not currently possible to assess a 2010–11 Cap target for the unregulated sections of the valley, and the estimated average annual unregulated diversion is also used to represent the unregulated Cap target each year. After adjustments for inter–valley trade and licences purchased for the environment are made, the overall valley Cap target is 1,090 GL. Under the Murray–Darling Basin agreement, annual Cap performances are cumulated from the 1997–98 water year, and the Murrumbidgee Valley has accumulated a Cap credit of 658 GL (table4) over this period.
4.11 lowerdarlingAll licence categories in the Lower Darling received an initial 100% allocation at the start of the 2010–11 water year. This included supplies for towns, stock and domestic users, as well as high and general security purposes. Net trade out of the Lower Darling during 2010–11 was 11 GL.
A total of 28GL was diverted from the Lower Darling regulated river system during the 2010–11 water year, with regulated river licences accounting for all of the diversions.
The Cap target is estimated for the regulated system each year using the Murray Monthly Simulation Model which is in the process of being resubmitted for accreditation. This target is the diversion that would have occurred during 2010–11 with management rules and irrigation development at 1993–94 levels. After adjustments for inter–valley trade and licences purchased for the environment are made, the preliminary Cap target is 141 GL. Under the Murray–Darling Basin agreement, annual Cap performances are cumulated from the 1997–98 water year, and the Lower Darling has accumulated a cumulative Cap credit of 306 GL over this period.
For Cap auditing purposes however, the Barwon–Darling and Lower Darling valleys are treated as one valley. The combined annual Cap performances totalled from the 1997–98 water year show a cumulative Cap credit of 215 GL.
4.12 MurrayThe Murray also commenced the 2010–11 water year with severe restrictions on allocations for even high reliability licence categories. Domestic and stock licensees and local water utility licensees received initial allocations of 50% whilst high security licensees commenced the water year with a zero allocation before receiving a small allocation of 10% in late July. General security licensees also initially had a zero allocation before receiving the first allocation of 8% in September. Allocations for all licensees then increased to 100% in mid December.
A total of 661 GL was diverted in NSW from the Murray regulated river system during the 2010–11 water year including supplementary access licence diversions of 139 GL. Diversions in the unregulated sections of the catchment are not currently monitored and, a volume of 28 GL, representing estimated average use, has been included as an estimate of unregulated diversions in the NSW Murray Valley. This provided a total diversion of 689 GL for the NSW Murray Valley (table 2).

27Water audit Monitoring report 2010–11
4. Review of 2010–11 water use in New South Wales
The Cap target is estimated for the regulated system each year using the Murray Monthly Simulation Model that has been accredited following the independent review of the model. This target is the diversion that would have occurred during 2010–11 with management rules and irrigation development at 1993–94 levels. It is not currently possible to assess a 2010–11 Cap target for the unregulated sections of the valley, and the estimated average annual unregulated diversion is also used to represent the unregulated Cap target each year. After adjustments for inter–valley trade and licences purchased for the environment are then made, the overall valley Cap target is 978 GL. Under the Murray–Darling Basin Agreement, annual Cap performances are cumulated from the 1997–98 water year. For the fourteen water years of Cap accounting, this indicates a cumulative Cap credit of 580 GL (table 4).
28
Murray–Darling Basin Authority
Water audit Monitoring report 2010–11
5. revIewoF2010–11wAteruseInvICtorIA
5.1 overviewWater availability in the 2010–11 irrigation season was largely driven by above average inflows to all northern Victorian storages, which resulted in significant improvements in stored resources. In 2010–11 irrigators supplied from all systems received allocation of 100% of high–reliability water shares (HRWS) for the first time since 2001–02 season. Allocations in the Campaspe, Broken and Bullarook systems also reached 100% of low–reliability water shares (LRWS).
Despite allocations reaching their highest levels in many years, allocations started at zero for the fourth consecutive year on 1 July 2010.
For the first time since 1999, irrigation areas in the Wimmera Mallee system received a 100% allocation. There was also a 100% allocation for urban, domestic and stock customers supplied from the Wimmera–Mallee pipeline.
Current carryover policy in the Murray, Goulburn and Campaspe systems allows unlimited water to be carried over. This resulted in a large volume of unused water being carried over from 2010–11 to 2011–12. Carryover has allowed irrigators to have water available to use early in a season regardless of the allocation to high–reliability water shares.
The Qualification of Rights that applied in the 2009–10 season to provide a limited supply to domestic and stock, urban and other commercial customers while allocations to high–reliability water shares are low, remained in place at the start of the 2010–11 season. Qualifications also reduce or remove the obligations to meet minimum environmental flows in some cases. Qualifications were in place for all systems except the Ovens, Kiewa and Wimmera–Mallee on 1 July 2010. The Qualifications in the Murray, Goulburn and Broken systems were revoked by the Minister for Water after available resources improved, but remained in place for the entire season in the, Campaspe and Loddon systems.
The summer of 2010–11 was the wettest season on record in Victoria, experiencing several significant rainfalls and flooding events. Flooding occurred downstream of several major storages including storages in the Goulburn, Loddon, Campaspe, Broken, Murray and Ovens systems. There were five distinct flood events occurring in September, November, December, January and February.
For all areas managed by Goulburn–Murray Water, rainfall for the year ending 30 June 2011 was overall well above average. August to March inclusive were wetter than average in nearly all areas, and well above average in the majority of areas.
The summer seasonal rainfall was considerably wetter than average across all locations with a range of 252% average at Eildon to 411% of average at Tatura. Many locations recorded their highest summer rainfall on record including: Rushworth, Boort, Cobram, Lake Eppalock, Lake Buffalo, Goulburn Weir, and Swan Hill.
5.1.1 wateruseCappingMeasuresVictoria has been implementing changes to water management policies under its water reform package since 1990–91. The effectiveness of the policies is continually monitored and reviewed. Bulk Entitlements for the Goulburn, Murray, Ovens, Broken, Campaspe, Loddon and Bullarook river systems are now in place. The Wimmera–Glenelg Bulk Entitlements were revoked in October of 2010 and replaced with new Bulk Entitlement Orders and an Environmental Entitlement.
Carryover of unused allocation mainly contributes to Cap Credits in the year the water was allocated. Unused allocation carried over from 2010–11 to 2011–12 amounted to 1,390 GL in the Victorian Murray valley and 1,140 GL in the Goulburn–Broken–Loddon. In comparison, the carryover from 2009–10 into 2010–11 for the Victorian Murray and Goulburn–Broken–Loddon valley was 501.5 GL and 335 GL respectively. The main factors for

29Water audit Monitoring report 2010–11
5. Review of 2010–11 water use in Victoria
the unused allocation at the end of the 2010–11 season being higher than previous years was the high allocations and available carryover in all systems and wet seasonal conditions which resulted in very low demand as water could not be utilised by customers.
5.1.2 volumesdivertedThe volume diverted during 2010–11 in the Murray–Kiewa–Ovens valley was 563.0 GL. In the Goulburn–Broken–Loddon designated river valley and the Campaspe river valley, diversions were 544.5 GL and 18.4 GL respectively. Wimmera–Mallee valley diversions were 9.7 GL. Victorian systems diverted 1,135.5 GL from the Murray–Darling Basin during 2010–11.
The total Cap target adjusted for trade and environmental allocations, including the Wimmera–Mallee, was 2,578.2 GL.
5.1.3 off–QuotaOff–quota allocations have not been available in Victorian river valleys since 2003.
5.1.4 deliveries
Finaldeliveries&historicalComparisonThe total volume delivered to northern Victorian regulated systems during 2010–11 was 831.2 GL. The total Victorian usage was 27% of the total volume allocated.
Deliveries in the Murray–Kiewa–Ovens designated valley were 530.0 GL in 2010–11, compared to 772.2 GL for the previous year. Goulburn–Broken– Loddon valley deliveries were 223.5 GL in 2010–11, 273.0 GL lower than the 496.5 GL delivered in 2009–10. Deliveries in the Campaspe valley were also lower in 2010–11, with 68.4 GL compared to 106.9 GL delivered in 2009–10.
Total Wimmera–Mallee deliveries including water diverted from other valleys were 9.3 GL in 2010–11, 0.5 GL more than in 2009–10.
5.1.5 tradingThe allocation trade market in Victoria was again very active during 2010–11 with a net volume of 176.1 GL traded into Victoria.
Interstate allocation trading with New South Wales resulted in an overall net inwards transfer to Victoria of 71.1 GL during 2010–11.
This volume includes net inwards allocation trade of 61.5 GL from NSW Murray and 12.2 GL from the Murrumbidgee River basin. A volume of 2.6 GL was traded into the Darling River.
Trade with South Australia was a net allocation trade of 105.0 GL from South Australia to Victoria, compared to 45.6 GL from Victoria to South Australia in the 2009–10 season.
There was 479.8 GL of allocation trade into the Kiewa–Ovens–Murray valley from other valleys and the reverse trade was 299.7 GL resulting in a net allocation trade into the Kiewa–Ovens–Murray valley of 180.0 GL.
There was a net volume of allocation trade out of the Goulburn–Broken–Loddon valley of 13.9 GL. A total of 163.2 GL was traded in while 177.1 GL was traded out. There was a net allocation trade of 21.0 GL from South Australia to the Goulburn–Broken–Loddon valley.
The net trade into the Campaspe valley was 10.0 GL, including 0.1 GL for use via the Goldfields Superpipe and 19.0 GL traded for use in the Rochester Irrigation Area. A total of 9.1 GL was traded out of the Campaspe Irrigation Area.
5.1.6 environmentalFlowsAs there were long periods of unregulated flow conditions in the River Murray and allocations reached 100% early in the season, numerous sources of water were available for environmental use. Overbank flows provided by the floods that occurred in the 2010–11 season filled many of the lakes and wetlands that had received environmental water in previous years.
The total use of water for environmental allocations in 2010–11 was 196.8 GL. This volume includes water used in the Barmah–Millewa Forest from the Barmah–Millewa entitlement and in‑stream use in the Wimmera– Mallee system. The total consumptive volume of water used for environmental purposes was 67.9 GL.
An additional 33.7 GL was used in the River Murray and Loddon system during periods of unregulated flows, of which 9,363 ML was delivered to sites upstream of Nyah including Richardson’s Lagoon and Cullen’s Lake, 13,539 ML was delivered downstream of Nyah and 10,798 ML was delivered to wetlands in the Boort district.

30
Murray–Darling Basin Authority
Water audit Monitoring report 2010–11
A total of 97.9 GL of environmental water was delivered in–stream to the Goulburn River to assist with water quality in both the Lower Goulburn River and the River Murray following the formation of ‘black water’ in both rivers. This water was sourced from the Goulburn Water Quality Reserve, The Living Murray, Flora and Fauna and Commonwealth entitlements. Of the 97.9 GL delivered, 85.4 GL was traded to South Australia to increase the flows over the border.
A total of 428 GL was supplied to the Barmah–Millewa Forest during 2010–11. Of this volume, 184.5 GL was contributed by Victoria, with 84.5 GL sourced from Victoria’s Environmental Water Allocations to the Barmah–Millewa Forest Entitlement, and a further 100 GL supplied from Victoria’s The Living Murray entitlements. A total of 30 GL from The Living Murray entitlement was consumed in the Barmah–Millewa Forest and the remaining 70 GL was traded to South Australia. Supply of this water to the Barmah–Millewa forest took place from September 2010 to February 2011 and was delivered via overbank flows downstream of Yarrawonga Weir, following natural flood events in September 2010 and January 2011. At 30 June 2011, there was 95.6 GL available in the Victorian Barmah–Millewa account.
Wetlands on the Loddon system were supplied with 11.3 GL of water. Lakes Boort, Meran, Leaghur, Yando, Little Lake Boort and Little Lake Meran all received water which was supplied from unregulated Loddon River flows. A portion of unregulated flows were diverted at Loddon Weir through the G–MW channel system and delivered to the wetlands under direction of North Central Catchment Management Authority. In addition to the unregulated flows, Little Lake Boort received 83.8 ML of donated water.
The Loddon River also received 0.4 GL of environmental water which was used to maintain increased passing flows below Loddon Weir. This water was provided from Commonwealth entitlements.
Water from Commonwealth entitlements was used to maintain increased passing flows in the Campaspe River as per environmental flow recommendations during June 2011, with a total of 2.1 GL used.
The Goulburn wetlands being Reedy Swamp, Black Swamp and Doctors Swamp, were not supplied with environmental water during 2010–11.
In addition to the volumes supplied to forests and wetlands, 7.8 GL from the Goulburn Water Quality Reserve was used to improve the health of Broken Creek via diversions at Goulburn Weir to the Murray system via Rice’s Weir on Broken Creek.
5.2 goulburnGravity irrigation customers and private diverters in the Goulburn System of the Goulburn–Broken–Loddon designated river valley were given an initial allocation of 0% of high–reliability water shares in July 2010. The allocation reached a maximum of 100% of high–reliability water shares on 15 November 2011. There has been no allocation of low–reliability water shares since 1997–98.
Lake Eildon was 27.5% full at the start of July 2010 and reached 87.5% of capacity on 30 June 2011. Lake Eildon has not filled to capacity since 1996.
Waranga Basin filled from catchment inflows during August for the first time since 2005. By the end of season, Waranga Basin was drawn down to 80.0% capacity. Pumping at the Major and Minor outlets at Waranga Basin were not needed to increase water availability to customers as the allocation exceeded 37% without pumping.
The total volume allocated for use in the Goulburn valley was 792 GL. Usage in the Goulburn valley was 167.7 GL, or 21% utilisation of the total allocated volume.
Approximately 154.8 GL was transferred to the Murray, Campaspe and Loddon systems. The total diversion during 2010–11 to the Goulburn valley was 513.5 GL. A total of 11.3 GL was transferred from north to south of the Great Dividing Range to Melbourne Water from the Silver and Wallaby creeks which are tributaries of the Goulburn River. An additional 7.5 GL was transferred to Melbourne Water from the Goulburn River via the Sugarloaf pipeline.
The Goulburn–Broken–Loddon valley is within Cap and maintains a cumulative Cap credit of 1,177.0 GL.

31Water audit Monitoring report 2010–11
5. Review of 2010–11 water use in Victoria
5.3 BrokenFor the fourth year in a row private diverters in the Broken River system received an initial zero allocation at the start of July 2010. Allocations improved rapidly to reach 100% of high–reliability water shares in early September. An allocation of 100% of low–reliability water shares was announced in mid November.
Lake Nillahcootie rose from a low of 28.7% full at the start of July 2010 and filled to 100% of capacity in late August. Due to sustained inflows and wet conditions, the storage remained close to full throughout the year as there was no need to release additional water to meet downstream requirements.
The Broken usage equated to 1.6 GL, or 6.8% utilisation of the total allocated volume. The Broken system is included in the Goulburn–Broken–Loddon designated river valley, which is within Cap and has a cumulative Cap credit.
5.4 loddonOn 16 August 2010 an allocation of 26% of high–reliability water shares was announced for the Loddon System (excluding Bullarook Creek). The allocation reached 100% of high–reliability water shares & 0% low–reliability water shares on 15 November 2010. Allocations to customers in the Bullarook system received an allocation of 100% high–reliability water shares and 100% low–reliability water shares.
Cairn Curran and Tullaroop reservoirs reached 100% capacity in early November and early September respectively. This is the first time since 2000 that Cairn Curran reservoir filled the first time since 1996 that Tullaroop reservoir filled. At the 30 June 2011, Cairn Curran was at 95.9% of capacity and Tullaroop reservoir was at 89.4% of capacity.
Laanecoorie reservoir rose from 21.1% in early July 2010 and for the first time in seven years exceeded capacity in mid August 2010. On 30 June 2011 Laanecoorie was at 76.8% of capacity.
Newlyn reservoir reached a capacity of over 100% by mid August 2010 and remained at capacity for the rest of the year.
Diversions from the Loddon River and tributaries for private irrigation use, domestic and stock, commercial, industrial and urban purposes remained low, amounting to only 3.4 GL.
Due to the higher allocations and water availability on the Loddon system, some of the supply to the Boort region of the Pyramid–Boort Irrigation Area was able to be met from the Loddon storages for the first time in nine years. A total of 44.2 GL was delivered in Pyramid–Boort in 2010–11.
The Loddon valley is included in the Goulburn–Broken–Loddon designated river valley for the assessment of Cap compliance which is within Cap and has a cumulative Cap credit. Loddon valley usage was 54.2 GL, or 21.7% of the allocated volume.
5.5 CampaspeThe Campaspe River system supplies private diverters, the Campaspe Irrigation District and the Coliban water supply system. Although physically located within the Campaspe catchment, the Rochester Irrigation Area receives its water from the Goulburn system via the Waranga Western Channel and is part of the Goulburn–Broken–Loddon designated river valley for Cap compliance. Allocations to irrigators in the Rochester Irrigation Area are the same as those in the Goulburn system.
Allocations in the Campaspe system opened at 0% of high–reliability water shares but increased to 100% of high–reliability water shares by 15 September for the first time since 2003–04. Allocations to low–reliability water shares also reached 100% in November.
Lake Eppalock was at only 8.8% capacity on 1 July 2010 and by late November the storage filled for the first time since 1996. As at 30 June 2010, Lake Eppalock was still at 96.7% capacity.
As all Coliban storages filled early in the 2010–2011 season the Goldfields Superpipe was not needed to transfer any water from the Goulburn system to Sandhurst reservoir at Bendigo or to the White Swan Reservoir at Ballarat. An amount of 0.1 GL was transferred from the Goulburn system to Lake Eppalock of which all was attributed to Coliban Water.
No water was pumped from Lake Eppalock to Bendigo by Coliban Water in the 2010–11 season.
The 2010–11 Campaspe valley allocation volume was 281.0 GL of which 24% was utilised.
There was no water harvested from the Campaspe River to the Waranga Western
32
Murray–Darling Basin Authority
Water audit Monitoring report 2010–11
Channel via the Campaspe Irrigation District channels or the Campaspe Pumps although there was water available.
Woodend was supplied with 53 ML from the Campaspe system.
Diversions from the Campaspe designated river valley were 41.0 GL less than the Cap target in 2010–11. The Campaspe valley has a cumulative Cap credit of 184.4 GL.
5.6 wimmera–MalleeLike much of Victoria, the Wimmera–Mallee system water resource management activities were dominated by floods.
Inflows for the year were 389.6 GL compared to 93.6 GL in 2009–10. This resulted in the total volume held in store increasing from 36.2 GL in July 2010 to 322.6 GL by June 2011. This is the most water held in the system since 1998. The large inflows received also saw a number of reservoirs spill, including Moora Moora, Lonsdale and Wartook.
Completion of the Wimmera Mallee Pipeline Project in May 2010 means 2010–11 is the first full year the Wimmera Mallee Pipeline has been operated within a reporting period. The Wimmera–Glenelg Bulk Entitlements were revoked in October of 2010 and replaced with new Bulk Entitlement Orders and an Environmental Entitlement. The new volume of entitlement held in the Wimmera–Glenelg system is 125 GL. This reduction in total entitlement of about 50 GL reflects the water savings made from the latter stages of the Wimmera Mallee Pipeline Project.
Opening allocations were 118.3 GL (determined in November 2010) with the final allocation for the 2010–11 water year being 125.5 GL. A reserve volume of 95 GL was also created during this period.
A 100% allocation was made available for irrigation for the first time since 1999. Both Coliban and Wannon water authorities had a 100% allocation.
For the year ending June 2011, diversions from water sourced within the Wimmera–Mallee valley totaled 9.7 GL.
5.7 kiewaTotal Kiewa usage was 0.5 GL or 43.2% of the urban entitlement volume. A further 0.7 GL was used in the unregulated system. The Kiewa system is included in the Murray–Kiewa–Ovens designated river valley for the assessment of Cap compliance which is within Cap and has a cumulative Cap credit.
5.8 ovensLake Buffalo was operated below full supply for most of the 2010–11 season due to flood conditions. Inflows were more than required to sustain downstream flow requirements. The storage did not fill during the year and was drawn down to 46.1% of capacity at the end of June. Lake William Hovell was full throughout the 2010–11 season. As both storages were effectively spilling all season, customers had access to spill‑reliability water shares.
Total Ovens valley usage was 5.5 GL or 14.6% of the allocated volume. A further 0.4 GL was used in the unregulated system. The Ovens valley is included in the Murray–Kiewa–Ovens designated river valley for the assessment of Cap compliance which is within Cap and has a cumulative Cap credit.
5.9 Murray(includingMittaMitta)There was zero allocation at the start of July 2010 for Murray system gravity irrigation customers and Mitta private diverters. An allocation of 2% of high–reliability water shares was announced on 2 August 2010, which was subsequently increased in steps to a final allocation of 100% on 15 October 2010.
At 1 July 2010, Lake Dartmouth was 33.3% of capacity and steadily increased throughout the year. By late June 2011 the storage had nearly doubled capacity and was at 64.5%.
In the 2010–11 season Lake Hume filled in mid November 2010 after starting the season on 1 July 2010 at 27.3% of capacity. At 30 June 2011 the storage had been drawn down to 93.4% of capacity.
The Menindee Lakes remained in MDBA control for the entire 2010–11 season.

33Water audit Monitoring report 2010–11
5. Review of 2010–11 water use in Victoria
The total diversion, excluding all environmental diversions, was 556.0 GL for the Victorian component of the River Murray valley. This diversion included 2.7 GL for the Northern Mallee pipeline. The allocated volume was 1,675 GL, of which 524.0 GL or 31% was used.
For the purposes of Cap compliance, the Murray valley is included in the Murray–Kiewa–Ovens designated river valley. Diversions from this valley were 648.1 GL below the 2010–11 Cap target and the accumulated Cap credit for the Murray–Kiewa–Ovens designated river valley is 1,737.2 GL.

34
Murray–Darling Basin Authority
Water audit Monitoring report 2010–11
6. revIewoF2010–11wAteruseInsouthAustrAlIA
6.1 overviewAt the commencement of the 2010‑11 water year, South Australia was experiencing the fifth consecutive year with access to less that its Entitlement Flow of 1850GL due to the prolonged period of low flows.
The volume of water available to South Australia at the start of 2010‑11 was 1384GL, which included 696GL for dilution and losses, 201GL for critical human water needs, a small opening allocation of 21 percent and provision of 100 percent of carryover for water access entitlement holders.
As the year progressed, conditions changed across the Southern Murray‑Darling Basin due to a number of heavy rainfall events. As a consequence, the Basin experienced widespread flooding, filling and spilling of storages followed by an extended period of unregulated flows into the River Murray and Darling River systems.
The significant improvement of inflows into the Murray‑Darling Basin resulted in South Australia receiving its full Entitlement Flow of 1850GL for 2010‑11.
This allowed South Australian water access entitlement holders, in aggregate, to receive a 100 percent water allocation, consisting of 422GL (or 67 percent) as a general allocation plus 228GL for those users that carried over unused allocations from 2009‑10, bringing the volume of water allocated to the 650GL cap under the Water Allocation Plan for the River Murray Prescribed Watercourse.
In addition to managing the dynamic and unplanned seasonal conditions, South Australia is addressing the ability to store and deliver water additional to the annual 1850GL Entitlement Flow through South Australia’s Storage Right under the impending Schedule G of the Murray‑Darling Basin Agreement. It is anticipated that the Murray‑Darling Basin Ministerial Council will approve the new Storage Right arrangement early
in 2011‑12. The Storage Right will provide South Australia with formal recognition of carryover and the implementation arrangements associated with storing water for this purpose and in the management of critical human water needs.
6.2 Impactofrecoveryfromdroughtconditions
The seasonal outlook changed dramatically by late spring and summer 2010 in response to several heavy rainfall events that generated a number of inflow events. These inflow events resulted in over 15000 GL flowing across the border and flows peaking at 94 GL/day by mid February 2011. Being the highest annual flow across the border since 1975‑76 benefited severely drought affected floodplains and improved water quality in the Lower Lakes. It also triggered the removal of a number of temporary structures that were put in place to manage water levels during the drought to prevent acidification.
Prior to the high inflow events, the River channel, floodplain and Lower Lakes suffered from the lack of high flow and in particular overbank flow, that commences at about 40 GL/day. The last time flow was more than 40 GL/day was in December 2000. The high flow provided significant benefits for the riparian, wetland and floodplain vegetation, in particular river red gum communities, which were suffering from impacts of salt and lack of inundation. This high flow event also allowed large‑scale recruitment of a number of wetland or floodplain species that will require future watering for survival and further recruitment.
Large areas of the floodplain received water and all locks and weirs were inundated by the high flow. The River Murray downstream of Lock 11 was free flowing for the entire length of the system and a large volume of water was discharged from the Lower Lakes into the Coorong.

35Water audit Monitoring report 2010–11
6. Review of 2010–11 water use in South Australia
6.3 riverMurraywaterManagementAn opening water allocation of 21 percent, together with 228GL for private carryover, was announced on 1 July 2010 for River Murray water access entitlement holders. South Australia’s volume of water from the shared resources continued to improve, allowing the allocation to be increased on 1 October 2010 to 67 percent (or 422GL) of entitlement. Together with carryover this was the maximum allocation allowable for 2010‑11 under the cap of 650GL included in the Water Allocation Plan for the River Murray Prescribed Watercourse.
Until South Australia’s Storage Right (Schedule G) comes into effect, carryover forms part of the general consumptive pool. Once endorsed, Schedule G will allow water to be available in addition to any announced allocations and will be in addition to South Australia’s 1850 GL Entitlement Flow.
This Storage Right will provide an opportunity for most South Australian water access entitlement holders to participate in a proposed Private Carryover Scheme. The policy and implementation arrangements will be developed in consultation with water users in 2011‑12 and is planned to be operational from the 2012‑13 water year. The scheme will contain a number of conditions whereby South Australia is limited with regard to when it can defer and store water. Conditions will include a restriction on water being deferred or stored during a period of unregulated flow and that South Australia’s water will spill first from a storage if there is a pre‑release or spill from where water is stored.
South Australia’s Storage Right will also be the mechanism for the long term management of South Australia’s River Murray water for critical human water needs.
While South Australia may have the ability to store water for private carryover and for managing critical human water needs, an assessment of resource conditions (including the outlook for water availability), water quality and risk of spill will be considered prior to water being deferred. The Department for Water will administer the process for deferring and storing water through a 12 month rolling Deferred Water Storage and Delivery Plan. This will require approval from the Murray–Darling Basin Authority before any changes are implemented.
6.4 riverMurraywateruseTotal diversions from the River Murray in 2010‑11 were 362 GL, representing the lowest diversions since the introduction of the Cap under the Murray‑Darling Basin Agreement and are reflective of the seasonal conditions. The diversions comprised:
• 56.4 GL for Metropolitan Adelaide and Associated Country Areas;
• 34.1 GL for Country Towns;
• 13.6 GL for the Lower Murray Swamps (including ELMA, which is restricted by the same percentage as irrigation allocations);
• 244.2GL for metered consumption; and
• 13.7 GL for non‑metered consumption.The metered consumption (principally irrigation) was extremely low as a result of the above average rainfall conditions (due to La Niña weather patterns) experienced during the main growing season (spring to summer) along the length of the River Murray. A total of 460mm was recorded at the Berri Post Office and isolated falls of 150mm‑200mm were recorded at some locations.
The Langhorne Creek Irrigation Area also received localised widespread flooding from heavy rainfall generated over the eastern Mount Lofty Ranges allowing the Angas and Bremer Rivers to flow out onto the floodplain and into some vineyards. This process is a naturally occurring event and is important for reducing soil salinity and to recharge groundwater systems.
6.5 MetropolitanAdelaideandAssociatedCountryAreas
The Metropolitan Adelaide Water Supply System uses two major water resources: natural catchment inflows into the Mount Lofty Ranges storages and the River Murray.
Water from the Mount Lofty Ranges storages is used as the primary water source because of the significant costs of treating and pumping water from the River Murray. The high flows in the River Murray and resulting blackwater event that was generated upstream, significantly increased treatment costs for urban and country areas water supply.

36
Murray–Darling Basin Authority
Water audit Monitoring report 2010–11
The Mount Lofty Ranges storage level is the major factor influencing the amount of water to be pumped from the River Murray. Natural inflows to the Mount Lofty Ranges storages were approximately 88 GL. Metropolitan Adelaide and Associated Country Areas also received above average rainfall during spring and summer and experienced below average temperatures. This resulted in a low volume of water use. Diversions from the River Murray for Metropolitan Adelaide and Associated Country Areas were 56.4 GL, being the lowest volume since the Cap was introduced. This allowed the Minister for Water and the River Murray to relax water restrictions imposed during the drought. Permanent water conservation measures remained in place.
The five‑year rolling diversion for the Metropolitan Adelaide was 555.3 GL, which is 94.7 GL less than the 650 GL five year rolling Cap. The 2006‑07 diversion of 203.1 GL was unusually high due to the additional 60 GL pumped during that year for use in 2007‑08.
6.6 CountrytownsCountry Towns used 34.1 GL, which was also the lowest diversion since the Cap was introduced. Diversions against this licence do not vary significantly between years as there are no other local water supplies available eg reservoirs.
6.7 lowerMurrayswampsThe Lower Murray Reclaimed Irrigation Areas (LMRIA), located between Mannum and Wellington, were formerly wetlands connected to the River Murray. The Cap on these areas was agreed in 2001 by Ministerial Council. This Cap was based on recognised best irrigation practice applied to approximately 5000 hectares of former wetlands and an additional 780 hectares of the adjoining highland.
Water allocations within the LMRIA have been treated in the same manner as all other irrigation licences (67 percent plus carryover). Diversions were only 13.6 GL, which included a small volume of non‑metered use. This was the third lowest diversion since the Cap was introduced. Water access was not an issue during 2010‑11 due to water levels being restored to the normal annual operating range of 0.5m AHD to 0.85m AHD.
6.8 AllotherpurposesofwaterfromtheriverMurray
Annual diversions under the All Other Purposes component of the Cap were 257.9 GL, including non‑metered water use of 13.7 GL. These diversions were the lowest since the Cap was implemented and lower than the annual diversions between 2006 and 2010, when allocations were restricted due to low water availability. Above average rainfall during peak crop‑growing times was a factor contributing to reduced diversions. In addition, there was a significant volume of water traded out of South Australia due to the State not being able to carryover water in 2011–12.
The All Other Purposes Cap includes stock, domestic, environmental, industrial and recreation entitlements. Annual water restrictions apply to all components of the Cap with the exception of industrial, stock and domestic (which equates to approximately 20 GL). A model for All Other Purposes Cap has been developed, and is used to enable a comparison of annual diversions against the annual climate adjusted Cap target. The Cap model for the All Other Purposes is a regression model in which the historical monthly demands are adjusted (de‑trended) to reflect the 1993‑94 level of development. An annual Cap target is then derived through regression of the de‑trended data with rainfall and temperature data from Berri and Loxton and scaled up to 449.9 to account for the transfer of 9.3 GL from the Lower Murray Swamps Cap.
table6.1:MetropolitanAdelaideCapAssessment
2006–07 2007–08 2008–09 2009–10 2010–11 total
Rolling Diversion Against 650 GL Cap 203.1 89.4 149.5 56.9 56.4 555.3
Five Year Cap 650.0
Amount Below Limit 94.7

37Water audit Monitoring report 2010–11
6. Review of 2010–11 water use in South Australia
The climate adjusted Annual Cap Target for 2010‑11 from the All Other Purposes Cap model was 404.1 GL, including 9.3 GL transferred from the Lower Murray Swamps. Further adjustments to the Annual Cap Target occurred due to:
• excluding net transfers of environmental water into South Australia from trade adjustments in accordance with Schedule E – Cap on Diversions;
• determining the effective volume of South Australian entitlement recovered for environmental purposes. Although 111.5 GL in total was recovered for TLM and CEWH by 30 June, only 86.7 GL of this resulted in water being allocated to the environment in 2010‑11;
• multiplying the effective entitlement by the appropriate Cap factor of 0.9 to determine the long term Cap equivalent volume of 78 GL;
• scaling this volume down by the ratio of the modelled 2010‑11 Cap target to the 449.9 GL long term Cap; and
• the final adjustment was = ‑78x404.1/449.9 = ‑70.1 GL.
6.9 watertradeSignificant trading of temporary water allocations into South Australia occurred during 2010‑11. A total of 404.2 GL was traded into South Australia. This included water for general allocations and substantial volumes for the environment (from Multi‑Site Environmental Watering Trials and other releases and spills from storages).
The environmental trades do not constitute a transfer of the Cap and therefore they have been excluded from the diversion calculations under the All Other Purposes Cap. table 6.2 below identifies the temporary water trades, including the water source, for the 2010‑11 water year.
In addition to temporary trades, permanent interstate trades prior to 2007 and inter‑valley trades with South Australia resulted in the exchange of Cap shown in table 6.3.
table6.3:exchangeofCapresultingfrompermanententitlementtrade
(gl)
Lower Murray Swamps ‑47.2
All Other Purposes 79.6
totaltosA 32.4
table6.2:riverMurrayInterstatetemporarywatertrade2010–11
temporarytrade(gl)
environmentaltrade(gl)
non–environmentaltrade
(gl)
Interstate Trade
From SA to Victoria ‑318.0 ‑96.8 ‑221.2
From SA to New South Wales ‑16.8 ‑3.2 ‑13.6
totaloutofsA -334.8 -100.0 -234.8
Into SA from Victoria 213.1 198.5 14.6
Into SA from New South Wales 191.1 128.3 62.8
totalintosA 404.2 326.8 77.4
nettradeintosA 69.4 226.8 ‑157.4

38
Murray–Darling Basin Authority
Water audit Monitoring report 2010–11
6.10 environmentalwateringDuring 2010‑11 a large volume of environmental water was delivered, in addition to unregulated flow. Environmental water bids, trades, delivery, accounting and monitoring were undertaken in partnership with a range of organisations and community groups. South Australia received a total of 306.410 GL of environmental water for wetlands, floodplains and the Lower Lakes, Coorong and Murray Mouth. This included water from the following sources:
• Murray‑Darling Basin Authority, TLM—157.347 GL;
• Commonwealth Environmental Water Holder (CEWH) ‑ 139.528 GL;
• Private donations ‑ 0.100 GL; and
• Return flows from Victorian environmental watering actions—8.873 GL.
In addition, a total of 0.563GL was delivered as part of the 2010–11 multi‑site environmental watering trial.
South Australia also provided 92 GL of water saved under the River Murray Drought Water Allocation Framework for Lakes Alexandrina and Albert. A summary of environmental water delivered is provided in table 6.4.
table6.4:summaryofenvironmentalwaterdeliveredin2010–11
site volumegl source
Lower Lakes, Coorong, Murray Mouth
92 Drought Allocation Framework
139.4 CEWH
8.9 Victorian return flows
157.2 TLM
Monoman Creek Depression, Chowilla Floodplain
0.057 TLM
Monoman Depression, Chowilla Floodplain
0.045 TLM
Punkah Creek Floodrunner, Chowilla Floodplain
0.034 TLM
Inner Mundic Floodrunner, Pike Floodplain
0.008 Private Donation
Mundic Billabong, Pike Floodplain 0.092 Private Donation
Carpark Lagoons, Katarapko Floodplain
0.154 CEWH
Coombool Swamp, Chowilla Floodplain
0.506 CEWH carryover from 2009–10
Kulkurna wetland, NSW 56.85 CEWH carryover from 2009–10

39Water audit Monitoring report 2010–11
7. Review of 2010–11 water use in Queensland
7. revIewoF2010–11wAteruseInQueenslAnd
7.1 waterplanningandManagementoverview
Queensland has water resource plans (WRPs) in place in all its Murray–Darling Basin catchments. WRPs provide a framework with a strong legislative basis that limits diversions from watercourses, lakes, springs and overland flows, provides for water trading and requires monitoring and reporting of the achievement of plan outcomes. The focus of these plans has been initially on surface water but will extend in the future to consider and incorporate groundwater in priority areas as additional information and improved methods to address groundwater sustainability become available.
Resource operations plans (ROPs) implement the provisions of WRPs and have been in place for the Moonie, Warrego, Paroo, and Nebine catchments since January 2006, and the Queensland Border Rivers catchment since March 2008. The Condamine and Balonne Resource Operations Plan was finalised for the upper and middle parts of the plan area, excluding the Gowrie–Oakey Creek sub–catchment, on 12 December 2008. The plan was amended on 26 March 2010 to include the Lower Balonne area. Arrangements for the Gowrie–Oakey Creek sub‑catchment have been excluded due to complexities associated with the re–use of water released from Toowoomba’s waste water treatment plant. It will be included in the ROP through a later amendment.
ROPs largely manage the take of water from watercourses in the Queensland Murray–Darling Basin through limits stated on entitlements and water sharing rules. The take of overland flow water is managed through regulation of works under the Sustainable Planning Act 2009 and limits on entitlements.
7.1.1 Moonie,warrego,andparooriversandnebineCreek
This is the fifth year in which Cap arrangements have been in place for the Moonie, Warrego, Paroo, and Nebine catchments.
Diversions reached 38 per cent of the Cap target for the Moonie catchment, 12 per cent for the Warrego, 68 per cent for the Paroo and 5 per cent for the Nebine catchment for the 2010–11 water year.
7.1.2 BorderriversA Cap proposal for the Queensland Border Rivers was noted by the Murray–Darling Basin Authority (Chief Executive acting as the Authority) on 26 March 2009 and further noted by the Murray–Darling Basin Ministerial Council at Meeting 1 on 29 May 2009. The Cap model has been submitted to the MDBA for review by an independent auditor and accreditation.
Diversions reached 70 per cent of the Cap target for the Border Rivers catchment for the 2010–11 water year.
An Intergovernmental Agreement that deals with interstate water sharing and access arrangements has been negotiated between Queensland and New South Wales. The access and sharing arrangements outlined in an interim agreement for the shared Border Rivers watercourses were introduced on a trial basis in 2005–06 and have been continued with some modification under the New South Wales—Queensland Border Rivers Intergovernmental Agreement 2008, which was formally finalised by the two state governments early in 2009.

40
Murray–Darling Basin Authority
Water audit Monitoring report 2010–11
7.1.3 CondamineandBalonneA Cap proposal for the Condamine and Balonne was submitted to the MDBA in October 2010 and noted by the MDBA on 30 March 2011. The Condamine and Balonne model has been finalised and was submitted for accreditation in May 2011.
Diversions reached 62 per cent of the Cap target for the Condamine and Balonne catchment for the 2010–11 water year.
7.1.4 MeteringQueensland released a policy on metering water extractions in May 2005, providing a framework for metering across the State. The policy includes metering standards, details of ownership, maintenance and reading of meters, and proposed charging arrangements. The metering project will see the staged introduction of water metering for all unsupplemented water extractions across Queensland over the coming years.
Queensland has commenced metering projects in the Moonie, Warrego, Paroo and Nebine resource operation plan areas. While the majority of works in the Moonie, Warrego and Nebine catchments are equipped with water meters, metering the larger works was deferred until National Standards had been finalised. DERM intended to complete metering of these works in 2010. However, meter installation was delayed due to flooding and infrastructure damage in 2010, and the intent now is to complete these in September–October 2011. Meters will be installed in accordance with manufacturer’s specifications if pattern approvals are not available. Water diverted in the Paroo catchment is metered.
Metering of unsupplemented water allocations in the Border Rivers catchment is complete; however, take under water licences (mostly area–based licences in the Granite Belt) is primarily unmetered. Area–based licences are scheduled for metering in 2012.
About 50 per cent by volume of waterharvesting diversion in the Condamine catchment area is metered. Surface water take from downstream of Cecil Plains to Beardmore Dam is intended to be metered by July 2012. Surface water take under water allocations in the Lower Balonne is metered to varying standards. A project is underway to bring all meters in line with the National Standard by July 2012. The project
includes measurement of water taken under the authority of overland flow licences in the Lower Balonne.
7.1.5 wateruseefficiency(wue)The fourth stage of the Rural Water Use Efficiency Initiative (RWUEI) began in July 2009, with $4.5 million available from the Queensland Government over four years.
The RWUEI makes funds available to the major rural industry groups involved in irrigation for programs which focus on water use and energy efficiency. Funding of industry programs is on the basis of agreed milestones and targets being achieved. Limited financial incentives are also available in certain cases to help irrigators improve their on–farm water management.
The initiative invests in an Industry Development Officer employed by Irrigation Australia Limited to improve the standards of service delivery by irrigation consultants, contractors, suppliers and installers in Queensland.
Further information is available on the RWUEI web site at http://www.derm.qld.gov.au/rwue/.
7.2 streamFlowandwateruseoverview
El Niño conditions in the Pacific through the 2009–10 water year underwent a rapid transition to La Niña in autumn 2010. By the start of the 2010–11 water year in July, La Niña conditions were well established. The 2010 La Niña was exceptionally strong, as measured by the Southern Oscillation Index, with rainfall generally well above average from August 2010 to January 2011 across the Queensland section of the MDB. Persistent heavy rainfall on wet catchments culminated in extensive and severe flooding across the Queensland section of the Murray Darling Basin in December and January. Flooding continued to a lesser extent and degree through into May.
The main flows occurred in December 2010 and January 2011 following the particularly heavy rain in these months. Record flood levels occurred at a number of locations in the Queensland section of Murray Darling Basin (QMDB) in 2010–11. In some cases these flood peaks broke records which had only just been set during the February–March 2010 event.

41Water audit Monitoring report 2010–11
7. Review of 2010–11 water use in Queensland
The main events were as follows:
• A significant rain and storm band late in July 2010 produced flooding that persisted into August in the lower Macintyre and Paroo rivers.
• In the second week of September 2010, heavy rainfall in the upper reaches of the Warrego catchment produced minor to moderate flooding of the Warrego River. Heavy rainfall in the Border Rivers catchment caused flooding in the lower Macintyre River at Goondiwindi, followed by minor to moderate flooding in the lower Weir River as a result of the breakout of floodwaters from the Macintyre River. Goondiwindi recorded its highest ever September rainfall.
• Continued rainfall through October produced a major flood peak at Goondiwindi, the seventh peak above minor flood level since August 2010. Minor to moderate flooding was also recorded in the Condamine and Weir rivers and the Paroo, Moonie and Warrego river catchments.
• Minor to moderate flooding in the Warrego River and tributaries and minor flooding in the Paroo River persisted through November.
• Queensland experienced yet another month of widespread rainfall in December, following the wettest spring on record. A weak category one tropical cyclone, Tasha, crossed the coast south of Cairns early on Christmas morning and continuing active monsoonal activity led to a wet Christmas period, culminating in some of the most widespread and significant flooding in Queensland’s history. By the end of December, flood warnings had been issued for the Condamine, Balonne, Moonie, Paroo and Warrego rivers.
• In January 2011, rainfall ranged from average or below average in the south to very much above average in the east and west of the QMDB. Heavy rain on saturated catchments produced significant runoff and resulted in almost every river east of the Warrego reaching major flood level at some time between 23 December 2010 and 7 January 2011.
• Although rain eased in February, further moderate to heavy rainfall in the first week of March resulted in widespread moderate to major flooding that extended east into the Warrego River catchment. Moderate to major flooding affected the Condamine River in mid–March, with floodwaters impacting the Lower Balonne by the end of March.
• Rainfall was generally average or below average across the QMDB catchments for the remainder of the water year.
• Notable flood peaks included:
− Condamine River—record flows in the middle reaches of the Condamine River, with flows at Chinchilla Weir peaking at 389 GL/day, 1.4 metres higher than the previous record set in 1988. The total volume of flow passing for the December–January event was 4,177 GL.
− Maranoa River—passing flow at Cashmere was 300 GL higher than the 2009–10 flow, which was reported as causing the highest flooding in 20 years.
− Balonne River—the flow passing St George of 8,535 GL was more than six times the average flow, but still did not reach the maximum flow recorded in 1955–56.
− Border Rivers—the record flow of 3,005 GL at Goondiwindi was 400 GL higher than the previous record set in 1983–84.
Rain eased in April, although flooding continued in the Balonne River system until late in the month.
The continuous flows in most of Queensland’s streams through the 2010–11 water year has provided exceptional waterharvesting opportunities, particularly in the Balonne and Border rivers, with total stream diversions in the QMDB estimated at 872 GL. Of this, 60 per cent was taken from the Lower Balonne and 27 per cent from the Border Rivers catchment. The record flooding in January 2011 also provided extensive overland flow opportunity with an estimated total of 653 GL taken during floodplain harvesting in the year. Irrigators with overland flow water access were able to partially substitute take of overland flow for stream flow diversion.

42
Murray–Darling Basin Authority
Water audit Monitoring report 2010–11
table7.1 summarises the diversions from the QMDB catchments and the annual flow volumes for 2010–11 as measured at key sites. Flows were well above the long term average, except in the Paroo and Nebine rivers. The high stream flow and widespread flooding has resulted in the second highest stream diversion figures and the highest overall level of diversions (stream flow plus floodplain harvesting) since recording began in 1993.
Diversion across all catchments is estimated to be 872 GL, made up of a combination of supplemented diversion (take from regulated flow associated with public storages under the authority of a water allocation) and unsupplemented diversion (take primarily from waterharvesting practices).
Overland flow, in the form of floodplain diversion, has been assessed from regional appraisal in the key areas where waterharvesting and floodplain diversion operate together. It has been estimated that a further 653 GL of floodplain diversion has occurred. Upland flow capture and on–farm rainfall runoff are not included in the overland flow diversion figures.
Therefore, total diversions across all QMDB catchments from streams and overland flow (floodplain diversion) for 2010–11 are estimated to be 1,525 GL.
table6 shows stream diversion levels for the total QMDB catchments over the past 18 years. The 872 GL diverted in 2010–11 had an associated cross border flow of 9,367 GL (table7.2). In comparison, in 2007–08, when Queensland’s highest watercourse diversions of 876 GL were reported, 3,271 GL flowed into NSW.
table7.2:Crossborderflows
valley Flow(gl)
Paroo 489
Warrego 1,301
Nebine 8
Condamine and Balonne 5,631
Moonie 543
Border Rivers 1,395
total 9,367
table7.1:summaryforQueenslandcatchments2010–11
CatchmentFlow2010–11
(gl)Meanannualflow
(gl)
streamdiversion2010–11
(gl)
Floodplainharvesting
2010–11(gl)
CondamineandBalonne
Condamine (Chinchilla) 4,722 588 57 201
Condamine–Balonne (Weribone)
8,163 1,238 16 n/a
Maranoa (Cashmere) 886 144 <1 n/a
Lower Balonne (St George)
8,535 1,246 527 263
Borderrivers
Granite Belt (Farnbro) 431 81 3 22
Macintyre–Barwon (Goondiwindi)
3,005 791 200 140
Weir (Talwood) 485 147 30 25
Moonie (Fenton) 543 158 27 2
nebine (Roseleigh) 8 Only gauged since 2007
<1 <1
warrego(Cunnamulla) 1,301 517 11 n/a
paroo(Caiwarro) 489 551 <1 n/a
totAl 872 653

43Water audit Monitoring report 2010–11
7. Review of 2010–11 water use in Queensland
Public storages are comparatively small in number and storage volume across the QMDB. Around one third of these storages are used solely for urban supplies, with the other storages supplying multiple needs.
There were significant inflows into public storages in the QMDB during the 2010–11 water year. All storages benefited from the high level of rainfall and resultant stream flows, with the majority of storages finishing the year at close to 100 per cent capacity.
7.3 warregoMonthly rainfalls from July through to March were generally above average. The highest rainfall was recorded in November with a quarter of the annual rainfall falling in this month. Total rainfall for the 2010–11 year recorded at Cunnamulla was 500 mm compared to an average annual rainfall of 377 mm.
Stream flow for the Warrego River at Cunnamulla for the 2010–11 water year was 1,301 GL, well above the average annual flow of 517 GL and the fourth highest flow on record. A total of 618 GL, nearly half of the 2010–11 annual flow, passed the gauging station in December.
The normal summer flow pattern in the Warrego River continued, with the main flows occurring in December and January, and additional smaller flows in October 2010 and March 2011.
Supplemented water diversion in this catchment is limited to the Cunnamulla Weir Water Supply Scheme. The scheme is based on conserving and supplying water allocations from a 4.7 GL weir on the Warrego River at Cunnamulla.
The announced allocation for the 2010–11 water year from the Cunnamulla Weir Water Supply Scheme was 100 per cent. Supplemented water diversion was less than 1 GL from an available entitlement of 2.6 GL.
The take of unsupplemented water within this catchment must be in accordance with stated flow conditions at a specified reference point. Diversion of unsupplemented water for the 2010–11 water year was 10.6 GL.
There were eight announced periods to take unsupplemented water in the Upper Warrego Water Management Area and six periods of
announced flow in the Lower Warrego Water Management Area for 2010–11. The first events commenced in September 2010 and the last ended in April 2011.
While the majority of works are equipped with water meters, metering the larger works was deferred until National Standards had been finalised. DERM intended to complete metering on these works in 2010. However, meter installation was delayed due to flooding and infrastructure damage in 2010 and the intent now is to complete these in September–October 2011. Meters will be installed in accordance with manufacturer’s specifications if pattern approvals are not available.
The Commonwealth Environmental Water Holder holds two unsupplemented entitlements in the Warrego catchment. A total of 16 GL (total volumetric limit associated with entitlements) of Commonwealth–held in–stream (non–regulated) environmental water was retained within the Warrego catchment as environmental flow during the 2010–11 water year. The following water contributed to the enhancement of environmental assets in the Warrego:
• In the Upper Warrego, Commonwealth–held in–stream environmental water complemented natural flow events that occurred between September and April.
• In the Lower Warrego, Commonwealth–held in–stream environmental water contributed to the first post–winter flow in the system, which is known to be a critical spawning cue for native fish.
• During March to April 2011, Commonwealth–held in–stream environmental water also contributed to an overbank flow that charged the nationally significant Warrego River distributary system and Yantabulla Swamp.
Held environmental water is not included in the cap target.
Annual diversion of 11 GL was 12 per cent of the cap target of 94 GL. Water entitlement holders did not fully avail themselves of access opportunities provided during the year for a number of reasons, including that property infrastructure and entitlements were not fully developed.

44
Murray–Darling Basin Authority
Water audit Monitoring report 2010–11
7.4 parooRainfall recorded for 2010–11 at Hungerford in the southern part of the Paroo catchment was 673 mm. This was more than double the long–term average of 297 mm and well over the 2009–10 total of 463 mm. Rainfall was heavily influenced by the La Niña conditions prevailing in the first half of the water year. The peak monthly rainfall received was in February, with 142 mm falling compared to the long term average for February of 36 mm.
The volume of flow passing the Caiwarro gauging station, which is located on the Paroo River upstream of the Queensland–New South Wales border, was recorded as 489 GL for the 2010–11 water year. This is below the average annual flow at Caiwarro of 551 GL (1968 to 2011) and significantly less than the 2,040 GL recorded in the 2009–10 water year. As in the Warrego catchment, nearly half the annual flow (227 GL) passed the gauging station in December.
There are no supplemented water allocations and only two unsupplemented water allocations in the Paroo catchment. Diversion for irrigation was 0.01 GL. An additional 0.04 GL was taken for urban purposes. Overland take from floodplain flows for the catchment is estimated at 0.01 GL.
Water diverted in the Paroo catchment is metered.
The annual diversion of 0.06 GL was 68 per cent of the 2010–11 cap target of 0.08 GL.
7.5 nebineRainfall was above average in the Nebine catchment with 483 mm recorded in the south of the catchment at Mulga Downs for the 2010–11 water year, against an average of 401 mm. Rainfall was well above average in the first half of the water year but below average from January to June 2011.
The mean annual flow from the Nebine catchment (including the Noorama and Widgeegoara creeks) is estimated at 33 GL/year. Flows either terminate on floodplains or discharge into the Culgoa River in New South Wales.
The new gauging station installed at Roseleigh Crossing (on Nebine Creek) now has four full years of recording. This gauging station is 10.5 km upstream of the Queensland–New South Wales border. A number of small flow events were recorded at the Roseleigh Crossing station and Wallam Creek at Cardiff (upstream of Bollon).
Flows in Wallam Creek at Cardiff and Nebine Creek at Roseleigh for 2010–11 totalled around 2 GL and 8 GL respectively, considerably less than the 2009–10 water year’s flows of 314 GL and 110 GL.
There are no supplemented water allocations and only four unsupplemented water allocations in the Nebine catchment. Diversion of unsupplemented water was 0.1 GL. An additional 0.1 GL of overland flow were diverted in the catchment.
While some works are equipped with water meters, completion of meter installation has been delayed due to flooding and infrastructure damage in 2010, and the intent now is to complete installation in September–October 2011. Meters will be installed in accordance with manufacturer’s specifications if pattern approvals are not available. Water use assessments are currently completed for each of these works.
The Commonwealth Environmental Water Holder holds one unsupplemented entitlement in the Nebine catchment. The flow levels needed to trigger access under Commonwealth water allocations were not met and therefore no Commonwealth–held environmental water was made available in the system in the 2010–11 water year. Held environmental water is not included in the cap target.
Annual diversion of 0.2 GL (including overland flow take) was 5 per cent of the cap target of 3 GL.
7.6 MoonieRainfall was above average in the first half of the 2010–11 water year and below average in the second half. Rainfall at Nindigully, located on the Moonie River in the south west of the catchment, was 568 mm for the year, compared to the average of 504 mm. The peak monthly total of 90 mm was recorded in November.

45Water audit Monitoring report 2010–11
7. Review of 2010–11 water use in Queensland
Stream flow for the Moonie River at Fenton, the most downstream gauge in Queensland, was 543 GL in 2010–11. This was more than three times the recorded annual average at this site of 158 GL.
There were a number of flows from October 2010 through to April 2011, with the main flow of 351 GL occurring in January. Record flooding at this time provided opportunity for floodplain harvesting.
No supplemented water supply exists in this catchment. The majority of the 33 water allocations in the catchment have flow conditions that relate to the take from watercourses (i.e. water harvesting).
Diversion for 2010–11 has been estimated at 27 GL, with take primarily occurring in December 2010 and January 2011.
While the majority of works are equipped with water meters, metering the larger works was deferred until National Standards had been finalised. DERM intended to complete metering on these works in 2010. However, meter installation was delayed due to flooding and infrastructure damage in 2010, and the intent now is to complete installation in September–October 2011. Meters will be installed in accordance with manufacturer’s specifications if pattern approvals are not available.
Overland flow harvesting from floodplain flows in the catchment is estimated at 2 GL based on a broad assessment of infrastructure development and opportunity.
The Commonwealth Environmental Water Holder holds one unsupplemented entitlement in the Moonie catchment. A total of 1.4 GL of Commonwealth–held environmental water remained in–stream in the Moonie catchment. Whilst this is a small volume compared to other river inflows it complemented floodplain flows of the lower Moonie River. This provided benefits to vegetation, water birds, native fish, and carbon and nutrient exchange. Held environmental water is not included in the cap target.
The 2010–11 annual diversion for the Moonie catchment was 29 GL (including the floodplain component of overland flow), 38 per cent of the cap target of 77 GL.
7.7 QueenslandBorderriversRainfall was above average across the Border Rivers catchment for the year. The upper catchment around Stanthorpe recorded 1,183 mm of rainfall compared to an average of 757 mm, with a total of 400 mm falling in December and January. The lower catchment around Goondiwindi recorded 818 mm of rainfall for the year compared to an average of 600 mm, with 139 mm falling in September—the highest September rainfall on record for this location.
Flows in the Border Rivers during the 2010–11 water year were well above average, with record flows in a number of locations. The main flows were recorded in January.
The flow passing Farnbro on the Dumaresq River during the 2010–11 water year was 431 GL, the highest on record and more than five times the average annual flow at Farnbro of 81 GL. A total of 203 GL passed the gauging station in January.
A total of 458 GL passed the Booba Sands gauging station on the Macintyre Brook during the water year compared to an average annual flow of 108 GL. Nearly half of the annual flow (220 GL) passed the gauging station in January.
Flows in the Macintyre River at Goondiwindi for the 2010–11 water year were 3,005 GL, the highest on record and nearly 400 GL higher than the previous record set in 1983–84. The passing flow was again highest in January at 1,029 GL.
The flow passing Talwood on the Weir River was 485 GL during the water year compared to an average annual flow of 147 GL. In January, the flow passing Talwood totalled 234 GL.
There are two major water supply storages in the Queensland part of the Border Rivers catchment. At 1 July 2010, GLenlyon Dam, the major storage for the Borders Rivers Water Supply Scheme, was at 22 per cent of capacity with 11 GL available for general use from the Queensland share of the storage. The storage finished the year at 99 per cent of capacity with around 70 GL available for general use from the Queensland share.
Coolmunda Dam on Macintyre Brook is the major storage for the Macintyre Brook Water Supply Scheme. This scheme now operates

46
Murray–Darling Basin Authority
Water audit Monitoring report 2010–11
on continuous accounting. Coolmunda Dam started the year at 13 per cent of capacity (9 GL) and filled in September 2010. The dam finished the year at 87 per cent of capacity.
In the 12 months to 30 June 2011, 31 GL of supplemented water was diverted within the Border Rivers Water Supply Scheme. This included supplemented take from releases from GLenlyon Dam and run of the river flows. The take of water transferred from NSW (23 GL net) is also included in the total. A total of 10 GL of supplemented water was diverted in the Macintyre Brook Water Supply Scheme.
From early August, flows triggered water harvesting access under the water sharing rules on the Border Rivers, with 160 GL diverted over multiple events. Water harvesting thresholds were also triggered in the Weir River, with 30 GL diverted in this catchment. A further 2.6 GL were diverted for direct irrigation purposes or stored for later use in the Granite Belt.
An additional 0.8 GL were taken for urban use, taking the total unsupplemented diversions in the Border Rivers to 193 GL for 2010–11.
The majority of diversion in this catchment is metered. Essentially all take under water allocations is metered and take under water licences (mostly area–based licences in the Granite Belt) is primarily unmetered. Area–based licences are scheduled for metering in 2012.
An estimated 187 GL of overland flow water were taken through floodplain harvesting in the Border Rivers and Weir River catchments, bringing total diversions in the Border Rivers catchment to 421 GL, 70 per cent of the cap target of 601 GL.
During the 2010–11 water year, the Commonwealth Environmental Water Holder held one unsupplemented entitlement and 17 supplemented entitlements in the Border Rivers catchment. In accordance with the access conditions on their water allocations, the Commonwealth was entitled to take 3,000 ML of unsupplemented water in the Border Rivers catchment. This water remained in–stream contributing to flows in the Border Rivers and further downstream.
There were 5.6 GL of supplemented water available under Commonwealth entitlements in the Border Rivers Water Supply Scheme. This water was not ordered but, under continuous accounting rules, remains available for use in future years when it can provide a greater environmental benefit. This held environmental water has been excluded from the cap target.
7.8 Condamine–Balonne
7.8.1 CondamineRainfall was generally above average across the Condamine area. Annual rainfall across the area was around 1,100 mm against an average of 670 mm. The main falls were in December, January and March.
The main flow events in December 2010 and January 2011, as well as a number of smaller flow events, passed along the entire Condamine system. Annual flows recorded at Cecil Plains Weir, Chinchilla and Cotswold were the highest on record, while the flow at Warwick was the second highest on record.
A total of 470 GL passed Warwick, in the upper reaches of the system, while 2,064 GL passed Cecil Plains Weir, 4,722 GL passed Chinchilla and 6,408 GL passed Cotswold at the end of the Condamine system in 2010–11.
The major storage for the Upper Condamine Water Supply Scheme is Leslie Dam which commenced the year at 9 per cent capacity. Inflows to the dam began in August, with the dam level steadily increasing until, on 5 January 2011, the water level rose to spill–over point for the first time in over 20 years, and water was released from the dam. Dam levels have remained high, with the dam finishing the year at 99 per cent capacity. Announced allocations in the Upper Condamine Water Supply Scheme are based on storage in Leslie Dam. An announced allocation of 100 percent was made for medium priority water allocations in November 2010.
The Chinchilla Weir, on the mid Condamine River, started the year at 78 per cent capacity and filled in September. The weir has remained at 100 per cent capacity since. Announced allocations for the Chinchilla Weir Water Supply Scheme were 100 per cent.

47Water audit Monitoring report 2010–11
7. Review of 2010–11 water use in Queensland
A total of 12 GL of supplemented water was diverted in the Condamine catchment in 2010–11, with 11.5 GL diverted in the Upper Condamine scheme and less than 1 GL at Chinchilla. The volume diverted in the Upper Condamine was from run of the river flows, which are made available for diversion subject to minimum flow conditions.
There were twelve waterharvesting events announced between August 2010 and June 2011 in the Upper Condamine Water Management Area, with July 2010 the only month of the water year in which no waterharvesting access was announced. Eight events were announced for the Condamine River North Branch with 3,450 ML of water extracted. In comparison, two events were announced in the 2009–10 water year with 3,390 ML extracted.
The volume of unsupplemented water taken in the Condamine catchment over 2010–11 is estimated at 58 GL with the majority of take (45 GL) occurring upstream of Chinchilla Weir. About 17 GL of unsupplemented water were diverted for direct irrigation with 9.5 GL taken from flows supplemented by treated effluent discharged from Toowoomba into the Gowrie–Oakey Creek system. An additional 1.9 GL were taken for urban use.
About 50 per cent by volume of waterharvesting diversion in the Condamine catchment area is metered. Surface water take from downstream of Cecil Plains to Beardmore Dam is intended to be metered by July 2012.
An estimated additional 201 GL of overland flow water were taken through harvesting of water on the Upper Condamine Floodplain, bringing the total take in the Condamine catchment to 273 GL.
7.8.2 BalonneandMaranoaRainfall in the Balonne and Maranoa was above average for the 2010–11 water year with 644 mm falling at St George (on the Balonne River) compared to an average of 518 mm. At Mitchell (on the Maranoa River) 932 mm was recorded compared to an average of 567 mm. The December rainfall in Mitchell was the highest on record for that month and 60 mm greater than the previous December record.
The heavy rainfalls in the Condamine and Balonne catchment recorded in December 2010 and January 2011 resulted in record flows in the Balonne (comprising flow through from the
Condamine plus tributary inflow). The passing flow at Weribone (on the Balonne River) was 8,163 GL, compared to an average annual flow of 1,238 GL, while the flow passing St George was 8,535 GL compared to an average flow of 1,246 GL. The main flows occurred in January with 5,287 GL passing Weribone in the month and 5,953 GL passing St George.
The main flows in the Maranoa River were recorded in December, with 524 GL out of the annual total of 886 GL passing in that month. Annual flow was well over the long term average of 144 GL.
Beardmore Dam started the year at 85 per cent capacity. The first inflow into Beardmore Dam commenced in mid–September and filled the dam. Inflows continued through the year, with the dam remaining at 100 percent capacity.
Inflows up to 730 ML a day may be passed downstream for environmental, stock and domestic purposes, or are sometimes held in storage for later release to maximise the benefit to downstream water users. From mid–September all inflows up to 730 ML–day were passed downstream for environmental, stock and domestic purposes.
A total of 57 GL (including 0.02 GL from the Maranoa Water Supply Scheme) was diverted from the water supply schemes.
High flows in the Balonne River between mid–September and May resulted in the triggering of take under flow condition–based water allocations. Total estimated take in the Lower Balonne was 470 GL, taken over seven announced periods. Flooding in the Lower Balonne between September and April allowed an additional take of 263 GL in floodplain harvesting.
An additional 0.02 GL of water were taken in the Maranoa catchment.
Surface water take under water allocations in the Lower Balonne is metered to varying standards. A project is underway to bring all meters in line with the National Standard by July 2012. The project includes measurement of water taken under the authority of overland flow licences in the Lower Balonne.
The 2010–11 annual diversion for the Condamine and Balonne catchment was 1,064 GL (including the floodplain component of overland flow), 62 per cent of the cap target of 1,728 GL.

48
Murray–Darling Basin Authority
Water audit Monitoring report 2010–11
table6:waterdiversionsinQueenslandsince1993–94
year diversion(gl)
2010–11 1525
2009–10 1232
2008–09 383
2007–08 1054
2006–07 160
2005–06 316*
2004–05 392*
2003–04 815*
2002–03 214*
2001–02 341*
2000–01 688*
1999–00 541*
1998–99 609*
1997–98 741*
1996–97 467*
1995–96 520*
1994–95 176*
1993–94 338*
Notes: Water year reported prior to 2006 was 1 October to 30 September. Water year reported post 2008 is 1 July to 30 June. * Diversions do not include take of overland flow water

49Water audit Monitoring report 2010–11
8. Review of 2010–11 water use in ACT
8. revIewoF2010–11wAteruseInACt
8.1 reviewofwateruseintheACtThe ACT experienced significantly higher rainfall during 2010–11 especially in the spring and early summer of 2010–11 than the previous eight years and in turn there were considerably higher stream inflows. Urban water restrictions were in place up to 1 November 2010. Since then permanent water conservations have been applied. In general water storages supplying the Canberra and Queanbeyan urban water supply were above 50%. The storage levels were at 60% (123.9 GL) at the start of the year and 97% (201.3 GL) by the end of the year.
Inflows improved during the last quarter of the year (since the start of the next water year there has been marked increase in rainfall and inflows).
ACTEW modelling analysis reveals that 20.5 GL was the total saving for 2010–11. This was based on demand management measures and the prevailing weather conditions at that time. It was apparent that it was the result of the lag effect of being on water restrictions for so long and the occurrence of then wet conditions during 2010–11.
Extractions from storages for the urban supply were 40.9 GL, with returns from sewage treatment plants at 35.1 GL resulting in net urban consumption of 6.4 GL. Metered non urban consumption was 0.5 GL, giving a total net consumption of 6.9 GL.
Consumption was significantly lower than would have been expected for the climatic conditions due to the occurrence of a very good rainfall for the year and the continuation of demand management programs and adoption of water conservation measures.
There was no increase in the demand for water in the ACT for industrial use and therefore no need to acquire additional water for the ACT.
8.2 progressofwaterreformsintheACt
The ACT is currently reviewing its water resources strategy, Think water, act water and will develop a revised strategy.
ACTEW is also undertaking an expansion of its storage and supply infrastructure through the construction of an expanded Cotter Dam and a pump and pipeline system from the Murrumbidgee River to Googong Dam.

50
Murray–Darling Basin Authority
Water audit Monitoring report 2010–11
9. wAtertrAdIngIntheMurrAy–dArlIngBAsIn
9.1 historyofwatertradingIn recent years, there has been considerable growth in water trading in the Murray–Darling Basin. Water trading has been encouraged by Governments as a means of moving irrigation from those uses which produce low returns to others which can generate greater economic returns. It is also expected to have environmental benefits, since increased profits from irrigation will make it easier for managers to invest in more efficient water delivery systems, which will produce better returns for the volume of water used and reduce accessions to groundwater.
Initially water trading was confined to trades within irrigation systems. However, over time, changes have been made to the trading rules, which have permitted inter–valley and more recently interstate trade to take place. In recent years, Australian Governments have been working together to reduce the differences in water entitlements, in preparation for the introduction of increased interstate water trading. These changes are part of the water market–reform package, which was endorsed by the COAG in 1994 and subsequently in 2004 as the National Water Initiative.
Trade has an impact on the implementation of the Cap. The trade in previously unused entitlements affects the size of the allocation that can be announced by the water managers, whilst inter–valley and interstate trade affects the Cap targets for the individual river valleys. It is therefore important that data on water trading be collected and published in the Water Audit Monitoring Report.
table7 details the total volume of intra–valley water trades and the net inter–valley and interstate water trades that occurred during the 2010–11 water year.
The sign convention used in table7 is that a negative value indicates a trade out of the valley
and a positive value indicates a trade into the valley. Permanent trade now occurs as tagged trade, where the entitlement remains with the originating (selling) valley, but the water use takes place in the destination valley. The cap target in the originating valley is reduced and that in the destination valley is increased by the volume of water used in the destination valley. Temporary trades will alter the annual Cap targets, usually on a one–for–one basis. Trade will therefore affect the Caps for individual valleys but will not result in an increase in the overall Cap for the Basin.
Interstate water trading between New South Wales, Victoria and South Australia continued to develop in 2010–11. However, resource constraints in the New South Wales and Victorian sections of the Murray Valley restricted the supply of available water for trade.

51Water audit Monitoring report 2010–11
9. Water trading in the Murray–Darling Basin
table7:netwaterentitlementtransfers(excludingenvironmentaltransfers)in2010–11
tradedatanotaffectingCap tradedataaffectingCap
system
totalIntra–valleyentitlement
(permanent)sold1
(gl)
totalAllocation
(temporary)sold2
(gl)
nettaggedtrade
Inwards3
(gl)
nettemporary
tradeInwards3
(gl)
Adjustmenttothisyear’sCap
forpreviouspermanent
trade(gl)
totaltradeAdjustment
tothisyear’sCaptarget
(gl)
newsouthwales
Border Rivers 0 48 4 ‑23 0 ‑20
Gwydir 1 60 0 0 0 0
Namoi–Peel 3 8 0 0 0 0
Macquarie–Castlereagh–Bogan 48 107 0 0 0 0
Barwon–Darling 0 0 0 0 0 0
Lower Darling 1 98 0 37 0 37
Lachlan 2 68 0 0 0 0
Murrumbidgee 95 577 0 ‑57 0 ‑57
Murray 43 497 0 ‑47 ‑2 ‑50
totalnewsouthwales 193 1,462 4 -91 -2 -89
victoria4
Goulburn 81 286 ‑15 17 0 ‑
Broken 1 0 0 0 0 ‑
Loddon 26 44 ‑5 ‑17 0 ‑
totalgoulburn–Broken–loddon7 108 329 -21 -1 -109 -135
Campaspe6 37 31 ‑5 0 0 0
Wimmera–Mallee 2 0 0 0 0 0
Kiewa 0 0 0 0 0 ‑
Ovens 1 0 0 0 0 ‑
Murray 185 451 25 225 0 ‑
totalkiewa–ovens–Murray 186 451 25 225 74 325
totalvictoria 333 812 0 225 -35 190
southAustralia
Metro–Adelaide & Associated Country Areas5
0 0 0 0 0 0
Lower Murray Swamps 0 0 0 ‑12 ‑47 ‑60
Country Towns 0 0 0 2 0 2
All Other Purposes 0 0 0 ‑147 80 ‑68
totalsouthAustralia 0 0 0 -157 32 -125
Queensland
Condamine–Balonne 12 3 0 0 0 0
Border Rivers 16 35 ‑4 23 0 23
Macintyre Brook 0 5 0 0 0 0
Moonie 2 0 0 0 0 0
Nebine 0 0 0 0 0 0
Warrego 1 0 0 0 0 0
Paroo 0 0 0 0 0 0
totalQueensland 31 42 -4 23 0 23
AustralianCapitalterritory 0 0 0 0 0 0
totalBasin 557 2,316 0 0 -5 -1
1. The total Cap adjustment for permanent trade (including exchange rate adjustments to permanent interstate trade) is comprised of the sum of net inter–valley and net interstate trade for each designated river valley.
2. The total Cap adjustment for temporary trade is comprised of the sum of net inter–valley and interstate temporary trade and unused component of permanent trade this year for each designated river valley.
3. The sign convention used is that a negative value indicates a trade out of the valley and a positive value indicates a trade into the valley.
4. Temporary entitlement transfers in Victoria, includes temporary trade in both water right and sales entitlement.
5. The Metro–Adelaide & Associated Country Areas Cap component is non–tradable, unless the Ministerial Council determines otherwise.
6. Adjustment for Campaspe equals water transferred via Goldfields Superpipe. All other trades are effected by changing the Rochester pumped diversions
7. Goulburn–Broken–Loddon Cap adjustment reduces by the total water transferred via the Goldfields Superpipe.
8. n/a—data not available

52
Murray–Darling Basin Authority
Water audit Monitoring report 2010–11
10. wAterAvAIlABIlItyFortheyeAr2010–11
10.1 waterAvailabilityThe 1995 report to the Ministerial Council: An Audit of Water Use in the Murray–Darling Basin, found that water users had only used 63% of the water that they had been authorised to use in the previous 5 years (the amount allocated was not restricted to the quantity available and in some years exceeded it). This highlights the fact that the States’ allocation systems evolved to encourage development of the Basin’s water resources and were not well suited to being used to impose a Cap on diversions.
A key step in the process to implement the Cap is adjusting the States’ allocation systems. To make Cap implementation more transparent, the water used in each valley has been compared with the quantity of water that has been allocated for use in that valley in 2010–11 (see table11).
Water is allocated in many different ways across the Basin and there are differences between States, valleys and regions depending upon the reliability of supply and the degree of regulation. These types of allocations are summarised below.
10.1.1 volumetricAllocationsWater users in regulated streams and in some unregulated systems are issued with volumetric entitlements (see table8). These entitlements specify a base volume of water that can be diverted each year and come in three main categories:
• High security entitlements, which are available every year;
• Volumetric entitlements on unregulated streams, which are available, provided there is flow in the stream; and
• Normal security entitlements, which are subject to allocation announcements, made at intervals throughout the season. These entitlements, which include Victorian water right and sales, are the largest category of volumetric entitlement in the Basin. For these entitlements, the volume allocated is the base entitlement multiplied by the announced percentage allocation at the end of the season.
10.1.2ContinuousAccountingIn the Border Rivers, Gwydir and Namoi valleys in New South Wales and Condamine–Balonne in Queensland, continuous accounting is in operation. Under this system, water users have individual accounts, which may build up to a specified percentage of the entitlement. The account increases when allocations are made and decreases as water is used. The usage in any season is limited to a specified percentage of the entitlement. Water available under continuous accounting is reported in the fourth column of table8.
10.1.3AllocationtransferredintovalleyA temporary inter–valley transfer will increase the allocation in the purchasing valley and reduce the allocation in the selling valley. The net transfer into each valley has been copied from table7 to the fifth column in table8.
10.1.4CarryoverfromthepreviousyearCarryover is available in a number of valleys in New South Wales, Victoria and South Australia. This enables unused allocation in one season to be carried over to the next, up to specified limits. Carryover differs from continuous accounting in that accounts are kept on an annual basis rather than a continuous one. In some valleys, carryover is

53Water audit Monitoring report 2010–11
10. Water availability for the year 2010–11
cancelled as allocations approach 100% or if a storage spills and carryover can also be reduced to allow for increased evaporations. table9 shows the carryover added to the valley allocation. The net carryover from the previous season is included as column 3 in table8.
10.2 AllocatedwaterThe total volume of allocated water under annual accounting equals the sum of allocated water this year, carryover from previous year and water transferred into valley. Under the continuous accounting the total volume of allocated water equals balance of accounts at the end year plus the water transferred into the valley, although this may be subject to overall usage limits. The total volume of allocated water is listed in the last column of table 8.
10.3 AccesstowaternotintheAllocationsystem
10.3.1supplementaryAccess(off-allocation)andwater–harvesting
Water is made available to irrigators in some regulated streams during periods when storages are spilling or there are unregulated flows by declarations of off‑allocation periods. Water diverted in these periods does not count against an irrigator’s allocation for the rest of the season. Historically there were no controls over the size of these diversions other than the duration of the event and the licensed pump capacity. However, in recent years, quotas have been established in some systems and annual limits have been imposed. Access to off–allocation has been discontinued in South Australia. In New South Wales, the off–allocation has been redesignated as supplementary access and requires separate licence
Water harvesting licences were issued in most Queensland streams, but the majority have now been converted into tradable water allocations. These water allocations are limited by diversion capacity, the passing stream‑flow at which water allocation holder can commence to pump and volumetric limits. The total volume of surface water able to be taken in a Queensland Murray Darling Basin catchment is also limited under the catchment’s water resource plan.
10.3.2Arealicencesonunregulatedstreams
Some entitlements on unregulated streams specify an area that can be irrigated but not the volume of water which can be diverted. It is possible to estimate the volume of water made available to these licences by multiplying the licensed area by an assumed usage based on crop type. However this availability can be limited by the low flows in the stream.
10.3.3IrrigationsystemlossesIn some irrigation distribution systems, water entitlements specify the rights to water delivered at the farm gate. The losses incurred by the water authority in delivering water from the diversion point on the river to the farm gate are therefore not covered by the announced allocation and need to be subtracted from the diversions to determine the use of allocated water. These losses are included in the fifth column of table10. For other irrigation distribution systems, such as the privatised districts in the New South Wales Murray, an allowance for the system losses has been included in the water entitlement.
10.4 ComparisonofuseofAllocatedwaterwiththeAllocatedvolume
The final column in table10 lists the total use of allocated water. This is worked out by subtracting from the total diversions, the sum of supplementary access–water harvesting (third column), unregulated stream use (fourth column) and diversions not in the allocation (fifth column). In calculating the water used in Victorian river valleys, the volumes diverted from each stream have to be adjusted for the water diverted from other valleys (second column of table10). For example, in Victoria, water is physically transferred from the Goulburn Valley into the Campaspe and Loddon Valleys via the Waranga Western Channel.
In table11, allocated volumes are compared with the water used in each valley and the percentage use of the water allocated by the water authorities for diversion is presented.
Until 2003–04, efficiency of an allocation system was measured by comparing diversions with water authorised for use. In theory, it would have been possible to assess the maximum volume of water that could have been diverted under the rules that existed for the water harvesting, unregulated flow

54
Murray–Darling Basin Authority
Water audit Monitoring report 2010–11
and system losses and comparing this with the volume of water used under these rules. In practice, working out this volume was too difficult, and an assumption was made that usage under these three categories equalled the volume authorised for use. This led to an overestimation of the utilisation of authorised water. This system has now been replaced with a new system of comparison of the use of allocated water with the volume of allocation. This gives a better measure of the degree of utilisation but covers only three quarters of the total diversion. The use percentages from 1997–98 to 2003–04 have been recalculated according to the new system. Figure7 shows the utilisation of allocations in the Basin since 1997–98.
The 2010–11 utilisation of 30% is lowest since Cap accounting started in 1997–98. This appears quite reasonable given wet conditions during 2010–11.
It is expected that diversion, as a percentage of the water allocated, will fluctuate from year to year, depending upon the climatic conditions and the degree to which the diversions are constrained by the physical resources available. Typically the utilisation of the allocations will be higher in the drier years and lower in the wetter years, especially in the south of the Basin. It is also expected that allocations would reduce and utilisation increase if the allocation system was tightened to prevent growth in diversions under the Cap.
Figure7:utilisationofallocatedwateraspercentageoftheallocatedvolumesince1997–98
20%
30%
40%
50%
60%
70%
80%
90%
100%
1998 1999 2000 2001 2002 2003 2004 2005 2006 2007 2008 2009 2010 2011
Per
cent
Use
Year ending June
NSW VIC SA QLD Basin 1995 Audit

55Water audit Monitoring report 2010–11
10. Water availability for the year 2010–11
table8:waterAllocatedin2010–11
system
Basevalleywater
entitlements(gl)
AnnouncedAllocation
(gl)2
netCarryoveroverdraw
fromprevious
year(gl)5
waterAvailable
undercontinuousaccounting
(gl)3
Allocationtransferred
intovalley(gl)4
netwaterallocatedto
environmentalentitlements
(gl)
totalAllocated
waterinvalley(gl)6
newsouthwales
Intersecting Streams 24 0 0 0 0 0 0
Border Rivers3 413 279 28 307 ‑20 0 246
Gwydir3 754 444 11 455 0 ‑88 366
Namoi–Peel3 551 336 38 374 0 ‑7 312
Macquarie–Castlereagh–Bogan
791 672 20 ‑ 0 ‑105 447
Barwon–Darling 195 0 0 ‑ 0 0 0
Lower Darling 366 95 13 ‑ 37 0 144
Lachlan 720 788 32 ‑ 0 ‑143 429
Murrumbidgee 2,935 2,213 512 ‑ ‑57 ‑344 2,324
Murray 2,550 1,693 560 ‑ ‑47 ‑107 2,100
totalnewsouthwales 9,301 6,518 1,214 1,136 -87 -794 6,368
victoria
Goulburn 939 640 275 ‑ 1 ‑124 792
Broken 34 20 4 ‑ 0 0 24
Loddon 357 220 56 ‑ ‑22 ‑3 251
Campaspe 375 236 54 ‑ ‑5 ‑5 281
Wimmera–Mallee 82 82 0 ‑ 0 ‑42 40
Kiewa 20 1 0 ‑ 0 0 1
Ovens 63 38 0 ‑ 0 0 38
Murray 1,543 1,224 502 ‑ 251 ‑302 1,675
totalvictoria 3,411 2,461 890 0 225 -474 3,102
southAustralia
Metro–Adelaide & Associated Country Areas3
150 150 175 0 0 n/a 325
Lower Murray Swamps 47 32 15 0 ‑12 n/a 34
Country Towns3 50 33 0 0 2 n/a 36
All Other Purposes 596 404 192 0 ‑147 n/a 449
totalsouthAustralia 843 619 382 0 -157 n/a 843
Queensland n/a
Condamine–Balonne 121 115 14 0 0 n/a 129
Border Rivers 78 76 0 0 20 n/a 96
Macintyre Brook 19 19 0 0 0 n/a 19
Moonie 0 0 0 0 0 n/a 0
Nebine 0 0 0 0 0 n/a 0
Warrego 3 3 0 0 0 n/a 3
Paroo 0 0 0 0 0 n/a 0
totalQueensland 220 212 14 0 20 n/a 246
AustralianCapitalterritory8
0 0 0 0 0 n/a 0
totalBasin 13,776 9,810 2,501 1,136 0 -1,268 10,559
1. Sum of the volumetric entitlements in valley (in NSW this is the sum of general and high security entitlements). Includes unregulated stream entitlements where these are expressed volumetrically (e.g. in Victoria).
2. The base entitlements multiplied, where appropriate, by the largest announced percentage allocation in the season. In NSW this includes high security entitlements.
3. In continuous accounting, individual accounts can accumulate up to a specified percentage of entitlements but use can be limited to a specified percentage of entitlements during a season.
4. Net temporary inter‑valley entitlement transfer from table7.
5. Net Carryover from Previous Year (see table9).
6. Allocated water = announced allocation or permitted use under continuous accounting + inter‑valley trade + net carryover from last season (in NSW the addition of high security entitlements are also included).
7. The gazetted allocation for Metro Adelaide & Associated Country areas and Country Towns.
8. There is no formal entitlement in ACT to date.

56
Murray–Darling Basin Authority
Water audit Monitoring report 2010–11
table9:Carryoversfor2010–11
system
Carryoverfrom
2009–10(gl)
lessCarryoverCancelledin2010–11
(gl)
lessoverdraw
usedin2009–10
(gl)
plusoverdrawcancelled
in2010–11(gl)
plusoverdraw
from2011–12
(gl)
netCarryoverfor2010–
11(gl)
newsouthwales
Intersecting streams 0 0 0 0 0 0
Border Rivers 28 0 0 0 0 28
Gwydir 11 0 0 0 0 11
Namoi–Peel 38 0 0 0 0 38
Macquarie–Castlereagh–Bogan 41 21 0 0 0 20
Barwon–Darling 0 0 0 0 0 0
Lachlan 33 1 0 0 0 32
Murrumbidgee 521 10 0 0 0 512
Lower Darling 13 0 0 0 0 13
Murray 564 4 0 0 0 560
totalnewsouthwales 1,250 36 0 0 0 1,214
victoria
Goulburn 275 0 0 0 0 275
Broken 4 0 0 0 0 4
Loddon 56 0 0 0 0 56
Campaspe 54 0 0 0 0 54
Wimmera–Mallee 0 0 0 0 0 0
Kiewa 0 0 0 0 0 0
Ovens 0 0 0 0 0 0
Murray 502 0 0 0 0 502
totalvictoria 890 0 0 0 0 890
southAustralia
Metro–Adelaide & Associated Country Areas
175 0 0 0 0 175
Lower Murray Swamps 15 0 0 0 0 15
Country Towns 0 0 0 0 0 0
All Other Purposes 192 0 0 0 0 192
totalsouthAustralia 382 0 0 0 0 382
Queensland
Condamine–Balonne 14 0 0 0 0 14
Border Rivers 0 0 0 0 0 0
Macintyre Brook 0 0 0 0 0 0
Moonie 0 0 0 0 0 0
Nebine 0 0 0 0 0 0
Warrego 0 0 0 0 0 0
Paroo 0 0 0 0 0 0
totalQueensland 14 0 0 0 0 14
AustralianCapitalterritory 0 0 0 0 0 0
totalBasin 2,537 36 0 0 0 2,501
1. Under certain conditions (such as storage spills), carryovers from the previous season can be cancelled.
2. Net carryover is defined as: carryover less cancelled carryover less overdraws used during last year plus overdraw permitted this year.

57Water audit Monitoring report 2010–11
10. Water availability for the year 2010–11
table10:useofAllocatedwater(excludingenvironmentalwater)in2010–11
system
diversionfrom
valley(gl)
divertedfromother
valleys(gl)
lesssupplementaryAccess,water–
harvestinguseand
landsurfacediversions
(gl)
lessunregulatedstreamuse
(gl)
lessdiversions
notinAllocation
(gl)
useofAllocated
waterinvalley
(gl)
newsouthwales
Intersecting Streams 3 0 0 3 0 0
Border Rivers 192 0 94 28 0 70
Gwydir 271 0 134 44 0 93
Namoi–Peel 270 0 87 113 0 70
Macquarie–Castlereagh–Bogan 183 0 35 40 0 108
Barwon–Darling 95 0 0 95 0 0
Lower Darling 28 0 0 0 0 28
Lachlan 90 0 0 15 0 74
Murrumbidgee 1,461 0 524 42 0 895
Murray 689 0 139 28 0 523
totalnewsouthwales 3,283 0 1,013 409 0 1,861
victoria
Goulburn 513 ‑155 0 3 188 168
Broken 6 0 0 0 4 2
Loddon 25 53 0 1 24 54
Campaspe 18 68 0 0 18 68
Wimmera–Mallee 10 0 0 0 0 9
Kiewa 1 0 0 1 0 0
Ovens 6 0 0 0 0 6
Murray 556 15 0 2 45 524
totalvictoria 1,136 -19 0 8 278 831
southAustralia
Metro–Adelaide & Associated Country Areas
56 0 0 0 0 56
Lower Murray Swamps 14 0 0 0 0 14
Country Towns 34 0 0 0 0 34
All Other Purposes 257 0 0 0 0 257
totalsouthAustralia 361 0 0 0 0 361
Queensland
Condamine–Balonne 1,064 0 975 7 12 69
Border Rivers 411 0 371 0 9 31
Macintyre Brook 10 0 0 0 0 10
Moonie 29 0 29 0 0 0
Nebine 0 0 0 0 0 0
Warrego 11 0 11 0 0 1
Paroo 0 0 0 0 0 0
totalQueensland 1,525 0 1,386 7 22 111
AustralianCapitalterritory 6 0 0 0 0 n/a
totalBasin 6,311 ‑19 2,399 423 299 3,164
1. ‘Diversion Losses not in Allocation’ are losses in those irrigation systems where the entitlement is defined at the farm gate and losses in the distribution system are not covered by an entitlement.

58
Murray–Darling Basin Authority
Water audit Monitoring report 2010–11
table11:useofvalleyAllocations(excludingenvironmentalallocations)in2010–11
systemtotalAllocatedwater
invalley(gl)3
useofAllocatedwaterinvalley
(gl)useasa%ofAuthorised
valleyuse(gl)
newsouthwales
Intersecting Streams1 0 0 n/a
Border Rivers1 246 70 28%
Gwydir1 366 93 25%
Namoi–Peel1 312 70 22%
Macquarie–Castlereagh–Bogan 447 108 24%
Barwon–Darling1 0 0 na
Lower Darling1 144 28 20%
Lachlan 429 74 17%
Murrumbidgee 2,324 895 39%
Murray 2,100 523 25%
totalnewsouthwales 6,368 1,861 29%
victoria
Goulburn 792 168 21%
Broken 24 2 7%
Loddon 251 54 22%
Campaspe 281 68 24%
Wimmera–Mallee 40 9 23%
Kiewa 1 0 43%
Ovens 38 6 15%
Murray 1,675 524 31%
totalvictoria 3,102 831 27%
southAustralia
Metro–Adelaide & Associated Country Areas1,2
325 56 17%
Lower Murray Swamps 34 14 40%
Country Towns 36 34 96%
All Other Purposes 449 257 57%
totalsouthAustralia 843 361 43%
Queensland
Condamine–Balonne1 129 69 54%
Border Rivers 1 96 31 32%
Macintyre Brook1 19 10 54%
Moonie1 0 0 n/a
Nebine 0 0 n/a
Warrego1 3 1 33%
Paroo1 0 0 n/a
totalQueensland 246 111 45%
AustralianCapitalterritory 0 n/a n/a
totalBasin 10,559 3,164 30%
1. The use of water not covered by allocations (e.g. water harvesting, off–allocations– supplementary water, unregulated stream licenses) constitutes a large percentage of the use in these valleys.
2. The volume authorised for use for Metro–Adelaide & Associated Country Areas for 2010–11 is the amount that could be used before the 5–year Cap of 650 GL would be exceeded.
3. Allocated water from table8

59Water audit Monitoring report 2010–11
11. Environmental water and cap adjustments
11. envIronMentAlwAterAndCApAdjustMents
Environmental water is the water used for environmental purposes. Protecting, maintaining and–or enhancing the riverine or terrestrial environment are all considered environmental purposes. Environmental water may be provided without creating any legal right or entitlement to water for the environment. However, providing environmental water by way of creating legally recognised right to water for the environment, called environmental entitlement, is preferred. Environmental entitlements are created through relevant State–Commonwealth legislation as continuing entitlements to water to be used for environmental purposes. Environmental water may be created by several means, for example, through purchase of non–environmental entitlements and water savings.
Environmental water that is recovered through savings or other mechanisms for the Snowy and River Murray System, in some cases, require adjustment to the Cap in valleys where this water is recovered or used. Different States treat environmental allocations and
environmental uses differently. This affects the timing and manner of Cap adjustment. Ministerial Council Meeting 45—23 May 2009 adopted a protocol for adjusting Caps for environmental entitlements and uses. The Protocol provides for different methods for adjusting the Cap. However, a State must seek approval of the Murray–Darling Basin Authority of its proposed method of adjusting the Cap for environmental water. The Protocol requires the Authority to receive data from the States on environmental entitlements created, allocations for environment use, trade in environmental entitlements and allocations, and Cap adjustments for environmental use to be reported and report the information in the Water Audit Monitoring Report. The collated data received from the States related to these matters given in table12—table 15.Total water available from entitlements for environmental use was 1,846 GL, total use of this water was 1,119 GL, and total net consumptive environmental use was 79 GL. The Cap adjustment for environmental use was 1,238 GL.

60
Murray–Darling Basin Authority
Water audit Monitoring report 2010–11
table12:environmentalwaterentitlementsin2010–11
totalenvironmentalentitlementsentitlementscreatedfromsavings
madeoutsidetheCap
system
highreliability
entitlement(gl)
lowreliability
entitlement(gl)
environmentalsupplementary
Accessentitlement
(gl)
highreliability
entitlements(gl)
lowreliability
entitlements(gl)
environmentalsupplementary
Accessentitlements
(gl)
newsouthwales
Intersecting Streams 0 0 0 0 0 0
Border Rivers 0 0 0 0 0 0
Gwydir 0 107 20 0 0 0
Namoi–Peel 0 6 0 0 0 0
Macquarie–Castlereagh–Bogan
0 120 3 0 0 0
Barwon–Darling 0 0 22 0 0 0
Lachlan 2 120 0 0 12 0
Murrumbidgee * 60 268 27 35 0 0
Lower Darling 1 48 250 0 0 0
Murray * 38 187 113 4 0 13
totalnewsouthwales 100 856 435 38 12 13
victoria
Goulburn 94 167 0 0 0 0
Broken 0 0 0 0 0 0
Loddon 3 3 0 0 0 0
Campaspe 5 5 0 0 0 0
Wimmera–Mallee 42 0 0 0 0 0
Kiewa 0 0 0 0 0 0
Ovens 0 0 0 0 0 0
Murray * 158 136 34 0 0 34
totalvictoria 302 312 34 0 0 34
southAustralia
Metro–Adelaide & Associated Country Areas
0 0 0 0 0 0
Lower Murray Swamps 0 0 0 0 0 0
Country Towns 0 0 0 0 0 0
All Other Purposes 112 0 0 0 0 0
totalsouthAustralia 112 0 0 0 0 0
Queensland
Condamine–Balonne 0 0 0 0 0 0
Border Rivers 0 9 1 0 0 0
Macintyre Brook 0 0 0 0 0 0
Moonie 0 0 1 0 0 0
Nebine 0 0 1 0 0 0
Warrego 0 0 8 0 0 0
Paroo 0 0 0 0 0 0
totalQueensland 0 9 11 0 0 0
AustralianCapitalterritory n/a n/a n/a n/a n/a n/a
totalBasin 515 1,177 480 38 12 47
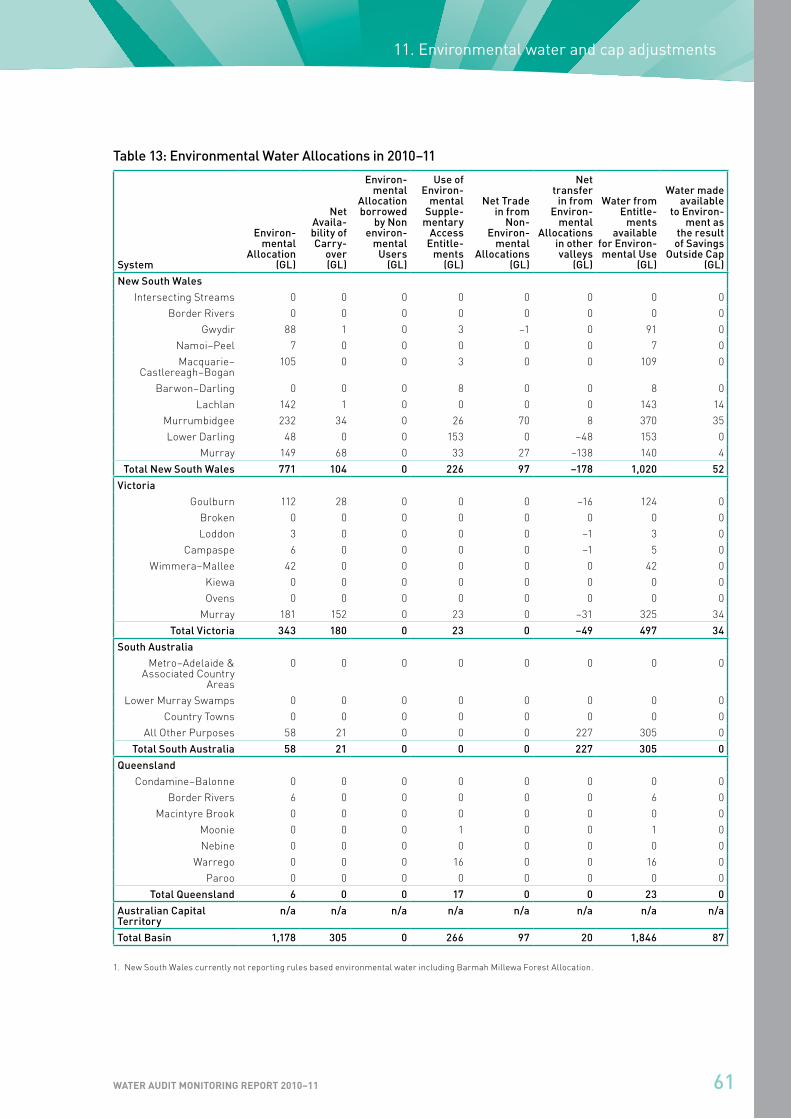
61Water audit Monitoring report 2010–11
11. Environmental water and cap adjustments
table13:environmentalwaterAllocationsin2010–11
system
environ-mental
Allocation(gl)
netAvaila-bilityofCarry-
over(gl)
environ-mental
Allocationborrowed
bynonenviron-
mentalusers
(gl)
useofenviron-
mentalsupple-
mentaryAccess
entitle-ments
(gl)
nettradeinfrom
non-environ-
mentalAllocations
(gl)
nettransfer
infromenviron-
mentalAllocations
inothervalleys
(gl)
waterfromentitle-
mentsavailable
forenviron-mentaluse
(gl)
watermadeavailable
toenviron-mentas
theresultofsavings
outsideCap(gl)
newsouthwales
Intersecting Streams 0 0 0 0 0 0 0 0
Border Rivers 0 0 0 0 0 0 0 0
Gwydir 88 1 0 3 –1 0 91 0
Namoi–Peel 7 0 0 0 0 0 7 0
Macquarie–Castlereagh–Bogan
105 0 0 3 0 0 109 0
Barwon–Darling 0 0 0 8 0 0 8 0
Lachlan 142 1 0 0 0 0 143 14
Murrumbidgee 232 34 0 26 70 8 370 35
Lower Darling 48 0 0 153 0 –48 153 0
Murray 149 68 0 33 27 –138 140 4
totalnewsouthwales 771 104 0 226 97 –178 1,020 52
victoria
Goulburn 112 28 0 0 0 –16 124 0
Broken 0 0 0 0 0 0 0 0
Loddon 3 0 0 0 0 –1 3 0
Campaspe 6 0 0 0 0 –1 5 0
Wimmera–Mallee 42 0 0 0 0 0 42 0
Kiewa 0 0 0 0 0 0 0 0
Ovens 0 0 0 0 0 0 0 0
Murray 181 152 0 23 0 –31 325 34
totalvictoria 343 180 0 23 0 –49 497 34
southAustralia
Metro–Adelaide & Associated Country
Areas
0 0 0 0 0 0 0 0
Lower Murray Swamps 0 0 0 0 0 0 0 0
Country Towns 0 0 0 0 0 0 0 0
All Other Purposes 58 21 0 0 0 227 305 0
totalsouthAustralia 58 21 0 0 0 227 305 0
Queensland
Condamine–Balonne 0 0 0 0 0 0 0 0
Border Rivers 6 0 0 0 0 0 6 0
Macintyre Brook 0 0 0 0 0 0 0 0
Moonie 0 0 0 1 0 0 1 0
Nebine 0 0 0 0 0 0 0 0
Warrego 0 0 0 16 0 0 16 0
Paroo 0 0 0 0 0 0 0 0
totalQueensland 6 0 0 17 0 0 23 0
AustralianCapitalterritory
n/a n/a n/a n/a n/a n/a n/a n/a
totalBasin 1,178 305 0 266 97 20 1,846 87
1. New South Wales currently not reporting rules based environmental water including Barmah Millewa Forest Allocation.

62
Murray–Darling Basin Authority
Water audit Monitoring report 2010–11
table14:environmentalwaterusein2010–11
system
totaluseofwaterfrom
environmentalentitlements
(gl)
Consumptiveuseof
waterfromenvironmental
entitlements(gl)
Consumptiveenvironmental
usenotcoveredbyanentitlements
(gl)
totalConsumptive
environmentaluse(gl)
percentageuseof
waterfromenvironmental
entitlements(%)
newsouthwales
Intersecting Streams 0 0 0 0 0%
Border Rivers 0 0 0 0 0%
Gwydir 18 0 0 0 19%
Namoi–Peel 0 0 0 0 0%
Macquarie–Castlereagh–Bogan 60 0 0 0 55%
Barwon–Darling 8 0 0 0 100%
Lachlan 12 0 0 0 8%
Murrumbidgee 186 0 0 0 50%
Lower Darling 153 0 0 0 100%
Murray 164 0 0 0 118%
totalnewsouthwales 601 0 0 0 59%
victoria
Goulburn 9 9 0 9 7%
Broken 0 0 0 0 0%
Loddon 0 0 11 11 3%
Campaspe 0 0 0 0 0%
Wimmera–Mallee 44 0 0 0 107%
Kiewa 0 0 0 0 0%
Ovens 0 0 0 0 0%
Murray 143 59 0 59 44%
totalvictoria 197 68 11 79 40%
southAustralia
Metro–Adelaide & Associated Country Areas
0 0 0 0 0%
Lower Murray Swamps 0 0 0 0 0%
Country Towns 0 0 0 0 0%
All Other Purposes 304 0 0 0 100%
totalsouthAustralia 304 0 0 0 100%
Queensland
Condamine–Balonne 0 0 0 0 0%
Border Rivers 0 0 0 0 0%
Macintyre Brook 0 0 0 0 0%
Moonie 1 0 0 0 100%
Nebine 0 0 0 0 0%
Warrego 16 0 0 0 100%
Paroo 0 0 0 0 0%
totalQueensland 17 0 0 0 76%
AustralianCapitalterritory n/a n/a n/a n/a n/a
totalBasin 1,119 68 11 79 61%

63Water audit Monitoring report 2010–11
11. Environmental water and cap adjustments
table15:CapAdjustmentforenvironmentalwaterusein2010–11
ComponentofcalculatedAnnualdiversiontarget
system
thatwasusedforenviron-
mentunderbaseline
conditions(gl)
relatingtoan
entitlementthathas
beentransfer-
redtoenviron-
mentaluse(gl)
relatingtoawater
savingsthathasbeen
transfer-redtoanenviron-
mentaluse(gl)
environ-mentaluseofannon-
environ-mental
Allocation(tradetoenviron-
ment)(gl)
non-environ-
mentaluseofanenviron-
mentalAllocation
(tradefromenviron-
ment)(gl)
waterwithinCaptransfer-
redtosnowyannual
Allocation(gl)
volumebywhichCapisreducedfor
environ-mental
entitle-mentsand
use(gl)
newsouthwales
Intersecting Streams 0 0 0 0 0 0 0
Border Rivers 0 0 0 0 0 0 0
Gwydir 0 18 0 0 1 0 17
Namoi–Peel 0 0 0 0 0 0 0
Macquarie–Castlereagh–Bogan
0 60 0 0 0 0 60
Barwon–Darling 0 8 0 0 0 0 8
Lachlan 0 12 0 0 0 0 12
Murrumbidgee 0 178 0 75 5 86 334
Lower Darling 0 201 0 0 0 0 201
Murray 0 302 0 28 0 29 359
totalnewsouthwales 0 779 0 102 6 115 991
victoria
Goulburn Broken Loddon
0 2 0 0 0 24 27
Campaspe 0 0 0 0 0 0 0
Wimmera–Mallee 0 44 0 0 0 0 44
Kiewa Ovens Murray 27 53 0 0 0 21 101
totalvictoria 27 100 0 0 0 45 172
southAustralia
Metro–Adelaide & Associated Country
Areas
0 0 0 0 0 0 0
Lower Murray Swamps 0 0 0 0 0 0 0
Country Towns 0 0 0 0 0 0 0
All Other Purposes 0 70 0 0 0 0 70
totalsouthAustralia 0 70 0 0 0 0 70
Queensland
Condamine–Balonne 0 0 0 0 0 0 0
Border Rivers 0 6 0 0 0 0 6
Macintyre Brook 0 0 0 0 0 0 0
Moonie 0 0 0 0 0 0 0
Nebine 0 0 0 0 0 0 0
Warrego 0 0 0 0 0 0 0
Paroo 0 0 0 0 0 0 0
totalQueensland 0 6 0 0 0 0 6
AustralianCapitalterritory
n/a n/a n/a n/a n/a n/a n/a
totalBasin 27 955 0 102 6 160 1,238
1. No Adjustment to diversions and Cap Target as result of TLM and other environmental use.

64
Murray–Darling Basin Authority
Water audit Monitoring report 2010–11
12. CoMpArIsonoFACtuAlFlowswIthnAturAlFlows
A key factor in the Ministerial Council’s decision to implement the Cap was the major changes that had occurred to the flow regime in many of the Basin’s rivers. This either presents itself as a change in the seasonality of flow (as occurs below major dams) or a reduction in the total flow volume (as occurs at the bottom end of many of the river valleys). As part of the Cap monitoring process, the States have agreed to report on the way the natural flows in each river have been altered.
The natural flows are estimated from computer modelling studies. Many of the river models are incomplete, or not yet modified, to allow these numbers to be readily calculated for 2010–11. table16 presents the 2010–11 annual flow volumes recorded and the natural flows at a number of selected key sites within the Murray–Darling Basin, whilst the impact of development can be seen graphically in Figure8 and Figure 9.

65Water audit Monitoring report 2010–11
12. Comparison of actual flows with natural flows
table16:Comparisonof2010–11ActualandnaturalAnnualFlowsforkeysiteswithintheMurray–darlingBasin
systemActualFlow
(gl)naturalFlow
(gl)Actual–/natural
(%)
InterBasintransfers
Snowy Mountain Scheme to Murrumbidgee River ‑97 n/a n/a
Snowy Mountain Scheme to Murray River 587 n/a n/a
Glenelg River Catchment to Wimmera–Mallee n/a n/a n/a
Wannon River Catchment to Wimmera–Mallee n/a n/a n/a
newsouthwalestributaries
Barwon River at Mungindi + Boomi River 1,540 n/a n/a
Inflows to Gwydir Wetland 173 n/a n/a
Gwydir System Outflows to Barwon River 21 n/a n/a
Namoi System Outflows to Barwon River 1,606 n/a n/a
Inflows to Macquarie Marshes 887 n/a n/a
Macquarie–Castlereagh–Bogan Outflows 2,063 n/a n/a
Darling River Inflows to Menindee Lakes 1,840 n/a n/a
Lachlan River at Coorong 120 n/a n/a
Lachlan River at Booligal 204 n/a n/a
Murrumbidgee River at Balranald 2,425 n/a n/a
Lower Darling River at Burtundy 3,462 n/a n/a
victoriantributaries
Kiewa River at Bandiana 1,085 1,086 100%
Ovens River at Wangaratta 3,442 3,440 100%
Goulburn River at McCoys Bridge 3,199 5,693 56%
Campaspe River at Rochester 515 855 60%
Loddon River at Appin South 474 700 68%
Wimmera River at Horsham 303 487 62%
Queenslandtributaries
Condamine–Balonne–Culgoa Flows at NSW Border 5,631 n/a n/a
Macintyre River at Goondiwindi 3,005 n/a n/a
Moonie River at Fenton 543 n/a n/a
Warrego River at Cunnamulla 1,295 n/a n/a
Paroo River at Caiwarro 486 n/a n/a
riverMurray
Albury (Doctors Point) 5,223 7,594 69%
Yarrawonga 7,869 11,519 68%
Euston 11,937 n/a n/a
South Australian Border 15,029 n/a n/a
Barrages 12,849 n/a n/a
1. na indicates data not available or not applicable.
2. Operational data, which may be subject to change.
3. Includes interstate trade.
4. Zero flows in some situations due to rounding off to nearest 1 GL.

66
Murray–Darling Basin Authority
Water audit Monitoring report 2010–11
Figure8:plotsofFlowsatselectedsitesshowing2010–11Actualandnatural(Modelled)Flowsinvictoria
180 000
160 000
140 000
120 000
100 000
80 000
60 000
40 000
20 000
0
2010–11
Mon
thly
Flo
w (M
L/M
onth
)
Impact of Development on Kiewa River Flows at Bandiana
Jul Aug Sep Oct Nov Dec Jan Feb Mar Apr May Jun
Natural Actual
800 000
700 000
600 000
500 000
400 000
300 000
200 000
100 000
0
2010–11
Mon
thly
Flo
w (M
L/M
onth
)
Impact of Development on Ovens River Flows at Wangaratta
Jul Aug Sep Oct Nov Dec Jan Feb Mar Apr May Jun
Natural Actual

67Water audit Monitoring report 2010–11
12. Comparison of actual flows with natural flows
Figure8:plotsofFlowsatselectedsitesshowing2010–11Actualandnatural(Modelled)Flowsinvictoria
1400 000
1200 000
1000 000
800 000
600 000
400 000
200 000
0
2010–11
Mon
thly
Flo
w (M
L/M
onth
)
Impact of Development on Goulburn River Flows at McCoys Bridge
Jul Aug Sep Oct Nov Dec Jan Feb Mar Apr May Jun
Natural Actual
250 000
200 000
150 000
100 000
50 000
0
2010–11
Mon
thly
Flo
w (M
L/M
onth
)
Impact of Development on Loddon River Flows at Appin South
Jul Aug Sep Oct Nov Dec Jan Feb Mar Apr May Jun
Natural Actual

68
Murray–Darling Basin Authority
Water audit Monitoring report 2010–11
Figure8:plotsofFlowsatselectedsitesshowing2010–11Actualandnatural(Modelled)Flowsinvictoria
250 000
200 000
150 000
100 000
50 000
0
2010–11
Mon
thly
Flo
w (M
L/M
onth
)
Impact of Development on Campaspe River Flows at Rochester
Jul Aug Sep Oct Nov Dec Jan Feb Mar Apr May Jun
Natural Actual
180 000
160 000
140 000
120 000
100 000
80 000
60 000
40 000
20 000
0
2010–11
Mon
thly
Flo
w (M
L/M
onth
)
Impact of Development on Wimmera River Flows at Horsham
Jul Aug Sep Oct Nov Dec Jan Feb Mar Apr May Jun
Natural Actual

69Water audit Monitoring report 2010–11
12. Comparison of actual flows with natural flows
Figure9:plotsofFlowsatselectedsitesshowing2010–11Actualandnatural(Modelled)FlowsinMurrayriver
2500 000
2000 000
1500 000
1000 000
500 000
0
2010–11
Mon
thly
Flo
w (M
L/M
onth
)
Impact of Development on Murray River Flows at Euston Weir
Jul Aug Sep Oct Nov Dec Jan Feb Mar Apr May Jun
Natural Actual
2500 000
2000 000
1500 000
1000 000
500 000
0
2010–11
Mon
thly
Flo
w (M
L/M
onth
)
Impact of Development on Murray River Flows downstream of Yarrawonga Weir
Jul Aug Sep Oct Nov Dec Jan Feb Mar Apr May Jun
Natural Actual

70
Murray–Darling Basin Authority
Water audit Monitoring report 2010–11
Figure9:plotsofFlowsatselectedsitesshowing2010–11Actualandnatural(Modelled)FlowsinMurrayriver
1500 000
1300 000
1100 000
900 000
700 000
500 000
300 000
100 000
0
2010–11
Mon
thly
Flo
w (M
L/M
onth
)
Impact of Development on Murray River Flows at Doctors Point, Albury
Jul Aug Sep Oct Nov Dec Jan Feb Mar Apr May Jun
Natural Actual
700 000
600 000
500 000
400 000
300 000
200 000
100 000
0
2010–11
Mon
thly
Flo
w (M
L/M
onth
)
Impact of Development on Murray River Flows at South Australian Border
Jul Aug Sep Oct Nov Dec Jan Feb Mar Apr May Jun
Natural
Actual

71Water audit Monitoring report 2010–11
13. Impoundments and losses in major on–stream storages
13. IMpoundMentsAndlossesInMAjoron–streAMstorAges
The diversion and impoundment of water into major on–stream storage infrastructure provides security and reliability of supply to water users, particularly during periods of adverse climatic conditions.
Typically in periods of high rainfall and high riverine flow conditions, moderate to average volumes of water are diverted for irrigation use, whilst relatively moderate to large volumes are diverted for impoundment into on–stream storages. In contrast, during periods of low rainfall and low riverine flow conditions, generally large volumes of water are required to satisfy irrigation demand. It is during these periods of low rainfall that the volumes impounded in on–stream storages are used to supplement riverine flows.
The impoundments and losses in major on–stream storages (above 10 GL capacity) within the Basin are reported in table17. The volumes reported indicate that the total volume in storage in the Basin in 2010–11 has increased from 8194 GL to 19752 GL (78% full). Total evaporative losses for major storages within the Basin were calculated by the respective States and are reported at 49 GL, representing 0.2% of total storage capacity and equal to 0.8 % of total diversion from the Basin. The net decrease in flow of 11607 GL due to increase in storages and evaporative losses equal to 0.8% of total Basin diversion.

72
Murray–Darling Basin Authority
Water audit Monitoring report 2010–11
table17:ImpoundmentsandlossesinMajoron–streamstorages(greaterthan10glcapacity)in2010–11
systemMajoron–streamstorage
Comple-tiondate
storageCapa-
city(gl)
volumeofstorage
atBeginning
ofwateryear(gl)
volumeof
storageatend
ofwateryear(gl)
%ofstorage
Fullatendof
year(%)
Increasein
volumeof
storage(gl)
evapor-ation
losses(gl)
netreduc-tionin
Flowdueto
storage(gl)
Murray–darlingBasinAuthority
Lower Darling Menindee Lakes1
1960 2,050 1,522 1,956 95% 434 0 434
Murray2 Dartmouth Reservoir
1979 3,906 1,254 2,491 64% 1,237 0 1,237
Hume Reservoir 1936‑61 3,038 804 2,805 92% 2,002 0 2,002
Lake Victoria 1928 677 353 479 71% 127 0 127
totalMurray–darlingBasinAuthority 9,671 3,932 7,732 80% 3,799 0 3,799
snowyMountainsschemeinMurray–darlingBasin
Murrumbidgee River Valley
Jounama Pondage
1968 44 25 19 44% ‑6 0 ‑6
Talbingo Reservoir
1971 921 867 910 99% 44 6 50
Tantangara Reservoir
1960 254 24 55 22% 31 0 31
Tumut Pondage 1958 53 10 41 78% 31 0 31
Murray River Valley
Geehi Reservoir 1966 21 15 16 77% 1 0 1
Tooma Reservoir
1961 28 15 17 60% 2 0 2
Khancoban Pondage
1965 22 13 10 46% ‑3 0 ‑3
totalsnowyMountainsscheme 1,342 968 1,069 80% 101 6 107
BordersriversCommission
Border Rivers Glenlyon Dam 1976 254 56 251 99% 195 0 195
totalBorderriversCommission 254 56 251 99% 195 0 195
newsouthwales
Border Rivers Pindari Reservoir
1962‑96 312 78 310 99% 231 0 231
Gwydir Copeton Reservoir
1976 1,364 100 690 51% 590 0 590
Namoi–Peel Chaffey Reservoir
1979 62 55 62 101% 7 0 7
Keepit Reservoir
1960 423 120 416 98% 296 0 296
Split Rock Reservoir
1987 397 14 83 21% 69 0 69
Macquarie–Castlereagh–Bogan
Burrendong Reservoir
1967 1,678 197 1,075 64% 877 0 877
Windamere Reservoir
1984 368 68 168 46% 100 0 100
Lachlan Carcoar Reservoir
1970 36 2 27 76% 25 0 25
Lake Brewster 1952 153 2 1 1% ‑1 0 ‑1
Lake Cargelligo 1902 36 19 38 105% 19 0 19
Wyangala Reservoir
1936‑71 1,220 89 1,117 92% 1,028 0 1,028

73Water audit Monitoring report 2010–11
13. Impoundments and losses in major on–stream storages
systemMajoron–streamstorage
Comple-tiondate
storageCapa-
city(gl)
volumeofstorage
atBeginning
ofwateryear(gl)
volumeof
storageatend
ofwateryear(gl)
%ofstorage
Fullatendof
year(%)
Increasein
volumeof
storage(gl)
evapor-ation
losses(gl)
netreduc-tionin
Flowdueto
storage(gl)
Murrumbidgee2 Blowering Reservoir
1968 1,631 754 1,579 97% 825 0 825
Burrinjuck Dam 1907‑56 1,028 423 904 88% 481 0 481
Tombullen Off–River Storage
1980 11 0 1 8% 1 0 1
Hay Weir 1981 14 2 6 47% 4 0 4
totalnewsouthwales 8,733 1,923 6,476 74% 4,553 0 4,553
victoria
Goulburn– Broken–Loddon
Eildon Reservoir
1956 3,334 921 2,914 87% 1,994 ‑58 1,935
Lake Mokoan 1971 365 0 0 0% 0 0 0
Lake Nillahcootie
1967 40 12 41 102% 29 ‑3 26
Cairn Curran Reservoir
1956 147 7 131 89% 125 0 125
Tullaroop Reservoir
1959 73 4 70 96% 66 1 66
Campaspe Lake Eppalock 1964 305 27 295 97% 268 ‑1 267
Lauriston Reservoir
1941 20 15 20 99% 4 1 6
Malmsbury Reservoir
1870 18 0 10 56% 10 1 11
Upper Coliban Reservoir
1903 37 1 38 102% 37 1 38
Wimmera–Mallee
Lake Bellfield 1966 79 22 61 78% 39 3 42
Lake Fyans 1916 18 6 13 72% 8 3 11
Lake Lonsdale 1903 65 3 48 74% 45 12 58
Lake Taylor 1923 34 23 22 66% ‑1 5 5
Pine Lake 1928 62 0 11 17% 11 0 11
Tooloondo Reservoir
1953 92 0 0 0% 0 0 0
Wartook Reservoir
1887 29 10 16 56% 6 10 16
Murray–Kiewa–Ovens
Rocky Valley Reservoir
1959 28 14 18 64% 5 ‑1 4
Lake Buffalo 1965 24 14 14 58% ‑1 ‑3 ‑3
Lake William Hovell
1973 14 14 14 101% 0 ‑2 ‑2
totalvictoria 4,785 1,093 3,737 78% 2,644 -30 2,615
Queensland
Condamine–Balonne
Beardmore Dam
1972 82 70 82 100% 12 37 49
Chinchilla Weir 1974 10 8 10 100% 2 4 6
Cooby Dam 1942 21 2 20 93% 17 2 19
Jack Taylor Weir 1953‑59 10 9 10 100% 1 3 4
Leslie Dam 1985 106 10 105 99% 95 10 105
Macintyre Brook Coolmunda Dam
1968 69 9 60 87% 51 19 70
totalQueensland 298 107 286 96% 179 75 255

74
Murray–Darling Basin Authority
Water audit Monitoring report 2010–11
systemMajoron–streamstorage
Comple-tiondate
storageCapa-
city(gl)
volumeofstorage
atBeginning
ofwateryear(gl)
volumeof
storageatend
ofwateryear(gl)
%ofstorage
Fullatendof
year(%)
Increasein
volumeof
storage(gl)
evapor-ation
losses(gl)
netreduc-tionin
Flowdueto
storage(gl)
AustralianCapitalterritory
Murrumbidgee Bendora Reservoir
1961 12 9 9 79% 0 0 0
Corin Reservoir 1968 71 43 68 96% 25 ‑2 23
Googong Reservoir
1979 121 59 121 100% 62 0 63
Cotter 1912 4 4 3 82% ‑1 0 ‑1
totalAustralianCapitalterritory 207 115 201 97% 87 -2 84
totalBasin 25,290 8,194 19,752 78% 11,558 49 11,607
1. Menindee Lakes capacity revised based upon 2003 survey
2. The data is from MDBA database as on 6 March 2012. Operational data, which may be subject to change.

75Water audit Monitoring report 2010–11
14. Groundwater use in the basin
14. groundwAteruseIntheBAsIn
14.1 ContextBased on the findings from the Review of the Operation of Cap, the Council in August 2000, agreed to the following recommendations of the former Commission (Authority) related to groundwater:
• Groundwater be managed on an integrated basis with surface water within the spirit of Cap (recommendation20); and
• A Murray–Darling Basin Groundwater Management Strategy is developed by the Groundwater Technical Reference Group (GTRG) that is based on jurisdictional management of groundwater through sustainable yields and includes investigations clarifying how groundwater management practices may impact upon the integrity of Cap in future (recommendation21).
The GTRG is currently undertaking many projects aimed at implementing the above recommendations. This section on groundwater is aimed at establishing an integrated reporting framework for surface and groundwater in line with Recommendation 20.
14.2 groundwaterdatafor2010–11The GTRG supplied the estimated data for sustainable yield (SY), allocation and usage of groundwater in 2010–11 for each Groundwater Management Unit (GMU) in the Basin. The data was further supplemented and analysed using Geographical Information System (GIS) techniques to assign the groundwater data to the designated Cap valleys. Some errors are inevitable in the groundwater data because of the absence of precise information to apportion the aquifers to Cap valleys. However, the analysis presented in table18is valuable in itself, as it gives a snapshot of the Basin–wide status of groundwater.
The estimated sustainable yields in
Groundwater Management Units (GMU) of the Basin are reported to be 1840 GL. However, 1842 GL was already allocated in 2010–11, which is more than 100% of SY. But this allocation percentage does not take into account Victorian SY values as Victoria does not mange its groundwater on the basis of SY. The total usage of groundwater in the Basin was 511 GL, which was 28% of allocation and 28% of SY. The groundwater usage was 8% of surface water diversion in the Basin.
14.3 groundwaterusesince1999–2000Figure10shows the use of groundwater in the Basin since 1999–2000, when groundwater reporting started. It is evident from this figure that the groundwater use has been steadily rising, but there is decline in 2010–11 water year. However, deficiency in groundwater data must be noted. Several factors account for this deficiency in data: including changes in groundwater systems, names, their boundaries and policies for determining sustainable yield. The translation factors for converting groundwater data based upon GMUs to that based upon Cap valleys were worked out in 1999–2000 based upon the GMU layer analysis facilitated by the data provided by National Land and Water Resources Audit that year. However, these translational factors have not been able to cope with the changes since then. So the groundwater data depicted in table18 and Figure10need to be viewed with extreme caution.

76
Murray–Darling Basin Authority
Water audit Monitoring report 2010–11
table18:Basin–widegroundwaterdatafor2010–11alignedalongthedesignatedCapvalleys
designatedrivervalleysystem
sustainableyieldestimate
(gl)
groundwaterAllocation
(gl)
groundwateruse(gl)
surfacewateruse(gl)
newsouthwales
Intersecting Streams4 37 2 0 3
Border Rivers 37 8 1 192
Gwydir 74 75 42 271
Namoi–Peel 208 268 76 270
Macquarie–Castlereagh–Bogan 164 147 24 183
Barwon–Darling 13 1 0 95
Lachlan 323 299 62 90
Murrumbidgee 0 0 0 1,461
Lower Darling 360 390 89 28
Murray 137 167 21 689
totalnewsouthwales 1,353 1,358 316 3,283
victoria
Goulburn Broken Loddon 121 122 34 544
Campaspe 26 18 4 18
Wimmera–Mallee 3 9 1 10
Kiewa Ovens Murray 99 84 17 563
totalvictoria 248 233 57 1,136
southAustralia
totalsouthAustralia3 53 52 23 361
Queensland
Condamine–Balonne 171 190 113 1,064
Border Rivers 7 7 1 411
Macintyre Brook 0 0 0 10
Moonie 0 0 0 29
Nebine 0 0 0 0
Warrego 0 0 0 11
Paroo 0 0 0 0
totalQueensland 179 197 114 1,525
AustralianCapitalterritory 7 1 0 6
totalBasin 1,840 1,842 511 6,311
1. Refer table2.
2. Groundwater figures for New South Wales and Queensland are approximate as they do not include all the groundwater systems within the Cap valley (not all groundwater systems are within a recognised GMU boundary).
3. It is not sensible to divide South Australia Groundwater use into designated valleys.
4. Intersecting Streams include New South Wales Moonie Valley Groundwater data.

77Water audit Monitoring report 2010–11
14. Groundwater use in the basin
Figure10:groundwateruseintheBasinsince1999–2000
0.0
0.4
0.8
1.2
1.6
2.0
0
200
400
600
800
1000
1200
1400
1600
1800
2000 2002 2004 2006 2008 2010
AC
T G
roun
dwat
er U
se (G
L/Ye
ar)
Oth
er s
tate
s G
roun
dwat
er U
se (G
L/Ye
ar)
Year Ending June
NSW VIC SA QLD Total ACT

78
Murray–Darling Basin Authority
Water audit Monitoring report 2010–11
ConClusIon
The information and data contained within this report provides a comprehensive review of water use and management for the 2010–11 water year for the Murray–Darling Basin, as per the requirements of Schedule E (former Schedule F) to the Murray–Darling Basin Agreement. Significant progress have made in developing and accrediting the Cap models, which are used for Cap compliance. Out of 24 Cap valleys, Caps have not been defined in 1 valley and 2 other valleys do not require a Cap model. The remaining 21 Cap valleys have 23 models as two valleys comprise 2 sub valleys and have separate Cap models. Out of 23 Cap models, 16 Cap valley models have been audited and 15 approved (1 more, Macquarie ready for approval), 4 Cap models are being audited and 3 models (NSW Border Rivers, Metro Adelaide and ACT) are yet to be submitted for audit.
Total surface water use in the Murray–Darling Basin in 2010–11 was 6311 GL and groundwater use was 511 GL.
Information on groundwater usage has been presented for the tenth time in this report.
Water allocation rules in Murray Darling Basin have been tightened to implement the Cap. Due to high rainfall, water availability was very good.
However, the use of allocated water in the 2010–11 water year was only 30%. This was lowest utilisation since 1997–98.
The accuracy of diversion measurements was ±14% in the 2010–11 water year.
It is expected that the accuracy of measurement will improve over time as volumetric conversion is implemented in Queensland, and metering is extended to areas in New South Wales (unregulated) and Queensland, which are currently un‑metered.
Interstate water trading between New South Wales, Victoria and South Australia continued to develop in 2010–11.
It is envisaged that with the completion of Cap models for New South Wales (IQQM models) and Queensland Water Resource Plan processes, the calculation and reporting of natural flows throughout the Basin will be more complete in future reports.
The total volume of water in major storages within the Basin in 2010–11 increased from 8194 GL to 19752 GL (78% full). Total evaporative losses for major storages within the Basin were 49 GL, representing 0.2% of total storage capacity and 0.8% of total Basin diversion.
All Cap valleys for which Cap have been defined were within their Cap. There was large Basin–wide Cap credit.
The groundwater information in 2010–11 was not completely available. Based upon the limited information, the allocation of groundwater in the Basin was 1842 GL and usage was 511 GL.
Total water made available from entitlements for environmental use was 1,866 GL and total use of this water was 1,119 GL. Total Cap adjustments for Environmental water use was 1,218 GL.
The monitoring of Cap compliance within the Murray–Darling Basin is a large, complex, and challenging task, which has required substantial resources, cooperation and management from all the Governments.
It is evident from the progress to date of Cap implementation and the development towards more sustainable water use practices throughout the Murray–Darling Basin, that the continuation of a pro–active water management role by all Governments within the Murray–Darling Basin Initiative is required. This is to ensure a balance is maintained between the significant economic and social benefits that are derived from the development of the Basin’s water resources on the one hand, and the environmental uses of water in the rivers on the other.

79Water audit Monitoring report 2010–11
Glossary
glossAry
Ahd Australian Height Datum
AnnouncedAllocation The percentage of water entitlement declared available for diversion from a regulated stream in a season.
At Annual Trigger
AnnualAllocation The annual volume of water available for diversion from a regulated stream by an entitlement holder.
Authoriseduse Total of the water allocated in the valley plus off–allocation and water harvesting use plus unregulated stream use not in allocation and system losses not in allocation.
Borderrivers The rivers and tributaries forming, or intersecting the border between New South Wales and Queensland.
Brwss Border Rivers Water Supply System
Bulkentitlement A perpetual entitlement to water granted to water authorities by the Crown of Victoria under the Water Act 1989.
Carryover An unused entitlement from one season that can be used in the next year.
CA Continuous Accounting.
ChannelCapacity The maximum rate at which water can be delivered through a river reach or an artificial channel.
Cewh Commonwealth Environment Water Holder
CIt Central Irrigation Trust
CoAg Council of Australian Governments.
CwAs Critical Water Allocation Scheme
diversion The movement of water from a river system by means of pumping or gravity channels.
diversionlicence Specified licences issued for a specified annual volume and diversion rate.
derM The Department of Environment and Resource Management (of Queensland)
dnr The Department of Natural Resources (of New South Wales).
dnrw The Department of Natural Resources and Water (of Queensland).
dse The Department of Sustainability and Environment (of Victoria).
dozerAllocation An allocation that is not fully utilised.
dwlBC The Department of Water, Land and Bio‑diversity Conservation (of South Australia).
dwe The Department of Water and Energy (of New South Wales)
eC(unit) Electrical conductivity unit 1 EC = 1 micro‑Siemens per centimetre measurement at 25o Celsius. Commonly used to indicate the salinity of water.
elMA Environmental Land Management Allocation
ewA Environmental Water Allocation

80
Murray–Darling Basin Authority
Water audit Monitoring report 2010–11
end–of–valleyFlows The flow regime at the end of a valley.
Floodplainharvesting The diversion of water from a floodplain into storage(s).
gigalitre(gl) One thousand million or 109 litres.
gIs Geographical Information System
g–Mw Goulburn–Murray Water (of Victoria).
gMu Groundwater Management Unit
gsM Goulburn Simulation Model
gtrg Groundwater Technical Reference Group
gravitydistricts Districts which use gravity to divert the flow of water from the river.
highsecurityentitlement An entitlement which does not vary from year to year and is expected to be available in all but the worst droughts.
highreliabilitywatershare
Legally recognised, secure entitlement to a defined share of water, as governed by the reserve policy
IAg Independent Audit Group.
Impoundment The Storage of water diverted from a water course
IQQM Integrated Quantity Quality Model
Irrigation Supplying land or crops with water by means of streams, channels or pipes
lMrIA Lower Murray Reclaimed Irrigation Areas
lsd Land Surface Diversion
lowreliabilitywatershare
Legally recognised, secure entitlement to a defined share of water available after full high reliability water allocation, as governed by the reserve policy. Previously known as sales water.
lv Licensed Volume.
MdB Murray Darling Basin
MdBA Murray–Darling Basin Authority.
MdBC Former Murray–Darling Basin Commission.
MdBMC Murray–Darling Basin Ministerial Council.
Megalitre(Ml) One million or 106 litres.
Mou Memorandum of Understanding
MsM Murray Simulation Model
MinisterialCouncil,the Murray–Darling Basin Ministerial Council.
Murray–darlingBasinAgreement
The Agreement between the Governments of the four Basin States and the Commonwealth. The current Agreement is the 2009 Agreement.
off–Allocation When unregulated tributary inflows or spills are sufficient to supply irrigation needs and downstream obligations.
on–Farmstorage Privately owned storages used to harvest surplus flows or to store unused allocations for use in the following season.
overdraw Water diverted in one season against a prospective allocation in the subsequent year.
overlandFlow Water that runs off the land following rainfall, before it enters a watercourse, and floodwater that erupts from a watercourse or lake onto a floodplain.

81Water audit Monitoring report 2010–11
permanenttransfer The transfer of water entitlements on a permanent basis. The right to permanent transfers allows irrigators to make long–term adjustments to their enterprise and enables new operators to enter the industry.
privatediverters Licensed to operate privately owned pumps or diversion channels; includes river pumpers and diverters as well as town water supplies.
propertyright In this context, the right to ownership of allocated volumes of water.
rAMsArwetland A wetland listed on the register of internationally significant wetlands established by the Convention at Ramsar.
reAlM Resource Allocation Model
regulatedstreams–waterways
Streams where users are supplied by releases from storage. A water licence for a regulated stream specifies a base water entitlement defining the licence holder’s share of the resources from a stream.
rMIF River Murray Improvement Flows
riparian Of, inhabiting or situated on the bank and floodplain of a river.
rIt Renmark Irrigation Trust.
rop Resource Operation Plan
rwueI Rural Water Use Efficiency Initiative
salinity The concentration of dissolved salts in groundwater or river water usually expressed in EC units.
sleeperAllocation An allocation that does not have a history of water usage.
sy Sustainable Yield
temporarytransfer Water entitlements transferred on an annual basis.
tlM The Living Murray
unregulatedstreams Streams that are not controlled or regulated by releases from major storages.
utilisation The amount of water available for diversion that is actually diverted.
waterentitlement The legal right of a user to access a specified amount of water in a given period.
water–harvesting The diversion of water from an unregulated stream in Queensland in which the access to water is defined by a diversion rate and a starting flow in the stream; and also a volumetric limit where Resource Operations Plans have been implemented.
wrp Water Resources Planning. It is a process currently underway in Queensland to enable the acceptable level of allocatable water to be determined for a river system. This methodology will determine what part of the flow regime should be preserved for environmental flows, and what part can be made available for consumptive use.
wMrwg Water Market Reform Working Group.
wue Water Use Efficiency.
Glossary

82
Murray–Darling Basin Authority
Water audit Monitoring report 2010–11
AppendixA:Capregister3—AnnualCapAdjustmentsfortrade(gl)
system 1997–98 1998–99 1999–00 2000–01 2001–02 2002–03 2003–04
newsouthwales
Intersecting Streams1 0.0 0.0 0.0 0.0 0.0 0.0 0.0
Border Rivers 0.0 ‑1.6 ‑3.5 ‑8.5 ‑8.7 ‑13.5 ‑3.4
Gwydir 0.0 0.0 0.0 0.0 0.0 0.0 0.0
Namoi–Peel 0.0 0.0 0.0 0.0 0.0 0.0 0.0
Macquarie–Castlereagh–Bogan 0.0 0.0 0.0 0.0 0.0 0.0 0.0
Barwon–Darling–Lower Darling 5.4 13.0 9.0 21.9 7.8 0.0 0.0
Lachlan 0.0 0.0 0.0 0.0 0.0 0.0 0.0
Murrumbidgee ‑33.4 ‑38.0 ‑113.7 ‑21.4 31.5 ‑14.5 ‑34.7
Murray 30.2 6.8 105.8 ‑12.9 ‑33.3 30.8 34.9
totalnsw 2.2 -19.8 -2.4 -20.9 -2.7 2.8 -3.2
victoria
Goulburn–Broken–Loddon cap valley ‑3.1 3.3 ‑7.8 ‑0.8 0.8 ‑4.4 ‑59.7
Campaspe 0.0 0.0 0.0 0.0 0.0 0.0 0.0
Wimmera–Mallee 0.0 0.0 0.0 0.0 0.0 0.8 0.7
Murray–Kiewa–Ovens Cap valley 17.7 11.9 0.7 ‑1.6 ‑10.4 ‑17.4 34.2
totalvictoria 14.6 15.2 -7.1 -2.4 -9.7 -21.1 -24.8
southAustralia
Metro–Adelaide & Associated Country Areas
0.0 0.0 0.0 0.0 12.0 11.0 9.4
Lower Murray Swamps ‑2.6 ‑3.4 ‑4.5 ‑4.7 ‑4.1 ‑5.0 ‑22.1
Country Towns 0.0 0.0 0.0 0.0 ‑12.0 ‑11.0 ‑9.4
All Other Purposes ‑14.1 7.0 10.8 20.0 9.9 9.7 41.5
totalsouthAustralia -16.8 3.6 6.3 15.2 5.8 4.7 19.4
Queensland
Condamine–Balonne 0.0 0.0 0.0 0.0 0.0 0.0 0.0
Border Rivers–Macintyre Brook 0.0 1.6 3.5 8.5 8.7 13.5 3.5
Moonie 0.0 0.0 0.0 0.0 0.0 0.0 0.0
Nebine 0.0 0.0 0.0 0.0 0.0 0.0 0.0
Warrego 0.0 0.0 0.0 0.0 0.0 0.0 0.0
Paroo 0.0 0.0 0.0 0.0 0.0 0.0 0.0
totalQueensland 0.0 1.6 3.5 8.5 8.7 13.5 3.5
AustralianCapitalterritory 0.0 0.0 0.0 0.0 0.0 0.0 0.0
totalBasin 0.0 0.6 0.4 0.4 2.1 0.0 –5.1
1. No Cap yet has been set for these valleys.
3 The Cap Register in Appendix A–H is an extract from Cap Register 25 stored in MDBA’s document management system –TRIM under reference: E2009–0257

83Water audit Monitoring report 2010–11
Appendix A
AppendixA:Capregister—AnnualCapAdjustmentsfortrade(gl)continued.
system 2004–05 2005–06 2006–07 2007–08 2008–09 2009–10 2010–11
newsouthwales
Intersecting Streams1 0.0 0.0 0.0 0.0 0.0 0.0 0.0
Border Rivers ‑6.4 ‑11.6 ‑6.7 ‑14.8 ‑9.5 ‑8.6 ‑19.6
Gwydir 0.0 0.0 0.0 0.0 0.0 0.0 0.0
Namoi–Peel 0.0 0.0 0.0 0.0 0.0 0.0 0.0
Macquarie–Castlereagh–Bogan 0.0 0.0 0.0 0.0 0.0 0.0 0.0
Barwon–Darling–Lower Darling ‑1.1 0.0 0.0 0.0 ‑27.1 ‑68.4 37.1
Lachlan 0.0 0.0 0.0 0.0 0.0 0.0 0.0
Murrumbidgee 8.0 ‑5.9 ‑96.8 ‑139.1 ‑390.0 ‑110.8 ‑57.2
Murray ‑0.8 0.1 44.2 ‑19.9 ‑138.1 ‑70.1 ‑49.2
totalnsw -0.2 -17.4 -59.3 -173.7 -564.7 -257.8 -89.5
victoria
Goulburn–Broken–Loddon cap valley ‑76.6 19.3 ‑62.3 ‑218.1 ‑106.9 ‑100.5 ‑135.2
Campaspe 0.0 0.0 0.0 21.9 28.7 26.4 0.1
Wimmera–Mallee ‑0.4 0.0 1.3 1.1 1.6 0.0 0.0
Murray–Kiewa–Ovens Cap valley 53.8 ‑9.1 36.1 171.6 258.2 51.2 325.0
totalvictoria -23.2 10.3 -25.0 -23.5 181.5 -22.9 189.9
southAustralia
Metro–Adelaide & Associated Country Areas
8.8 16.0 0.0 0.0 0.0 0.0 0.0
Lower Murray Swamps ‑32.6 ‑35.5 ‑29.4 ‑21.4 ‑9.1 ‑30.26 ‑59.59
Country Towns ‑5.0 ‑8.0 10.7 6.1 6.1 6.6 2.3
All Other Purposes 45.3 23.0 91.3 192.1 371.8 290.9 ‑67.7
totalsouthAustralia 16.5 -4.5 72.6 176.8 368.7 267.3 -125.0
Queensland
Condamine–Balonne 0.0 0.0 0.0 0.0 0.0 0.0 0.0
Border Rivers–Macintyre Brook 6.4 11.6 6.7 14.8 9.5 8.6 19.6
Moonie 0.0 0.0 0.0 0.0 0.0 0.0 0.0
Nebine 0.0 0.0 0.0 0.0 0.0 0.0 0.0
Warrego 0.0 0.0 0.0 0.0 0.0 0.0 0.0
Paroo 0.0 0.0 0.0 0.0 0.0 0.0 0.0
totalQueensland 6.4 11.6 6.7 14.8 9.5 8.6 19.6
AustralianCapitalterritory 0.0 0.0 0.0 0.0 0.0 0.0 0.0
totalBasin -0.6 -0.1 -5.0 -5.7 -5.0 -4.9 -5.0
1. No Cap yet has been set for these valleys

84
Murray–Darling Basin Authority
Water audit Monitoring report 2010–11
AppendixB:Capregister—AnnualCaptargets(gl)AdjustedfortradeandenvironmentalAllocations
system 1997–98 1998–99 1999–00 2000–01 2001–02 2002–03 2003–04
newsouthwales
Intersecting Streams n/a n/a n/a n/a n/a n/a n/a
Border Rivers 272 223 219 237 314 150 173
Gwydir 637 303 533 347 457 468 185
Namoi–Peel 367 351 380 373 369 310 247
Macquarie–Castlereagh–Bogan 386 592 411 575 577 263 270
Barwon–Darling–Lower Darling 237 519 328 499 214 149 210
Lachlan 427 323 287 377 446 249 94
Murrumbidgee 2,557 2,551 2,018 2,716 2,672 2,091 1,812
Murray 1,820 2,075 1,819 2,006 1,891 393 1,530
totalnsw 6,703 6,937 5,996 7,130 6,939 4,072 4,520
victoria
Goulburn–Broken–Loddon cap valley 1,985 1,653 1,590 1,679 1,587 1,005 1,621
Campaspe 127 85 80 108 112 88 83
Wimmera–Mallee 152 155 113 63 79 56 63
Murray–Kiewa–Ovens Cap valley 1,853 1,721 1,594 1,758 1,833 1,904 1,635
totalvictoria 4,117 3,614 3,377 3,608 3,611 3,053 3,402
southAustralia
Metro–Adelaide & Associated Country Areas1
Lower Murray Swamps 92 91 90 89 90 89 67
Country Towns 50 50 50 50 38 39 41
All Other Purposes 412 445 450 473 457 488 495
totalsouthAustralia 554 586 590 613 585 616 603
Queensland
Condamine–Balonne n/a n/a n/a n/a n/a n/a n/a
Border Rivers–Macintyre Brook n/a n/a n/a n/a n/a n/a n/a
Moonie n/a n/a n/a n/a n/a n/a n/a
Nebine n/a n/a n/a n/a n/a n/a n/a
Warrego n/a n/a n/a n/a n/a n/a n/a
Paroo n/a n/a n/a n/a n/a n/a n/a
totalQueensland 0 0 0 0 0 0 0
AustralianCapitalterritory2 53 41 37 34 37 51 43
totalBasin 11,427 11,177 9,999 11,385 11,171 7,792 8,569
1. See appendix F.
2. ACT has yet to develop a Cap model. No model target was available for 2010–11.The past targets worked out from an Authority model has been recognised as part of the Cap agreement for the ACT.
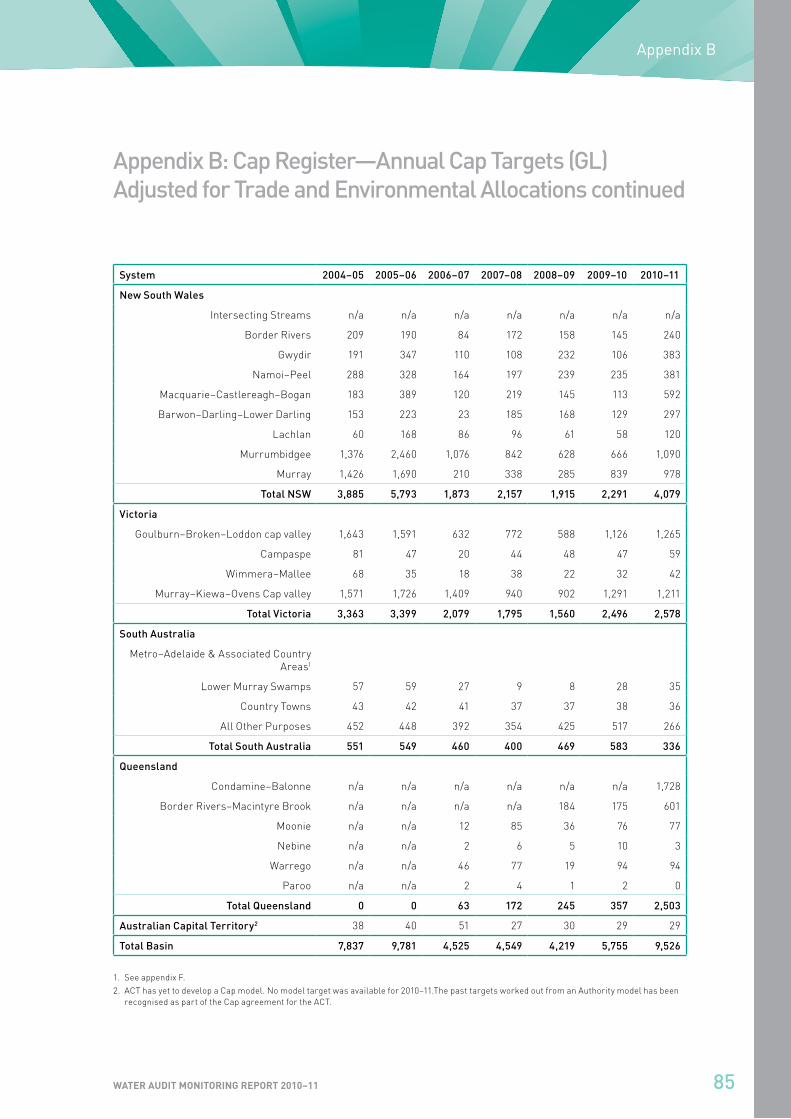
85Water audit Monitoring report 2010–11
AppendixB:Capregister—AnnualCaptargets(gl)AdjustedfortradeandenvironmentalAllocationscontinued
system 2004–05 2005–06 2006–07 2007–08 2008–09 2009–10 2010–11
newsouthwales
Intersecting Streams n/a n/a n/a n/a n/a n/a n/a
Border Rivers 209 190 84 172 158 145 240
Gwydir 191 347 110 108 232 106 383
Namoi–Peel 288 328 164 197 239 235 381
Macquarie–Castlereagh–Bogan 183 389 120 219 145 113 592
Barwon–Darling–Lower Darling 153 223 23 185 168 129 297
Lachlan 60 168 86 96 61 58 120
Murrumbidgee 1,376 2,460 1,076 842 628 666 1,090
Murray 1,426 1,690 210 338 285 839 978
totalnsw 3,885 5,793 1,873 2,157 1,915 2,291 4,079
victoria
Goulburn–Broken–Loddon cap valley 1,643 1,591 632 772 588 1,126 1,265
Campaspe 81 47 20 44 48 47 59
Wimmera–Mallee 68 35 18 38 22 32 42
Murray–Kiewa–Ovens Cap valley 1,571 1,726 1,409 940 902 1,291 1,211
totalvictoria 3,363 3,399 2,079 1,795 1,560 2,496 2,578
southAustralia
Metro–Adelaide & Associated Country Areas1
Lower Murray Swamps 57 59 27 9 8 28 35
Country Towns 43 42 41 37 37 38 36
All Other Purposes 452 448 392 354 425 517 266
totalsouthAustralia 551 549 460 400 469 583 336
Queensland
Condamine–Balonne n/a n/a n/a n/a n/a n/a 1,728
Border Rivers–Macintyre Brook n/a n/a n/a n/a 184 175 601
Moonie n/a n/a 12 85 36 76 77
Nebine n/a n/a 2 6 5 10 3
Warrego n/a n/a 46 77 19 94 94
Paroo n/a n/a 2 4 1 2 0
totalQueensland 0 0 63 172 245 357 2,503
AustralianCapitalterritory2 38 40 51 27 30 29 29
totalBasin 7,837 9,781 4,525 4,549 4,219 5,755 9,526
1. See appendix F.
2. ACT has yet to develop a Cap model. No model target was available for 2010–11.The past targets worked out from an Authority model has been recognised as part of the Cap agreement for the ACT.
Appendix B

86
Murray–Darling Basin Authority
Water audit Monitoring report 2010–11
AppendixC:Capregister—Annualdiversions(gl)
system 1997–98 1998–99 1999–00 2000–01 2001–02 2002–03 2003–04
newsouthwales
Intersecting Streams 3 3 3 3 3 3 3
Border Rivers 211 192 206 257 208 147 129
Gwydir 566 340 481 458 496 272 203
Namoi–Peel 340 357 385 390 398 329 208
Macquarie–Castlereagh–Bogan 442 396 437 522 597 411 219
Barwon–Darling–Lower Darling 266 428 260 487 202 127 293
Lachlan 429 293 301 423 457 253 59
Murrumbidgee 2,585 2,505 1,875 2,747 2,348 1,793 1,775
Murray 1,890 2,000 1,234 2,070 2,113 879 1,312
totalnsw 6,733 6,513 5,183 7,356 6,823 4,213 4,200
victoria
Goulburn–Broken–Loddon cap valley 1,909 1,699 1,553 1,569 1,700 1,076 1,596
Campaspe 105 83 80 112 129 85 80
Wimmera–Mallee 184 159 103 68 84 60 66
Murray–Kiewa–Ovens Cap valley 1,743 1,804 1,555 1,712 1,916 1,755 1,478
totalvictoria 3,941 3,745 3,292 3,461 3,829 2,976 3,219
southAustralia
Metro–Adelaide & Associated Country Areas
153 153 139 104 82 165 82
Lower Murray Swamps 92 91 90 89 90 89 67
Country Towns 35 36 37 38 36 39 35
All Other Purposes 384 409 377 431 413 443 423
totalsouthAustralia 664 689 642 662 621 736 607
Queensland
Condamine–Balonne 545 467 366 360 162 123 575
Border Rivers–Macintyre Brook 186 123 163 288 163 78 204
Moonie 8 8 8 31 6 6 26
Nebine 0 0 0 0 0 0 0
Warrego 2 10 3 9 10 7 11
Paroo 0 0 0 0 0 0 0
totalQueensland 741 609 541 688 341 214 815
AustralianCapitalterritory 44 23 27 34 36 40 28
totalBasin 12,123 11,580 9,684 12,201 11,650 8,180 8,870

87Water audit Monitoring report 2010–11
AppendixC:Capregister—Annualdiversions(gl)continued
system 2004–05 2005–06 2006–07 2007–08 2008–09 2009–10 2010–11
newsouthwales
Intersecting Streams 3 3 3 3 3 3 3
Border Rivers 134 162 155 141 146 131 192
Gwydir 199 264 173 123 187 91 271
Namoi–Peel 225 269 201 177 223 205 270
Macquarie–Castlereagh–Bogan 102 224 252 75 106 112 183
Barwon–Darling–Lower Darling 186 199 17 221 159 150 123
Lachlan 36 128 66 46 40 26 90
Murrumbidgee 1,618 2,200 960 515 602 910 1,461
Murray 1,241 1,667 602 244 341 439 689
totalnsw 3,744 5,116 2,430 1,544 1,807 2,067 3,283
victoria
Goulburn–Broken–Loddon cap valley 1,553 1,592 651 684 628 804 544
Campaspe 41 21 14 24 27 26 18
Wimmera–Mallee 50 60 19 45 11 9 10
Murray–Kiewa–Ovens Cap valley 1,493 1,578 1,406 801 837 971 563
totalvictoria 3,137 3,252 2,090 1,553 1,504 1,810 1,136
southAustralia
Metro–Adelaide & Associated Country Areas
72 74 203 89 150 57 56
Lower Murray Swamps 57 59 27 15 10 14 14
Country Towns 39 40 41 37 37 38 34
All Other Purposes 453 417 355 282 288 371 257
totalsouthAustralia 620 590 626 423 485 480 361
Queensland
Condamine–Balonne 167 186 57 776 190 1,049 1,064
Border Rivers–Macintyre Brook 192 125 71 210 157 122 421
Moonie 23 2 9 41 29 43 29
Nebine 0 0 0 0 0 1 0
Warrego 11 3 21 23 6 15 11
Paroo 0 0 2 4 1 2 0
totalQueensland 392 316 160 1,054 383 1,232 1,525
AustralianCapitalterritory 27 32 25 16 19 17 6
totalBasin 7,921 9,306 5,331 4,590 4,197 5,606 6,311
Appendix C

88
Murray–Darling Basin Authority
Water audit Monitoring report 2010–11
Appendixd:Capregister—AnnualCapCredits(gl)
system
longterm
Capscheduleetrigger 1997–98 1998–99 1999–00 2000–01 2001–02 2002–03 2003–04
newsouthwales
Intersecting Streams n/a n/a n/a n/a n/a n/a n/a n/a n/a
Border Rivers 221 ‑44 61 31 13 ‑20 106 3 44
Gwydir 350 ‑70 71 ‑37 52 ‑111 ‑39 197 ‑18
Namoi–Peel 364 ‑73 27 ‑7 ‑5 ‑16 ‑30 ‑19 39
Macquarie–Castlereagh–Bogan
492 ‑98 ‑57 196 ‑26 53 ‑20 ‑148 51
Barwon–Darling–Lower Darling
331 ‑66 ‑29 92 68 12 11 22 ‑83
Lachlan 335 ‑67 ‑2 30 ‑14 ‑47 ‑11 ‑4 36
Murrumbidgee 2,358 ‑472 ‑28 45 143 ‑32 324 298 36
Murray 1,908 ‑382 ‑69 76 586 ‑64 ‑223 ‑486 219
totalnsw 6,359 -1,272 -26 427 816 -223 119 -138 324
victoria
Goulburn–Broken–Loddon cap valley
2,034 ‑407 76 ‑46 36 110 ‑114 ‑71 26
Campaspe 122 ‑24 23 1 0 ‑4 ‑17 3 3
Wimmera–Mallee 159 ‑32 ‑32 ‑4 10 ‑5 ‑5 ‑4 ‑3
Murray–Kiewa–Ovens Cap valley
1,702 ‑340 110 ‑83 39 46 ‑83 150 157
totalvictoria 4,017 -803 176 -131 85 147 -218 77 183
southAustralia
Metro–Adelaide & Associated Country Areas1
128 84 74 109 31 31 111
Lower Murray Swamps 94 ‑19 0 0 0 0 0 0 0
Country Towns 50 ‑10 15 14 13 12 3 0 5
All Other Purposes 450 ‑90 28 36 73 43 44 45 72
totalsouthAustralia 594 -119 171 134 161 164 78 75 188
Queensland
Condamine–Balonne 729 ‑146 n/a n/a n/a n/a n/a n/a n/a
Border Rivers–Macintyre Brook
245 ‑49 n/a n/a n/a n/a n/a n/a n/a
Moonie 33 ‑7 n/a n/a n/a n/a n/a n/a n/a
Nebine 3 ‑1 n/a n/a n/a n/a n/a n/a n/a
Warrego 39 ‑8 n/a n/a n/a n/a n/a n/a n/a
Paroo 0 0 n/a n/a n/a n/a n/a n/a n/a
totalQueensland 1,049 -210 0 0 0 0 0 0 0
AustralianCapitalterritory2
40 ‑8 8 17 10 0 0 10 16
totalBasin 12,060 -2,412 329 447 1,072 88 -21 25 711
1. Metro Adelaide has a five–year rolling Cap of 650 GL and does not accumulate Cap credit.
2. ACT has yet to develop a Cap model. No model target (hence any cap credit) was available for 2010–11.The past credits worked out from an Authority model has been recognised as part of the Cap agreement for the ACT.

89Water audit Monitoring report 2010–11
Appendixd:Capregister—AnnualCapCredits(gl)continued
system
longterm
Capschedulee
trigger 2004–05 2005–06 2006–07 2007–08 2008–09 2009–10 2010–11
newsouthwales
Intersecting Streams n/a n/a n/a n/a n/a n/a n/a n/a n/a
Border Rivers 221 ‑44 75 28 ‑71 31 12 14 48
Gwydir 350 ‑70 ‑7 83 ‑64 ‑15 44 15 111
Namoi–Peel 364 ‑73 63 59 ‑36 20 16 30 111
Macquarie–Castlereagh–Bogan
492 ‑98 80 165 ‑132 144 39 1 409
Barwon–Darling–Lower Darling
331 ‑66 ‑33 24 6 ‑35 9 ‑21 173
Lachlan 335 ‑67 23 40 20 50 21 32 29
Murrumbidgee 2,358 ‑472 ‑242 259 116 327 26 ‑244 ‑372
Murray 1,908 ‑382 185 23 ‑392 94 ‑56 400 289
totalnsw 6,359 -1,272 144 681 -554 616 111 227 799
victoria
Goulburn–Broken–Loddon cap valley
2,034 ‑407 90 ‑2 ‑20 88 ‑40 322 721
Campaspe 122 ‑24 40 26 6 21 21 21 41
Wimmera–Mallee 159 ‑32 19 ‑25 ‑1 ‑7 11 23 33
Murray–Kiewa–Ovens Cap valley
1,702 ‑340 78 148 3 139 65 320 648
totalvictoria 4,017 -803 227 147 -11 241 56 686 1,443
southAustralia
Metro–Adelaide & Associated Country Areas
187 232 100 164 87 93 95
Lower Murray Swamps 94 ‑19 0 0 0 ‑6 ‑2 14 21
Country Towns 50 ‑10 4 2 0 0 0 0 1
All Other Purposes 450 ‑90 ‑1 31 37 72 136 146 9
totalsouthAustralia 594 -119 189 265 136 231 221 253 126
Queensland
Condamine–Balonne 729 ‑146 n/a n/a n/a n/a n/a n/a 665
Border Rivers–Macintyre Brook
245 ‑49 n/a n/a n/a n/a 27 53 180
Moonie 33 ‑7 n/a n/a 3 43 7 33 48
Nebine 3 ‑1 n/a n/a 2 6 5 9 3
Warrego 39 ‑8 n/a n/a 25 54 13 79 82
Paroo 0 0 n/a n/a 0.15 0.08 0 0 0
totalQueensland 1,049 -210 0 0 31 103 52 174 978
AustralianCapitalterritory 40 ‑8 10 8 26 11 11 12 23
totalBasin 12,060 -2,412 570 1,101 -372 1,202 452 1,352 3,369
1. Metro Adelaide has a five–year rolling Cap of 650 GL and does not accumulate Cap credit.
2. ACT has yet to develop a Cap model. No model target (hence any cap credit) was available for 2010–11.The past credits worked out from an Authority model has been recognised as part of the Cap agreement for the ACT.
Appendix D

90
Murray–Darling Basin Authority
Water audit Monitoring report 2010–11
Appendixe:Capregister—CumulativeCapCredits(gl)
system
longterm
Capscheduleetrigger 1997–98 1998–99 1999–00 2000–01 2001–02 2002–03 2003–04
newsouthwales
Intersecting Streams n/a n/a n/a n/a n/a n/a n/a n/a n/a
Border Rivers 221 ‑44 61 93 105 86 192 195 239
Gwydir 350 ‑70 71 34 86 ‑25 ‑63 133 115
Namoi–Peel 364 ‑73 27 20 15 ‑1 ‑31 ‑50 ‑11
Macquarie–Castlereagh–Bogan
492 ‑98 ‑57 139 113 167 147 ‑2 49
Barwon–Darling–Lower Darling
331 ‑66 ‑29 63 130 142 154 176 93
Lachlan 335 ‑67 ‑2 28 15 ‑32 ‑43 ‑47 ‑11
Murrumbidgee 2,358 ‑472 ‑28 17 160 128 452 750 787
Murray 1,908 ‑382 ‑69 6 592 528 306 ‑180 38
totalnsw 6,359 -1,272 -26 401 1,217 993 1,113 975 1,299
victoria
Goulburn–Broken–Loddon cap valley
2,034 ‑407 76 30 66 176 63 ‑8 18
Campaspe 122 ‑24 23 24 24 20 3 6 9
Wimmera–Mallee 159 ‑32 ‑32 ‑36 ‑27 ‑32 ‑37 ‑41 ‑44
Murray–Kiewa–Ovens Cap valley
1,702 ‑340 110 27 66 113 30 179 336
totalvictoria 4,017 -803 176 45 130 277 59 136 319
southAustralia
Metro–Adelaide & Associated Country Areas
128 84 74 109 31 31 111
Lower Murray Swamps 94 ‑19 0 0 0 0 0 0 0.0
Country Towns 50 ‑10 15 28 42 54 56 56 61
All Other Purposes 450 ‑90 28 64 137 180 224 269 341
totalsouthAustralia 594 -119 171 176 253 343 312 356 513
Queensland
Condamine–Balonne 729 ‑146 n/a n/a n/a n/a n/a n/a n/a
Border Rivers–Macintyre Brook
245 ‑49 n/a n/a n/a n/a n/a n/a n/a
Moonie 33 ‑7 n/a n/a n/a n/a n/a n/a n/a
Nebine 3 ‑1 n/a n/a n/a n/a n/a n/a n/a
Warrego 39 ‑8 n/a n/a n/a n/a n/a n/a n/a
Paroo 0 0 n/a n/a n/a n/a n/a n/a n/a
totalQueensland 1,049 -210 0 0 0 0 0 0 0.0
AustralianCapitalterritory 40 ‑8 8 26 36 36 37 47 63
totalBasin 12,060 -2,412 329 648 1,635 1,649 1,520 1,514 2,194
1. Metro Adelaide has a five–year rolling Cap of 650 GL and does not accumulate Cap credit.
2. Caps for Moonie Warrego, Paroo and Nebine are annual and do not accumulate Cap credit
3. ACT has yet to develop a Cap model. No model target (hence any cap credit) was available for 2010–11.The past cumulative credits worked out from an Authority model has been recognised as part of the Cap agreement for the ACT.
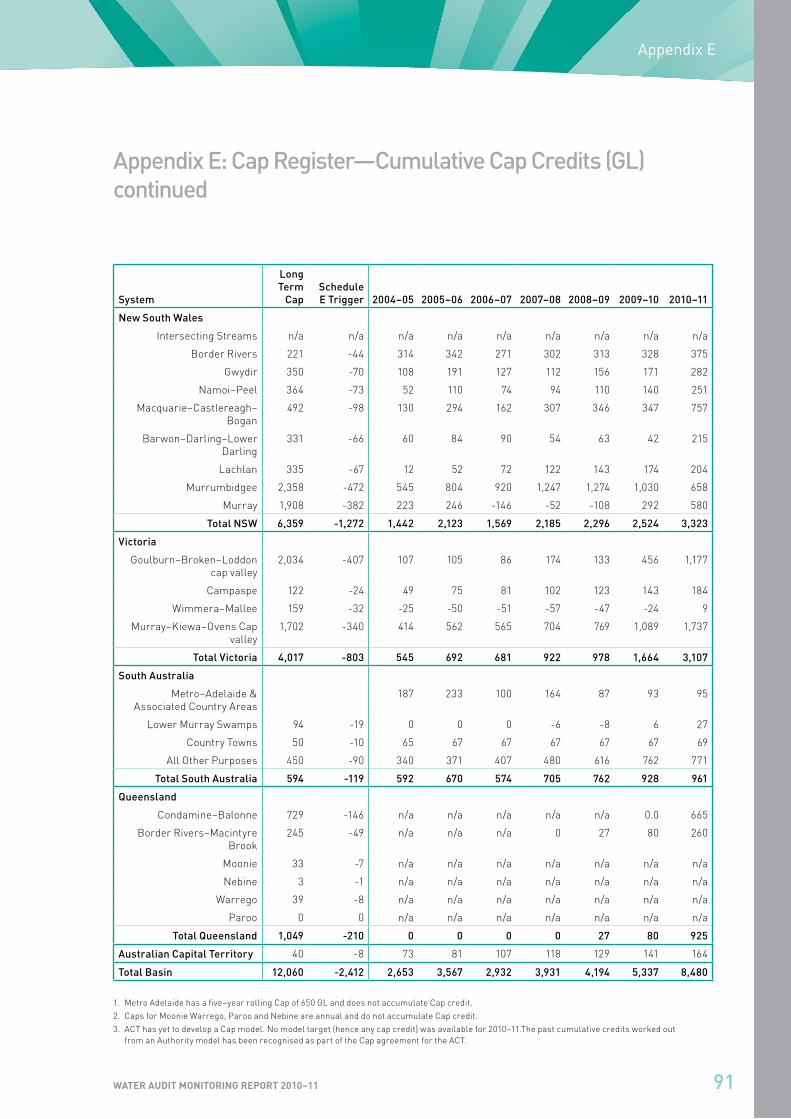
91Water audit Monitoring report 2010–11
Appendixe:Capregister—CumulativeCapCredits(gl)continued
system
longterm
Capscheduleetrigger 2004–05 2005–06 2006–07 2007–08 2008–09 2009–10 2010–11
newsouthwales
Intersecting Streams n/a n/a n/a n/a n/a n/a n/a n/a n/a
Border Rivers 221 ‑44 314 342 271 302 313 328 375
Gwydir 350 ‑70 108 191 127 112 156 171 282
Namoi–Peel 364 ‑73 52 110 74 94 110 140 251
Macquarie–Castlereagh–Bogan
492 ‑98 130 294 162 307 346 347 757
Barwon–Darling–Lower Darling
331 ‑66 60 84 90 54 63 42 215
Lachlan 335 ‑67 12 52 72 122 143 174 204
Murrumbidgee 2,358 ‑472 545 804 920 1,247 1,274 1,030 658
Murray 1,908 ‑382 223 246 ‑146 ‑52 ‑108 292 580
totalnsw 6,359 -1,272 1,442 2,123 1,569 2,185 2,296 2,524 3,323
victoria
Goulburn–Broken–Loddon cap valley
2,034 ‑407 107 105 86 174 133 456 1,177
Campaspe 122 ‑24 49 75 81 102 123 143 184
Wimmera–Mallee 159 ‑32 ‑25 ‑50 ‑51 ‑57 ‑47 ‑24 9
Murray–Kiewa–Ovens Cap valley
1,702 ‑340 414 562 565 704 769 1,089 1,737
totalvictoria 4,017 -803 545 692 681 922 978 1,664 3,107
southAustralia
Metro–Adelaide & Associated Country Areas
187 233 100 164 87 93 95
Lower Murray Swamps 94 ‑19 0 0 0 ‑6 ‑8 6 27
Country Towns 50 ‑10 65 67 67 67 67 67 69
All Other Purposes 450 ‑90 340 371 407 480 616 762 771
totalsouthAustralia 594 -119 592 670 574 705 762 928 961
Queensland
Condamine–Balonne 729 ‑146 n/a n/a n/a n/a n/a 0.0 665
Border Rivers–Macintyre Brook
245 ‑49 n/a n/a n/a 0 27 80 260
Moonie 33 ‑7 n/a n/a n/a n/a n/a n/a n/a
Nebine 3 ‑1 n/a n/a n/a n/a n/a n/a n/a
Warrego 39 ‑8 n/a n/a n/a n/a n/a n/a n/a
Paroo 0 0 n/a n/a n/a n/a n/a n/a n/a
totalQueensland 1,049 -210 0 0 0 0 27 80 925
AustralianCapitalterritory 40 ‑8 73 81 107 118 129 141 164
totalBasin 12,060 -2,412 2,653 3,567 2,932 3,931 4,194 5,337 8,480
1. Metro Adelaide has a five–year rolling Cap of 650 GL and does not accumulate Cap credit.
2. Caps for Moonie Warrego, Paroo and Nebine are annual and do not accumulate Cap credit.
3. ACT has yet to develop a Cap model. No model target (hence any cap credit) was available for 2010–11.The past cumulative credits worked out from an Authority model has been recognised as part of the Cap agreement for the ACT.
Appendix E
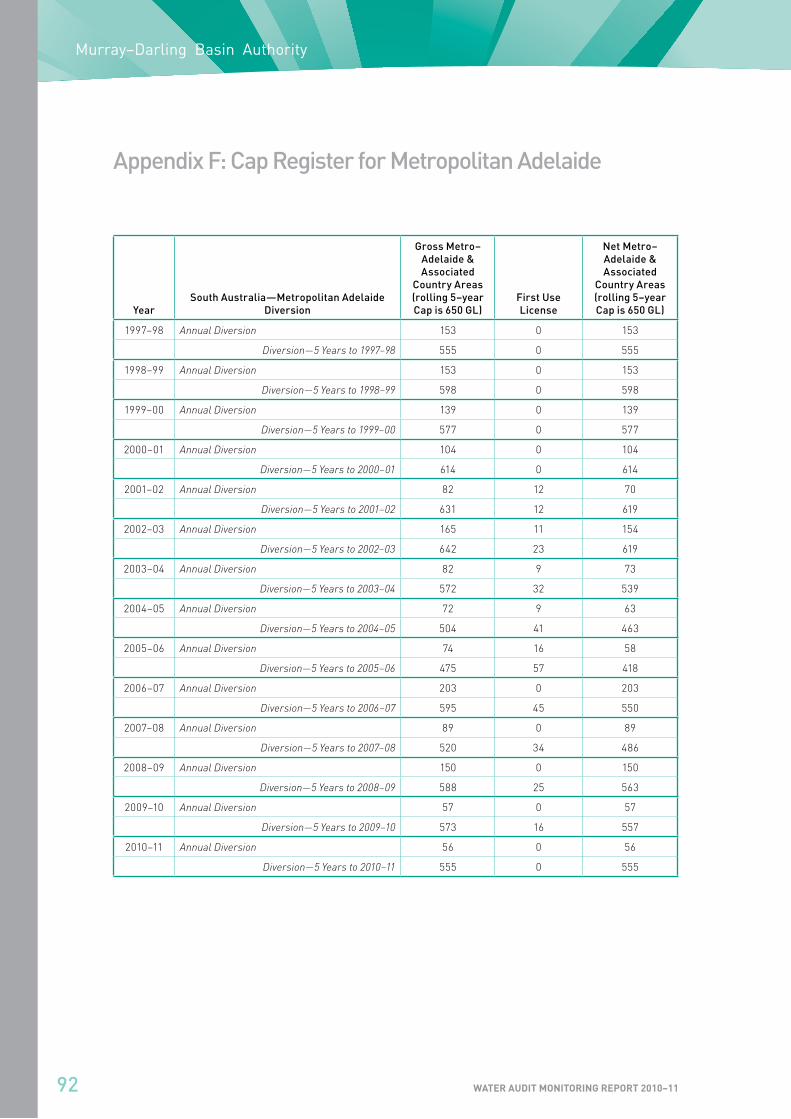
92
Murray–Darling Basin Authority
Water audit Monitoring report 2010–11
AppendixF:CapregisterforMetropolitanAdelaide
yearsouthAustralia—MetropolitanAdelaide
diversion
grossMetro–Adelaide&Associated
CountryAreas(rolling5–yearCapis650gl)
Firstuselicense
netMetro–Adelaide&Associated
CountryAreas(rolling5–yearCapis650gl)
1997–98 Annual Diversion 153 0 153
Diversion—5 Years to 1997–98 555 0 555
1998–99 Annual Diversion 153 0 153
Diversion—5 Years to 1998–99 598 0 598
1999–00 Annual Diversion 139 0 139
Diversion—5 Years to 1999–00 577 0 577
2000–01 Annual Diversion 104 0 104
Diversion—5 Years to 2000–01 614 0 614
2001–02 Annual Diversion 82 12 70
Diversion—5 Years to 2001–02 631 12 619
2002–03 Annual Diversion 165 11 154
Diversion—5 Years to 2002–03 642 23 619
2003–04 Annual Diversion 82 9 73
Diversion—5 Years to 2003–04 572 32 539
2004–05 Annual Diversion 72 9 63
Diversion—5 Years to 2004–05 504 41 463
2005–06 Annual Diversion 74 16 58
Diversion—5 Years to 2005–06 475 57 418
2006–07 Annual Diversion 203 0 203
Diversion—5 Years to 2006–07 595 45 550
2007–08 Annual Diversion 89 0 89
Diversion—5 Years to 2007–08 520 34 486
2008–09 Annual Diversion 150 0 150
Diversion—5 Years to 2008–09 588 25 563
2009–10 Annual Diversion 57 0 57
Diversion—5 Years to 2009–10 573 16 557
2010–11 Annual Diversion 56 0 56
Diversion—5 Years to 2010–11 555 0 555
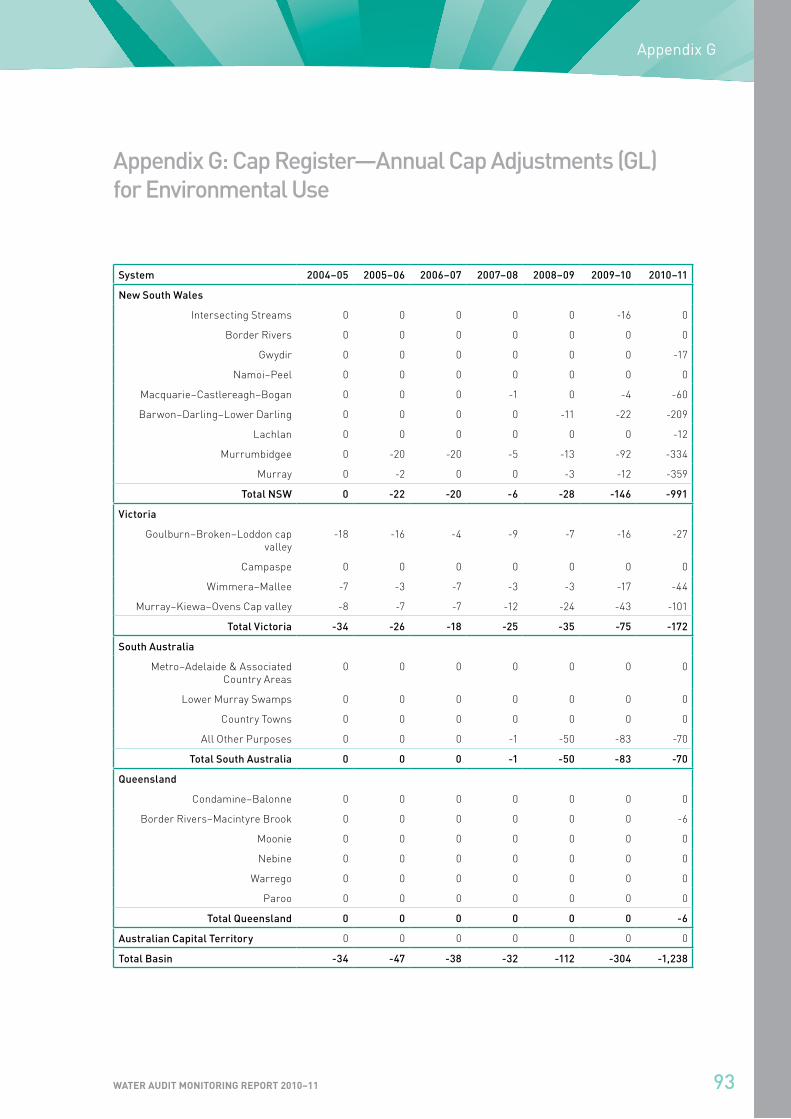
93Water audit Monitoring report 2010–11
Appendixg:Capregister—AnnualCapAdjustments(gl)forenvironmentaluse
system 2004–05 2005–06 2006–07 2007–08 2008–09 2009–10 2010–11
newsouthwales
Intersecting Streams 0 0 0 0 0 ‑16 0
Border Rivers 0 0 0 0 0 0 0
Gwydir 0 0 0 0 0 0 ‑17
Namoi–Peel 0 0 0 0 0 0 0
Macquarie–Castlereagh–Bogan 0 0 0 ‑1 0 ‑4 ‑60
Barwon–Darling–Lower Darling 0 0 0 0 ‑11 ‑22 ‑209
Lachlan 0 0 0 0 0 0 ‑12
Murrumbidgee 0 ‑20 ‑20 ‑5 ‑13 ‑92 ‑334
Murray 0 ‑2 0 0 ‑3 ‑12 ‑359
totalnsw 0 -22 -20 -6 -28 -146 -991
victoria
Goulburn–Broken–Loddon cap valley
‑18 ‑16 ‑4 ‑9 ‑7 ‑16 ‑27
Campaspe 0 0 0 0 0 0 0
Wimmera–Mallee ‑7 ‑3 ‑7 ‑3 ‑3 ‑17 ‑44
Murray–Kiewa–Ovens Cap valley ‑8 ‑7 ‑7 ‑12 ‑24 ‑43 ‑101
totalvictoria -34 -26 -18 -25 -35 -75 -172
southAustralia
Metro–Adelaide & Associated Country Areas
0 0 0 0 0 0 0
Lower Murray Swamps 0 0 0 0 0 0 0
Country Towns 0 0 0 0 0 0 0
All Other Purposes 0 0 0 ‑1 ‑50 ‑83 ‑70
totalsouthAustralia 0 0 0 -1 -50 -83 -70
Queensland
Condamine–Balonne 0 0 0 0 0 0 0
Border Rivers–Macintyre Brook 0 0 0 0 0 0 ‑6
Moonie 0 0 0 0 0 0 0
Nebine 0 0 0 0 0 0 0
Warrego 0 0 0 0 0 0 0
Paroo 0 0 0 0 0 0 0
totalQueensland 0 0 0 0 0 0 -6
AustralianCapitalterritory 0 0 0 0 0 0 0
totalBasin -34 -47 -38 -32 -112 -304 -1,238
Appendix G

94
Murray–Darling Basin Authority
Water audit Monitoring report 2010–11
Appendixh:Capregister—differenceinCumulativeCapCreditsbetweenCapregister2009–10andCapregister2010–11(gl)
system
CumulativeCapCreditupto
year2009–10inwAMreport
2009–10
CumulativeCapCreditupto
year2009–10inwAMreport
2010–11
differ-enceinCumu-
lativeCap
Credit
differencedueto
ModelCap
targets
CapAdjust-
mentfortrade
CapAdjust-
mentforenviron-
mentdiver-sions
newsouthwales
Intersecting Streams n/a n/a n/a 0 0 0 0
Border Rivers n/a 327 n/a 2,144 0 0 128
Gwydir 170 171 1 439 0 0 438
Namoi–Peel 222 140 ‑82 372 0 0 454
Macquarie–Castlereagh–Bogan
336 347 11 14 0 0 3
Barwon–Darling–Lower Darling
‑4 42 46 46 0 0 0
Lachlan 163 174 11 5 0 0 ‑7
Murrumbidgee 1,170 1,030 ‑141 ‑140 0 ‑1 0
Murray 662 292 ‑370 ‑370 0 0 0
totalnsw 2,719 2,524 -523 366 0 -1 889
victoria
Goulburn–Broken–Loddon cap valley
446 456 10 10 0 0 0
Campaspe 146 143 ‑3 42 0 0 44
Wimmera–Mallee 157 ‑24 ‑181 ‑10 0 ‑171 0
Murray–Kiewa–Ovens Cap valley
1,075 1,089 14 14 0 0 0
totalvictoria 1,824 1,664 -160 56 0 -171 44
southAustralia
Metro–Adelaide & Associated Country Areas
93 93 0 0 0 0 0
Lower Murray Swamps 6 6 0 0 0 0 0
Country Towns 67 67 0 0 0 0 0
All Other Purposes 762 762 0 0 0 0 0
totalsouthAustralia 928 928 0 0 0 0 0
Queensland
Condamine–Balonne n/a 0 n/a 0 0 0 0
Border Rivers– Macintyre Brook
80 80 0 0 0 0 0
Moonie n/a n/a n/a 0 0 0 0
Nebine n/a n/a n/a 0 0 0 0
Warrego n/a n/a n/a 0 0 0 0
Paroo n/a n/a n/a 0 0 0 0
totalQueensland 80 80 0 0 0 0 0
AustralianCapitalterritory 141 141 0 0 0 0 0
totalBasin 5,692 5,337 -683 422 0 -173 933

Water Audit M
onitoring Report 2010–11