Embed Size (px)
Citation preview

University of Nebraska - Lincoln University of Nebraska - Lincoln
DigitalCommons@University of Nebraska - Lincoln DigitalCommons@University of Nebraska - Lincoln
Community and Regional Planning Program: Student Projects and Theses Community and Regional Planning Program
Fall 12-2-2011
Water Borne Diseases: A Cry of a Trapped Community Water Borne Diseases: A Cry of a Trapped Community
Passmore Mudundulu University of Nebraska-Lincoln, [email protected]
Follow this and additional works at: https://digitalcommons.unl.edu/arch_crp_theses
Part of the Urban, Community and Regional Planning Commons
Mudundulu, Passmore, "Water Borne Diseases: A Cry of a Trapped Community" (2011). Community and Regional Planning Program: Student Projects and Theses. 9. https://digitalcommons.unl.edu/arch_crp_theses/9
This Article is brought to you for free and open access by the Community and Regional Planning Program at DigitalCommons@University of Nebraska - Lincoln. It has been accepted for inclusion in Community and Regional Planning Program: Student Projects and Theses by an authorized administrator of DigitalCommons@University of Nebraska - Lincoln.

WATER BORNE DISEASES: A CRY OF A TRAPPED COMMUNITY
By
Passmore Mudundulu
A THESIS
Presented to the Faculty of
The Graduate College at the University of Nebraska
In Partial Fulfillment of Requirements
For the Degree of Master of Community and Regional Planning
Major: Community and Regional Planning
Under the Supervision of Professor Robert Kuzelka
Lincoln, Nebraska
December 2011

ii
WATERBORNE DISEASES: A CRY OF A TRAPPED COMMUNITY
Passmore Mudundulu, M.C.R.P.
University of Nebraska, 2011
Advisor: Robert Kuzelka
The purpose of this study was to understand the problem of attaining safe and clean water
that has contributed to high incidence of water borne diseases and to investigate its
effects on the residents of Chawama Township, Lusaka, Zambia. A survey was used to
collect data from 400 male and female participants to determine their source, treatment
and storage of water; sanitary facilities; attitude, experience and knowledge of
waterborne diseases. Findings indicated that, the most common source of water was
communal city taps and residents did not boil or add chlorine to make it safe for use,
making it susceptible for them to contract waterborne diseases. Pit latrines were the
common type of toilet facility residents used. Almost all of the participants had a wide
knowledge of waterborne diseases particularly cholera and diarrhea. An understanding of
the link between unsafe water and waterborne diseases can be useful to the decision
makers for planning, management and evaluation of water supply policies.

i
ACKNOWLEDGEMENTS
I would like to start by saying thank you to everyone who stood by me in the
development process of this ―Waterborne Diseases: A Cry of a Trapped Community‖
project. I thank Professor Robert Kuzelka of the University of Nebraska-Lincoln and
some friends. Professor Kulzelka provided candid and useful advice; motivated me; was
a helping hand every step of the way; and allowed and presented me with the opportunity
to work with him through this thesis project. I also wish to thank Professors Tang, and
Nam who served on the thesis committee as regular members and advisors.
I thank Chito Mudundulu, my son who was always with me in the planning and
writing of this thesis. I thank him also for not crying for attention during my busy hours
of this project and several times going with me for the project meetings with my
supervisor.
A final special thank you goes out to the UNL‘s IRB for facilitating the formative
stages of this thesis project; and the Lusaka Water and Sewerage Company for allowing
the survey to be undertaken in Chawama Township. I thank George Siamuzoka and the
entire staff who administered the survey.

ii
1 Table of Contents 1. CHAPTER ONE - INTRODUCTION ..................................................................................... 1
1.1 Water Related Health Issues ............................................................................................ 1
1.2 Background of Zambia .................................................................................................... 3
1.2.1 Geography ................................................................................................................ 3
1.2.2 Population ................................................................................................................ 6
1.2.3 Economy .................................................................................................................. 6
1.3 Statement of the Problem ................................................................................................. 7
1.4 Significance of the Study ................................................................................................. 9
1.5 Research Questions ........................................................................................................ 10
1.6 Objectives ...................................................................................................................... 10
1.7 Definitions...................................................................................................................... 10
2 CHAPTER TWO - REVIEW OF LITERATURE ................................................................. 12
2.1 Introduction .................................................................................................................... 12
2.2 Development of water resource ..................................................................................... 12
2.3 Access to safe water ....................................................................................................... 13
2.4 Morbidity and Mortality Waterborne Diseases .............................................................. 14
2.5 Summary ........................................................................................................................ 17
3 CHAPTER THREE - WATER RESOURCES IN ZAMBIA ................................................ 18
3.1 Introduction .................................................................................................................... 18
3.2 Water Use in Zambia ..................................................................................................... 18
3.3 Health Concerns/Impacts ............................................................................................... 19
3.4 Hydrology ...................................................................................................................... 20
3.4.1 Surface water Drainage .......................................................................................... 21
3.4.2 Groundwater .......................................................................................................... 23
3.5 Water Supply in Zambia ................................................................................................ 24
3.6 Level of Access to Safe and Clean Water ...................................................................... 25
3.7 National Water Regulations ........................................................................................... 25
3.8 Summary ........................................................................................................................ 28
4 CHAPTER FOUR - RESEARCH DESIGN AND APPLICATION OF THE SURVEY ..... 30
4.1 Introduction .................................................................................................................... 30
4.2 Theoretical Approach ..................................................................................................... 30

iii
4.3 Research Design............................................................................................................. 31
4.4 Methodology .................................................................................................................. 32
4.5 Study Design .................................................................................................................. 32
4.6 Study Site ....................................................................................................................... 32
4.7 Lusaka Overview ........................................................................................................... 33
4.7.1 Lusaka Groundwater .............................................................................................. 34
4.7.2 Lusaka Water Demand ........................................................................................... 35
4.7.3 Chawama Township ............................................................................................... 35
4.7.4 Excretal Disposal ................................................................................................... 38
4.8 Study Population ............................................................................................................ 39
4.8.1 Research Study Protocol ........................................................................................ 40
4.8.2 Informed Consent Procedures ................................................................................ 40
4.8.3 Risks and/or Discomforts ....................................................................................... 40
4.8.4 Confidentiality ....................................................................................................... 41
4.8.5 Freedom to Withdraw ............................................................................................ 41
4.8.6 Questionnaire ......................................................................................................... 42
4.9 Study Phase 1 ................................................................................................................. 42
4.10 Study Phase 2 ................................................................................................................. 44
4.10.1 Research Sample .................................................................................................... 44
4.10.2 Method of Sampling Design .................................................................................. 44
4.10.3 Recruitment Procedures and Benefits .................................................................... 44
4.10.4 Administration of the Questionnaire ...................................................................... 45
4.10.5 Interviewer Training .............................................................................................. 46
4.10.6 Variables in the Study ............................................................................................ 46
4.10.7 Data Processing and Analysis ................................................................................ 47
4.11 Summary ........................................................................................................................ 48
5 CHAPTER FIVE - SURVEY RESULTS .............................................................................. 49
5.1 Introduction .................................................................................................................... 49
5.2 Demographic Characteristics ......................................................................................... 49
5.2.1 Age and Gender of participants (Questions 15 and 16, Section C)........................ 49
5.2.2 Participants Levels of Education (Question 18, Section C) ................................... 50
5.2.3 Participants Marital Status (Question 17, Section C)............................................. 51

iv
5.2.4 Participants Water Source and Preventive Measures ........................................... 53
5.2.5 Water Treatment and Storage before Use ............................................................ 54
5.2.6 Source of water and Chlorine use .......................................................................... 55
5.2.7 Source of Water and Storage ................................................................................. 56
5.3 Participants Type of Toilet Facilities and Sharing with Neighbors ................................. 57
5.3.1 Sharing of Toilet Facilities ..................................................................................... 58
5.4 Participants Knowledge of Waterborne Diseases .......................................................... 58
5.4.1 Participants‘ Experience with Waterborne diseases .............................................. 59
5.4.2 Knowledge of experience of household or neighbors who died of the diseases .... 60
5.5 Participant knowledge of cholera by Level of Education .............................................. 61
5.6 Knowledge of Typhoid Fever by Level of Education .................................................... 61
6 CHAPTER SIX - DISCUSSION AND RECOMMENDATIONS ........................................ 63
6.1 Discussion ...................................................................................................................... 63
6.2 Recommendations .......................................................................................................... 65
6.3 Limitation and Value of the Research Study ................................................................. 66
6.3.1 Limitation of the Study .......................................................................................... 66
6.3.2 Value of the Research Study .................................................................................. 67
6.4 Future of Research ......................................................................................................... 68
7 References .............................................................................................................................. 69
8 APPENDEX A - Questionnaire ............................................................................................. 74
9 APPENDIX B - Zambia Demographic and Health Survey ................................................... 79
10 APPENDIX C - UNL IRB Protocol Letter ........................................................................... 83
11 APPENDIX D - Lusaka Water and Sewerage Company Letter ............................................ 84

v
Figures and Tables
Figure Page
Figure 1-1 Child deaths due to diarrhea .......................................................................................... 2
Figure 1-2 Location map of Zambia ................................................................................................. 4
Figure 1-3 Provincial Map of Zambia ............................................................................................... 5
Figure 3-1 Water Usage in Zambia ................................................................................................. 19
Figure 3-2 Zambia's River Drainage System ................................................................................... 23
Figure 4-1 Health Belief Model ...................................................................................................... 31
Figure 4-2 Location Maps of Lusaka City and Chawama Township ............................................... 34
Figure 4-3 Backyard Water Well .................................................................................................... 38
Figure 4-4a Ground level pit latrine Figure 4-5b Raised pit latrine ................ 39
Table Page
Table 1-1 Number of Cholera cases and deaths 1991-2004 in Zambia ........................................... 9
Table 3-1 Zambia’s average population density ............................................................................ 20
Table 4-1 Key characteristics of Chawama Township peri-urban area ......................................... 36
Table 4-2 Variables, research questions, and items on the questionnaire ................................... 47
Table 5-1 Percentages of females and males in various age groups ............................................. 50
Table 5-2 Percentages of level of education of males and females participants .......................... 51
Table 5-3 Percentages of marital status ........................................................................................ 52
Table 5-4 Participants Main Source of Drinking Water ................................................................. 54
Table 5-5 Percentages of various sources of water by boiling it before use ................................. 55
Table 5-6 Percentages of main water source by participant chlorine use .................................... 56
Table 5-7 Source Drinking Water by Storage ................................................................................. 57
Table 5-8 Participants Type of Toilet Facilities .............................................................................. 57
Table 5-9 Type and Sharing of Toilet Facilities .............................................................................. 58
Table 5-10 Distribution of disease knowledge............................................................................... 59
Table 5-11 Percentages of participants knowledge of neighbor experience of waterborne
diseases .......................................................................................................................................... 60
Table 5-12 Percentage of household who died from waterborne Diseases ................................. 60
Table 5-13 Knowledge of Cholera disease by level of Education .................................................. 61
Table 5-14 Knowledge of Typhoid Fever by level of Education ..................................................... 62

1
1. CHAPTER ONE - INTRODUCTION
1.1 Water Related Health Issues
Access to safe and clean water is important as a health and development issue at
national, regional and local levels (World Health Organization 2006). Throughout
human history, the major problems of health that humans have faced have been
concerned with community life such as the control of transmissible diseases, and the
provision of safe and clean water in sufficient supply (Rosen 1993). The Romans, for
instance, in spite of the remarkable achievement in public health engineering still had to
cope with the problem of endemic and epidemic water borne disease such as typhoid
fever and dysentery (Rosen 1993).
Furthermore, each year, an estimated 2.5 billion cases of diarrhea occur among
children under five years of age, with more than half of these cases occurring among
populations in low-income regions of South-East Asia and sub-Saharan Africa, Figure
1.1 (UNICEF/WHO 2009).

2
Figure 1-1 Child deaths due to diarrhea (Source: UNICEF/WHO 2009, 7)
This document is divided into six chapters. The first chapter describes the purpose
and background of the study. Chapter two presents a review of literature on the problem
of attaining safe and clean water that has contributed to high incidence of waterborne
diseases among the residents of Chawama Township in Zambia. The water resource in
Zambia is discussed in chapter three. Chapter four details the research design and
application of the survey, including theoretical model and methodology. Chapter five
presents the results of the survey. Chapter six is a discussion of the results, and
recommendations.

3
1.2 Background of Zambia
Historical and Archeological evidence indicates that by the year 1500, Zambia
was occupied by Bantu- speaking horticulturists and subsistence farming people who are
ancestors of its present inhabitants. Between 1889 and 1924 the British South Africa
Company established by Cecil Rhodes, governed the region under the mandate of the
British government. In 1911 the territory was named Northern Rhodesia. In 1924 the
British government assumed direct control over Northern Rhodesia, and it officially
became an established protectorate. On October 24, 1964 Northern Rhodesia gained and
declared independence as a nation state of Zambia (Northern Rhodesia 1964).
Zambia is situated in the tropical region of the sub-Sahara Africa, the axis of the
waterborne diseases, where it has been reported that the burden of these diseases is a
major concern (Negri 2005). The problem of attaining safe water supplies has led
residents to experience high incidence of waterborne diseases some of which lead to
death. For example, in 2004, a cumulative total of 4,734 cholera cases were reported in
the city of Lusaka, with 212 deaths (Central Statistical Office 2006).
The 2000 Census report indicated that at National Level, only 49.1 percent of
households in Zambia had access to safe water (Central Statistical Office 2002).
1.2.1 Geography
Zambia is situated in southern Africa, landlocked and surrounded by eight
countries namely, Botswana, Democratic Republic of the Congo, Angola, Namibia,
Zimbabwe, Mozambique, Malawi, and Tanzania (Figure 1. 2).

4
Figure 1-2 Location map of Zambia (source: WorldAtlas.com)
Zambia has a total land area of 752,614 square kilometers. The landlocked terrain
of Zambia consists mainly of a high plateau with some mountains and hills. The elevation
varies from greater than 2300 meters in the Mafinga Hills on the northeast national
border, down to 329 meters in the valley of the Zambezi River (UN Report 1989).
The climate is tropical with variations depending on altitude. Annual rainfall
averages 1010 mm, ranging between 750 and 1400 mm, and increases progressively from
south to north. A distinct rainy season occurs from October to April. Average daily

5
temperatures are around 18 to 20°C during the cool dry season (from May to August) and
35°C during the hot dry (from September to November) are common particularly for low-
lying regions such as the Zambezi and Luangwa valleys (UN Report 1989). It is endowed
with good water resources, mainly from the rivers, lakes, wetlands, and groundwater. For
instance, the basin of the Zambezi River covers around three-quarters of the country.
Zambia has a centralized system (Republic) of government divided into ten
provinces, and 73 districts. The provinces are Central, Copperbelt, Eastern, Muchinga,
Southern, Luapula, and Lusaka; Northern, North-western, and Western (Figure 1.3)
(Central Statistical Office 2011.)
Figure 1-3 Provincial Map of Zambia (Source: Zambians.com)

6
1.2.2 Population
Zambia‘s population was first comprehensively recorded at 5.7 million in 1980. It
increased to 7.8 million in 1990, 9.9 million in 2000, and 13.01 million people in 2010.
This gives an annual growth of 2.8 percent between 2000 and 2010; with Lusaka
Province having the highest average population growth rate of 4.7 percent yearly (Central
Statistical Office 2011).
Zambia is one of the most urbanized countries in southern Africa; between 35 and
40 per cent of the population live in urban areas, with an urbanization rate estimated at
2.3 percent annually between 2005 and 2010.
1.2.3 Economy
Zambia has a mixed economy consisting of a modern urban sector that,
geographically, follows the rail line and a rural agricultural sector. Copper mining is the
country‘s main economic activity accounting for 95 percent of export earnings and
contributing 45 percent of government revenue during the decades following
independence (1965-1975). In the mid 1970s following a sharp decline in copper prices
and a sharp increase in oil prices, the country‘s economy deteriorated (Zambia
Demographic and Health Survey 2003).
The country suffers from high levels of extreme poverty, with an estimated GDP
per capita at purchasing power parity of US$1500 in 2009. Excess mortality due to AIDS
has reduced life expectancy to just 39 years, and the population‘s median age is 17 years
(Central Statistical Office 2002). The low sanitation levels and limited access to safe and
clean water in many urban areas resulting from high population densities and low
investment levels is critical, and a serious threat to public health. The rising rate of
7
population growth for example is not rising at the same pace with the current water
supply infrastructure; hence, rendering it to be inadequate to cater for this rising
population, and this has posed a public health concern. Subterranean pollution and
dilapidated Water Supply and Sanitation systems connecting with each other lead to a
public health risk which is worse in towns than in rural areas (Nyambe and Feilberg
2009).
This rapid population growth, urbanization and weak economy makes access to
safe and clean water supply more difficult, hence, a risk for outbreaks of waterborne
diseases. The current water supply infrastructure is not adequate to cater for the growing
population.
1.3 Statement of the Problem
The link between the problem of attaining safe and clean water and high
incidence of water borne diseases has not been clearly understood. This is a serious
problem that affects people world over, national as well as in local communities, but
those living in the third world are especially the most impacted. According to the World
Health Organization (2004), 45 countries reported cholera outbreaks in 2003, with a total
of 111,575 cases and 1,894 deaths, and 97% of these reported cases occurred in sub-
Saharan Africa.
The purpose of this study was to understand the problem of attaining safe and
clean drinking water that has contributed to high incidence of water borne diseases some
of which lead to death, for the inhabitants of Chawama Township, Lusaka, Zambia.
Personal characteristics were divided into participant demography (Level of education,
gender, age, marital status, and number of people in household). The examination of

8
demographics was important to this study because it was used to compare with other
constructs contributing to the problem of attaining safe water and incidence of
waterborne diseases (Creswell 2003). The second part of the study asked participants to
identify their source of drinking water. Source of water was defined by the following
elements: how long it took to get the water from source; how it was stored; treatment
before drinking (boiling or chlorination), toilet facilities and use of toilet facilities
(household or/and share with neighbors). The last components asked participants about
knowledge and experience of incidence of waterborne diseases.
The problem of attaining safe and clean water places an enormous burden of
waterborne diseases on the health of the citizens, particularly on the health of children.
For instance, the 1996 Zambia Demographic Health Survey showed that 24 percent of
children under-five years of age experienced diarrhea in the two weeks preceding the
survey (Central Statistical Office 1996). Chege and Agha (1999) reported that the
incidence of diarrhea among children in Zambia‘s low-income neighborhoods was about
42% higher than the national (urban) level.
Access to safe and clean water is an important component to health. Polluted
water can be transported rapidly during floods and can end up in the drinking water
sources. Zambia‘s water pollution from human activities has apparently been on the
increase (Museteka and Bäumle 2009).
Water borne diseases such as cholera, occurs and spreads fast during the rainy
season causing sicknesses and deaths (Table 1.1).

9
Table 1-1 Number of Cholera cases and deaths 1991-2004 in Zambia
Year
Cholera cases
Deaths
1991 13,154 -
1992 11,657 -
1993 11,327
2003/2004 2,529 128
Source: Museteka and Baumle
Similarly, an accumulative of 34,271 cholera cases (nationally) was reported
between 1999 and 2006 (National Water Supply and Sanitation Council 2006). These
cholera cases were attributed to unclean environments and mostly due to ingesting
contaminated water drawn from shallow wells (Sack et al. 2004). Zulu and Nyambe
(2004) showed that the high prevalence rates of cholera were related to the interaction
between pit latrines and the unprotected shallow groundwater wells used for domestic
purposes including drinking.
1.4 Significance of the Study
Understanding the problem of attaining clean and safe water that contributes to
incidence of waterborne diseases is important for several reasons. First, understanding the
link between unsafe water and diseases can help promoting preventive attitudes and
practices among water users. Second, the findings were useful to water providers for
planning, management and evaluation of water supply services. Third, the information
was helpful to health systems plan intervention strategies to curb the problem of water-
borne diseases. Fourth, the study provided opportunities for future studies to fill in the

10
gaps that this study could not address. Fifth, these studies added to the existing body of
knowledge on water related diseases and play a vital role in providing people with
information on public health. Finally, this study highlighted the problem of attaining safe
water, and then developed and made recommendation to policy and decision makers on
how best the water supply can be improved.
1.5 Research Questions
(1) What was the main source of water supply for people in Chawama Township during
the study period?
(2) How was the water treated and stored before use?
(3) What type of toilet facilities existed and how were they used in Chawama Township
during the study period?
(4) Are people in Chawama Township knowledgeable about waterborne diseases?
(5) Did any of the study participants or household members, or neighbor suffer from any
of the waterborne diseases listed on the questionnaire?
1.6 Objectives
(1) To determine the households‘ vulnerability to waterborne diseases attributed to the
problem of attaining safe and clean water.
(2) To identify the participants‘ source(s) of water, storage, and treatment
(3) To determine the participants attitudes and knowledge of waterborne diseases
1.7 Definitions
Waterborne disease is a disease caused by the ingestion of water contaminated by
human or animal feces or urine containing pathogenic bacteria or viruses.

11
Drinking water is water used for domestic purposes such as drinking, cooking and
personal hygiene.
Household is a group of persons who normally eat and live together. These people may
or may not be related by blood, but make common provision for food and other essentials
for a living. It may comprise one or several members.
Access to water: In urban areas a distance of not more than 200 meters from a home to a
public water source.
Access is actual use by the population.
Clean Water is water which is pure enough to be consumed or used with low risk of
immediate or long term harm.
Safe water is water that does not contain biological or chemical agents directly
detrimental to health. It includes treated surface water and untreated but uncontaminated
water from protected springs, boreholes.
Dysentery is an inflammation of the intestine characterized by the frequent passage of
feces with blood and mucus.

12
2 CHAPTER TWO - REVIEW OF LITERATURE
2.1 Introduction
This chapter describes literature reviewed for research purposes of this thesis. The
search employed library sources, the Internet‘s World Wide Web, and locally published
documents obtained from Zambia.
The literature review was guided by the questions in the questionnaire. For
example, information was sought to provide information on source of drinking water for
members of households. The chapter is organized into three sections: (1) development
of water resource (2) Access to safe water, and (3) waterborne diseases.
2.2 Development of water resource
The literature on the development of water resources acknowledges the
importance of adequate and safe water for human health, economic production, and
sustainable development (Walton 1970; King 1953). Failure to ensure the provision of
clean and safe water could expose citizens to the risk of contracting waterborne diseases.
Humans have been concerned with managing water as a necessity of life and as a
potential hazard at least since the first civilizations developed (Dingman 2002).
Centuries ago, for instance, canals, dams, and wells were built along major rivers such as
the Indus in Pakistan, the Tigris and Euphrates in Mesopotamia, the Hwang Ho in China,
and the Nile in Egypt as early as 5,000-6,000 years BC in an effort to capture and store
water (Biswas 1970)
Zambia has made some efforts in dealing with the water supply for its citizens.
These efforts have been in a form of regulatory provisions and physical structures. For

13
instance, there are more than 1,500 dams constructed countrywide with total water
storage of 200km3 for purposes of domestic use and energy generation (National Water
Law 1994). Also, the Water Sector Policy and Legal Reforms were introduced to protect
water source and quality. In 1994 for instance, the National Water policy was adopted to
address issues of water resources. Its objective was to promote sustainable water resource
development with a view of facilitating adequate, equitable and good quality water
supply at all times for all of the users (National Water Resources Report 2009).
2.3 Access to safe water
The lack of access to safe and clean water is a serious problem. The WHO
(2000) estimated that 1.1 billion people worldwide lack access to ―improved water
supply‖ while Hunter et al. (2000) reported that, about 20 percent of the world's
population lack access to safe drinking water.
Although all nations have deficiencies in providing adequate supplies of safe
water for domestic use, the problem is most critical among the developing countries
(Walton 1970). UNICEF (2000) estimated that in 50 percent of the developing countries,
the majority of the populations have no access to adequate safe and clean water.
Furthermore, UN Population Division (2004, 68) reported that of 117 countries with data
available in developing nations, the majority of the population lack access to safe
drinking water.
Although the problem of lack of access to safe water supply exists among many
regions of the world, Sub-Saharan Africa is experiencing its devastating impact first-
hand. UN-HABITAT Report (2011) indicated that an estimated 150 million Sub-Sahara
African urban dwellers do not have access to safe drinking water supplies. It is also
14
estimated that in Sub-Sahara Africa, more than 300 million people lack access to safe
drinking water supply (Yongsi 2010, 424).
Within the context of cities which are witnessing constant population growth,
access to safe water remains a challenge to many inhabitants. The population growth and
peri-urban sprawling, has made it hard for Zambia to provide clean and safe piped water
to everyone. This failure has led to many urban dwellers resorting to obtaining water
from unsafe sources such as hand- dug shallow wells. Water from such sources is often
contaminated with fecal material, domestic and industrial wastes. Such polluted water
results in an increased public health risk of waterborne diseases outbreaks (Mahvi and
Karyab 2007).
In Zambia, access to safe and clean water is similar to many other developing
countries. The 2000 Census estimated that at national level, only 49.1 percent of
households had access to safe water (Central Statistical Office 2000). The United States
Agency for International Development (2006) survey estimated that only 52 percent of
the population had access to safe and clean water. This percentage of access to clean
water was higher than the average in Sub-Saharan Africa (International Network for
Environmental Justice in Africa 2010).
2.4 Morbidity and Mortality Waterborne Diseases
Although waterborne diseases have largely been eliminated in developed nations,
the burden of these diseases remains a major concern in many developing countries,
particularly in tropical regions (Gleick 2002).
Water-borne diseases are basically ―dirty-water‖ diseases; mainly attributed to
water that has been contaminated by human, animals or chemical wastes (Chabalala and

15
Mamo 2001). Worldwide, it has been shown that water-borne diseases are responsible for
over 2-3 million deaths a year mainly due to lack of safe drinking water (UNICEF/WHO
2009). Waterborne diseases among others include dysentery, cholera, diarrhea, and
typhoid fever.
More importantly, vulnerable groups, such as children, women, immune
compromised people such as AIDS patients, and the elderly, are the most impacted.
There is evidence in literature that shows a relationship between contaminated drinking
water, and waterborne diseases. For example, drinking water, which is contaminated by
human or animal feces, can result in contracting waterborne diseases, such as cholera,
dysentery, and typhoid fever, and diarrhea (Tumwine et al. 2002, 7).
According to the UNICEF/WHO (2009), waterborne diseases, such as diarrhea,
remains the second leading cause of death among children under five globally.
Worldwide, it is estimated that 140 million people develop dysentery each year, and
about 600,000 die (Perlin & Cohen 2002). In the United States of America, waterborne
disease outbreaks have been caused mainly by contaminated wells and water storage
reservoirs. For instance, in 1993, an outbreak of ―S. Typhimurium‖ resulted in 650
illnesses and 7 deaths in Missouri (Covert 1999).
Furthermore, it is estimated that nearly one in five children‘s death, that is about
1.5 million each year is attributed to diarrhea, thus, killing more young children than
AIDS, Malaria and Measles combined (UNICEF/WHO 2009). It is also estimated and
reported that diarrhea kills 1.8 million and causes approximately 4 billion cases of illness
annually, of which 88% is attributable to unsafe water (WHO 2007). The Center for
Disease Control (2007) reported that Typhoid fever is still common in the developing

16
world where it affects about 21.5 million persons each year. Hall and Lobina (2008)
reported that 2.2 million deaths in developing nations are attributed to waterborne
diseases. Almost half of the population in developing countries is at high risk of exposure
to waterborne diseases such as dysentery, typhoid fever, and cholera (Suresh and Smith n.
d.).
Diarrheal epidemics have been common in many world regions. For example, a
four-year epidemic in Central America, starting in 1968, resulted in more than 500,000
cases and more than 20,000 deaths. Since 1991, dysentery epidemics have occurred in
eight southern African countries of Angola, Burundi, Malawi, Mozambique, Rwanda,
Tanzania, Zaire, and Zambia (Perlin and Cohen 2002). Currently, the island nation of
Haiti is in a cholera epidemic which has reportedly killed more than 4,000 people and
infected 217, 000 people (Tuite et al. 2011).
In sub-Saharan Africa, a region in which Zambia is located, diarrheal diseases are
a leading cause of death in children under five years. It is estimated that each child has
five episodes of diarrhea per year and that 800,000 of those children die from diarrhea
and associated de-hydration (Perlin and Cohen 2002).
In Zambia, the United States Agency for International Development Water and
Sanitation Profile 1 (2006) estimated that diarrheal deaths in 2004 were 13,700;
furthermore, cholera epidemics have occurred every year in many parts of the country
leaving hundreds dead and many thousands more passing through the ordeal of the
infection. For instance, a total of 6,542 cholera cases and 187 deaths were reported in
Lusaka between November 28, 2003 and June 8, 2004 (Sasaki et al. 2008).

17
2.5 Summary
Study reports cited above clearly show that water-borne diseases are a serious
public health threat, particularly in developing countries. Negri (2005) reported that
water-borne diseases are number one killer in the tropical regions of Africa. The studies
reviewed above also addressed outbreaks in different countries including Zambia,
whereas this study focused on data collected in Chawama Township, Lusaka. Unless the
problem of attaining safe and clean water is adequately dealt with, incidence of
waterborne diseases will continue impacting young children and the elderly particularly
in less developed nations.

18
3 CHAPTER THREE - WATER RESOURCES IN ZAMBIA
3.1 Introduction
In Zambia, available water in any particular area depends on how much surface
water and groundwater is available. The current water resource potential estimate for
2005 was 186.65 Km3. Although it appears sufficient and of relatively good quality to
meet both present water demands estimated at 40 Km3, the population has almost double
to 13 million (Central Statistical Office 2011) pausing a challenge to future demands for a
growing population.
Nearly all discussions on water tend to underscore its importance to human life.
Viewed from the Africa perception, water is a gift from the gods and unquestionably a
substance that is part of humanity. Many ceremonies of birth and death rites in Africa and
Zambia in particular revolve around water. For instance the ―Malende‖ ceremony of the
Tonga people in Southern province of Zambia is intended to invoke mercies of the gods
to release the rains when there is a drought.
3.2 Water Use in Zambia
Zambia‘s water resources are predominantly present in two forms, the surface
water and groundwater. Although the country may be bursting with abundant water
resource, the problem is that it may not all be in the form and quantity in which it can be
utilized by the nation‘s 13.01 million people.
The country‘s largest amount of water is used for hydropower generation. The
rest is shared among various sectors such as agriculture, industry, and domestic water
supply including wildlife. According to an assessment made by Japanese International
Cooperation Agency (1995), between1992 and 1995, it was estimated that the total water

19
demand in Zambia was less than 40 Km3. Of this water, 36 Km
3 per year (1,150m
3/s) is
used for hydropower generation. Out of the remaining 3 Km3 per year, agriculture uses
about 2.31Km3, Industry 0.21 and households 0.48 Km
3 (Figure 3.1).
Figure 3-1 Water Usage in Zambia (Source: JICA-MEWD, 1995)
3.3 Health Concerns/Impacts
Zambia, with its ten provinces and 73 districts, is one of the most urbanized
countries in Southern Africa with 40% of its population living in urban areas (Central
Statistical Office 2008). The average population density in urban areas has continued to
rise at every census period (Table 3.1).

20
Table 3-1 Zambia’s average population density
Year
1969
1980
1990
2000
2010
Average
Population
Density
5.4 7.5 9.8 13.1 17.3
Source: CSO 2004
Lusaka has the highest population density at 100.4 per square kilometer. As a
matter of fact, this population explosion is concentrated mostly in Lusaka‘s unplanned
settlements or Peri-urban areas. The population density particularly in these unplanned
settlements raises a serious public health concern because these areas are characterized by
poor water supply and sanitation services, deteriorated environmental conditions, poor
drainage, and uncollected solid waste (Nyambe and Feilberg 2009).
3.4 Hydrology
The rainfall range is from 600 mm in the south to 1500 mm in the north, falling
between October and April, which is the wet season. This means, river flows in the
country experience seasonal variations with peaks between March and April and the
lowest flow is experienced between October and November. The Country is therefore
prone to extreme meteorological events.
Renewable potential of surface water has been estimated to be just over 100 Km3
while that of groundwater was estimated to be 49.6 Km3
(Japanese International
Cooperation Agency 1995). There has been no observed sign of groundwater depletion,
but some aquifers such as the Lusaka aquifer are slowly coming under a threat from
pollution due to exposure to pit latrines, and septic tanks (Nyambe and Feilberg, 2009).

21
The average annual evapo-transpiration is estimated at 1,574 mm and ranges
between 1,394 mm and 1,892 mm (Japanese International Cooperation Agency 1995).
This means, the country has a precipitation deficit of 100 to 1,100mm per based potential
evapo-transpiration.
In a high rainfall hydrological year, the annual runoff can be as high as 130
Km3per year. It can also be as low as 68 Km
3 in a severe drought year. This fluctuation is
important because during the dry seasons, groundwater becomes a major source of water
in sustaining the country‘s river flows (Nyambe and Feilberg 2009).
3.4.1 Surface water Drainage
Zambia, unlike many other countries in the region has more than adequate water
resources. The nation lies entirely within two large river basins, the Zambezi and the
Congo River basins. The river network is well distributed and well fed and it includes
large and small watercourses with a total renewable water resource of 105 km3/year
(Matlock 2007). For instance, Zambezi River‘s total drainage from source to mouth,
occupies about 1.2 million km², 20 percent of which is located within the country (UN
Report 1989). In addition, two of its tributaries, the Kafue and the Luangwa, lie entirely
within the country. The country also is bursting with four large lakes, Bangweulu,
Mweru, Tanganyika, and Kariba (UN Report 1989). Other water bodies include flood
plains and wetlands.

22
There are three major river systems within the Zambezi River basin and two
within the Congo River basins. (Figure 3.2) shows the river drainage systems:
(i) The upper main Zambezi River system is joined by the Luangwa and
Kafue tributaries. The upper Zambezi originates in Angola and flows to
Mozambique after forming the borders with Botswana, Namibia and Zimbabwe.
(ii) The Kafue River system covers an area of 152,000 km2. The river has two
important dams, the Itezhi-Tezhi dam and the Kafue Gorge dam, the latter of
which is used for hydropower generation.
(iii)The Luangwa River has a catchment area of 165,000 km2. It drains most of the
central parts of the country and empties into the Zambezi.
(iv) The Chambeshi River and the Luapula River are associated with lakes Mweru and
Mweru-Wantipa and drain their water into the Congo River system.
(v) The small Tanganyika drainage system is also part of the large Congo River
system.

23
Figure 3-2 Zambia's River Drainage System (Source: Graphic Maps.com)
3.4.2 Groundwater
Groundwater is a major source of water in many parts of Zambia. It sustains river
flows particularly during the dry season for perennial rivers and streams and can
contribute to between 30 and over 90 percent of the total flows (Nyambe and Feilberg,
2009).
The availability of water resources in Zambia has previously been discussed by
the Japanese International Cooperation Agency (1992). The findings have been that the
country has substantial groundwater resources (Chabwela and Mumba 1998).
There has been a steady growing demand on groundwater use in Zambia. It is
estimated that 9% of water usage is from groundwater which provides 28% of domestic
water supply (British Geological Survey 2001). The rocks of the Katanga systems
24
possess the highest groundwater potential as a single geological sequence that occupies
the Northern and Central parts of the country (UN Report 1989). Yields in these systems
are highest in the top 30 m or so of the sediment strata where fissures are best developed.
These aquifers provide a significant proportion of the water supply for the municipalities
of Lusaka, Kabwe, and Ndola where boreholes yield up to 35–50 l/sin karstic sections of
the aquifers (UN Report 1989).
3.5 Water Supply in Zambia
There are several government ministries and agencies, which are involved in
water resources development, management and administration. The Water Development
Board and the Department of Water Affairs in the Ministry of Energy and Water
Development are the major organizations involved in water resources development while
the Resource Conservation is carried out by the two agencies; (1) the Ministry of
Environment and Natural Resources and (2) the Environmental Council of Zambia.
The Ministry of Local government and Housing is responsible for providing water
supply and sanitation. The National Water Supply and Sanitation council is the regulator
of the water supply and sanitation sector. The resource conservation function is carried
out by the Ministry of Environment and Natural Resources and the Environmental
Council of Zambia. The Ministry of Local government and Housing is responsible for
providing water supply and sanitation. The National Water Supply and Sanitation council
is the regulator of the water supply and sanitation sector (Phiri 2000, 4).
According to the 1990 census, 2.75 million people had piped water services. Of
those who had piped water, 0.97 million people had their households connected to the
local provider‘s water system. Interestingly, 1.37 million people got their water from

25
communal taps, which were, located more than 100m away from their homes (Phiri
2000).
3.6 Level of Access to Safe and Clean Water
Access to safe drinking water is measured by the proportion of population with
access to an adequate amount of safe drinking water located within a convenient distance
from the user‘s dwelling. In urban areas, a distance of not more than 200 meters to fetch
20 liters of safe water per person per day from a home to a public water source may be
considered reasonable access (WHO 2006)
In Zambia, the government has set the standard access to a domestic water supply
at 500 meters from a water supply point. This standard is way too high up compared with
the recommended World Health Organization access standard set at 200 meters from a
water point. Efforts to reduce the distance covered to a water point have proven difficult
due to irregular land use settlement patterns. For example, people erect building
structures in places intended for other uses, such as water points. The resulting situation
is that, ideally, a water point, which was intended to serve 200 people, ends up serving
900 people. These factors have led to the rate of access to clean and safe water supply to
remain low particularly in peri-urban areas where 50 –70 percent of the urban population
lives (Ministry of Energy and Water Development 2008).
3.7 National Water Regulations
The aim of a national drinking-water laws and standards are to ensure that the
consumer is availed and enjoyed safe and clean drinking water. Effective delivery and

26
control of drinking water quality should be supported by adequate legislation, standards
and codes and their enforcement (WHO 2006).
The precise nature of the water legislation in Zambia depends on the national,
constitutional and other considerations. It generally outlines the responsibility and
authority of key players and describes the relationship between them as well as
establishing basic policy principles, such as water supplied for drinking should be clean
and safe to the user. It should also make provision for the establishment and amendment
of drinking water quality standards and guidelines, as well as for the establishment of
regulations for the development and protection of safe and clean water sources (WHO,
2006). Legislation should also establish the legal functions and responsibilities of the
water supplier and should generally specify that the water supplier is legally responsible
at all times for the quality of the water supplied to the consumer (WHO 2006).
In November 1994, the Government of Zambia adopted the National Water
Policy. The main aim of the policy is to provide a holistic management approach to the
water sector. For the water supply and sanitation sector, the policies and strategies are
aimed at improving the quality of life and productivity of all people by ensuring an
equitable provision of an adequate quantity and quality of water to all competing user and
sanitation services to all, at an acceptable cost, and on a sustainable basis. The overall
objective of the water policy is to promote sustainable water resources development with
a view of facilitating an equitable provision of an adequate quantity and quality of water
for all competing users at acceptable cost and ensuring security of supply under varying
conditions (National Water Law 1994).

27
The major legal enactments relating to water in Zambia are as follows:
(a) The Water Act of 1948 is the supreme law on water resource issues in Zambia. It
stipulates the ownership of water and the procedures of authorization and invalidation of
water use (Phiri 2000, 2).
(b) The Water Supply and Sanitation Act of 1997 was enacted to deal with problems in
delivery, protection, conservation, development and management of the water resources.
The key to addressing most of these issues had to do with the legal, institutional and
organizational framework of the water sector and necessitated the adoption of the
National Water Policy of 1994 (National Water Law, Government of Zambia 1994).
In this section, the emerging consensus on water policy was discussed and the
major institutions created by parliament to deal with water issues in Zambia.
The following key strategies were enshrined within this policy:
(i) Recognizing the important role of the water sector in the overall socio-economic
development of the country
(ii) Vesting control of water resources in the country under state control
(iii) Promoting water resources development through an integrated management approach
(iv) Providing adequate, safe and cost effective water supply and sanitation services with
due regard to environmental protection
(v) Defining clear institutional responsibilities of all stakeholders in the Water Sector for
effective management and co-ordination
(vi) Recognizing water as an economic good
The 1994 Water Policy is guided by seven key principles, and they are:
(i) Separation of water resources management from supply and sanitation;

28
(ii) Separation of regulatory and executive functions;
(iii) Devolution of authority (from central government) to local authority and private
enterprises;
(iv) Achievement of full cost recovery for the water supply and sanitation services
through user charges in the long run;
(v) Human resources development leading to more effective institutions;
(vi) The use of technologies more appropriate to local conditions;
(vii) Increased government priority and budget spending to the sector.
Following the water supply and sanitation sub-sector reforms at different levels,
the Government of Zambia launched the Water Resources sub-sector reforms with the
Water Resource Action Program in 2001. A Water Resources Management Bill,
proposed a new Water Resources Institutional Framework (legal and institutional paper),
which was an improved Water Resources Management Information System and a Draft
Water Action Plan on how to deal with water resource issues. An additional weight to
this process was the target of developing Integrated Water Resources Management Plans
as declared at the 2005 Johannesburg World Summit for Sustainable Development.
Further, the 2004 Commission on Sustainable Development focused on the water and
sanitation sector to toward realizing these goals. As a show of commitment to water
development, the Fifth National Development Plan and the Integrated Water Resources
Management/Water Efficiency Implementation Plan were to be implemented nationwide.
3.8 Summary
As it has been earlier pointed out, Zambia is bursting with abundant water
resources. The problem lies in priorities on the side of policy and decision makers. For

29
instance, there are many organs of the state involved in water resources, and this has led
to problems of coordination. Also the government is not investing adequate financial
resources in the water sector. The laws that govern water resources lack the realization
component, that is, there is no following through to the demands of the laws and
regulations.

30
4 CHAPTER FOUR - RESEARCH DESIGN AND APPLICATION OF THE
SURVEY
4.1 Introduction
The research design shows how the study was conducted. The key issues
addressed include: method, study participants and how they were selected, research
design, the procedures, sampling, data collection, and processing and analysis.
4.2 Theoretical Approach
A theory presents a systematic way of understanding events or situations. It is a
set of concepts, definitions, and propositions that explain or predict these events or
situations by illustrating the relationships between variables (National Cancer Institute
2005).
The theoretical approach used in this study is the Health Belief Model (HBM).
This theory was used to describe and analyze the link between the problem of attaining
clean and safe water and waterborne diseases. The HBM (Figure 4.1) is a conceptual
formulation for understanding why individuals did or did not engage in a wide variety of
health related actions. It espouses that behavior depends mainly upon two premises: (1)
the value placed by an individual or community on a particular goal, and (2) the estimate
of the likelihood that a given action will achieve that goal (Janz and Becker 1984).
In the HBM, behavior change is determined by the way one perceives
susceptibility to a disease condition, and severity. This perception is informed and
shaped by among other factors, the environment, age and a person‘s knowledge of the
disease. The prediction of this model is the likelihood of the individual concerned to
undertake recommended preventive health actions. The desire to avoid illness (or if ill,

31
to get well) is shown by the specific action an individual takes to prevent it. Cues to
preventive actions are developed based on an individual‘s experiencing or seeing another
person suffer or die from the disease. These experiences are expected to lead to such
preventive behavioral changes as boiling or chlorinating the water before use.
HBM constructs have been used in studies focusing on dealing with cancer
control programs (National Cancer Institute 2005). These studies have examined
behavior change derived from the way a disease or condition is perceived and the ability
to cope.
Individual Perceptions Modifying Factors Likelihood of Action
Figure 4-1 Health Belief Model (Source: National Cancer Institute 2005)
4.3 Research Design
Exploratory research design was chosen for purposes of this study because it was
found to be suitable for two reasons (1) it is usually a small-scale research undertaken to
define the nature of the problem and to gain an understanding of the environment within
Age, sex, ethnicity
Personality, Socio-
economics
Knowledge
Perceived threat of
disease
Cues to action
Education, symptoms
Media information
Perceived benefits
Versus barriers to
behavioral change
Likelihood of
behavioral change
Perceived susceptibility/Seriousness of disease

32
which it occurred (McDaniel and Gates 1995); (2) exploratory research is suitable for this
study owing to its concern on finding out about what was happening and discovering new
insights about a problem.
The study utilized in-depth search of the literature, and collection of data using a
questionnaire. It is out of these different sources of information that the details about the
nature of the problem are derived (Mancosa 2000).
4.4 Methodology
This section contains a description of the physical steps taken to gather the data. It
describes study participants and the procedures such as the administration of the survey.
It also describes the instrument used to collect data.
4.5 Study Design
This was a cross-sectional population survey that was conducted in 400
households sampled in Chawama Township, Lusaka, Zambia using the cluster sampling
methodology.
4.6 Study Site
For purposes of this study, one typical peri-urban township of Chawama, in
Lusaka, was chosen to collect investigative data that sought to understand the problem of
attaining safe and clean water and residents‘ health with respect to high incidence of
waterborne diseases. Figure 4.2 shows the location of Chawama Township in Lusaka.
In this part of the study, an overview of Lusaka City, and then of Chawama
Township is discussed.

33
4.7 Lusaka Overview
Lusaka is the capital city of Zambia situated on the central African plateau at
about 1300m above sea level (Figure 4.2). It had an estimated population of 2.2million
inhabitants in 2010 (Central Statistics Office 2011) and is growing mainly due to
migration from the rest of the country, but also because of high internal population
growth. The city was designed during the colonial error for a population of 500,000 in an
area of only 2.6 km2; today it comprises 375 km
2. As for city planning, the last approved
master plan came into force in 1978. Illegal site developments and quarrying are common
in the city (Lusaka City Council Report 2008).
Approximately 1.23 million residents of Lusaka live in low-income unplanned
peri-urban areas, a majority of which are slum-like in character. The water supply service
in the peri-urban areas of Lusaka is rudimentary, and sanitation service provision by
Lusaka City Council to those areas is almost non-existent (Mayumbelo and Münch
2008).
The city has an average annual rainfall of 865mm and the runoff drains into
several different watersheds: the Ngwerere and Chalimbana streams drain most of the
northeast of the city into the Chongwe River. Areas in the south and the northwest of the
city are drained by the Chunga stream into the Kafue River (Lusaka City Council Report
2008). The few perennial streams in the region are characterized by low flow especially
during the dry months of the year (Mpamba et al. 2008).

34
Chawama Township
Figure 4-2 Location Maps of Lusaka City and Chawama Township (Source: JICA 1995)
4.7.1 Lusaka Groundwater
The Lusaka dolomite holds an integrated system of conduits, caves and
subterranean channels and therefore constitutes the city‘s major aquifer, from which
substantial volumes of groundwater is drawn. The trend of groundwater flow in the
channels is southeast to northwest (Mpamba et al. 2008).
The water table is in some places situated at extremely shallow depths, ranging
from 0.5 to 30 meters below the surface, but it is more typically at six to 15 meters. It has
been observed to decline in some places, raising fears of over-exploitation (De Waele and
35
Roberto 2003). Observations from some boreholes indicate a long-term decreasing trend
that risks leaving shallow wells dry during the dry season (Japanese International
Cooperation Agency 2009), but that the water table is mainly decreasing in the formal
residential areas where boreholes are drilled in schist and quartzite rock.
4.7.2 Lusaka Water Demand
Local water demand is estimated to be 450,000 m3/day considering a daily
consumption per person of 180 liters the domestic water demand is estimated in 360,000
m3/day while the remaining 90,000 m
3/day are used by industry. 100,000 m
3/day of water
is taken from the Kafue River, about 40 km south f Lusaka and is brought to the capital
through a mostly external pipeline of 2 m diameter. At least 350,000 m3/day is taken
from the aquifer, of which 90,000 m3/day comes from 40 production wells of Lusaka
city, leaving not less than 260,000 m3/day pumped from 3000-4000 private boreholes
(Nyambe and Maseka 2000).
4.7.3 Chawama Township
Chawama Township is bordered by John Laing Township to the west, Misisi
Township to the north, and John Howard to the south, and Kamwala Township to the east
(See Figure 4.2). It is one of the largest shanty compounds located 8 kilometers south of
the Lusaka central business district. It has total population of 97,000 people, and 40,908
households (Central Statistics Office 2011).
Chawama Township was selected for this study because it is one of the peri-urban
areas in Lusaka with diverse population, and is close to the central district (Table 4.1)
shows some of its characteristics:

36
Table 4-1 Key characteristics of Chawama Township peri-urban area
Characteristics
Status
Typical number of households per plot
3 people
Approx. population density in people per
hectare
244
Legal status Recognized by municipality
Frequency of outbreaks of water-borne
diseases (dysentery or other diarrhea)
Endemic
Expenditure on water as % of household
income
0.7 to 5%
Ownership of toilet
Usage of toilet is commonly shared by all
tenants on the plot (average of 12 people) but
officially the landlord owns the toilet
structure
Main drinking water
Sources
Drilled boreholes within Chawama,
And supply from Lusaka Water
And Sewerage Company
Alternative drinking water
Sources
Shallow hand-dug wells
(Source: GKW 2005)
Chawama Township started out as a farming area and later was leased to
companies for quarrying in the 1940s. Quarrying activities ceased in 1961. The
community was incorporated in the city of Lusaka in 1970. From 1974 to 1978 former
quarry workers were leased plots to build houses. The government introduced public
services in the area in the late 1970s. It is one of the first large-scale squatter upgrading
projects that was undertaken by the government between 1975 and 1982 (Fallavier,
Mulenga, and Jere 2005).
The dwellings in Chawama Township are predominantly made of concrete block
walls with corrugated iron or asbestos sheet roofs, and a large number of them have

37
backyard space, which is often used to dig water wells. The area is prone to flooding
during the rainy season, and is densely populated and lack well-functioning primary
services such as water and electricity supply, sewerage systems and solid waste
collection.
Shallow wells, hand-dug from the soil and in caves, are common in Chawama
township area of Lusaka, and the water is hand-drawn from the vast majority of them.
Many of the wells are of the open type, lacking brick or stone wall on the sides, whereas
others have a lining and a covered construction.
The lack of a proper sewerage system in this township means that the majority of
the population has to make their own sanitation facilities. The on-site pit latrines are
commonly used, which are normally simple constructions, four to six meters deep. Dried-
up shallow wells are also often converted into pit latrines during the dry season
(Mayumbelo and Münch 2008).
The non-raised pit latrines in particular tend to get flooded during the rainy season
and high concentrations of pathogens infiltrate the aquifers, contaminating the
groundwater. Moreover, most of the latrines are unlined, thus constructed without
waterproofing. Although this is not a criterion for considering the latrine ‗improved‘, the
result is that any liquid from the excreta can rapidly find its way underground
(Mayumbelo and Münch 2007). Since the latrines are typically situated close to wells,
this contributes to frequent outbreaks of cholera, dysentery and other water-borne
diseases, at least during the rainy season (Figure 4.3)

38
Figure 4-3 Backyard Water Well (Source: Mayumbelo & Munch)
4.7.4 Excretal Disposal
Disposal of fecal matter in Chawama Township is mainly through pit latrines with
minor systems of open defecation; pour flush latrines and limited use of flushing toilets
or septic tanks. Some of the households do not have their own toilet facilities. Those who
have toilet facilities share with other households.
Two types of pit latrines are found in Chawama Township, namely ―ground-level
and raised‖ latrines. The ground-level pit latrines are often constructed in sinkholes over
which residents build some form of structure made of sacks, plastics, grass or any other
available materials (Figure 4.4a). These pit latrines are not built for structural strength,
but only for privacy. The raised pit latrines (Figure 4.4b) are usually made of blocks, and
when they are filled, they are either abandoned or the excreta removed and the pit can be
re-used.

39
Figure 4-4a Ground level pit latrine (GKW 2005) Figure 4-5b Raised pit latrine (GKW 2005)
4.8 Study Population
Study participants interviewed were 19 years or older. Most participants were
between the ages of 21 and 40 (32%) years. They were asked to participate in this study
because they were residents of Chawama Township. The sample of 400 participants was
drawn from the 97,000 inhabitants of Chawama Township, Lusaka, Zambia. About 70
percent of the participants were females and 30 percent were males. 51 percent of the
participants were married while 19% were single. Comparatively, 26.6 percent had grade
9, and 24.6 percent had grade 12 level of education and only 8.5 percent had a university
level of education.
Participation in the study required approximately 30 minutes of interview time.
They were initially asked questions about the source and storage of their water. Next they
were asked about their knowledge and incidence of waterborne diseases. At the end
participants were asked to provide personal information about their age, marital status,
gender and level of education. The interviews were not video or audio taped.

40
4.8.1 Research Study Protocol
As part of research compliance with Health and Human Services regulations, and
commitment to human participant research protection program, UNL‘s Institutional
Review Board (IRB) reviews and approves all human participant research conducted by
the faculty, students, staff, or other Institutional representatives regardless of where the
research is conducted (Human Research Protections Policies and Procedures (HRPP)
2008, 4). To fulfill this requirement, an application to conduct this study was made to the
IRB office. This project was approved as an Expedited protocol, category 6 & 7, and
permission to begin the research was officially granted under IRB protocol number
―NUgrant Project ID: 11767‖ (Appendix C).
Furthermore, permission to conduct a survey in the study site was sought from
Zambia‘s Lusaka Water and Sewerage Company. Authorization to proceed with this part
of the study was granted through a letter (Appendix D).
4.8.2 Informed Consent Procedures
The participants were verbally asked if they were willing to participate in the
study. A written consent form was also available with the interviewer in cases where it
was required. However, in this study area, asking someone to fill out a consent form for
purposes of research raised more questions than not doing it at all. Therefore, a verbal
agreement was sufficient to give the interviewer the mandate to proceed with the
administration of the questionnaire.
4.8.3 Risks and/or Discomforts
There were no known risks or discomforts associated with this research.

41
4.8.4 Confidentiality
At the start of an interview, participants were assured of confidentiality. They
were asked not to give their names, house numbers, or any information that would
identify them. They were also informed that any information obtained during this study,
which could identify them, would only be accessed by the principal researcher.
Participants were also informed that information obtained in this study was not
going to be published in any Scientific Journals or presented at any Scientific Meeting in
line with a condition given by the Lusaka Water and Sewerage Company for authorizing
the study to be conducted in Chawama Township. LWSC is the main Utility Commercial
Company that provides piped water to the residents of Chawama Township.
Nongovernmental agencies do provide well water to the residents. For example, the
Japanese International Co-operation Agency provides water supply service delivery
through community-based schemes to Peri-urban areas (United States Agency for
International Development 2006).
In many situations, residents themselves dig shall wells to provide for their
supply of water. It was also communicated to the participants that the project personnel
had signed a confidentiality agreement to protect their privacy as study research
participants. They were also informed that there was no financial compensation for
participating in this research study.
4.8.5 Freedom to Withdraw
It was explained to the participants that participation in this study was voluntary
and could therefore refuse to participate or withdraw at any time without harming their

42
relationship with the researchers or the University of Nebraska-Lincoln, or in any other
way receive a penalty or loss of benefits.
4.8.6 Questionnaire
The questionnaire consisted of 20 items some of which had sub- items (Appendix
A). The contents of the questionnaire used for this study was based on the household
questionnaire model developed by the Zambia Demographic and Health Survey (2003).
In consultation with Central Statistical Office, and the study advisor, the original contents
of the questionnaire were modified to produce the draft that reflected relevant issues to
this study.
The questionnaire consisted of items to which participants were to respond by
placing an X in the appropriated boxes. Some basic information was collected on the
characteristics of the participants who agreed to feel out the questionnaire, including
gender, age, and level of education, marital status, and number of people in the household
from participants 19 years and older. The questionnaire collected information on
characteristics of the household‘s dwelling unit, such as the source of water, and type of
toilet facilities. It also collected information on knowledge and experiences of
waterborne diseases.
4.9 Study Phase 1
This was a pilot phase when a proposed questionnaire was administered to 20
participants in the study area. This was intended to test the procedures for selection of the
sample and an application of the statistical procedures to be used in the data analysis

43
stage (Monette, Sullivan and Dejong 2005). This pilot phase provided additional insights
into the formulation of the final questionnaire.
A draft version of the questionnaire was prepared and distributed to participants to
complete. Informed consent procedures and confidentiality were followed as required by
the University of Nebraska-Lincoln research protocol. Based on the nature of the study,
requirements by the Zambia Ethics Review Committee were waived. The questionnaire
was administered to every 10th household in the housing unit rows. The designation,
"every 10th house" was not based on specific numerical labels, for example house No
B378; but instead we counted every tenth house from the last person that agreed to
participate. This was the convenient method because of the way the housing units are
arranged. Completed copies of the proposed draft questionnaires were sent back to the
University of Nebraska in the United States for analysis.
This phase was intended to test for clarity and understandability of the
questionnaire by the participants. The data collected from the participants were analyzed,
and used to guide the design of the final questionnaire on the problem of attaining safe
and clean water and experience of high incidence of waterborne diseases.
A discussion to examine the items (questions) in the questionnaire was held with
my study advisor, Professor Kuzelka. This discussion focused on the clarity of the
questions and their applicability to the Zambian situation. Based on this discussion, the
draft questionnaire was further revised to take into consideration some issues raised. The
questions on the problem of attaining safe and clean water and experience of high
incidence of waterborne diseases were mostly derived from the Questionnaire developed
by the Zambia Demographic and Health Survey 2001-2002 (Appendix B).

44
4.10 Study Phase 2
4.10.1 Research Sample
A sample of 400 participants was drawn from the 97,000 residents of Chawama
Township, Lusaka, Zambia. Of the 400 questionnaires collected, 391 were complete and
nine were discarded for incomplete responses. This sample was considered
appropriate for this study on two grounds (1) to measure changes in selected variables,
and (2) to provide a representative sample size large enough to permit detailed analysis.
4.10.2 Method of Sampling Design
Non-probability sampling design was chosen to select participants for this study.
Often, units for this type of sample are selected on the basis of known characteristics that
seem to represent the population, with the assumption that the units selected will
represent the population on unknown characteristics as well (O‘Sullivan, Rassel and
Berner 2008). This design was chosen for this study because there was not a well-defined
sampling frame (O‘Sullivan, Rassel and Berner 2008, 135). This sampling technique was
applied by administering questionnaires to the participants representing heads of
households within the study area.
4.10.3 Recruitment Procedures and Benefits
Participants were approached by interviewers who introduced themselves as
research project personnel collecting data on clean and safe water and incidence of water
borne diseases in Chawama. If a participant agreed to participate, then he or she was
interviewed and asked to fill out the questionnaire.

45
The benefits of the study to the participants was (1) gaining a deeper
understanding of the problem of attaining safe and clean water and high incidence of
waterborne diseases (2) improvement of safe water supply quality through the
recommendations that were made to policy and decision makers and cooperating
partners.
4.10.4 Administration of the Questionnaire
A total of four field personnel were recruited and trained as interviewers.
These administered the questionnaires door to door and carried out face-to-face
interviews. The interviewers were trained on interviewing skills including, but not limited
to self-introduction, explanation of the purpose of their visit, and the study. They were
made to understand every detail of the survey to enable them explain it to the participants
who may have difficulties in answering questions.
One of the field interviewers was the contact person and was also responsible to
make all necessary arrangements such as the appropriate times to get to the households.
A questionnaire was administered to every 10th
household in the block. The
questionnaires were completed by the household in a single contact. The households were
assured that no information about their participation would be revealed to other
respondents or to anyone outside of the trained study personnel. In the event a participant
experiences a discomfort from participation in this study a local contact person was
available to offer further assistance.

46
4.10.5 Interviewer Training
The training and fieldwork was conducted and completed in September 2011.
Four interviewers were trained in interviewing techniques and the contents of the
questionnaire. The training included group presentations and mock interviews. In
addition, the group instruction training included practice interviews using one common
local language.
One field supervisor was present to monitor interviewers and met with them at the
end of each workday and reviewed the day‘s work.
4.10.6 Variables in the Study
This part attempts to relate the variables to the specific questions and how the items
on the questionnaire were used. Table 4.2 shows this information.
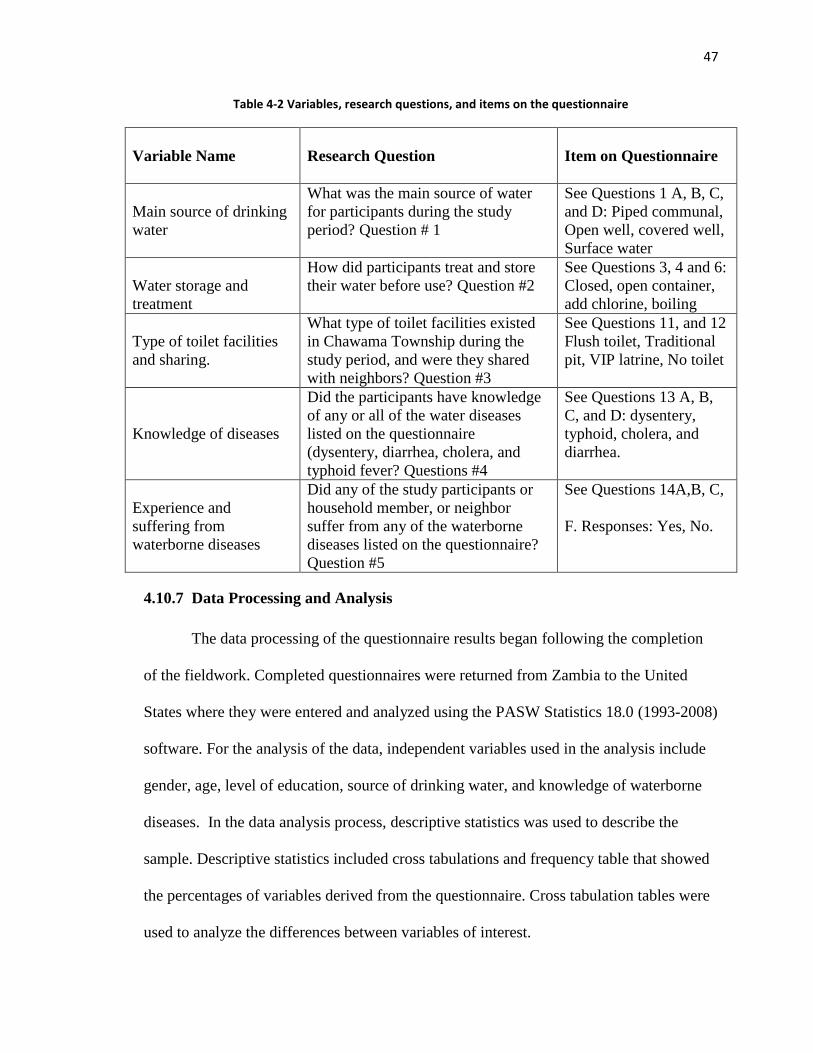
47
Table 4-2 Variables, research questions, and items on the questionnaire
Variable Name
Research Question
Item on Questionnaire
Main source of drinking
water
What was the main source of water
for participants during the study
period? Question # 1
See Questions 1 A, B, C,
and D: Piped communal,
Open well, covered well,
Surface water
Water storage and
treatment
How did participants treat and store
their water before use? Question #2
See Questions 3, 4 and 6:
Closed, open container,
add chlorine, boiling
Type of toilet facilities
and sharing.
What type of toilet facilities existed
in Chawama Township during the
study period, and were they shared
with neighbors? Question #3
See Questions 11, and 12
Flush toilet, Traditional
pit, VIP latrine, No toilet
Knowledge of diseases
Did the participants have knowledge
of any or all of the water diseases
listed on the questionnaire
(dysentery, diarrhea, cholera, and
typhoid fever? Questions #4
See Questions 13 A, B,
C, and D: dysentery,
typhoid, cholera, and
diarrhea.
Experience and
suffering from
waterborne diseases
Did any of the study participants or
household member, or neighbor
suffer from any of the waterborne
diseases listed on the questionnaire?
Question #5
See Questions 14A,B, C,
F. Responses: Yes, No.
4.10.7 Data Processing and Analysis
The data processing of the questionnaire results began following the completion
of the fieldwork. Completed questionnaires were returned from Zambia to the United
States where they were entered and analyzed using the PASW Statistics 18.0 (1993-2008)
software. For the analysis of the data, independent variables used in the analysis include
gender, age, level of education, source of drinking water, and knowledge of waterborne
diseases. In the data analysis process, descriptive statistics was used to describe the
sample. Descriptive statistics included cross tabulations and frequency table that showed
the percentages of variables derived from the questionnaire. Cross tabulation tables were
used to analyze the differences between variables of interest.

48
4.11 Summary
This chapter provided a description of the steps involved in carrying out this
research study. The informed consent procedures and steps taken to maintain
confidentiality were described. The study sample and the administration of the
questionnaire used to collect data were also highlighted. Variables, research questions,
and items on a Questionnaire including method of sampling were discussed. Recruitment
procedure and data processing and analysis were fully described

49
5 CHAPTER FIVE - SURVEY RESULTS
5.1 Introduction
This study sought to answer the five research questions (Refer to Table 4.2). It
also provides a descriptive summary of some of the demographic characteristics of the
population such as gender, marital status, age and level of education. The questionnaire
was used to collect information from the participants. This information was essential for
the interpretation of the study questionnaire results.
5.2 Demographic Characteristics
Demographic variables are the primary basis of classification in vital statistics and
surveys (Zambia Demographic and Health Survey 2003). A total of 400 questionnaires
were collected from the study participants. During the data cleaning process, 9
questionnaires were discarded for incompleteness and uncoordinated responses.
Consequently, a total of 391questionnaires were admitted for analysis.
5.2.1 Age and Gender of participants (Questions 15 and 16, Section C)
The demographic characteristics of the sample (N=391) are shown in Table 5.1.
The data shows that there were more females than males who participated in the survey.
There were 271females (69.3 percent), and 120 males (30.7 percent) giving a total of
391participants. The number of participants 31 to 40 years (n=124) was higher than those
reported for other age groups while the number of the participants 60 years and over
(n=40) was the lowest.

50
Table 5-1 Percentages of females and males in various age groups
Ages of Participants in years
Gender 19 years 20-30
years
31-40
years
41-50
years
60 years
and over
Total
Male 33.3%
(n =15)
33.0%
(n = 31)
24.2%
(n = 30)
31.8%
(n = 28)
60.0%
(n = 24)
30.7%
(n = 120)
Female 66.7%
(n = 30)
67.0%
(n = 63)
75.8%
(n = 94)
68.2%
(n = 60)
40.0%
(n = 16)
69.3%
(n = 271)
Total 100%
(n=45)
100%
(n=94)
100%
(n=124)
100%
(n=88)
100%
(n=40)
100%
(n=391)
5.2.2 Participants Levels of Education (Question 18, Section C)
In this study, information on education attainment was collected for the
participant who filled out the questionnaire. The results are presented in Table 5.2. The
collected data shows that the number of participants who had attained grade 9 level of
education was high (n=109). The results also show that the rate of females was high in all
of the levels of education 69.3 percent (n=271) compared to 30.7 percent (n=120) of their
male counterparts. The number of participants with a university level of education was
the lowest (n=31).

51
Table 5-2 Percentages of level of education of males and females participants
Education level of Participants
Gender Grade 7 Grade 9 Grade
12
Institute College University Total
Male
23.8%
(n =15)
22.9%
(n =25)
31.1%
(n =32)
43.6%
(n =17)
34.8%
(n =16)
48.4%
(n =15)
30.7%
(n =120)
Female 76.2%
(n =48)
77.1%
(n = 84)
68.9%
(n = 71)
56.4%
(n =22)
65.2%
(n =30)
51.6%
(n =16)
69.3%
(n =271)
Total 100%
(n =63)
100%
(n =109)
100%
(n =103)
100%
(n =39)
100%
(n =46)
100%
(n=31)
100 %
(n =391)
5.2.3 Participants Marital Status (Question 17, Section C)
Marital status is an important aspect of the value system upon which individuals,
married, single, separated, or widowed are revered. Marital status is deemed to be the
pillar of family life and a driver of societal values. Care for the sick, and ability to tackle
community problems are all viewed in the context of the marital status of an individual.
In Zambia, the married and the widowed are held in higher esteem than the separated and
the single. The results of the marital status responses are presented in Table 5.3.
The results show that the majority of the participants were married (48.6 percent).
This shows that the family system is still strong and intact. Notably though, the
percentage of the widowed was relatively high (15.1 percent).

52
Table 5-3 Percentages of marital status
Marital Status
Count Married Divorced Separated Widow/
widower
Single Total
Percentages 48.6% 10.0% 7.9% 15.1% 18.4% 100%
Numbers (n=190) (n=39) (n=31) (n=59) (n=72) (391)

53
5.2.4 Participants Water Source and Preventive Measures
The most common sources of water for the Zambian households are open wells,
protected wells, communal taps, rivers and streams. In urban areas, most drinking water
comes from piped sources and wells (Zambia Demographic and Housing Survey 2003).
Water quality has a strong impact on the health of household members, particularly
young children. A source of water is important because potentially waterborne diseases,
such as typhoid fever, cholera, and dysentery, are prevalent in unprotected sources. Water
supply sources expected to be relatively free of these diseases are piped water and water
drawn from protected wells and deep boreholes. Other sources, such as communal tap,
unprotected and shall wells, and surface water (rivers, ponds and lakes) is more likely to
carry disease-causing agents (Zambia Demographic and Housing Survey 2003).
The first research question concerned the main source of water for participants
during the study period. They were asked to identify their source of drinking water. The
results (Table 5.4) show that the most common source of water for the study participants
was communal city taps 61.4 percent (n=232). Slightly half, 29.6 percent (113) got their
water from piped city water. The remainder got their water from various other sources.

54
Table 5-4 Participants Main Source of Drinking Water
Participants Main Source of Drinking Water
Piped city
water
Communal
city tap
Open well
in yard
Protected
well in yard
Total
Percentage 29.6% 61.4% 3.3% 5.4% 96.7%
Number (112) (232) (13) (21) (378)
*missing 3.35% (n=13)
5.2.5 Water Treatment and Storage before Use
The second question asked participants how they treated their water; and how
they stored it to make it safe for use. Residents in the study area store their water in open
or closed containers. This is done because there is not enough water to run throughout the
day, or it has to be fetched from a communal tap which may be situated a long distance
away from the residential house.
Participants were asked whether they boiled their water before using it as a
precaution to making it safe for use (Research Question #2). The results (Table 5.5) show
that 62.2 percent (n=130) of those who got water from the communal city tap did not boil
it while 64.8 percent (n=94) from the same water source (communal tap) indicated that
they boiled their water some of the time. Of those using piped water, only 35.4 percent
(n=74) did not boil their water.

55
Table 5-5 Percentages of various sources of water by boiling it before use
Boiling Water Main source of drinking Water
Protected
yard well
Piped city
water
Communal
city tap
Open well
in yard
Total
No
35.4%
(n =74)
62.2%
(n =130)
1.0%
(n =2)
1.4%
(n=3)
100%
(n=209)
Yes, some of the
time
24.1%
(n =35)
64.8%
(n =94)
4.8%
(n =7)
6.2%
(n =9)
100%
(n=145)
Yes, most of the
time
10.8%
(n =4)
54.1%
(n=20)
10.8%
(n =4)
24.3%
(n =9)
100%
(n=37)
5.2.6 Source of water and Chlorine use
Chlorine is used to purify water by adding measured drops or powder sachets in a
container of water. Participants were asked whether they added chlorine to their water
before using it (Research Question #2). The results are shown in Figure 5.6. The results
show that a fairly larger number of participants (n=202) who got their water from various
sources did not add chlorine to it. Of those who drew water from communal sources,
66.8 percent (n=135) did not add chlorine.

56
Table 5-6 Percentages of main water source by participant chlorine use
Main Source of Water
Adding
Chlorine
Piped city
water
Communal
city tap
Open well
in yard
Protected
well in yard
Total
No
25.2%
(n=51)
66.8%
(n=135)
3.0%
(n=6)
5.0%
(n=10)
100%
(n=202)
Yes, some of
the time
32.8%
(n=62)
57.7%
(n=109)
3.7%
(n=7)
5.8%
(n=11)
100%
(n=189)
5.2.7 Source of Water and Storage
Participants were asked to indicate how they stored their water before they used it
(Research Question #2). Table 5.7 shows that a high number of participants (n=222)
stored their water in closed containers. Of these 61.5 percent (n=104) of those who got
water from communal taps stored it in open containers.

57
Table 5-7 Source Drinking Water by Storage
Main Source of Water
Water Storage Piped city
water
Communal
city tap
Open well in
yard
Closed well
in yard
Total
Closed container
32.9%
(n=73)
63.0%
(n=140)
1.4%
(n=3)
2.7%
(n=6)
100%
(n=222)
Open container 23.7%
(n=40)
61.5%
(n=104)
5.9%
(n=10)
8.9%
(n=15)
100%
(n=169)
5.3 Participants Type of Toilet Facilities and Sharing with Neighbors
To address the third question, participants were asked about the type of toilet
facilities they had and whether they shared with neighbors. Table 5.8 shows that 36.9
percent of the participants had traditional pit latrines. These findings give support to the
problem of water related diseases. Notably, the percentage of participants (17.1%) who
did not have toilet facilities was relatively high.
Table 5-8 Participants Type of Toilet Facilities
Traditional Pit
Latrines
Flush Toilet Ventilated
Improved
Latrine
No Toilet
Facility
Total
36.9%
(n=142)
18.4%
(n=71)
27.5%
(n=106)
17.1%
(n=66)
98.5%
(n=385)
Missing 1.5% (n=6)

58
5.3.1 Sharing of Toilet Facilities
The sharing of toilet facilities with neighbors was explored to find out if it was
common. The sharing of such facilities is a potential vehicle for waterborne disease
outbreaks. Table 5.9 shows that participants with traditional (74.5%) and those with
ventilated improved (63.2%) latrines generously shared their toilets facilities with
neighbors. These findings give support to potential spread of waterborne diseases.
Table 5-9 Type and Sharing of Toilet Facilities
Sharing Toilet Facility Traditional Pit Latrine Flush Toilet Ventilated Improved
Latrine
Yes 74.5%
(n=105)
22.5%
(n=16)
63.2%
(n=67) No 25.5%
(n=36)
77.5%
(n=55)
36.8%
(n=39)
Total 100% 100% 100%
5.4 Participants Knowledge of Waterborne Diseases
The fourth research question concerned the participants‘ knowledge of
waterborne diseases listed on the questionnaire. Knowledge is important for purposes of
diseases prevention and care. Table 5.10 shows that the two well-known waterborne
diseases among the participants were cholera and diarrhea with 94.6 percent knowledge
rate. More than two thirds of the participants have heard or were aware of these
waterborne diseases.

59
Table 5-10 Distribution of disease knowledge
Various waterborne diseases
Knowledge/awareness
of the diseases
Cholera
Diarrhea
Dysentery
Typhoid
Fever
Percentage
94.6
94.6
67.8
68
Number 369 367 251 246
5.4.1 Participants’ Experience with Waterborne diseases
The fifth question addressed the question of whether study participants ever heard
of any of their neighbor's household member who suffered from dysentery, typhoid,
diarrhea or cholera. Experience of the disease meant either a participant heard about a
neighbor who suffered or a member of their households or the participants themselves.
This was intended to relate their knowledge of the diseases to their real life experiences.
Table 5.11 shows that almost 50 percent (47.9%) of the participants indicated that they
had knowledge of a neighbor or family member who suffered from a waterborne disease
in the past six months prior to the survey. These findings suggest that participants were
well aware of the effects of these diseases.

60
Table 5-11 Percentages of participants knowledge of neighbor experience of waterborne diseases
Hearing of neighbor suffer from
waterborne diseases
Yes No Total
Percentage 47.9 52.1 100
Number
(186)
(202)
388
Missing .8% (n=3)
5.4.2 Knowledge of experience of household or neighbors who died of the diseases
Participants were asked whether they were aware of a neighbor or household
member who had died from a waterborne disease. Of those who participated (Table 5.12)
74 percent denied knowledge of a neighbor dying from a waterborne disease. The
remainder (26%) indicated they had heard of someone who had died.
Table 5-12 Percentage of household who died from waterborne Diseases
Experience of neighbors who died
from waterborne diseases
Yes No Total
Percentage 26 74 100
Number (101) (288) (389)
*Missing .5% (n=2)

61
5.5 Participant knowledge of cholera by Level of Education
Participants‘ knowledge of cholera was compared with level of education. It was
expected that those with a higher level of education were likely to be more aware of the
diseases. Table 5.13 shows that in Chawama Township, the level of education did not
matter. Almost every household had knowledge of cholera.
Table 5-13 Knowledge of Cholera disease by level of Education
Level of Education
Knowledge
( Cholera)
Grade 7 Grade 9 Grade 12 Trades College University Total
Yes 92.1%
(n=58)
94.5%
(n=103)
96.1%
(n=99)
92.3%
(n=36)
100%
(n=46)
90.3%
(n=28)
94.6%
(n=370)
No 7.9%
(n=5)
5.5%
(n=6)
3.9%
(n=4)
7.7%
(n=3)
0%
(n=0)
9.7%
(n=3)
5.4%
(n=21)
Total 100%
(n=63)
100%
(n=109)
100%
(n=103)
100%
(n=39)
100%
(n=46)
100%
(n=31)
100%
(n=391)
5.6 Knowledge of Typhoid Fever by Level of Education
Table 5.14 compared participant knowledge of typhoid fever with level of
education. The idea was to find out if there was a relationship between knowledge of
typhoid and level of education. The results show that level of education did not matter.
These findings support the idea that residents had lived with the diseases well enough to
attain extra knowledge to know them.

62
Table 5-14 Knowledge of Typhoid Fever by level of Education
Participant Level of Education
Knowledge
of Typhoid
Grade 7 Grade 9 Grade 12 Trades College University Total
Yes 60.3%
(n=38)
75.2%
(n=82)
66.0%
(n=68)
61.5%
(n=24)
73.9%
(n=34)
61.3%
(n=19)
67.8%
(n=265)
No 39.7%
(n=25)
24.8%
(n=27)
34.0%
(n=35)
38.5%
(n=15)
26.1%
(n=12)
38.7%
(n=12)
32.2%
(n=126)
Total 100.0%
(n=63)
100.0%
(n=109)
100.0%
(n=103)
100.0%
(n=39)
100.0%
(n=46)
100.0%
(n=31)
100.0%
(n=391)
63
6 CHAPTER SIX - DISCUSSION AND RECOMMENDATIONS
6.1 Discussion
Zambia is endowed with plentiful water resources mainly from the rivers, lakes,
wetlands, and groundwater. For instance, the basin of the Zambezi River covers around
three-quarters of the country. The problem of attaining clean and safe water therefore
goes beyond the availability of the liquid water.
The first question of this study was to assess the main source of water for
residents of Chawama, Lusaka. In the study sample of 400 participants, it was found that
most of the residents got water from a communal tap (61.4%), suggesting that the risk of
public health exposure was high. Findings from the study clearly revealed that the
residents had an overwhelming knowledge of waterborne diseases (94.6%). The familiar
waterborne diseases to them include cholera, diarrhea, dysentery, and typhoid fever.
Whereas they had this knowledge, it was noted from the study results that most of the
residents did not boil (62.2%) or add chlorine (66.8%) to make the water safe for use.
Therefore, this situation suggests that residents of Chawama Township are not doing
enough to prevent outbreaks of waterborne diseases. One of the more interesting
outcomes was the large number of widowed residents, and this could be attributed to the
AIDS epidemic.
The housing arrangements in Chawama township coupled with the area‘s prone
to flooding during the rainy season, and densely populated neighborhoods characterized
by lack of properly functioning sewerage systems and solid waste collection makes it a
public health hazard as well as problematic to development of water supply
infrastructure.

64
Education attainment is a key determinant of the lifestyle and status an individual
enjoys in a society. It is, for instance, one of the key indicators of the status of women as
indicated in an International Labor Organization (ILO) briefing kit (ILO 1995).
Furthermore, studies consistently show that educational attainment has a substantial
effect on disease prevention measures, attitudes and awareness to hygiene (Zambia
Demographic and Health Survey 2003, 15).
Formal education in Zambia is based on a three tier system: primary education
consisting of 7 years, junior secondary school consisting of 2 years, and senior secondary
school consisting of 3 years. Upon completion of secondary school, an individual may
choose to move up the education ladder by either going to the university for 4 to 7 years,
depending on the field of study, and obtain a degree, or choose to attend a vocational or
technical institute for a two to three-year certificate/diploma course. In this study,
although females seem to be more educated than the males, the reality might lie in the
fact that female were the majority who participated in the survey, suggesting that men
might not have been at home. Furthermore, results show that women play a major role in
securing water in the household. This can be explained by the cultural role in which
females tend to be in charge of domestic roles more than their male counterparts.
Level of education seems not to have any bearing to the knowledge of
waterborne diseases and treatment of water. This finding seems to be inconsistent with
education being a key determinant of the lifestyle and status individual enjoy in a society.

65
6.2 Recommendations
The findings of this study point to some important policy implications. For
instance, access to clean and safe drinking water for the majority of urban dwellers
requires effort from the community and policy makers. It also suggests paying great
attention to water-handling methods by sensitizing households to healthy behaviors
particularly in the water collection and storage conditions. Second, as most individuals
use water directly from available sources without any form of treatment, and may,
therefore, be exposed to various water-related diseases, it seems logical to suggest that
current regulations be revised to include water-quality testing.
Public health concerns due to the problem of attaining clean and safe water are
influenced by the source, treatment and storage of water, toilet facilities and knowledge
of waterborne diseases. Based on this, the following are recommendations for
intervention into waterborne diseases among residents of Chawama Township, Lusaka.
(1) Although Zambia has made important advances in regulatory and institutional
reforms, there must be a continued reviewing and implementation of the national
water policies rather than just having them on paper.
(2) Health education programs need to focus on empowering women because of their
major role in securing clean and safe water for households.
(3) The government need to develop policies that encourage cooperating partners to
work directly with communities.
(4) The government needs to develop and encourage a policy that lets water
providers to work directly with residents on how best they can be provided and
pay for the water supply.

66
(5) Although hygiene education programs are being incorporated in water and
sanitation programs to raise awareness about waterborne diseases and to promote
positive hygienic practice, the government should put more effort in this area
particularly during the rainy season.
(6) There is need to have public fee paying toilets at strategic points in Chawama
which could at least be open to the public up to 22.00 hours.
6.3 Limitation and Value of the Research Study
6.3.1 Limitation of the Study
This is the first known study that explored the problem of attaining clean and safe
water in Chawama Township, Lusaka, Zambia. This makes the findings to be limited in
scope. However, it has highlighted potential relationship between attaining safe water and
waterborne diseases. Although the questionnaire started with a pilot phase to assess its
suitability, the study did not examine cultural considerations that may have hindered or
enhanced the research study. Such studies will require a much deeper understanding of
certain aspects of the Zambian culture hidden in its 73 languages and how these affect
questionnaire responses. For example, sample size did not allow for the exploration of
differences in attitudes toward water and diseases as held by individual cultural group.
It is therefore, important to consider some limitations that may affect the
generalizability of the results of this study. These limitations point to opportunities for
further studies on this topic among peri-urban residents in Zambia.
First, there is need to further develop and refine the questionnaire to be able to
adequately assess the problem of attaining safe water and waterborne diseases, attitudes

67
and situations that could lead to adequate disease prevention behaviors. Second, it would
be useful to assess more accurately the involvement of males in handling water problems.
Third, this research focused on the problem of attaining safe water and waterborne
diseases without paying much attention to factors such as poor or lack of drainage system
which lead to flooding. This is a limitation because waterborne diseases can be spread by
mediums other than directly ingesting dirty water. For example consuming of unwashed
fruits or vegetables can lead to cholera or dysentery infection.
6.3.2 Value of the Research Study
Although the study has limitations, it also has value to the water sector and
cooperating partners as follows: (1) a clear understanding of the link between unsafe
water and waterborne diseases can help designing disease interventions that can shape
attitudes and practices among water users, (2) findings of the study are useful to water
providers for purposes of planning, management and evaluation of water supply services,
(3) the information from the study is helpful to health systems to monitor trends and
respond decisively to curb the problem of water-borne diseases, (4) the study provided
opportunities for future studies to fill in the gaps that this study could not address, (5)
this study added value to the existing body of knowledge on waterborne diseases and play
a vital role in providing people with information on public health, and (6) this study
highlighted the problem of attaining safe water, and made recommendation to policy and
decision makers on how best the water supply can be improved. These recommendations
are applicable to other peri-urban areas that are in a similar situation.

68
6.4 Future of Research
This research study explored the problem of attaining clean and safe water and
incidence of waterborne diseases. The literature in this area is abundantly available.
Future research should include other variables that could impact the interaction and
interpretation of unsafe water and waterborne diseases. Suggestions for further research
include examination of (1) how water and disease interact to cause an illness, (2) in spite
of knowing about waterborne diseases, why residents have not taken seriously measures
to prevent the diseases, (3) whether redesigning the township would work to solve the
water and disease problems?
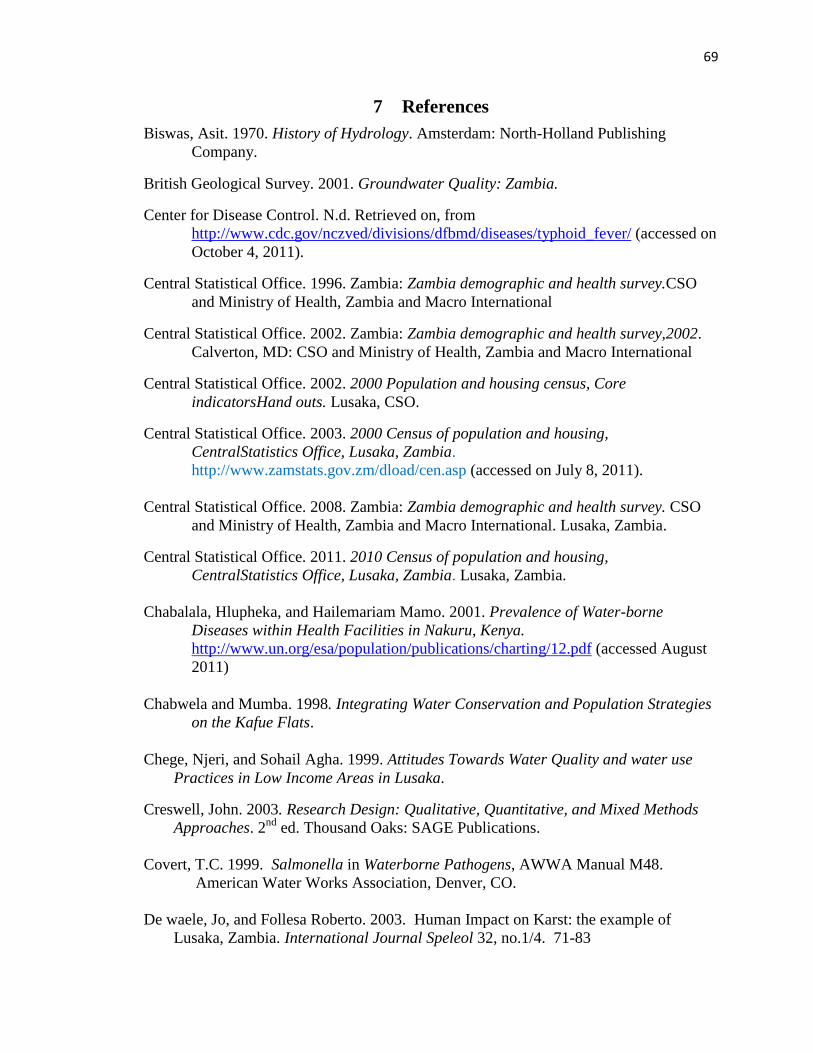
69
7 References
Biswas, Asit. 1970. History of Hydrology. Amsterdam: North-Holland Publishing
Company.
British Geological Survey. 2001. Groundwater Quality: Zambia.
Center for Disease Control. N.d. Retrieved on, from
http://www.cdc.gov/nczved/divisions/dfbmd/diseases/typhoid_fever/ (accessed on
October 4, 2011).
Central Statistical Office. 1996. Zambia: Zambia demographic and health survey.CSO
and Ministry of Health, Zambia and Macro International
Central Statistical Office. 2002. Zambia: Zambia demographic and health survey,2002.
Calverton, MD: CSO and Ministry of Health, Zambia and Macro International
Central Statistical Office. 2002. 2000 Population and housing census, Core
indicatorsHand outs. Lusaka, CSO.
Central Statistical Office. 2003. 2000 Census of population and housing,
CentralStatistics Office, Lusaka, Zambia.
http://www.zamstats.gov.zm/dload/cen.asp (accessed on July 8, 2011).
Central Statistical Office. 2008. Zambia: Zambia demographic and health survey. CSO
and Ministry of Health, Zambia and Macro International. Lusaka, Zambia.
Central Statistical Office. 2011. 2010 Census of population and housing,
CentralStatistics Office, Lusaka, Zambia. Lusaka, Zambia.
Chabalala, Hlupheka, and Hailemariam Mamo. 2001. Prevalence of Water-borne
Diseases within Health Facilities in Nakuru, Kenya.
http://www.un.org/esa/population/publications/charting/12.pdf (accessed August
2011)
Chabwela and Mumba. 1998. Integrating Water Conservation and Population Strategies
on the Kafue Flats.
Chege, Njeri, and Sohail Agha. 1999. Attitudes Towards Water Quality and water use
Practices in Low Income Areas in Lusaka.
Creswell, John. 2003. Research Design: Qualitative, Quantitative, and Mixed Methods
Approaches. 2nd
ed. Thousand Oaks: SAGE Publications.
Covert, T.C. 1999. Salmonella in Waterborne Pathogens, AWWA Manual M48.
American Water Works Association, Denver, CO.
De waele, Jo, and Follesa Roberto. 2003. Human Impact on Karst: the example of
Lusaka, Zambia. International Journal Speleol 32, no.1/4. 71-83

70
Dingman, Lawrence. 2002. Physical Hydrology. 2nd ed. Long Groove: Waveland Press.
GKW. 2005. Baseline Study on Water Supply and Sanitation for Peri-Urban and
LowCost Areas in Zambia. National Water and Sanitation Council & Devolution
Trust Fund, Lusaka, Zambia. http://[email protected] (accessed on July
8, 2011).
Gleick, Peter. 2002. Dirty Water: Estimated Deaths from Water-Related Disease 2000-
2020.Pacific Institute Research Report.
http://www.pacinst.org/reports/water_related_deaths/water_related_deaths_report.
pdf (accessed July 10, 2011).
Hall, David, and Emanuele Lobina. 2006. Pipe dreams: The Failure of the Private Sector
to invest in Water Services in Developing Countries. World Development
Movement. http://www.wdm.org.uk (accessed on July 7, 2011).
Human Research Protections Policies and Procedures. 2008. University of Nebraska-
Lincoln.
Hunter, Paul, Alan McDonald, and Richard Carter. 2010. Water Supply and Health. PLoS
Medicine 7, no. 11 (November). http://www. www.plosmedicine.org (accessed on
July 19, 2011).
International Labor Office (ILO). 1995. Gender Issues in the world of work: Briefing Kit.
INT/93/MO9/NET. Geneva Switzerland.
Janz, Nacy, and Marshal Becker. 1984. The Health Belief Model: A Decade Later.
Health Education Quarterly 11, no. 1.
Japan International Cooperation Agecy (JICA) Report. 1995. The Study on the National
WaterResourcess Master Plan in the Republic of Zambia. Ministry of Energy and
Water Development, YEC.
King, Thomson. 1953. Water: Miracle of Nature. New York: MacMillan Company.
Lusaka City Council – Environmental Council of Zambia (ECZ), 2008. Lusaka City state
of environment outlook report. Lusaka, Zambia. 91p.
Mahvi, A. and H. Karyab. Risk assessment for microbial pollution in drinking water in
small community and relation to diarrhea disease. American-Eurasian. Journal of
Agricultural and Environ Science, no.2. (2007). 404-6.
Mancosa. 2000. Research Methods: MBA Year 2. Durban, South Africa.
Matlock, Marty. 2007. Water profile of Zambia. Encyclopedia of Earth.
http://www.eoearth.org/article/Water_profile_of_Zambia (accessed on July 10,
2011).

71
McDaniel C. and R. Gates. 1995. Marketing Research Essentials. New York: West
Publishing Company.
Mpamba, N. 2006. Comparative Analystical Model for Groundwater Monitoring in the
Urban and Rural area of Zambia. Groundwater Resources Data and Information,
School of Mines; The University of Zambia.
Mpamba, N, D. Nkhuwa, nyambe, C. Mdala, and I. 2008. Groundwater Mining: A reality
for the Lusaka urban aquifers. In Applied Groundwater Studies in Africa,
ed.Adelana, Segan, Alan MacDonald, and Tamiru Abiye, 278-289. London: CRC
Press.
Mpamba, N., I. Nkhuwa and Wohnlich, S. (2008). Groundwater Mining: A Reality forthe
Lusaka Urban Aquifers? Applied Groundwater Studies in Africa. Selected Papers
on Hydrology 13. Editors: Adelana, S.. MacDonald, A., Abiye, T., &
Tindimugaya, C. Taylor & Francis Group, London, UK.
Monnette, Duane, Thomas Sullivan, and Cornell Dejong. 2005. Applied Social
Research:A tool for the Human Services. 6th
ed. Belmont, California:
Thomson Brookes/Cole.
Montgomery, Carla. 2008. Environmental Geology. 8th
ed. New York: McGraw-Hill.
Mayumbelo, K., and Münch, Evon, 2008. Methodology to Compare Costs of
SanitationOptions for Low-income Peri-urban areas in Lusaka, Zambia 33, no. 5
(October). http://www.wrc.org.za (accessed on July 8, 2011).
Museteka, Levy, and Roland, Bäumle. 2008. Development of a Groundwater Information
& Management Program for the Lusaka Groundwater Systems.National Water
Supply and Sanitation Council. 2006.
National Cancer Institute. 2005. Theory at a Glance: A Guide for Health Promotion
Practice.
National Water Law. 1994. Government of Zambia, Lusaka: Ministry of Energy and
Water Development
National Water Resources Report. 2009. Ministry of Energy and Water Development.
Negri Stefania. 2005. Waterborne Disease Surveillance: The Case for a Closer Interaction
Between the UNECE Protocol on Water and Health and the International Health
Regulations. International Community Law Review 12 (2010) 287–302.
Nkhuwa, D. 1996. Is groundwater Management still an achievable task in the Lusaka
aquifer? Proceedings of the XXXIX. Conference of the IAH Bratislava, Slovak
Republic, 209-213.
Nkhuwa, D. 2003. Hydrogeology and Engineering Geological Problems of Urban
Development over karstified marble in Lusaka, Zambia. RMZ Matrials and
Geoenvironment, 50, 273-276.

72
Northern Rhodesia. 1964. Hansard National Assembly Proceedings. 2d serv, Vol. 145.
Roy, Welensky. Address to the House, July 18.
Nyambe, Imasiku and Miriam Feilberg. 2009. Zambia – National Water Resources
Report for WWDR3. Ministry of Energy and Water Development.
O‘Sulliavan, Elizabeth, Gary Rassel, and Maureen Berner. 2008. Research Methods
forPublic Administrators. 5th
ed. New York: Pearson Education Inc.
Perlin, David and Ann Cohen. 2002. The Complete Idiot's Guide to Dangerous Diseases
and Epidemics. Royersford, PA: Alpha Publishing House.
Phiri, Zebediah. 2000. Water Law, Water Rights and Water Supply in Zambia – Issues
And Perspectives. 1st WARFSA/Water Net Symposium: Sustainable Use of
Water Resources, Maputo, 1-2 November.
Rosen, George. 1993. A History of Public Health. Baltimore: John Hopkins University
Press.
Sasaki, Satoshi, Hiroshi Suzuki, Kumiko Igarashi, Bushimbwa Tambatamba, and Philip
Mulenga. Spatial Analysis of Risk Factor of Cholera Outbreak for 2003–2004 in
a Peri-urbanArea of Lusaka, Zambia. Am. J. Trop. Med. Hyg., 79(3), 2008, pp.
414–421
Sack, D, Sack R, Nair G.H, and Siddique A.K. 2004. Cholera. Lance t363: 897–898.
Suresh, K., and H. Smith n.d. Tropical organisms in Asia/Africa/South America
Tuite, shleigh et al. 2011. Cholera Epidemic in Haiti, 2010: Using a Transmission
Modelto Explain Spatial Spread of Disease and Identify Optimal Control
Interventions. Annals of Internal Medicine 154, no. 9 (March). www.annals.org
(accessed July 8, 2011).
Tumwine, J, M. Katua-Katua, and M. Mujwajuzi. 2002. Diarrhea and Effects ofDifferent
Water Sources, Sanitation and Hygiene Behaviour in East Africa. Tropical
Medicine International Health, no. 7. 750-6.
UNICEF. N.d. Charting the Progress of Populations
UN Population Division. 2004. Access to Safe Water.
qhttp://www.un.org/esa/population/publications/charting/12.pdf (accessed on July
9, 2011).
United Nations. 1989. Groundwater in Eastern, Central and Southern Africa. Natural
Resources/Water Ser.19. New York: UN Publication.
United Nations Children‘s Fund (UNICEF)/World Health Organization (WHO). 2009.
Diarrhoea: Why Children are still dying and what can be done. WS 312. Geneva:
WHO Press.
United States Agency for International Development. 2006. Zambia Water and Sanitation
Profile. http://www.usaid.gov (accessed July 6, 2011).

73
Walton, William. 1970. The World of Water. Birkenhead, London: Willmer Brother
Limited.
Water Law, Water Rights and Water Supply in Zambia – Issues and Perspectives. International Network for Environmental Justice in
Africa.2010http://www.bvsde.paho.org/bvsacd/cd46/zambia.pdf (accessed on
July 10, 2011)
World Health Organization. 2000. Global Water Supply and Sanitation
AssessmentReport. Geneva: WHO
Press.http://www.who.int/water_sanitation_health/Globassessment/GlobalTOC.ht
m (accessed on July 7, 2011).
World Health Organization. 2006. Guidelines for drinking-water quality. WA 675.
Geneva: WHO Press.
World Health Organization. 2007. Combating Waterborne Disease at the Household
Level/ International Network to Promote Household Water Treatment and Safe
Storage. WA 675. Geneva: WHO Press.
WRAP (Water Resources Action Programme). 2005. Zambia Water Resources
Management Sector Report for 2004. Ministry of Energy and water
Development, Lusaka, Zambia.
Yongsi, Nguendo. 2010. Suffering for Water, Suffering from Water: Access toDrinking-
water and Associated Health Risks in Cameroon. Journal of Health popul
nutrition. (2010) Oct; 28(5):424-435
Zulu, J. and I. Nyambe. 2004. Karstified Lusaka Marble aquifer, Zambia:
Implicationson Groundwater Contamination and Community Management in
Kanyama Settlement. In Abstract Volume, International Geological Congresss,
Florence, Italy.

74
8 APPENDEX A - Questionnaire
Hello, my name is ________________________ and I am working with Passmore
Mudundulu, a student researcher at the University of Nebraska in the USA. We are
conducting a survey about drinking water and high incidence of water borne diseases
some of which lead to death. We would very much appreciate your participation in this
survey, but please understand that your participation is strictly voluntary. You will not be
compensated for your participation and will not receive any direct benefits. I would like
to ask you about your sources of drinking water, what you know about water borne
diseases, if you or any of your family members or neighbors has had any of these
diseases and what the effects of those diseases were. I will also ask you some
demographic questions. You may feel some emotional distress when answering
questions about your family members or neighbors. Please understand that this is not a
government-based study. The information from this study will be used to create
recommendations for government policy guidelines to plan clean water services. Any
individual information you provide in this study will be kept strictly confidential. Your
decision whether or not to participate will not affect any benefits to which you are
entitled, or any relationship with the researcher or the government or cooperating
partners. By completing the survey you are showing consent to participate.
Do not write your name or house number or any identifying information on this
questionnaire.
Please indicate your response to the following questions by placing an X in the
appropriate box.
Section A. Source of Drinking water
1. What is the main source of drinking water for members of your household?
A. Piped water
Piped water into dwelling (house)
Piped water into yard or plot
Communal tap
B. Water from open well
Open well in yard or plot

75
Open public well
C. Covered well or borehole
Protected well in yard or plot
Protected public well (City council or NGO provided well)
D. Surface Water
River/stream
Pond/lake/dam
Rainwater
E. Tanker truck
F. Bottled water
G. Other (specify)
2. How long does it take you to go there, get water, and come back?
15 minutes 30 minutes One hour More than 1 hour
3. How do you store your drinking water?
Closed container/ ―Budiza‖ Open container/bucket Other____________
4. Do you usually boil your drinking water?
Yes, most of the time Yes, some of the time No
5. Have you ever seen or heard of a product called Chlorine—a liquid that can be used to
make water safe to drink? Yes No
6. Is your household water currently treated with chorine?
Yes No

76
7. Do you care about the source of your household drinking water? Yes No
8. If the city council piped water was supplied to your household, would you be willing to
pay for the service? Yes No
9. If you answered yes in number 8, how much would you pay per month for your water
bill?
K5000 – K15000 K15000 – K25000 K25000 - K35000 K35000 or
more
10. If the city council water is currently supplied to your household, how frequently do
you receive the supply? 2-6 hours daily 24 hours daily None
Other___
11. What kind of toilet facilities does your household have?
Flush toilet Traditional pit latrine Ventilated Improved Pit latrine
No toilet facility Other _________________(specify)
12. Do you share these toilet facilities with other households? Yes No
Section B. Incidence of water borne diseases
13. Have you ever heard of any of the following diseases?
A. Dysentery Yes No
B. Typhoid Yes No
C. Cholera Yes No
D. Diarrhea Yes No
14. If you answered yes to any one of the diseases in number 13 above
A. Have you ever heard of any of your neighbor‘s household member who suffered
from dysentery, Typhoid, diarrhea, or cholera? Yes No

77
(i) If yes, when did the most recent incident happen?
Last 6 months Last 12 months Last two years Last five years
(ii) What was the age of that person? Under 5 years Youth Adult
B. Has anyone in your neighbor‘s household died of dysentery, Typhoid, diarrhea,
Cholera?
Yes No
C. Has anyone in your household suffered from any of these diseases? Yes No
D. If yes, when did the most recent incident happen? Last 6 months Last 12
months
Last two years Last five years
E. What was the age of the person? Under 5 years Youth Adult
F. Have you yourself, suffered from any one of them? Yes No
G. If yes, when did the most recent incident happen? Last 6 months Last 12
months Last two years Last five years
H. Has anyone in your household died of dysentery, Typhoid, diarrhea, Cholera?
Yes No
(i) If yes, when did the most recent incident happen?
Last 6 months Last 12 months Last two years Last five years
(ii) What was the age of the person who died? Under 5 years Youth Adult
Section C. Demographics
15. What is your age?
15-19 years 20-30 years 31-40 years 41-50 years Over 60 years

78
16. What is your gender?
Male Female
17. What is your current marital status?
Married
Divorced
Separated
Widow/Widower
Single
18. What is your education level completed?
Grade 7
Grade 9
Grade 12
Institute/Trades
College
University
19. Please indicate the number of people in your household: ______

79
9 APPENDIX B - Zambia Demographic and Health Survey

80

81

82
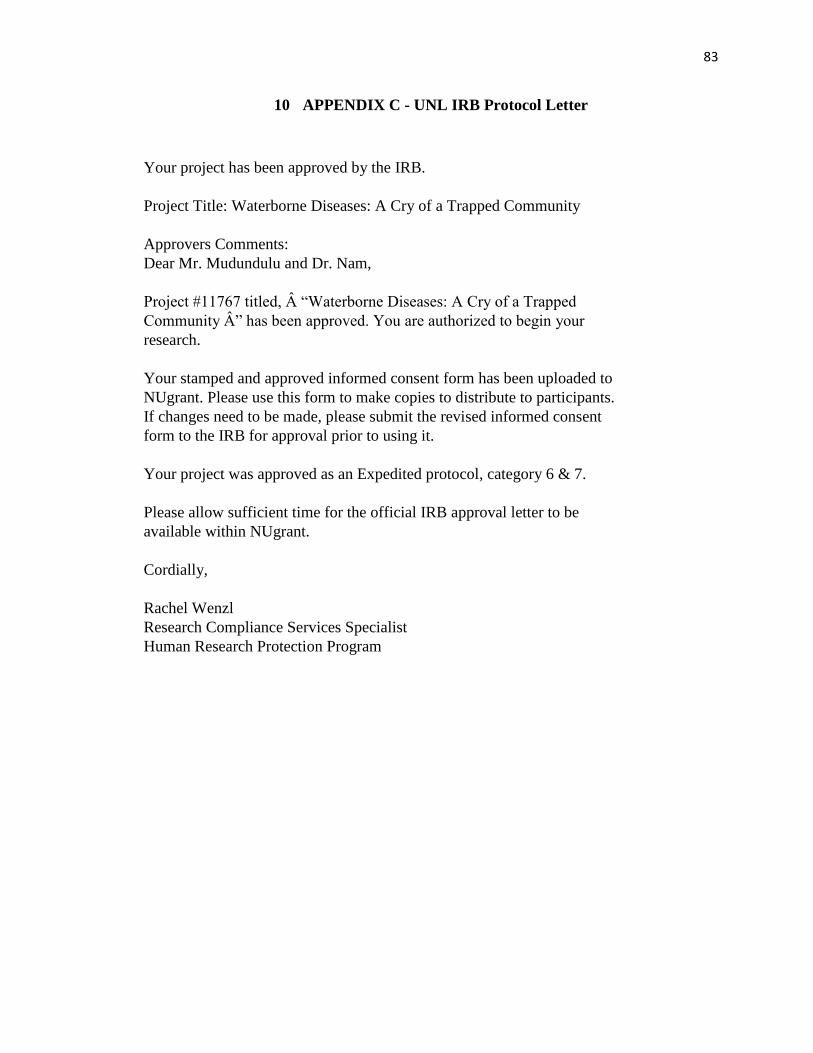
83
10 APPENDIX C - UNL IRB Protocol Letter
Your project has been approved by the IRB.
Project Title: Waterborne Diseases: A Cry of a Trapped Community
Approvers Comments:
Dear Mr. Mudundulu and Dr. Nam,
Project #11767 titled, Â ―Waterborne Diseases: A Cry of a Trapped
Community Â‖ has been approved. You are authorized to begin your
research.
Your stamped and approved informed consent form has been uploaded to
NUgrant. Please use this form to make copies to distribute to participants.
If changes need to be made, please submit the revised informed consent
form to the IRB for approval prior to using it.
Your project was approved as an Expedited protocol, category 6 & 7.
Please allow sufficient time for the official IRB approval letter to be
available within NUgrant.
Cordially,
Rachel Wenzl
Research Compliance Services Specialist
Human Research Protection Program

84
11 APPENDIX D - Lusaka Water and Sewerage Company Letter