Embed Size (px)
Citation preview
United States Department of Agriculture
EconomicResearchService
Glenn D. Schaible and Marcel P. Aillery
Water Conservation in Irrigated Agriculture: Trends and Challenges in the Face of Emerging Demands
Economic Information Bulletin Number 99
September 2012
ww
ww
w.er
s.usda.govoo
Visit Our Website To Learn More!
The U.S. Department of Agriculture (USDA) prohibits discrimination in all its programs and activities on the basis of race, color, national origin, age, disability, and, where applicable, sex, marital status, familial status, parental status, religion, sexual orientation, genetic information, political beliefs, reprisal, or because all or a part of an individual’s income is derived from any public assistance program. (Not all prohibited bases apply to all programs.) Persons with disabilities who require alternative means for communication of program information (Braille, large print, audiotape, etc.) should contact USDA’s TARGET Center at (202) 720-2600 (voice and TDD).
To file a complaint of discrimination write to USDA, Director, Office of Civil Rights, 1400 Independence Avenue, S.W., Washington, D.C. 20250-9410 or call (800) 795-3272 (voice) or (202) 720-6382 (TDD). USDA is an equal opportunity provider and employer.
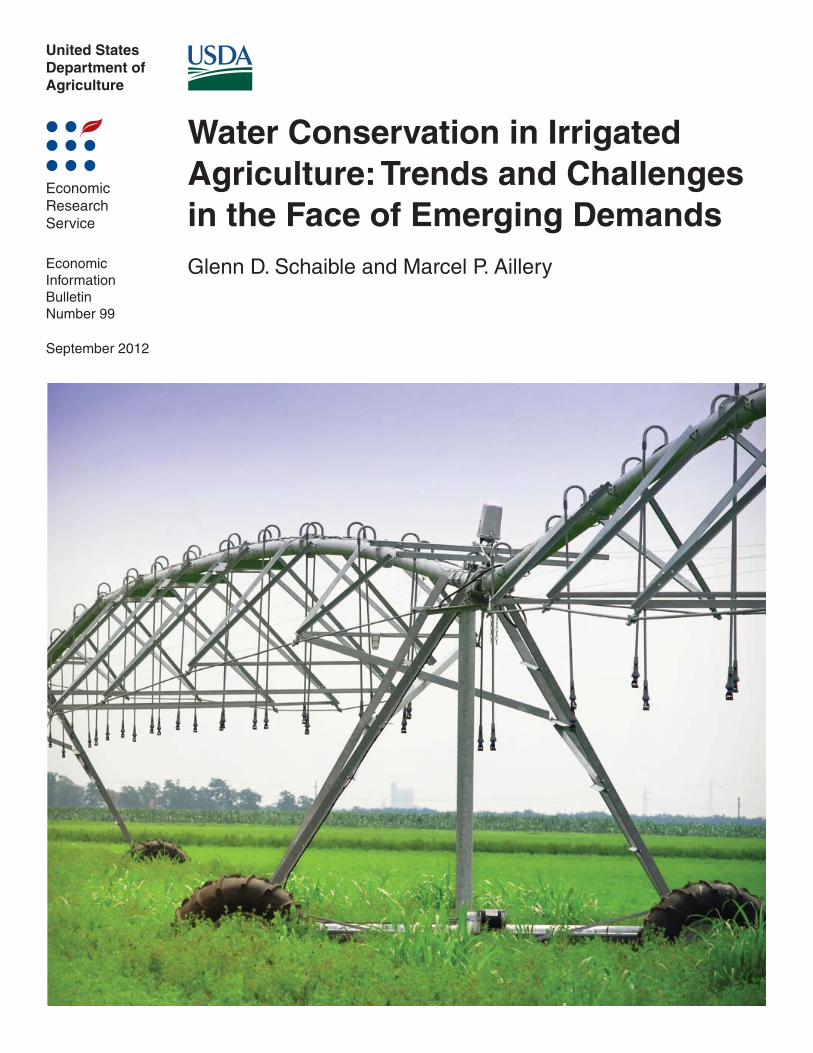
Cover photo credit: Shutterstock.
http://www.ers.usda.gov
Find additional information on this topic:
Use of commercial and trade names does not imply approval or constitute endorsement by USDA.
Recommended citation format for this publication:
Schaible, Glenn D., and Marcel P. Aillery. Water Conservation in Irrigated Agriculture: Trends and Challenges in the Face of Emerging Demands, EIB-99, U.S. Department of Agriculture, Economic Research Service, September 2012.
United StatesDepartmentof Agriculture
www.ers.usda.gov
A Report from the Economic Research Service
Abstract
This report relies on fi ndings from several national surveys and current literature to assess water resource use and conservation measures within the U.S. irrigated crop sector. U.S. agriculture accounts for 80-90 percent of the Nation’s consumptive water use (water lost to the environment by evaporation, crop transpiration, or incorporation into products). Expanding water demands to support population and economic growth, environmental fl ows (water within wetlands, rivers, and groundwater systems needed to maintain natural ecosystems), and energy-sector growth, combined with Native American water-right claims and supply/demand shifts expected with climate change, will present new challenges for agricultural water use and conservation, particularly for the 17 Western States that account for nearly three-quarters of U.S. irrigated agriculture. Despite technological innovations, at least half of U.S. irrigated cropland acreage is still irrigated with less effi cient, traditional irrigation application systems. Sustainability of irrigated agriculture will depend partly on whether producers adopt more effi cient irrigation production systems that integrate improved onfarm water management practices with effi cient irrigation application systems.
Keywords: agricultural water conservation, irrigated agriculture, irrigation effi ciency, water supply and demand, irrigation technologies, water management practices, water conservation policy
Acknowledgments
The authors would like to thank Steve Wallander from USDA’s Economic Research Service, Jim Ayars from USDA’s Agricultural Research Service, Raymond J. Supalla from the University of Nebraska – Lincoln, Brian Hurd from New Mexico State University, Jan Lewandrowski from USDA’s Offi ce of the Chief Economist, and Noel Gollehon from USDA’s Natural Resources Conservation Service for their review comments and suggestions. The authors also wish to thank Angela Anderson for editorial support and Curtia Taylor for production/design support.
Glenn D. SchaibleMarcel P. Aillery
Water Conservation in Irrigated Agriculture: Trends and Challenges in the Face of Emerging Demands
Economic Information BulletinNumber 99
September 2012
iiWater Conservation in Irrigated Agriculture: Trends and Challenges in the Face of Emerging Demands / EIB-99
Economic Research Service/USDA
Contents
Summary. . . . . . . . . . . . . . . . . . . . . . . . . . . . . . . . . . . . . . . . . . . . . . . . . . . iii
Introduction . . . . . . . . . . . . . . . . . . . . . . . . . . . . . . . . . . . . . . . . . . . . . . . . . 1
Water Supply and Demand Challenges for Irrigated Agriculture . . . . . . . . . . . . . . . . . . . . . . . . . . . . . . . . . . . . . . . 2 Traditional Water Demands: Agriculture Versus Nonagricultural Sectors . . . . . . . . . . . . . . . . . . . . . . . 2 New Challenges for Irrigated Agriculture. . . . . . . . . . . . . . . . . . . . . . . . . 3 The Challenge for Agricultural Water Conservation . . . . . . . . . . . . . . . 12
How Important Is Irrigation to U.S. Agriculture? . . . . . . . . . . . . . . . . . 15 Where Does Irrigation Occur and What Does It Produce?. . . . . . . . . . . 16 How Much Water Is Applied, What Is Its Source, and What Does It Cost?. . . . . . . . . . . . . . . . . . . . . . . . . . . . . . . . . . . . . . 23
How Effi cient Is Irrigated Agriculture?. . . . . . . . . . . . . . . . . . . . . . . . . . 26
Irrigation Investments: Decision Factors, Types, Purposes, and Funding Sources . . . . . . . . . . . . . . . . . . . . . . . . . . 39 Factors Affecting Irrigation Technology Investment Decisions. . . . . . . . . . . . . . . . . . . . . . . . . . . . . . . . . . . . . . . . 39 Onfarm Irrigation Investment Expenditures . . . . . . . . . . . . . . . . . . . . . . 43 Sources of Onfarm Irrigation Investment Funding . . . . . . . . . . . . . . . . . 44
Summary and Policy Implications . . . . . . . . . . . . . . . . . . . . . . . . . . . . . . 47
References . . . . . . . . . . . . . . . . . . . . . . . . . . . . . . . . . . . . . . . . . . . . . . . . . . 50
iiiWater Conservation in Irrigated Agriculture: Trends and Challenges in the Face of Emerging Demands / EIB-99
Economic Research Service/USDA
Summary
What Is the Issue?
Population and economic growth, changing social values about the impor-tance of water quality and the environment, and Native American water-right claims will continue to drive growing U.S. demand for water resources. Expansion of the U.S. energy sector is expected to further increase regional demands for water. At the same time, projected climate change—through warming temperatures, shifting precipitation patterns, and reduced snow-pack—is expected to reduce water supplies and increase water demand across much of the West.
These trends are placing greater pressure on existing water allocations, heightening the importance of water management and conservation for the sustainability of irrigated agriculture. How well irrigated agriculture adapts to growing constraints on water, particularly by increasing its water-use effi ciency, will directly affect the economic health and sustainability of the sector.
What Did the Study Find?
Irrigated agriculture, which accounts for 80-90 percent of consumptive water use in the United States, represents a signifi cant share of the value of U.S. agricultural production.
• Based on the 2007 Census of Agriculture, irrigated farms accounted for roughly 40 percent ($118.5 billion) of the value of U.S. agricultural production; nationwide, the average value of production for an irri-gated farm was more than three times the average value for a dryland farm.
• Irrigated farms accounted for 54.5 percent ($78.3 billion) of the value of all crop products sold and contributed to the farm value of livestock and poultry production through animal forage and feed production. Livestock/poultry products accounted for roughly a third of market sales for irrigated farms and 63 percent for nonirrigated (dryland) farms. Irrigated forage and feed production contributed to the live-stock/poultry market sales for both irrigated and nonirrigated farm types.
• Nearly 57 million acres were irrigated across the United States in 2007, or 7.5 percent of all cropland and pastureland. Roughly three-quarters of U.S. irrigated agriculture occurred in the 17 Western States, although irrigation has been expanding in the more humid Eastern States.
• Based on the 2008 Farm and Ranch Irrigation Survey (a followup to the 2007 Census of Agriculture), irrigated agriculture across the Western States applied 74 million acre-feet (24 trillion gallons) of water for crop production, with 52 percent originating from surface-water sources and 48 percent pumped from wells that draw from local and regional aquifers.
ivWater Conservation in Irrigated Agriculture: Trends and Challenges in the Face of Emerging Demands / EIB-99
Economic Research Service/USDA
Demands on agricultural water supplies are likely to increase over time as alternative nonfarm uses of water continue to grow. Potential Native American water-right claims have been estimated at nearly 46 million acre-feet annually and could impact the distribution and cost of irrigation water in the West. For many States, the scope of water demands for the environment have expanded from a minimum instream fl ow to an “environmental-fl ows” standard (i.e., a concept requiring water to meet the needs for water quality, but to also rehabilitate ecosystem habitats). Energy-sector growth is expected to signifi cantly increase water demands for an expanding biofuels sector, util-ity-scale development of solar power, innovation in thermoelectric generating capacity, and commercial oil-shale and deep shale natural gas development. Expansion in these competing water demands, especially with water supply/demand impacts expected with climate change, presents new challenges for agricultural water use and conservation, particularly in the arid Western States.
While substantial technological innovation has increased the effi ciency of irrigated agriculture over the past several decades, signifi cant potential exists for continued improvement. At least half of irrigated cropland acreage across the United States is still irrigated with less effi cient, traditional irrigation application systems. In addition, most irrigators do not make use of the more effi cient onfarm water-management practices that conserve the most water.
• Irrigators continue to make signifi cant investments in new and improved irrigation systems. Approximately $2.15 billion was invested in irrigation systems in 2008, a 92-percent increase over investments for 2003.
• Most onfarm irrigation investment is fi nanced privately—less than 10 percent of farms reported fi nancing irrigation improvements in 2008 through public fi nancial assistance programs. Nearly 57 percent of the farms that received fi nancial assistance for irrigation technology adoption did so through USDA’s primary working lands conservation program—the Environmental Quality Incentives Program (EQIP). Irrigated farms participating in EQIP, however, represented only about 4 percent of all farms making irrigation investments in 2008.
• Over time, EQIP funding has had an important impact on irriga-tion investments, amounting to $1.4 billion from 2004 through 2010. Nationally, irrigation practices accounted for roughly a quarter of total EQIP funding obligations ($5.7 billion) during 2004-10.
• Less than 10 percent of irrigated farms use advanced onfarm water management decision tools, such as soil- or plant-moisture sensing devices, commercial irrigation-scheduling services, or computer-based crop-growth simulation models. The sustainability of irrigated agricul-ture may depend partly on the willingness and ability of producers to adopt irrigation “production systems” that more effectively integrate improved water management practices with effi cient irrigation applica-tion systems.
• Agricultural water conservation is both a farm and basin-level resource conservation issue. Integrating the use of improved onfarm irriga-tion effi ciency with State and Federal watershed water-management
vWater Conservation in Irrigated Agriculture: Trends and Challenges in the Face of Emerging Demands / EIB-99
Economic Research Service/USDA
tools (e.g., conserved water rights, drought water banks, option and contingent water markets, reservoir management, irrigated acreage and groundwater pumping restrictions, and irrigated acreage retirement) encourages producers to recognize and respond to differing values of water across competing uses, improving the potential for sustainable irrigation while facilitating water reallocation to other uses.
How Was the Study Conducted?
This report draws on several USDA agricultural production and water-use analyses and surveys, as well as an extensive literature review, to describe the U.S. irrigated agriculture sector, existing and emerging water demands, trends in water-use effi ciency in irrigated agriculture, and funding levels (private and public) for farm-level irrigation investments. USDA’s Censuses of Agriculture (1982-2007) and Farm and Ranch Irrigation Surveys (FRIS) for 1984-2008, together with the U.S. Geological Survey’s (USGS) water-use summaries, were used to assess the demand for U.S. water resources and the importance of irrigation to U.S. agriculture—where it occurs, what it produces, how much water agriculture uses, the water sources supplying irrigation, and the costs of irrigation. FRIS data are also used to analyze the effi ciency of irrigated agriculture as of 2008 to demonstrate the potential for continued agricultural water conservation as producers more effectively inte-grate onfarm and off-farm water management practices with improved irriga-tion production systems. USDA’s FRIS and conservation program contract data are used to examine the current status of private and public investments in irrigated agriculture.
1Water Conservation in Irrigated Agriculture: Trends and Challenges in the Face of Emerging Demands / EIB-99
Economic Research Service/USDA
Introduction
Across the United States, human and environmental demands for water resources have increased signifi cantly over the last 50 years. Population and economic growth, changing social norms regarding the importance of water quality and protection of ecosystems, and longstanding Native American water-right claims have increased pressures on available water supplies, particularly in the arid Western States. Given that agriculture accounts for 80-90 percent of U.S. consumptive water use, relatively fi xed water supplies and growing water demands have heightened confl icts over agricultural allo-cations in water-short years.
Water confl icts have required a variety of legislative and judicial remedies, generally involving reallocation of agricultural water supplies to meet the rising needs of competing water users (NRC, 1996; CBO, 1997; Gollehon and Quinby, 2006; Schaible et al., 2010). Historically, Federal and State programs have focused on agricultural water conservation, mandatory with-drawal restrictions, and the use of water markets to meet the Nation’s various water needs. More recently, water demands for an expanding energy sector and shifting regional water balances under climate change projections have heightened awareness of the importance of water conservation for a sustain-able future for irrigated agriculture. Knowledge about the status and the social and institutional dimensions of competing uses of water resources provides a better understanding of the supply and demand challenges facing irrigated agriculture.
2Water Conservation in Irrigated Agriculture: Trends and Challenges in the Face of Emerging Demands / EIB-99
Economic Research Service/USDA
Water Supply and Demand Challenges for Irrigated Agriculture
Traditional Water Demands: Agriculture Versus Nonagricultural Sectors
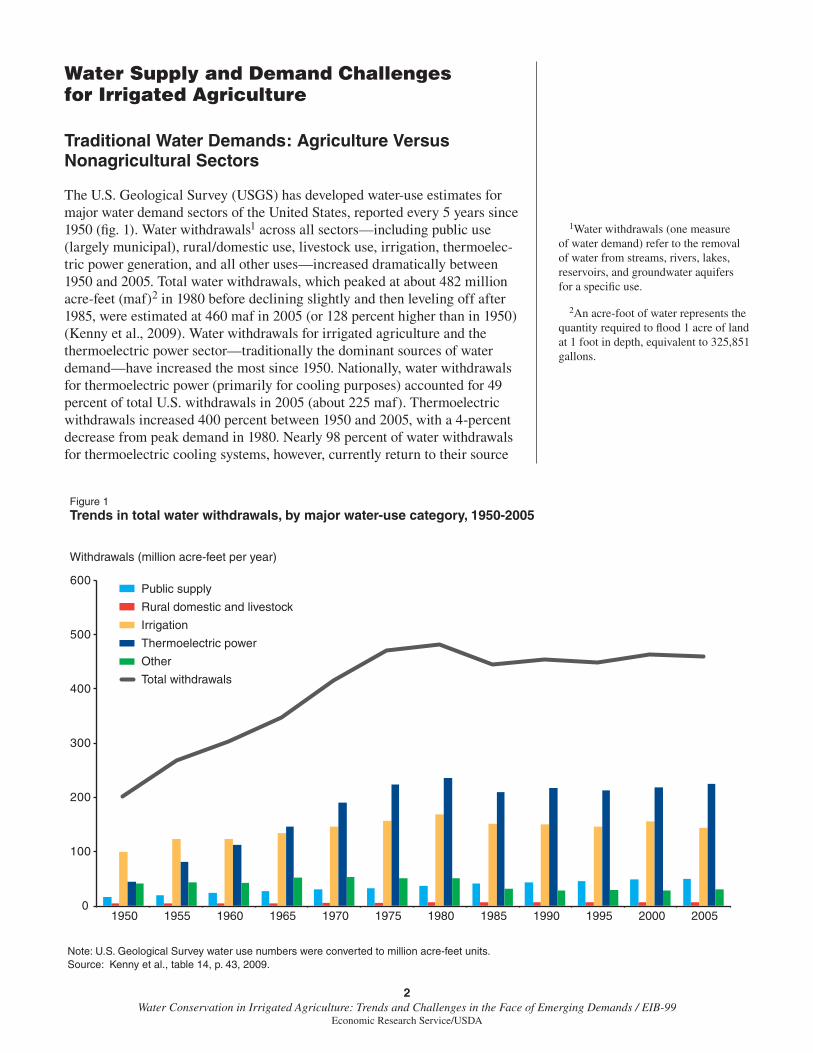
The U.S. Geological Survey (USGS) has developed water-use estimates for major water demand sectors of the United States, reported every 5 years since 1950 (fi g. 1). Water withdrawals1 across all sectors—including public use (largely municipal), rural/domestic use, livestock use, irrigation, thermoelec-tric power generation, and all other uses—increased dramatically between 1950 and 2005. Total water withdrawals, which peaked at about 482 million acre-feet (maf)2 in 1980 before declining slightly and then leveling off after 1985, were estimated at 460 maf in 2005 (or 128 percent higher than in 1950) (Kenny et al., 2009). Water withdrawals for irrigated agriculture and the thermoelectric power sector—traditionally the dominant sources of water demand—have increased the most since 1950. Nationally, water withdrawals for thermoelectric power (primarily for cooling purposes) accounted for 49 percent of total U.S. withdrawals in 2005 (about 225 maf). Thermoelectric withdrawals increased 400 percent between 1950 and 2005, with a 4-percent decrease from peak demand in 1980. Nearly 98 percent of water withdrawals for thermoelectric cooling systems, however, currently return to their source
1Water withdrawals (one measure of water demand) refer to the removal of water from streams, rivers, lakes, reservoirs, and groundwater aquifers for a specifi c use.
2An acre-foot of water represents the quantity required to fl ood 1 acre of land at 1 foot in depth, equivalent to 325,851 gallons.
Note: U.S. Geological Survey water use numbers were converted to million acre-feet units.Source: Kenny et al., table 14, p. 43, 2009.
Figure 1Trends in total water withdrawals, by major water-use category, 1950-2005
Withdrawals (million acre-feet per year)
0
100
200
300
400
500
600
1950 1955 1960 1965 1970 1975 1980 1985 1990 1995 2000 2005
Public supply
Rural domestic and livestock
Irrigation
Thermoelectric power
Other
Total withdrawals
3Water Conservation in Irrigated Agriculture: Trends and Challenges in the Face of Emerging Demands / EIB-99
Economic Research Service/USDA
of origin, where the water can be reused for other purposes, including irrigation.
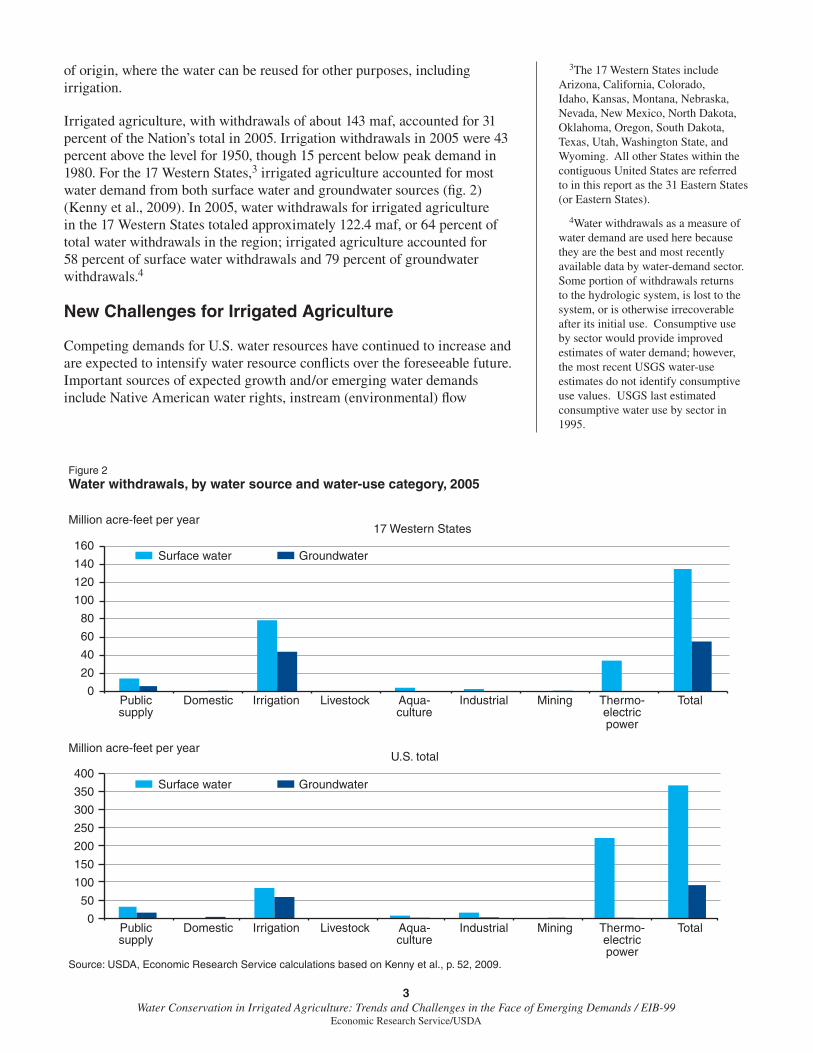
Irrigated agriculture, with withdrawals of about 143 maf, accounted for 31 percent of the Nation’s total in 2005. Irrigation withdrawals in 2005 were 43 percent above the level for 1950, though 15 percent below peak demand in 1980. For the 17 Western States,3 irrigated agriculture accounted for most water demand from both surface water and groundwater sources (fi g. 2) (Kenny et al., 2009). In 2005, water withdrawals for irrigated agriculture in the 17 Western States totaled approximately 122.4 maf, or 64 percent of total water withdrawals in the region; irrigated agriculture accounted for 58 percent of surface water withdrawals and 79 percent of groundwater withdrawals.4
New Challenges for Irrigated Agriculture
Competing demands for U.S. water resources have continued to increase and are expected to intensify water resource confl icts over the foreseeable future. Important sources of expected growth and/or emerging water demands include Native American water rights, instream (environmental) fl ow
3The 17 Western States include Arizona, California, Colorado, Idaho, Kansas, Montana, Nebraska, Nevada, New Mexico, North Dakota, Oklahoma, Oregon, South Dakota, Texas, Utah, Washington State, and Wyoming. All other States within the contiguous United States are referred to in this report as the 31 Eastern States (or Eastern States).
4Water withdrawals as a measure of water demand are used here because they are the best and most recently available data by water-demand sector. Some portion of withdrawals returns to the hydrologic system, is lost to the system, or is otherwise irrecoverable after its initial use. Consumptive use by sector would provide improved estimates of water demand; however, the most recent USGS water-use estimates do not identify consumptive use values. USGS last estimated consumptive water use by sector in 1995.
Source: USDA, Economic Research Service calculations based on Kenny et al., p. 52, 2009.
Figure 2Water withdrawals, by water source and water-use category, 2005
Million acre-feet per year
Million acre-feet per year
0
20
40
60
80
100
120
140
16017 Western States
0
50
100
150
200
250
300
350
400
Surface water
Publicsupply
Domestic Irrigation Livestock Aqua-culture
Industrial Mining Thermo-electricpower
Total
Publicsupply
Domestic Irrigation Livestock Aqua-culture
Industrial Mining Thermo-electricpower
Total
Groundwater
U.S. total
Surface water Groundwater
4Water Conservation in Irrigated Agriculture: Trends and Challenges in the Face of Emerging Demands / EIB-99
Economic Research Service/USDA
requirements, and an expanding energy sector. In addition, climate change is expected to affect both the supply of and demand for freshwater.
Native American Water Rights
Native American reservation water rights were established by the U.S. Supreme Court in its 1908 Winters v. United States decision. The ruling established reserved water rights based on the amount of water necessary for Native Americans to maintain and survive on the land granted to the reservation by the Government, even if those rights were not explicitly stated in the reservation treaty. In subsequent decisions, the U.S. Supreme Court quantifi ed those water rights as the water needed to irrigate all “practicably irrigable acreage” on the reservation and made such rights generally superior to the rights of all other appropriators by vesting them with a “priority” date equivalent to the date the reservation was established (Gregory, 2008; Moore, 1989). In addition, while Winters v. United States applies to surface waters, in 1976, the U.S. Supreme Court (Cappaert v. United States) opened the door for Native American reserved water-right claims to apply to groundwater. No defi nitive decision on Native American reserved groundwater rights has been made, but some States recognize these rights (Gregory, 2008).
Potential Native American water-right claims have been estimated at nearly 46 maf annually (Western States Water Council, 1984). At present, the claims for many reservations are under negotiation or remain unresolved within settlement disputes or judicial proceedings. Future resolution of these water-right claims will undoubtedly affect the water resources available for co mpeting uses, including off-reservation irrigated agriculture. Settling Native American water-right claims, however, may not result in less water for agriculture, but rather a reallocation of existing water rights. While water delivered to U.S. Tribes generally originates from existing water-right allocations, Tribes are generally allowed to assign, exchange, lease, and create options to lease water rights through settlement arrangements. Within existing negotiated settlements, some reallocated water supports irrigation expansion on reservation lands, but Tribes also may agree to lease water to off-reservation agricultural users, to non-Indian lessees on reservation lands, and to nonagricultural users, such as municipalities (Claims Resolution Act of 2010).
To the extent that Tribes accept compensation in lieu of wet water, the actual reallocation of water from existing agricultural users may be limited. However, due to the political and fi nancial challenges in negotiating or adju-dicating water rights claims and a lack of ability to fi nance irrigation projects and related storage, exercising reservation water rights has moved historically at a relatively slow pace. The reality is that, for many reservations, future development of these claims will likely continue to progress slowly barring an infusion of economic, legal, and technical assistance.5
Instream (Environmental) Flows6
Historically, water resources were managed to fulfi ll the needs of out-of-stream development, such as crop irrigation and municipal or industrial expansion. Water not withdrawn from a stream for economic development was generally considered wasted water. Water-fl ow needs for fi sh and wildlife
5Under the U.S. Department of the Interior’s Indian Water Rights Settlement Program, the Federal Government has refocused settlement of tribal water-right claims, shifting from litigation to negotiated settlements (U.S. BoR, 2012). Recent congressional hearings on “Indian Water Rights: Promoting the Negotiation and Implementation of Water Settlements in Indian Country” indicate that in the last dozen years, 27 tribal settlements were concluded based on this process, compared with less than 10 through the litigation process (U.S. Senate Committee on Indian Affairs, 2012). These settlements often involve, via congressional approval, allowing Tribes to assign, exchange, and lease their water rights to non-Indian users both on and off the reservation. While many Tribal water rights remain unquantifi ed, these settlements enhance certainty in water-rights allocations and also may contribute to new investment in improved (more effi cient) irrigation systems.
6Flow is generally measured as the volume of water per unit of time, usually cubic feet per second, and represents the amount of water fl owing past a point in the river at a given time.
5Water Conservation in Irrigated Agriculture: Trends and Challenges in the Face of Emerging Demands / EIB-99
Economic Research Service/USDA
habitat and other ecosystem benefi ts were not a legally recognized water management priority. From the 1970s on, however, changing social values with respect to water quality and environmental/ecosystem services have had greater infl uence on Federal and State water-resource management institu-tions and policies. Changing environmental values initially led to the estab-lishment of minimum streamfl ow requirements to meet legally recognized instream water needs. Subsequently, watershed/basin-level water manage-ment agencies were legally bound to manage water resources consistent with maintaining sustainable ecosystems.
Minimum streamfl ow management focused primarily on the need for a minimum amount of water to be left in a stream, generally to maintain fi sh habitat (Poff et al., 2003; Zellmer, 2009; MacDonnell, 2009). In basins with signifi cant irrigation withdrawals, minimum fl ow provisions often reallocate water supplies from agriculture, particularly during low-fl ow (drought) years. More recently, the use of fl ow provisions designed to enhance ecosystem services has become broader in scope. Often referred to as “environmental fl ows,” these fl ow regimes are intended to provide multiple instream benefi ts, including enhanced fi ltration, dilution of sewage and other effl uents, fi sh and wildlife habitat, recreation (fi shing, hunting, boating, and environ-mental aesthetics), hydropower, navigation, groundwater recharge,7 riparian wetlands, and migratory bird habitat, as well as exotic species control and local/regional economic development (Sophocleous, 2007; Zellmer, 2008; MacDonnell, 2009).
Environmental fl ows will likely play an increasingly important role in the ongoing struggle among competing water demands. Most Western States have adopted some form of legislation establishing minimum instream fl ows, and provisions have evolved over time to refl ect the complexities of hydrology and a range of instream uses.8 See the box, “Environmental Flows and Increasing Demand Pressures,” for examples of the growing pressure that environmental fl ows place on limited water supplies.
Water for Energy Expansion
U.S. energy sector growth, for production of biofuels and other energy sources, is expected to place increasing demand on water resources. In the Western States, where surface-water systems are already over-appropriated and groundwater aquifer levels are generally declining, energy-related water demand could directly affect irrigated agriculture.
An expanding biofuel sector will require water for both processing and feed-stock production. Water demand for a biofuel plant with a given processing capacity is generally known (an engineering relationship), local (site-specifi c), and typically managed through market-based permanent lease or purchase agreements between local farms and the biofuel fi rm. While total withdrawals for biofuel processing are comparatively low, local/regional impacts on water resources can be sizable. Water demands for irrigated feed-stock production for biofuel production, however, may be more signifi cant. While some of this water demand will likely come from existing irrigated production, a growing biofuel industry may increase demand for irrigation water as producers respond to higher corn and soybean prices by expanding
7A system of using the hydrologic process to refi ll a groundwater aquifer by either pumping water back into wells or managing surface water to increase downward water percolation to the groundwater aquifer.
8The evolution and status of State-specifi c minimum instream-environmental fl ow programs, statutes, and policies, which vary widely across the Western States, have been summarized by MacDonnell (2009).
6Water Conservation in Irrigated Agriculture: Trends and Challenges in the Face of Emerging Demands / EIB-99
Economic Research Service/USDA
Environmental Flows and Increasing Demand Pressures
Changing societal values have focused greater attention on water resources to meet the needs for water quality, fi sh and wildlife habitat, and other ecosystem services. These water demands have often exceeded the historical “minimum instream-fl ow” requirement. The following examples demonstrate how providing water for “environmental fl ows” places increasing pressures on limited water supplies.
Stream and river restoration projects have become an important component of Federal and State environmental management programs. A recent study, based on a review of 37,099 projects in the National River Restoration Science Synthesis database, reported that the number of restoration projects has increased exponentially since 1990 (Sophocleous, 2007; Bernhardt et al., 2005). These restoration projects may be designed to achieve multiple objectives, including enhanced water quality; management of riparian zones; improved instream habitat for fi sh and other aquatic species; improved fi sh passage; bank stabilization; fl ood plain management; river/stream channel reconfi guration; and fl ow modifi cation for fi sh, aesthetics, and recreation. The study estimated that from 1990 to 2004, more than $14 billion was spent on stream/river restoration projects within the continental United States, averaging slightly more than $1 billion annually.
In many Western States, water markets are increasingly being used to reallocate water from existing uses, particularly from agriculture, to enhance supplies for environmental fl ows within fully or over-appropriated basins. Many State water laws now recognize environmental fl ows as a benefi cial use and allow State and nongovernmental organizations (NGOs), including conservation and environmental groups, to lease, purchase, or donate water or water rights to enhance river fl ows (Sophocleous, 2007; MacDonnell, 2009). Landry (1998) reported that from 1990 to 1997 about 2.4 million acre-feet (maf) of water was “leased, purchased, or donated for purposes of enhancing river fl ows in the Western United States.” While this does not refl ect the total volume of water for instream fl ows (a quantity diffi cult to measure), by comparison, water transferred for environmental purposes represented about 5.2 percent of the quantity of surface water applied by irrigated agriculture in 1998.
From 2000 to 2005, the Colorado River Basin experienced the worst drought conditions in approximately 100 years, with Lake Powell and Lake Mead dropping to about 46 percent of combined water storage capacity (Jerla and Prairie, 2009). As a result, the Bureau of Reclamation (Reclamation), through the National Environmental Policy Act process, developed a management plan for the basin that included interim guidelines for coordinated water storage operations during Lower Colorado River Basin water shortages (U.S. BoR, 2007; Jerla and Prairie, 2009). The preferred management alternative for the basin included a “Conservation Before Shortage” alternative (developed by a consortium of eight environmental NGOs) to allow Reclamation to develop and manage voluntary compensated, conservation reduction/water-banking programs that would include water for environmental uses. In July 2006, these environmental NGOs submitted a new proposal, “Conservation Before Shortage II,” encouraging Reclamation to expand its use of voluntary market-based conservation mechanisms to provide water to protect but also enhance fl ow-dependent environmental values within the lower basin (Gillon et al., 2006).
--continued
7Water Conservation in Irrigated Agriculture: Trends and Challenges in the Face of Emerging Demands / EIB-99
Economic Research Service/USDA
Environmental Flows and Increasing Demand Pressures (continued)
Over the years, managing water supplies to enhance benefi ts for fi sheries and ecosystem values has become an increasingly important focus for the Central Valley of California. The Central Valley Project (CVP), initially authorized in 1933 and completed in the early 1970s, is comprised of 18 dams and reservoirs and over 500 miles of canals and aqueducts. The project conveys about 7.4 maf of water annually from the Sacramento, Trinity, American, Stanislaus, and San Joaquin Rivers to agricultural users (irrigating more than 3.0 million acres), municipal users, and wildlife refuges and for recovery of endangered fi sh species in the Sacramento and San Joaquin Valleys and the San Francisco Bay/Delta Estuary. In 1992, the U.S. Congress adopted the Central Valley Project Improvement Act (CVPIA), which formally identifi ed fi sh and wildlife protection, restoration, and mitigation as project objectives of equal priority with irrigation and other domestic uses, as well as required the CVP to contribute to the State’s efforts to protect the Bay/Delta Estuary (U.S. BoR, 2009). The act also reallocated 800,000 acre-feet of water from existing users to fi sh and wildlife annually.
Since 1992, and after nearly $1 billion had been spent on numerous restoration projects throughout the Central Valley, the CVPIA Program Activity Review (conducted by the U.S. Bureau of Reclamation) reported that “there is no basis to conclude” that the provisions of the CVPIA “have been satisfi ed” (U.S. BoR, 2009), while an independent review panel concluded that anadromous fi sh species had “stayed relatively even or declined from 1992-2005” (Circlepoint, 2008). Therefore, reallocating water supplies to meet environmental/ecosystem concerns within the Central Valley remains a high priority of the State/Federal partnership (CALFED), an agreement by 25 State and Federal agencies established in 2000 to “work collaboratively toward achieving balanced improvements” for the Bay/Delta Estuary (CALFED Bay-Delta Program, 2010).
More recently, efforts of the State and CALFED have taken on a larger ecosystem sustainability focus. In 2006, California State agencies initiated the Bay Delta Conservation Plan, a collaborative effort by State, Federal, and local water agencies; State and Federal fi sh agencies; environmental organizations; and other interested parties to identify water fl ow and habitat restoration actions designed to recover endangered sensitive species and their habitats in the Bay-Delta area, while also providing for improved reliability of water supplies (U.S. BoR, 2010). Draft habitat conservation plans for the Bay-Delta area are expected to be completed in 2012. Meanwhile, due to low reservoir storage associated with below-normal precipitation levels and the need to reallocate water supplies to protect native fi sh species, the California Department of Water Resources reduced 2010 water deliveries (from Northern California) to users in the Bay-Delta and Southern California (including agriculture) by some 800,000 acre-feet, or roughly half of normal allocations. In 2009, due to similar conditions, Southern California municipal and agricultural users of State Water Project water received only 40 percent of their normal allocations. Over the past 10 years, low reservoir storage and environmental fl ow demands across the Sacramento/San Joaquin Delta have limited water-supply deliveries to only 68 percent of normal allocations from the State Water Project, impacting water for over 25 million Californians and approximately 750,000 acres of irrigated farmland (DWR, 2010a and 2010b).
8Water Conservation in Irrigated Agriculture: Trends and Challenges in the Face of Emerging Demands / EIB-99
Economic Research Service/USDA
irrigated acreage for these crops. Chiu et al. (2009), in estimating the “embodied water in ethanol” (i.e., ethanol’s lifecycle water use), revealed that:
1. More corn production for ethanol was taking place within highly irrigated regions, particularly in the northern High Plains (Ogallala Aquifer) region;
2. Consumptive water use for bio-ethanol production in the United States increased 246 percent, from 1.54 to 4.95 maf, between 2005 and 2008; and
3. Total consumptive water use for bio-ethanol production (including water for irrigation) in the Ogallala Aquifer region increased from 1.95 maf in 2007 to 3.65 maf in 2008 (about 68 percent was supplied from groundwater).9
The National Research Council (2008) estimated that:
1. Irrigated corn for ethanol (in Nebraska) required about 780 gallons of freshwater withdrawals per gallon of ethanol; and
2. “While irrigation of native grass today would be unusual, this could easily change as cellulosic biofuel production gets underway.”
The U.S. Government Accountability Offi ce (GAO) estimated the average water consumed in corn ethanol production (adjusting for irrigation return fl ows) for the Northern Plains States at 323.6 gallons of water per gallon of ethanol (U.S. GAO, 2009). Nearly 88 percent of this requirement is expected to come from groundwater.
The full impact of biofuel expansion on agricultural land and water resources, however, is expected to be complex, involving the substitution of land and water among crops, cropland expansion, reduced use of idled cropland, expanded use of applied inputs, and increased double-cropping (producing two crops on the same land within the same year), depending on where biofuel development occurs. Wallander et al. (2011) estimate that, since 2006, corn production expansion to meet biofuel feedstock demand came primarily from acreage shifts from soybean farms (53 percent), conversion of uncultivated hay and grazing land, and acreage formerly enrolled under the USDA Conservation Reserve Program (CRP) (33 percent). Increases in corn yields and double-cropping, and decreases in idled cropland, accounted for the remainder.10 Production response has varied across regions; shifts in crop acreage from soybean to corn acres have been the dominant produc-tion response in the Corn Belt and Lake States regions, while expansion in harvested cropland from new cultivated land has dominated the Northern and Southern Plains and the lower Mississippi River Valley.
Malcolm et al. (2009) drew similar conclusions regarding the impact of biofuel-sector growth on agricultural land-use decisions. Their estimates suggest that the substitution of soybean acres for corn acres would dominate cropland reallocation decisions across the Corn Belt, while expansion in harvested corn acreage (primarily from expired CRP contracts, pastureland, and idled cropland) explained a predicted increase in corn production in the Northern Plains. Based on a qualitative assessment, this research suggests that the expansion of corn acreage to meet biofuel feedstock demand has the
9Consumptive water-use estimates by Chiu et al. (2009) were in trillions of liters but are converted here (for consistency) to acre-feet units based on 3.7854 liters = 1 gallon and 325,851 gallons = 1 acre-foot.
10Acreage shifts from soybean farms could have included acres from other crops besides soybeans. In addition, Wallander et al. (2011) did not evaluate irrigated crop and water-use effects.
9Water Conservation in Irrigated Agriculture: Trends and Challenges in the Face of Emerging Demands / EIB-99
Economic Research Service/USDA
“potential for increased reliance on irrigation,” particularly for the Plains States. This would likely involve an increase in consumptive water use, both due to expanded irrigated corn acres and because water consumption by corn plants is greater than that for soybeans, placing additional pressure on groundwater resources where withdrawals have generally exceeded natural recharge. Increases in water demand for energy feedstock production could affect the long-term sustainability of surface and groundwater resources where they are currently under stress.
Water demands are also expected to increase due to growth and technical innovation forecast in other energy-related uses, including thermoelectric generating capacity, expected development of utility-scale solar power across the Southwestern United States, and potential development of a commercial oil shale industry in the Upper Colorado River Basin. In addition, expansion of hydraulic fracturing (fracking) for deep shale natural gas exploration is expected to increase energy sector water demand in the Eastern and Central United States. Hydraulic fracking involves pumping water, sand, and chemi-cals under high pressure into a shale formation to generate fractures or cracks that allow natural gas to fl ow out of the rock and into the well. Water demand for hydraulic fracking does not represent a long-term water resource commit-ment, as it occurs only during the drilling and completion phases of each well (Chesapeake Energy, 2011). However, the practice has raised public concern for groundwater quality.
Increased use of evaporative cooling technology for thermoelectric and solar power may signifi cantly increase consumptive water-use require-ments for the energy sector in areas where expansion occurs. Water demand for the oil shale industry could also be signifi cant; ongoing studies by the U.S. Department of the Interior address the uncertainties of water resource impacts for this sector. For most new energy development, however, water quality and environmental impacts are potentially the more signifi cant policy concern. Summarizing these water demands is outside the scope of this report due to the unique needs by energy type, the complexities of energy forecasts, technological uncertainties, and the lack of aggregate water-use estimates for projected energy expansion.11
Climate Change and Water Resources
Substantial evidence demonstrates that the global climate is changing, with important implications for agriculture and water resources (IPCC Report, 2007; U.S. CCSP, 2008). In much of the Western United States, annual precipitation is projected to decline, particularly in the warmer summer months. Moreover, gradual temperature increases will shift the West’s tradi-tional source of freshwater supplies from winter snowpack to more frequent and intense early spring rain (IPCC Report, 2007; Knowles et al., 2006). These shifts are expected to alter both the quantity and timing of associated streamfl ow, with more fl ow in the early spring, and to reduce late-season reservoir storage amounts from precipitation and late-spring and summer snowmelt. These streamfl ow and reservoir storage effects are expected to reduce water supplies for traditional peak irrigation water demands during the summer and fall growing seasons.
11For more specifi c information on these water-use demands, see NETL, 2008; GWPC and All Consulting, 2009; U.S. DOE, 2010; U.S. GAO, 2010; Bartis et al., 2005; U.S. BLM, 2011.
10Water Conservation in Irrigated Agriculture: Trends and Challenges in the Face of Emerging Demands / EIB-99
Economic Research Service/USDA
Studies conducted for the Intergovernmental Panel on Climate Change’s (IPCC) Fourth Assessment Report (IPCC Report, 2007) revealed that:
1. The April 1 snow-water equivalent snow cover “has declined 15 to 30 percent since 1950 in the western mountains of North America” (Mote et al., 2003 and 2005; Lemke et al., 2007); and
2. Streamfl ow over the last century has “decreased by about 2 percent per decade” in the Central Rocky Mountain region (Rood et al., 2005).
These studies indicated that these patterns were not uniform across the Mountain region and that, while there has been a general downward trend in snow-water equivalent snow across the Western States, decreases have been relatively larger at lower elevations. In addition, results from various climate simulation models or analyses based on multi-century tree-ring reconstruc-tion (1490-1998) indicate that expected warming temperatures and precipi-tation changes will reduce streamfl ow in the Upper Colorado River Basin (UCRB). Streamfl ow could decline by 8-11 percent by the end of the 21st century, with declines as high as 25 percent by 2030 and 45 percent by 2060 (Christensen and Lettenmaier, 2007; Hoerling and Eischeid, 2007; McCabe and Wolock, 2007).12
Van Kirk and Naman (2008) estimated that 39 percent of the observed decline in the July-October discharge for the Scott River within the Klamath Basin could be explained by regional-scale climatic factors. The U.S. Climate Change Science Program’s Final Report of Synthesis and Assessment Product 4.3 (U.S. CCSP, 2008), drawing on 2007 IPCC climate change assessments and other studies, revealed signifi cant regional differences in projected streamfl ow effects across the United States. The 2008 CCSP report projected that annual runoff would increase across the Eastern United States, gradually transition to little change in the Missouri and Lower Mississippi basins, and substantially decrease (by up to 20 percent) in the western interior (particularly the Colorado and Great Basin areas). Runoff projections for the West Coast (Pacifi c Northwest and California) were also negative, but smaller than in the western interior basins. The recent Bureau of Reclamation report to Congress (Reclamation, 2011) further disaggregated climatic impact and hydrologic projections to eight reclamation river basins. This study indicates that for the Colorado Basin, southern sub-basins are expected to experience greater warming and a decrease in precipitation; portions of the upper basin are expected to experience wetter conditions, but warming temperatures will dominate expected basin-wide effects. As a result, projected reductions in natural runoff and changes in runoff seasonality in the Colorado Basin are expected to reduce water supplies given current reservoir system capacity and operational regimes, with differences between northern and southern sub-basins. In addition, because reservoir storage opportunities are limited by fl ood control considerations, increased winter runoff is not expected to trans-late into increased water storage for the spring season. Reductions in runoff during the spring and early summer are expected to reduce reservoir levels and water supply deliveries during the irrigation season.
The 2011 Reclamation report indicates that warming temperatures are expected to be relatively uniform over the Columbia River Basin, with gener-ally wetter conditions varying across sub-basins. Decreases in snowpack are expected to be more substantial over the western mountain ranges of the
12For information and maps of the major U.S. aquifer and river systems, see the U.S. Geological Survey (USGS) report for the Groundwater Atlas of the United States (USGS, 2011), which describes the location, extent, and the geologic and hydrologic characteristics of the major aquifers of the Nation, and the USGS Water Supply Paper 2294, Hydrologic Unit Maps (Seaber et al., 1987), which provides descriptions, names, and drainage areas of the major U.S. river basin hydrologic units.
11Water Conservation in Irrigated Agriculture: Trends and Challenges in the Face of Emerging Demands / EIB-99
Economic Research Service/USDA
basin and the lower elevations of the basin’s eastern mountain ranges, which “contribute signifi cantly to runoff in headwater reaches of major Columbia River tributaries.” Snowpack in northern and higher elevations of eastern portions of the basin, however, are projected to increase overall. These impacts are expected to result in varied annual runoff across sub-basins, with changes in the southern and central portions of the basin expected to be less than in the northern sub-basins. In addition, the seasonality of runoff becomes more important as warming temperatures in the northern sub-basins cause more of the runoff to occur during the December-March (cool) season and decrease runoff during the April-July (warmer) season. The southern and central sub-basins (e.g., the Snake and Yakima Rivers) are expected to see little change in April-July runoff as increased precipitation could offset the cool-season warming effect. The Reclamation report (2011) recognized that, for the Columbia Basin, the impact on water supply and reservoir opera-tions is less obvious because of the anticipated variability in climatic effects across sub-basins. The report also recognizes that, based on some studies, the general warming effects across the basin appear to have the most infl uence on runoff and ultimately on basin water supplies.13
Other climate change studies indicate that, as increasing temperatures thin snowpack and raise snowline elevations, mountain recharge rates will decline as recharge areas shrink, thereby reducing aquifer recharge and water-table levels (Dettinger and Earman, 2007; Hall et al., 2008). For the Ogallala Aquifer region, groundwater recharge is expected to decrease by more than 20 percent if temperatures increase by 4.5º F (2.4º C) (IPCC Report, 2007). Aquifer recharge rates could decrease by as much as 25 percent in the Ellensburg Basin of the Columbia Basin Plateau (NWAG Report, 2000). While these studies provide some initial information on how climate change may affect groundwater resources, these effects are not completely under-stood (USGS, 2009; Green et al., 2007). This uncertainty affects researchers’ ability to isolate climate change infl uences on the subsurface hydrologic cycle and their effect on such factors as recharge, discharge, and groundwater storage. These factors are infl uenced signifi cantly by groundwater-residence time—the time it takes climate variability and longrun climate change to affect a groundwater resource—which can range from days to tens of thou-sands of years. The longer the groundwater-residence time, the greater the challenge in detecting responses in groundwater supply due to climate vari-ability and change.
Climate-induced declines in snowpack and altered runoff also create uncer-tainties involving the interactions between evapotranspiration (ET), mountain recharge versus alluvial (fan) basin recharge, and their combined effect on lower basin groundwater recharge (Dettinger and Earman, 2007). In addition, most groundwater systems have been altered substantially by human activities (Green et al., 2007). The USGS reports that improved groundwater-moni-toring systems and an expanded research focus beyond groundwater-level fl uctuations to address groundwater uncertainties and processes occur-ring over multiple decades will enhance our understanding of groundwater response to climate change (USGS, 2009).14
Moderate temperature increases are also expected to increase crop ET for the southern-tier Western States, increasing irrigation water demands in the region, while enhancing ET effi ciency for many crops in the northern-tier
13Summarizing results here for the Colorado and Columbia River Basins was intended to illustrate the variability in climate change impacts on surface water supply, both across and within basins. For more information on how projected climate change affects water supplies for other river basins, see the Reclamation report (U.S. BoR, 2011) at http://www.usbr.gov/climate/SECURE/docs/SECUREWaterReport.pdf.
14The USGS and the U.S. Department of Agriculture (USDA), in conjunction with the United Nations project Groundwater Resources Assessment under the Pressures of Humanity and Climate Change (GRAPHIC), are assessing climate change effects on the High Plains Ogallala Aquifer (USGS, 2009).
12Water Conservation in Irrigated Agriculture: Trends and Challenges in the Face of Emerging Demands / EIB-99
Economic Research Service/USDA
Western States.15 Even for northern-tier States, however, moderate warming conditions will likely still impact irrigation water demands because, with less total water supply, the timing of irrigation becomes a more critical onfarm water management issue. In the Eastern United States, where precipitation is generally suffi cient to support rainfed crop production, climate-induced changes in irrigation to meet water demands will depend on shifts in normal growing-season rainfall, potential increases in the frequency and severity of drought, and relative returns to irrigated and dryland production.
The Challenge for Agricultural Water Conservation
New pressures on regional water budgets, particularly in the Western States, have raised important questions concerning the sustainability of water resources for irrigated agriculture:
1. Can irrigated agriculture adapt to climate-adjusted water supplies and emerging water demands through conventional means alone (i.e., the adoption of more effi cient irrigation technologies, improved water management practices, and/or cropland allocation shifts)?
2. What changes in water institutions may be needed to complement and drive water conservation policy to more effectively manage increas-ingly scarce water supplies for agriculture?
3. How will these changes impact irrigated agriculture, land and water resource use, the environment, and rural economies?
Sustainability of U.S. Western Irrigated Agriculture
The critical link between climate change vulnerability and sustainability is adaptability (Wall and Smit, 2005; Hall et al., 2008; IPCC Report, 2007; Brekke et al., 2009).16 Reduced water supplies due to climate change will likely further constrain already over-allocated water resources across much of the Western United States, while increased water demand from alternative user groups, ecological requirements, and Native American claims will put additional pressure on water allocations. For agriculture, increased competi-tion underscores the importance of managing irrigation applications (i.e., being capable of applying water at the time and in the amount needed to meet consumptive use requirements by crop growth stage). In addition, high-pres-sure sprinkler and traditional gravity irrigation systems will become even less effi cient as application losses increase due to higher evaporation rates caused by rising temperatures.
Given current and projected climate changes, the adaptability of western irri-gated agriculture to a more sustainable future could involve more widespread use of effi cient gravity and pressurized irrigation systems, coupled with inten-sive fi eld-level water management practices to enhance irrigation effi ciency and potential farm water savings. Such practices may include the use of soil- or plant-moisture-sensing devices, commercial irrigation-scheduling services, and computer-based crop-growth simulation models that help producers decide when and how much to irrigate.
Practices that enhance gravity-fl ow systems through improved distributional uniformity of fi eld-water advance include fi eld laser leveling, gated pipe
15Crop evapotranspiration (ET) is generally defi ned as the loss of water to the atmosphere through evaporation (from soil and plant leaf surfaces) and transpiration (water from inside the plant that vaporizes through plant stomata or microscopic pores on plant leaf surfaces). Crop ET-effi ciency, as used here, refers to the effect that rising temperatures have on crop yield per unit of water consumed in ET, alternatively recognized as crop water-use effi ciency (Izaurralde et al., 2003; Hatfi eld et al., 2008; Bates et al., 2008). Rising temperatures are expected to reduce crop yield per unit of ET in the southern-tier Western States, while having a positive effect in the northern-tier Western States.
16The terms “water conservation,” “sustainable water use,” and “adaptation” have been widely used in economic literature, but consistent defi nitions are somewhat elusive. For the purposes of this report, we defi ne sustainable irrigation water use as a goal of conservation policy—ensuring a viable irrigated agriculture sector and adequate agricultural water availability for future generations, while also protecting offsite environmental services. This defi nition is consistent with most USDA reports that address sustainable agriculture. Adaptation strategies involve various mechanisms for achieving agricultural water conservation and allocation goals.
13Water Conservation in Irrigated Agriculture: Trends and Challenges in the Face of Emerging Demands / EIB-99
Economic Research Service/USDA
systems with surge fl ow/cablegation, shortened furrow lengths, alternate-row irrigations, reduced irrigation set times, and polyacrylamide (PAM) applica-tions (a water-soluble soil amendment that stabilizes soil and waterborne sediment). Tailwater pits may also be used to capture and reuse irrigation drainage from the fi eld. Pressurized system enhancements, including low-energy precision application/drop-tube systems, micro-irrigation systems, and automated nozzle control systems, improve the precision of applied water while reducing energy requirements for pressurization.
Under the more effi cient gravity and pressurized irrigation systems, inten-sive infi eld water management practices can enhance a producer’s ability to apply water closer to a crop’s consumptive use requirement. This is especially important when defi cit irrigating a crop to maximize profi ts, particularly during drought years. Defi cit irrigation is an applied water management strategy that concentrates the application of limited seasonal water supplies on moisture-sensitive crop growth stages to maximize the productivity of applied water. The quantity of water applied provides less than the full crop ET requirement, which inevitably results in plant moisture stress and reduced crop yield. With defi cit irrigation, however, the farmer’s goal is to maximize profi ts (net income) per unit of water used rather than per land unit used for production (Fereres and Soriano, 2007; Geerts and Raes, 2009). Thus, appropriately integrating water management practices with effi cient irriga-tion systems improves the adaptability of irrigated agriculture to water-supply defi cits, while enhancing longrun sustainability.
Sustainability of U.S. Eastern Irrigated Agriculture
Conservation also ensures a more sustainable future for irrigated agricul-ture in the 31 Eastern States. In the more humid East, irrigation generally complements growing-season precipitation that normally provides suffi -cient water to meet crop consumptive use requirements in average rainfall years. When precipitation during the crop-growing season falls short, some producers supplement with irrigation to meet crop water-use requirements.17 Historically, irrigated production has accounted for a small share of crop production in the Eastern States. Since the mid-1990s, however, crop irri-gation has expanded signifi cantly across the East, increasing by nearly 20 percent from 1998 to 2008 and by 15 percent since 2003 (USDA/NASS, 2010).18 Irrigation has increased in the Eastern States primarily because of increases in commodity prices and yields, increased risk avoidance due to recurring drought conditions, and access to available groundwater supplies at relatively low cost due to shallow aquifer pumping depths (Midwest Irrigation, 2010; Fischer Farm Services, 2011; Evett et al., 2003; Vories and Evett, 2010).
In 2008, nearly 79 percent of crop water applied in the Eastern States was pumped from shallow aquifers subject to annual recharge that also often serve as the primary source for downstream surface-water fl ows for nonagri-cultural uses (USDA/NASS, 2010; USGS, 2011). Less than 4 percent of the water for eastern irrigated agriculture has come from off-farm water sources. At the same time, population growth has increased water demand to meet the needs of urban/industrial growth and recreation, while changing social values have increased pressure for improved water quality and ecosystem services. Water supplies also have tightened in many eastern watersheds. Expanded
17While all irrigation is supplemental to rainfed crop production, irrigation in humid regions is often referred to as supplemental (or complementary) within the scientifi c literature (Evans and Sadler, 2008; Clemmens et al., 2008) because irrigation in humid regions is understood to be a “tactical measure to complement reasonably suffi cient rainfall and to stabilize production despite short-term droughts” (Evans and Sadler, 2008).
18The largest irrigation increases in the East since 1998 have been in the Southeast (Georgia at 56 percent and Alabama at 60 percent), the Lower Mississippi Delta (Missouri at 48 percent, Arkansas at 11 percent, and Mississippi at 31 percent), and the Upper Midwest (Minnesota at 57 percent and Michigan at 45 percent).
14Water Conservation in Irrigated Agriculture: Trends and Challenges in the Face of Emerging Demands / EIB-99
Economic Research Service/USDA
groundwater use for irrigated agriculture has contributed to declining aquifer water levels, rising pumping costs, and saltwater intrusion near coastal regions. The increasing importance of groundwater resources for nonagri-culture uses, the lack of reliable surface-water supplies because of limited annual carryover storage capacity, rising irrigation pumping costs, and water-quality concerns from irrigation system losses have all heightened concerns for onfarm water conservation as a critical component of a sustainable irri-gated agriculture sector in the Eastern States. As a result, advancing onfarm water conservation is as important throughout much of the 31 Eastern States as it is in the 17 Western States.
15Water Conservation in Irrigated Agriculture: Trends and Challenges in the Face of Emerging Demands / EIB-99
Economic Research Service/USDA
How Important Is Irrigationto U.S. Agriculture?
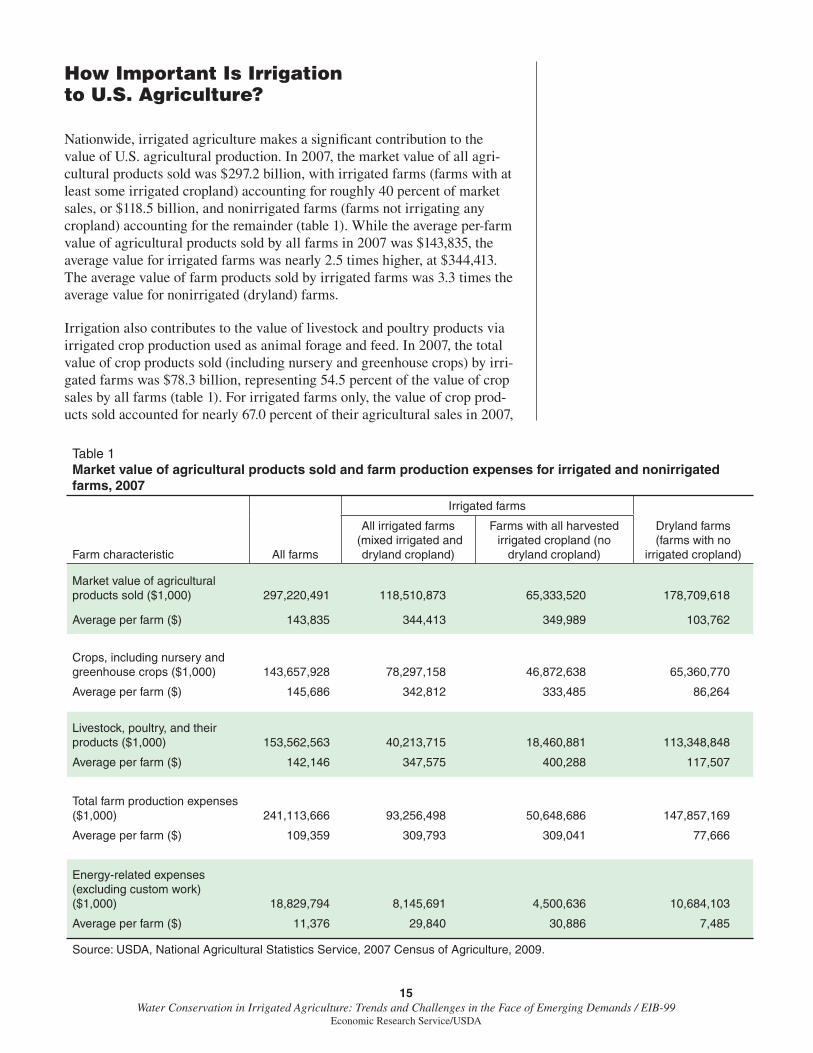
Nationwide, irrigated agriculture makes a signifi cant contribution to the value of U.S. agricultural production. In 2007, the market value of all agri-cultural products sold was $297.2 billion, with irrigated farms (farms with at least some irrigated cropland) accounting for roughly 40 percent of market sales, or $118.5 billion, and nonirrigated farms (farms not irrigating any cropland) accounting for the remainder (table 1). While the average per-farm value of agricultural products sold by all farms in 2007 was $143,835, the average value for irrigated farms was nearly 2.5 times higher, at $344,413. The average value of farm products sold by irrigated farms was 3.3 times the average value for nonirrigated (dryland) farms.
Irrigation also contributes to the value of livestock and poultry products via irrigated crop production used as animal forage and feed. In 2007, the total value of crop products sold (including nursery and greenhouse crops) by irri-gated farms was $78.3 billion, representing 54.5 percent of the value of crop sales by all farms (table 1). For irrigated farms only, the value of crop prod-ucts sold accounted for nearly 67.0 percent of their agricultural sales in 2007,
Table 1Market value of agricultural products sold and farm production expenses for irrigated and nonirrigated farms, 2007
Irrigated farms
Farm characteristic All farms
All irrigated farms (mixed irrigated and
dryland cropland)
Farms with all harvested irrigated cropland (no
dryland cropland)
Dryland farms(farms with no
irrigated cropland)
Market value of agricultural products sold ($1,000) 297,220,491 118,510,873 65,333,520 178,709,618
Average per farm ($) 143,835 344,413 349,989 103,762
Crops, including nursery and greenhouse crops ($1,000)
143,657,928 78,297,158 46,872,638 65,360,770
Average per farm ($) 145,686 342,812 333,485 86,264
Livestock, poultry, and their products ($1,000) 153,562,563 40,213,715 18,460,881 113,348,848
Average per farm ($) 142,146 347,575 400,288 117,507
Total farm production expenses ($1,000) 241,113,666 93,256,498 50,648,686 147,857,169
Average per farm ($) 109,359 309,793 309,041 77,666
Energy-related expenses (excluding custom work) ($1,000) 18,829,794 8,145,691 4,500,636 10,684,103
Average per farm ($) 11,376 29,840 30,886 7,485
Source: USDA, National Agricultural Statistics Service, 2007 Census of Agriculture, 2009.
16Water Conservation in Irrigated Agriculture: Trends and Challenges in the Face of Emerging Demands / EIB-99
Economic Research Service/USDA
with livestock products accounting for roughly a third of market sales.19 In general, nonirrigated farms were more dependent upon livestock and poultry sales; crop sales accounted for 36.6 percent of agricultural product sales in 2007, while livestock/poultry sales accounted for 63.4 percent.
Where Does Irrigation Occur and What Does It Produce?
In 2007, 56.6 million farmland acres were irrigated across the United States (51.5 million acres of harvested cropland and 5.1 million acres of pasture-land and other cropland), accounting for about 7.5 percent of all cropland and pastureland. About 16.6 percent of U.S. harvested cropland acres were irrigated, while only 1.2 percent of pastureland acres were irrigated (USDA/NASS, 2009). Nearly three-quarters of U.S. irrigated agriculture occurred in the 17 contiguous Western States, including 73.0 percent of harvested irri-gated cropland and 94.0 percent of irrigated pastureland.
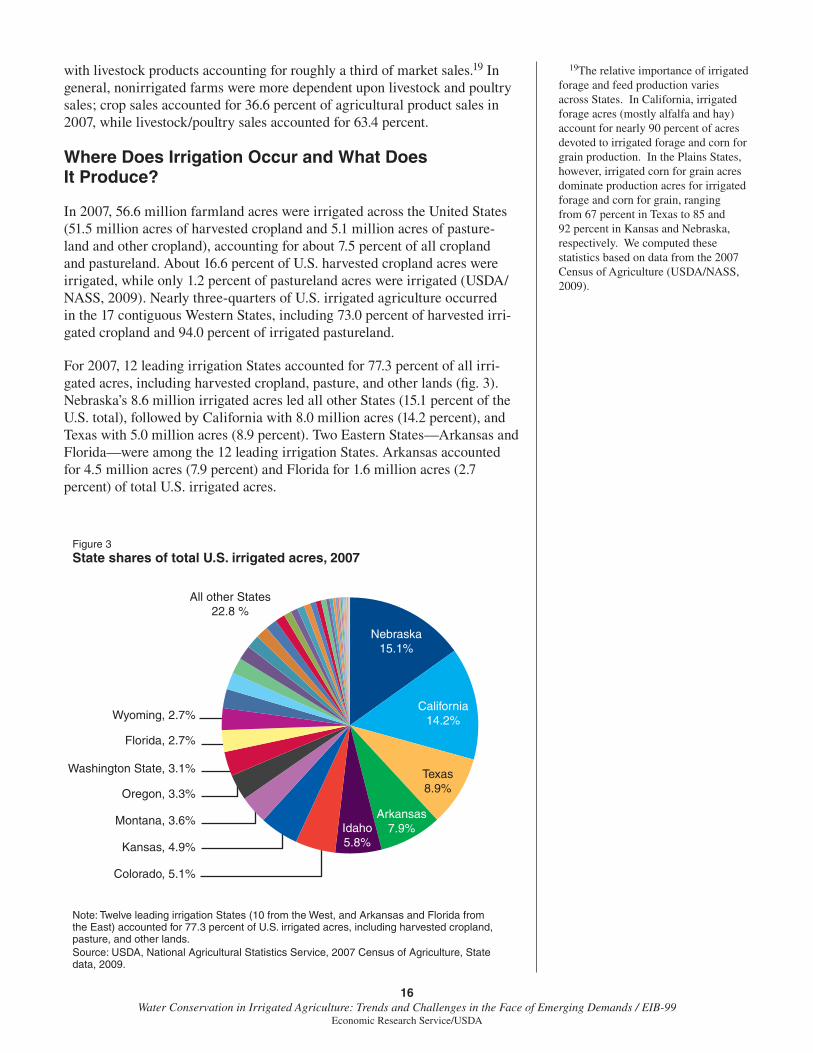
For 2007, 12 leading irrigation States accounted for 77.3 percent of all irri-gated acres, including harvested cropland, pasture, and other lands (fi g. 3). Nebraska’s 8.6 million irrigated acres led all other States (15.1 percent of the U.S. total), followed by California with 8.0 million acres (14.2 percent), and Texas with 5.0 million acres (8.9 percent). Two Eastern States—Arkansas and Florida—were among the 12 leading irrigation States. Arkansas accounted for 4.5 million acres (7.9 percent) and Florida for 1.6 million acres (2.7 percent) of total U.S. irrigated acres.
19The relative importance of irrigated forage and feed production varies across States. In California, irrigated forage acres (mostly alfalfa and hay) account for nearly 90 percent of acres devoted to irrigated forage and corn for grain production. In the Plains States, however, irrigated corn for grain acres dominate production acres for irrigated forage and corn for grain, ranging from 67 percent in Texas to 85 and 92 percent in Kansas and Nebraska, respectively. We computed these statistics based on data from the 2007 Census of Agriculture (USDA/NASS, 2009).
Note: Twelve leading irrigation States (10 from the West, and Arkansas and Florida from the East) accounted for 77.3 percent of U.S. irrigated acres, including harvested cropland, pasture, and other lands.Source: USDA, National Agricultural Statistics Service, 2007 Census of Agriculture, State data, 2009.
Figure 3State shares of total U.S. irrigated acres, 2007
Nebraska15.1%
California14.2%
Texas8.9%
Arkansas7.9%Idaho
5.8%
Colorado, 5.1%
Kansas, 4.9%
Montana, 3.6%
Oregon, 3.3%
Washington State, 3.1%
Florida, 2.7%
Wyoming, 2.7%
All other States22.8 %
17Water Conservation in Irrigated Agriculture: Trends and Challenges in the Face of Emerging Demands / EIB-99
Economic Research Service/USDA
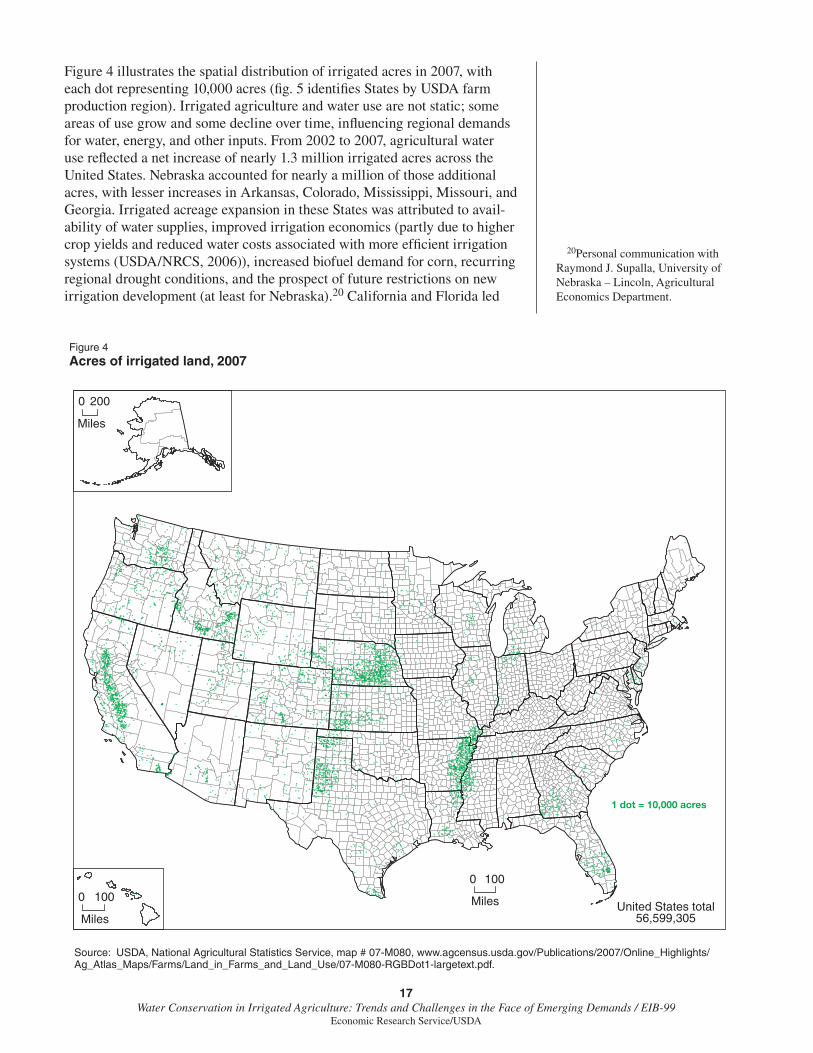
Figure 4 illustrates the spatial distribution of irrigated acres in 2007, with each dot representing 10,000 acres (fi g. 5 identifi es States by USDA farm production region). Irrigated agriculture and water use are not static; some areas of use grow and some decline over time, infl uencing regional demands for water, energy, and other inputs. From 2002 to 2007, agricultural water use refl ected a net increase of nearly 1.3 million irrigated acres across the United States. Nebraska accounted for nearly a million of those additional acres, with lesser increases in Arkansas, Colorado, Mississippi, Missouri, and Georgia. Irrigated acreage expansion in these States was attributed to avail-ability of water supplies, improved irrigation economics (partly due to higher crop yields and reduced water costs associated with more effi cient irrigation systems (USDA/NRCS, 2006)), increased biofuel demand for corn, recurring regional drought conditions, and the prospect of future restrictions on new irrigation development (at least for Nebraska).20 California and Florida led
20Personal communication with Raymond J. Supalla, University of Nebraska – Lincoln, Agricultural Economics Department.
Source: USDA, National Agricultural Statistics Service, map # 07-M080, www.agcensus.usda.gov/Publications/2007/Online_Highlights/Ag_Atlas_Maps/Farms/Land_in_Farms_and_Land_Use/07-M080-RGBDot1-largetext.pdf.
Figure 4Acres of irrigated land, 2007
1 dot = 10,000 acres
United States total56,599,305
0 100
Miles0 100
Miles
0 200
Miles
18Water Conservation in Irrigated Agriculture: Trends and Challenges in the Face of Emerging Demands / EIB-99
Economic Research Service/USDA
among States where irrigated acres fell from 2002 to 2007, with declines of nearly 0.7 million acres and 0.3 million acres, respectively.21, 22
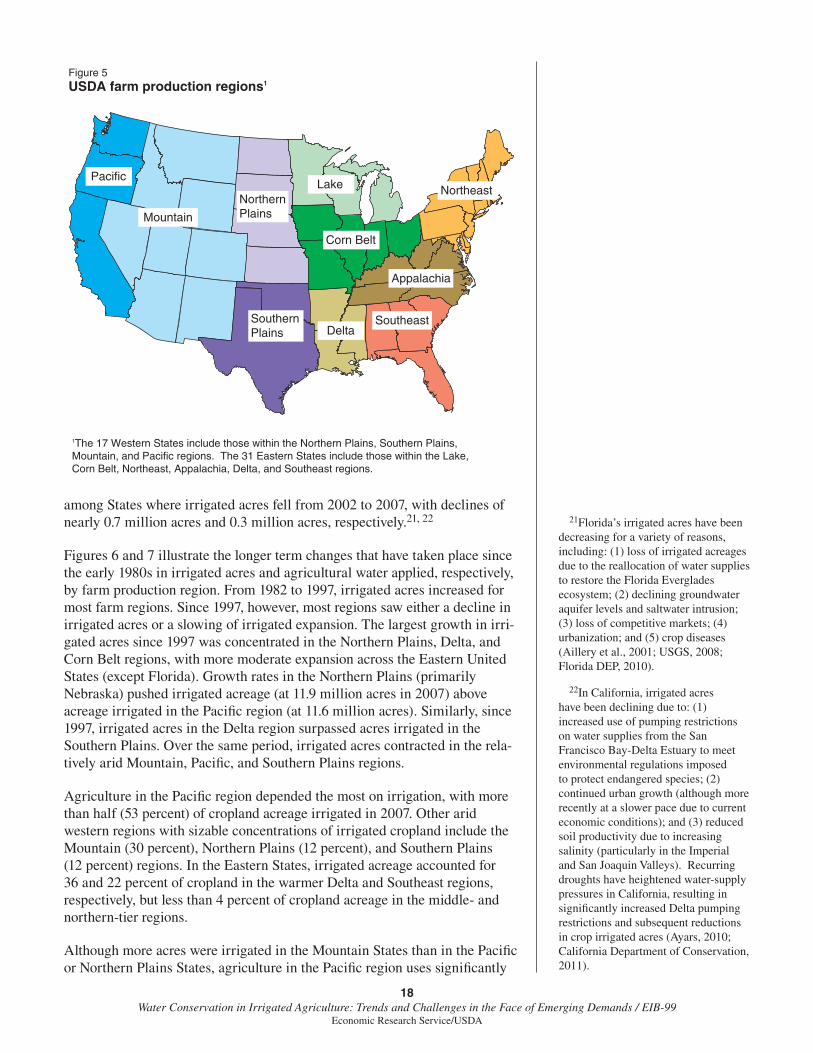
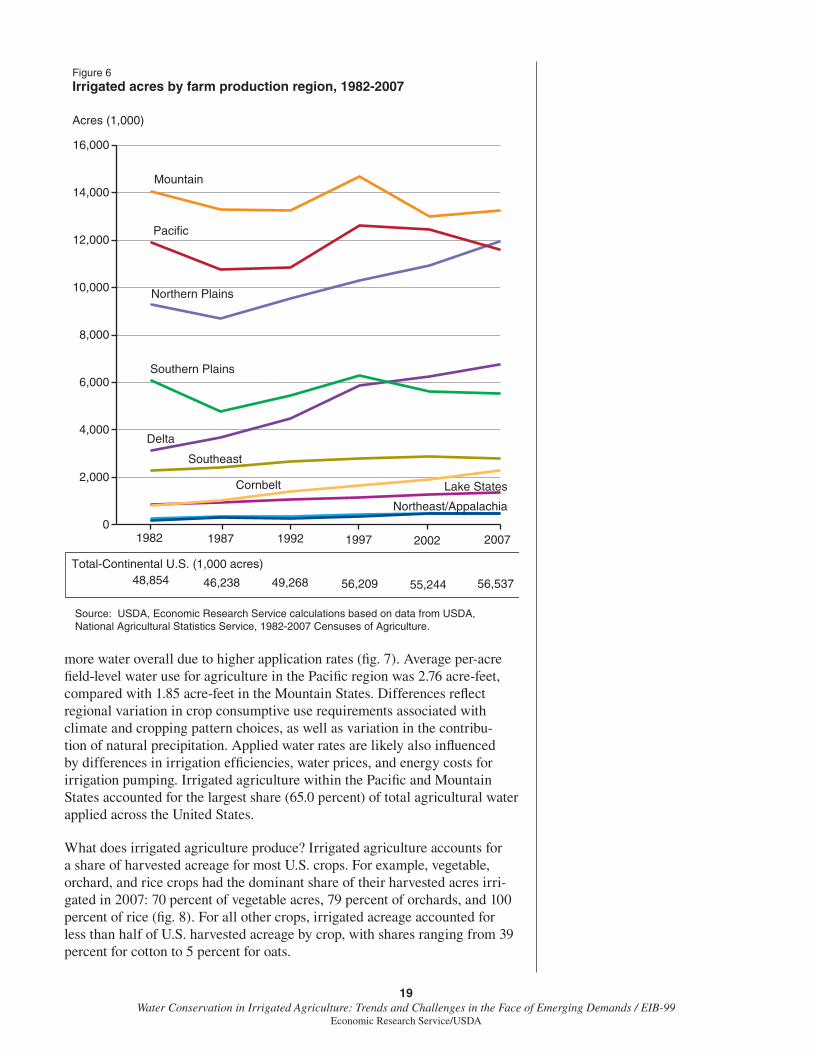
Figures 6 and 7 illustrate the longer term changes that have taken place since the early 1980s in irrigated acres and agricultural water applied, respectively, by farm production region. From 1982 to 1997, irrigated acres increased for most farm regions. Since 1997, however, most regions saw either a decline in irrigated acres or a slowing of irrigated expansion. The largest growth in irri-gated acres since 1997 was concentrated in the Northern Plains, Delta, and Corn Belt regions, with more moderate expansion across the Eastern United States (except Florida). Growth rates in the Northern Plains (primarily Nebraska) pushed irrigated acreage (at 11.9 million acres in 2007) above acreage irrigated in the Pacifi c region (at 11.6 million acres). Similarly, since 1997, irrigated acres in the Delta region surpassed acres irrigated in the Southern Plains. Over the same period, irrigated acres contracted in the rela-tively arid Mountain, Pacifi c, and Southern Plains regions.
Agriculture in the Pacifi c region depended the most on irrigation, with more than half (53 percent) of cropland acreage irrigated in 2007. Other arid western regions with sizable concentrations of irrigated cropland include the Mountain (30 percent), Northern Plains (12 percent), and Southern Plains (12 percent) regions. In the Eastern States, irrigated acreage accounted for 36 and 22 percent of cropland in the warmer Delta and Southeast regions, respectively, but less than 4 percent of cropland acreage in the middle- and northern-tier regions.
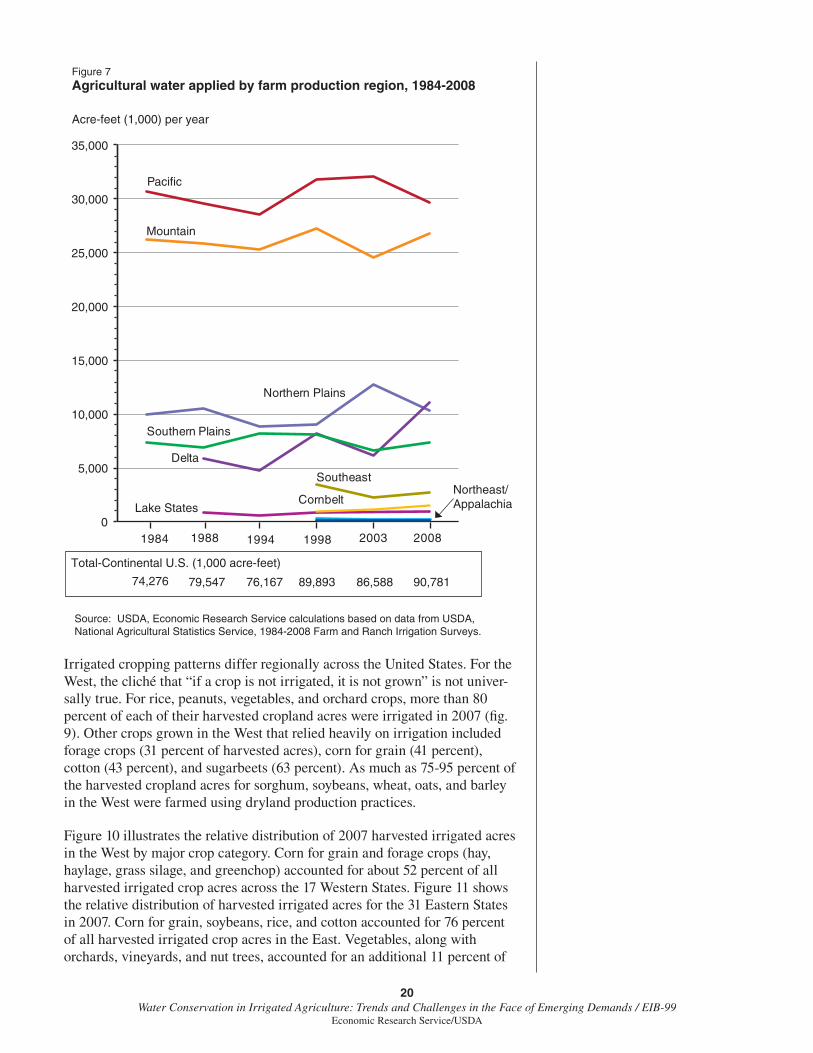
Although more acres were irrigated in the Mountain States than in the Pacifi c or Northern Plains States, agriculture in the Pacifi c region uses signifi cantly
21Florida’s irrigated acres have been decreasing for a variety of reasons, including: (1) loss of irrigated acreages due to the reallocation of water supplies to restore the Florida Everglades ecosystem; (2) declining groundwater aquifer levels and saltwater intrusion; (3) loss of competitive markets; (4) urbanization; and (5) crop diseases (Aillery et al., 2001; USGS, 2008; Florida DEP, 2010).
22In California, irrigated acres have been declining due to: (1) increased use of pumping restrictions on water supplies from the San Francisco Bay-Delta Estuary to meet environmental regulations imposed to protect endangered species; (2) continued urban growth (although more recently at a slower pace due to current economic conditions); and (3) reduced soil productivity due to increasing salinity (particularly in the Imperial and San Joaquin Valleys). Recurring droughts have heightened water-supply pressures in California, resulting in signifi cantly increased Delta pumping restrictions and subsequent reductions in crop irrigated acres (Ayars, 2010; California Department of Conservation, 2011).
1The 17 Western States include those within the Northern Plains, Southern Plains, Mountain, and Pacific regions. The 31 Eastern States include those within the Lake, Corn Belt, Northeast, Appalachia, Delta, and Southeast regions.
Figure 5USDA farm production regions1
PacificLake
Delta
Corn Belt
Mountain
Southeast
Northeast
Appalachia
NorthernPlains
SouthernPlains
19Water Conservation in Irrigated Agriculture: Trends and Challenges in the Face of Emerging Demands / EIB-99
Economic Research Service/USDA
more water overall due to higher application rates (fi g. 7). Average per-acre fi eld-level water use for agriculture in the Pacifi c region was 2.76 acre-feet, compared with 1.85 acre-feet in the Mountain States. Differences refl ect regional variation in crop consumptive use requirements associated with climate and cropping pattern choices, as well as variation in the contribu-tion of natural precipitation. Applied water rates are likely also infl uenced by differences in irrigation effi ciencies, water prices, and energy costs for irrigation pumping. Irrigated agriculture within the Pacifi c and Mountain States accounted for the largest share (65.0 percent) of total agricultural water applied across the United States.
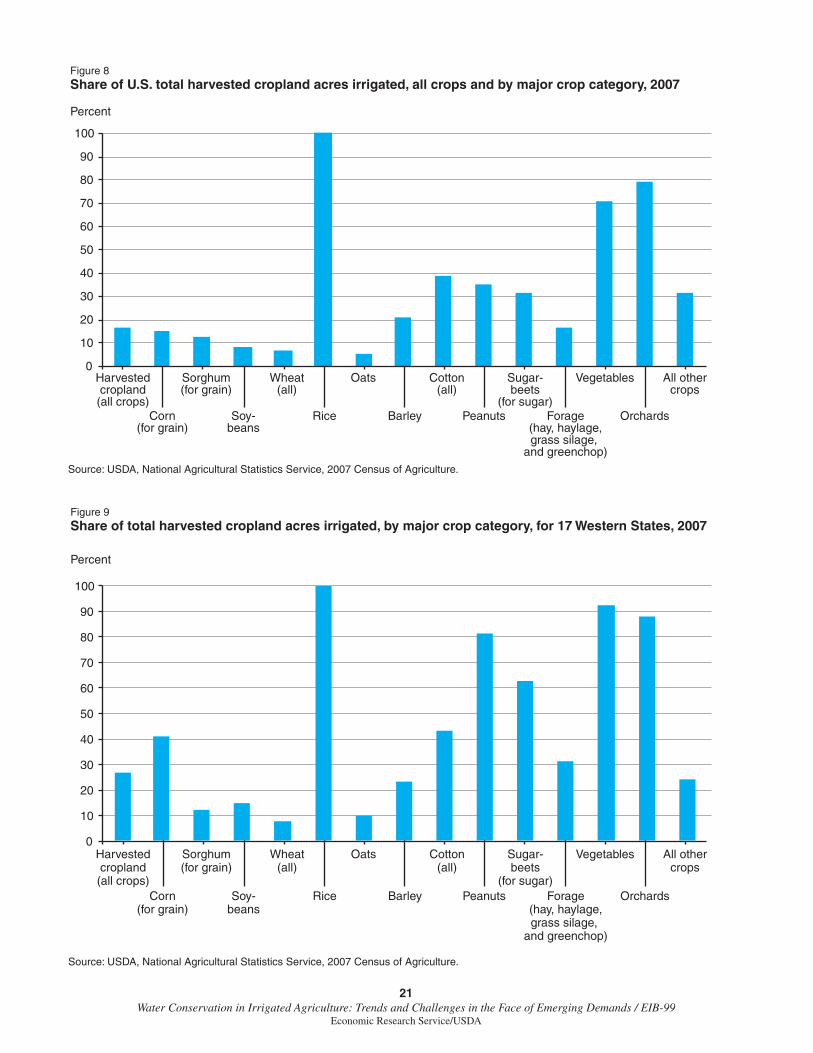
What does irrigated agriculture produce? Irrigated agriculture accounts for a share of harvested acreage for most U.S. crops. For example, vegetable, orchard, and rice crops had the dominant share of their harvested acres irri-gated in 2007: 70 percent of vegetable acres, 79 percent of orchards, and 100 percent of rice (fi g. 8). For all other crops, irrigated acreage accounted for less than half of U.S. harvested acreage by crop, with shares ranging from 39 percent for cotton to 5 percent for oats.
Source: USDA, Economic Research Service calculations based on data from USDA, National Agricultural Statistics Service, 1982-2007 Censuses of Agriculture.
Total-Continental U.S. (1,000 acres) 48,854
Figure 6Irrigated acres by farm production region, 1982-2007
Acres (1,000)
0
2,000
4,000
6,000
8,000
10,000
12,000
14,000
16,000
Mountain
Pacific
Northern Plains
Delta
Cornbelt Lake States
Southern Plains
Northeast/Appalachia
Southeast
1982 1987 1992 1997 2002 2007
46,238 49,268 56,209 55,244 56,537
20Water Conservation in Irrigated Agriculture: Trends and Challenges in the Face of Emerging Demands / EIB-99
Economic Research Service/USDA
Irrigated cropping patterns differ regionally across the United States. For the West, the cliché that “if a crop is not irrigated, it is not grown” is not univer-sally true. For rice, peanuts, vegetables, and orchard crops, more than 80 percent of each of their harvested cropland acres were irrigated in 2007 (fi g. 9). Other crops grown in the West that relied heavily on irrigation included forage crops (31 percent of harvested acres), corn for grain (41 percent), cotton (43 percent), and sugarbeets (63 percent). As much as 75-95 percent of the harvested cropland acres for sorghum, soybeans, wheat, oats, and barley in the West were farmed using dryland production practices.
Figure 10 illustrates the relative distribution of 2007 harvested irrigated acres in the West by major crop category. Corn for grain and forage crops (hay, haylage, grass silage, and greenchop) accounted for about 52 percent of all harvested irrigated crop acres across the 17 Western States. Figure 11 shows the relative distribution of harvested irrigated acres for the 31 Eastern States in 2007. Corn for grain, soybeans, rice, and cotton accounted for 76 percent of all harvested irrigated crop acres in the East. Vegetables, along with orchards, vineyards, and nut trees, accounted for an additional 11 percent of
Source: USDA, Economic Research Service calculations based on data from USDA, National Agricultural Statistics Service, 1984-2008 Farm and Ranch Irrigation Surveys.
Total-Continental U.S. (1,000 acre-feet)
74,276
Figure 7Agricultural water applied by farm production region, 1984-2008
Acre-feet (1,000) per year
Lake States
Northeast/Appalachia
79,547 76,167 89,893 86,588 90,781
0
5,000
10,000
15,000
20,000
25,000
30,000
35,000
1984 1988 1994 1998 2003 2008
Mountain
Pacific
Northern Plains
Southern Plains
Southeast
Delta
Cornbelt
21Water Conservation in Irrigated Agriculture: Trends and Challenges in the Face of Emerging Demands / EIB-99
Economic Research Service/USDA
Source: USDA, National Agricultural Statistics Service, 2007 Census of Agriculture.
Figure 8Share of U.S. total harvested cropland acres irrigated, all crops and by major crop category, 2007
Percent
Harvestedcropland(all crops)
Sorghum(for grain)
Wheat(all)
Cotton(all)
Sugar-beets
(for sugar)Peanuts OrchardsForage
(hay, haylage, grass silage,
and greenchop)
Rice
Oats Vegetables All othercrops
BarleyCorn(for grain)
Soy-beans
0
10
20
30
40
50
60
70
80
90
100
Source: USDA, National Agricultural Statistics Service, 2007 Census of Agriculture.
Figure 9Share of total harvested cropland acres irrigated, by major crop category, for 17 Western States, 2007
Percent
Harvestedcropland(all crops)
Sorghum(for grain)
Wheat(all)
Cotton(all)
Sugar-beets
(for sugar)Peanuts OrchardsForage
(hay, haylage, grass silage,
and greenchop)
Rice
Oats Vegetables All othercrops
BarleyCorn(for grain)
Soy-beans
0
10
20
30
40
50
60
70
80
90
100
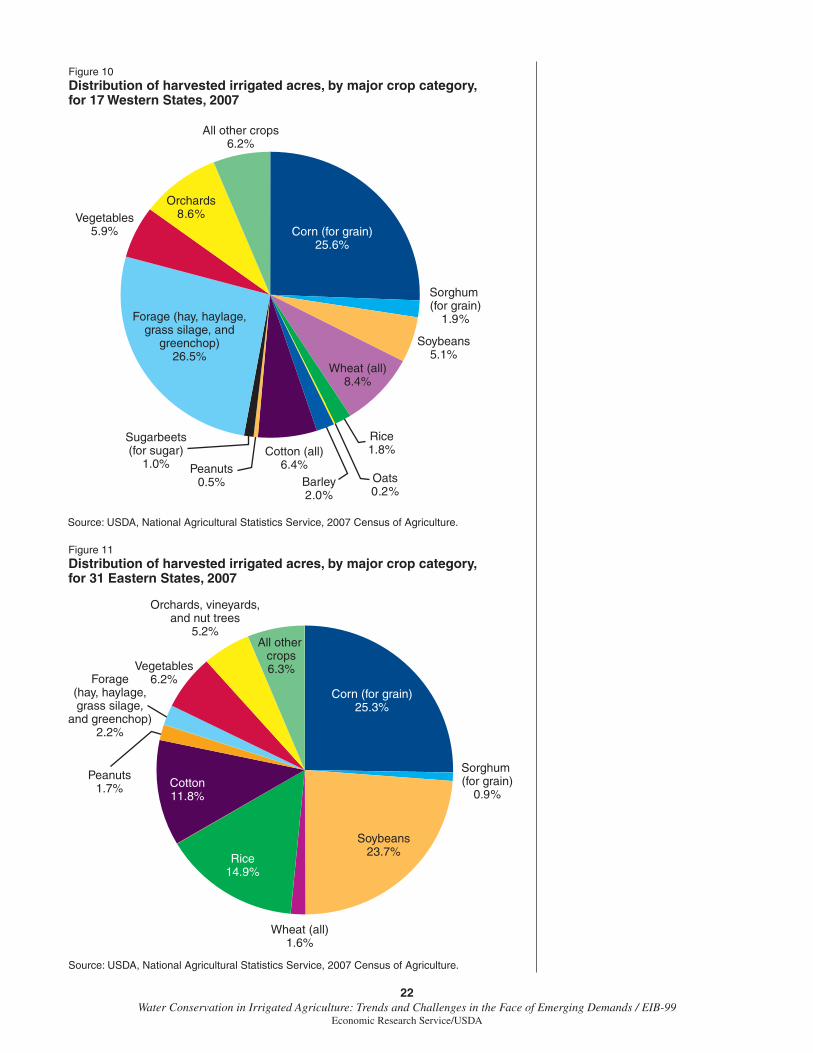
22Water Conservation in Irrigated Agriculture: Trends and Challenges in the Face of Emerging Demands / EIB-99
Economic Research Service/USDA
Source: USDA, National Agricultural Statistics Service, 2007 Census of Agriculture.
Figure 10Distribution of harvested irrigated acres, by major crop category, for 17 Western States, 2007
Sorghum (for grain)
1.9%
Wheat (all)8.4%
Cotton (all)6.4%
Sugarbeets(for sugar)
1.0% Peanuts0.5%
Orchards8.6%
Rice1.8%
Oats0.2%
Vegetables5.9%
All other crops6.2%
Barley2.0%
Corn (for grain)25.6%
Soybeans5.1%
Forage (hay, haylage, grass silage, and
greenchop)26.5%
Source: USDA, National Agricultural Statistics Service, 2007 Census of Agriculture.
Figure 11Distribution of harvested irrigated acres, by major crop category, for 31 Eastern States, 2007
Sorghum (for grain)
0.9%
Wheat (all)1.6%
Peanuts1.7%
Orchards, vineyards,and nut trees
5.2%
Forage (hay, haylage, grass silage,
and greenchop)2.2%
Corn (for grain)25.3%
Soybeans23.7%Rice
14.9%
Cotton11.8%
Vegetables6.2%
All other crops6.3%
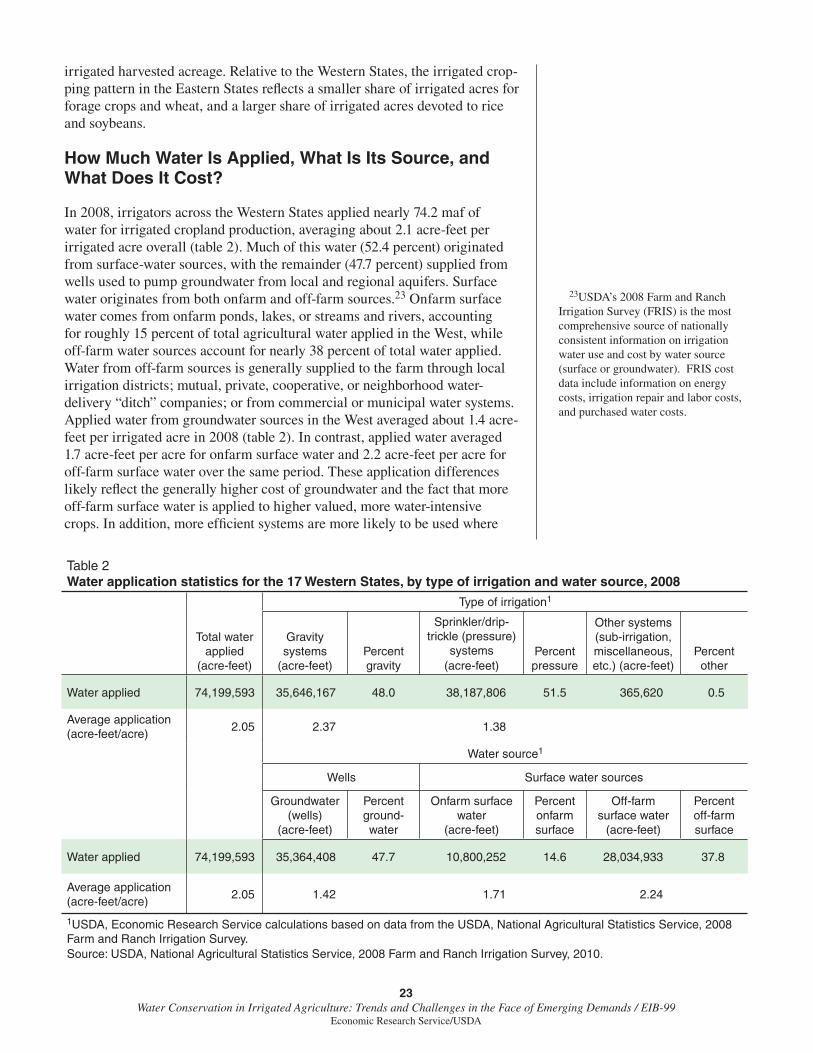
23Water Conservation in Irrigated Agriculture: Trends and Challenges in the Face of Emerging Demands / EIB-99
Economic Research Service/USDA
irrigated harvested acreage. Relative to the Western States, the irrigated crop-ping pattern in the Eastern States refl ects a smaller share of irrigated acres for forage crops and wheat, and a larger share of irrigated acres devoted to rice and soybeans.
How Much Water Is Applied, What Is Its Source, and What Does It Cost?
In 2008, irrigators across the Western States applied nearly 74.2 maf of water for irrigated cropland production, averaging about 2.1 acre-feet per irrigated acre overall (table 2). Much of this water (52.4 percent) originated from surface-water sources, with the remainder (47.7 percent) supplied from wells used to pump groundwater from local and regional aquifers. Surface water originates from both onfarm and off-farm sources.23 Onfarm surface water comes from onfarm ponds, lakes, or streams and rivers, accounting for roughly 15 percent of total agricultural water applied in the West, while off-farm water sources account for nearly 38 percent of total water applied. Water from off-farm sources is generally supplied to the farm through local irrigation districts; mutual, private, cooperative, or neighborhood water-delivery “ditch” companies; or from commercial or municipal water systems. Applied water from groundwater sources in the West averaged about 1.4 acre-feet per irrigated acre in 2008 (table 2). In contrast, applied water averaged 1.7 acre-feet per acre for onfarm surface water and 2.2 acre-feet per acre for off-farm surface water over the same period. These application differences likely refl ect the generally higher cost of groundwater and the fact that more off-farm surface water is applied to higher valued, more water-intensive crops. In addition, more effi cient systems are more likely to be used where
23USDA’s 2008 Farm and Ranch Irrigation Survey (FRIS) is the most comprehensive source of nationally consistent information on irrigation water use and cost by water source (surface or groundwater). FRIS cost data include information on energy costs, irrigation repair and labor costs, and purchased water costs.
Table 2Water application statistics for the 17 Western States, by type of irrigation and water source, 2008
Type of irrigation1
Total water applied
(acre-feet)
Gravity systems
(acre-feet)Percent gravity
Sprinkler/drip-trickle (pressure)
systems (acre-feet)
Percent pressure
Other systems (sub-irrigation, miscellaneous, etc.) (acre-feet)
Percent other
Water applied 74,199,593 35,646,167 48.0 38,187,806 51.5 365,620 0.5
Average application (acre-feet/acre)
2.05 2.37 1.38
Water source1
Wells Surface water sources
Groundwater (wells)
(acre-feet)
Percent ground-water
Onfarm surface water
(acre-feet)
Percent onfarm surface
Off-farm surface water
(acre-feet)
Percent off-farm surface
Water applied 74,199,593 35,364,408 47.7 10,800,252 14.6 28,034,933 37.8
Average application (acre-feet/acre)
2.05 1.42 1.71 2.24
1USDA, Economic Research Service calculations based on data from the USDA, National Agricultural Statistics Service, 2008 Farm and Ranch Irrigation Survey.Source: USDA, National Agricultural Statistics Service, 2008 Farm and Ranch Irrigation Survey, 2010.
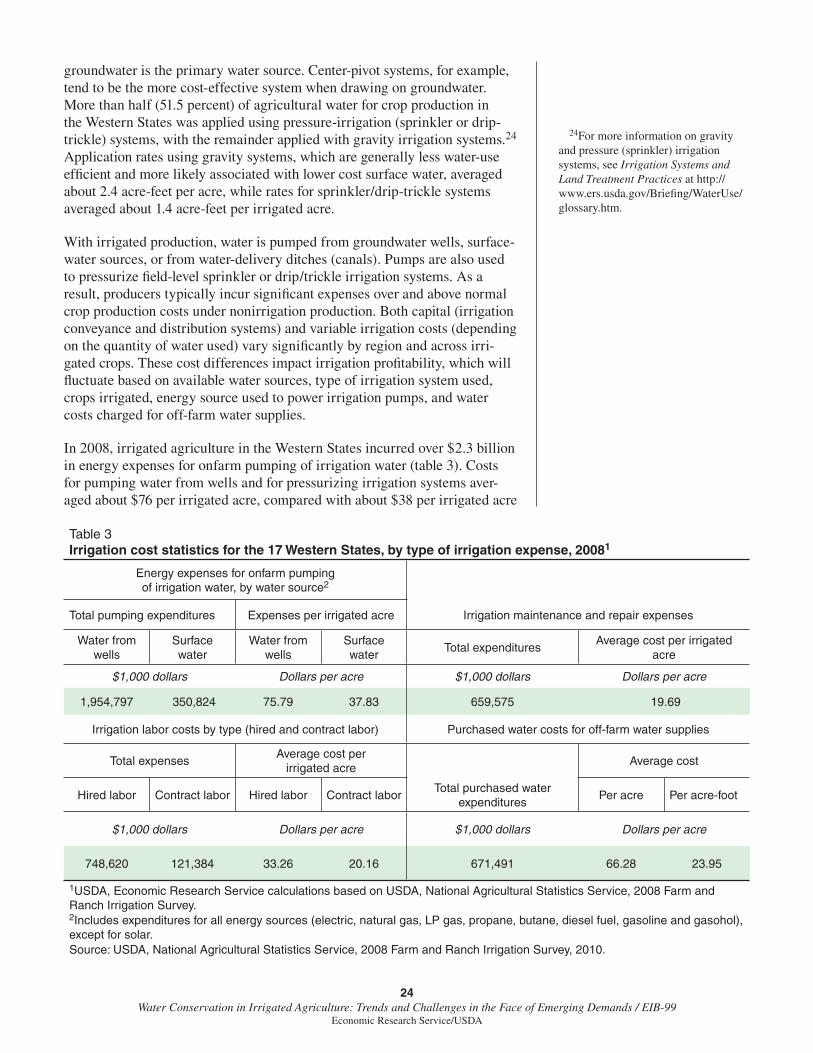
24Water Conservation in Irrigated Agriculture: Trends and Challenges in the Face of Emerging Demands / EIB-99
Economic Research Service/USDA
groundwater is the primary water source. Center-pivot systems, for example, tend to be the more cost-effective system when drawing on groundwater. More than half (51.5 percent) of agricultural water for crop production in the Western States was applied using pressure-irrigation (sprinkler or drip-trickle) systems, with the remainder applied with gravity irrigation systems.24 Application rates using gravity systems, which are generally less water-use effi cient and more likely associated with lower cost surface water, averaged about 2.4 acre-feet per acre, while rates for sprinkler/drip-trickle systems averaged about 1.4 acre-feet per irrigated acre.
With irrigated production, water is pumped from groundwater wells, surface-water sources, or from water-delivery ditches (canals). Pumps are also used to pressurize fi eld-level sprinkler or drip/trickle irrigation systems. As a result, producers typically incur signifi cant expenses over and above normal crop production costs under nonirrigation production. Both capital (irrigation conveyance and distribution systems) and variable irrigation costs (depending on the quantity of water used) vary signifi cantly by region and across irri-gated crops. These cost differences impact irrigation profi tability, which will fl uctuate based on available water sources, type of irrigation system used, crops irrigated, energy source used to power irrigation pumps, and water costs charged for off-farm water supplies.
In 2008, irrigated agriculture in the Western States incurred over $2.3 billion in energy expenses for onfarm pumping of irrigation water (table 3). Costs for pumping water from wells and for pressurizing irrigation systems aver-aged about $76 per irrigated acre, compared with about $38 per irrigated acre
24For more information on gravity and pressure (sprinkler) irrigation systems, see Irrigation Systems and Land Treatment Practices at http://www.ers.usda.gov/Briefi ng/WaterUse/glossary.htm.
Table 3Irrigation cost statistics for the 17 Western States, by type of irrigation expense, 20081
Energy expenses for onfarm pumpingof irrigation water, by water source2
Total pumping expenditures Expenses per irrigated acre Irrigation maintenance and repair expenses
Water from wells
Surface water
Water from wells
Surface water
Total expendituresAverage cost per irrigated
acre
$1,000 dollars Dollars per acre $1,000 dollars Dollars per acre
1,954,797 350,824 75.79 37.83 659,575 19.69
Irrigation labor costs by type (hired and contract labor) Purchased water costs for off-farm water supplies
Total expensesAverage cost per
irrigated acreAverage cost
Hired labor Contract labor Hired labor Contract laborTotal purchased water
expendituresPer acre Per acre-foot
$1,000 dollars Dollars per acre $1,000 dollars Dollars per acre
748,620 121,384 33.26 20.16 671,491 66.28 23.95
1USDA, Economic Research Service calculations based on USDA, National Agricultural Statistics Service, 2008 Farm and Ranch Irrigation Survey.2Includes expenditures for all energy sources (electric, natural gas, LP gas, propane, butane, diesel fuel, gasoline and gasohol), except for solar.Source: USDA, National Agricultural Statistics Service, 2008 Farm and Ranch Irrigation Survey, 2010.
25Water Conservation in Irrigated Agriculture: Trends and Challenges in the Face of Emerging Demands / EIB-99
Economic Research Service/USDA
for water supplied from a surface source. Maintenance and repair costs for onfarm irrigation systems in the West totaled nearly $660 million (or $20 per irrigated acre). Irrigation labor costs totaled about $870 million ($749 million for hired labor and $121 million for contract labor). Hired labor averaged about $33 per irrigated acre, while contract labor averaged $20 per acre. In addition, irrigators using off-farm water supplies paid over $671 million for purchased water from irrigation districts and other off-farm water suppliers. Purchased water costs across the West averaged about $66 per irrigated acre, or $24 per acre-foot of water. However, total variable irrigation costs can vary signifi cantly across water sources. In 2008, variable irrigation costs across the West averaged about $91 per acre for a farm using onfarm surface water, $129 per acre for a farm pumping groundwater, and $144 per acre for a farm pumping purchased surface water and using contract labor. In the 31 Eastern States, average variable irrigation costs ranged from $65 to $75 per acre. Average costs were lower in Eastern States because groundwater pumping depths are generally shallower and purchased-water costs averaged less than $10 per acre, compared with $66 per acre in the West (purchased water from off-farm sources account for less than 4 percent of irrigation water supplies in Eastern States).
26Water Conservation in Irrigated Agriculture: Trends and Challenges in the Face of Emerging Demands / EIB-99
Economic Research Service/USDA
How Effi cient Is Irrigated Agriculture?
Prior to the 1970s, gravity-fed furrow and fl ood irrigation systems were the dominant production systems for irrigated crop agriculture. By 1978, sprinkler irrigation, including center-pivot systems, accounted for about 35 percent of crop irrigation in the Western States. Virtually all of this transition involved adoption of high-pressure sprinkler irrigation. While the center-pivot system improved fi eld irrigation effi ciency, water conservation was not the primary motivation for its widespread adoption. Other factors, such as yield enhancement from uniform water application and irrigation’s expansion into productive lands that were not suitable for a gravity system due to topography, soils, or distance from traditional riparian boundaries, were the primary drivers behind the early transition from gravity-fl ow irrigation to center-pivot sprinkler irrigation.
The expansion of irrigated crop agriculture, along with increasing water demands from nonagricultural users, signifi cantly intensifi ed the competi-tion for available water resources. At the same time, large-scale water supply enhancement was becoming more restricted for fi scal and environmental reasons. Water conservation in irrigated agriculture became an increasingly important focus of water policy to address water allocation concerns. Various water policy analyses as early as the late 1960s recognized the merits of new regulatory, conservation, and water market policies designed to mitigate water resource allocation confl icts (Gardner and Fullerton, 1968; Hamilton et al., 1989; Hornbaker and Mapp, 1988; Howe, 1985; Martin, 1986; Moore, 1991; Schaible, 1997 and 2000; Peterson et al., 2003; Kim et al., 1989; Schaible and Aillery 2003). At the same time, producers receiving assistance from Federal and State resource conservation programs adopted more effi cient irrigation systems to improve irrigation returns, enhance the health and productivity of their resource base, and ensure a more sustainable future for their livelihoods.
Adoption of more effi cient irrigation systems and water management prac-tices has been examined extensively, particularly within the 17 Western States (Schaible and Aillery, 2006; Schaible, 2004; Schaible et al., 2010). Figure 12 illustrates that between 1984 and 2008 a substantial shift has occurred across the Western States away from gravity irrigation to pressure irrigation systems. In 1984, for example, 71 percent of all crop agricultural water in the West was applied using gravity irrigation systems. By 2008, operators used gravity systems to apply just 48 percent of water for crop production, while pressure irrigation systems accounted for 51.5 percent, or an increase of 23 percentage points from 1984. By 2008, much of the acreage in more effi cient pressure irrigation systems included drip, low-pressure sprinkler, or low-energy preci-sion application systems. Improved pressure systems contributed to reduced agricultural water use, as fewer acre-feet were required to irrigate a greater number of acres using these systems. From 1984 to 2008, total irrigated acres across the West increased by 2.1 million acres, while total agricultural water applied declined by nearly 100,000 acre-feet.
Onfarm crop irrigation effi ciency is measured as the fraction of applied water benefi cially used by the crop, including the quantity of water required for crop ET (consumptive use) and water to leach salts from the crop root zone (Howell, 2003; Burt et al., 1997).25 Water applied to crops but not used for
25This defi nition of crop irrigation effi ciency is conceptually consistent with Howell’s (2003) “seasonal irrigation effi ciency” and the “irrigation effi ciency” (IE) performance indicator presented by Burt et al. (1997). Depending upon the crop and region (and consistent with both references cited), crop benefi cial use may also include water for cooling or frost protection of plants, seed bed preparation, enhancement of seed germination, and to meet ET requirements for plants benefi cial to the crop, such as for herbaceous windbreaks and cover crops.
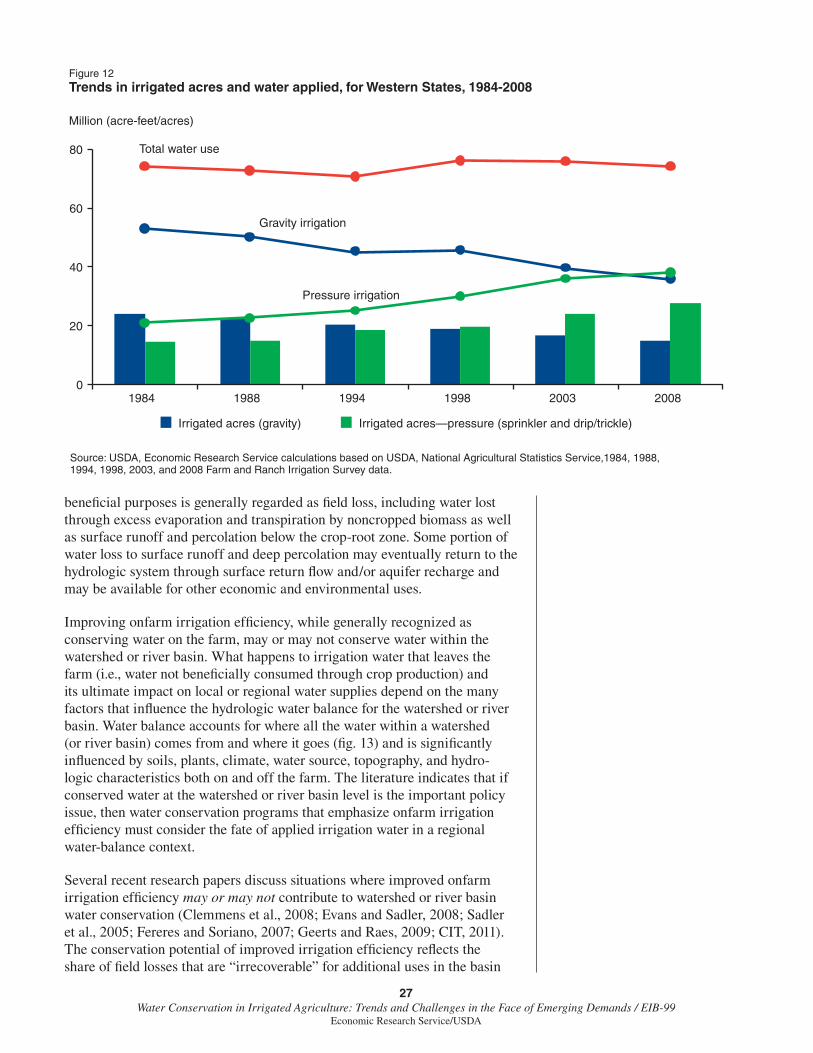
27Water Conservation in Irrigated Agriculture: Trends and Challenges in the Face of Emerging Demands / EIB-99
Economic Research Service/USDA
benefi cial purposes is generally regarded as fi eld loss, including water lost through excess evaporation and transpiration by noncropped biomass as well as surface runoff and percolation below the crop-root zone. Some portion of water loss to surface runoff and deep percolation may eventually return to the hydrologic system through surface return fl ow and/or aquifer recharge and may be available for other economic and environmental uses.
Improving onfarm irrigation effi ciency, while generally recognized as conserving water on the farm, may or may not conserve water within the watershed or river basin. What happens to irrigation water that leaves the farm (i.e., water not benefi cially consumed through crop production) and its ultimate impact on local or regional water supplies depend on the many factors that infl uence the hydrologic water balance for the watershed or river basin. Water balance accounts for where all the water within a watershed (or river basin) comes from and where it goes (fi g. 13) and is signifi cantly infl uenced by soils, plants, climate, water source, topography, and hydro-logic characteristics both on and off the farm. The literature indicates that if conserved water at the watershed or river basin level is the important policy issue, then water conservation programs that emphasize onfarm irrigation effi ciency must consider the fate of applied irrigation water in a regional water-balance context.
Several recent research papers discuss situations where improved onfarm irrigation effi ciency may or may not contribute to watershed or river basin water conservation (Clemmens et al., 2008; Evans and Sadler, 2008; Sadler et al., 2005; Fereres and Soriano, 2007; Geerts and Raes, 2009; CIT, 2011). The conservation potential of improved irrigation effi ciency refl ects the share of fi eld losses that are “irrecoverable” for additional uses in the basin
Source: USDA, Economic Research Service calculations based on USDA, National Agricultural Statistics Service,1984, 1988, 1994, 1998, 2003, and 2008 Farm and Ranch Irrigation Survey data.
Figure 12Trends in irrigated acres and water applied, for Western States, 1984-2008
Million (acre-feet/acres)
0
20
40
60
80
1984 1988 1994 1998 2003 2008
Irrigated acres (gravity) Irrigated acres—pressure (sprinkler and drip/trickle)
Total water use
Gravity irrigation
Pressure irrigation
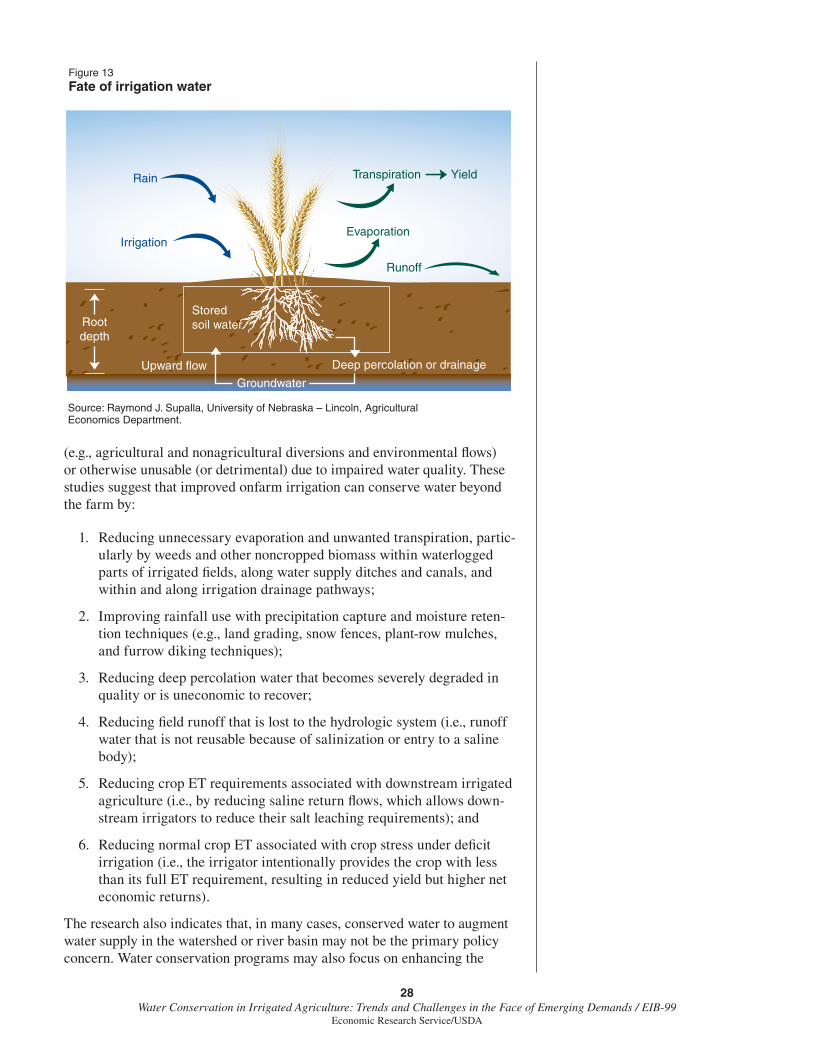
28Water Conservation in Irrigated Agriculture: Trends and Challenges in the Face of Emerging Demands / EIB-99
Economic Research Service/USDA
(e.g., agricultural and nonagricultural diversions and environmental fl ows) or otherwise unusable (or detrimental) due to impaired water quality. These studies suggest that improved onfarm irrigation can conserve water beyond the farm by:
1. Reducing unnecessary evaporation and unwanted transpiration, partic-ularly by weeds and other noncropped biomass within waterlogged parts of irrigated fi elds, along water supply ditches and canals, and within and along irrigation drainage pathways;
2. Improving rainfall use with precipitation capture and moisture reten-tion techniques (e.g., land grading, snow fences, plant-row mulches, and furrow diking techniques);
3. Reducing deep percolation water that becomes severely degraded in quality or is uneconomic to recover;
4. Reducing fi eld runoff that is lost to the hydrologic system (i.e., runoff water that is not reusable because of salinization or entry to a saline body);
5. Reducing crop ET requirements associated with downstream irrigated agriculture (i.e., by reducing saline return fl ows, which allows down-stream irrigators to reduce their salt leaching requirements); and
6. Reducing normal crop ET associated with crop stress under defi cit irrigation (i.e., the irrigator intentionally provides the crop with less than its full ET requirement, resulting in reduced yield but higher net economic returns).
The research also indicates that, in many cases, conserved water to augment water supply in the watershed or river basin may not be the primary policy concern. Water conservation programs may also focus on enhancing the
Source: Raymond J. Supalla, University of Nebraska – Lincoln, Agricultural Economics Department.
Figure 13Fate of irrigation water
Upward flow
TranspirationRain
Irrigation
Yield
Runoff
Evaporation
Deep percolation or drainage
Rootdepth
Stored soil water
Groundwater
29Water Conservation in Irrigated Agriculture: Trends and Challenges in the Face of Emerging Demands / EIB-99
Economic Research Service/USDA
viability and sustainability of the regional agricultural economy, improving the quality and availability of water supplies locally, improving the quality of return fl ows, and reducing environmental degradation of existing regional supplies. Numerous USGS National Water-Quality Assessment studies have identifi ed irrigated agriculture as a key contributor to many of the Nation’s degraded surface water bodies and groundwater aquifers because irrigation often makes heavier use of agricultural chemicals and because excess irriga-tion increases the hydrologic transport of agricultural chemicals, salts, and other soil-based chemicals potentially detrimental to water-based ecosys-tems (USGS, 2011). Thus, without adding to regional water supplies, water conservation programs encouraging improved onfarm irrigation effi ciency may purposefully serve local and regional economic, water-quality, and envi-ronmental goals that contribute to farmer and societal welfare, improve fi sh and wildlife habitat, and reduce ecosystem and human health risks associated with environmental pollution.
The potential for continued improvement in onfarm irrigation effi ciency to contribute to water-conservation program goals relies a great deal on how effi cient U.S. irrigated agriculture is today. Because actual irrigation water use is rarely measured and actual consumptive use can vary signifi cantly depending on agri-climatic conditions, the effi ciency of irrigated agricul-ture (based on the irrigation effi ciency defi nition discussed earlier) cannot be readily measured. An alternative measure of the relative effi ciency of irrigated agriculture demonstrated in Schaible (2004) is based on the rela-tive shares of irrigated acres where water is applied using more effi cient (improved) irrigation systems, determined separately for gravity and pres-sure-sprinkler systems.
Using farm-level data from USDA’s Farm and Ranch Irrigation Survey (FRIS) (USDA/NASS, 1994-2008), we categorized irrigated acres as either “traditional” or “more effi cient” irrigation. More effi cient gravity irrigation includes furrow gravity irrigated acres using an above- or below-ground pipe or a lined open-ditch fi eld water-delivery system, plus acres in fl ood irriga-tion (between borders or within basins) on farms using laser-leveling and pipe or lined open-ditch fi eld water-delivery systems. More-effi cient (improved) pressure-sprinkler irrigation includes acres irrigated using either drip/trickle systems or lower pressure-sprinkler systems (pressure per square-inch (PSI) <30). Both improved gravity and pressure-sprinkler irrigation systems increase the uniformity of water distribution across a fi eld, reduce fi eld runoff and aquifer-seepage losses, reduce evaporation losses, and enhance crop yields.
Figure 14 illustrates the use of more effi cient irrigation (separately for gravity and pressure-sprinkler systems) as a percent of total acres irrigated for the 17 Western States for 1994, 1998, 2003, and 2008. Between 1994 and 1998, the share of Western irrigated acres using improved gravity-fl ow systems increased from 21 to 25 percent. During the same time period, the share of irrigated acres using improved pressure-sprinkler irrigation also increased and accounted for about 23 percent of total irrigated acres in 1998. Thus, more effi cient irrigation in 1998 (based on a physical system-based defi nition, unadjusted for levels of onfarm water management) accounted for about 49 percent of irrigation in the West. From 1998 to 2008, however, the share of gravity-fl ow irrigated acres using improved gravity systems declined. At the
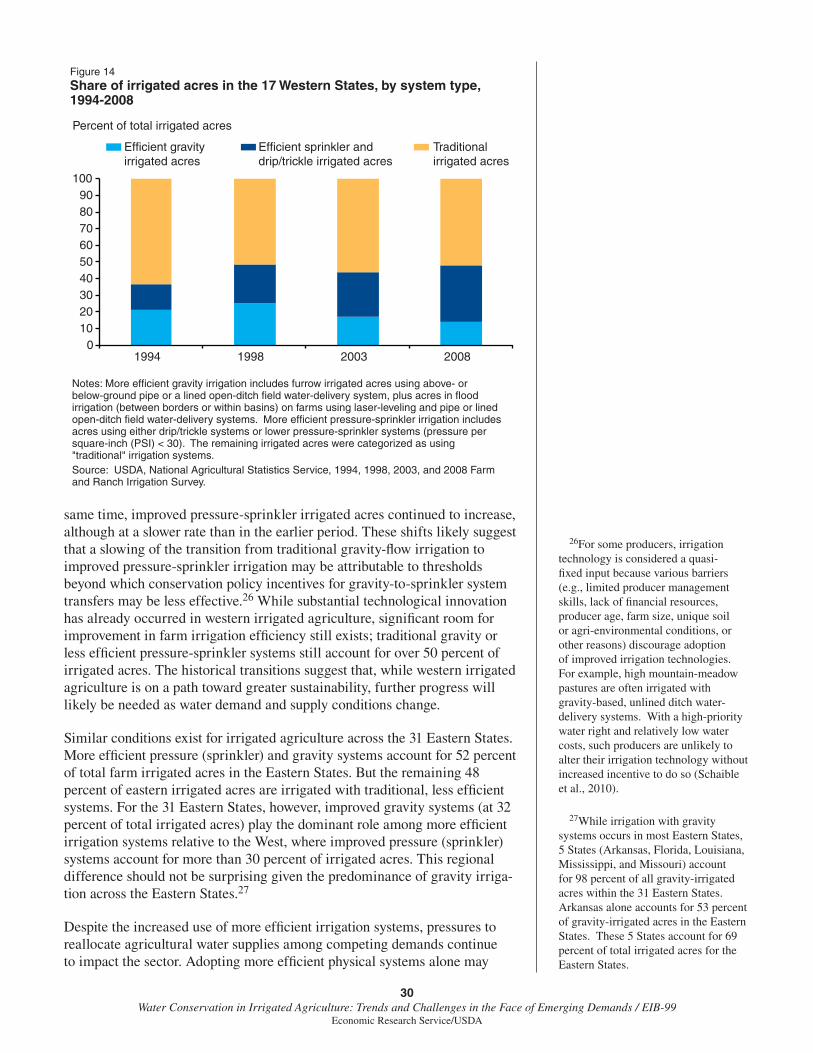
30Water Conservation in Irrigated Agriculture: Trends and Challenges in the Face of Emerging Demands / EIB-99
Economic Research Service/USDA
same time, improved pressure-sprinkler irrigated acres continued to increase, although at a slower rate than in the earlier period. These shifts likely suggest that a slowing of the transition from traditional gravity-fl ow irrigation to improved pressure-sprinkler irrigation may be attributable to thresholds beyond which conservation policy incentives for gravity-to-sprinkler system transfers may be less effective.26 While substantial technological innovation has already occurred in western irrigated agriculture, signifi cant room for improvement in farm irrigation effi ciency still exists; traditional gravity or less effi cient pressure-sprinkler systems still account for over 50 percent of irrigated acres. The historical transitions suggest that, while western irrigated agriculture is on a path toward greater sustainability, further progress will likely be needed as water demand and supply conditions change.
Similar conditions exist for irrigated agriculture across the 31 Eastern States. More effi cient pressure (sprinkler) and gravity systems account for 52 percent of total farm irrigated acres in the Eastern States. But the remaining 48 percent of eastern irrigated acres are irrigated with traditional, less effi cient systems. For the 31 Eastern States, however, improved gravity systems (at 32 percent of total irrigated acres) play the dominant role among more effi cient irrigation systems relative to the West, where improved pressure (sprinkler) systems account for more than 30 percent of irrigated acres. This regional difference should not be surprising given the predominance of gravity irriga-tion across the Eastern States.27
Despite the increased use of more effi cient irrigation systems, pressures to reallocate agricultural water supplies among competing demands continue to impact the sector. Adopting more effi cient physical systems alone may
26For some producers, irrigation technology is considered a quasi-fi xed input because various barriers (e.g., limited producer management skills, lack of fi nancial resources, producer age, farm size, unique soil or agri-environmental conditions, or other reasons) discourage adoption of improved irrigation technologies. For example, high mountain-meadow pastures are often irrigated with gravity-based, unlined ditch water-delivery systems. With a high-priority water right and relatively low water costs, such producers are unlikely to alter their irrigation technology without increased incentive to do so (Schaible et al., 2010).
27While irrigation with gravity systems occurs in most Eastern States, 5 States (Arkansas, Florida, Louisiana, Mississippi, and Missouri) account for 98 percent of all gravity-irrigated acres within the 31 Eastern States. Arkansas alone accounts for 53 percent of gravity-irrigated acres in the Eastern States. These 5 States account for 69 percent of total irrigated acres for the Eastern States.
Notes: More efficient gravity irrigation includes furrow irrigated acres using above- or below-ground pipe or a lined open-ditch field water-delivery system, plus acres in flood irrigation (between borders or within basins) on farms using laser-leveling and pipe or lined open-ditch field water-delivery systems. More efficient pressure-sprinkler irrigation includes acres using either drip/trickle systems or lower pressure-sprinkler systems (pressure per square-inch (PSI) < 30). The remaining irrigated acres were categorized as using "traditional" irrigation systems.Source: USDA, National Agricultural Statistics Service, 1994, 1998, 2003, and 2008 Farm and Ranch Irrigation Survey.
Figure 14Share of irrigated acres in the 17 Western States, by system type, 1994-2008
Percent of total irrigated acres
0102030405060708090
100
1994 1998 2003 2008
Efficient gravity irrigated acres
Efficient sprinkler and drip/trickle irrigated acres
Traditionalirrigated acres
31Water Conservation in Irrigated Agriculture: Trends and Challenges in the Face of Emerging Demands / EIB-99
Economic Research Service/USDA
not be enough in the face of greater demands placed on increasingly scarce water resources, especially with new demands from climate change and an expanding energy sector. The sustainability of irrigated agriculture may depend increasingly on expanded adoption of more effi cient irrigation “production systems” (Evans and Sadler, 2008; Sadler et al., 2005; Clemmens et al., 2008). These production systems could involve a continued shift from traditional, less effi cient gravity/sprinkler irrigation to the more effi cient irrigation application systems, but with greater reliance on “within-system” water management improvements that increase overall production effi ciency beyond that attainable with an improved gravity or pressure-sprinkler appli-cation system alone.28
To increase the effi cient use of water resources, irrigation production systems could incorporate more intensive use of infi eld water management practices (e.g., soil- or plant-moisture sensing devices, commercial irrigation sched-uling services, or computer-based crop-growth simulation models) that help farmers decide when to irrigate and how much water to use by crop growth stage (Schaible et al., 2010). Improved water management practices can help producers maximize the economic effi ciency of their irrigation systems and the potential for real water savings through reduced system losses and managed reductions in crop consumptive use.
For irrigated agriculture, in general, and for gravity irrigation, in particular, survey data suggest that producers do not make widespread use of less water-intensive infi eld water management practices. Across the West, producers using gravity-fl ow irrigation tend to give more emphasis to such practices as reduced irrigation set times, alternate furrow irrigation (for row crops), and end-of-fi eld dikes to restrict fi eld runoff (table 4). Other less water-use inten-sive management practices for gravity systems have declined in use or have received little producer attention. Use of tailwater pits for onfarm water reuse (reducing the need for additional withdrawals) has declined across gravity irrigation, from 22 percent in 1994 to 8 percent in 2008, partly in response to irrigation application improvements that limit fi eld runoff. Laser-leveled acres on gravity irrigated fi elds declined from 27 percent of acreage in 1998 to 16 percent in 2008.
By 2008, less water-intensive gravity-management practices, such as special furrowing techniques, shortened furrow lengths, and polyacrylamide (PAM), were applied on a relatively small portion of gravity-irrigated agriculture in the West. Less interest in these practices may refl ect their expected economic impact at the farm level, either through increased costs for land preparation or for specialized furrow-management equipment, particularly when expected profi t margins are low. Across the Eastern States, however, producers tend to give more emphasis to alternate row irrigation and laser-leveling of fi elds to improve water management on gravity-irrigated acres (accounting for 11 and 22 percent of gravity irrigated acres, respectively). As in the West, use of effi ciency-enhancing gravity water management practices accounts for a rela-tively small portion of gravity irrigated acres.
Despite technological advances in crop and soil moisture sensing, irrigators across the United States continue to depend heavily on traditional decision-making methods in deciding when to irrigate a crop and by how much. In the West, most producers generally irrigate based on the visible “condition
28The sustainability of irrigated agriculture also could be enhanced through continued research and development of crop cultivars with improved tolerance to drought, heat, and salts, as well as shorter growing seasons. This particular issue is beyond the focus of this report.
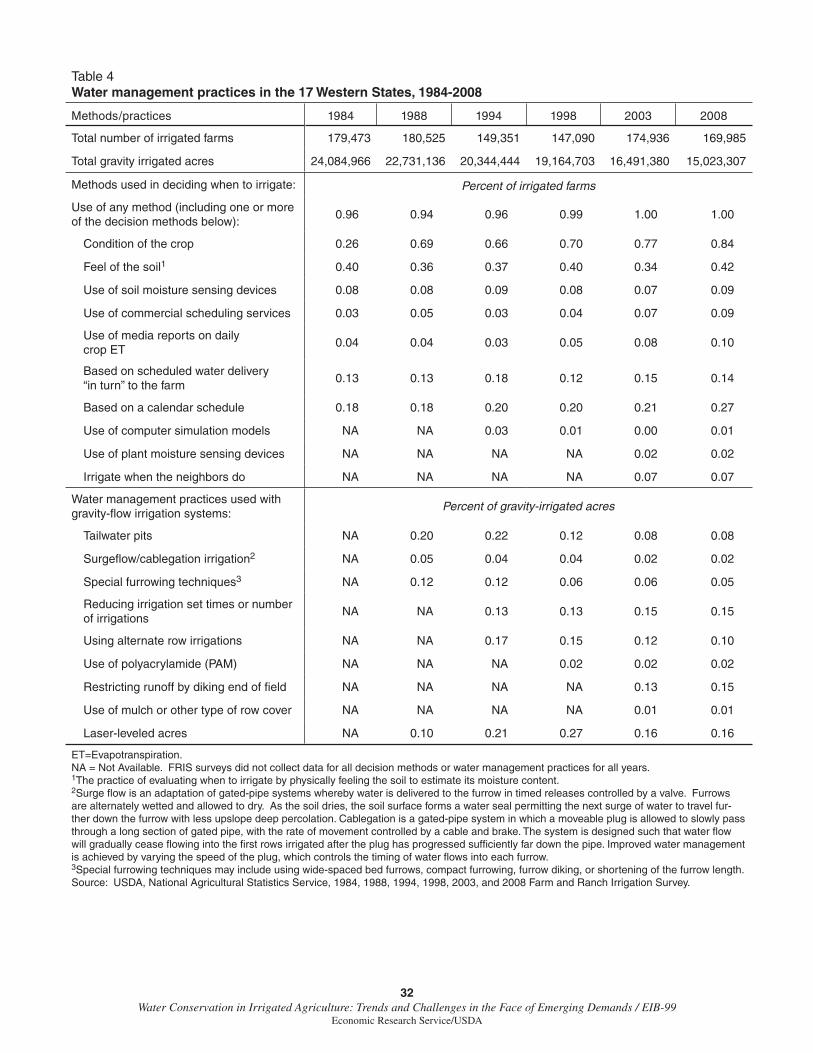
32Water Conservation in Irrigated Agriculture: Trends and Challenges in the Face of Emerging Demands / EIB-99
Economic Research Service/USDA
Table 4Water management practices in the 17 Western States, 1984-2008
Methods/practices 1984 1988 1994 1998 2003 2008
Total number of irrigated farms 179,473 180,525 149,351 147,090 174,936 169,985
Total gravity irrigated acres 24,084,966 22,731,136 20,344,444 19,164,703 16,491,380 15,023,307
Methods used in deciding when to irrigate: Percent of irrigated farms
Use of any method (including one or more of the decision methods below):
0.96 0.94 0.96 0.99 1.00 1.00
Condition of the crop 0.26 0.69 0.66 0.70 0.77 0.84
Feel of the soil1 0.40 0.36 0.37 0.40 0.34 0.42
Use of soil moisture sensing devices 0.08 0.08 0.09 0.08 0.07 0.09
Use of commercial scheduling services 0.03 0.05 0.03 0.04 0.07 0.09
Use of media reports on daily crop ET
0.04 0.04 0.03 0.05 0.08 0.10
Based on scheduled water delivery “in turn” to the farm
0.13 0.13 0.18 0.12 0.15 0.14
Based on a calendar schedule 0.18 0.18 0.20 0.20 0.21 0.27
Use of computer simulation models NA NA 0.03 0.01 0.00 0.01
Use of plant moisture sensing devices NA NA NA NA 0.02 0.02
Irrigate when the neighbors do NA NA NA NA 0.07 0.07
Water management practices used with gravity-fl ow irrigation systems:
Percent of gravity-irrigated acres
Tailwater pits NA 0.20 0.22 0.12 0.08 0.08
Surgefl ow/cablegation irrigation2 NA 0.05 0.04 0.04 0.02 0.02
Special furrowing techniques3 NA 0.12 0.12 0.06 0.06 0.05
Reducing irrigation set times or number of irrigations
NA NA 0.13 0.13 0.15 0.15
Using alternate row irrigations NA NA 0.17 0.15 0.12 0.10
Use of polyacrylamide (PAM) NA NA NA 0.02 0.02 0.02
Restricting runoff by diking end of fi eld NA NA NA NA 0.13 0.15
Use of mulch or other type of row cover NA NA NA NA 0.01 0.01
Laser-leveled acres NA 0.10 0.21 0.27 0.16 0.16
ET=Evapotranspiration.NA = Not Available. FRIS surveys did not collect data for all decision methods or water management practices for all years.1The practice of evaluating when to irrigate by physically feeling the soil to estimate its moisture content.2Surge fl ow is an adaptation of gated-pipe systems whereby water is delivered to the furrow in timed releases controlled by a valve. Furrows are alternately wetted and allowed to dry. As the soil dries, the soil surface forms a water seal permitting the next surge of water to travel fur-ther down the furrow with less upslope deep percolation. Cablegation is a gated-pipe system in which a moveable plug is allowed to slowly pass through a long section of gated pipe, with the rate of movement controlled by a cable and brake. The system is designed such that water fl ow will gradually cease fl owing into the fi rst rows irrigated after the plug has progressed suffi ciently far down the pipe. Improved water management is achieved by varying the speed of the plug, which controls the timing of water fl ows into each furrow.3Special furrowing techniques may include using wide-spaced bed furrows, compact furrowing, furrow diking, or shortening of the furrow length.Source: USDA, National Agricultural Statistics Service, 1984, 1988, 1994, 1998, 2003, and 2008 Farm and Ranch Irrigation Survey.
33Water Conservation in Irrigated Agriculture: Trends and Challenges in the Face of Emerging Demands / EIB-99
Economic Research Service/USDA
of the crop” or by “feeling the soil” for soil-moisture content, or irrigation may be based on a calendar schedule (which can be infl uenced by labor avail-ability from local labor markets) or an “in-turn” (fi xed rotation) delivery schedule for water supplied to the farm (see table 4). For 2008, fewer than 10 percent of irrigators throughout the West used soil- or plant-moisture sensing devices or commercial irrigation scheduling services. Fewer than 2 percent of irrigators used computer-based simulation models to evaluate crop irriga-tion requirements based on consumptive use needs by crop-growth stage and local weather conditions. Low adoption rates may be due to the fact that these practices are much more human-capital and management intensive than tradi-tional water-application decision tools. These more sophisticated tools may require more extensive technical training and support to increase adoption rates.
Similar relationships exist for the Eastern States, except that irrigation deci-sions generally are not based on water delivered within a fi xed rotation to the farm. While 14 percent of irrigators in the West reported that water delivered within a fi xed farm rotation infl uenced their decisions on when to irrigate, less than 1 percent of irrigators in the Eastern States relied on this arrange-ment. The decisionmaking process varies by region and refl ects the fact that, in the West, 33 percent of irrigated acres used water from off-farm sources, generally from irrigation districts, while in the East, less than 4 percent of irrigated acres used off-farm water sources.
According to the 2008 FRIS, at least half of irrigated crop acreage across the United States continues to be irrigated with less effi cient irrigation appli-cation systems and most irrigators do not make use of less water-intensive onfarm water management practices. Our fi ndings suggest that, particularly for the West, given the increasing water demand pressures from competing uses, the potential for reduced water supplies and increased evaporation losses associated with climate change, a sustainable future for irrigated agri-culture may require wider adoption of more effi cient irrigation practices.
According to the National Research Council report, Toward Sustainable Agricultural Systems in the 21st Century (NRC, 2010), and the recent USDA Research, Education, and Economics Action Plan (USDA/REE, 2012),29 achieving a more sustainable future for irrigated agriculture through agricul-tural water conservation involves three elements:
• Continue to encourage adoption of high-effi ciency irrigation applica-tion systems;
• Place greater emphasis on adoption of more effi cient irrigation produc-tion systems (a farming systems approach) that better manage when and how much water is applied at the fi eld level, enhancing producer ability to respond to water shortages as well as promote agricultural water conservation through defi cit irrigation while improving farm profi ts; and
• Better integrate onfarm water conservation with watershed-level water management mechanisms that help facilitate optimal alloca-tion of limited water supplies among competing demands (e.g., use of conserved water rights, drought-year water banks, water-option markets, contingent water markets, reservoir management, irrigated
29“Sustainable agriculture” as a USDA policy goal was initiated with the Food, Agriculture, Conservation, and Trade Act of 1990, with the key objective to “protect and enhance America’s water resources.” USDA’s Strategic Plan for FY 2010-15 highlights the importance of using farm-level, watershed, and institutional measures as a strategic means to meet this goal (USDA, 2012).
34Water Conservation in Irrigated Agriculture: Trends and Challenges in the Face of Emerging Demands / EIB-99
Economic Research Service/USDA
acreage and groundwater pumping restrictions, and irrigated acreage retirement).
The box “Irrigation Production Systems and Agricultural Water Conservation” expands upon the concept of accounting for basin-level water balance by considering the fate of farm-level water savings/losses and strate-gies underway to improve onfarm irrigation water-use effi ciency and integrate water conservation and watershed water-management tools.
Watershed-level water management tools can create more effi cient water allocations by encouraging water-resource stakeholders to recognize the opportunity value of water across competing uses and by facilitating water transfers through varying degrees of market-based trading and realloca-tion schemes. USDA presently participates in watershed-scale agricultural water conservation and water-management activities through Federal, State, and local partnership agreements established under its Agricultural Water Enhancement Program (AWEP). With the 2008 Food, Conservation, and Energy Act’s establishment of AWEP, USDA’s water conservation program was effectively extended to embody a focus on farms as well as on a water-shed/regional/institutional conservation. Since 2009, USDA’s Natural Resources Conservation Service, (NRCS) has entered into 101 AWEP part-nership agreements designed to enhance agricultural water conservation.30 AWEP allows USDA to integrate onfarm water conservation with institu-tional and watershed water-management tools to enhance water conservation objectives at a “landscape scale,” while leveraging fi nancial support from other Federal, State, and local organizations. The box, “Institutional Tools for Water Management,” presents examples of policy approaches being used to encourage and enhance agricultural water conservation.
30With the AWEP, under the Environmental Quality Incentives Program (EQIP), USDA’s NRCS presently manages multi-year watershed-level water conservation partnership agreements with State, local, irrigation district, federally recognized Indian Tribes, and nongovernmental organizations. The complexity of these partnerships can range from providing producers fi nancial assistance to convert from gravity irrigation to low-pressure sprinkler irrigation, to using irrigated acreage and water-use restrictions and conserved water for instream fl ow uses and managed drought-year water banks. NRCS partnership agreements and water management mechanisms can vary signifi cantly across watersheds and States. For a description of AWEP partnership agreements, see http://www.nrcs.usda.gov/wps/portal/nrcs/detailfull/national/programs/?&cid=nrcs143_008334.
35Water Conservation in Irrigated Agriculture: Trends and Challenges in the Face of Emerging Demands / EIB-99
Economic Research Service/USDA
Irrigation Production Systems and Agricultural Water Conservation
Agricultural water conservation has long been recognized as key to providing water resources to meet the increasing demands of competing uses. Historically, promoting producer adoption of irrigation technologies that increase farm-level irrigation effi ciency has been a principal policy focus. Through the use of conservation-incentive programs, Federal and State agencies have funded improvements in irrigation system effi ciency to help meet the needs of competing water demands. In recent years, however, the appropriateness of this policy approach has been challenged. Concerns have been raised about the effect of irrigation technology adoption on irrigation consumptive water use and the amount of water actually “conserved.”
Researchers believe that public promotion of more effi cient irrigation technologies can unintentionally increase irrigated crop consumptive water use at the basin level by encouraging wider adoption of crop irrigation and/or the production of more water-intensive crops (Whittlesey and Huffaker, 1995; Huffaker and Whittlesey, 2003; Ward and Pulido, 2008; Clemmens et al., 2008; Evans and Sadler, 2008). This policy concern suggests that improving irrigation effi ciency may not always “conserve” water for off-farm uses. The potential of irrigation effi ciency improvements to achieve water savings within a basin depends partly on the nature of irrigation system losses and rates of irrigation return fl ow to surface streams and aquifers. Potential water savings also depend on whether water-use effi ciency gains are offset by increases in crop consumptive water use. Where return fl ows are high from irrigation systems, real water conservation may require reduced crop consumptive water use within the basin.
Improved Technology Alone May Not Be Enough. Producer adoption of more effi cient irrigation technology may increase agricultural water consumption in several ways.
1. More effi cient irrigation systems allow the producer to reduce the quan-tity of water applied to a fi eld, often through improved uniformity of fi eld-water distribution and timing of water applications to meet crop growth-stage requirements. These improvements may also result in higher crop yields, which generally increase crop consumptive water use.
2. In the absence of defi ned “conserved” water rights, water savings from irrigation effi ciency improvements on one fi eld may be applied to addi-tional crop acreage under irrigation. Unless restricted, “water spreading” over an expanded acreage base generally increases aggregate agricul-tural water consumption.
3. Improved irrigation technologies can alter the economics of irriga-tion enough to entice producers to adjust traditional cropping patterns, potentially shifting to more water-intensive irrigated crops. In the High Plains, for example, higher yields and reduced irrigation pumping costs with improved irrigation effi ciency have prompted a shift from irrigated wheat and sorghum production to increased acreage in irrigated corn. These types of cropping pattern adjustments may increase aggregate crop consumptive water use.
Improved irrigation effi ciency can also have off-farm implications. Specifi cally, upstream water savings may be claimed by downstream (junior water-right) irrigators, increasing basin-wide agricultural consumptive water use. Where
--continued
36Water Conservation in Irrigated Agriculture: Trends and Challenges in the Face of Emerging Demands / EIB-99
Economic Research Service/USDA
Irrigation Production Systems and Agricultural Water Conservation (continued)
seasonal instream water fl ows are limiting, increases in crop consumptive water use may adversely impact water allocation objectives for environmental and other purposes at the basin level. Similarly, groundwater savings from reduced irrigation pumping requirements under high-effi ciency systems may be offset by expanded aquifer withdrawals for additional irrigated acreage and other purposes off the farm.
Benefi ts of Technological Improvements. While the effects of irrigation effi ciency on crop consumptive use and net water savings are an important policy concern, investment in more effi cient onfarm irrigation technologies has additional benefi ts.
1. Improved irrigation technologies are generally productivity enhancing, requiring less land and water inputs for a given level of yield.
2. Enhanced irrigation effi ciency produces onfarm water savings through reduced applications that also reduce farm water costs (Evans and Sadler, 2008; Sadler et al., 2005; Fereres and Soriano, 2007; Geerts and Raes, 2009). Higher productivity and reduced water costs are important to the economic viability of a sustainable irrigated agriculture sector over the long term.
3. Improved onfarm irrigation effi ciency generally results in signifi cant water quality and environmental benefi ts (Huffaker, 2010; Kim et al., 2000; Schaible and Aillery, 2003; Weinberg et al., 1993). Effi cient irri-gation “production systems” allow producers to improve their nutrient management practices through chemical application effi ciencies, reduced soil erosion runoff, improved salinity control, and improved drainage water quality. Improving onfarm irrigation effi ciency also reduces nutrient loads, pesticides, and trace elements in irrigation runoff to surface waters, as well as leaching of agrichemicals into groundwater supplies, producing off-farm benefi ts for ecosystem habitats, endangered species recovery, biodiversity, and human health.
Broadening Policy Focus To Achieve Conservation Goals. Public water conservation programs that encourage producer adoption of effi cient “irrigation production systems,” integrated within basin-level institutional water management initiatives (e.g., conserved water-right provisions, groundwater withdrawal restrictions, water banks, and option and contingent water markets), could enhance the potential for real agricultural water conservation. Integrated farm and basin-level institutional conservation initiatives could encourage both irrigators and conservation program managers to consider the alternative opportunity values of water across competing demands, improving allocation of scarce water resources. In doing so, irrigation effi ciency improvements, as part of a broader basin-level conservation plan, may be combined with other practices, such as defi cit irrigation, acreage idling, and off-farm water transfers, that reduce crop water consumption in water-defi cit years while allowing producers to maximize farm income. Through the adoption of highly effi cient irrigation production systems, in combination with water allocation frameworks that encourage producers and program managers to jointly consider the opportunity values of water within the basin, the overall effi ciency in water allocations can be improved while enhancing real agricultural water conservation.
37Water Conservation in Irrigated Agriculture: Trends and Challenges in the Face of Emerging Demands / EIB-99
Economic Research Service/USDA
Institutional Tools for Water Management
Agricultural water conservation can enhance crop production and farm income, as well as water resources for competing demands, where institutional provisions provide appropriate incentives for the allocation of conserved water. USDA’s Agricultural Water Enhancement Program—under the Environmental Quality Incentive Program (EQIP)—is one approach within a broader partnership-based institutional framework that provides fi nancial assistance to agricultural producers to implement agricultural water enhancement activities on agricultural land to conserve surface and groundwater and to improve water quality. Various institutional provisions at the Federal and State level help promote potential water savings from onfarm investments in improved irrigation production systems. Integrating onfarm water conservation programs with institutional water management mechanisms can encourage the reallocation of conserved water to meet off-farm uses for environmental fl ows and other higher valued water demands, both agricultural and nonagricultural. Examples of how onfarm water conservation has been integrated with institutional water management measures include:
• EQIP fi nancial assistance provisions. By allocating Federal funds for irrigation technology investments, EQIP program managers at the State (or sub-State) level may assign priority to contract offers demonstrating net water savings at the farm level. Financial assistance for irrigation technology improvements may also be combined with environmental measures that limit agricultural water withdrawals. For example, in a special EQIP project in south-central Nebraska where groundwater pumping has affected Platte River fl ows for endangered species, fi nan-cial assistance for conversion to high-effi ciency sprinkler systems was tied to restrictions on irrigated acreage expansion.
• Groundwater management. States may enact groundwater management regulations that promote adoption of improved irrigation technology. In Arizona, where groundwater withdrawals for agricultural production have resulted in signifi cant water-table declines, groundwater manage-ment areas have been established to limit groundwater overdraft. Under the groundwater management provisions, agricultural water conserva-tion programs were established for designated groundwater manage-ment areas. Irrigation withdrawals for farms within these areas are tied to successively higher irrigation effi ciency levels. Compliance with an approved set of best management practices for irrigated production may be accepted in lieu of fi xed groundwater withdrawals.
• Environmental fl ow regulations. Federal and State regulatory require-ments for environmental fl ows may be combined with policy initia-tives for water conservation. The Central Valley Project Improvement Act (CVPIA) of 1992, which reallocated farm water deliveries to meet instream fl ow requirements, mandated water conservation programs at the irrigation district level. In 2001, severe drought in the Klamath River Basin (California and Oregon) prompted Federal regulatory restrictions on agricultural water diversions to ensure fl ows for endangered fi sh species. The Federal action resulted in a special USDA EQIP funding allocation to support improved irrigation systems in the Klamath River Basin under the 2002 Farm Act.
--continued
38Water Conservation in Irrigated Agriculture: Trends and Challenges in the Face of Emerging Demands / EIB-99
Economic Research Service/USDA
Institutional Tools for Water Management
(continued)
• Incentive pricing for surface water. Current prices for surface irriga-tion water may not refl ect the market value of water. In many cases, water charges are tied to some portion of the capital and mainte-nance costs of the delivery system and often do not refl ect the value of water in irrigation or its opportunity cost in other uses. With tiered pricing for surface water deliveries, per-unit costs increase (in a stepped fashion) with the volume of water delivered. The CVPIA established tiered water pricing for agricultural diversions at the irri-gation district level in California’s Central Valley Project. Individual irrigation districts may decide whether or not to implement tiered pricing (using a modifi ed schedule or alternative rate to cover the increased costs of water they receive from the Bureau of Reclamation project) for their respective producers (CBO, 1997). Producers may lessen their average per-unit water charge by adopting higher effi -ciency irrigation systems that reduce total farm water diversions.
• Water markets. Water markets can improve the allocation of water among competing economic uses by facilitating the voluntary transfer of water to higher valued uses under sale or lease agreements. Water markets can encourage investment in more effi cient irrigation technol-ogies through improved market signals on the value of water. Water savings through irrigation system upgrades at the farm level may be available for transfer off the farm. Similarly, farmers investing in irrigation improvements may value the additional certainty of water supplies available through the market. States can help protect environ-mental services through laws governing water transfers. In Oregon, for example, irrigators may transfer water made available through conser-vation as long as 25 percent of water conserved is reserved for instream uses.
• CREP land retirement. Under USDA’s Conservation Reserve Enhancement Program (CREP), the Federal Government may partner with States, tribes, local governments and private entities to idle irri-gated cropland under long-term lease agreements. CREP partnerships provide greater enrollment incentives than what currently exists under a Conservation Reserve Program (CRP) general signup—USDA’s primary land retirement program. Under CREP contracts, USDA offers higher payments tied to irrigated rental rates, while partners provide funding for additional expenses, such as permanent easements or retire-ment of water rights. Today, CREP projects in several Western States (Nebraska, Colorado, Idaho, and Kansas) target agricultural water conservation in critical watersheds. The projects are designed to reduce consumptive use of surface and groundwater through retirement of irri-gated land and accompanying restrictions on water withdrawals, and they are intended to lessen the effect of water-supply shortfalls on water users and natural systems during periods of sustained drought. Related project goals involve enhanced water quality and terrestrial habitat through establishment of vegetative cover and restoration of aquatic systems through reestablishment of fl ow volumes in river systems and adjoining wetlands.
39Water Conservation in Irrigated Agriculture: Trends and Challenges in the Face of Emerging Demands / EIB-99
Economic Research Service/USDA
Irrigation Investments: Decision Factors, Types, Purposes, and Funding Sources
While the need for continued improvements in water-conserving production systems in U.S. irrigated agriculture is well established, water-use effi ciency gains depend on irrigation investment decisions in the private farm sector. Various factors infl uence the adoption of more effi cient irrigation systems and water management practices, and their relative importance in the technology selection decision varies across locations and farm types, ultimately affecting investment expenditures and funding sources in the U.S. irrigated sector.
Factors Affecting Irrigation Technology Investment Decisions
Potential gains in onfarm water-use effi ciency, and resulting crop yield and/or input use benefi ts, vary across systems and resource settings. Survey data suggest that resulting income gains from irrigation technology adoption drive most investment decisions. According to the 2008 FRIS, 59 percent of U.S. survey respondents who invested in system upgrades reported reductions in applied water, and 60 percent reported improvements in crop yield and quality as a direct result of making recent irrigation investment decisions (table 5). Reductions in irrigation-related energy and labor costs were identi-fi ed by 46 and 41 percent of respondents, respectively. Other reported invest-ment benefi ts included reductions in soil erosion, fertilizer and pesticide loss, and drainage runoff. Most farmers across the United States seemed to be similarly motivated when making irrigation investment decisions, although farms in the Eastern States placed a slightly higher emphasis on improving irrigated crop yield and quality.
The suitability of irrigation system investments often depends on the physical characteristics of the land (Caswell and Zilberman, 1985; Negri and Brooks, 1990). Improved gravity-fl ow systems perform best on fi elds with low slope and higher quality soils with low water-infi ltration rates. Sprinkler systems have an advantage for use on nonuniform-shaped fi elds with greater slope and soils with higher infi ltration rates. Land quality considerations can have an impact on potential effi ciency gains in water use and related energy and labor requirements.
Expanding irrigated acreage on a farm will likely involve new investment in high-effi ciency irrigation systems. Similarly, a farm that reduces irrigated acreage is more likely to discontinue irrigation on acres with lower effi ciency systems. Cropping decisions may also affect the types of system innova-tions considered. Costly irrigation innovations are less likely to be applied for lower valued hay and pasture crops. Water-use effi ciency gains may be greater for crops with relatively higher water needs, such as corn, relative to less water-intensive crops, such as wheat. A crop’s cultural requirements may also affect irrigation system improvement choices. Special furrow tech-niques that modify soil-moisture infi ltration, for example, and improve the uniformity of applied water across a fi eld are best suited to row crops, such as corn and cotton. Of survey respondents indicating barriers to practice adoption in 2008, 16 percent identifi ed physical fi eld conditions and cropping
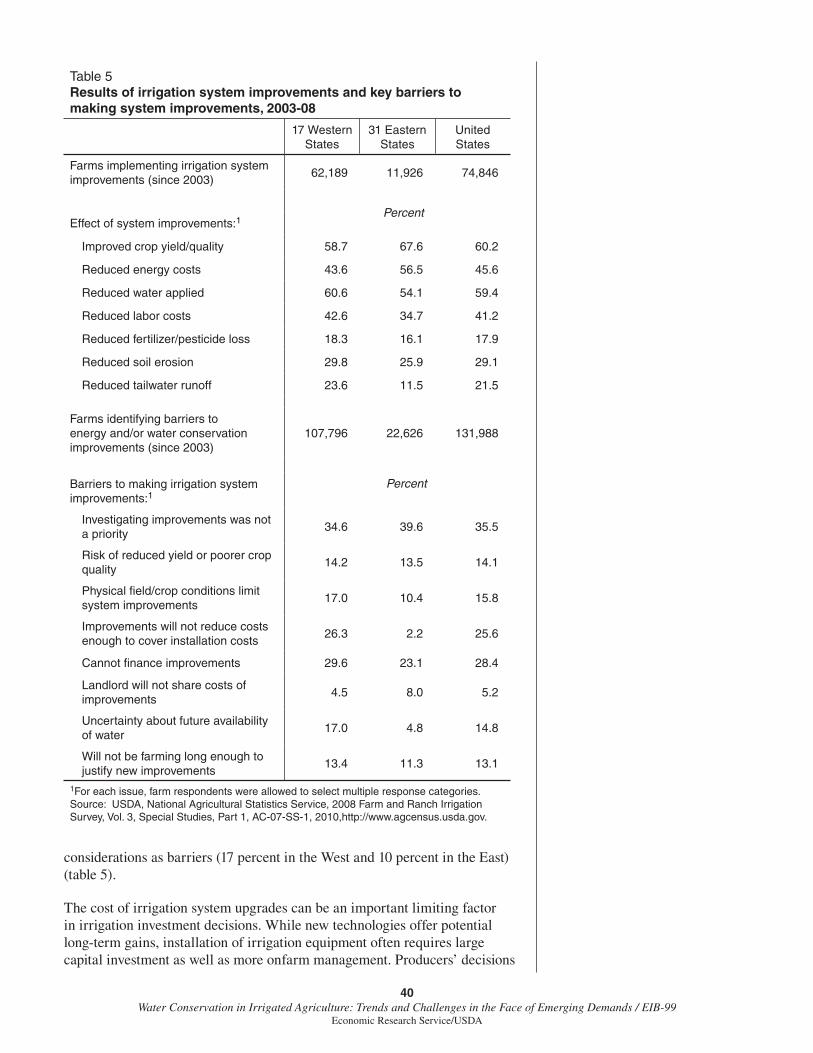
40Water Conservation in Irrigated Agriculture: Trends and Challenges in the Face of Emerging Demands / EIB-99
Economic Research Service/USDA
considerations as barriers (17 percent in the West and 10 percent in the East) (table 5).
The cost of irrigation system upgrades can be an important limiting factor in irrigation investment decisions. While new technologies offer potential long-term gains, installation of irrigation equipment often requires large capital investment as well as more onfarm management. Producers’ decisions
Table 5Results of irrigation system improvements and key barriers to making system improvements, 2003-08
17 Western States
31 Eastern States
United States
Farms implementing irrigation system improvements (since 2003)
62,189 11,926 74,846
PercentEffect of system improvements:1
Improved crop yield/quality 58.7 67.6 60.2
Reduced energy costs 43.6 56.5 45.6
Reduced water applied 60.6 54.1 59.4
Reduced labor costs 42.6 34.7 41.2
Reduced fertilizer/pesticide loss 18.3 16.1 17.9
Reduced soil erosion 29.8 25.9 29.1
Reduced tailwater runoff 23.6 11.5 21.5
Farms identifying barriers to energy and/or water conservation improvements (since 2003)
107,796 22,626 131,988
PercentBarriers to making irrigation system improvements:1
Investigating improvements was not a priority
34.6 39.6 35.5
Risk of reduced yield or poorer crop quality
14.2 13.5 14.1
Physical fi eld/crop conditions limit system improvements
17.0 10.4 15.8
Improvements will not reduce costs enough to cover installation costs
26.3 2.2 25.6
Cannot fi nance improvements 29.6 23.1 28.4
Landlord will not share costs of improvements
4.5 8.0 5.2
Uncertainty about future availability of water
17.0 4.8 14.8
Will not be farming long enough to justify new improvements
13.4 11.3 13.1
1For each issue, farm respondents were allowed to select multiple response categories.Source: USDA, National Agricultural Statistics Service, 2008 Farm and Ranch Irrigation Survey, Vol. 3, Special Studies, Part 1, AC-07-SS-1, 2010,http://www.agcensus.usda.gov.
41Water Conservation in Irrigated Agriculture: Trends and Challenges in the Face of Emerging Demands / EIB-99
Economic Research Service/USDA
to invest depend on whether the expected benefi ts of adoption outweigh expected costs, relative to production systems currently in use. According to the 2008 FRIS, 28 percent of respondents identifying barriers to conserva-tion indicated an inability to fi nance improvements as a barrier to change (30 percent in the West and 23 percent in the East) (table 5). Many respon-dents believed that system improvements would not lower production costs suffi ciently to cover costs (26 percent of all respondents). For some of these producers, long-term investment paybacks may also be viewed as overly speculative. Public fi nancial assistance programs that support the adop-tion of more effi cient irrigation practices reduce the effective cost borne by producers.
For some irrigators, the cost of water supplies plays a larger role in irrigation investment decisions. Incentives for water-use effi ciency gains are greatest where water costs are high. High-effi ciency pressurized systems, for example, are predominant in the Plains States where deep-well groundwater irrigation is predominant. In surface water supply areas, irrigators may be reluctant to invest in improved irrigation technologies where the price per unit of water is low or water is charged on a per-acre basis.31 Water pricing policies have been implemented for public surface-water supplies to capture capital and operation costs of the off-farm delivery system while also promoting onfarm water conservation. Under the Central Valley Project Improvement Act of 1992, for example, tiered (block-rate) pricing structures are applied to water deliveries for project contractors (irrigation districts).32 However, districts may elect to use a modifi ed rate schedule or an alternative average rate when pricing water deliveries to farmers (CBO, 1997).
Adoption of improved irrigation systems may also occur in response to restricted water supplies. Reduced water losses under more effi cient systems are intended to offset water-supply shortfalls. In California, surface water delivery restrictions under sustained drought conditions in the early 1990s prompted improvements in irrigation water-use effi ciency as well as institu-tional adaptations in water resource allocation (Zilberman et al., 1998; CBO, 1997). In some cases, public fi nancial support for improved irrigation prac-tices has been contingent upon water-supply restrictions. In the Central Platte Natural Resource District of Nebraska, for example, irrigation expansion was limited under an Environmental Quality Incentives Program (EQIP) special project to support conversion from gravity to sprinkler irrigation systems (SWCS and ED, 2007).
Farmers also may be reluctant to invest in improved technologies if access to future water supplies is uncertain. In the 2008 FRIS survey, uncertainty about future water availability was identifi ed as a barrier to technology adop-tion by 17 percent of irrigators in the Western States and 5 percent of irriga-tors in the Eastern States (table 5). Water-supply uncertainty is a particular concern for junior holders33 of surface water rights, whose water supply fl uctuates more signifi cantly with annual variability in precipitation. These water-rights holders may face irrigation delivery cutbacks when water supply conditions fall below levels required to meet the needs of senior water right holders.
The technology adoption decisions of senior versus junior appropriators vary depending on differences in land quality and operator management skills,
31Schuck et al. (2005) indicated that other factors, such as recurring drought conditions, could motivate irrigators to adopt improved irrigation technologies even under low water prices.
32For the fi rst rate tier, a district is charged the applicable contract (subsidized) rate for the fi rst 80 percent of water delivery, then an average of the contract and full-cost rates for water quantities between 80 and 90 percent of water delivery, and a district full-cost rate for the last 10 percent of water delivery to the district.
33Under the "prior appropriation system," the dominant water-rights legal institution in the Western States, water allocations are based on the "priority date" of the water right, a principle generally characterized as "fi rst in time, fi rst in right." Each water right has a specifi c annual quantity with an assigned appropriation date. Water-right holders with the earliest appropriation dates (senior appropriators) generally receive their full appropriation, provided there is adequate water supply. In water-short years, users holding water rights with later appropriation dates (junior appropriators) may not receive their full appropriation or even any water at all.
42Water Conservation in Irrigated Agriculture: Trends and Challenges in the Face of Emerging Demands / EIB-99
Economic Research Service/USDA
uncertainty over future water prices, the level of the farm’s water alloca-tion, perceived water-supply risk, whether water markets exist, and access to market-based information among water-right holders. For example, Carey and Zilberman (2002) revealed that water markets may decrease technology adoption incentives for some farms. For farms with abundant water supplies (i.e., senior appropriators), water markets are likely to increase incentives to invest in improved irrigation systems in anticipation of marketing water savings; but for farms with scarce supplies (i.e., junior appropriators), a water market may cause a postponement of irrigation technology investments as they have the option to purchase water in the market.
In the absence of a water market, however, Carey and Zilberman determined that a farm’s willingness to invest in improved technology is infl uenced by the size of the farm’s water allocation. The authors concluded that senior appropriators without a means to market water have less incentive to adopt improved technology, while junior appropriators with reduced supply recog-nize that they may need to produce at reduced acreage or lower yields (defi cit irrigate) with the traditional technology, prompting them to adopt more effi -cient systems.34 This effect is likely infl uenced by how junior the water right and the perceived magnitude of the water-supply risk relative to the potential onfarm effi ciency gain. For example, junior appropriators facing signifi -cant water-supply risk may have less incentive to adopt improved irrigation systems because the investment may too often sit idle in water-short years.
Inadequate off-farm water storage and delivery infrastructure also can represent a signifi cant barrier to achieving maximum irrigation effi ciencies through improved onfarm technologies (USDA/REE, 2004). Investment may be needed to enhance the capacity of an off-farm delivery system to supply onfarm water requirements on a more timely basis. For 2008, FRIS results indicated that 14 percent of irrigators had no choice in scheduling their irriga-tion because water was delivered to the farm on a fi xed rotation basis via their water-delivery organization.
Irrigators also may be reluctant to adopt new technologies due to risk of unsuccessful outcomes, particularly in the short term (Harwood et al., 1999). Irrigation system upgrades are often part of a broader change in production systems. New irrigation technologies often require higher levels of informa-tion and management to achieve potential yield gains and input use effi -ciencies. Increased adoption of improved irrigation systems may require a commitment of public funding for technical support, demonstration projects, and information transfer.
Farm size and structure as well as demographic factors also infl uence farm-level irrigation system improvements. Larger farms that benefi t from a stronger capital base and scale economies may be better positioned to adopt system improvements. Schaible (2004) and Schaible and Aillery (2006) reported that farm size infl uenced how effectively water conserva-tion programs serve both USDA conservation and small-farm policy goals. Schaible (2004) notes that the largest 10 percent of irrigated farms in the West (farms with more than $500,000 in sales) accounted for nearly 50 percent of total farm water applied. While relative irrigation improvement potential—the percent of irrigated acres still irrigated with traditional, less-effi cient systems—is generally greater for smaller irrigated farms, larger
34This would imply that, for some watersheds, a cut in irrigation water allocations may result in reduced supplies to producers using more effi cient systems.
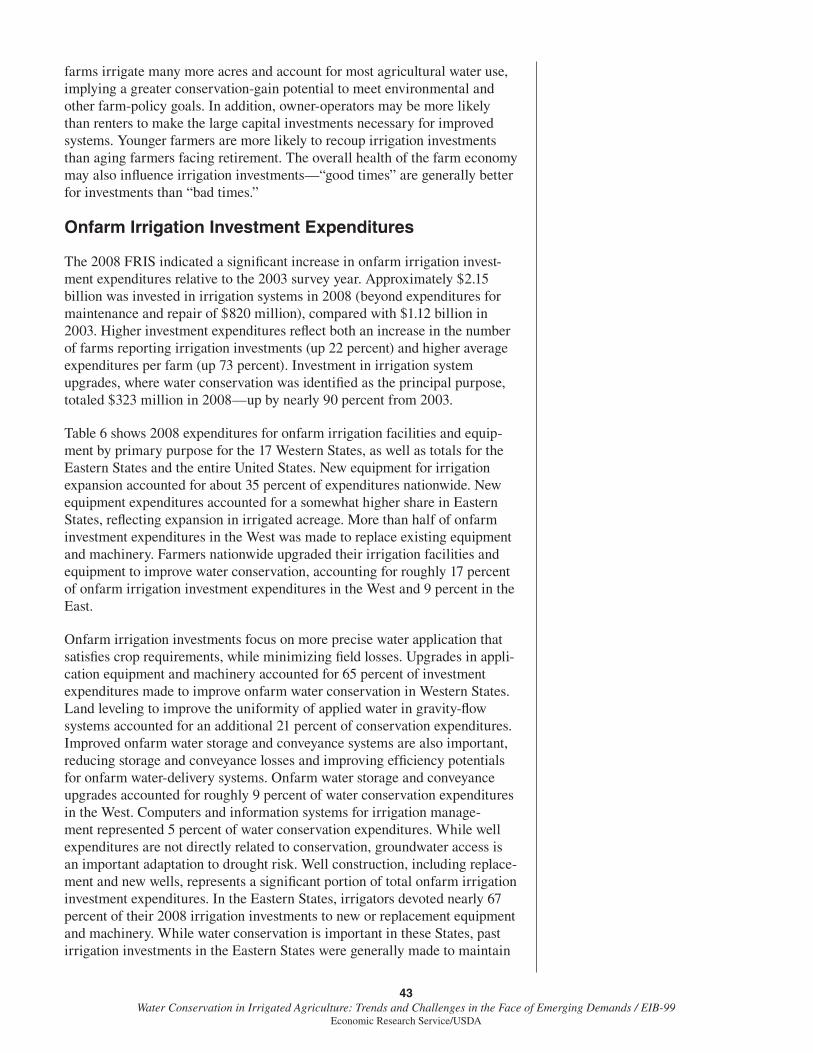
43Water Conservation in Irrigated Agriculture: Trends and Challenges in the Face of Emerging Demands / EIB-99
Economic Research Service/USDA
farms irrigate many more acres and account for most agricultural water use, implying a greater conservation-gain potential to meet environmental and other farm-policy goals. In addition, owner-operators may be more likely than renters to make the large capital investments necessary for improved systems. Younger farmers are more likely to recoup irrigation investments than aging farmers facing retirement. The overall health of the farm economy may also infl uence irrigation investments—“good times” are generally better for investments than “bad times.”
Onfarm Irrigation Investment Expenditures
The 2008 FRIS indicated a signifi cant increase in onfarm irrigation invest-ment expenditures relative to the 2003 survey year. Approximately $2.15 billion was invested in irrigation systems in 2008 (beyond expenditures for maintenance and repair of $820 million), compared with $1.12 billion in 2003. Higher investment expenditures refl ect both an increase in the number of farms reporting irrigation investments (up 22 percent) and higher average expenditures per farm (up 73 percent). Investment in irrigation system upgrades, where water conservation was identifi ed as the principal purpose, totaled $323 million in 2008—up by nearly 90 percent from 2003.
Table 6 shows 2008 expenditures for onfarm irrigation facilities and equip-ment by primary purpose for the 17 Western States, as well as totals for the Eastern States and the entire United States. New equipment for irrigation expansion accounted for about 35 percent of expenditures nationwide. New equipment expenditures accounted for a somewhat higher share in Eastern States, refl ecting expansion in irrigated acreage. More than half of onfarm investment expenditures in the West was made to replace existing equipment and machinery. Farmers nationwide upgraded their irrigation facilities and equipment to improve water conservation, accounting for roughly 17 percent of onfarm irrigation investment expenditures in the West and 9 percent in the East.
Onfarm irrigation investments focus on more precise water application that satisfi es crop requirements, while minimizing fi eld losses. Upgrades in appli-cation equipment and machinery accounted for 65 percent of investment expenditures made to improve onfarm water conservation in Western States. Land leveling to improve the uniformity of applied water in gravity-fl ow systems accounted for an additional 21 percent of conservation expenditures. Improved onfarm water storage and conveyance systems are also important, reducing storage and conveyance losses and improving effi ciency potentials for onfarm water-delivery systems. Onfarm water storage and conveyance upgrades accounted for roughly 9 percent of water conservation expenditures in the West. Computers and information systems for irrigation manage-ment represented 5 percent of water conservation expenditures. While well expenditures are not directly related to conservation, groundwater access is an important adaptation to drought risk. Well construction, including replace-ment and new wells, represents a signifi cant portion of total onfarm irrigation investment expenditures. In the Eastern States, irrigators devoted nearly 67 percent of their 2008 irrigation investments to new or replacement equipment and machinery. While water conservation is important in these States, past irrigation investments in the Eastern States were generally made to maintain
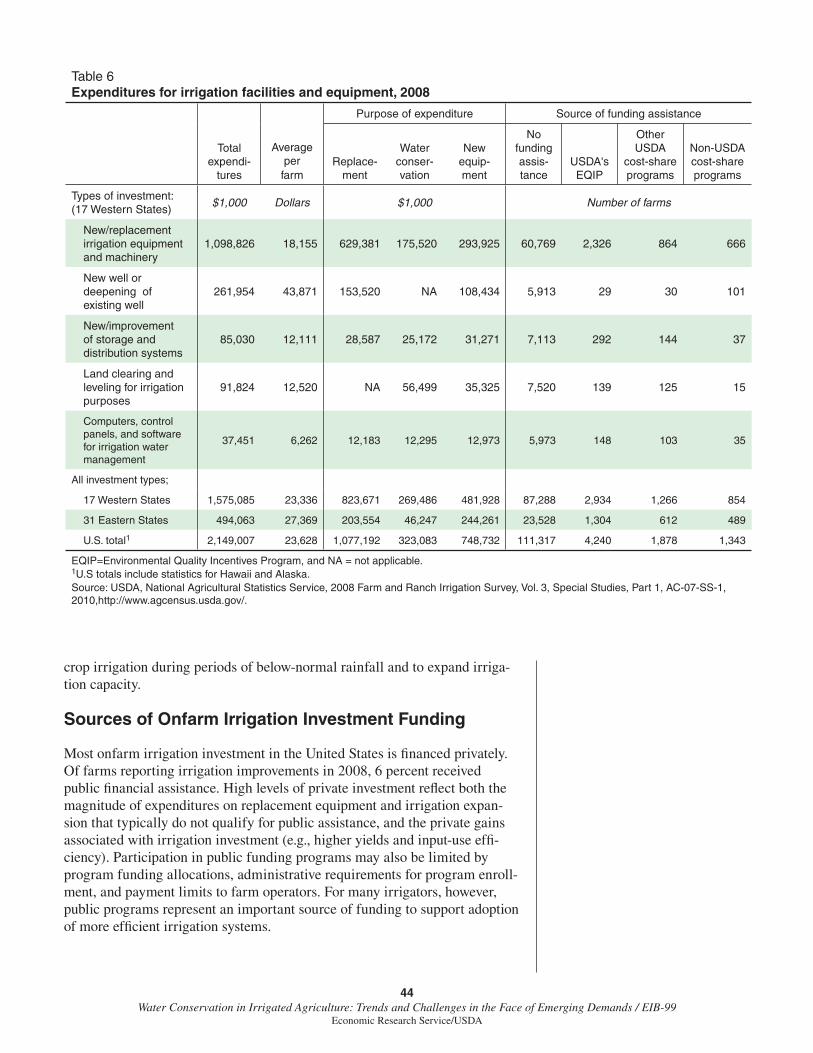
44Water Conservation in Irrigated Agriculture: Trends and Challenges in the Face of Emerging Demands / EIB-99
Economic Research Service/USDA
crop irrigation during periods of below-normal rainfall and to expand irriga-tion capacity.
Sources of Onfarm Irrigation Investment Funding
Most onfarm irrigation investment in the United States is fi nanced privately. Of farms reporting irrigation improvements in 2008, 6 percent received public fi nancial assistance. High levels of private investment refl ect both the magnitude of expenditures on replacement equipment and irrigation expan-sion that typically do not qualify for public assistance, and the private gains associated with irrigation investment (e.g., higher yields and input-use effi -ciency). Participation in public funding programs may also be limited by program funding allocations, administrative requirements for program enroll-ment, and payment limits to farm operators. For many irrigators, however, public programs represent an important source of funding to support adoption of more effi cient irrigation systems.
Table 6Expenditures for irrigation facilities and equipment, 2008
Purpose of expenditure Source of funding assistance
Total expendi-
tures
Average per farm
Replace-ment
Water conser-vation
New equip-ment
No funding assis-tance
USDA's EQIP
Other USDA
cost-share programs
Non-USDA cost-share programs
Types of investment: (17 Western States)
$1,000 Dollars $1,000 Number of farms
New/replacement irrigation equipment and machinery
1,098,826 18,155 629,381 175,520 293,925 60,769 2,326 864 666
New well or deepening of existing well
261,954 43,871 153,520 NA 108,434 5,913 29 30 101
New/improvement of storage and distribution systems
85,030 12,111 28,587 25,172 31,271 7,113 292 144 37
Land clearing and leveling for irrigation purposes
91,824 12,520 NA 56,499 35,325 7,520 139 125 15
Computers, control panels, and software for irrigation water management
37,451 6,262 12,183 12,295 12,973 5,973 148 103 35
All investment types;
17 Western States 1,575,085 23,336 823,671 269,486 481,928 87,288 2,934 1,266 854
31 Eastern States 494,063 27,369 203,554 46,247 244,261 23,528 1,304 612 489
U.S. total1 2,149,007 23,628 1,077,192 323,083 748,732 111,317 4,240 1,878 1,343
EQIP=Environmental Quality Incentives Program, and NA = not applicable.1U.S totals include statistics for Hawaii and Alaska. Source: USDA, National Agricultural Statistics Service, 2008 Farm and Ranch Irrigation Survey, Vol. 3, Special Studies, Part 1, AC-07-SS-1, 2010,http://www.agcensus.usda.gov/.
45Water Conservation in Irrigated Agriculture: Trends and Challenges in the Face of Emerging Demands / EIB-99
Economic Research Service/USDA
The EQIP, administered by USDA’s NRCS, is the Nation’s primary agricul-tural conservation program for working farms and ranches. EQIP provides technical and fi nancial assistance for eligible conservation practices under short-term contracts (1-10 years). Financial support for installation of struc-tural and vegetative practices range from 50 to 75 percent of typical costs established at the county level, with rates of up to 90 percent for beginning, resource-limited, and socially disadvantaged farmers. Annual payments are also offered for the adoption of conservation-compatible management practices, including irrigation water management. In 2008, EQIP accounted for 58 and 54 percent of farms reporting public fi nancial assistance for irrigation investments across Western and Eastern States, respectively (table 6).35 Other USDA fi nancial assistance programs (e.g., Conservation Stewardship Program, Wetlands Reserve Program) accounted for 25 percent of farms reporting assistance, with the remaining funding provided by non-USDA programs (e.g., U.S. Environmental Protection Agency, Bureau of Reclamation, as well as State and local water management and supply district programs).
Figure 15 shows EQIP expenditures for irrigation practices as a share of total program outlays, by region, for 2004-10.36 Nationally, irrigation practices accounted for $1.4 billion in program expenditures over this period (USDA/NRCS, 2004-10), or roughly a quarter of total EQIP fi nancial assistance. The magnitude of public irrigation investment under EQIP varied across the United States, partly refl ecting the relative importance of irrigation to the agricultural economy.37 In Western States, EQIP funding of irrigation practices (as a share of total program outlays) ranged from 13.0 percent in the Northern Plains to 57.7 percent in Southern Mountain States. Irrigation
35Farms reporting EQIP funding assistance represented 4 percent of all U.S. irrigated farms making irrigation investments in 2008. The statistics here represent only a snapshot of EQIP participants for the 2008 production year and do not refl ect program participation over time.
36Funding levels reported here represent fi scal year dollars obligated.
37The conservation of ground and surface water resources is one of several priority resource concerns used to set State funding allocations and to rank local contract offers under EQIP.
NE=Northeast; AP=Appalachia; SE=Southeast; LK=Lake States; CB=Cornbelt; DL=Delta; NP=Northern Plains; SP=Southern Plains; NM=Northern Mountain; SM=Southern Mountain; NW=Northwest; CA=California.Source: USDA, Economic Research Service calculations based on USDA’s Natural Resource Conservation Service, Environmental Quality Incentives Program data, 2004-10.
Figure 15Environmental Quality Incentives Program funding for irrigation practices, by region, 2004-10
Total program outlays (million dollars)
0
100
200
300
400
500
600
700
800
NE AP SE LK CB DL NP SP NM SM NW CA
Nonirrigated Irrigated
46Water Conservation in Irrigated Agriculture: Trends and Challenges in the Face of Emerging Demands / EIB-99
Economic Research Service/USDA
practices accounted for a relatively small share of program expenditures in the Corn Belt, Lake States, Appalachian, and Northeast regions. Since 2004, however, the shares of EQIP funding for irrigation practices generally have increased in Eastern States while they have declined across the West.
A wide range of irrigation-related practices are eligible for fi nancial assis-tance under EQIP. More than half (55.8 percent) of EQIP irrigation funding was devoted to upgrades in onfarm water application systems (USDA/NRCS, 2004-10). Approximately 34.7 percent of funding was allocated to improved onfarm water conveyance. Water supply practices represented a relatively small portion (9.4 percent) of total irrigation expenditures under EQIP, refl ecting program emphasis on enhancing producer adoption of improved onfarm irrigation practices for existing irrigation. In a recent report, USDA’s NRCS estimated that, as of 2007, the EQIP program treated about 4.0 million irrigated acres and, by the end of 2012, EQIP is expected to treat an addi-tional 2.0 million irrigated acres with water-conserving irrigation practices (USDA/NRCS, 2010). The study estimated benefi ts for irrigation conserva-tion funding at $10.30 per acre. This measure is considered conservative because not all benefi ts could be taken into account.38 38The NRCS evaluation of EQIP
funding for irrigation conservation, conducted consistent with Offi ce of Management and Budget guidelines as part of an offi cial rule-making process, did not include benefi ts for productivity changes, input-cost savings, water quality and environmental impacts, or a measure of the nonagricultural market value of saved water. The study also assumed that water saved on the farm would be available for other agricultural activities, other competing uses (municipal, power, or fi sh habitat), or sold locally via irrigation rental markets, but did not account for these adjustments within the benefi t/cost analysis (USDA/NRCS, 2010).
47Water Conservation in Irrigated Agriculture: Trends and Challenges in the Face of Emerging Demands / EIB-99
Economic Research Service/USDA
Summary and Policy Implications
Irrigated agriculture makes a signifi cant contribution to the value of U.S. agricultural production. Based on 2007 Census of Agriculture data, irrigated farms accounted for $118.5 billion in sales, or roughly 40 percent of the value of U.S. agricultural production, with the national average value of production for irrigated farms 3.3 times the average value for nonirrigated farms (farms not irrigating any land). Irrigated farms accounted for 54.5 percent ($78.3 billion) of the value of all crop products sold, while also contributing signifi -cantly to the value of livestock and poultry production through animal forage and feed production.
In 2007, nearly 57 million U.S. acres were irrigated, representing 7.5 percent of all cropland and pastureland. The 12 leading irrigation States accounted for 77.2 percent of all irrigated acres, with Nebraska, California, and Texas leading all other States with 8.6, 8.0, and 5.0 million irrigated acres, respec-tively. Two States among the 31 Eastern States—Arkansas and Florida—were among the 12 leading irrigation States, with 4.5 and 1.6 million acres, respec-tively. Nearly three-quarters of U.S. irrigated agriculture occurred in the 17 Western States, including 73 percent of harvested irrigated cropland and 94 percent of irrigated pastureland. Farm and Ranch Irrigation Survey data for 2008 indicated that U.S. irrigated agriculture used nearly 91 maf of water. Irrigators across the Western States applied nearly 74.2 maf of water for irri-gated cropland production, with 52.4 percent originating from surface-water sources and the remaining 47.7 percent pumped from wells drawing water from regional and local aquifers.
Population and economic growth, changing social values with respect to water quality and the environment, and Native American water-right claims have been and will continue to be forces driving demand for water resources within the United States. Resolving Native American water-right claims, once estimated at nearly 46 maf annually, could have a signifi cant impact on future surface/groundwater supplies for agriculture. As more States move beyond the minimum instream-fl ow concept to formally recognize envi-ronmental fl ows—instream fl ows required to maintain sustainable fi sh and wildlife habitats or to re-establish natural habitats—the volume of water real-located from agriculture to meet environmental needs likely will increase. More recently, emerging demands for water resources have heightened water scarcity concerns, particularly across the Western States. Biofuel develop-ment, whether through corn-based ethanol or cellulosic feedstock sources, may increase demand for water resources in some regions. Over time, climate change impacts are expected to alter both water supplies and water demands across and within regions. Warming temperatures, changing precipita-tion patterns, and reduced snowpack are expected to signifi cantly reduce late spring/summer streamfl ows (fl ows that historically were available for reservoir storage to meet peak irrigation water demands) and groundwater recharge across much of the West. In addition, higher temperatures are expected to increase crop-water demands via reduced crop ET effi ciency.
Competing demands for U.S. water resources will continue to grow, while the potential for new, large-scale water-supply projects is fairly limited. Agriculture accounts for more than 80 percent of U.S. consumptive water use
48Water Conservation in Irrigated Agriculture: Trends and Challenges in the Face of Emerging Demands / EIB-99
Economic Research Service/USDA
and, with the lowest marginal value of water among competing out-of-stream uses, will be the likely water source to meet future water demands. Emerging demands already are placing new pressures on existing water allocations, particularly across the West, heightening the importance of water conserva-tion for irrigated agriculture sustainability. The future sustainability of the irrigated agriculture sector will depend a great deal on a variety factors, such as water-use effi ciency, conservation policies that encourage more effi cient onfarm water management, and how and when increasingly scarce water supplies are reallocated among competing demands.
Since the 1970s, data reveal a substantial and sustained shift across the Western States from traditional gravity-fed and fl ood irrigation to more effi -cient gravity and pressure/sprinkler irrigation systems. In 2008, about $2.15 billion was invested in U.S. irrigation systems, with the majority ($1.6 billion) invested in Western States. Most irrigation investment was fi nanced privately, with less than 10 percent of farms reporting irrigation improvements in 2008 using public fi nancial assistance for irrigation upgrades. The data indicate that, while substantial technological innovation has already occurred in U.S. irrigated agriculture, signifi cant room for improvement exists. At least half of irrigated cropland acreage across both Western and Eastern States is still irri-gated with traditional (less effi cient) irrigation application systems. In addi-tion, survey data indicate that most irrigators do not implement more effi cient onfarm water management practices. Fewer than 10 percent used soil- or plant-moisture sensing devices or commercial irrigation scheduling services. Less than 2 percent of irrigators used computer-based simulation models to evaluate crop irrigation requirements based on consumptive-use needs and local weather conditions.
Adoption of more effi cient irrigation application systems has been and will be an important component of agricultural water conservation efforts. During 2004-10, most of USDA’s EQIP irrigation funding was devoted to upgrades in onfarm water application and onfarm water conveyance systems. The sustainability of irrigated agriculture, however, could be enhanced further if producers combined improved onfarm water management practices with high-effi ciency irrigation application systems. In addition, through collabora-tive Federal, State, and local partnerships under USDA’s Agricultural Water Enhancement Program, integration of onfarm conservation efforts with watershed-level water management tools could further encourage increased conservation of water resources for current, alternative, and future uses. Integrating irrigation effi ciency improvements with other practices, such as defi cit irrigation, acreage idling, and off-farm water transfers that compensate agricultural producers for water conservation gains, may allow producers to balance the drop in yields that often accompanies efforts to reduce irriga-tion water use with potentially improved profi tability through reduced costs of applying water and related inputs and increased water-related revenue. Integrating onfarm conservation and Federal/State institutional mechanisms also may encourage producers and other stakeholders to interact jointly in determining market-based water reallocations.
Designing agricultural water conservation policies that promote a more sustainable future for irrigated agriculture depends a great deal on improving the economic analysis of adaptation options within the irrigated farm sector. While previous economic studies of agricultural water-conservation issues
49Water Conservation in Irrigated Agriculture: Trends and Challenges in the Face of Emerging Demands / EIB-99
Economic Research Service/USDA
have been helpful, these studies were limited in their ability to handle the broad range of “production system” adaptation strategies that will help irri-gated agriculture adjust to a future of increasing competition for a stable or declining supply of water. This reduced-supply, rising-demand environment will place increased pressures on producers to adopt production systems that simultaneously reduce crop consumptive water use while maintaining farm profi ts. Managing water on the farm, whether applied by gravity or by high- or low-pressure sprinkler irrigation, will become an increasingly important part of the farm’s irrigation production system technology.
In an increasingly water-scarce world, production system adaptation strate-gies are likely to involve complex production decisions on crop choice, water application rates, and adopting effi cient irrigation technology and water management practices that adjust to changing water-supply conditions over time. Economic analyses from a production system perspective could simultaneously consider all the components of a producer’s production deci-sions—crop choice, crop yield target, irrigation system type, and onfarm water management regime—combined with fi eld-level physical/environ-mental characteristics and water-supply conditions. As competing demands and climate change increasingly strain the water supply/demand environment for agriculture, economic analysis of water conservation policy issues and their impact on agricultural production and regional resource use and quality will become more complex. Such analyses, however, could also enhance the quality and reliability of information on irrigation choices, improving our understanding of irrigated agriculture’s adaptability toward a more sustain-able future.
50Water Conservation in Irrigated Agriculture: Trends and Challenges in the Face of Emerging Demands / EIB-99
Economic Research Service/USDA
References
Aillery, Marcel, Robbin Shoemaker, and Margriet Caswell. “Agriculture and Ecosystem Restoration in South Florida: Assessing Trade-Offs from Water-Retention Development in the Everglades Agricultural Area,” American Journal of Agricultural Economics Vol. 83, No. 1: pp. 183-95, February 2001.
Ayars, James E. “Adapting Irrigated Agriculture to Drought in the San Joaquin Valley of California,” Policy Note 03-0910, University of California-Riverside, Water Science and Policy Center, p. 4, September 2010, http://wspc.ucr.edu/policy_notes/PN_03_0910_Drought.pdf.
Bartis, J.T., T. LaTourrete, L. Dixon, D.J. Peterson, and G. Cecchine. Oil Shale Development in the United States: Prospects and Policy Issues, RAND Corporation: Arlington, VA, p. 68, 2005.
Bates, B.C., Z.W. Kundzewicz, S. Wu, and J.P. Palutikof (Eds.). Climate Change and Water, IPCC Technical Paper VI, Intergovernmental Panel on Climate Change, IPCC Secretariat: Geneva, p. 210, 2008.
Bernhardt, E.S., M.A. Palmer, J.D. Allan, G. Alexander, K. Barnas, S. Brooks, J. Carr, S. Clayton, C. Dahm, J. Follstad-Shah, D. Galat, S. Gloss, P. Goodwin, D. Hart, B. Hassett, R. Jenkinson, S. Katz, G.M. Kondolf, P.S. Lake, R. Lave, J.L. Meyer, T.K. O’Donnell, L. Pagano, B. Powell, and E. Sudduth. “Synthesizing U.S. River Restoration Efforts,” Science Vol. 308, No. 5722: pp. 636-37, April 2005.
Brekke, L.D., J.E. Kiang, J.R. Olsen, R.S. Pulwarty, D.A. Raff, D.P. Turnipseed, R.S. Webb, and K.D. White. Climate Change and Water Resources Management—A Federal Perspective, U.S. Geological Survey, Circular 1331, p. 65, 2009.
Burt, C.M., A.J. Clemmens, T.S. Strelkoff, K.H. Solomon, R.D. Bliesner, L.A. Hardy, T.A. Howell, and D.E. Eisenhauer. “Irrigation Performance Measures: Effi ciency and Uniformity,” Journal of Irrigation and Drainage Engineering Vol. 123 (6): pp. 423-42, November 1997.
CALFED Bay-Delta Program. CALFED Record of Decision, 2010, http://calwater.ca.gov/calfed/objectives/ecosystem_restoration.html.
California Department of Conservation. 2006-2008 California Farmland Conversion Report, Farmland Division of Land Resource Protection, Mapping and Monitoring Program: Sacramento, CA, p. 97, 2011.
Carey, Janis M., and David Zilberman. “A Model of Investment Under Uncertainty: Modern Irrigation Technology and Emerging Markets in Water,” American Journal of Agricultural Economics Vol. 84, No. 1: pp. 171-83, February 2002.
Caswell, M., and D. Zilberman. “The Choices of Irrigation Technologies in California,” American Journal of Agricultural Economics Vol. 67: pp. 224-34, May 1985.
51Water Conservation in Irrigated Agriculture: Trends and Challenges in the Face of Emerging Demands / EIB-99
Economic Research Service/USDA
Center for Irrigation Technology (CIT). Agricultural Water Use in California: A 2011 Update, Staff Report, California State University, p. 79, November 2011.
Chesapeake Energy. “Water Use in Deep Shale Gas Exploration,” Fact Sheet, p. 2, May 2011, http://www.chk.com/Media/Educational-Library/Fact-Sheets/Pages/default.aspx.
Chiu, Yi-Wen, B. Walseth, and S. Suh. “Water Embodied in Bio-Ethanol in the United States,” Environmental Science and Technology Vol. 43, No. 8: pp. 2688-92, 2009.
Christensen, N.S., and D.P. Lettenmaier. “A multimodel ensemble approach to assessment of climate change impacts on the hydrology and water resources of the Colorado River Basin,” Hydrology and Earth System Sciences Vol. 11: pp. 1417-34, 2007.
Claims Resolution Act of 2010. Titles III – VI, Public Law 111-291, pp. 3073-3156, December 8, 2010.
Clemmens, A.J., R.G. Allen, and C.M. Burt. “Technical Concepts Related to Conservation of Irrigation and Rainwater in Agricultural Systems,” Water Resources Research Vol. 44, W00E03, doi:10.1029/2007WR006095, p. 16, 2008.
Circlepoint. Listen to the River: An Independent Review of the CVPIA Fisheries Program, U.S. Bureau of Reclamation and the U.S. Fish and Wildlife Service, p. 51, December 2008.
Congressional Budget Offi ce (CBO). Water Use Confl icts in the West: Implications of Reforming the Bureau of Reclamation’s Water Supply Policies, United States Congress, August 1997.
Department of Water Resources (DWR). DWR Increases Water Allocation: Final Delivery Estimate is 45 Percent of Requests, DWR News Releases, California, May 20, 2010a, http://www.water.ca.gov/news/newsreleases/2010/05202010fi nalallocation.pdf.
Department of Water Resources (DWR). Late Spring Weather Allows DWR to Increase Water Allocation: Final Delivery Estimate is 50 Percent of Requests, DWR News Releases, California, June 23, 2010b, http://www.water.ca.gov/news/newsreleases/2010/06232010revisedfi nalallocation.pdf.
Dettinger, Michael, and Sam Earman. “Western Groundwater and Climate Change—Pivotal to Supply Sustainability or Vulnerability in its Own Right?” Ground Water: News and Views Vol. 4, No. 1: pp. 4-5, June 2007.
Evans, Robert G., and E. John Sadler. “Methods and technologies to improve effi ciency of water use,” Water Resources Research Vol. 44, W00E04, doi:10.1029/2007WR006200, p. 15, 2008.
52Water Conservation in Irrigated Agriculture: Trends and Challenges in the Face of Emerging Demands / EIB-99
Economic Research Service/USDA
Evett, Steven, Dennis Carman, and Dale Bucks. “Expansion of Irrigation in the Mid South United States: Water Allocation and Research Issues,” Proceedings, 2nd International Conference on Irrigation and Drainage, Water for a Sustainable World–Limited Supplies and Expanding Demand, U.S. Committee on Irrigation and Drainage: Phoenix, AZ, pp. 247-60, May 12-15, 2003.
Fereres, Elias, and María Auxiliadora Soriano. “Defi cit irrigation for reducing agricultural water use,” Journal of Experimental Botany, Special Issue, Vol. 58, No. 2: pp. 147-59, 2007.
Fischer Farm Services. Reasons to Invest in Mississippi Farmland, Aberdeen, MS, 2011, http://www.fi scherfarmservices.com/reasons_farm.html.
Florida Department of Environmental Protection (DEP). Sustaining Our Water Resources: Annual Report on Regional Water Supply Planning, p. 21, March 2010.
Gardner, B. Delworth, and Herbert H. Fullerton. “Transfer Restrictions and Misallocations of Irrigation Water,” American Journal of Agricultural Economics Vol. 50, No. 3: pp. 556-71, 1968.
Geerts, Sam, and Dirk Raes. “Defi cit irrigation as an on-farm strategy to maximize crop water productivity in dry areas,” Agricultural Water Management Vol. 96, No. 9: pp. 1275-84, 2009.
Gillon, K., M. Cohen, J. Pitt, J. Wechsler, G. Voggesser, P. Culp, F. Zamora, R. Wigington, and P. Hyde. Conservation Before Shortage II: Proposal for Colorado River Operations, Defenders of Wildlife, Environmental Defense, National Wildlife Federation, The Nature Conservancy, Pacifi c Institute, Sierra Club, Sonoran Institute, pp. 1-9, July 2006, http://www.pacinst.org/topics/water_and_sustainability/colorado_river/shortage_proposal/CBS_II.pdf.
Gollehon, N., and W. Quinby. “Irrigation Resources and Water Costs,” Agricultural Resources and Environmental Indicators, 2006 Edition, EIB-16, U.S. Department of Agriculture, Economic Research Service, pp. 24-32, 2006.
Green, Timothy R., Makoto Taniguchi, and Henk Kooi. “Potential Impacts of Climate Change and Human Activity on Subsurface Water Resources,” Vadose Zone Journal Vol. 6, No. 3: pp. 531-32, August 2007.
Gregory, Liana. “Technically Open: The Debate Over Native American Reserved Groundwater Rights,” Journal of Land, Resources, and Environmental Law Vol. 28, No. 2: pp. 361-73, 2008.
Ground Water Protection Council (GWPC) and All Consulting. Modern Shale Gas Development in the United States: A Primer, U.S. Department of Energy, Offi ce of Fossil Energy, National Energy Technology Laboratory, Contract DE-FG26-04NT15455, p. 96, April 2009.
53Water Conservation in Irrigated Agriculture: Trends and Challenges in the Face of Emerging Demands / EIB-99
Economic Research Service/USDA
Hall, Noah D., Bret B. Stuntz, and Robert H. Abrams. “Climate Change and Freshwater Resources,” Natural Resources& Environment Vol. 22, No. 3 (Winter): pp. 30-5, 2008.
Hamilton, J.R., N.K. Whittlesey, and P. Halverson. “Interruptible Water Markets in the Pacifi c Northwest,” American Journal of Agricultural Economics Vol. 71, No. 1: pp. 63-75, February 1989.
Harwood, J., R. Heifner, K. Coble, J. Perry, and A. Somwaru. Managing Risk in Farming: Concepts, Research, and Analysis, AER-774, U.S. Department of Agriculture, Economic Research Service, p. 125, March 1999.
Hatfi eld, J.L., K.J. Boote, P.A. Fay, G.L. Hahn, R.C. Izaurralde, B.A. Kimball, T.L. Mader, J.A. Morgan, D.R. Ort, H.W. Polley, A.M. Thomson, and D.W. Wolfe. “Agriculture,” The Effects of Climate Change on Agriculture, Land Resources, Water Resources, and Biodiversity in the United States, U.S. Climate Change Science Program and the Subcommittee on Global Change Research: Washington, DC, p. 21-74, May 2008.
Hoerling, M., and J. Eischeid. “Past Peak Water in the Southwest,” Southwest Hydrology Vol. 6, p. 18, 2007.
Hornbaker, R.H., and H.P. Mapp. “A Dynamic Analysis of Water Savings from Advanced Irrigation Technology,” Western Journal of Agricultural Economics Vol. 13, No. 2: pp. 307-15, 1988.
Howe, C.W. “Economic, Legal, and Hydrologic Dimensions of Potential Interstate Water Markets,” American Journal of Agricultural Economics Vol. 67, No. 5: pp. 1226-30, 1985.
Howell, T.A. “Irrigation Effi ciency,” Encyclopedia of Water Science, pp. 467-72, 2003.
Huffaker, R. “Impacts of Biofuels on Water Supply: Proposed Cures May Worsen the Disease,” Choices Vol. 25, No. 3, 3rd Quarter: pp. 7-10, 2010.
Huffaker, R., and N. Whittlesey. “A Theoretical Analysis of Economic Incentive Policies Encouraging Agricultural Water Conservation,” Water Resources Development Vol. 19, No. 1: pp. 37-53, 2003.
Intergovernmental Panel on Climate Change (IPCC Report). “Climate Change 2007: Impacts, Adaptation and Vulnerability,” Fourth Assessment Report of the Intergovernmental Panel on Climate Change, M.L. Parry, O.F. Canziani, J.P. Palutikof, J.P. van der Linden, and C.E. Hanson (Eds.), Cambridge University Press: Cambridge, UK, p. 976, 2007.
54Water Conservation in Irrigated Agriculture: Trends and Challenges in the Face of Emerging Demands / EIB-99
Economic Research Service/USDA
Izaurralde, R.C., N.J. Rosenberg, R.A. Brown, and A.M. Thomson. “Integrated assessment of Hadley Center (HadCM2) climate-change impacts on agricultural productivity and irrigation water supply in the conterminous United States, Part II: Regional agricultural production in 2030 and 2095,” Agricultural and Forest Meteorology Vol. 117, pp. 97-122, 2003.
Jerla, Carly, and Jim Prairie. “Colorado River Interim Guidelines for Lower Basin Shortages and the Coordinated Operations for Lake Powell and Lake Mead & Efforts Addressing Climate Change and Variability,” Intermountain West Climate Summary Vol. 5, Issue 1: pp. 5-7, January 2009.
Kenny, J.F., N.L. Barber, S.S. Hutson, K.S. Linsey, J.K. Lovelace, and M.A. Maupin. Estimated Use of Water in the United States in 2005, Circular 1344, U.S. Department of the Interior, U.S. Geological Survey, p. 52, 2009.
Kim, C.S., G.D. Schaible, and S.G. Daberkow. “An Effi cient Cost-Sharing Program to Reduce Nonpoint-Source Contamination: Theory and an Application to Groundwater Contamination,” Environmental Geology Vol. 39, No. 6: pp. 649-59, April 2000.
Kim, C.S., M.R. Moore, J. Hanchar, and M. Nieswiadomy. “A Dynamic Model of Adaptation to Resource Depletion: Theory and an Application to Groundwater Mining,” Journal of Environmental Economics and Management Vol. 17, No. 1: pp. 66-82, 1989.
Knowles, Noah, Michael D. Dettinger, and Daniel R. Cyan. “Trends in Snowfall versus Rainfall in the Western United States,” Journal of Climate Vol. 19, Issue 18: pp. 4545-59, September 2006.
Landry, C. “Market transfers of water for environmental protection in the western United States,” Water Policy Vol. 1, No. 5: pp. 457-69, 1998.
Lemke, P., J. Ren, R. Alley, I. Allison, J. Carrasco, G. Flato, Y. Fujii, G. Kaser, P. Mote, R.H. Thomas, and T. Zhang. “Observations: Changes in Snow, Ice and Frozen Ground,” Climate Change 2007: The Physical Science Basis, a Contribution of Working Group I to the Fourth Assessment Report of the Intergovernmental Panel on Climate Change, S. Solomon, D. Quin, M. Manning, Z. Chen, M. Marquis, K.B. Averyt, M. Tignor, and H.L. Miller (Eds.), Cambridge University Press: Cambridge and New York, pp. 337-84, 2007.
MacDonnell, Lawrence J. “Environmental Flows in the Rocky Mountain West: A Progress Report,” Wyoming Law Review Vol. 9, No. 2: pp. 335-96, 2009.
Malcolm, Scott A., Marcel Aillery, and Marca Weinberg. Ethanol and a Changing Agricultural Landscape, ERR-86, U.S. Department of Agriculture, Economic Research Service, p. 58, November 2009.
55Water Conservation in Irrigated Agriculture: Trends and Challenges in the Face of Emerging Demands / EIB-99
Economic Research Service/USDA
Martin, W.E. “Evolving Water Institutions in an Urbanizing West: Discussion,” American Journal of Agricultural Economics Vol. 68: pp. 1152-54, 1986.
McCabe, G.J., and D.M. Wolock. “Warming may create substantial water supply shortages in the Colorado River basin,” Geophysical Research Letters Vol. 34, L22708: pp. 1-5, November 2007.
Midwest Irrigation. Midwest States Increase Irrigation, The Net Irrigate Blog, 2010, http://netirrigate.wordpress.com/tag/midwest-irrigation/.
Moore, M.R. “Native American Water Rights: Effi ciency and Fairness,” Natural Resources Journal Vol. 29 (Summer): pp. 763-91, 1989.
Moore, M.R. “The Bureau of Reclamation’s New Mandate for Irrigation Water Conservation: Purposes and Policy Alternatives,” Water Resources Research Vol. 27: pp. 145-55, February 1991.
Mote, P.W., A.F. Hamlet, M.P. Clark, and D.P. Lettenmaier. “Declining Mountain Snowpack in Western North America,” Bulletin of the American Meteorological Society Vol. 86: pp. 39-49, 2005.
Mote, P.W., E.A. Parson, A.F. Hamlet, W.S. Keeton, D. Lettenmaier, N. Mantau, E.L. Miles, D.W. Peterson, D.L. Peterson, R. Slaughter, and A.K. Snover. “Preparing for Climate Change: The Water, Salmon, and Forests of the Pacifi c Northwest,” Climate Change Vol. 61: pp. 45-88, 2003.
National Energy Technology Laboratory (NETL). Estimating Freshwater Needs to Meet Future Thermoelectric Generation Requirements, 2008 Update, DOE/NETL-400/2008/1339, p. 107, September 2008, http://www.netl.doe.gov/technologies/coalpower/ewr/pubs/2008_Water_Needs_Analysis-Final_10-2-2008.pdf.
National Research Council (NRC). A New Era for Irrigation, Water Science and Technology Board, National Academies Press: Washington, DC, 1996.
National Research Council (NRC). Toward Sustainable Agricultural Systems in the 21st Century, Board on Agriculture and Natural Resources, National Academies Press: Washington, DC, 2010.
National Research Council (NRC). Water Implications of Biofuels Production in the United States, Water Science and Technology Board, National Academies Press: Washington, DC, p. 86, 2008.
National Water Assessment Group (NWAG Report). Water: The Potential Consequences of Climate Variability and Change, Peter Gleick (project lead), U.S. Global Change Research Program: Oakland, CA, p. 160, September 2000.
Negri, D.H., and D.H. Brooks. “Determinants of Irrigation Technology Choice,” Western Journal of Agricultural Economics Vol. 15, No. 2: pp. 213-23, December 1990.
56Water Conservation in Irrigated Agriculture: Trends and Challenges in the Face of Emerging Demands / EIB-99
Economic Research Service/USDA
Peterson, J.M., T.L. Marsh, and J.R. Williams. “Conserving the Ogallala Aquifer: Effi ciency, Equity, and Moral Motives,” Choices, First Quarter, pp. 15-8, 2003.
Poff, N.L., J.D. Allan, M.A. Palmer, D.D. Hart, B.D. Richter, A.H. Arthington, K.H. Rogers, J.L. Meyer, and J.A. Stanford. “River Flows and Water Wars: Emerging Science for Environmental Decision Making,” Frontiers in Ecology and the Environment Vol. 1, Issue 6: pp. 298-306, August 2003.
Rood, S.B., G.M. Samuelson, J.K. Weber, and K.A. Wyrot. “Twentieth-century decline in streamfl ows from the hydrographic apex of North America,” Journal of Hydrology Vol. 306: pp. 215-33, 2005.
Sadler, E.J., R.G. Evans, K.C. Stone, and C.R. Camp. “Opportunities for Conservation with Precision Irrigation,” Journal of Soil and Water Conservation Vol. 60, No. 6: pp. 371-79, 2005.
Schaible, G.D. “Economic and Conservation Tradeoffs of Regulatory vs. Incentive-based Water Policy in the Pacifi c Northwest,” International Journal of Water Resources Development Vol. 16, No. 2: pp. 221-38, 2000.
Schaible, G.D. “Water Conservation Policy Analysis: An Interregional, Multi-Output, Primal-Dual Optimization Approach,” American Journal of Agricultural Economics Vol. 79: pp. 163-77, February 1997.
Schaible, G.D. Western Irrigated Agriculture, data set, U.S. Department of Agriculture, Economic Research Service, 2004, http://www.ers.usda.gov/Data/WesternIrrigation.
Schaible, G.D., C.S. Kim, and M.P. Aillery. “Dynamic Adjustment of Irrigation Technology/Water Management in Western U.S. Agriculture: Toward a Sustainable Future,” Canadian Journal of Agricultural Economics Vol. 58: pp. 433-61, December 2010.
Schaible, G.D., and M.P. Aillery. “Irrigation Technology Transitions in the Mid-Plains States: Implications for Water Conservation/Water Quality Goals and Institutional Changes,” Water Resources Development Vol. 19, No. 1: pp. 67-88, 2003.
Schaible, G.D., and M.P. Aillery. “Irrigation Water Management,” Agricultural Resources and Environmental Indicators: 2006 Edition, EIB-16, U.S. Department of Agriculture, Economic Research Service, pp. 134-43, 2006, http://www.ers.usda.gov/publications/arei/eib16/eib16_4-6.pdf.
Schuck, E.C., W.M. Frasier, R.S. Webb, L.J. Ellingson, and W.J. Umberger. “Adoption of More Technically Effi cient Irrigation Systems as a Drought Response,” International Journal of Water Resources Development Vol. 21, No. 4: pp. 651-62, 2005.
57Water Conservation in Irrigated Agriculture: Trends and Challenges in the Face of Emerging Demands / EIB-99
Economic Research Service/USDA
Seaber, Paul R., F. Paul Kapinos, and George L. Knapp. Hydrologic Unit Maps, Water-Supply Paper 2294, U.S. Department of the Interior, U.S. Geological Survey, p. 20, 1987, http://pubs.usgs.gov/wsp/wsp2294/pdf/wsp_2294_a.pdf.
Soil and Water Conservation Service (SWCS) and Environmental Defense (ED). Environmental Quality Incentives Program (EQIP): Program Assessment, p. 34, March 2007, http://www.swcs.org/documents/fi lelibrary/EQIP_assessment.pdf.
Sophocleous, Marios. “The Science and Practice of Environmental Flows and the Role of Hydrogeologists,” Ground Water Vol. 45, No. 4: pp. 393-401, July-August 2007.
Supalla, Raymond J. Personal communication, University of Nebraska-Lincoln, Agricultural Economics Department, 2011.
U.S. Climate Change Science Program (U.S. CCSP), and the Subcommittee on Global Change Research. The Effects of Climate Change on Agriculture, Land Resources, Water Resources, and Biodiversity in the United States, P. Backlund, A. Janetos, D. Schimel, J. Hatfi eld, K. Boote, P. Fay, L. Hahn, C. Izaurralde, B.A. Kimball, T. Mader, J. Morgan, D. Ort, W. Polley, A. Thomson, D. Wolfe, M.G. Ryan, S.R. Archer, R. Birdsey, C. Dahm, L. Heath, J. Hicke, D. Hollinger, T. Huxman, G. Okin, R. Oren, J. Randerson, W. Schlesinger, D. Lettenmaier, D. Major, L. Poff, S. Running, L. Hansen, D. Inouye, B.P. Kelly, L. Meyerson, B. Peterson, and R. Shaw (Contrib.), U.S. Department of Agriculture, p. 362, 2008.
U.S. Department of Agriculture, National Agricultural Statistics Service (USDA/NASS). 2007 Census of Agriculture: U.S. Summary and State Data, Vol. 1, Geographic Area Series, Part 51 (AC-07-A-51), p. 739, 2009, http://www.agcensus.usda.gov/Publications/2007/Full_Report/usv1.pdf.
U.S. Department of Agriculture, National Agricultural Statistics Service (USDA/NASS). Farm and Ranch Irrigation Survey (2008), Vol. 3, Special Studies of the 2007 Census of Agriculture, Part I (AC-07-SS-1), p. 268, February 2010, http://www.agcensus.usda.gov/Publications/2007/Online_Highlights/Farm_and_Ranch_Irrigation_Survey/index.asp.
U.S. Department of Agriculture, National Agricultural Statistics Service (USDA/NASS), and Economic Research Service. Farm and Ranch Irrigation Survey, 1984-2008.
U.S. Department of Agriculture, Natural Resources Conservation Service (USDA/NRCS). “Conservation Practices that Save: Irrigation Water Management,” Save Energy Save Money, 2006, http://www.nrcs.usda.gov/Internet/FSE_DOCUMENTS/nrcs143_023630.pdf.
U.S. Department of Agriculture, Natural Resources Conservation Service (USDA/NRCS). Environmental Quality Incentives Program (EQIP) contract data from the NRCS PROTRACTS database, 2004-10.
58Water Conservation in Irrigated Agriculture: Trends and Challenges in the Face of Emerging Demands / EIB-99
Economic Research Service/USDA
U.S. Department of Agriculture, Natural Resources Conservation Service (USDA/NRCS). Final Benefi t-Cost Analysis for the Environmental Quality Incentives Program (EQIP), p. 116, May 2010, http://www.nrcs.usda.gov/Internet/FSE_DOCUMENTS/nrcs143_007977.pdf.
U.S. Department of Agriculture, Research, Education, and Economics (USDA/REE). Agricultural Water Security Listening Session–Final Report, J.P. Dobrowolski and M.P. O’Neill (Eds.), p. 31, 2004.
U.S. Department of Agriculture, Research, Education, and Economics (USDA/REE). Research, Education, and Economics Action Plan, Offi ce of the Under Secretary for Research, Education, and Economics, p. 37, February 2012.
U.S. Department of Agriculture (USDA), Offi ce of the Secretary. Strategic Plan FY 2010 – 2015, p. 50, 2012, http://www.usda.gov/wps/portal/usda/usdahome?navid=ABOUT_USDA.
U.S. Department of Energy (U.S. DOE). “Concentrating Solar Power Commercial Application Study: Reducing Water Consumption of Concentrating Solar Power Electricity Generation,” A Report to Congress, p. 35, 2010, http://www1.eere.energy.gov/solar/pdfs/csp_Water_Study.pdf.
U.S. Department of the Interior, Bureau of Land Management (U.S. BLM). Oil Shale Fact Sheet, 2011, http://www.blm.gov/pgdata/etc/medialib/blm/wo/Communications_Directorate/public_affairs/news_release_attachments.Par.96261.File.tmp/OilShaleFS_022011.pdf.
U.S. Department of the Interior, Bureau of Reclamation (U.S. BoR). Bay Delta Conservation Plan: Status Update 3, June 2010, http://www.assembly.ca.gov/acs/committee/c26/hearings/111910/BDCP_Status_Update_3_June_2010.pdf.
U.S. Department of the Interior, Bureau of Reclamation (U.S. BoR). Central Valley Project Improvement Act Program Activity Review Report, August 25, 2009, http://www.usbr.gov/mp/cvpia/docs_reports/docs/2009_Final%20CPAR%20Report%208-25-09.pdf.
U.S. Department of the Interior, Bureau of Reclamation (U.S. BoR). Final EIS – Colorado River Interim Guidelines for Lower Basin Shortages and Coordinated Operations for Lake Powell and Lake Mead, October 2007.
U.S. Department of the Interior, Bureau of Reclamation (U.S. BoR). Interior’s Indian Water Rights Settlement Program – Reclamation Support for Secretary’s Program, June 12, 2012, http://www.usbr.gov/native/waterrights/waterrights.html.
59Water Conservation in Irrigated Agriculture: Trends and Challenges in the Face of Emerging Demands / EIB-99
Economic Research Service/USDA
U.S. Department of the Interior, Bureau of Reclamation (U.S. BoR). Secure Water Act Section 9503(c)—Reclamation Climate Change and Water, Report to Congress, Patty Alexander, Brekke Levi, Gray Davis, Subhrendu Gangopadhyay, Katrina Grantz, Charles Hennig, Carly Jerla, Dagmar Llewellyn, Paul Miller, Tom Pruitt, David Raff, Tom Scott, Michael Tansey, and Toni Turner (Contrib.), Denver, CO, p. 205, April 2011, http://www.usbr.gov/climate/SECURE/docs/SECUREWaterReport.pdf.
U.S. Department of the Interior, U.S. Geological Survey (USGS). Effects of Climate Variability and Change on Groundwater Resources of the United States, Fact Sheet 2009-3074, J.J. Gurdak, R.T. Hanson, and T.R. Green(Contrib.), p. 4, September 2009.
U.S. Department of the Interior, U.S. Geological Survey (USGS). Groundwater Atlas of the United States, Alabama, Florida, Georgia, and South Carolina (HA 730-G), http://pubs.usgs.gov/ha/ha730/ch_g/G-text1.html; Iowa, Michigan, Minnesota, and Wisconsin (HA 730-J), http://pubs.usgs.gov/ha/ha730/ch_j/J-text1.html; and Arkansas, Louisiana, and Mississippi (HA 730-F), http://pubs.usgs.gov/ha/ha730/ch_f/F-text1.html, 2011.
U.S. Department of the Interior, U.S. Geological Survey (USGS). National Water-Quality Assessment (NAWQA) studies, 2011, http://water.usgs.gov/nawqa/bib.
U.S. Department of the Interior, U.S. Geological Survey (USGS). Water Use in Florida, 2005 and Trends 1950-2005, Fact Sheet 2008-3080, Richard L. Marella (Ed.), p. 7, September 2008.
U.S. Government Accountability Offi ce (U.S. GAO). Energy-Water Nexus: A Better and Coordinated Understanding of Water Resources Could Help Mitigate the Impacts of Potential Oil Shale Development, GAO-11-35, p. 69, October 2010.
U.S. Government Accountability Offi ce (U.S. GAO). Energy-Water Nexus: Many Uncertainties Remain about National and Regional Effects of Increased Biofuel Production on Water Resources, GAO-10-116, U.S. House of Representatives, Committee on Science and Technology, p. 50, 2009.
U.S. Senate Committee on Indian Affairs. Oversight Hearing on Indian Water Rights: Promoting the Negotiation and Implementation of Water Settlements in Indian Country, webcast, March 15, 2012, http://www.indian.senate.gov/hearings/hearing.cfm?hearingID=eb997a7c3376c76b36a041cf2a0ba6c1.
Van Kirk, R.W., and S.W. Naman. “Relative Effects of Climate and Water Use on Base-Flow Trends in the Lower Klamath Basin,” Journal of American Water Resources Association Vol. 44, No. 4: pp. 1035-52, August 2008.
60Water Conservation in Irrigated Agriculture: Trends and Challenges in the Face of Emerging Demands / EIB-99
Economic Research Service/USDA
Vories, Earl D., and Steven R. Evett. “Irrigation Research Needs in the USA Mid-South and Southeast, Humid and Subhumid Regions,” Proceedings for the 5th National Decennial Irrigation Conference, ASABE # IRR10-8679, American Society of Agricultural and Biological Engineers (ASABE) and the Irrigation Association: Phoenix, AZ, M. Dukes (Ed.), pp. 1-12, December 5-8, 2010.
Wall, Ellen, and Barry Smit. “Climate Change Adaptation in Light of Sustainable Agriculture,” Journal of Sustainable Agriculture Vol. 27, No. 1: pp. 113-23, 2005.
Wallander, Steven, Roger Claassen, and Cynthia Nickerson. The Ethanol Decade: An Expansion of U.S. Corn Production, 2000-09, EIB-79, U.S. Department of Agriculture, Economic Research Service, p. 16, August 2011.
Ward, F.A., and M. Pulido-Velazquez. “Water conservation in irrigation can increase water use,” Proceedings of the National Academy of Sciences Vol. 105, No. 47: pp. 18218-20, 2008.
Weinberg, M., C.L. Kling, and J.E. Wilen. “Water Markets and Water Quality,” American Journal of Agricultural Economics Vol. 75, No. 2: pp. 278-91, May 1993.
Western States Water Council. Indian Water Rights in the West, Western Governors Association, May 1984.
Whittlesey, N.K., and R.G. Huffaker. “Water Policy Issues for the Twenty-fi rst Century,” American Journal of Agricultural Economics Vol. 77: pp. 1199-203, December 1995.
Zellmer, Sandra. “Legal Tools for Instream Flow Protection,” Integrated Approaches to Riverine Resource Stewardship: Case Studies, Science, Law, People, and Policy, A. Locke, C. Stalnaker, S. Zellmer, K. Williams, H. Beecher, T. Richards, C. Robertson, A. Wald, A. Paul, and T. Annear (Contrib.), The Instream Flow Council: Cheyenne, WY, 2008.
Zellmer, Sandra. “United States: The Emergence of Environmental Considerations,” The Evolution of the Law and Politics of Water, J.W. Dellapenna and J. Gupta (Eds.), Springer Science and Business Media B.V., pp. 205-23, 2009.
Zilberman, D., A. Dinar, N. MacDougall, M. Khanna, C. Brown, and F. Castillo. Private and Institutional Adaptation to Water Scarcity During the California Drought: 1987-92, Staff Paper No. 9802, U.S. Department of Agriculture, Economic Research Service, p. 70, July 1998.