Embed Size (px)
Citation preview
Watercress (Nasturtium officinale) Production Utilizing Brook Trout (Salvelinus fontinalis) Flow-through Aquaculture Effluent
Erika Nichole Smith
Thesis submitted to the Davis College of Agriculture, Forestry, and Consumer Sciences
at West Virginia University in partial fulfillment of the requirements
for the degree of
Master of Science in
Todd P. West, Ph.D., Chair Sven Verlinden, Ph.D. Ken Semmens, Ph.D.
Department of Agriculture
Morgantown, West Virginia 2007
Keywords: aquaponics, effluent, phytoremediation, sustainable agriculture, watercress
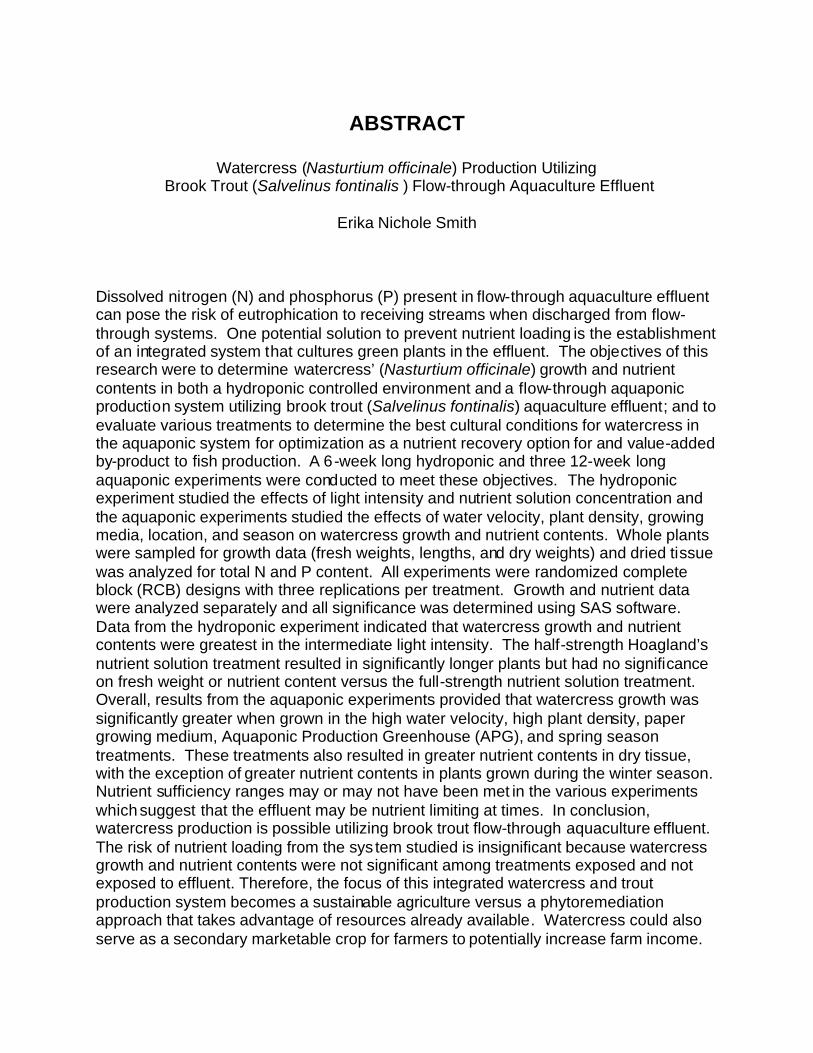
ABSTRACT
Watercress (Nasturtium officinale) Production Utilizing Brook Trout (Salvelinus fontinalis ) Flow-through Aquaculture Effluent
Erika Nichole Smith
Dissolved nitrogen (N) and phosphorus (P) present in flow-through aquaculture effluent can pose the risk of eutrophication to receiving streams when discharged from flow-through systems. One potential solution to prevent nutrient loading is the establishment of an integrated system that cultures green plants in the effluent. The objectives of this research were to determine watercress’ (Nasturtium officinale) growth and nutrient contents in both a hydroponic controlled environment and a flow-through aquaponic production system utilizing brook trout (Salvelinus fontinalis) aquaculture effluent; and to evaluate various treatments to determine the best cultural conditions for watercress in the aquaponic system for optimization as a nutrient recovery option for and value-added by-product to fish production. A 6-week long hydroponic and three 12-week long aquaponic experiments were conducted to meet these objectives. The hydroponic experiment studied the effects of light intensity and nutrient solution concentration and the aquaponic experiments studied the effects of water velocity, plant density, growing media, location, and season on watercress growth and nutrient contents. Whole plants were sampled for growth data (fresh weights, lengths, and dry weights) and dried tissue was analyzed for total N and P content. All experiments were randomized complete block (RCB) designs with three replications per treatment. Growth and nutrient data were analyzed separately and all significance was determined using SAS software. Data from the hydroponic experiment indicated that watercress growth and nutrient contents were greatest in the intermediate light intensity. The half-strength Hoagland’s nutrient solution treatment resulted in significantly longer plants but had no significance on fresh weight or nutrient content versus the full-strength nutrient solution treatment. Overall, results from the aquaponic experiments provided that watercress growth was significantly greater when grown in the high water velocity, high plant density, paper growing medium, Aquaponic Production Greenhouse (APG), and spring season treatments. These treatments also resulted in greater nutrient contents in dry tissue, with the exception of greater nutrient contents in plants grown during the winter season. Nutrient sufficiency ranges may or may not have been met in the various experiments which suggest that the effluent may be nutrient limiting at times. In conclusion, watercress production is possible utilizing brook trout flow-through aquaculture effluent. The risk of nutrient loading from the sys tem studied is insignificant because watercress growth and nutrient contents were not significant among treatments exposed and not exposed to effluent. Therefore, the focus of this integrated watercress and trout production system becomes a sustainable agriculture versus a phytoremediation approach that takes advantage of resources already available. Watercress could also serve as a secondary marketable crop for farmers to potentially increase farm income.
iii
ACKNOWLEDGEMENTS
The author wishes to acknowledge the USDA for grant approval and funding, Dr. Todd
West (Advisor/Committee Chair) for useful advice, guidance, and support, Dr. Ken
Semmens and Dr. Sven Verlinden (Committee members) for useful advice, insight, and
resources, Dr. Barton Baker (Division Chair) for approval, Dr. Dale Karlson (WVU
Professor) for informing me about the assistantship position, Dr. George Seidel (WVU
Professor) for assistance with statistics, Karen Buzby, Derek Dyer, and Will Ravenscroft
(Project engineers) for assistance with experiment and greenhouse construction,
Chestina Merriner and Jerry Yates (Reymann Farm personnel), Joan Wright (WVU
Soils Lab) for assistance with lab equipment, Jason Miller (Horticulture undergraduate)
for assistance with data collection, sample preparation, and hydroponic experiment
design, Emily Kaminski (Horticulture undergraduate) for assistance with data collection,
and all those associated with the Division of Plant & Soil Sciences, Davis College, and
WVU who helped to make this research possible and enjoyable.
iv
TABLE OF CONTENTS
ABSTRACT................................................................................................................................... ii ACKNOWLEDGEMENTS .......................................................................................................... iii LIST OF FIGURES.......................................................................................................................vi LIST OF TABLES........................................................................................................................vii LIST OF SYMBOLS / NOMENCLATURE ................................................................................ix INTRODUCTION..........................................................................................................................1 LITERATURE REVIEW...............................................................................................................5
Watercress (Nasturtium officina le R.Br.) ..............................................................................5 Aquaculture ...............................................................................................................................8 Hydroponics ..............................................................................................................................9 Aquaponics..............................................................................................................................10 Phytoremediation ...................................................................................................................12
EXPERIMENTAL OBJECTIVES..............................................................................................14 MATERIALS & METHODS.......................................................................................................16
Aquaculture System...............................................................................................................16 Hydroponic Experiment .........................................................................................................17 Aquaponic Experiments ........................................................................................................19
Summer 2005 (ARF)..........................................................................................................19 Winter and Spring 2006 (APG) ........................................................................................22
Plant Tissue Analysis.............................................................................................................25 Data Collection and Statistical Analysis .............................................................................26
RESULTS & DISCUSSION ......................................................................................................27
Hydroponic Experiment .........................................................................................................27 Growth Data ........................................................................................................................27 Nutrient Data .......................................................................................................................30
Aquaponic Experiments ........................................................................................................35 Summer 2005 (ARF)..............................................................................................................36
Growth Data ........................................................................................................................36 Nutrient Data .......................................................................................................................39
Summer 2005 (ARF) - Control Comparison.......................................................................45 Growth Data ........................................................................................................................45 Nutrient Data .......................................................................................................................48
Winter 2006 (APG) .................................................................................................................51 Growth Data ........................................................................................................................51
v
Nutrient Data .......................................................................................................................53 Winter 2006 – Location Comparison...................................................................................53
Growth Data ........................................................................................................................55 Nutrient Data .......................................................................................................................55
Spring 2006 (APG) .................................................................................................................57 Growth Data ........................................................................................................................57 Nutrient Data .......................................................................................................................61
Spring 2006 – Location Comparison...................................................................................64 Growth Data ........................................................................................................................64 Nutrient Data .......................................................................................................................67
Winter v. Spring 2006 – Season Comparison ...................................................................70 Watercress Yield and Profit Estimates ...............................................................................71
CONCLUSIONS .........................................................................................................................75 LITERATURE CITED.................................................................................................................78 APPENDIX ..................................................................................................................................81 CURRICULUM VITAE.............................................................................................................115
vi
LIST OF FIGURES
Figure 1. Research Location Layout Figure 2. Aquaculture Research Facility (ARF) Layout Figure 3. Aquaponic Production Greenhouse (APG) Layout Figure 4. Hydroponic Watercress Growth at Week 6 – Length Figure 5. Hydroponic Watercress Growth at Week 6 – Dry weight
vii
LIST OF TABLES Table 1. Effects of Light intensity, Sample Date, and Nutrient Solution on Watercress Length and Fresh Weight in a Controlled Environment Table 2. Effects of Light intensity and Nutrient Solution on Watercress Total Nitrogen Content in a Controlled Environment Table 3. Effects of Water Velocity, Growing Media, Replication, and Sample Date on Watercress Length & Dry Weight - Summer 2005 (ARF) Table 4. Effects of Water Velocity, Growing Media, and Sample Date on Watercress Total Nitrogen Content - Summer 2005 (ARF) Table 5. Effects of the Factorial Combination of Water Velocity and Growing Media on Watercress Total Phosphorus Content - Summer 2005 (ARF) Table 6. Effects of Water Velocity, Growing Media, and Sample Date on Watercress Length and Dry Weight - Summer 2005 (ARF) - Control Comparison Table 7. Effects of Water Velocity, Growing Media, and Sample Date on Watercress Total Nitrogen and Phosphorus Content – Summer 2005 (ARF) - Control Comparison Table 8. Effects of Water Velocity and Sample Date on Watercress Length and Dry Weight - Winter 2006 (APG) Table 9. Effect of Sample Date on Watercress Total Nitrogen Content – Winter 2006 (APG) Table 10. Effects of Experiment Location and Sample Date on Watercress Length and Dry Weight - Winter 2006 - Location Comparison Table 11. Effects of Experiment Location and Sample Date on Watercress Total Nitrogen and Phosphorus Content - Winter 2006 - Location Comparison Table 12. Effects of Water Velocity, Plant Density, and Sample Date on Watercress Length and Dry Weight - Spring 2006 (ARF) Table 13. Effects of Water Velocity, Plant Density, and Replication on Watercress Total Nitrogen and Phosphorus Contents - Spring 2006 (APG)

viii
Table 14. Effects of Experiment Location and Sample Date on Watercress Length and Dry Weight - Spring 2006 - Location Comparison Table 15. Effect of Experiment Location on Watercress Total Nitrogen and Phosphorus Contents - Spring 2006 - Location Comparison

ix
LIST OF SYMBOLS / NOMENCLATURE 1. ARF – Aquaculture Research Facility 2. APG – Aquaponic Production Greenhouse 3. ANOVA – Analysis of Variance 4. BCF – Bio-concentration Factor 5. BMP – Best Management Practices 6. CAAP – Concentrated Aquatic Animal Production 7. N – Nitrogen 8. P – Phosphorus 9. TSS – Total Suspended Solids 10. ELG – Effluent Limit Guidelines 11. EPA – Environmental Protection Agency 12. NFT – Nutrient Film Technique 13. NPDES – National Pollutant Discharge Elimination System 14. NRCCE – National Research Center for Coal and Energy 15. OLSB – Off-line Settling Basin 16. RCB – Randomized Complete Block 17. RMF – Reymann Memorial Farm 18. PAR – Photosynthetically Active Radiation 19. PEITC - 2-phen(yl)ethyl-isothiocyanate 20. WVDEP – West Virginia Department of Environmental Protection 21. BWQ – Baseline Water Quality 22. WV – West Virginia 23. WVU – West Virginia University 24. US – United States
1
INTRODUCTION The aquaculture, or concentrated aquatic animal production (CAAP), industry is
under increasing pressure to reduce the concentration and amount of aquaculture
effluent that is released into the environment from aquaculture systems. Aquaculture
effluent contains nutrient waste generated from production. When these nutrients are
discharged from aquaculture systems, they can result in nutrient loading of natural
water bodies and lead to environmental degradation. In the absence of treatment,
pollutant loadings from individual CAAP facilities can contribute up to several thousand
pounds of nitrogen (N) and phosphorus (P) and up to several million pounds of total
suspended solids (TSS) per year (EPA, 2004).
Effluent limitation guidelines (ELGs) have been established by the Environmental
Protection Agency (EPA) regarding flow-through, recirculating, or net pen aquaculture
systems that directly discharge wastewater into the nation’s waters (EPA, 2004). CAAP
facilities qualify as point sources and are required under the Clean Water Act to obtain a
National Pollutant Discharge Elimination System (NPDES) permit to regulate the
amount of soluble solids and nutrients discharged into the nation’s waters (EPA, 2004).
Systems yielding over 9,090 kg (harvest weight) of aquatic animals annually and
feeding over 2,272 kg of food during a calendar month of maximum feeding (major
limiting factor) are required to obtain a NPDES permit (EPA, 2004). Systems producing
and feeding less than these amounts are not currently required to obtain a permit. Due
to potential environmental degradation from any aquaculture system, regulations are
also likely to be implemented in the future on systems yielding under the current
2
guidelines.
At the state level, Antidegradation Implementation Procedures established by the
West Virginia Department of Environmental Protection (WVDEP), under Titles 60, CSR
5 and 46, CSR 1, require baseline water quality (BWQ) assessments for receiving water
segments for any new or expanded operation that wants permit coverage. If BWQ has
not been previously established, it is the responsibility of the regulated entity to conduct
the assessment according to the proper procedures set forth by the WVDEP (WVDEP,
2001).
The number of operations selling and/or distributing fish and/or eggs in West
Virginia (WV) increased from 25 in 2003 to 31 in 2004. The number of operations in the
United States (US) increased from 545 in 2003 to 610 in 2004 (NASS, 2005). The total
value of all trout sales (fish and eggs) in 20 selected states, including WV, totaled $68.7
million in 2004, a 7% increase from 2003 (NASS, 2005). Statistics reveal growth of the
aquaculture industry in both the nation and WV, which has an aquaculture output of
about $2 million annually (Semmens, 2003). This current trend indicates a valid
concern for protecting the environment and providing the aquaculture industry with cost-
effective methods to manage effluent to ensure compliance, now and in the future.
One such cost-effective method to recover nutrients and positively utilize
aquaculture effluent is the development of sustainable, integrated aquaponic systems
that cultivate green plants in effluent to remove nutrients. Many studies have looked at
integrated aquaponic systems to address the aquaculture effluent issue in recirculating
systems, but not as a management option for flow-through systems.
This research involves an integrated system that evaluates the production of
3
watercress, Nasturtium officinale R.Br, and its ability to recover nutrients from brook
trout, Salvelinus fontinalis (Mitchill), flow-through aquaculture effluent by utilizing the
phytoremediation process versus dilution or discharge. There were two main roles of
watercress in this integrated agriculture research: to act as a bio-filter and recover N
and P from effluent to prevent nutrient loading of the receiving stream and to potentially
increase aquaculture industry income by serving as a value-added, secondary
marketable crop that utilizes resources (i.e. irrigation, fertilizer) already available.
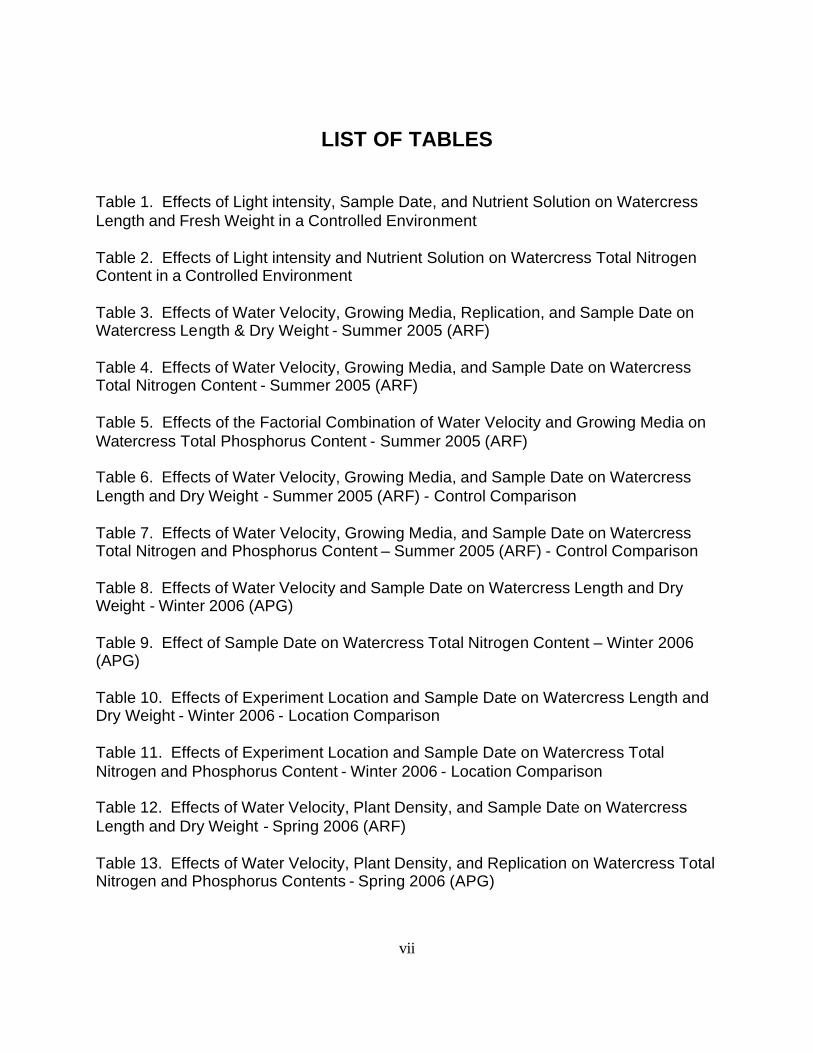
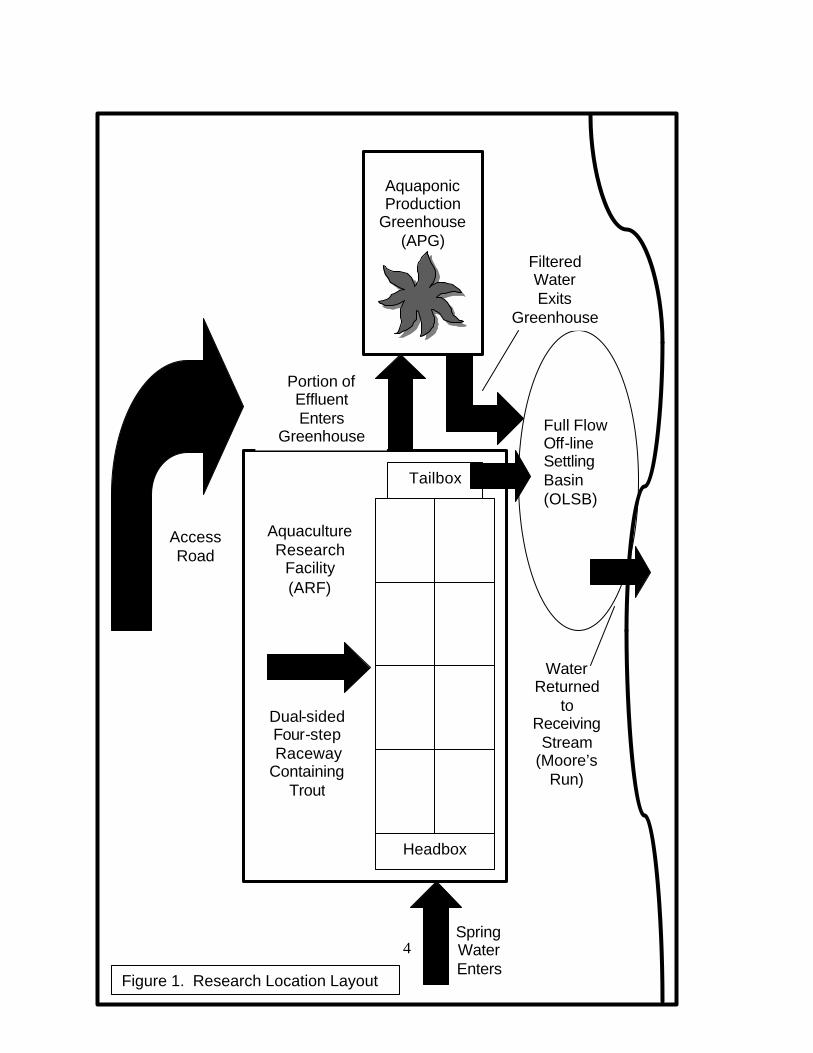
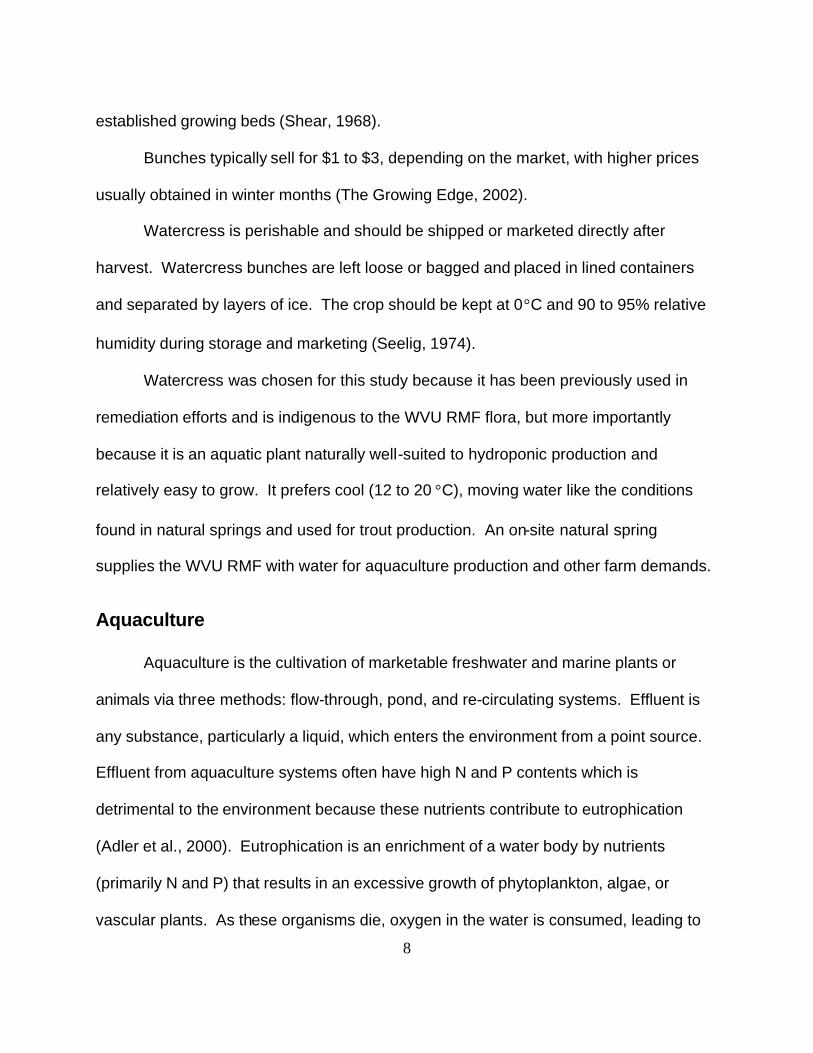
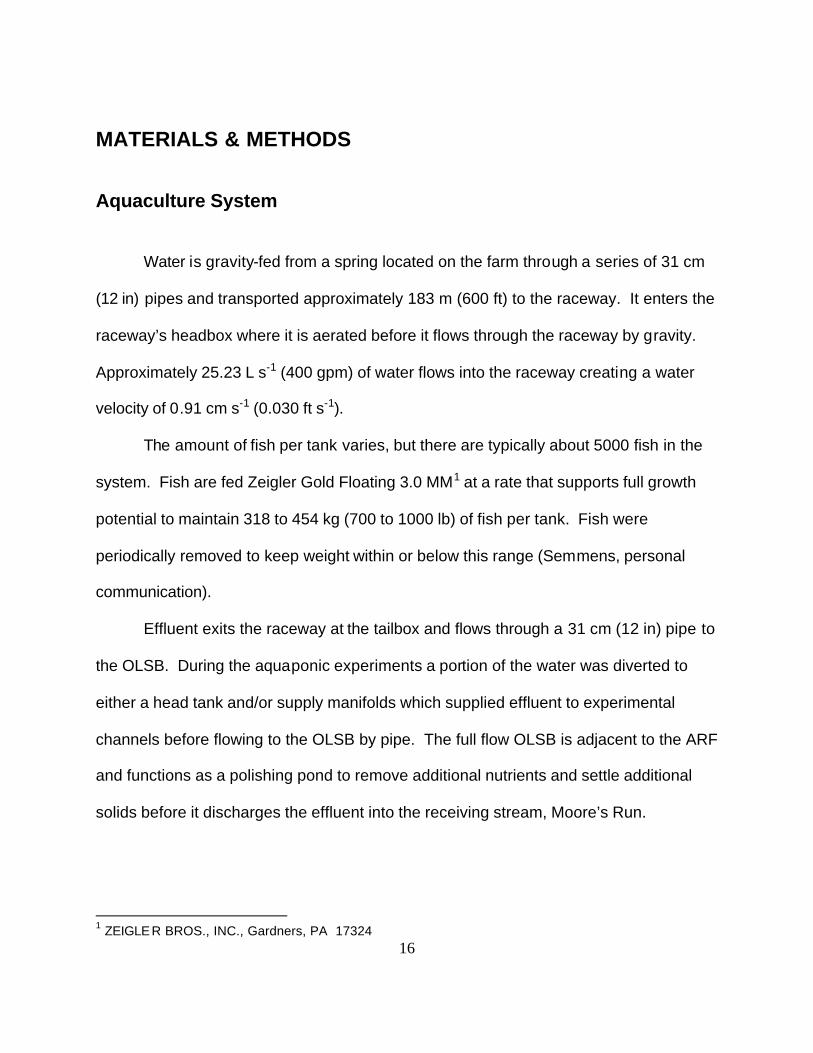
Figure 1 shows the general layout of the research location at the West Virginia
University (WVU) Reymann Memorial Farm (RMF) in Wardensville (Hardy County), WV
where the aquaponic experiments took place. The aquaculture research facility (ARF)
currently feeds less than 2,272 kg of feed during any month raises and does not fall
under the NPDES permit requirement. Quiescent zones in addition to an off-line settling
basin (OLSB) and other best management practices (BMPs) are currently used to
manage solids and effluent generated from fish production.
Results from this research may provide fish farmers with a pro-active,
preventative, cost-effective, and sustainable method of managing flow-through
aquaculture effluent. If successful, this research could potentially aid in alleviating
environmental degradation and the pressures that currently face the CAAP industry in
WV, the nation, and world wide.
4
Aquaponic Production
Greenhouse (APG)
Full Flow Off-line Settling Basin (OLSB)
Figure 1. Research Location Layout
Spring Water Enters
Water Returned
to Receiving
Stream (Moore’s
Run)
Headbox
Tailbox
Portion of Effluent Enters
Greenhouse
Filtered Water Exits
Greenhouse
Access Road
Aquaculture Research
Facility (ARF)
Dual-sided Four-step Raceway
Containing Trout
5
LITERATURE REVIEW
Watercress (Nasturtium officinale R.Br.) Watercress is in the family Brassicaceae (Cruciferae), the Mustard Family, which
consists of about 350 genera and over 3000 species. Some commonly known plants in
this family include broccoli, bok choy, cabbage, cauliflower, and onion. Brassicaceae
members share a suite of glycosinolate compounds, known as mustard oils, which are
characteristic in identification of the family (Texas A & M Univ., 2004).
Watercress dates back to the 1st Century A.D. and is one of the oldest known
green vegetables consumed by humans. It is used as a salad green, garnish, steamed
vegetable, and medicinal herb (Howard, 1976). Watercress is characterized by its
tangy, peppery flavor. The plant is very nutritious with plant constituents including beta
carotene (Vit A), aspartic acid (Vit C), calcium, folic acid, iron, iodine, and phosphorous.
It also contains arginine, glycine, lysine, tryptophan, the antioxidant a-tocopherol, and a
chemo-preventative of several tobacco specific carcinogens, 2 -phen(yl)ethyl-
isothiocyanate (PEITC), which is also the primary flavoring component of the plant
(Palaniswamy and McAvoy, 2001).
Watercress is an aquatic, perennial herb native to Europe and naturalized in the
United States. It lives in and obtains its nourishment from water, is not considered to
have a high nutrient demand, and little is known about the need or effectiveness of
fertilizer in growing beds (Seelig, 1974). It can grow in cool streams, near springs, or in
moist soil on stream banks, but grows best in running water. Watercress growth is
dependent on water velocity. The higher the nitrogen content of the water source, the
6
smaller the flow required for a given size bed. A large flow of water is needed to supply
other nutrients and protect plants from freezing (Seelig, 1974). The water supply should
contain greater than 2ppm of nitrate from larger springs and even greater levels for
smaller springs to support profitable beds (Shear, 1968). The sufficiency ranges for N
and P contents based on watercress new leaf samples taken in the middle of the
growing season are 4.2 to 6.0% N and 0.7 to 1.3% P (Mills et al, 1996).
Watercress can tolerate a range of light conditions from partial shade to full sun.
Production is reportedly heavier in summer months when more daylight promotes
growth (Seelig, 1974). If all other conditions are in proper supply, aquatic plants
saturate photosynthesis between 300 to 1000 µmol m-2 s-1, with a good target range
between 200 to 500 µmol m-2 s-1. Light intensities below 100 µmol m-2 s-1 are
considered low light and aquatic plants have a minimum compensation point required
between 15 to 85 µmol m-2 s-1 to stay alive (Pushak, 1997). Watercress is reported to
prefer a soil pH within the range of 4.3 to 8.3 (Simon et al, 1984).
Watercress has smooth, creeping or freely floating, stems with adventitious roots
forming at each node, typically below water. Leaves are compound with 3 to11 round or
oblong leaflets. Small white flowers, with the corolla in the shape of a cross, develop in
elongated racemes and bloom from April to June. Fruits are siliques that are 1.27 to
2.54 cm (0.5 to 1 in) long with 2 seeds per locule.
Commercial watercress is propagated via seed, shoot tip cuttings, and tissue
culture. Seed propagation is the preferred method due to the increased risk of
spreading turnip mosaic virus, a common disease of watercress when propagating via
shoot tip cuttings (Palaniswamy and McAvoy, 2001). One of the most serious pests of
7
commercial watercress is Armadillidium vulgare, or sow bug, which eats underwater
leaves and chews through stems. One method of sow bug control includes crop
rotation (Seelig, 1974). Other known diseases and pests include algae, duckweed,
crook rot disease, Cercospora sp. (chlorotic leaf spot), yellow spot virus, Plutella
xylostella (diamond back moth), Gammarus pulex (a terrestrial arthropod pest),
Steneotarsonemus pallidus (cyclamen mites), liver flukes, and several aphid species
(Palaniswamy and McAvoy, 2001). Maintaining a dense growth of watercress is one of
the most effective ways to control weeds (Seelig, 1974).
Watercress seed is typically sown in gravel beds with germination occurring in 5
to10 days. The cool season crop grows best with day temperatures of 20 to 25°C and
night temperature of 15 to 20°C, but can still grow successfully up to 28 °C. The
minimum temperature required to sustain a commercial system is 10 °C (The Growing
Edge, 2002).
Plants are harvested when they reach a height of 18 cm (7 in) around 35 days (in
summer) and 50 days (in spring and fall) or 6 to 7 weeks after sowing (Palaniswamy
and McAvoy, 2001). Subsequent harvesting is done at 15 to 30 day intervals. A sharp
object is used to cut the stems 15 to 20 cm (6 to 8 in) below the tip o f the plant and
plants are submerged in water until harvest is complete. Adventitious roots decrease
market value, therefore, only the above water portion of the plants are harvested. The
plants are rinsed clean, 20 to 30 stems are collected in bunches and tied close to the
top, and the bottoms of the stems are trimmed evenly to 10 to 15 cm (4 to 6 in) (Seelig,
1974). The average yield per cutting is about 2500 bunches per 93 m² (1000 ft²) of well-
8
established growing beds (Shear, 1968).
Bunches typically sell for $1 to $3, depending on the market, with higher prices
usually obtained in winter months (The Growing Edge, 2002).
Watercress is perishable and should be shipped or marketed directly after
harvest. Watercress bunches are left loose or bagged and placed in lined containers
and separated by layers of ice. The crop should be kept at 0°C and 90 to 95% relative
humidity during storage and marketing (Seelig, 1974).
Watercress was chosen for this study because it has been previously used in
remediation efforts and is indigenous to the WVU RMF flora, but more importantly
because it is an aquatic plant naturally well-suited to hydroponic production and
relatively easy to grow. It prefers cool (12 to 20 °C), moving water like the conditions
found in natural springs and used for trout production. An on-site natural spring
supplies the WVU RMF with water for aquaculture production and other farm demands.
Aquaculture
Aquaculture is the cultivation of marketable freshwater and marine plants or
animals via three methods: flow-through, pond, and re-circulating systems. Effluent is
any substance, particularly a liquid, which enters the environment from a point source.
Effluent from aquaculture systems often have high N and P contents which is
detrimental to the environment because these nutrients contribute to eutrophication
(Adler et al., 2000). Eutrophication is an enrichment of a water body by nutrients
(primarily N and P) that results in an excessive growth of phytoplankton, algae, or
vascular plants. As these organisms die, oxygen in the water is consumed, leading to
9
oxygen depletion which adversely effects aquatic life and can lead to death.
Flow-through aquaculture systems create large volumes of effluent carrying
relatively dilute nutrients that are difficult to treat (Heinen et al.,1996). Flow-through
systems typically have higher flow rates and lower nutrient concentrations than pond
and recirculating systems. In addition to dilute soluble nutrients, flow-through effluents
often contain suspended solids which add to its nutrient content.
N and P present in soluble waste released in fish urine and across the gills and
solid waste from feces and undigested food become suspended in solution as water
travels through the raceway. Quiescent zones are located at the end of each raceway
and serve as settling areas for the majority of solids. Ideally, these zones are cleaned
daily to remove accumulated solids; however, when this occurs, some solid waste is re-
suspended resulting in waste streams that are typically higher in N and P
(Avault, 1996).
Figure 1 displays the dual-sided, four -step, flow-through “raceway” system at the
WVU RMF Aquaculture Research Facility (ARF) which utilizes water from a high-
yielding spring to raise trout. This is the flow-through system that provided effluent for
the aquaponic experiments in this research.
Hydroponics
Hydroponics is a soil-less method of growing plants which includes water culture
(water and dissolved nutrients) and substrate culture (inert media, water, and dissolved
nutrients) (Acquaah, 2002). Examples of inert media include oasis cubes, which are
made from a foam-based material typically used in the floral industry, and horticultural
10
rockwool, which consists of melted basalt rock and chalk spun into fibers.
Hydroponic systems are beneficial because they concentrate crop production
into smaller areas than those required in the field without compromising yield. This is
accomplished by providing high levels of nutrients and water to plants (Univ. of the
Virgin Islands, no date). Some examples of hydroponic techniques available include
ebb-and-flow and floating systems (Acquaah, 2002).
Hydroponic watercress is grown commercially following the cultural conditions
described in the watercress section above. Systems are typically based on large
outdoor gravel beds or nutrient film technique (NFT) channels filled with water 2.54 to
5.08 cm (1 to 2 in) deep. One study reports that NFT sub-systems are less efficient at
removing nutrients from fish effluent and producing good plant biomass and yields than
either gravel bed or floating hydroponic sub-systems (Lennard et al, 2004). Nutrient
solution is flooded into the system and generally re-circulated to limit environmental
impacts. Yields of 1.5 to 2.0 kg/m²/month have been obtained in summer from
protected systems and 500 g/m²/month is common in winter (The Growing Edge, 2002).
Limitations to hydroponic systems include costs associated with the continual
need for nutrients to be artificially supplied through the irrigation water and the potential
for environmental degradation from nutrient discharges in non-recirculating systems.
Aquaponics
Aquaponics (aquaculture plus hydroponics) is the simultaneous culture of
marketable fish and plants. Nutrients from fish production acts as fertilizer to provide
essential nutrients, like N and P, to plants which use the nutrients for growth.
11
Simultaneously, plants serve as a bio-filter to remove some nutrients before it’s reused
or discharged from the system.
The role of nitrifying bacteria, present in growing beds and in association with
plant roots, in the nutrient cycling process is critical and without them the conversion of
ammonia (toxic to plants and fish) present in effluent to nitrate (form available to plants)
would not take place (Diver, 2006). In Step 1 of the nitrification process, Nitrosomonas
spp. oxidize ammonium into nitrite and in Step 2, Nitrobacter spp. transform nitrite to
nitrate (Mills et al, 1996).
Researchers and growers have turned aquaponics into a working model of
sustainable food production. Aquaponics supports sustainable food production by:
turning by-products from one system into nutrients for another system, establishing a
polyculture that increases crop diversity and yields multiple products, re-using natural
resources (i.e. water), generating local food production, and supporting the local
economy (Diver, 2006).
Watercress has been grown as a bio-filter in an aquaponic system utilizing trout
farm effluent for production. This system grew watercress in a pond using floating
frames (C.W. Johnson, unpublished data). Watercress was found to flourish on the
effluent alone without the addition of other nutrients for growth and it effectively
removed suspended solids and many of the nutrients produced by the fish. The North
Carolina Division of Environmental Management conducted tests on the effluent above
and below these ponds and found that 93% of the solids were removed, ammonia was
reduced by 74%, P showed a decline of 50%, and the biological oxygen demand
decreased by 58% (C.W. Johnson, unpublished data).
12
Another example of watercress’ use in aquaponics is a watercress-crayfish
polyculture system that used effluent from a trout hatchery to grow watercress.
Watercress removed nutrients from the water for growth, which resulted in clean water
for crayfish production, and served as an easy food source for the crayfish diet
(Rundquist, 1976).
Watercress is capable of recovering nutrients from trout effluent in a low volume
flow, high nutrient concentration pond environment and in a polyculture system used to
generate multiple aquaculture crops. This research evaluated an integrated flow-
through system to determine if watercress could obtain nutrients and grow in trout
effluent in a high volume flow, low nutrient concentration environment. Instead of gravel
beds, a floating raft system was used, which allowed any suspended solids to settle out
and provide a substrate for rhizobacteia within the system.
Phytoremediation
Phytoremediation is the use of green plants in the removal of contaminants,
toxins, and wastes from soil and water. The primary concerns in this study are the
nutrient concentrations (nitrogen and phosphorus) present in the aquaculture effluent.
One example of how phytoremediation has been used to successfully recover
nutrients from aquaculture effluent is a study that evaluated an aquaponic system that
integrated the production of lettuce to uptake nutrients from rainbow trout effluent in a
recirculating system. The objective of this research was to remove >95% of the
phosphorus in the effluent while producing a marketable crop, which they achieved
13
(Adler, 1998). Watercress has also been used in other phytoremediation efforts.
Several studies have looked at watercress and its ability to accumulate contaminants
such as chromium, perchlorate, thallium, and zinc from soil and water at affected sites.
In this study, watercress will be grown in flow-through aquaculture effluent to
determine if it is able to use nutrients from the effluent to meet its growth requirements,
while also producing cleaner water for discharge from the system
14
EXPERIMENTAL OBJECTIVES
This project involved multiple disciplines including horticulture, aquaculture, and
environmental engineering to address the issues of plant production, fish production,
and water quality, respectively. The horticulture research involved two objectives: 1) to
determine watercress growth and nutrient contents in a hydroponic controlled
environment experiment and a flow-through aquaponic system and 2) to evaluate
various treatments based on growth and nutrient data to determine the best cultural
conditions for watercress in the aquaponic system for optimization as a nutrient
recovery option and value-added product for fish production.
The objectives of the environmental engineering researchers working on this
project were to measure the water quality prior to, during, and after fish production and
after watercress production to determine the nutrient concentrations of the water and
how the water was affected by the fish and plants. For further information on the water
quality outcomes of this combined research, please refer to Dyer (2006).
Two types of experiments were conducted to achieve the horticulture objectives.
A hydroponic experiment took place at the WVU Davis College of Agriculture Forestry
and Consumer Sciences (DCAFCS) and evaluated the effects of light intensity and
nutrient solution concentration on watercress growth and nutrient contents in controlled
environments. Whole plant fresh weight, length, and dry weight measurements were
taken to determine growth and dried plant tissue was analyzed for N and P content.
This experiment was designed to supply baseline values for watercress growth and
nutrient contents in a controlled environment with optimum cultural conditions. These
15
results are intended to support results from the aquaponic experiments with regards to
light intensity and nutrient concentrations.
Aquaponic experiments were conducted at the WVU Reymann Memorial Farm
(RMF) Aquaculture Research Facility (ARF) and Aquaponic Production Greenhouse
(APG). The effects of water velocity, plant density, growing medium, location, and
season on watercress growth and nutrient contents were evaluated. Growth and
nutrient data collection was the same as for the hydroponic studies. These studies
should supply values on watercress growth and nutrient contents with regards to the
above variables in a flow-through aquaponic system and semi-controlled environment.
Aquaponic experiments should provide preliminary data that will allow future
researchers or growers to optimize cultural conditions for watercress production in an
integrated, flow-through aquaponic system to meet nutrient demands and achieve a
harvestable crop. If successful, aquaponic watercress may prove to be a value-added,
by-product of trout production.
16
MATERIALS & METHODS
Aquaculture System
Water is gravity-fed from a spring located on the farm through a series of 31 cm
(12 in) pipes and transported approximately 183 m (600 ft) to the raceway. It enters the
raceway’s headbox where it is aerated before it flows through the raceway by gravity.
Approximately 25.23 L s-1 (400 gpm) of water flows into the raceway creating a water
velocity of 0.91 cm s-1 (0.030 ft s-1).
The amount of fish per tank varies, but there are typically about 5000 fish in the
system. Fish are fed Zeigler Gold Floating 3.0 MM1 at a rate that supports full growth
potential to maintain 318 to 454 kg (700 to 1000 lb) of fish per tank. Fish were
periodically removed to keep weight within or below this range (Semmens, personal
communication).
Effluent exits the raceway at the tailbox and flows through a 31 cm (12 in) pipe to
the OLSB. During the aquaponic experiments a portion of the water was diverted to
either a head tank and/or supply manifolds which supplied effluent to experimental
channels before flowing to the OLSB by pipe. The full flow OLSB is adjacent to the ARF
and functions as a polishing pond to remove additional nutrients and settle additional
solids before it discharges the effluent into the receiving stream, Moore’s Run.
1 ZEIGLER BROS., INC., Gardners, PA 17324
17
Hydroponic Experiment Watercress seed was sown in coarse vermiculite 2 and placed in a mistbed at the
WVU Greenhouse for germination and initial growth. Seedlings were watered with tap
water only and no fertilizer was added during this time. After 20d, watercress seedlings
with at least one set of true leaves forming were transferred from the vermiculite, rinsed
with de-ionized water, and placed in 500mL flasks containing either aerated full-strength
(100%) or half-strength (50%) Hoagland’s complete nutrient solution or the control (de-
ionized water) (Hoagland et al., 1936). The nutrient solution recipe was described in
Reed (2006) and consisted of the following: 1 mM KH2PO4, 5 mM KNO3, 5 mM
Ca(NO3)2 * 4H2O, 2 mM MgSO4 * 7H20, 11.8 µM MnSO4 * H2O, 0.7 µM ZnSO4 * 7H2O,
0.32 µM CuSO4 * 5H2O, 0.16 µM (NH4)6Mo7O24 * 4H2O, 46.3 µM H3BO3, 5 µM
Sequestrene 330 (10% Fe) and 1N KOH to adjust pH to 6.3 using a Corning pH meter
4303. The only modification to this recipe was the use of 5 µM Iron Chelate DP (10%
Fe), which is the same formulation as Sequestrene 330, just sold under a different
name. Aeration was supplied by Tetra Whisper® air pumps4 and plastic airlines with
pinholes in the end.
A hydroponic experiment was conducted at the WVU DCAFCS to evaluate
watercress growth and nutrient contents under ideal conditions. Half of the experiment
was ran under a low (50 ± 10 µmol m-2 s-1) light intensity in a Percival Incubator5 where
lighting was supplied by cool white fluorescent lamps. The other half of the experiment
2 Therm-O-Rock East, Inc., New Eagle, PA 15067 3 Corning Inc., Science Products Division, One Riverfront Plaza, Corning, NY 14831 4 Tetra Holding (US), Inc., 3001 Commerce Street, Blacksburg, VA 24060-6671 5 Percival Scientific, Inc., 505 Research Drive, Perry, IA 50220
18
was ran under an intermediate (450 ± µmol m-2 s-1) light intensity in a Sherer CEL 34-7
Growth Chamber6 where lighting was supplied by cool white fluorescent lamps and
incandescent bulbs. Light intensity is a measure of the amount of photosynthetically
active radiation (PAR) in the visible light spectrum of 400 to 700nm, which represents
the range that plants are able to use for photosynthesis.
The two light intensities were selected based on watercress’ light requirement
information and to coincide with the average light intensities found in the ARF (low PAR)
and APG (intermediate PAR) at the WVU RMF where the aquaponic experiments were
conducted. Light intensities were confirmed by an AccuPAR model LP-80 PAR/LAI
Ceptometer7. Photoperiods in both experiments consisted of a 16-hr light:8-hr dark
cycle and temperatures in both chambers were maintained at a 23:18ºC day-night cycle
with 50% relative humidity.
Seedlings were placed in modified foam stoppers which were inserted into the
mouths of 500mL flasks containing the designated nutrient solutions filled to the 500 mL
level to ensure that roots were fully immersed in solution. All flasks were wrapped in
aluminum foil to maintain iron in solution and reduce algal growth. One seedling was
placed in each flask and arranged in a randomized complete block (RCB) design with
three replications of each treatment per block for a total of 27 flasks per experiment.
Nutrient solutions were changed 14d from the initiation of the experiment and
every 7d thereafter for a total of 6 weeks. Sampling occurred every two weeks for six
weeks for a total of three samplings. One plant from each treatment in each block was
6 Sherer Inc., Marshall, MI, USA 7 DECAGON, 950 NE Nelson Court, Pullman, WA 99163
19
randomly selected and measured every two weeks and whole plant fresh weights and
lengths were recorded. On the last sample date (Week 6), the plants sampled were
placed in a drying oven at 75ºC for 24hr, and then dry weights were recorded. Whole
plant dried samples were ground using a ceramic mortar and pestle, placed in the oven
for a second drying, then stored in a -80ºC freezer until nutrient analysis.
Aquaponic Experiments
Experimental beds used to culture watercress in the aquaponic experiments
were constructed of 0.64 cm (0.25 in) plywood, insulated with polystyrene panels, and
lined with a heavy-duty black plastic pond liner. Each bed measured 2.44 m (8 ft) long x
1.22 m (4 ft) wide and contained three channels which each measured 2.44 m (8 ft) long
x 0.36 m (15 in) wide. Each channel had its own water inflow (set at a designated
velocity treatment) and water outflow (with a 15 cm (6 in) standpipe) and contained
three floating rafts for a total of nine rafts per bed. The rafts were designed for this
system and were constructed from 2.54 cm (1 in) PVC and 1.91 cm (0.5 in) plastic
poultry netting and measured 74 cm (29 in) long x 36 cm (14 in) wide each. A HOBO
Microstation Datalogger8 with two 2-bit temperature sensors and two photosynthetically
active radiation (PAR) sensors were used to monitor and collect data on air temperature
and light intensity during the experiments.
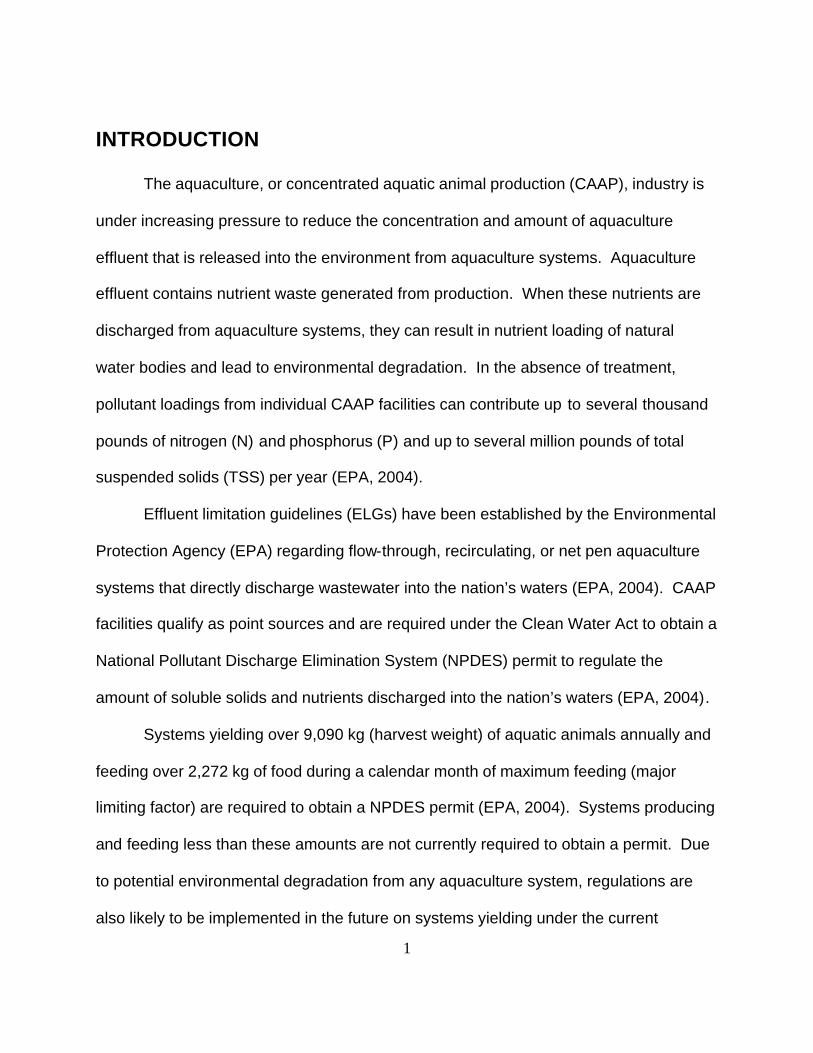
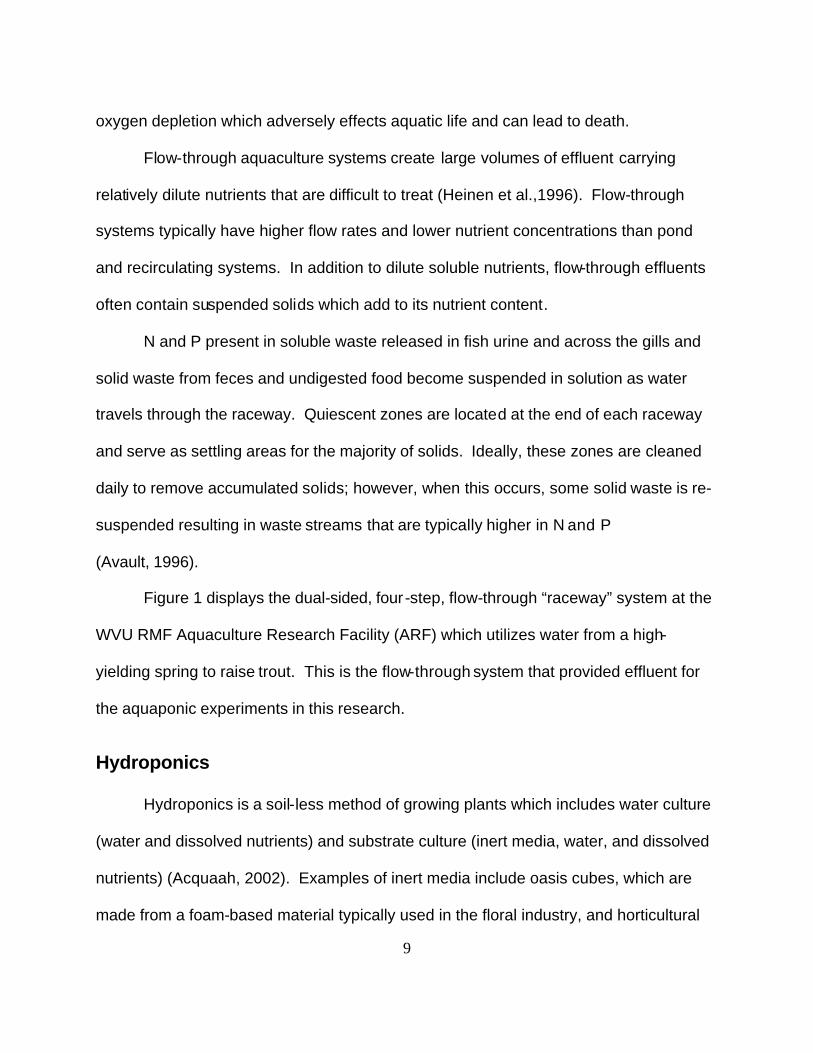
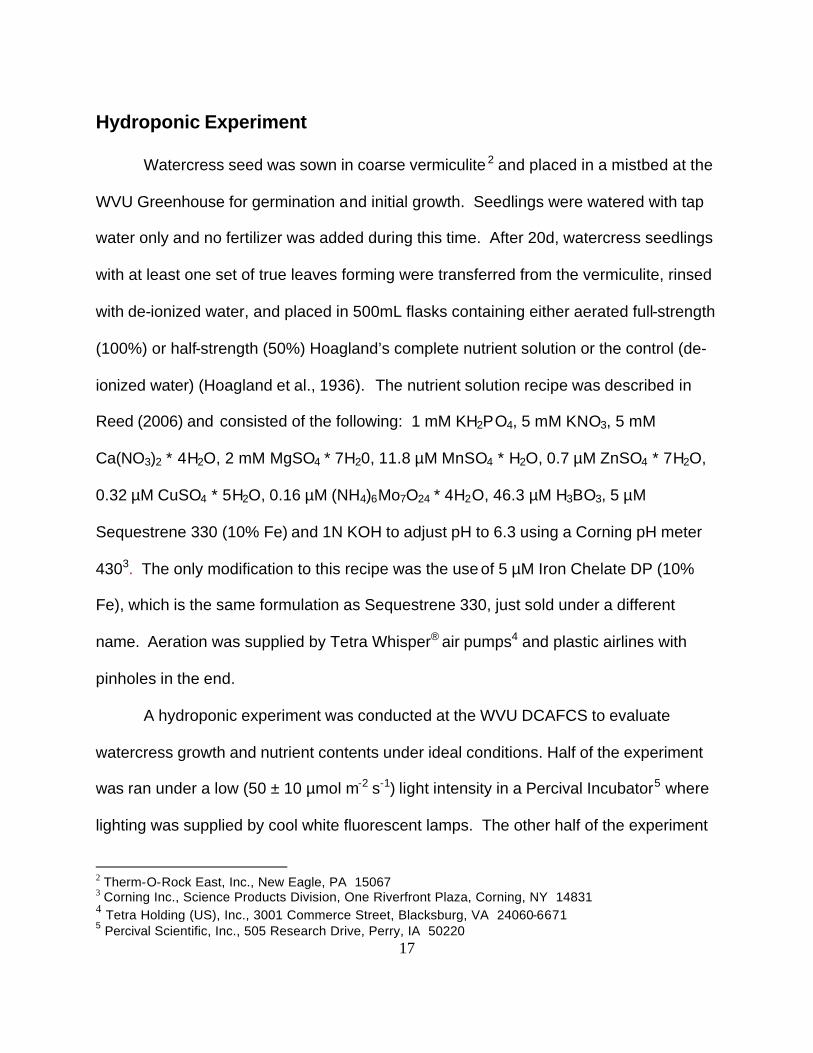
Summer 2005 (ARF) This experiment took place in the Aquaculture Research Facility (ARF) during the
8 Ben Meadows Company, PO Box 5277, Janesville, WI 53547-5277
20
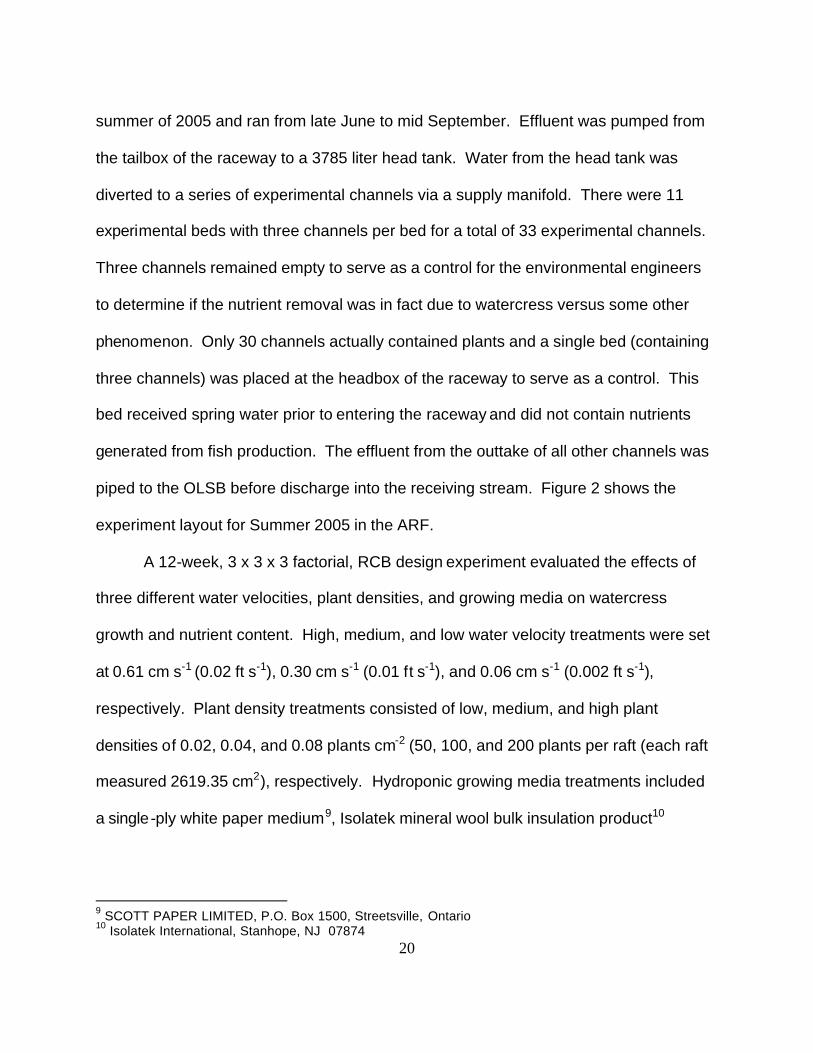
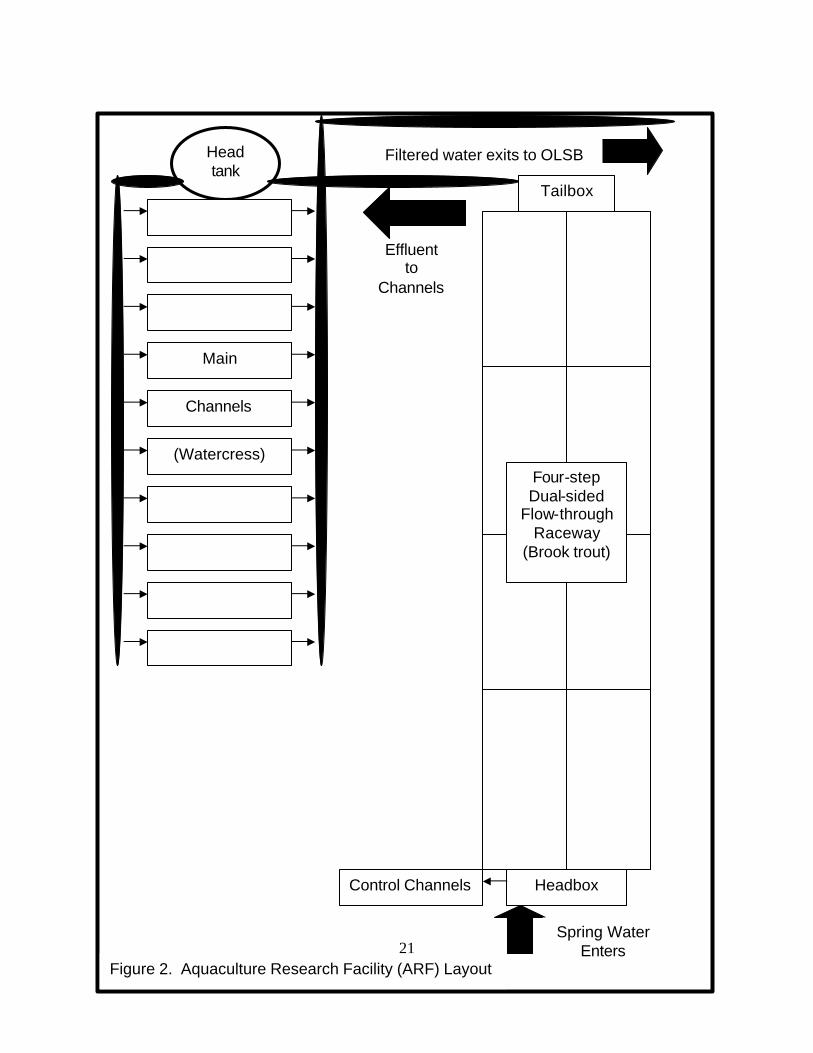
summer of 2005 and ran from late June to mid September. Effluent was pumped from
the tailbox of the raceway to a 3785 liter head tank. Water from the head tank was
diverted to a series of experimental channels via a supply manifold. There were 11
experimental beds with three channels per bed for a total of 33 experimental channels.
Three channels remained empty to serve as a control for the environmental engineers
to determine if the nutrient removal was in fact due to watercress versus some other
phenomenon. Only 30 channels actually contained plants and a single bed (containing
three channels) was placed at the headbox of the raceway to serve as a control. This
bed received spring water prior to entering the raceway and did not contain nutrients
generated from fish production. The effluent from the outtake of all other channels was
piped to the OLSB before discharge into the receiving stream. Figure 2 shows the
experiment layout for Summer 2005 in the ARF.
A 12-week, 3 x 3 x 3 factorial, RCB design experiment evaluated the effects of
three different water velocities, plant densities, and growing media on watercress
growth and nutrient content. High, medium, and low water velocity treatments were set
at 0.61 cm s-1 (0.02 ft s-1), 0.30 cm s-1 (0.01 ft s-1), and 0.06 cm s-1 (0.002 ft s-1),
respectively. Plant density treatments consisted of low, medium, and high plant
densities of 0.02, 0.04, and 0.08 plants cm-2 (50, 100, and 200 plants per raft (each raft
measured 2619.35 cm2), respectively. Hydroponic growing media treatments included
a single-ply white paper medium9, Isolatek mineral wool bulk insulation product10
9 SCOTT PAPER LIMITED, P.O. Box 1500, Streetsville, Ontario 10 Isolatek International, Stanhope, NJ 07874
21
Headbox
Tailbox
Head tank
Control Channels
Main
Channels
(Watercress)
Figure 2. Aquaculture Research Facility (ARF) Layout
Spring Water Enters
Filtered water exits to OLSB
Effluent to
Channels
Four-step Dual-sided
Flow-through Raceway
(Brook trout)
22
(horticultural rockwool), and 4 cm (1.5 in) oasis rootcubes cubes11. Each factorial
treatment combination was replicated three times. The control channels incorporated
all three water velocities and growing media used in the main channels, but only the
medium plant density due to replication limitations.
During the experiment, plant samples were collected four times at three week
intervals. Three plants, representing a single sample, were taken from each raft and
whole plant fresh weights and plant lengths were recorded. Sample criteria required
plants to have at least two sets of true leaves and a collective fresh weight of at least
600 mg. The rafts were systematically rotated within their respective channels at the
end of each sampling to account for nutrient fluctuations within the channels. Samples
were placed in brown paper bags and transported to WVU and placed in a drying oven
as above, and dry weights were recorded.
Samples were prepared and stored as above until analysis for total N and P
content. Whole plant fresh weight and length averages were taken to provide growth
data on a per plant basis while dried samples used for nutrient analysis contained all
three plants to ensure enough tissue to meet detection limits.
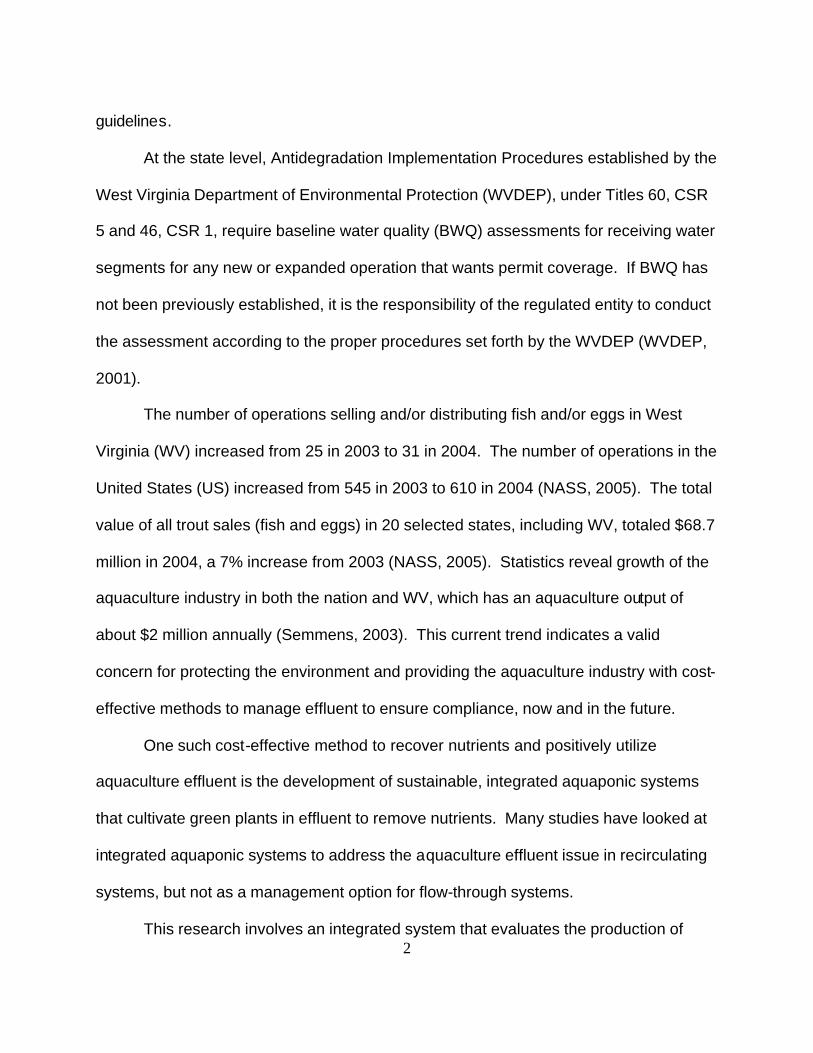
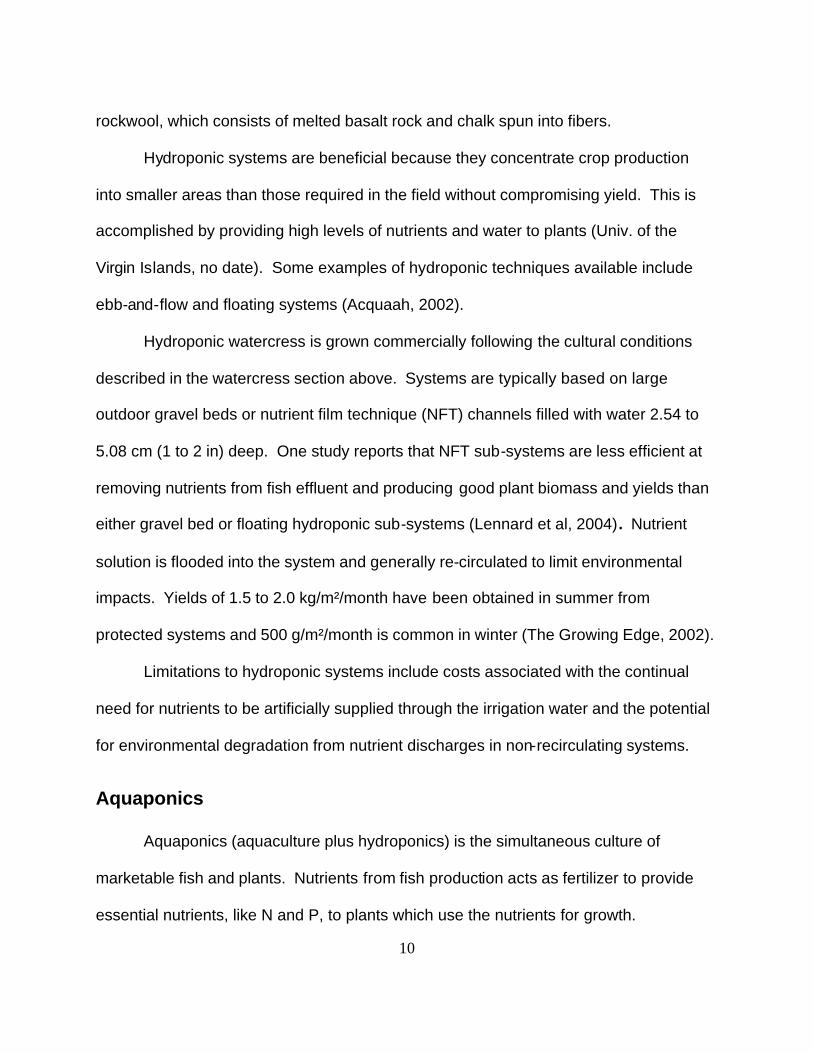
Winter and Spring 2006 (APG) Additional funding provided for construction of a new greenhouse, so the Winter
and Spring 2006 experiments took place in the Aquaponic Production Greenhouse
(APG) instead of the ARF. Due to an opaque roof covering in the ARF and associated
low light intensities, a decision was made to conduct subsequent aquaponic
11 Hummert International, 4500 Earth City Expressway, Earth City, MO 63045
23
experiments in the APG. The winter experiment ran from mid December to early March
and the spring experiment ran from mid March to early June.
The 15 m (48 ft) long x 8 m (25 ft) wide double-layer polyethylene greenhouse
with roll-up side walls and polycarbonate end walls was constructed due east of the
ARF. The greenhouse was not equipped with a formal heating and cooling system, so it
basically served as a protective, semi-controlled environment structure for crop
production. Ventilation was achieved by rolling up the side walls, a vent fan, and vent.
Lumite 52 x 52 mesh screening12 was attached to the side walls to allow for ventilation
while also reducing pest populations.
Based on observations from the Summer 2005 experiment and limited space in
the APG, the medium velocity, medium density, and rockwool and oasis media
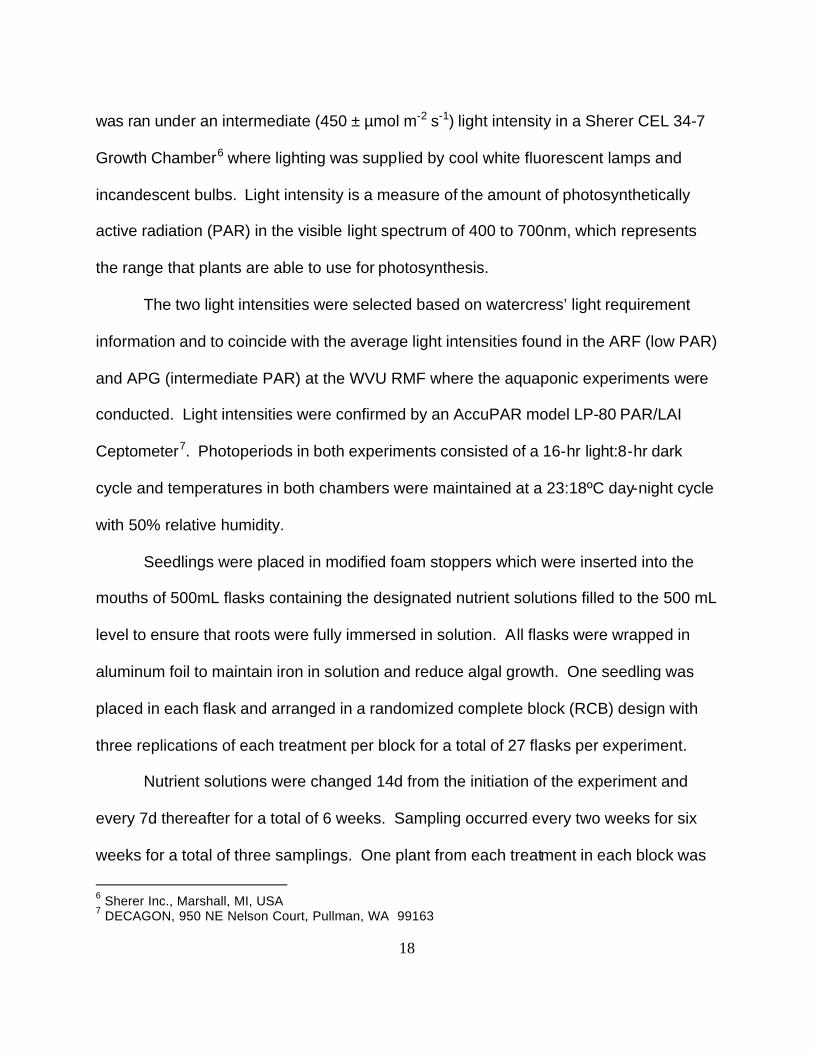
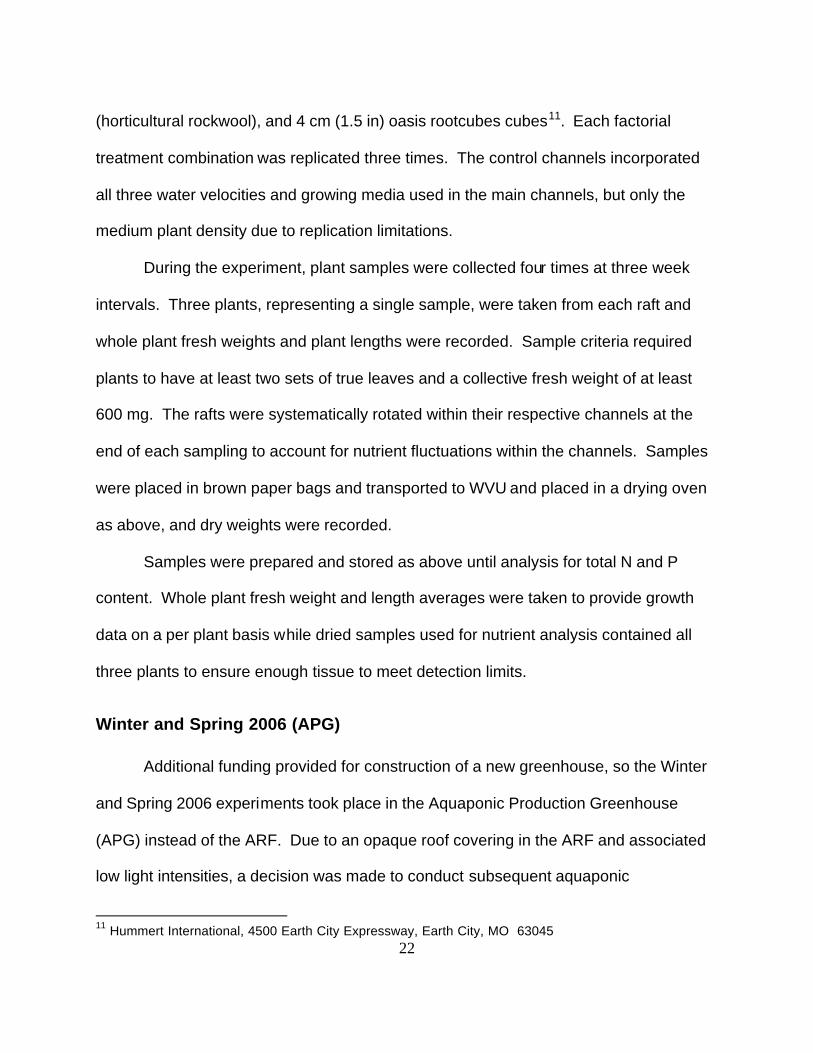
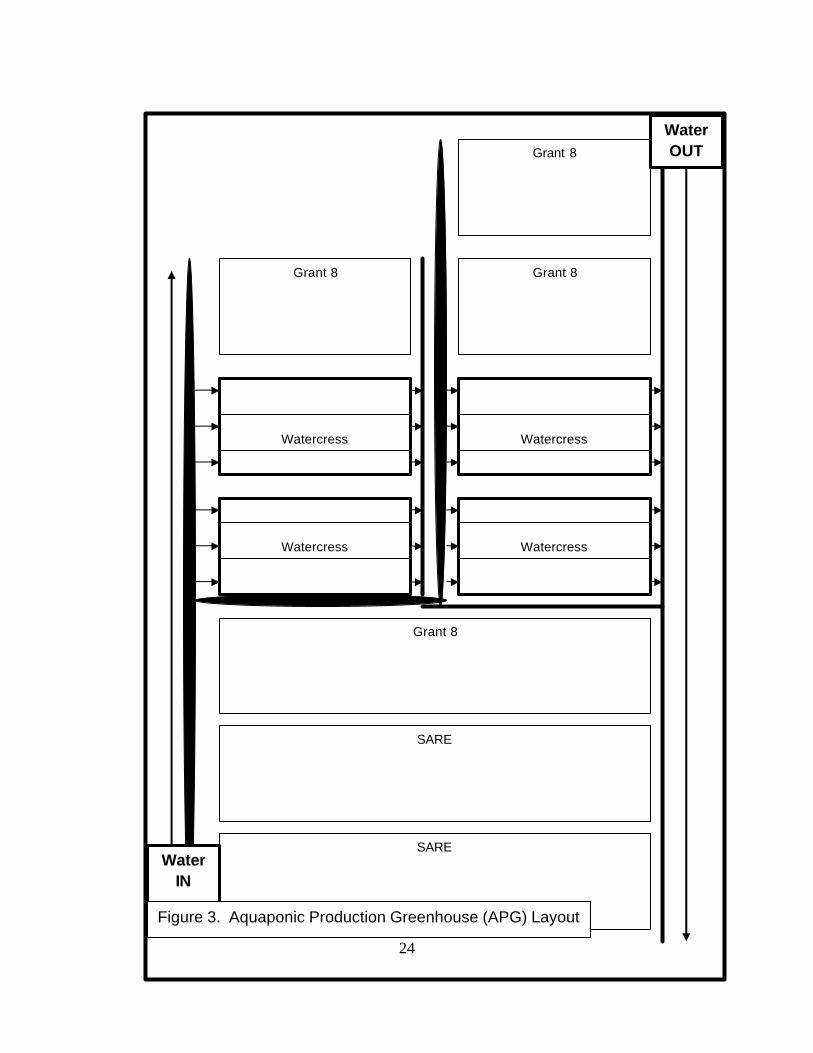
treatments were eliminated. Figure 3 depicts the general layout of the Winter and
Spring 2006 experiments in the APG. These experiments were conducted
simultaneously with other experiments. Water from trout production exited the tailbox of
the raceway inside the ARF and was pumped to main and sub-main manifolds inside
the greenhouse which supplied experimental beds with effluent. Four beds in the center
of the APG were dedicated to watercress production (Figure 3). Each bed contained
three channels each for a total of twelve experimental channels with the same
dimensions described above. Effluent flowed through pipes to the OLSB before
discharge into the receiving stream.
Twelve-week, 2 x 2 factorial, RCB design experiments evaluated the effects of
12 Lumite Inc., 2100c Atlanta Hwy., Gainesville, GA 30504
24
Grant 8
Grant 8
Watercress
Grant 8
Watercress
Watercress
Grant 8
SARE
SARE
Watercress
Water IN
Water OUT
Figure 3. Aquaponic Production Greenhouse (APG) Layout
25
two different water velocities and plant densities on watercress’ growth and nutrient
content. The low and high velocities and plant densities used were the same as those
in the Summer 2005 experiment above. Watercress was direct-seeded on paper
medium. There was no control in these experiments because there was no way to
allow for an experimental channel in the greenhouse that contained spring water only,
since all water entering the greenhouse originated from the raceway and contained
nutrients from fish production.
Sample criteria and sampling procedure used were the same as that for the
Summer 2005 experiment above. Dried plants were also treated the same until nutrient
analysis.
Plant Tissue Analysis A minimum dry weight criterion was established for each element prior to
analysis to ensure detection limits were met. Based on technician and equipment
recommendations, dried samples had to weigh greater than or equal to 150 mg to be
included in the data set for nitrogen analysis (R. Weaver, personal communication,
2006). Dried samples had to weigh greater than or equal to 200 mg to be included in
the data set for phosphorus analysis (K. Stewart, personal communication, 2006). Total
nitrogen was determined using a LECO TruSpec CHN-S (carbon, hydrogen, nitrogen,
and sulfur) analyzer13 for all but thirteen samples. Those samples were sent to the
WVU Chemical Engineering Lab and analyzed for nitrogen content by gas
chromatography when the TruSpec was undergoing maintenance.
13 LECO Corporation, 3000 Lakeview Ave., St. Joseph, MI 49085
26
Samples analyzed for phosphorus were sent to the National Research Center for
Coal and Energy (NRCEE) Analytical Lab. Total phosphorus was determined using a
Varian ICP-OES14 (inductively coupled plasma optical emission spectrometer).
Data Collection and Statistical Analysis
Whole plants (roots and shoots) were collected for growth and nutrient data and
analysis for all experiments. Whole plant fresh weights and plant lengths (distance from
root tip to shoot tip) were recorded at sample time and whole plant dry weights were
recorded after drying.
Separate statistical programs were created for growth and nutrient data for each
experiment and analyzed separately for analysis of variance using the SAS General
Linear Model. Type III SS and Tukey’s Studentized Range (HSD) test were used for
significant means and contrast statements were used to determine if trends were linear
or quadratic.
Growth data only represents the last nine weeks of each aquaponic experiment
because plants did not meet the sampling criteria during the first three weeks of each
experiment. Nutrient data only represents the last sampling (Week 6) of the hydroponic
experiment and the last six weeks of each aquaponic experiment because it wasn’t until
then that there was consistently enough dry tissue among the treatments to meet plant
tissue analysis criteria.
14 Varian Instruments, 2700 Mitchell Dr., Walnut Creek, CA 94598
27
RESULTS & DISCUSSION
Hydroponic Experiment
Growth results are based on whole plant (roots and shoots) length and fresh
weight means that were recorded at each sampling. Nutrient results are based on
whole plant dry weight means that were recorded for the last sampling only (Week 6)
due to inadequate amounts of dry tissue for analysis at Weeks 2 and 4.
Growth Data
Light intensity, sample date, and nutrient solution concentration had significant
effects on watercress length and fresh weight (Appendices 1 & 2, respectively). Plants
grown under the intermediate light intensity (450 ±10 PAR) were significantly longer and
weighed significantly more than those grown under the low light intensity (50 ± 10 PAR)
(Table 1).
There was a linear relationship between sample date and watercress length and
fresh weight. Plants sampled at Week 6 were significantly longer and weighed
significantly more than those sampled at Week 2. Plants sampled at Week 4 were not
significantly different than those sampled at Week 2 or Week 6 with regard to length,
however, they did weigh significantly less than those sampled at Week 6, but were not
significantly different in weight from those sampled at Week 2 (Table 1).
There was a quadratic relationship between nutrient solution and watercress
length and a linear relationship between nutrient solution and watercress fresh weight.
Plants grown in half-strength Hoagland’s nutrient solution were significantly longer than
28
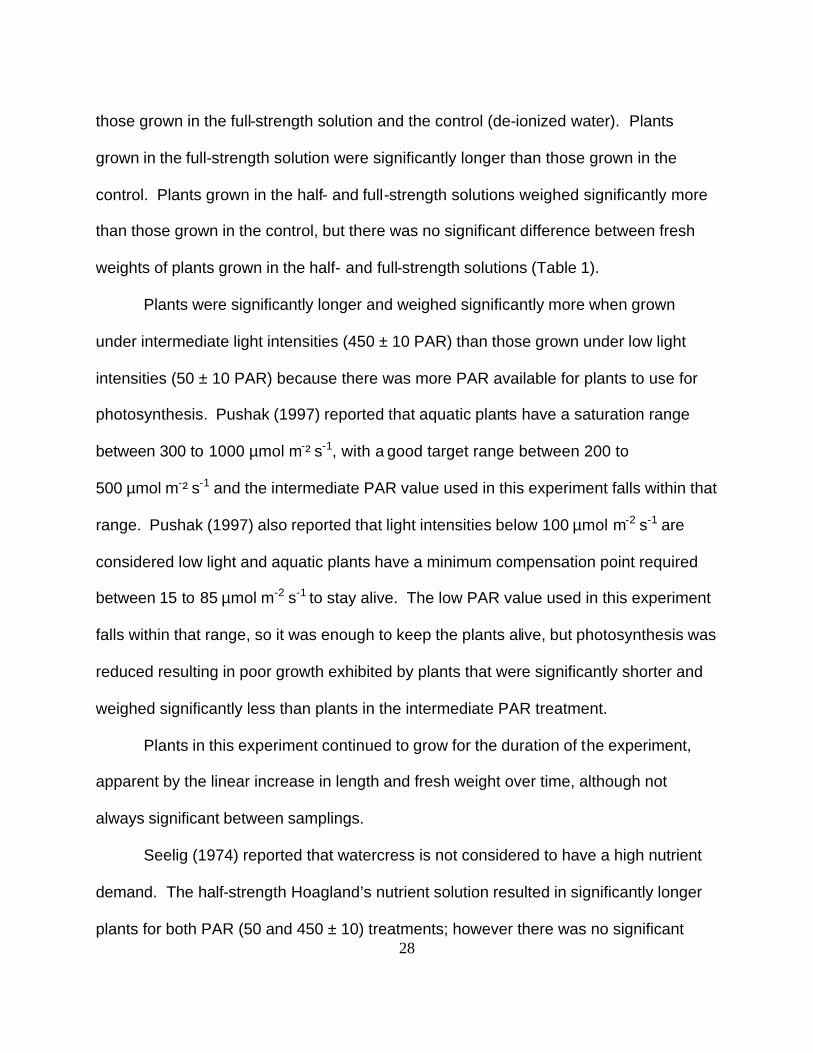
those grown in the full-strength solution and the control (de-ionized water). Plants
grown in the full-strength solution were significantly longer than those grown in the
control. Plants grown in the half- and full-strength solutions weighed significantly more
than those grown in the control, but there was no significant difference between fresh
weights of plants grown in the half- and full-strength solutions (Table 1).
Plants were significantly longer and weighed significantly more when grown
under intermediate light intensities (450 ± 10 PAR) than those grown under low light
intensities (50 ± 10 PAR) because there was more PAR available for plants to use for
photosynthesis. Pushak (1997) reported that aquatic plants have a saturation range
between 300 to 1000 µmol m-² s-1, with a good target range between 200 to
500 µmol m-² s-1 and the intermediate PAR value used in this experiment falls within that
range. Pushak (1997) also reported that light intensities below 100 µmol m-2 s-1 are
considered low light and aquatic plants have a minimum compensation point required
between 15 to 85 µmol m-2 s-1 to stay alive. The low PAR value used in this experiment
falls within that range, so it was enough to keep the plants alive, but photosynthesis was
reduced resulting in poor growth exhibited by plants that were significantly shorter and
weighed significantly less than plants in the intermediate PAR treatment.
Plants in this experiment continued to grow for the duration of the experiment,
apparent by the linear increase in length and fresh weight over time, although not
always significant between samplings.
Seelig (1974) reported that watercress is not considered to have a high nutrient
demand. The half-strength Hoagland’s nutrient solution resulted in significantly longer
plants for both PAR (50 and 450 ± 10) treatments; however there was no significant
29
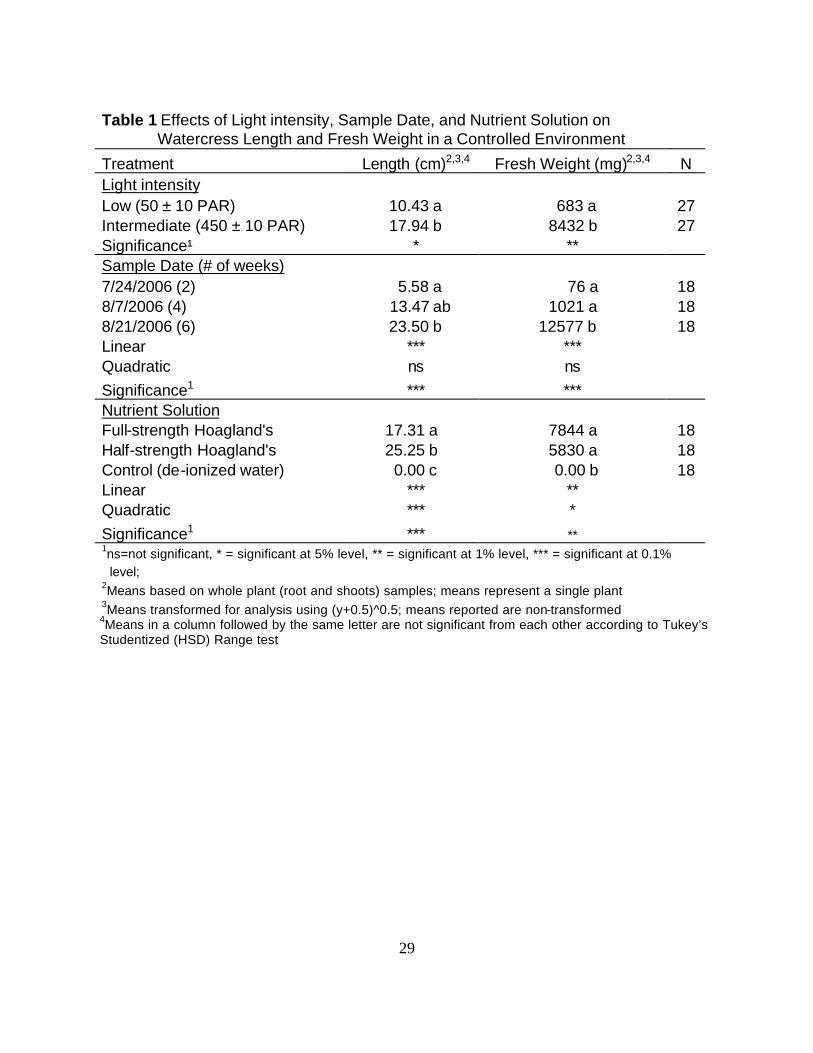
Table 1 Effects of Light intensity, Sample Date, and Nutrient Solution on Watercress Length and Fresh Weight in a Controlled Environment
Treatment Length (cm)2,3,4 Fresh Weight (mg)2,3,4 N Light intensity Low (50 ± 10 PAR) 10.43 a 683 a 27 Intermediate (450 ± 10 PAR) 17.94 b 8432 b 27 Significance¹ * ** Sample Date (# of weeks) 7/24/2006 (2) 5.58 a 76 a 18 8/7/2006 (4) 13.47 ab 1021 a 18 8/21/2006 (6) 23.50 b 12577 b 18 Linear *** *** Quadratic ns ns Significance1 *** *** Nutrient Solution Full-strength Hoagland's 17.31 a 7844 a 18 Half-strength Hoagland's 25.25 b 5830 a 18 Control (de-ionized water) 0.00 c 0.00 b 18 Linear *** ** Quadratic *** * Significance1 *** ** 1ns=not significant, * = significant at 5% level, ** = significant at 1% level, *** = significant at 0.1% level; 2Means based on whole plant (root and shoots) samples; means represent a single plant 3Means transformed for analysis using (y+0.5)^0.5; means reported are non-transformed
4Means in a column followed by the same letter are not significant from each other according to Tukey’s Studentized (HSD) Range test
30
difference between plants in the half- and full-strength solutions regarding fresh weight.
Greater plant lengths in the half-strength solution early on suggests that the
nutrient solution was providing essential nutrients for seedling root establishment and
initial stem elongation without presenting a nutrient overload to the young plants. This
provided plants grown in half-strength solution treatments with a head start in length.
As plants continued to grow, the full-strength solution became more desirable for
watercress nutritional demands, allowing plants in these treatments to catch up with
plants in the half-strength solution which suggests why no significant difference for fresh
weight occurred between these treatments.
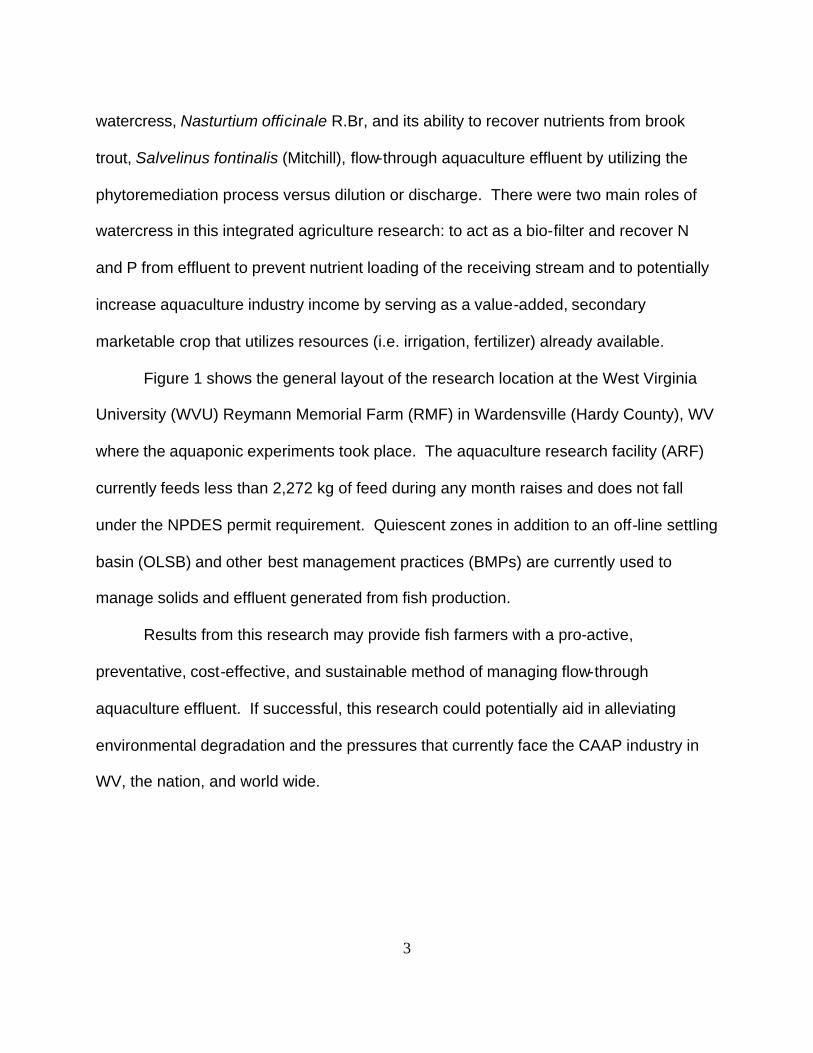
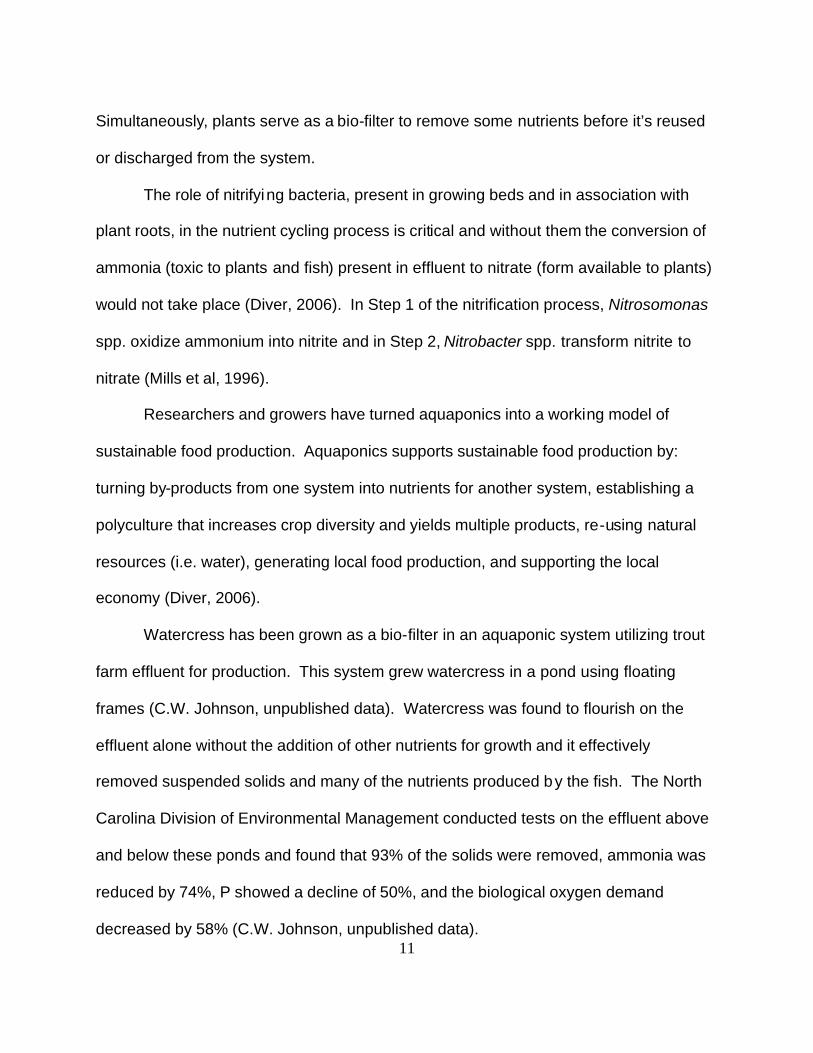
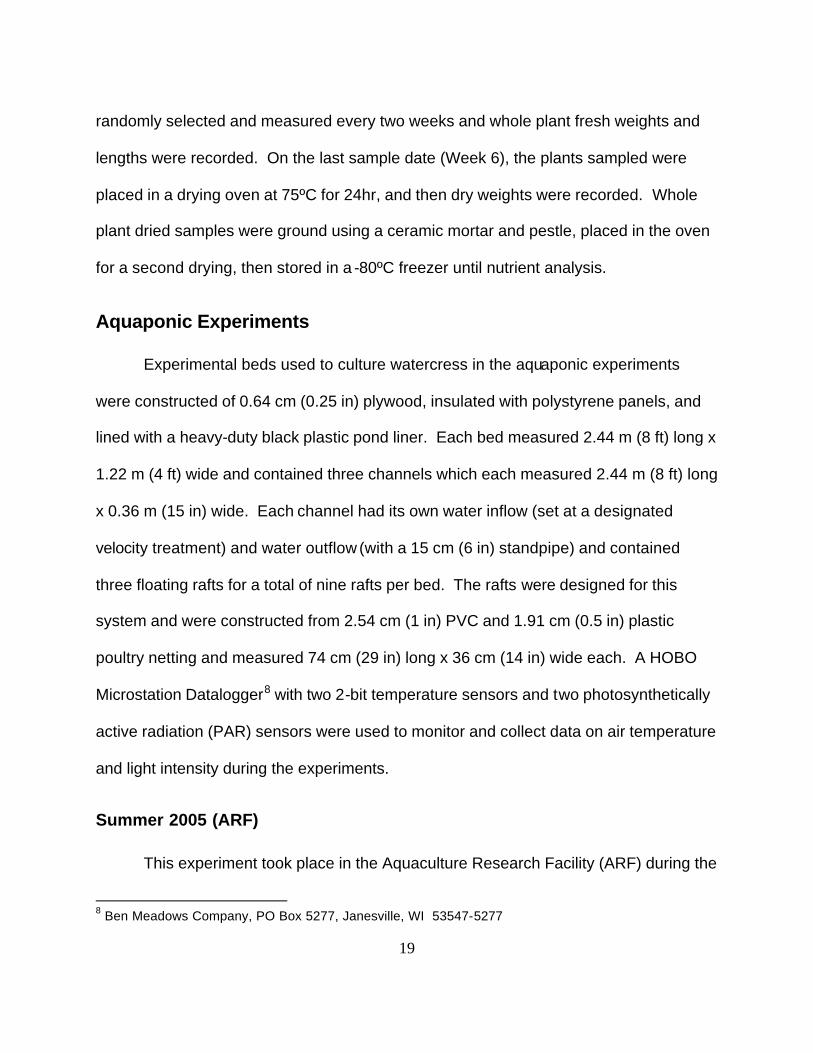
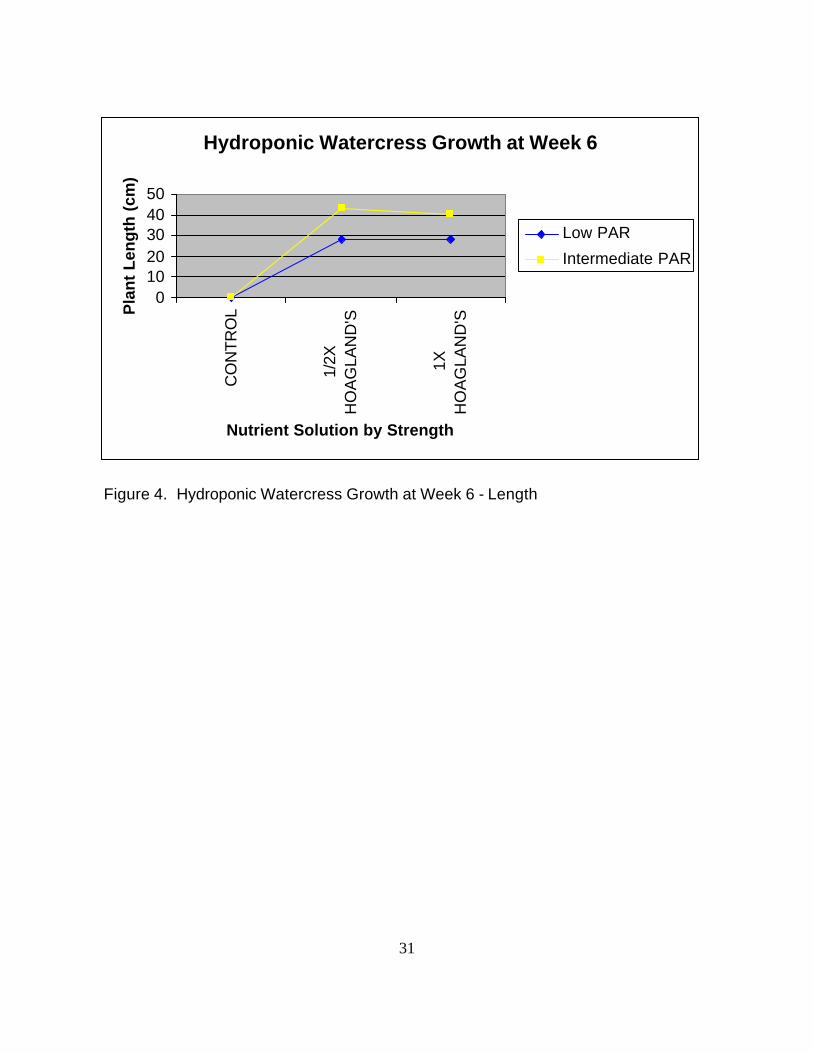
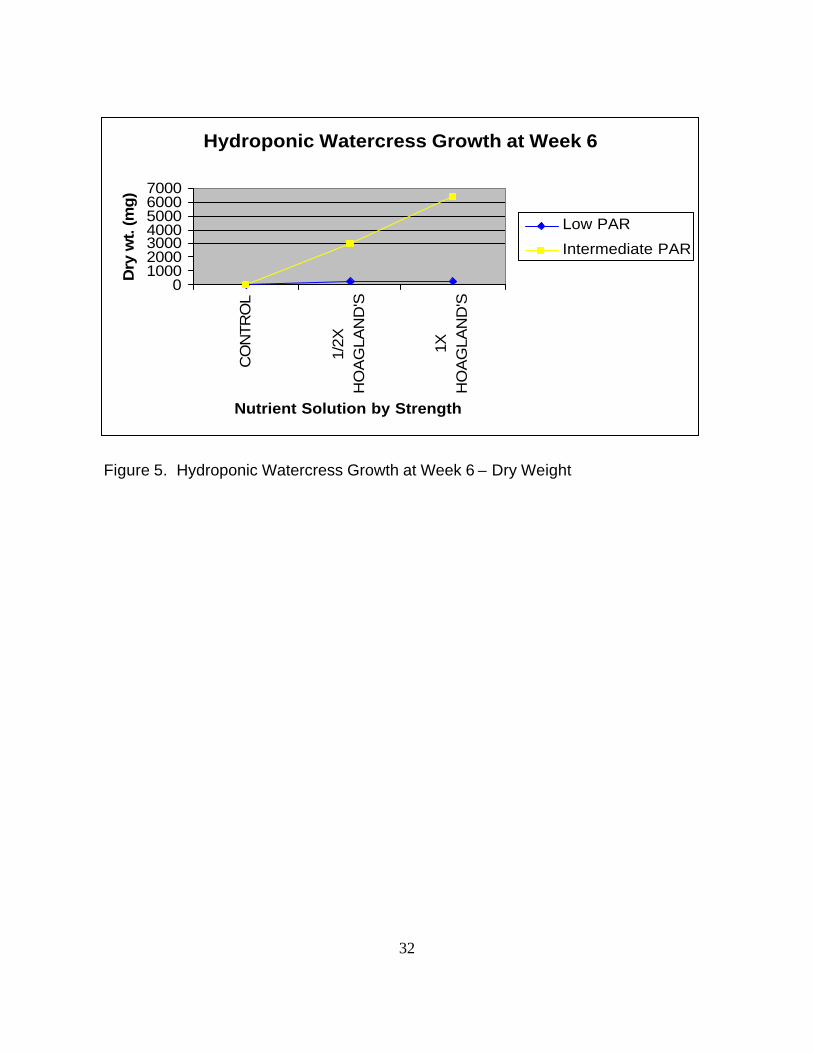
Figure 4 represents the interaction of light intensity and nutrient solution
concentration (non significant interaction) on watercress length at Week 6 only. Figure
5 represents the significant (P < 0.05) interaction of light intensity and nutrient solution
concentration on watercress dry weight at Week 6 only. These figures serve as a
reference for light intensity and nutrient solution concentration data between the Spring
2006 - Location Comparison aquaponic experiment growth data at Week 6 (below) and
the hydroponic experiment growth data at Week 6 .
Nutrient Data
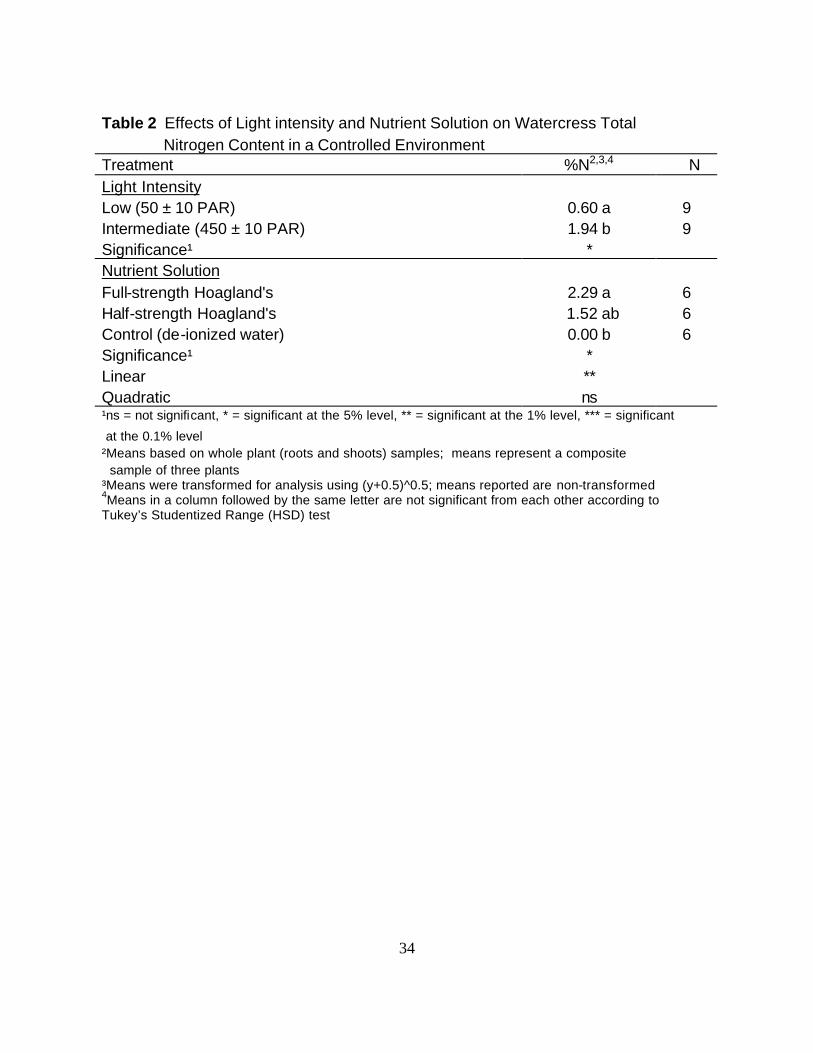
Light intensity and nutrient solution concentration had significant effects on
watercress total nitrogen (N) content (Appendix 3). Plants in intermediate PAR
treatments had significantly more N in dry tissue than those in low PAR treatments.
There was a linear relationship between nutrient solution and watercress total N
content. Plants grown in full-strength Hoagland’s nutrient solution had significantly
31
Hydroponic Watercress Growth at Week 6
01020304050
CO
NTR
OL
1/2X
HO
AG
LAN
D'S
1XH
OA
GLA
ND
'S
Nutrient Solution by Strength
Pla
nt
Len
gth
(cm
)
Low PAR
Intermediate PAR
Figure 4. Hydroponic Watercress Growth at Week 6 - Length
32
Hydroponic Watercress Growth at Week 6
01000200030004000500060007000
CO
NTR
OL
1/2X
HO
AG
LAN
D'S
1XH
OA
GLA
ND
'S
Nutrient Solution by Strength
Dry
wt.
(mg
)
Low PAR
Intermediate PAR
Figure 5. Hydroponic Watercress Growth at Week 6 – Dry Weight
33
more N in dry tissue than those grown in the control. Plants grown in the half-strength
solution were not significantly different from either the full-strength solution or control
with regard to N content (Table 2).
There was no significant difference in phosphorus (P) content among light
intensity or nutrient solution concentration treatments in the hydroponic experiment
(Appendix 4).
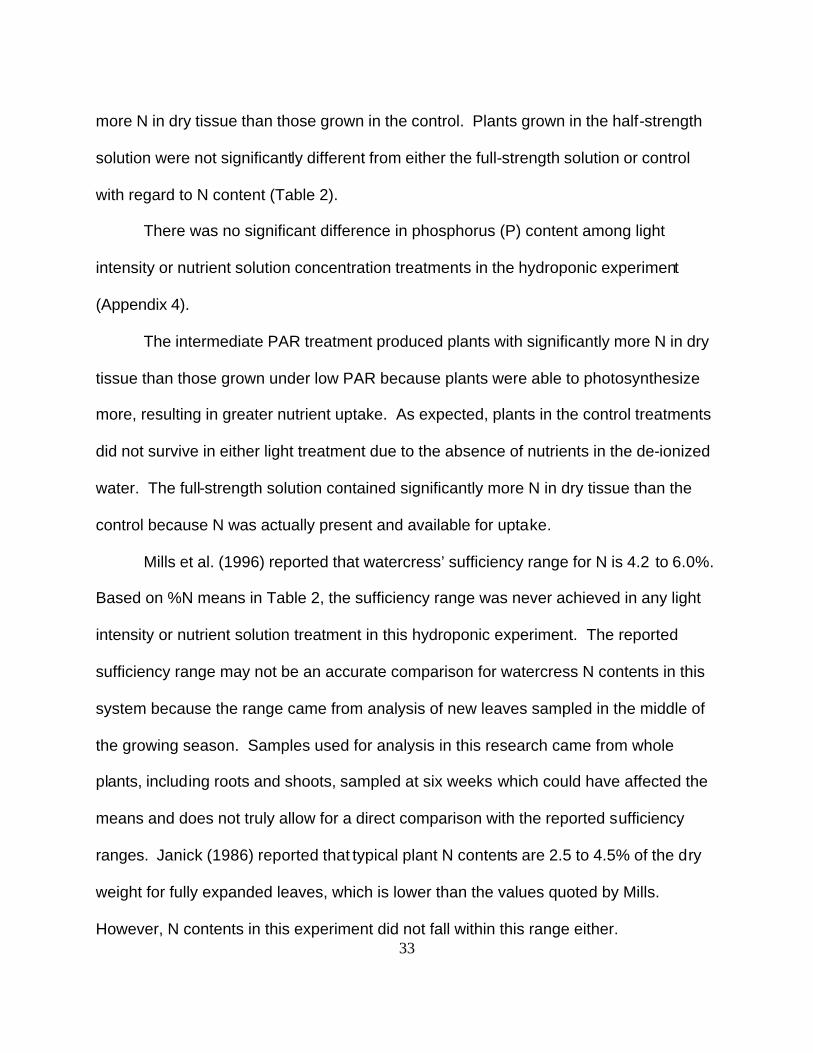
The intermediate PAR treatment produced plants with significantly more N in dry
tissue than those grown under low PAR because plants were able to photosynthesize
more, resulting in greater nutrient uptake. As expected, plants in the control treatments
did not survive in either light treatment due to the absence of nutrients in the de-ionized
water. The full-strength solution contained significantly more N in dry tissue than the
control because N was actually present and available for uptake.
Mills et al. (1996) reported that watercress’ sufficiency range for N is 4.2 to 6.0%.
Based on %N means in Table 2, the sufficiency range was never achieved in any light
intensity or nutrient solution treatment in this hydroponic experiment. The reported
sufficiency range may not be an accurate comparison for watercress N contents in this
system because the range came from analysis of new leaves sampled in the middle of
the growing season. Samples used for analysis in this research came from whole
plants, including roots and shoots, sampled at six weeks which could have affected the
means and does not truly allow for a direct comparison with the reported sufficiency
ranges. Janick (1986) reported that typical plant N contents are 2.5 to 4.5% of the dry
weight for fully expanded leaves, which is lower than the values quoted by Mills.
However, N contents in this experiment did not fall within this range either.
34
Table 2 Effects of Light intensity and Nutrient Solution on Watercress Total Nitrogen Content in a Controlled Environment Treatment %N2,3,4 N Light Intensity Low (50 ± 10 PAR) 0.60 a 9 Intermediate (450 ± 10 PAR) 1.94 b 9 Significance¹ * Nutrient Solution Full-strength Hoagland's 2.29 a 6 Half-strength Hoagland's 1.52 ab 6 Control (de-ionized water) 0.00 b 6 Significance¹ * Linear ** Quadratic ns ¹ns = not significant, * = significant at the 5% level, ** = significant at the 1% level, *** = significant
at the 0.1% level ²Means based on whole plant (roots and shoots) samples; means represent a composite sample of three plants ³Means were transformed for analysis using (y+0.5)^0.5; means reported are non-transformed 4Means in a column followed by the same letter are not significant from each other according to Tukey’s Studentized Range (HSD) test
35
Aquaponic Experiments
Three, 12-week long, aquaponic experiments were conducted. The first
experiment was conducted during the summer (June to September) of 2005 in the
Aquaculture Research Facility (ARF). The second and third experiments were
conducted during the winter (December to March) and spring (March to June) of 2006 in
the Aquaponic Production Greenhouse (APG).
Whole plant length, fresh weight, and dry weight data were collected and
recorded for all experiments. Whole plant length and dry weight means were used for
statistical analysis.
During the Summer 2005 experiment in the ARF, there was an aphid infestation
on some of the plants in several rafts in various channels at Week 9. A 20:1
horticultural soap:water solution was made and applied to infested plants to suffocate
the aphids and prevent further damage.
By Week 12, there was no longer an aphid issue; however, a cabbage worm
(Pieris rapae (Linneaus)) infestation was discovered. The cabbage worm larva had
defoliated some of the plants in several rafts in various channels, so pest damage was
random, but primarily within the first replication. Some plants were not able to be
sampled due to damage from both pests, but no raft lost all of its plants and Week 12
signified the end of the experiment, so this did not become a major experimental issue.
Pests did not become an issue or affect data collection in the APG during the
second and third aquaponic experiments. This was probably due to lower seasonal
ambient air temperatures, the fine mesh screen that was installed on the sides of the
36
greenhouse, and less weed establishment within the greenhouse versus the ARF.
Summer 2005 (ARF)
Growth Data
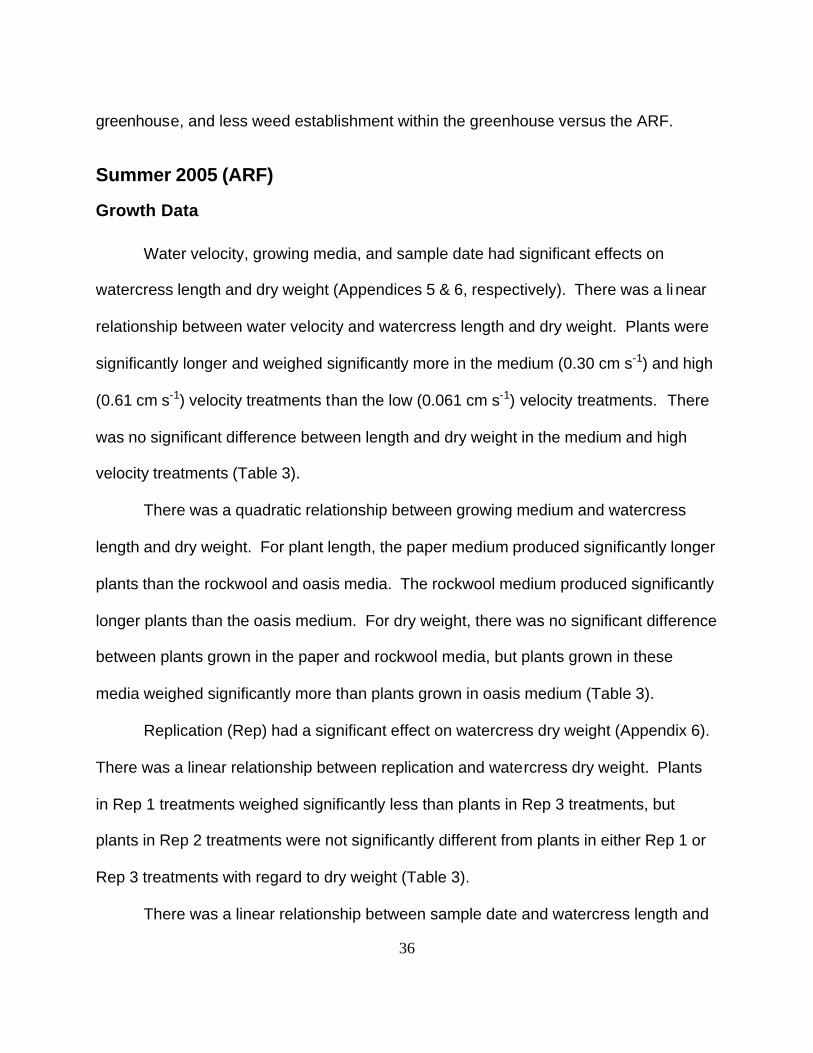
Water velocity, growing media, and sample date had significant effects on
watercress length and dry weight (Appendices 5 & 6, respectively). There was a li near
relationship between water velocity and watercress length and dry weight. Plants were
significantly longer and weighed significantly more in the medium (0.30 cm s-1) and high
(0.61 cm s-1) velocity treatments than the low (0.061 cm s-1) velocity treatments. There
was no significant difference between length and dry weight in the medium and high
velocity treatments (Table 3).
There was a quadratic relationship between growing medium and watercress
length and dry weight. For plant length, the paper medium produced significantly longer
plants than the rockwool and oasis media. The rockwool medium produced significantly
longer plants than the oasis medium. For dry weight, there was no significant difference
between plants grown in the paper and rockwool media, but plants grown in these
media weighed significantly more than plants grown in oasis medium (Table 3).
Replication (Rep) had a significant effect on watercress dry weight (Appendix 6).
There was a linear relationship between replication and watercress dry weight. Plants
in Rep 1 treatments weighed significantly less than plants in Rep 3 treatments, but
plants in Rep 2 treatments were not significantly different from plants in either Rep 1 or
Rep 3 treatments with regard to dry weight (Table 3).
There was a linear relationship between sample date and watercress length and
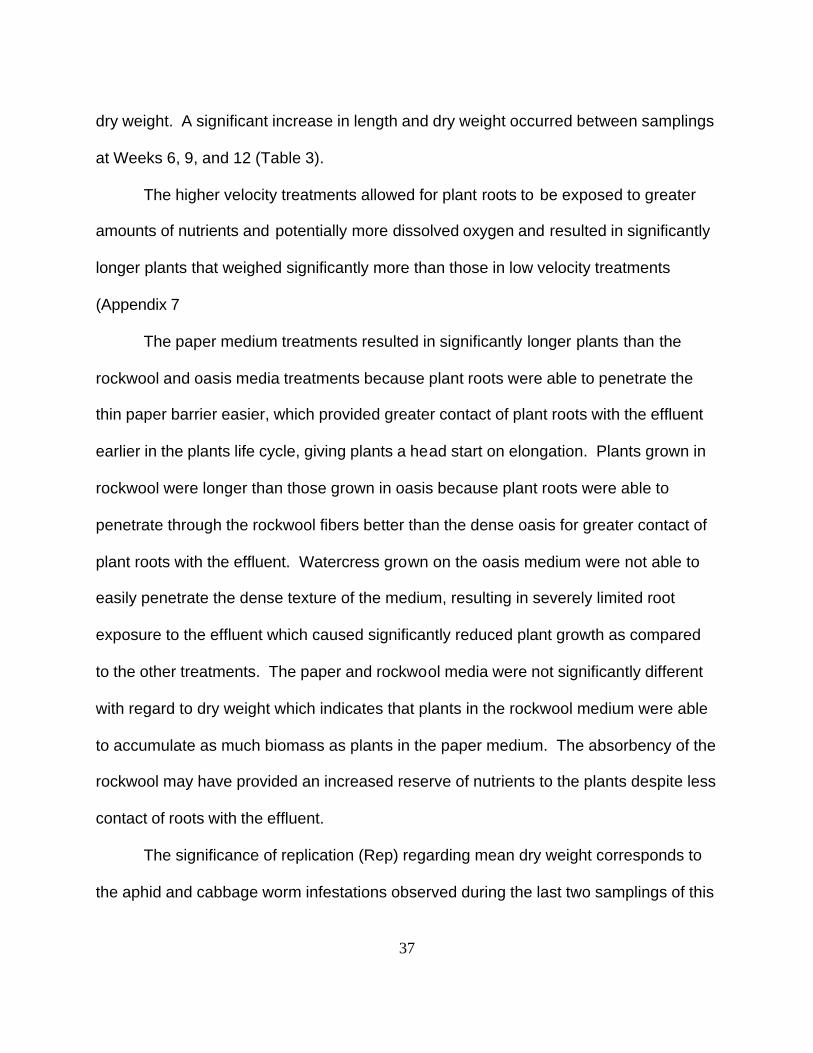
37
dry weight. A significant increase in length and dry weight occurred between samplings
at Weeks 6, 9, and 12 (Table 3).
The higher velocity treatments allowed for plant roots to be exposed to greater
amounts of nutrients and potentially more dissolved oxygen and resulted in significantly
longer plants that weighed significantly more than those in low velocity treatments
(Appendix 7
The paper medium treatments resulted in significantly longer plants than the
rockwool and oasis media treatments because plant roots were able to penetrate the
thin paper barrier easier, which provided greater contact of plant roots with the effluent
earlier in the plants life cycle, giving plants a head start on elongation. Plants grown in
rockwool were longer than those grown in oasis because plant roots were able to
penetrate through the rockwool fibers better than the dense oasis for greater contact of
plant roots with the effluent. Watercress grown on the oasis medium were not able to
easily penetrate the dense texture of the medium, resulting in severely limited root
exposure to the effluent which caused significantly reduced plant growth as compared
to the other treatments. The paper and rockwool media were not significantly different
with regard to dry weight which indicates that plants in the rockwool medium were able
to accumulate as much biomass as plants in the paper medium. The absorbency of the
rockwool may have provided an increased reserve of nutrients to the plants despite less
contact of roots with the effluent.
The significance of replication (Rep) regarding mean dry weight corresponds to
the aphid and cabbage worm infestations observed during the last two samplings of this
38
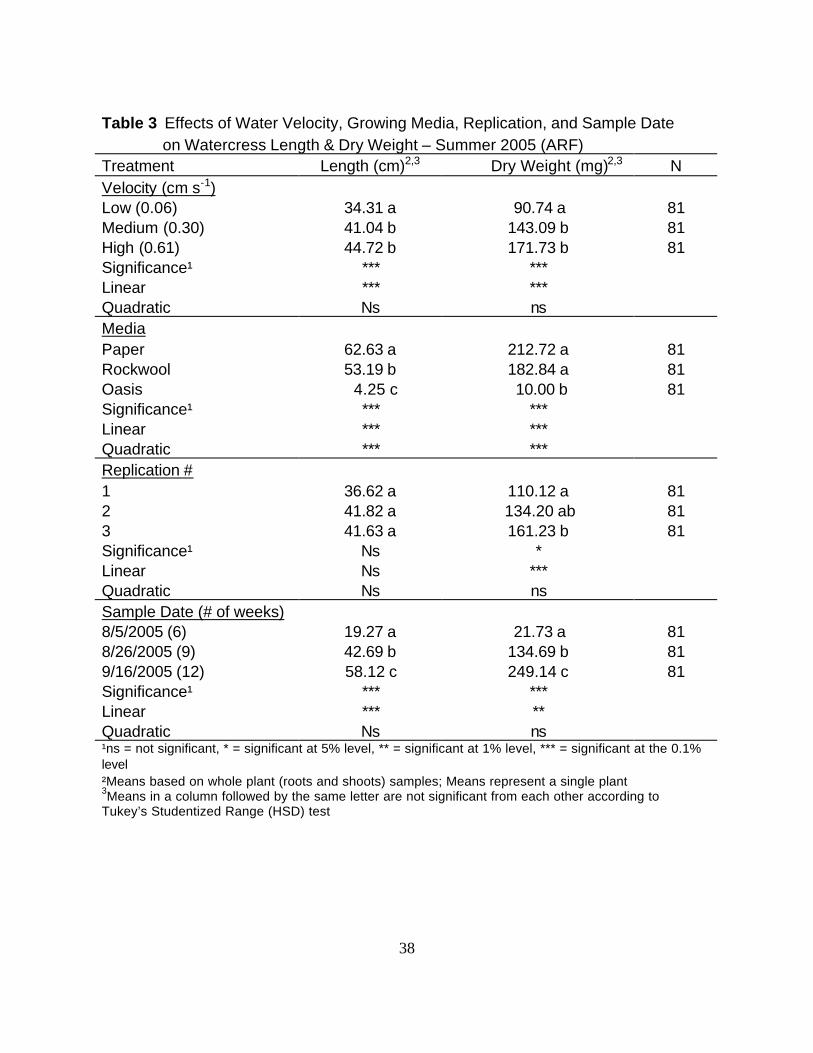
Table 3 Effects of Water Velocity, Growing Media, Replication, and Sample Date on Watercress Length & Dry Weight – Summer 2005 (ARF) Treatment Length (cm)2,3 Dry Weight (mg)2,3 N
Velocity (cm s-1)
Low (0.06) 34.31 a 90.74 a 81
Medium (0.30) 41.04 b 143.09 b 81
High (0.61) 44.72 b 171.73 b 81
Significance¹ *** ***
Linear *** ***
Quadratic Ns ns
Media
Paper 62.63 a 212.72 a 81
Rockwool 53.19 b 182.84 a 81
Oasis 4.25 c 10.00 b 81
Significance¹ *** ***
Linear *** ***
Quadratic *** ***
Replication #
1 36.62 a 110.12 a 81
2 41.82 a 134.20 ab 81
3 41.63 a 161.23 b 81
Significance¹ Ns *
Linear Ns ***
Quadratic Ns ns
Sample Date (# of weeks)
8/5/2005 (6) 19.27 a 21.73 a 81
8/26/2005 (9) 42.69 b 134.69 b 81
9/16/2005 (12) 58.12 c 249.14 c 81
Significance¹ *** ***
Linear *** **
Quadratic Ns ns ¹ns = not significant, * = significant at 5% level, ** = significant at 1% level, *** = significant at the 0.1% level ²Means based on whole plant (roots and shoots) samples; Means represent a single plant 3Means in a column followed by the same letter are not significant from each other according to Tukey’s Studentized Range (HSD) test
39
experiment. Rep 1 was affected the most by the infestations than any other replication.
Rep 2 was affected by the infestations more than Rep 3, which was the replication least
affected by the pests. No significant difference was seen in length because stems were
left intact and upright, but heavy defoliation occurred during the last sampling, which
contributed to the reduction in dry weights, particularly in Rep 1.
The significant increase in watercress length and dry weight at each sampling
indicates a positive growth curve.
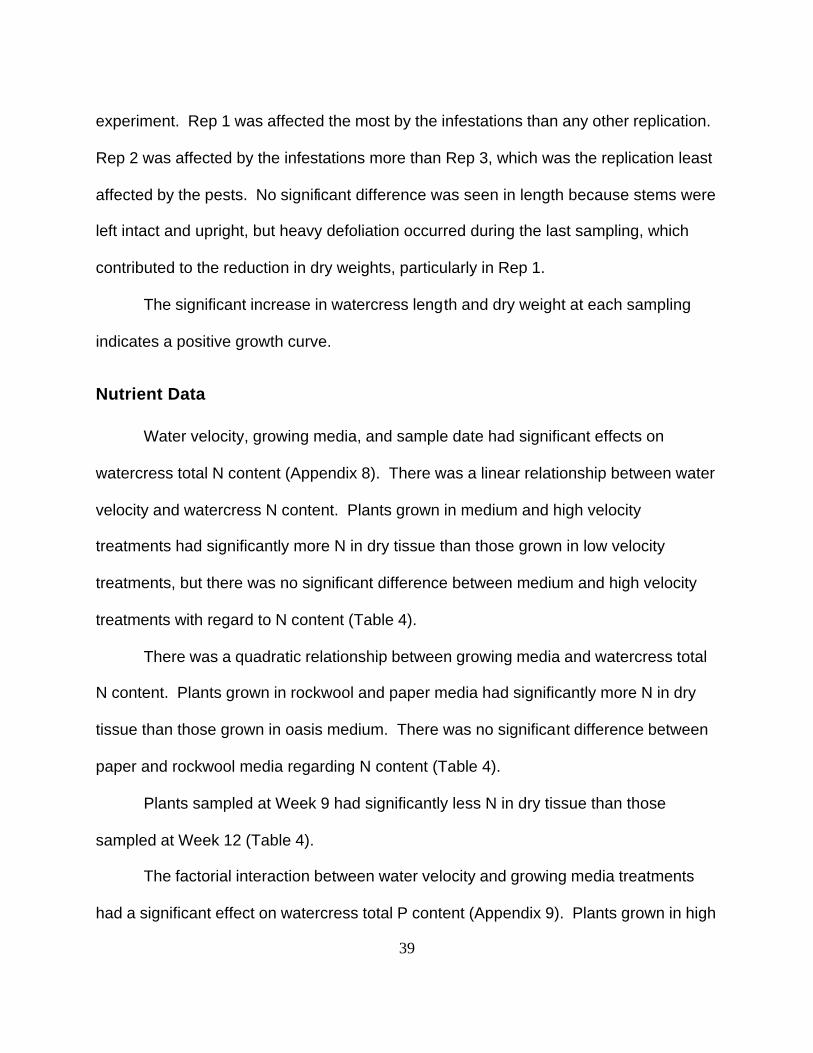
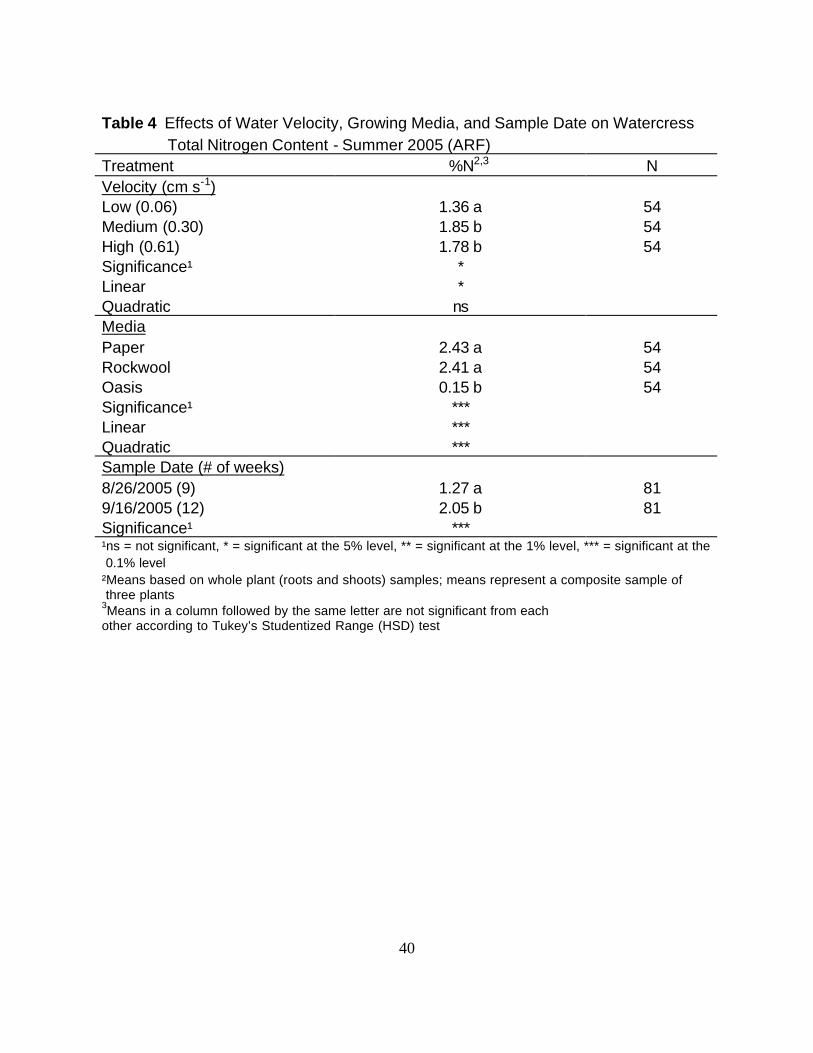
Nutrient Data
Water velocity, growing media, and sample date had significant effects on
watercress total N content (Appendix 8). There was a linear relationship between water
velocity and watercress N content. Plants grown in medium and high velocity
treatments had significantly more N in dry tissue than those grown in low velocity
treatments, but there was no significant difference between medium and high velocity
treatments with regard to N content (Table 4).
There was a quadratic relationship between growing media and watercress total
N content. Plants grown in rockwool and paper media had significantly more N in dry
tissue than those grown in oasis medium. There was no significant difference between
paper and rockwool media regarding N content (Table 4).
Plants sampled at Week 9 had significantly less N in dry tissue than those
sampled at Week 12 (Table 4).
The factorial interaction between water velocity and growing media treatments
had a significant effect on watercress total P content (Appendix 9). Plants grown in high
40
Table 4 Effects of Water Velocity, Growing Media, and Sample Date on Watercress Total Nitrogen Content - Summer 2005 (ARF) Treatment %N2,3 N
Velocity (cm s-1)
Low (0.06) 1.36 a 54
Medium (0.30) 1.85 b 54
High (0.61) 1.78 b 54
Significance¹ *
Linear *
Quadratic ns
Media
Paper 2.43 a 54
Rockwool 2.41 a 54
Oasis 0.15 b 54
Significance¹ ***
Linear ***
Quadratic ***
Sample Date (# of weeks)
8/26/2005 (9) 1.27 a 81
9/16/2005 (12) 2.05 b 81
Significance¹ *** ¹ns = not significant, * = significant at the 5% level, ** = significant at the 1% level, *** = significant at the 0.1% level ²Means based on whole plant (roots and shoots) samples; means represent a composite sample of three plants 3Means in a column followed by the same letter are not significant from each other according to Tukey’s Studentized Range (HSD) test
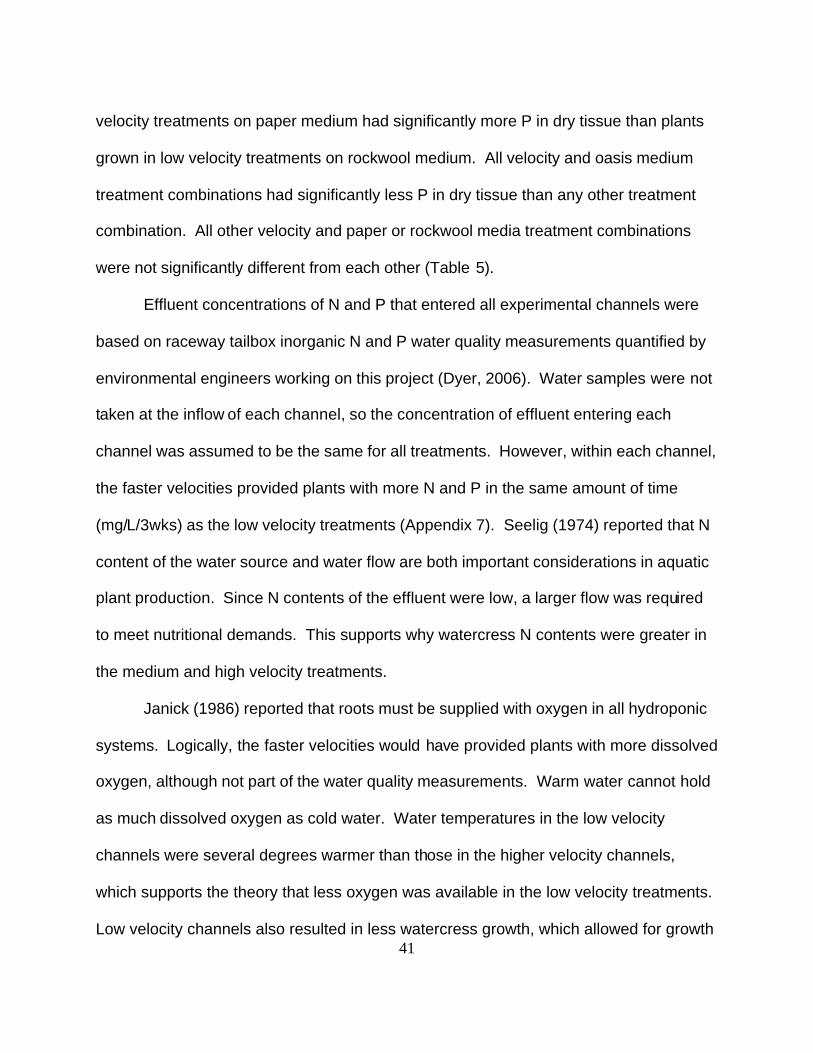
41
velocity treatments on paper medium had significantly more P in dry tissue than plants
grown in low velocity treatments on rockwool medium. All velocity and oasis medium
treatment combinations had significantly less P in dry tissue than any other treatment
combination. All other velocity and paper or rockwool media treatment combinations
were not significantly different from each other (Table 5).
Effluent concentrations of N and P that entered all experimental channels were
based on raceway tailbox inorganic N and P water quality measurements quantified by
environmental engineers working on this project (Dyer, 2006). Water samples were not
taken at the inflow of each channel, so the concentration of effluent entering each
channel was assumed to be the same for all treatments. However, within each channel,
the faster velocities provided plants with more N and P in the same amount of time
(mg/L/3wks) as the low velocity treatments (Appendix 7). Seelig (1974) reported that N
content of the water source and water flow are both important considerations in aquatic
plant production. Since N contents of the effluent were low, a larger flow was required
to meet nutritional demands. This supports why watercress N contents were greater in
the medium and high velocity treatments.
Janick (1986) reported that roots must be supplied with oxygen in all hydroponic
systems. Logically, the faster velocities would have provided plants with more dissolved
oxygen, although not part of the water quality measurements. Warm water cannot hold
as much dissolved oxygen as cold water. Water temperatures in the low velocity
channels were several degrees warmer than those in the higher velocity channels,
which supports the theory that less oxygen was available in the low velocity treatments.
Low velocity channels also resulted in less watercress growth, which allowed for growth
42
Table 5 Effects of the Factorial Combination of Water Velocity and Growing Media on Watercress Total Phosphorus Content – Summer 2005 (ARF) Treatment Combination (3 x 3) %P2,3 N Velocity (cm s-1) Media Low (0.06) Paper 0.58 ab 18 Rockwool 0.35 b 18 Oasis 0.00 c 18 Medium (0.30) Paper 0.62 ab 18 Rockwool 0.58 ab 18 Oasis 0.03 c 18 High (0.61) Paper 0.63 a 18 Rockwool 0.62 ab 18 Oasis 0.03 c 18 Significance¹ ** ¹ns = not significant, * = significant at the 5% level, ** = significant at the 1% level, *** = significant at the 0.1% level ²Means based on whole plant (roots and shoots) samples; means represent a composite sample of three plants 3Means in a column followed by the same letter are not significant from each other according to t-test for paired comparisons, where t = 0.27
43
of undesirable species like algae and duckweed, which could have contributed to the
eutrophic conditions this research aimed to avoid.
Plants grown in the paper and rockwool media contained significantly more N in
their tissue than the oasis medium because the seedlings’ roots were able to penetrate
the thin paper barrier and rockwool fibers easier than the dense oasis cubes for greater
access to N and oxygen present in the effluent for nutrient uptake.
The significant increase in N content from Week 9 to Week 12 indicates that
plants continued to uptake N between these samplings. Based on reported sufficiency
ranges for watercress N content, %N means for this experiment do not fall within that
range or the reported typical plant N range. This suggests that the effluent did not
contain enough N to meet watercress’ N requirement and indicates the potential for N
deficiency according to the cultural conditions in the ARF in the Summer 2005
experiment. There were no obvious signs of nutrient deficiency. The only deficiency
observed was etiolation due to the low light intensity within the ARF.
The factorial interaction favoring the high water velocity and paper medium
treatment combination for significantly greater watercress P contents also relates to
higher P concentrations present in high velocity channels and greater access of plant
roots with the effluent due to the thin paper barrier. The paper media is also more cost
effective for the grower than rockwool or oasis and it’s bio-degradable. Mills et al.
(1997) reported sufficiency range for watercress P content is 0.7 to 1.3%. Mean values
for %P did not fall within this reported range; however, Janick (1986) reported that the
optimum leaf P concentration of a typical plant is 0.2 to 0.3%. The mean %P contents
for the factorial combinations of medium and high velocities and paper and rockwool
44
media in this experiment were above this range. The effluent may or may not have
contained enough P to meet watercress’ P requirement and may or may not have been
P limiting, depending on which range is considered acceptable. No obvious signs of P
deficiency were observed and the only deficiency observed was etiolation due to the low
light intensity within the ARF.
The sufficiency ranges reported by Mills et al. (1996) may not be an accurate
comparison for watercress nutrient contents in this system because the ranges came
from analysis of new leaves sampled in the middle of the growing season. Samples
used for analysis in this research came from whole plants, including roots and shoots,
and were sampled throughout the growing season which could have affected the means
and does not truly allow for a direct comparison with the reported sufficiency ranges. It
is likely that the reported watercress ranges came from commercially grown watercress
that was heavily fertilized contributing to the higher ranges given for N and P.
Insufficient watercress nutrient contents could also be attributed to nutrients
settling out in the channels before watercress is able to use them. One suggestion is to
lower the standpipe to 7.62 cm (3 in), which is slightly higher than commercial depth, so
roots are able to take advantage of the nutrients which may be present in solids at the
bottom of the channels. Another option to ensure that sufficient nutrient requirements
are met would be the addition of supplemental nutrients, preferably in the form of a
water soluble organic fertilizer or from the application of solids removed from the
quiescent zones during cleaning. This could potentially improve growth and even
reduce the amount of time required to achieve a harvestable crop. In contrast, if
watercress did not utilize all of the supplemental nutrients, then nutrient loading of the
45
environment could result, which is a conflict of interest since this is the issue that’s
trying to be avoided in the first place.
Potential nutrient loading via the addition of supplemental nutrients is a delicate
situation that needs to be addressed and considered carefully. Local residents have
been harvesting and consuming watercress from natural springs in the area where this
research occurred for generations and these plants are not intentionally exposed to
supplemental fertilizer. Watercress grown in aquaculture effluent should have the
added benefit of higher nutrient concentrations than if grown in spring water alone. The
added production costs and environmental risks associated with fertilizer additions
probably would not improve the system as a whole, especially since watercress is cited
as not having a high nutrient demand (Seeling, 1974).
Summer 2005 (ARF) - Control Comparison
This comparison looks at the control channels placed at the headbox of the
raceway (containing spring water only) and channels from each replication in the main
experimental channels (containing aquaculture effluent) that contained only the medium
plant density treatments.
Growth Data
Water velocity, growing media, and sample date had significant effects on
watercress length and dry weight (Appendices 10 and 11, respectively).
There was a linear relationship between water velocity and watercress length
and dry weight in both the control and main channels. Plants were significantly longer
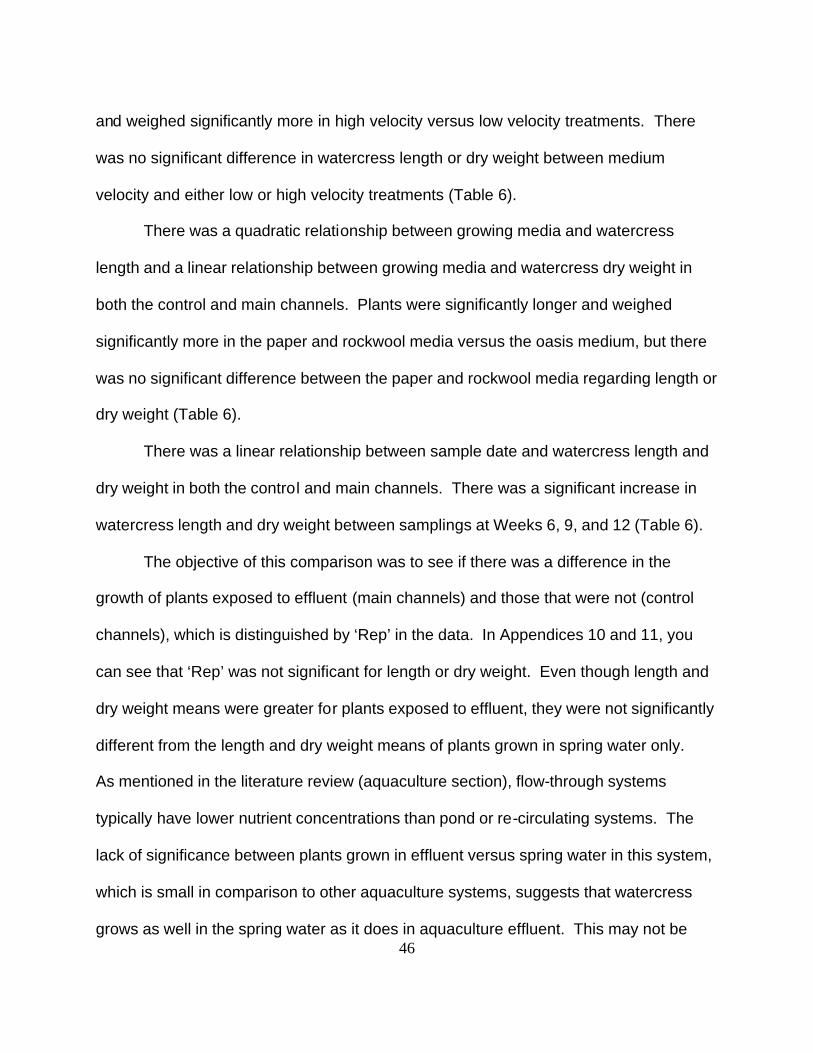
46
and weighed significantly more in high velocity versus low velocity treatments. There
was no significant difference in watercress length or dry weight between medium
velocity and either low or high velocity treatments (Table 6).
There was a quadratic relationship between growing media and watercress
length and a linear relationship between growing media and watercress dry weight in
both the control and main channels. Plants were significantly longer and weighed
significantly more in the paper and rockwool media versus the oasis medium, but there
was no significant difference between the paper and rockwool media regarding length or
dry weight (Table 6).
There was a linear relationship between sample date and watercress length and
dry weight in both the control and main channels. There was a significant increase in
watercress length and dry weight between samplings at Weeks 6, 9, and 12 (Table 6).
The objective of this comparison was to see if there was a difference in the
growth of plants exposed to effluent (main channels) and those that were not (control
channels), which is distinguished by ‘Rep’ in the data. In Appendices 10 and 11, you
can see that ‘Rep’ was not significant for length or dry weight. Even though length and
dry weight means were greater for plants exposed to effluent, they were not significantly
different from the length and dry weight means of plants grown in spring water only.
As mentioned in the literature review (aquaculture section), flow-through systems
typically have lower nutrient concentrations than pond or re-circulating systems. The
lack of significance between plants grown in effluent versus spring water in this system,
which is small in comparison to other aquaculture systems, suggests that watercress
grows as well in the spring water as it does in aquaculture effluent. This may not be
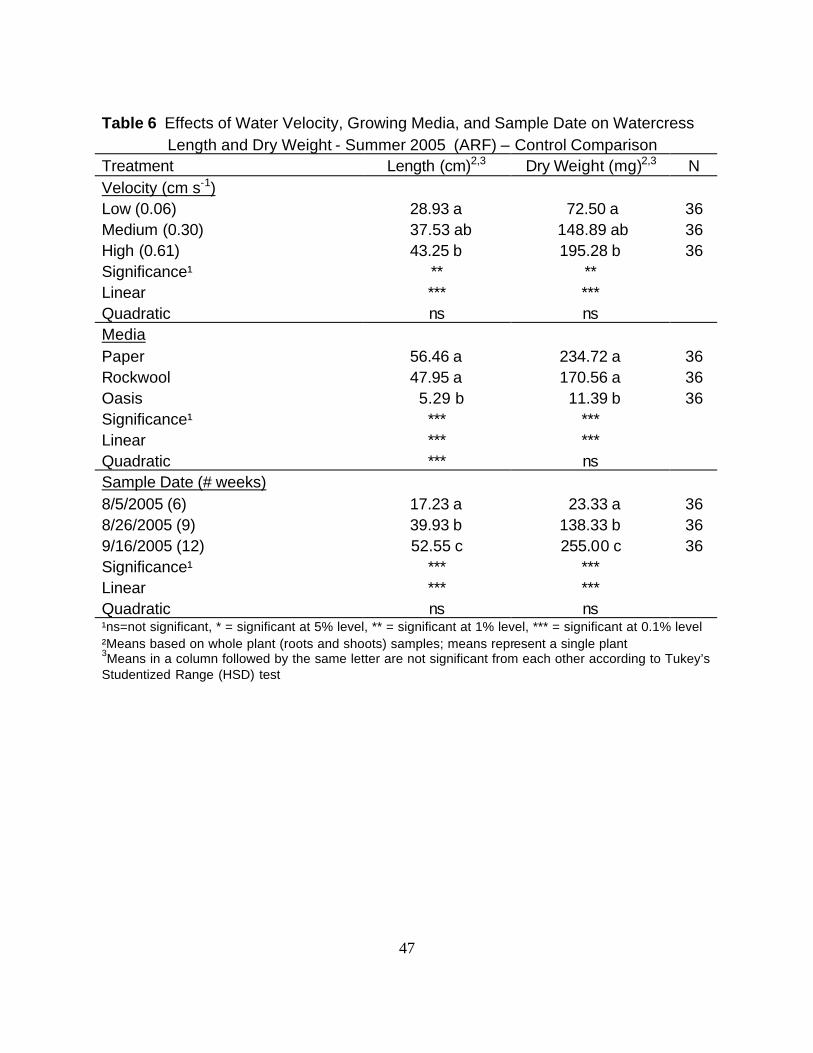
47
Table 6 Effects of Water Velocity, Growing Media, and Sample Date on Watercress Length and Dry Weight - Summer 2005 (ARF) – Control Comparison Treatment Length (cm)2,3 Dry Weight (mg)2,3 N Velocity (cm s-1) Low (0.06) 28.93 a 72.50 a 36 Medium (0.30) 37.53 ab 148.89 ab 36 High (0.61) 43.25 b 195.28 b 36 Significance¹ ** ** Linear *** *** Quadratic ns ns Media Paper 56.46 a 234.72 a 36 Rockwool 47.95 a 170.56 a 36 Oasis 5.29 b 11.39 b 36 Significance¹ *** *** Linear *** *** Quadratic *** ns Sample Date (# weeks) 8/5/2005 (6) 17.23 a 23.33 a 36 8/26/2005 (9) 39.93 b 138.33 b 36 9/16/2005 (12) 52.55 c 255.00 c 36 Significance¹ *** *** Linear *** *** Quadratic ns ns ¹ns=not significant, * = significant at 5% level, ** = significant at 1% level, *** = significant at 0.1% level ²Means based on whole plant (roots and shoots) samples; means represent a single plant 3Means in a column followed by the same letter are not significant from each other according to Tukey’s Studentized Range (HSD) test
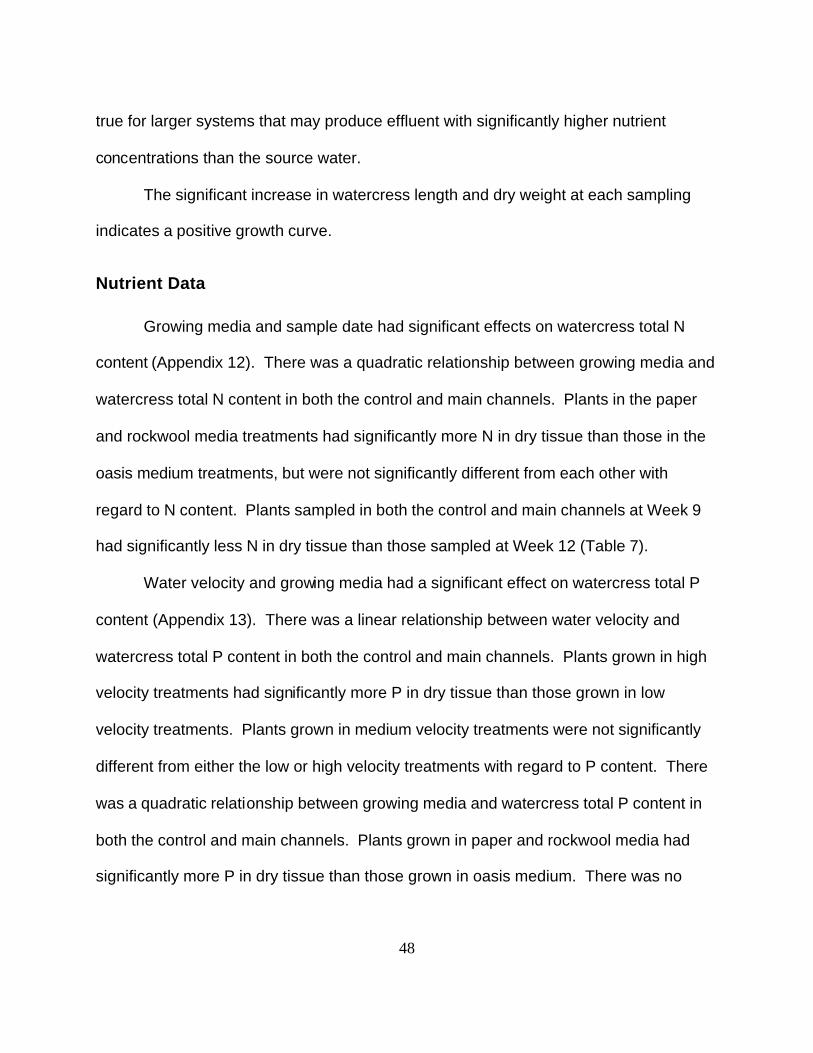
48
true for larger systems that may produce effluent with significantly higher nutrient
concentrations than the source water.
The significant increase in watercress length and dry weight at each sampling
indicates a positive growth curve.
Nutrient Data
Growing media and sample date had significant effects on watercress total N
content (Appendix 12). There was a quadratic relationship between growing media and
watercress total N content in both the control and main channels. Plants in the paper
and rockwool media treatments had significantly more N in dry tissue than those in the
oasis medium treatments, but were not significantly different from each other with
regard to N content. Plants sampled in both the control and main channels at Week 9
had significantly less N in dry tissue than those sampled at Week 12 (Table 7).
Water velocity and growing media had a significant effect on watercress total P
content (Appendix 13). There was a linear relationship between water velocity and
watercress total P content in both the control and main channels. Plants grown in high
velocity treatments had significantly more P in dry tissue than those grown in low
velocity treatments. Plants grown in medium velocity treatments were not significantly
different from either the low or high velocity treatments with regard to P content. There
was a quadratic relationship between growing media and watercress total P content in
both the control and main channels. Plants grown in paper and rockwool media had
significantly more P in dry tissue than those grown in oasis medium. There was no
49
significant difference in P content between paper and rockwool media treatments
(Table 7).
Similar to the growth results, the objective of this comparison was to see if there
was a difference in the nutrient contents of watercress in treatments exposed to effluent
(main channels) and those that were not (control channels), which is distinguished by
‘Rep’ in the data. In Appendices 12 and 13, ‘Rep’ is not significant. Although
watercress grown in the main channels contained slightly more N and P in dry tissue
than those grown in the control channels, these amounts were not significant. This
indicates that the nutrient contribution of the effluent is insignificant because watercress
N and P contents were approximately the same whether grown in spring water or in
effluent.
Water quality data provided by the project environmental engineers also supports
this finding. Nutrient concentrations of the spring water sampled in the headbox prior to
trout production were very dilute (less than 1 mg/L (1ppm) N and P) and concentrations
remained dilute in samples taken from the tailbox after production. Only small
increases in N and P concentrations, based on water quality testing, were seen in the
tailbox and some results even showed a decline or no change at all in nutrient
concentrations after fish production (Dyer, 2006).
Thus, based on this comparison, the function and purpose of this integrated
system becomes water re-use and production of a secondary marketable crop versus
nutrient recovery. Watercress is able to recover nutrients from this system, but since
the amount of nutrients in the effluent is insignificant, the threat of nutrient loading and
associated environmental impacts is unlikely from this aquaculture system as is.
50
Table 7 Effects of Water Velocity, Growing Media, and Sample Date on Watercress Total Nitrogen and Phosphorus Content – Summer 2005 (ARF) – Control Comparison Treatment %N2,3 %P2,3 N Velocity (cm s-1) Low (0.06) 1.18 a 0.29 a 24 Medium (0.30) 1.81 a 0.36 ab 24 High (0.61) 1.63 a 0.43 b 24 Significance¹ ns * Linear ns ** Quadratic ns ns Media
Paper 1.96 a 0.56 a 24
Rockwool 2.43 a 0.50 a 24
Oasis 0.22 b 0.02 b 24
Significance¹ *** ***
Linear *** ***
Quadratic *** ***
Sample Date (# weeks)
8/26/2005 (9) 1.26 a 0.35 a 36
9/16/2005 (12) 1.82 b 0.37 a 36
Significance¹ * ns ¹ns = not significant, * = significant at the 5% level, ** = significant at the 1% level, *** = significant at the 0.1% level ²Means based on whole plant (roots and shoots) samples; means represent a composite sample of three plants 3Means in a column followed by the same letter are not significant from each other according to Tukey’s Studentized Range (HSD) test
51
Winter 2006 (APG)
This experiment and the Spring 2006 experiment study of the effects of low and
high water velocities and low and high plant densities on watercress growth and nutrient
contents in the Aquaponic Production Greenhouse (APG).
Growth Data
Sample date had a significant effect on watercress length (Appendix 14). There
was a quadratic relationship between sample date and watercress length. Plant length
significantly increased between samplings at Weeks 6, 9, and 12 (Table 8).
Water velocity and sample date had significant effects on watercress dry weight
(Appendix 15). Plants grown in high velocity treatments weighed significantly more than
those grown in low velocity treatments. There was a linear relationship between sample
date and watercress dry weight. Dry weight significantly increased between samplings
at Weeks 6, 9, and 12 (Table 8).
Seelig (1974) reported that watercress grows best in flowing water. The high
velocity studied in all of the aquaponic experiments had a flow rate about ten times
greater than the low velocity studied. This allowed for plant roots to be exposed to
greater amounts of nutrients and oxygen in high velocity treatments in the same amount
of time as those in low velocity treatments and resulted in plants that weighed
significantly more (Appendix 7). Since it was winter and ambient air temperatures were
colder, effluent in the high velocity channels probably insulated plants better than in the
low velocity channels because the greater flows kept the water in the high velocity
channels from freezing.
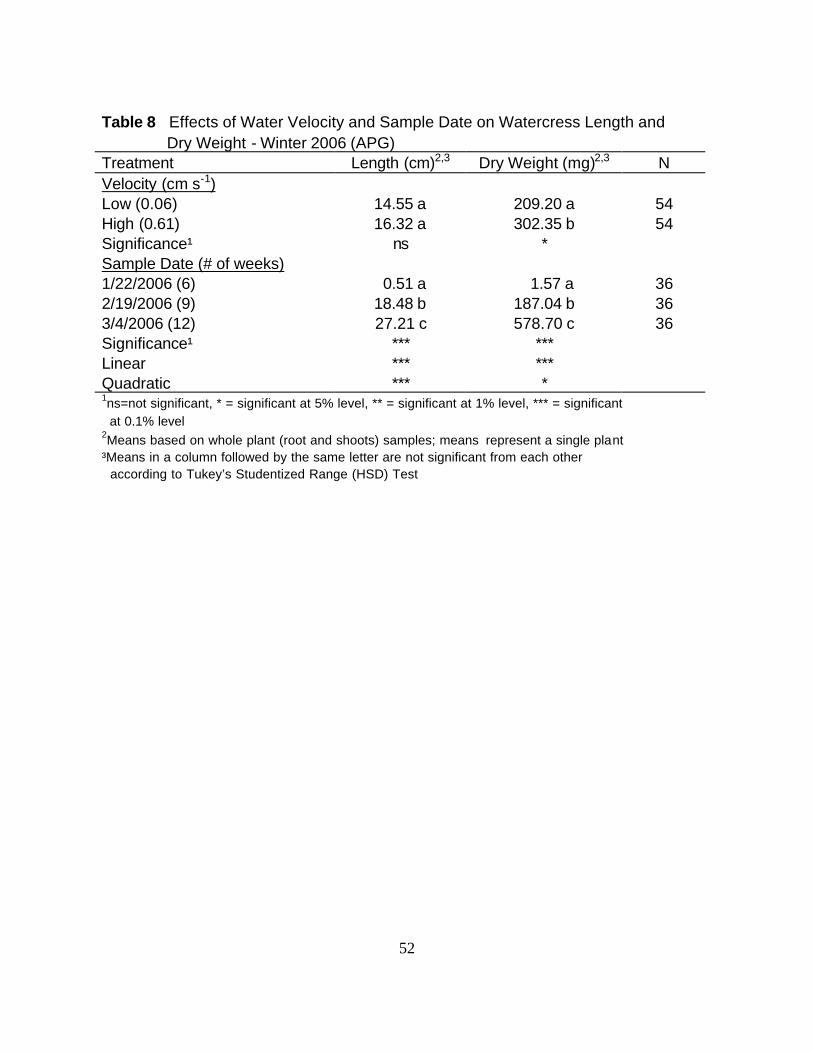
52
Table 8 Effects of Water Velocity and Sample Date on Watercress Length and Dry Weight - Winter 2006 (APG) Treatment Length (cm)2,3 Dry Weight (mg)2,3 N Velocity (cm s-1) Low (0.06) 14.55 a 209.20 a 54 High (0.61) 16.32 a 302.35 b 54 Significance¹ ns * Sample Date (# of weeks) 1/22/2006 (6) 0.51 a 1.57 a 36 2/19/2006 (9) 18.48 b 187.04 b 36 3/4/2006 (12) 27.21 c 578.70 c 36 Significance¹ *** *** Linear *** *** Quadratic *** * 1ns=not significant, * = significant at 5% level, ** = significant at 1% level, *** = significant at 0.1% level 2Means based on whole plant (root and shoots) samples; means represent a single plant ³Means in a column followed by the same letter are not significant from each other according to Tukey’s Studentized Range (HSD) Test
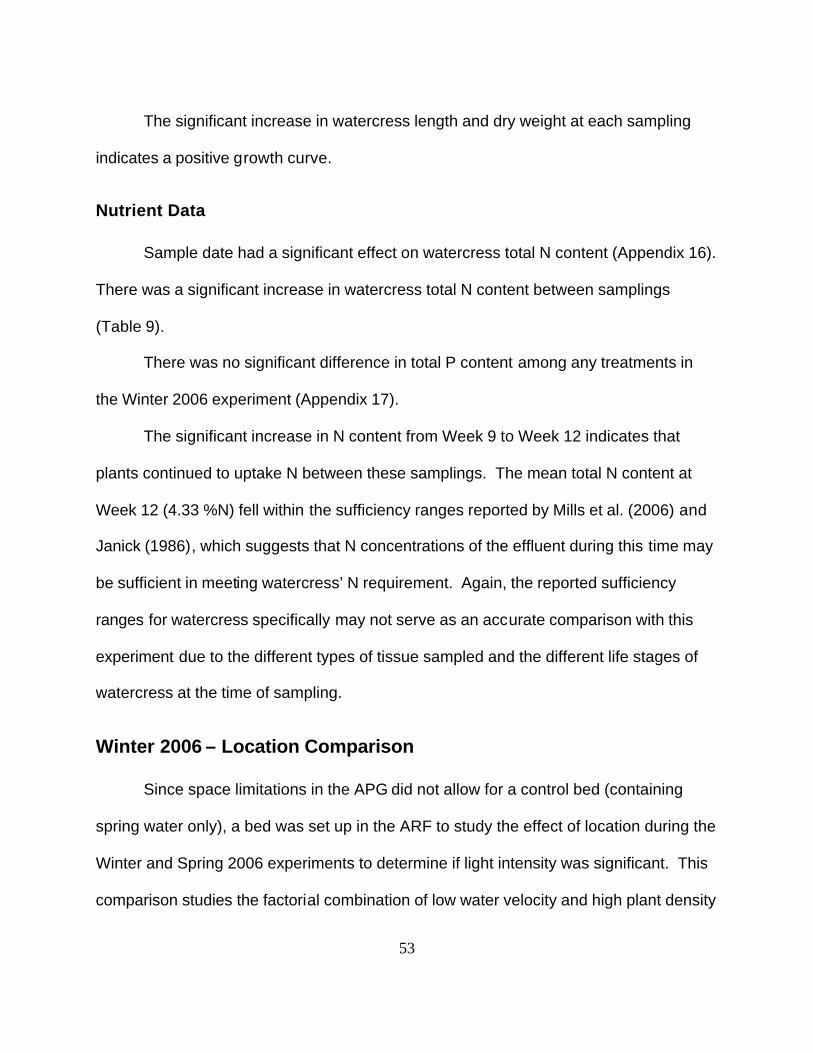
53
The significant increase in watercress length and dry weight at each sampling
indicates a positive growth curve.
Nutrient Data
Sample date had a significant effect on watercress total N content (Appendix 16).
There was a significant increase in watercress total N content between samplings
(Table 9).
There was no significant difference in total P content among any treatments in
the Winter 2006 experiment (Appendix 17).
The significant increase in N content from Week 9 to Week 12 indicates that
plants continued to uptake N between these samplings. The mean total N content at
Week 12 (4.33 %N) fell within the sufficiency ranges reported by Mills et al. (2006) and
Janick (1986), which suggests that N concentrations of the effluent during this time may
be sufficient in meeting watercress’ N requirement. Again, the reported sufficiency
ranges for watercress specifically may not serve as an accurate comparison with this
experiment due to the different types of tissue sampled and the different life stages of
watercress at the time of sampling.
Winter 2006 – Location Comparison
Since space limitations in the APG did not allow for a control bed (containing
spring water only), a bed was set up in the ARF to study the effect of location during the
Winter and Spring 2006 experiments to determine if light intensity was significant. This
comparison studies the factorial combination of low water velocity and high plant density
54
Table 9 Effect of Sample Date on Watercress Total Nitrogen Content - Winter 2006 (APG) Treatment %N2,3 N Sample Date 2/19/2006 (9) 2.50 a 36 3/4/2006 (12) 4.33 b 36 Significance¹ *** ¹ns = not significant, * = significant at the 5% level, ** = significant at the 1% level,
*** = significant at the 0.1% level ²Means based on whole plant (roots and shoots) samples; means represent a composite sample of three plants ³Means in a column followed by the same letter are not significant from each other according to Tukey’s Studentized Range (HSD) Test
55
treatments only on watercress growth and nutrient contents in the ARF (low PAR)
versus the APG (intermediate PAR) in the Winter 2006 experiment.
Growth Data
Location and sample date had significant effects on watercress length and dry
weight (Appendix 18 and 19, respectively). Plants grown in the APG were significantly
longer and weighed significantly more than those grown in the ARF. There was a linear
relationship between sample date and watercress length and dry weight. Plant length
and dry weight significantly increased between samplings at Weeks 6, 9, and 12 (Table
10).
Plants grown in the APG location had a significant increase in length and dry
weight because the greenhouse provided greater light intensities and ambient air
temperatures than the ARF which aided photosynthesis and promoted growth. PAR
values and ambient air temperatures for the APG and the ARF can be found in Dyer
(2006). Plants did not grow at all in the ARF during the winter which resulted in zeroes
for growth. which is attributed to lower light intensities and ambient air temperatures
during the winter.
The significant increase in watercress length and dry weight at each sampling
indicates a positive growth curve for plants grown in the APG.
Nutrient Data
Location and sample date had significant effects on watercress total N content
(Appendix 20). Plants grown in the APG had significantly more N in dry tissue than
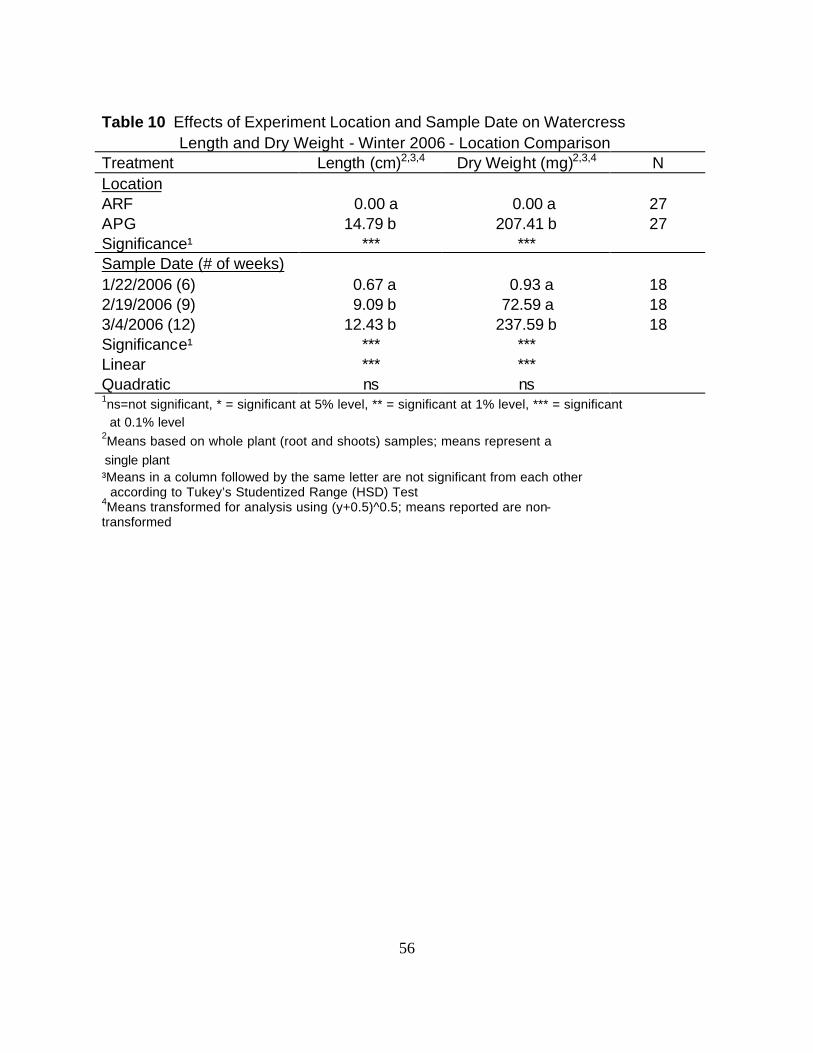
56
Table 10 Effects of Experiment Location and Sample Date on Watercress Length and Dry Weight - Winter 2006 - Location Comparison Treatment Length (cm)2,3,4 Dry Weight (mg)2,3,4 N Location ARF 0.00 a 0.00 a 27 APG 14.79 b 207.41 b 27 Significance¹ *** *** Sample Date (# of weeks) 1/22/2006 (6) 0.67 a 0.93 a 18 2/19/2006 (9) 9.09 b 72.59 a 18 3/4/2006 (12) 12.43 b 237.59 b 18 Significance¹ *** *** Linear *** *** Quadratic ns ns 1ns=not significant, * = significant at 5% level, ** = significant at 1% level, *** = significant at 0.1% level 2Means based on whole plant (root and shoots) samples; means represent a single plant ³Means in a column followed by the same letter are not significant from each other according to Tukey’s Studentized Range (HSD) Test 4Means transformed for analysis using (y+0.5)^0.5; means reported are non-transformed
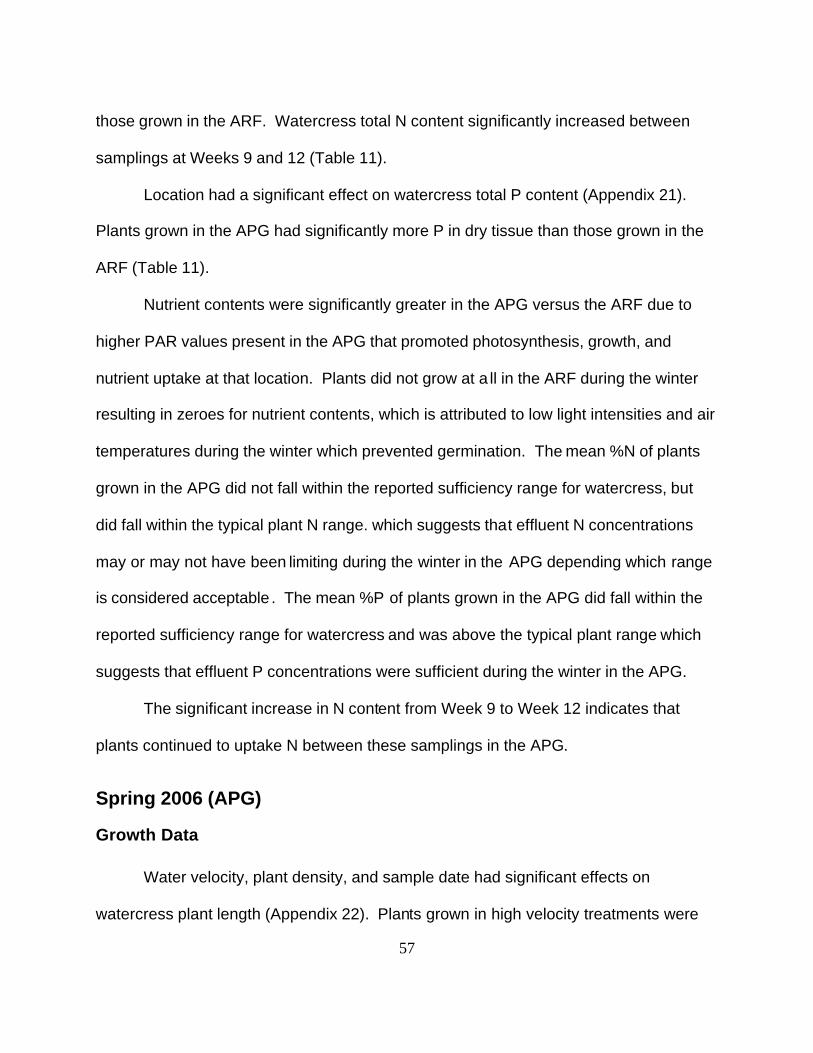
57
those grown in the ARF. Watercress total N content significantly increased between
samplings at Weeks 9 and 12 (Table 11).
Location had a significant effect on watercress total P content (Appendix 21).
Plants grown in the APG had significantly more P in dry tissue than those grown in the
ARF (Table 11).
Nutrient contents were significantly greater in the APG versus the ARF due to
higher PAR values present in the APG that promoted photosynthesis, growth, and
nutrient uptake at that location. Plants did not grow at a ll in the ARF during the winter resulting in zeroes for nutrient contents, which is attributed to low light intensities and air
temperatures during the winter which prevented germination. The mean %N of plants
grown in the APG did not fall within the reported sufficiency range for watercress, but
did fall within the typical plant N range. which suggests that effluent N concentrations
may or may not have been limiting during the winter in the APG depending which range
is considered acceptable . The mean %P of plants grown in the APG did fall within the
reported sufficiency range for watercress and was above the typical plant range which
suggests that effluent P concentrations were sufficient during the winter in the APG.
The significant increase in N content from Week 9 to Week 12 indicates that
plants continued to uptake N between these samplings in the APG.
Spring 2006 (APG)
Growth Data
Water velocity, plant density, and sample date had significant effects on
watercress plant length (Appendix 22). Plants grown in high velocity treatments were
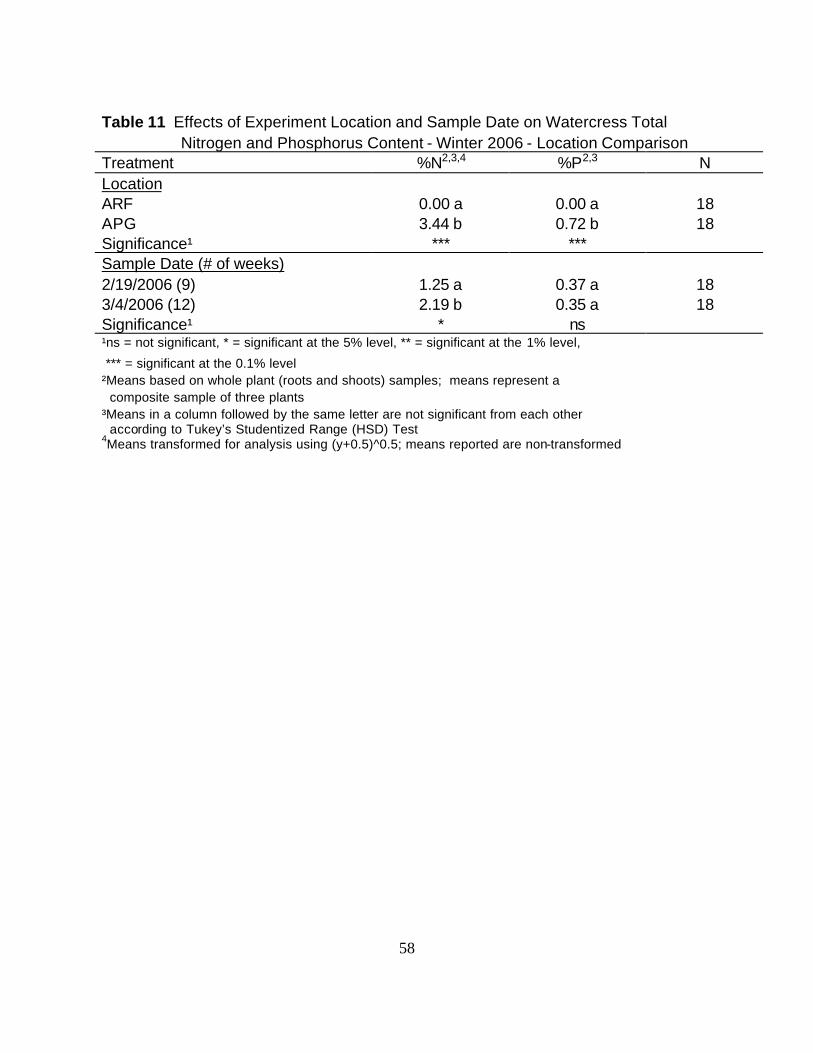
58
Table 11 Effects of Experiment Location and Sample Date on Watercress Total Nitrogen and Phosphorus Content - Winter 2006 - Location Comparison Treatment %N2,3,4 %P2,3 N Location ARF 0.00 a 0.00 a 18 APG 3.44 b 0.72 b 18 Significance¹ *** *** Sample Date (# of weeks) 2/19/2006 (9) 1.25 a 0.37 a 18 3/4/2006 (12) 2.19 b 0.35 a 18 Significance¹ * ns ¹ns = not significant, * = significant at the 5% level, ** = significant at the 1% level,
*** = significant at the 0.1% level ²Means based on whole plant (roots and shoots) samples; means represent a composite sample of three plants ³Means in a column followed by the same letter are not significant from each other according to Tukey’s Studentized Range (HSD) Test 4Means transformed for analysis using (y+0.5)^0.5; means reported are non-transformed
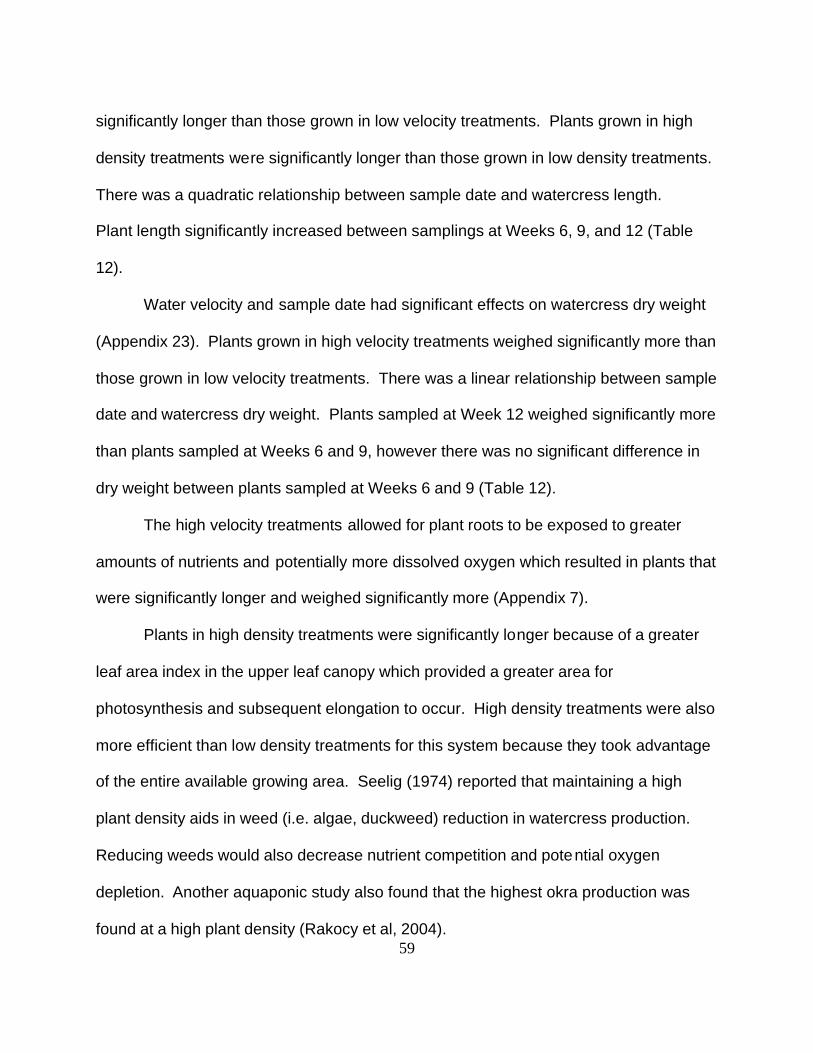
59
significantly longer than those grown in low velocity treatments. Plants grown in high
density treatments were significantly longer than those grown in low density treatments.
There was a quadratic relationship between sample date and watercress length.
Plant length significantly increased between samplings at Weeks 6, 9, and 12 (Table
12).
Water velocity and sample date had significant effects on watercress dry weight
(Appendix 23). Plants grown in high velocity treatments weighed significantly more than
those grown in low velocity treatments. There was a linear relationship between sample
date and watercress dry weight. Plants sampled at Week 12 weighed significantly more
than plants sampled at Weeks 6 and 9, however there was no significant difference in
dry weight between plants sampled at Weeks 6 and 9 (Table 12).
The high velocity treatments allowed for plant roots to be exposed to greater
amounts of nutrients and potentially more dissolved oxygen which resulted in plants that
were significantly longer and weighed significantly more (Appendix 7).
Plants in high density treatments were significantly longer because of a greater
leaf area index in the upper leaf canopy which provided a greater area for
photosynthesis and subsequent elongation to occur. High density treatments were also
more efficient than low density treatments for this system because they took advantage
of the entire available growing area. Seelig (1974) reported that maintaining a high
plant density aids in weed (i.e. algae, duckweed) reduction in watercress production.
Reducing weeds would also decrease nutrient competition and potential oxygen
depletion. Another aquaponic study also found that the highest okra production was
found at a high plant density (Rakocy et al, 2004).
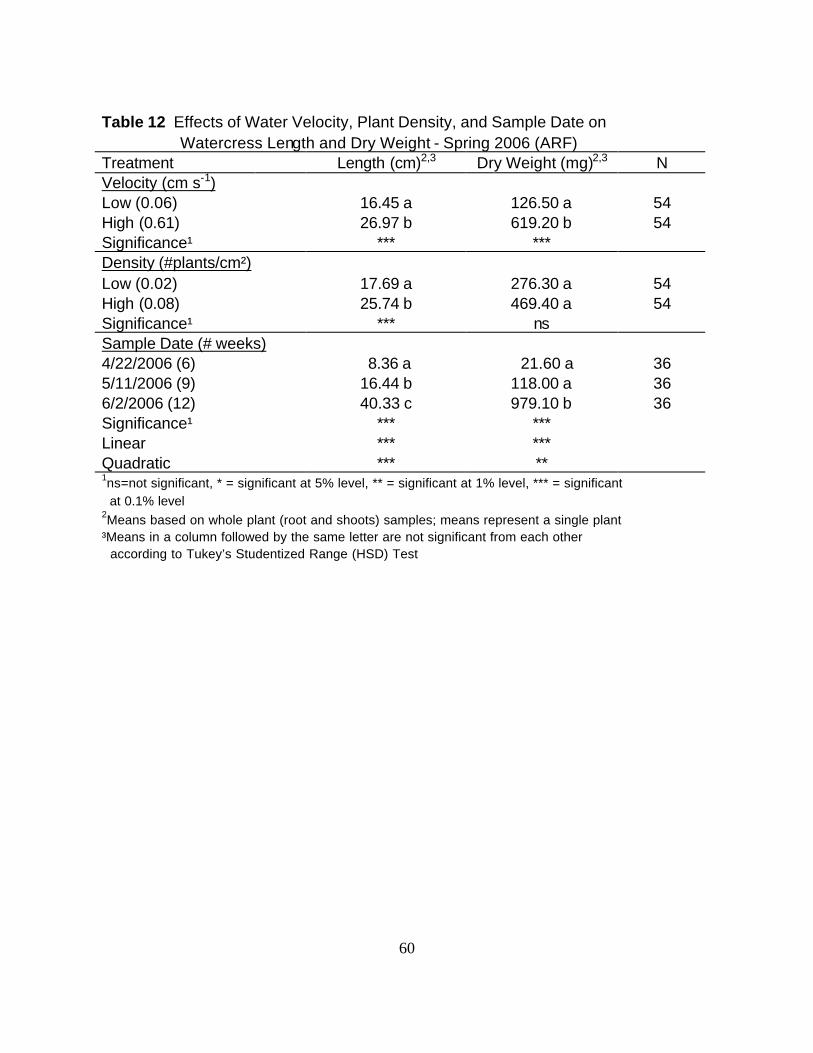
60
Table 12 Effects of Water Velocity, Plant Density, and Sample Date on Watercress Length and Dry Weight - Spring 2006 (ARF) Treatment Length (cm)2,3 Dry Weight (mg)2,3 N Velocity (cm s-1) Low (0.06) 16.45 a 126.50 a 54 High (0.61) 26.97 b 619.20 b 54 Significance¹ *** *** Density (#plants/cm²) Low (0.02) 17.69 a 276.30 a 54 High (0.08) 25.74 b 469.40 a 54 Significance¹ *** ns Sample Date (# weeks) 4/22/2006 (6) 8.36 a 21.60 a 36 5/11/2006 (9) 16.44 b 118.00 a 36 6/2/2006 (12) 40.33 c 979.10 b 36 Significance¹ *** *** Linear *** *** Quadratic *** ** 1ns=not significant, * = significant at 5% level, ** = significant at 1% level, *** = significant at 0.1% level 2Means based on whole plant (root and shoots) samples; means represent a single plant ³Means in a column followed by the same letter are not significant from each other according to Tukey’s Studentized Range (HSD) Test
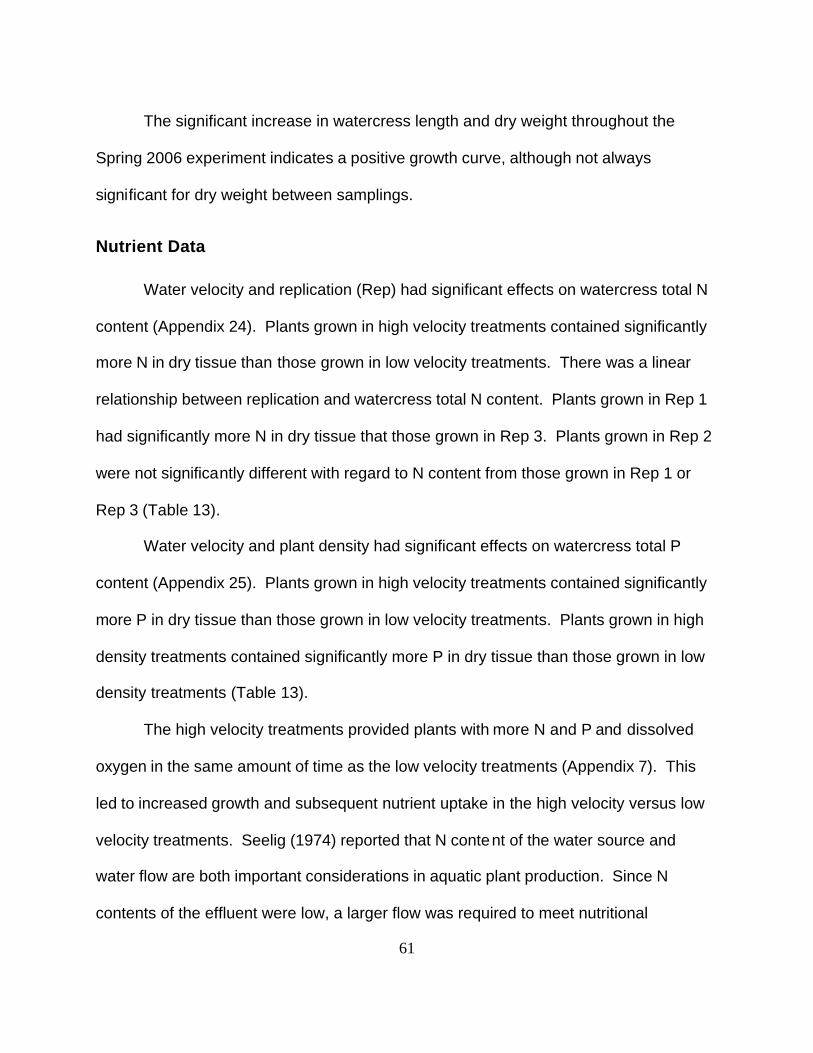
61
The significant increase in watercress length and dry weight throughout the
Spring 2006 experiment indicates a positive growth curve, although not always
significant for dry weight between samplings.
Nutrient Data
Water velocity and replication (Rep) had significant effects on watercress total N
content (Appendix 24). Plants grown in high velocity treatments contained significantly
more N in dry tissue than those grown in low velocity treatments. There was a linear
relationship between replication and watercress total N content. Plants grown in Rep 1
had significantly more N in dry tissue that those grown in Rep 3. Plants grown in Rep 2
were not significantly different with regard to N content from those grown in Rep 1 or
Rep 3 (Table 13).
Water velocity and plant density had significant effects on watercress total P
content (Appendix 25). Plants grown in high velocity treatments contained significantly
more P in dry tissue than those grown in low velocity treatments. Plants grown in high
density treatments contained significantly more P in dry tissue than those grown in low
density treatments (Table 13).
The high velocity treatments provided plants with more N and P and dissolved
oxygen in the same amount of time as the low velocity treatments (Appendix 7). This
led to increased growth and subsequent nutrient uptake in the high velocity versus low
velocity treatments. Seelig (1974) reported that N content of the water source and
water flow are both important considerations in aquatic plant production. Since N
contents of the effluent were low, a larger flow was required to meet nutritional
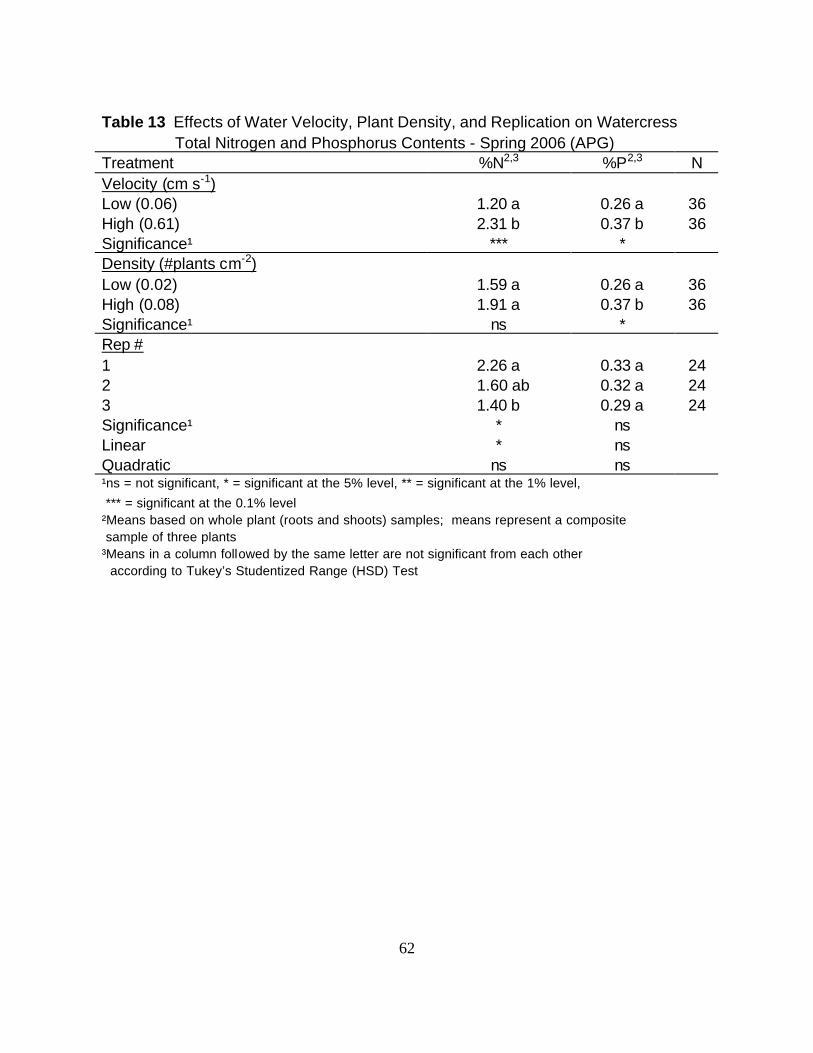
62
Table 13 Effects of Water Velocity, Plant Density, and Replication on Watercress Total Nitrogen and Phosphorus Contents - Spring 2006 (APG) Treatment %N2,3 %P2,3 N Velocity (cm s-1) Low (0.06) 1.20 a 0.26 a 36 High (0.61) 2.31 b 0.37 b 36 Significance¹ *** * Density (#plants cm-2) Low (0.02) 1.59 a 0.26 a 36 High (0.08) 1.91 a 0.37 b 36 Significance¹ ns * Rep # 1 2.26 a 0.33 a 24 2 1.60 ab 0.32 a 24 3 1.40 b 0.29 a 24 Significance¹ * ns Linear * ns Quadratic ns ns ¹ns = not significant, * = significant at the 5% level, ** = significant at the 1% level,
*** = significant at the 0.1% level ²Means based on whole plant (roots and shoots) samples; means represent a composite sample of three plants ³Means in a column followed by the same letter are not significant from each other according to Tukey’s Studentized Range (HSD) Test
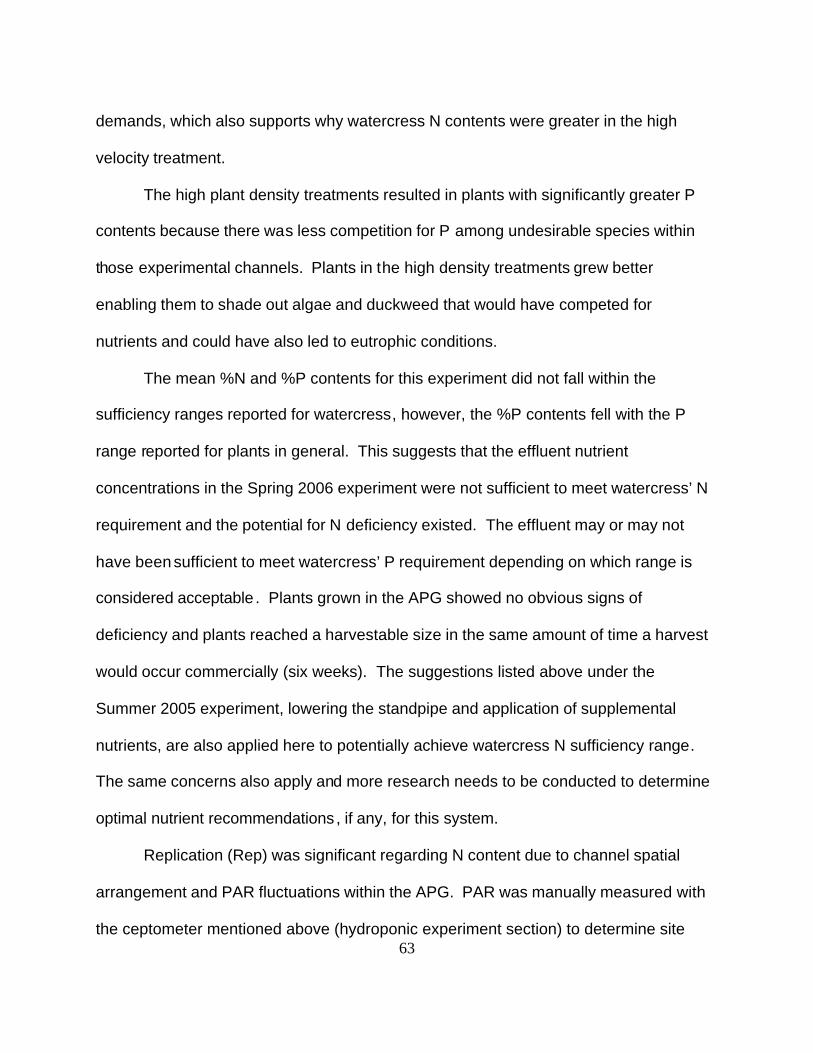
63
demands, which also supports why watercress N contents were greater in the high
velocity treatment.
The high plant density treatments resulted in plants with significantly greater P
contents because there was less competition for P among undesirable species within
those experimental channels. Plants in the high density treatments grew better
enabling them to shade out algae and duckweed that would have competed for
nutrients and could have also led to eutrophic conditions.
The mean %N and %P contents for this experiment did not fall within the
sufficiency ranges reported for watercress, however, the %P contents fell with the P
range reported for plants in general. This suggests that the effluent nutrient
concentrations in the Spring 2006 experiment were not sufficient to meet watercress’ N
requirement and the potential for N deficiency existed. The effluent may or may not
have been sufficient to meet watercress’ P requirement depending on which range is
considered acceptable . Plants grown in the APG showed no obvious signs of
deficiency and plants reached a harvestable size in the same amount of time a harvest
would occur commercially (six weeks). The suggestions listed above under the
Summer 2005 experiment, lowering the standpipe and application of supplemental
nutrients, are also applied here to potentially achieve watercress N sufficiency range.
The same concerns also apply and more research needs to be conducted to determine
optimal nutrient recommendations , if any, for this system.
Replication (Rep) was significant regarding N content due to channel spatial
arrangement and PAR fluctuations within the APG. PAR was manually measured with
the ceptometer mentioned above (hydroponic experiment section) to determine site
64
specific PAR values within the greenhouse versus general PAR readings obtained from
the datalogger. Rep 1 was closer to the east end wall of the greenhouse than Rep 3
and PAR values were higher in this area. Watercress’ performance under different light
intensities and cultural requirements stated in the literature review (watercress section)
suggest that watercress growth would be greater in the higher PAR areas of the
greenhouse. This would result in increased N contents in treatments in the high PAR
areas due to increased photosynthesis, growth, and nutrient uptake.
Spring 2006 – Location Comparison
This comparison studies the factorial combination of low water velocity and high
plant density treatments only on watercress growth and nutrient contents in the ARF
(low PAR) versus the APG (intermediate PAR) in the Spring 2006 experiment.
Growth Data
Sample date had a significant effect on watercress length (Appendix 26). There
was a quadratic relationship between sample date and watercress length. Plant length
significantly increased between samplings at Weeks 6, 9, and 12 (Table 14).
Location and sample date had significant effects on watercress dry weight
(Appendix 27). Plants grown in the APG weighed significantly more than those grown in
the ARF. There was a linear relationship between sample date and watercress dry
weight. Dry weight significantly increased between Week 12 and Weeks 6 and 9,
however there was no significant difference in dry weight between Weeks 6 and 9
(Table 14).
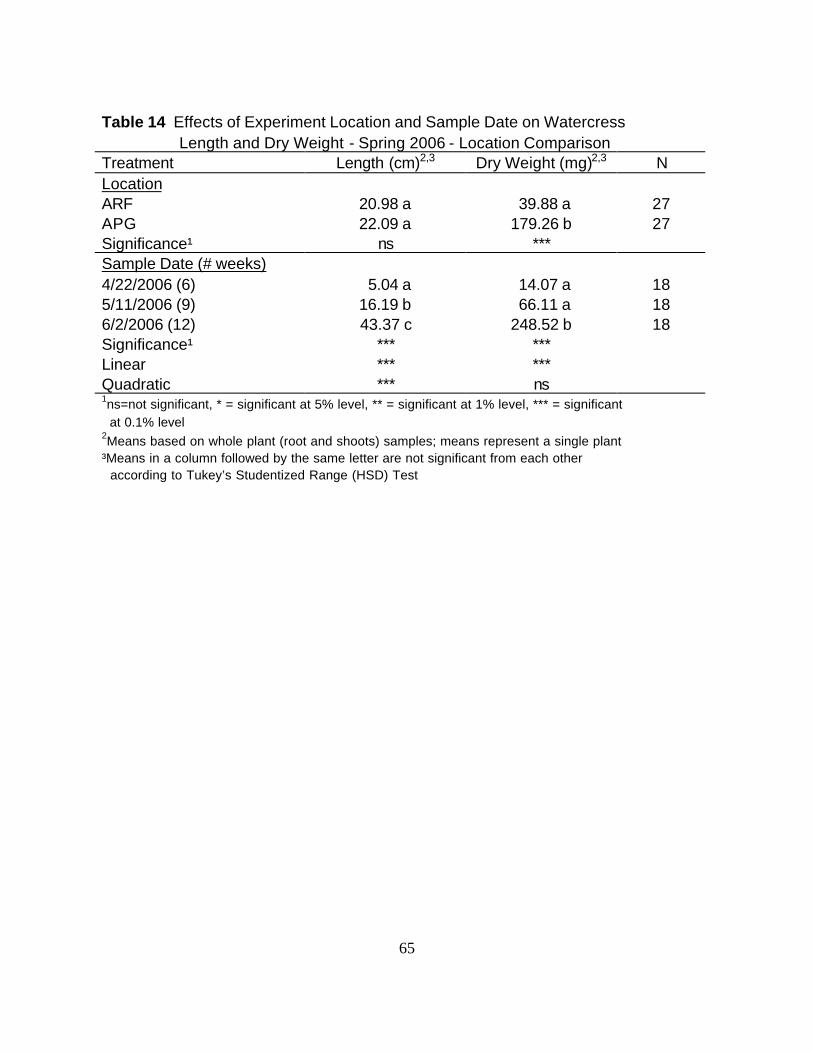
65
Table 14 Effects of Experiment Location and Sample Date on Watercress Length and Dry Weight - Spring 2006 - Location Comparison Treatment Length (cm)2,3 Dry Weight (mg)2,3 N Location ARF 20.98 a 39.88 a 27 APG 22.09 a 179.26 b 27 Significance¹ ns *** Sample Date (# weeks) 4/22/2006 (6) 5.04 a 14.07 a 18 5/11/2006 (9) 16.19 b 66.11 a 18 6/2/2006 (12) 43.37 c 248.52 b 18 Significance¹ *** *** Linear *** *** Quadratic *** ns 1ns=not significant, * = significant at 5% level, ** = significant at 1% level, *** = significant at 0.1% level 2Means based on whole plant (root and shoots) samples; means represent a single plant ³Means in a column followed by the same letter are not significant from each other according to Tukey’s Studentized Range (HSD) Test
66
Plants grown in the APG location had a significant increase in dry weight
because the greenhouse allowed for greater light intensities and ambient air
temperatures than the ARF which aided photosynthesis and promoted growth. PAR
values and ambient air temperatures for the APG and the ARF can be found in
Dyer (2006).
Plants grown in the spring in both locations continued to grow for the duration of
the experiment, apparent by the increase in length and dry weight over time, although
not always significant for dry weight between samplings.
The Spring 2006 - Location Comparison experiment is the only comparison that
can be used to compare aquaponic growth data with hydroponic growth data. Since the
hydroponic experiment only ran for six weeks, only data from Week 6 of the Spring
2006 – Location Comparison experiment can be compared because it is the only
aquaponic experiment that represents data for both low and intermediate PAR
environments and where cultural environmental conditions (photoperiod, ambient air
temperature, pH, etc.) were similar to those used in the hydroponic experiment.
At Week 6, length and dry weight means were zero in the ARF (low PAR).
Watercress was growing in the ARF at this time, but samples did not meet the sampling
criteria (Data Collection and Statistical Analysis section). In reference to Figures 4 and
5, watercress grown in the hydroponic experiment under low PAR was about 20 times
longer and weighed about 200 to 300 times more in the half- and full-strength
Hoagland’s nutrient solutions, respectively, than in effluent at Week 6. This suggests
that watercress length and dry weight was greater at Week 6 when grown in a
hydroponic nutrient solution versus flow-through aquaculture effluent under low PAR.
67
At Week 6, length and dry weight means were 10.07 cm and 84.55 mg,
respectively, in the APG (intermediate PAR). In reference to Figures 4 and 5,
watercress grown in the hydroponic experiment under intermediate PAR was about 4
times longer and weighed about 35 to 75 times more in the half- and full-strength
Hoagland’s nutrient solution, respectively, than in effluent at Week 6. This suggests
that watercress length and dry weight was greater at Week 6 when grown in a
hydroponic nutrient solution versus flow-through aquaculture effluent under intermediate
PAR.
The greater lengths and dry weights found from plants grown in a hydroponic
nutrient solution versus aquaculture effluent suggest that the effluent was nutrient
limiting and potentially prevented watercress from reaching its growth potential, thus
limiting its ability for effluent nutrient recovery and potentially for a secondary
marketable crop. Although plants grew better under intermediate light intensities in a
hydroponic nutrient solution versus aquaculture effluent, they may have grown too well
and this kind of growth may not be desirable from a commercial perspective. At six
weeks, the thicker stems and larger leaves of plants grown in Hoagland’s were not as
appetizing as plants grown in effluent, which resembled what one would purchase in a
market.
Nutrient Data
Location had a significant effect on watercress N and P contents (Appendices 28
and 29, respectively). Plants grown in the APG contained significantly more N and P in
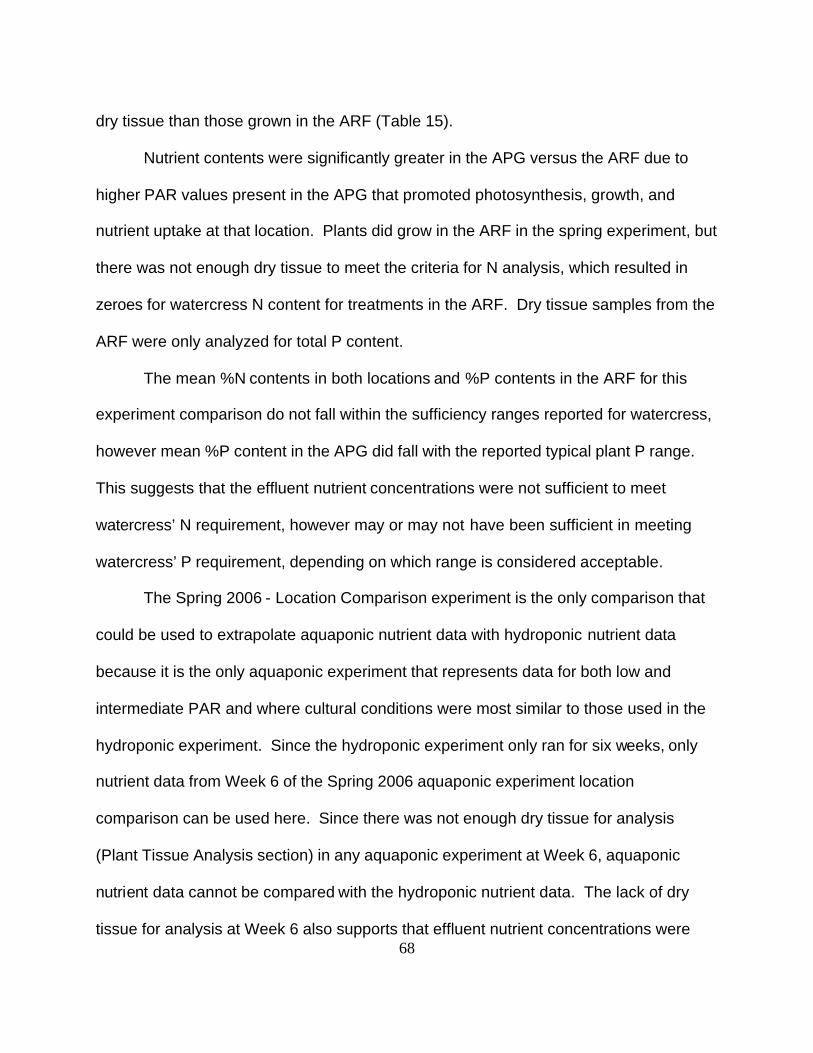
68
dry tissue than those grown in the ARF (Table 15).
Nutrient contents were significantly greater in the APG versus the ARF due to
higher PAR values present in the APG that promoted photosynthesis, growth, and
nutrient uptake at that location. Plants did grow in the ARF in the spring experiment, but
there was not enough dry tissue to meet the criteria for N analysis, which resulted in
zeroes for watercress N content for treatments in the ARF. Dry tissue samples from the
ARF were only analyzed for total P content.
The mean %N contents in both locations and %P contents in the ARF for this
experiment comparison do not fall within the sufficiency ranges reported for watercress,
however mean %P content in the APG did fall with the reported typical plant P range.
This suggests that the effluent nutrient concentrations were not sufficient to meet
watercress’ N requirement, however may or may not have been sufficient in meeting
watercress’ P requirement, depending on which range is considered acceptable.
The Spring 2006 - Location Comparison experiment is the only comparison that
could be used to extrapolate aquaponic nutrient data with hydroponic nutrient data
because it is the only aquaponic experiment that represents data for both low and
intermediate PAR and where cultural conditions were most similar to those used in the
hydroponic experiment. Since the hydroponic experiment only ran for six weeks, only
nutrient data from Week 6 of the Spring 2006 aquaponic experiment location
comparison can be used here. Since there was not enough dry tissue for analysis
(Plant Tissue Analysis section) in any aquaponic experiment at Week 6, aquaponic
nutrient data cannot be compared with the hydroponic nutrient data. The lack of dry
tissue for analysis at Week 6 also supports that effluent nutrient concentrations were
69
Table 15 Effect of Experiment Location on Watercress Total Nitrogen and Phosphorus Contents - Spring 2006 - Location Comparison Treatment %N2,3,4 %P2,3 N Location ARF 0.00 a 0.14 a 18 APG 1.48 b 0.35 b 18 Significance¹ *** ** ¹ns = not significant, * = significant at the 5% level, ** = significant at the 1% level,
*** = significantat the 0.1% level ²Means based on whole plant (roots and shoots) samples; means represent a composite sample of three plants ³Means in a column followed by the same letter are not significant from each other according to Tukey’s Studentized Range (HSD) Test 4Means transformed for analysis using (y+0.5)^0.5; means reported are non-transformed
70
limiting for watercress, thus preventing watercress from reaching its growth potential
and limiting its ability for effluent nutrient recovery and potentially for a secondary
marketable crop.
Winter v. Spring 2006 – Season Comparison
In addition to the above significant effects reported for water velocity, plant
density, and location on watercress growth and nutrient contents in Winter and Spring
2006 separately, an analysis was ran for plants grown in the APG only for Winter 2006
versus Spring 2006 to evaluate the effect of season on watercress growth and nutrient
contents.
Season had a significant effect on watercress length, N content, and P content.
Plants grown in the APG in Spring 2006 were significantly longer than those grown in
the APG in Winter 2006 (Appendix 30). Plants grown in the APG in Winter 2006 had
significantly more N and P in dry tissue than those grown in the APG in Spring 2006
(Appendices 31 and 32, respectively).
There are two explanations why plants were significantly longer in Spring 2006.
First, the increased day length, higher PAR values, and higher air temperatures in the
APG in the spring could have resulted in greater stem elongation. PAR values and
ambient air temperatures for the Winter and Spring 2006 experiments can be found in
Dyer (2006). Second, the effluent nutrient concentrations were lower during the spring
experiment which could have resulted in plants with decreased biomass. This makes
sense since there was no dry weight significance between the Winter and Spring 2006
experiments.
71
Plants in the Winter 2006 experiment contained significantly more N and P in dry
tissue because N and P concentrations in the effluent were higher during this time than
during the Spring 2006 experiment (Appendix 33). Seasonal water quality
measurements can be found in Dyer (2006).
Watercress Yield and Profit Estimates
Based on the experimental results that promoted significant watercress growth
and nutrient contents, estimated watercress potential yields and profits were calculated
for this flow-through aquaculture system.
The watercress yield and profit estimates are based on a proposed watercress
production system in the APG that uses the factorial combination of high velocity, high
density, and paper medium treatments and either a single or double harvest staggered
cropping system. No harvest treatments were conducted during the aquaponic
experiments in this research and the following yield estimate and profit potential given
for watercress are theoretical and based on the current growing area in the APG,
commercial harvest schedules, and current market prices.
The following estimates are not an attempt to verify the actual yields or profits
from this system, but rather theoretical attempts to show what this system is potentially
capable of with regard to these topics. Further research needs to be conducted to
determine and optimize the actual yields and profits from this system and those issues
are intended to be addressed in subsequent research efforts.
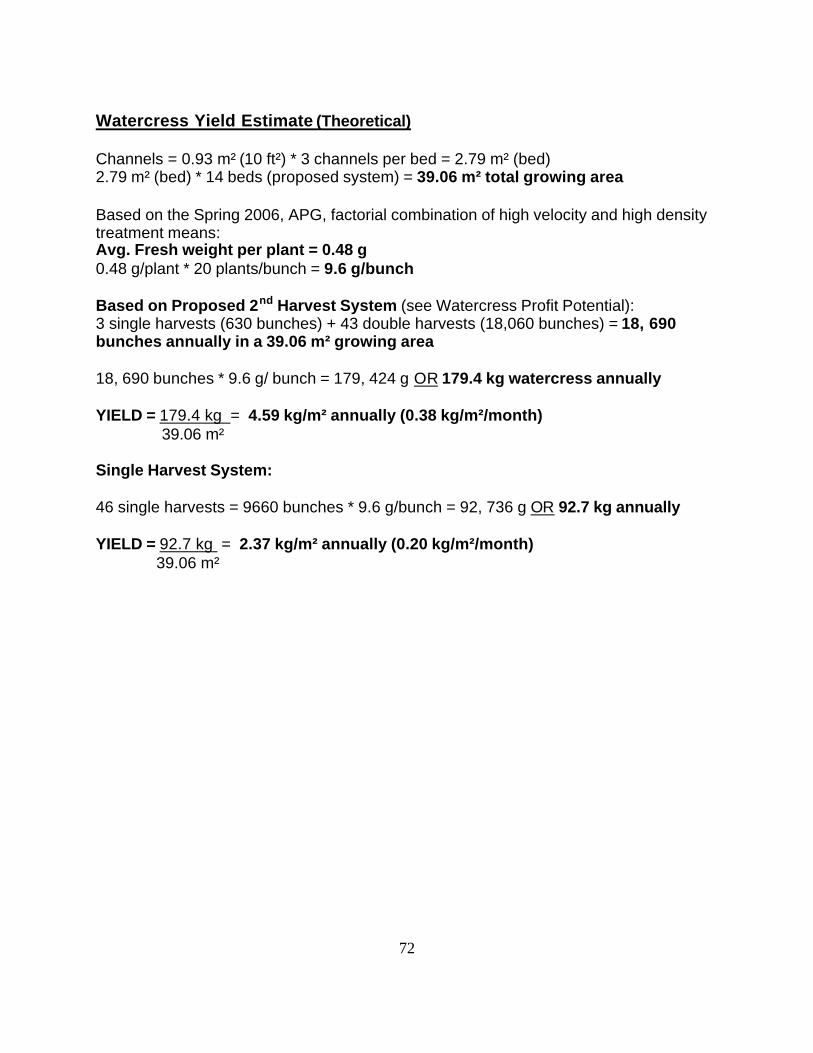
72
Watercress Yield Estimate (Theoretical) Channels = 0.93 m² (10 ft²) * 3 channels per bed = 2.79 m² (bed) 2.79 m² (bed) * 14 beds (proposed system) = 39.06 m² total growing area Based on the Spring 2006, APG, factorial combination of high velocity and high density treatment means: Avg. Fresh weight per plant = 0.48 g 0.48 g/plant * 20 plants/bunch = 9.6 g/bunch Based on Proposed 2nd Harvest System (see Watercress Profit Potential): 3 single harvests (630 bunches) + 43 double harvests (18,060 bunches) = 18, 690 bunches annually in a 39.06 m² growing area 18, 690 bunches * 9.6 g/ bunch = 179, 424 g OR 179.4 kg watercress annually YIELD = 179.4 kg = 4.59 kg/m² annually (0.38 kg/m²/month) 39.06 m² Single Harvest System: 46 single harvests = 9660 bunches * 9.6 g/bunch = 92, 736 g OR 92.7 kg annually YIELD = 92.7 kg = 2.37 kg/m² annually (0.20 kg/m²/month) 39.06 m²
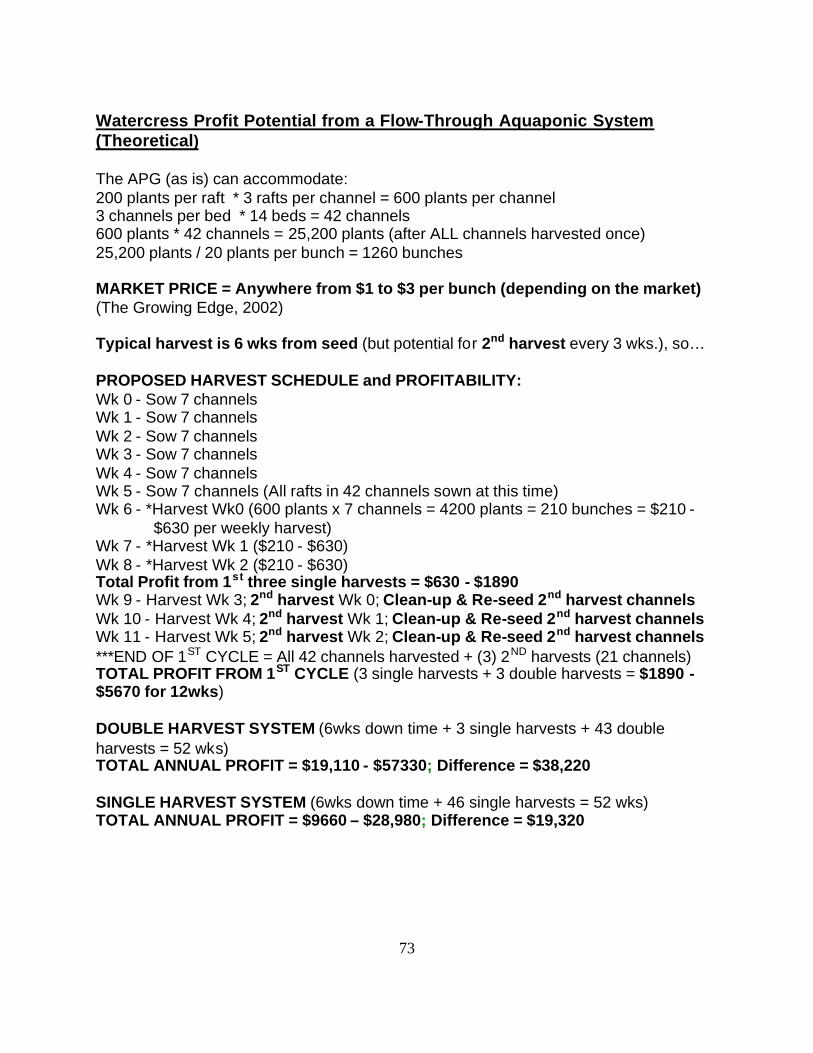
73
Watercress Profit Potential from a Flow-Through Aquaponic System (Theoretical) The APG (as is) can accommodate: 200 plants per raft * 3 rafts per channel = 600 plants per channel 3 channels per bed * 14 beds = 42 channels 600 plants * 42 channels = 25,200 plants (after ALL channels harvested once) 25,200 plants / 20 plants per bunch = 1260 bunches MARKET PRICE = Anywhere from $1 to $3 per bunch (depending on the market) (The Growing Edge, 2002) Typical harvest is 6 wks from seed (but potential for 2nd harvest every 3 wks.), so… PROPOSED HARVEST SCHEDULE and PROFITABILITY: Wk 0 - Sow 7 channels Wk 1 - Sow 7 channels Wk 2 - Sow 7 channels Wk 3 - Sow 7 channels Wk 4 - Sow 7 channels Wk 5 - Sow 7 channels (All rafts in 42 channels sown at this time) Wk 6 - *Harvest Wk0 (600 plants x 7 channels = 4200 plants = 210 bunches = $210 - $630 per weekly harvest) Wk 7 - *Harvest Wk 1 ($210 - $630) Wk 8 - *Harvest Wk 2 ($210 - $630) Total Profit from 1st three single harvests = $630 - $1890 Wk 9 - Harvest Wk 3; 2nd harvest Wk 0; Clean-up & Re-seed 2nd harvest channels Wk 10 - Harvest Wk 4; 2nd harvest Wk 1; Clean-up & Re-seed 2nd harvest channels Wk 11 - Harvest Wk 5; 2nd harvest Wk 2; Clean-up & Re-seed 2nd harvest channels ***END OF 1ST CYCLE = All 42 channels harvested + (3) 2ND harvests (21 channels) TOTAL PROFIT FROM 1ST CYCLE (3 single harvests + 3 double harvests = $1890 - $5670 for 12wks) DOUBLE HARVEST SYSTEM (6wks down time + 3 single harvests + 43 double harvests = 52 wks) TOTAL ANNUAL PROFIT = $19,110 - $57330; Difference = $38,220 SINGLE HARVEST SYSTEM (6wks down time + 46 single harvests = 52 wks) TOTAL ANNUAL PROFIT = $9660 – $28,980; Difference = $19,320
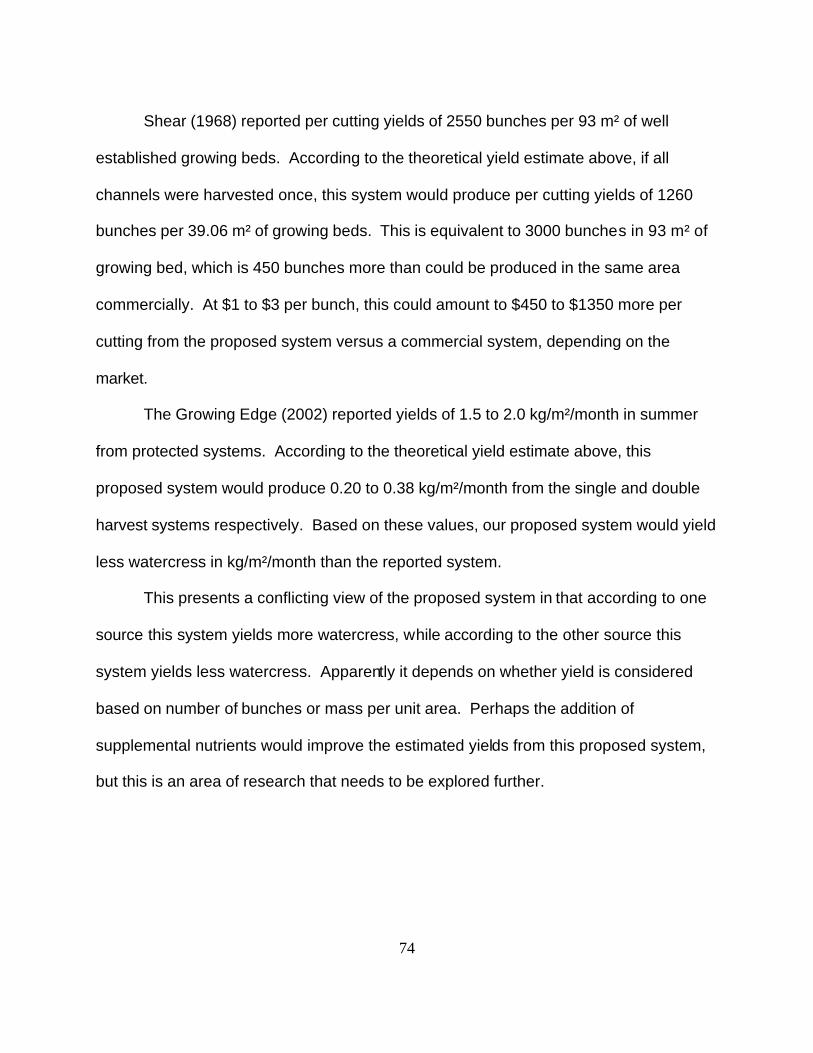
74
Shear (1968) reported per cutting yields of 2550 bunches per 93 m² of well
established growing beds. According to the theoretical yield estimate above, if all
channels were harvested once, this system would produce per cutting yields of 1260
bunches per 39.06 m² of growing beds. This is equivalent to 3000 bunches in 93 m² of
growing bed, which is 450 bunches more than could be produced in the same area
commercially. At $1 to $3 per bunch, this could amount to $450 to $1350 more per
cutting from the proposed system versus a commercial system, depending on the
market.
The Growing Edge (2002) reported yields of 1.5 to 2.0 kg/m²/month in summer
from protected systems. According to the theoretical yield estimate above, this
proposed system would produce 0.20 to 0.38 kg/m²/month from the single and double
harvest systems respectively. Based on these values, our proposed system would yield
less watercress in kg/m²/month than the reported system.
This presents a conflicting view of the proposed system in that according to one
source this system yields more watercress, while according to the other source this
system yields less watercress. Apparently it depends on whether yield is considered
based on number of bunches or mass per unit area. Perhaps the addition of
supplemental nutrients would improve the estimated yields from this proposed system,
but this is an area of research that needs to be explored further.
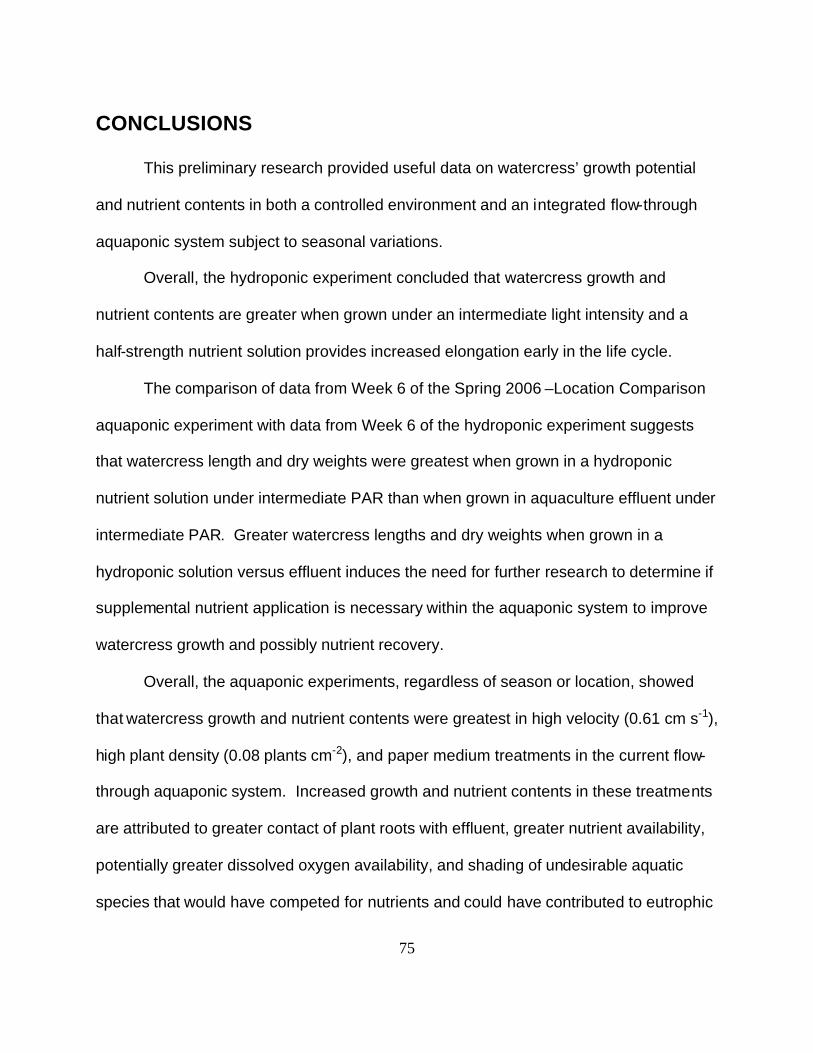
75
CONCLUSIONS
This preliminary research provided useful data on watercress’ growth potential
and nutrient contents in both a controlled environment and an integrated flow-through
aquaponic system subject to seasonal variations.
Overall, the hydroponic experiment concluded that watercress growth and
nutrient contents are greater when grown under an intermediate light intensity and a
half-strength nutrient solution provides increased elongation early in the life cycle.
The comparison of data from Week 6 of the Spring 2006 –Location Comparison
aquaponic experiment with data from Week 6 of the hydroponic experiment suggests
that watercress length and dry weights were greatest when grown in a hydroponic
nutrient solution under intermediate PAR than when grown in aquaculture effluent under
intermediate PAR. Greater watercress lengths and dry weights when grown in a
hydroponic solution versus effluent induces the need for further research to determine if
supplemental nutrient application is necessary within the aquaponic system to improve
watercress growth and possibly nutrient recovery.
Overall, the aquaponic experiments, regardless of season or location, showed
that watercress growth and nutrient contents were greatest in high velocity (0.61 cm s-1),
high plant density (0.08 plants cm-2), and paper medium treatments in the current flow-
through aquaponic system. Increased growth and nutrient contents in these treatments
are attributed to greater contact of plant roots with effluent, greater nutrient availability,
potentially greater dissolved oxygen availability, and shading of undesirable aquatic
species that would have competed for nutrients and could have contributed to eutrophic
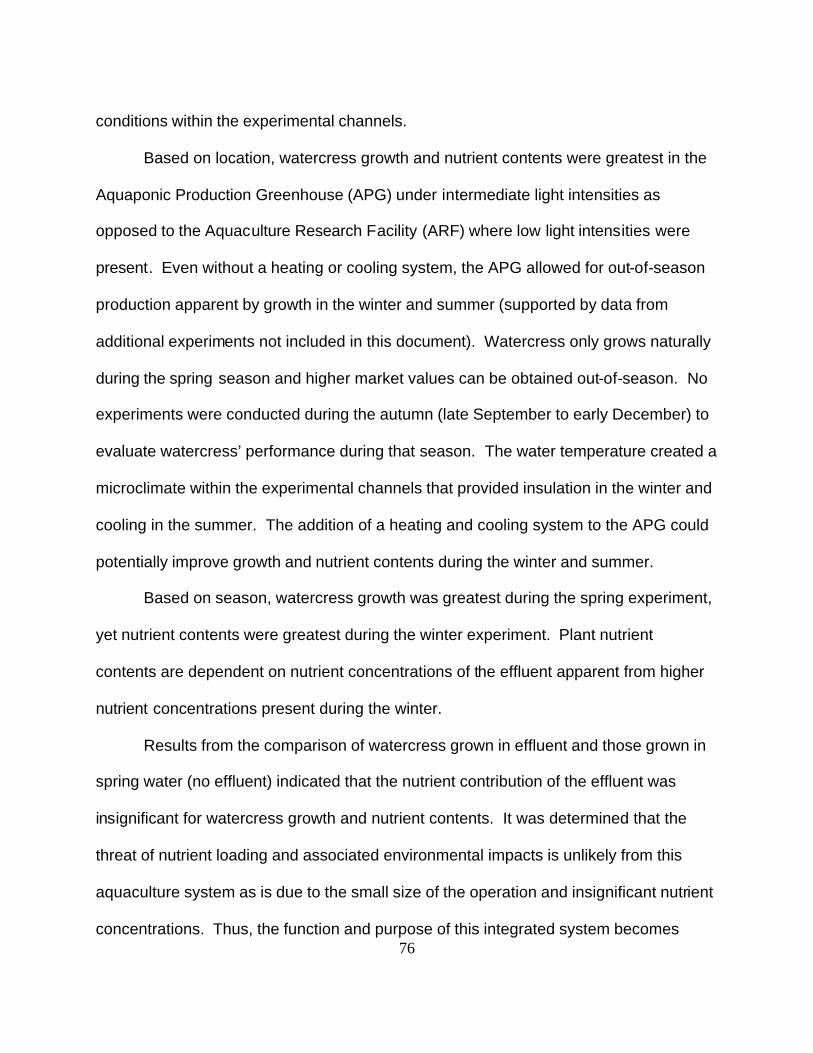
76
conditions within the experimental channels.
Based on location, watercress growth and nutrient contents were greatest in the
Aquaponic Production Greenhouse (APG) under intermediate light intensities as
opposed to the Aquaculture Research Facility (ARF) where low light intensities were
present. Even without a heating or cooling system, the APG allowed for out-of-season
production apparent by growth in the winter and summer (supported by data from
additional experiments not included in this document). Watercress only grows naturally
during the spring season and higher market values can be obtained out-of-season. No
experiments were conducted during the autumn (late September to early December) to
evaluate watercress’ performance during that season. The water temperature created a
microclimate within the experimental channels that provided insulation in the winter and
cooling in the summer. The addition of a heating and cooling system to the APG could
potentially improve growth and nutrient contents during the winter and summer.
Based on season, watercress growth was greatest during the spring experiment,
yet nutrient contents were greatest during the winter experiment. Plant nutrient
contents are dependent on nutrient concentrations of the effluent apparent from higher
nutrient concentrations present during the winter.
Results from the comparison of watercress grown in effluent and those grown in
spring water (no effluent) indicated that the nutrient contribution of the effluent was
insignificant for watercress growth and nutrient contents. It was determined that the
threat of nutrient loading and associated environmental impacts is unlikely from this
aquaculture system as is due to the small size of the operation and insignificant nutrient
concentrations. Thus, the function and purpose of this integrated system becomes
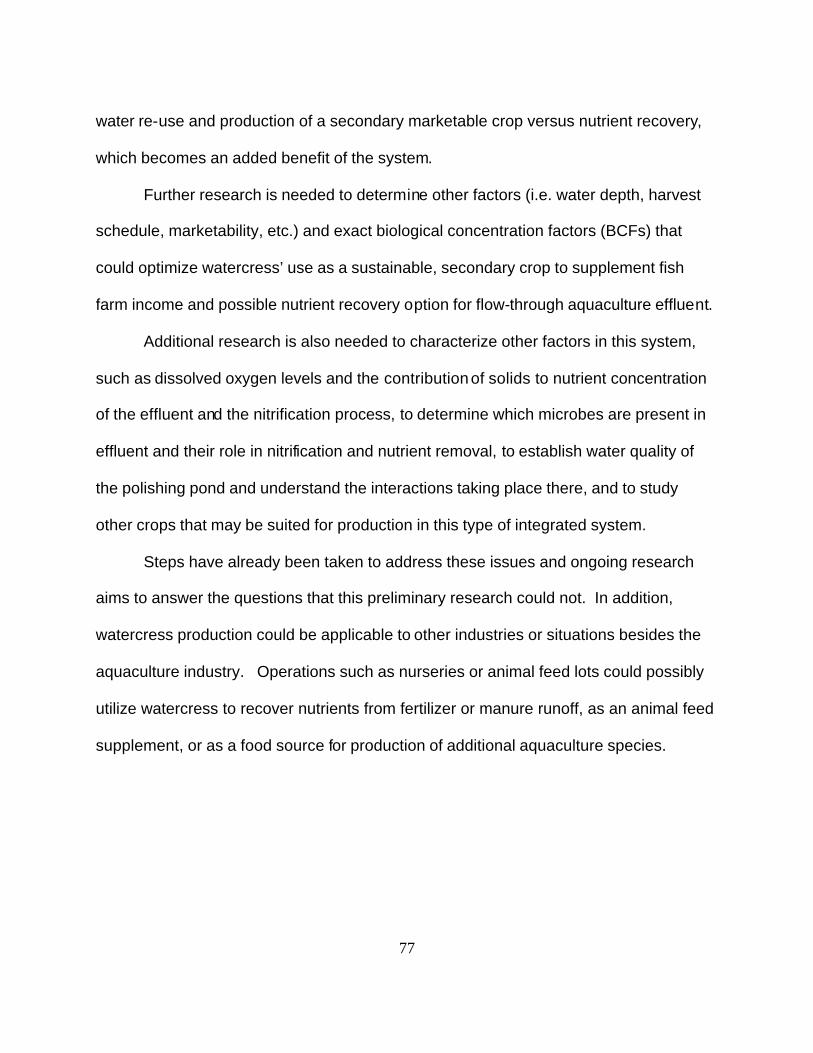
77
water re-use and production of a secondary marketable crop versus nutrient recovery,
which becomes an added benefit of the system.
Further research is needed to determine other factors (i.e. water depth, harvest
schedule, marketability, etc.) and exact biological concentration factors (BCFs) that
could optimize watercress’ use as a sustainable, secondary crop to supplement fish
farm income and possible nutrient recovery option for flow-through aquaculture effluent.
Additional research is also needed to characterize other factors in this system,
such as dissolved oxygen levels and the contribution of solids to nutrient concentration
of the effluent and the nitrification process, to determine which microbes are present in
effluent and their role in nitrification and nutrient removal, to establish water quality of
the polishing pond and understand the interactions taking place there, and to study
other crops that may be suited for production in this type of integrated system.
Steps have already been taken to address these issues and ongoing research
aims to answer the questions that this preliminary research could not. In addition,
watercress production could be applicable to other industries or situations besides the
aquaculture industry. Operations such as nurseries or animal feed lots could possibly
utilize watercress to recover nutrients from fertilizer or manure runoff, as an animal feed
supplement, or as a food source for production of additional aquaculture species.
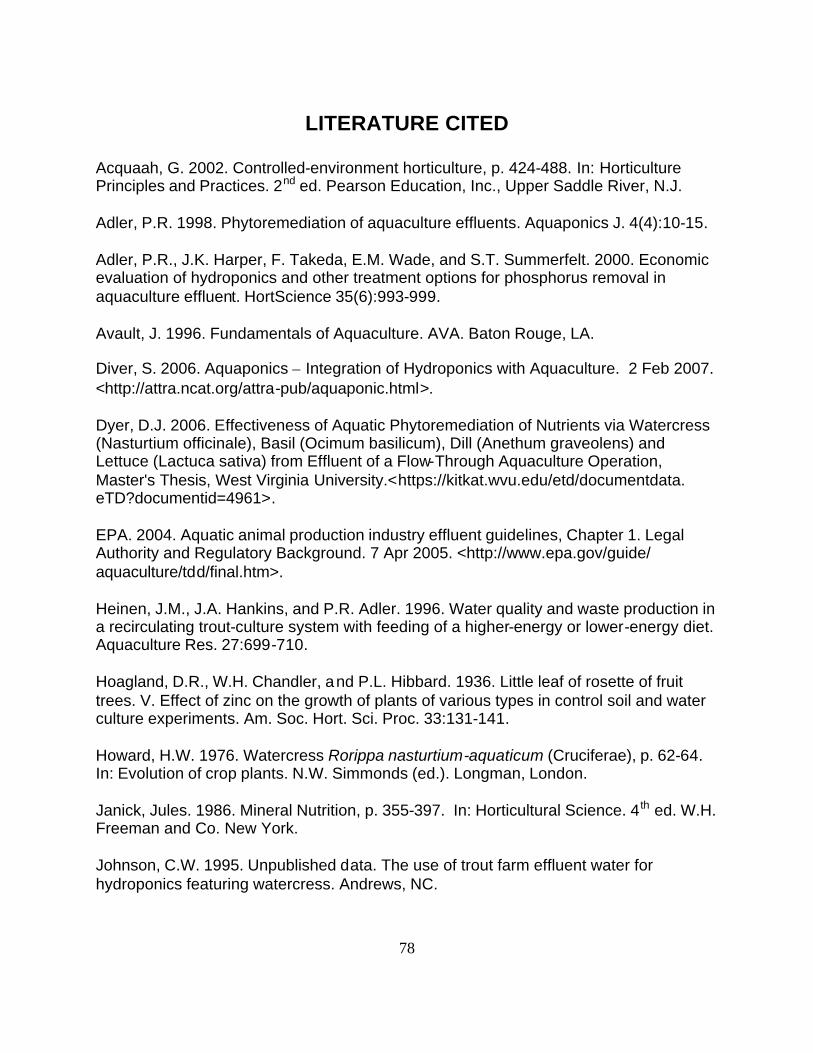
78
LITERATURE CITED
Acquaah, G. 2002. Controlled-environment horticulture, p. 424-488. In: Horticulture Principles and Practices. 2nd ed. Pearson Education, Inc., Upper Saddle River, N.J. Adler, P.R. 1998. Phytoremediation of aquaculture effluents. Aquaponics J. 4(4):10-15. Adler, P.R., J.K. Harper, F. Takeda, E.M. Wade, and S.T. Summerfelt. 2000. Economic evaluation of hydroponics and other treatment options for phosphorus removal in aquaculture effluent. HortScience 35(6):993-999. Avault, J. 1996. Fundamentals of Aquaculture. AVA. Baton Rouge, LA. Diver, S. 2006. Aquaponics – Integration of Hydroponics with Aquaculture. 2 Feb 2007. <http://attra.ncat.org/attra-pub/aquaponic.html>. Dyer, D.J. 2006. Effectiveness of Aquatic Phytoremediation of Nutrients via Watercress (Nasturtium officinale), Basil (Ocimum basilicum), Dill (Anethum graveolens) and Lettuce (Lactuca sativa) from Effluent of a Flow-Through Aquaculture Operation, Master's Thesis, West Virginia University.<https://kitkat.wvu.edu/etd/documentdata. eTD?documentid=4961>. EPA. 2004. Aquatic animal production industry effluent guidelines, Chapter 1. Legal Authority and Regulatory Background. 7 Apr 2005. <http://www.epa.gov/guide/ aquaculture/tdd/final.htm>. Heinen, J.M., J.A. Hankins, and P.R. Adler. 1996. Water quality and waste production in a recirculating trout-culture system with feeding of a higher-energy or lower-energy diet. Aquaculture Res. 27:699-710. Hoagland, D.R., W.H. Chandler, and P.L. Hibbard. 1936. Little leaf of rosette of fruit trees. V. Effect of zinc on the growth of plants of various types in control soil and water culture experiments. Am. Soc. Hort. Sci. Proc. 33:131-141. Howard, H.W. 1976. Watercress Rorippa nasturtium-aquaticum (Cruciferae), p. 62-64. In: Evolution of crop plants. N.W. Simmonds (ed.). Longman, London. Janick, Jules. 1986. Mineral Nutrition, p. 355-397. In: Horticultural Science. 4 th ed. W.H. Freeman and Co. New York. Johnson, C.W. 1995. Unpublished data. The use of trout farm effluent water for hydroponics featuring watercress. Andrews, NC.
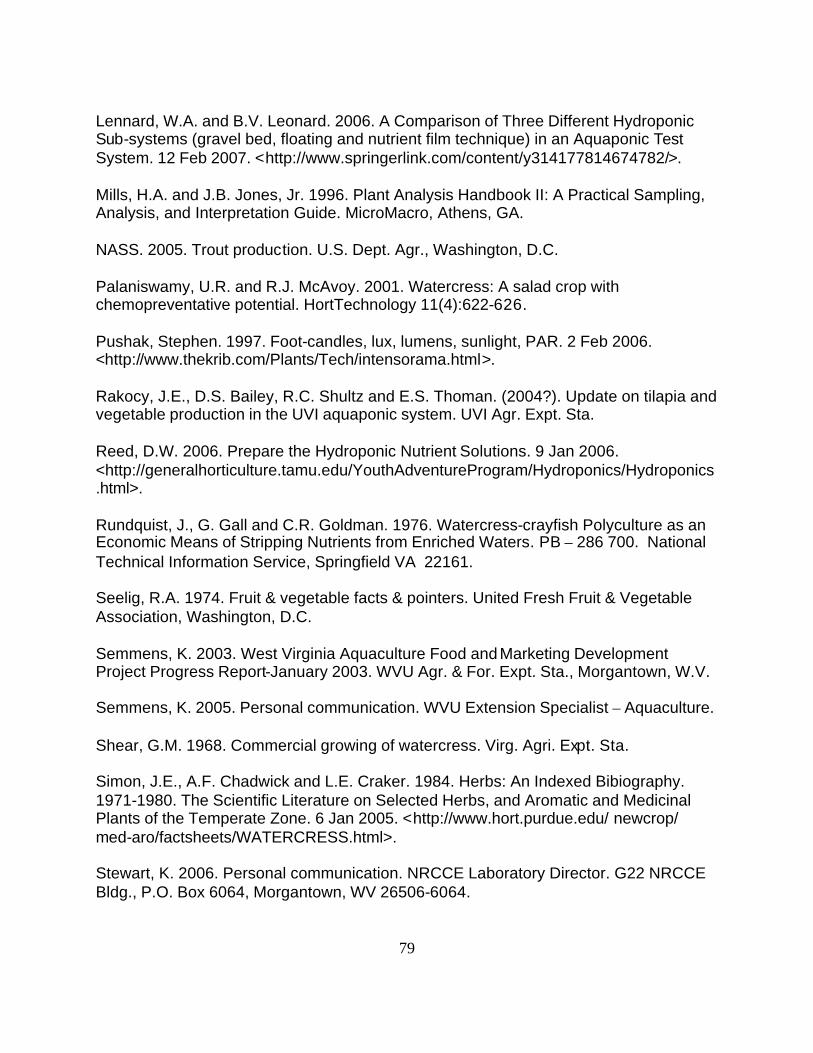
79
Lennard, W.A. and B.V. Leonard. 2006. A Comparison of Three Different Hydroponic Sub-systems (gravel bed, floating and nutrient film technique) in an Aquaponic Test System. 12 Feb 2007. <http://www.springerlink.com/content/y314177814674782/>. Mills, H.A. and J.B. Jones, Jr. 1996. Plant Analysis Handbook II: A Practical Sampling, Analysis, and Interpretation Guide. MicroMacro, Athens, GA. NASS. 2005. Trout production. U.S. Dept. Agr., Washington, D.C. Palaniswamy, U.R. and R.J. McAvoy. 2001. Watercress: A salad crop with chemopreventative potential. HortTechnology 11(4):622-626. Pushak, Stephen. 1997. Foot-candles, lux, lumens, sunlight, PAR. 2 Feb 2006. <http://www.thekrib.com/Plants/Tech/intensorama.html>. Rakocy, J.E., D.S. Bailey, R.C. Shultz and E.S. Thoman. (2004?). Update on tilapia and vegetable production in the UVI aquaponic system. UVI Agr. Expt. Sta. Reed, D.W. 2006. Prepare the Hydroponic Nutrient Solutions. 9 Jan 2006. <http://generalhorticulture.tamu.edu/YouthAdventureProgram/Hydroponics/Hydroponics.html>. Rundquist, J., G. Gall and C.R. Goldman. 1976. Watercress-crayfish Polyculture as an Economic Means of Stripping Nutrients from Enriched Waters. PB – 286 700. National Technical Information Service, Springfield VA 22161. Seelig, R.A. 1974. Fruit & vegetable facts & pointers. United Fresh Fruit & Vegetable Association, Washington, D.C. Semmens, K. 2003. West Virginia Aquaculture Food and Marketing Development Project Progress Report-January 2003. WVU Agr. & For. Expt. Sta., Morgantown, W.V. Semmens, K. 2005. Personal communication. WVU Extension Specialist – Aquaculture. Shear, G.M. 1968. Commercial growing of watercress. Virg. Agri. Expt. Sta. Simon, J.E., A.F. Chadwick and L.E. Craker. 1984. Herbs: An Indexed Bibiography. 1971-1980. The Scientific Literature on Selected Herbs, and Aromatic and Medicinal Plants of the Temperate Zone. 6 Jan 2005. <http://www.hort.purdue.edu/ newcrop/ med-aro/factsheets/WATERCRESS.html>. Stewart, K. 2006. Personal communication. NRCCE Laboratory Director. G22 NRCCE Bldg., P.O. Box 6064, Morgantown, WV 26506-6064.
80
Texas A & M University. 2004. The Dilleniidae. 1 Feb 2005. <http://www.csdl.tamu. edu/FLORA/Wilson/tfp/dil/brapage2.htm>. The Growing Edge. 2002. Hydroponic Watercress. 12 Jan 2005. <http://www. growingedge.com/community/archive/read.php3?s=yes&q=1005>. University of the Virgin Islands. Aquaponics – An integrated fish culture and vegetable hydroponics production system. 18 Jan 2005. <http://rps.uvi.edu/AES/ Aquaculture/ aquaponics.html>. Weaver, R. 2006. Personal communication. LECO Lab Technician. 3000 Lakeview Ave., St. Joseph, MI 49085. WVDEP. 2001. Antidegradation Guidance – Baseline Water Quality (BWQ) Assessment Procedures. Charleston, WV.

81
APPENDIX

82
Appendix 1. Analysis of variance for the effects of light intensity, sample date, nutrient solution, and replication for watercress length in a controlled environment Dependent Variable: Length Source of Variation DF Type III SS Mean Square F Value Pr > F Light Intensity 1 10.3228167 10.3228167 4.35 0.0426 Sample Date 2 44.5114704 22.2557352 9.38 0.0004 Nutrient Solution 2 157.1666259 78.5833130 33.13 <.0001 Replication 2 1.9662259 0.9831130 0.41 0.6632
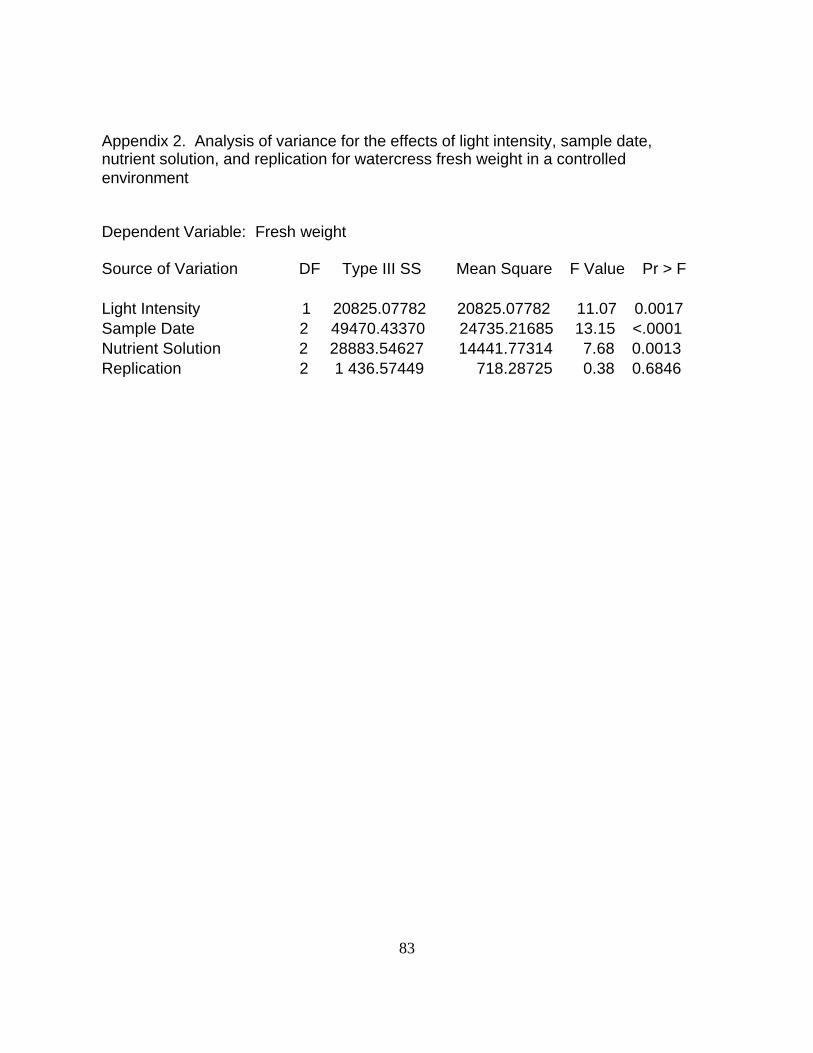
83
Appendix 2. Analysis of variance for the effects of light intensity, sample date, nutrient solution, and replication for watercress fresh weight in a controlled environment
Dependent Variable: Fresh weight
Source of Variation DF Type III SS Mean Square F Value Pr > F Light Intensity 1 20825.07782 20825.07782 11.07 0.0017 Sample Date 2 49470.43370 24735.21685 13.15 <.0001 Nutrient Solution 2 28883.54627 14441.77314 7.68 0.0013 Replication 2 1 436.57449 718.28725 0.38 0.6846
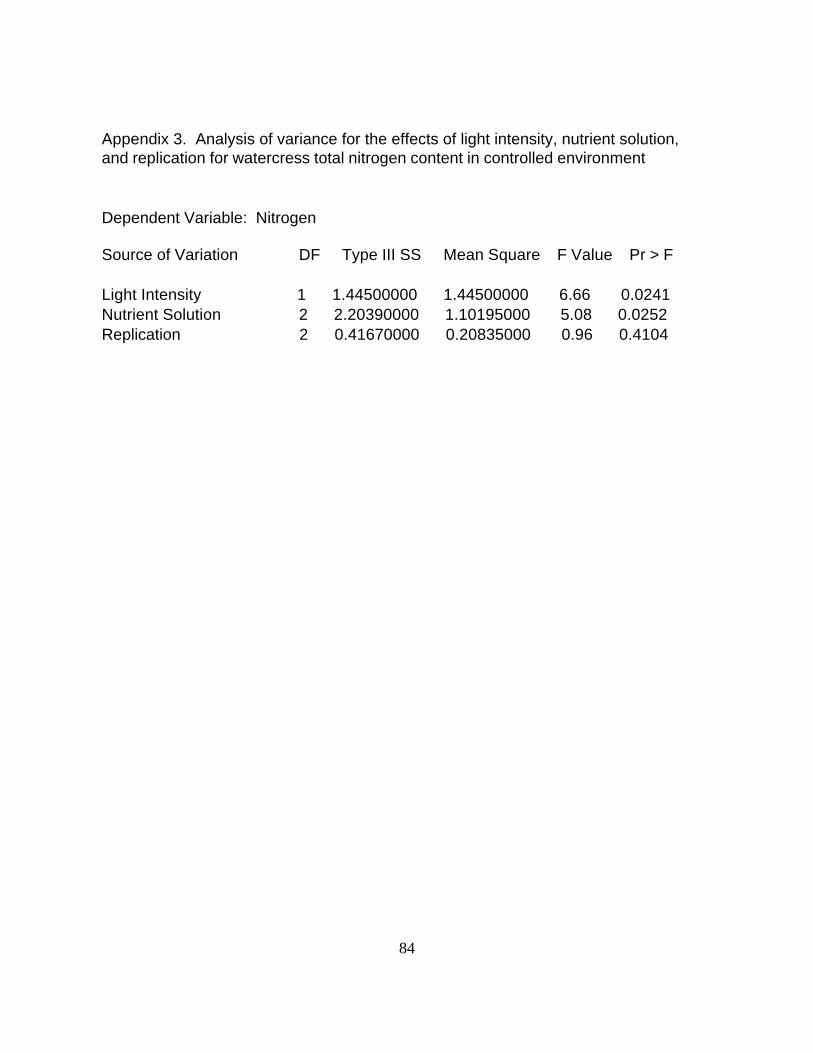
84
Appendix 3. Analysis of variance for the effects of light intensity, nutrient solution, and replication for watercress total nitrogen content in controlled environment Dependent Variable: Nitrogen
Source of Variation DF Type III SS Mean Square F Value Pr > F Light Intensity 1 1.44500000 1.44500000 6.66 0.0241 Nutrient Solution 2 2.20390000 1.10195000 5.08 0.0252 Replication 2 0.41670000 0.20835000 0.96 0.4104

85
Appendix 4. Analysis of variance for the effects of light intensity, nutrient solution, and replication for watercress total phosphorus content in a controlled environment Dependent Variable: Phosphorus
Source of Variation DF Type III SS Mean Square F Value Pr > F Light Intensity 1 0.00245000 0.00245000 0.02 0.8966 Nutrient Solution 2 1.07223333 0.53611667 3.85 0.0510 Replication 2 0.00333333 0.00166667 0.01 0.9881
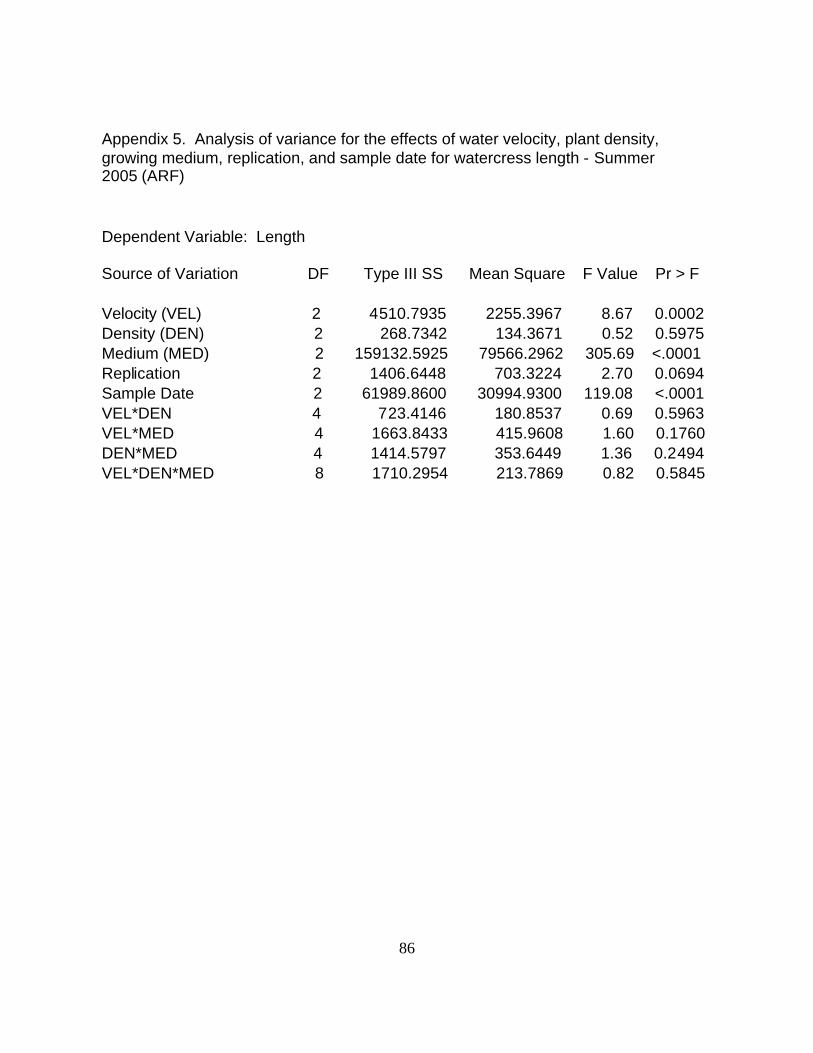
86
Appendix 5. Analysis of variance for the effects of water velocity, plant density, growing medium, replication, and sample date for watercress length - Summer 2005 (ARF) Dependent Variable: Length
Source of Variation DF Type III SS Mean Square F Value Pr > F Velocity (VEL) 2 4510.7935 2255.3967 8.67 0.0002 Density (DEN) 2 268.7342 134.3671 0.52 0.5975 Medium (MED) 2 159132.5925 79566.2962 305.69 <.0001 Replication 2 1406.6448 703.3224 2.70 0.0694 Sample Date 2 61989.8600 30994.9300 119.08 <.0001 VEL*DEN 4 723.4146 180.8537 0.69 0.5963 VEL*MED 4 1663.8433 415.9608 1.60 0.1760 DEN*MED 4 1414.5797 353.6449 1.36 0.2494 VEL*DEN*MED 8 1710.2954 213.7869 0.82 0.5845
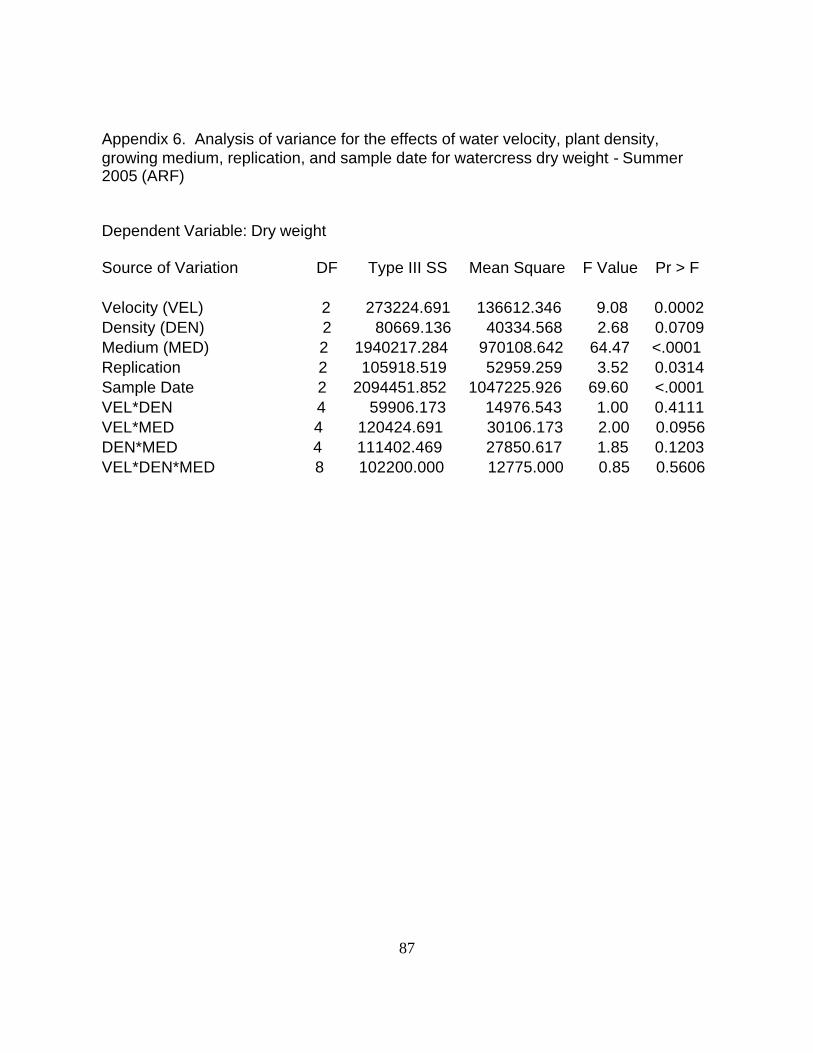
87
Appendix 6. Analysis of variance for the effects of water velocity, plant density, growing medium, replication, and sample date for watercress dry weight - Summer 2005 (ARF)
Dependent Variable: Dry weight
Source of Variation DF Type III SS Mean Square F Value Pr > F Velocity (VEL) 2 273224.691 136612.346 9.08 0.0002 Density (DEN) 2 80669.136 40334.568 2.68 0.0709 Medium (MED) 2 1940217.284 970108.642 64.47 <.0001 Replication 2 105918.519 52959.259 3.52 0.0314 Sample Date 2 2094451.852 1047225.926 69.60 <.0001 VEL*DEN 4 59906.173 14976.543 1.00 0.4111 VEL*MED 4 120424.691 30106.173 2.00 0.0956 DEN*MED 4 111402.469 27850.617 1.85 0.1203 VEL*DEN*MED 8 102200.000 12775.000 0.85 0.5606
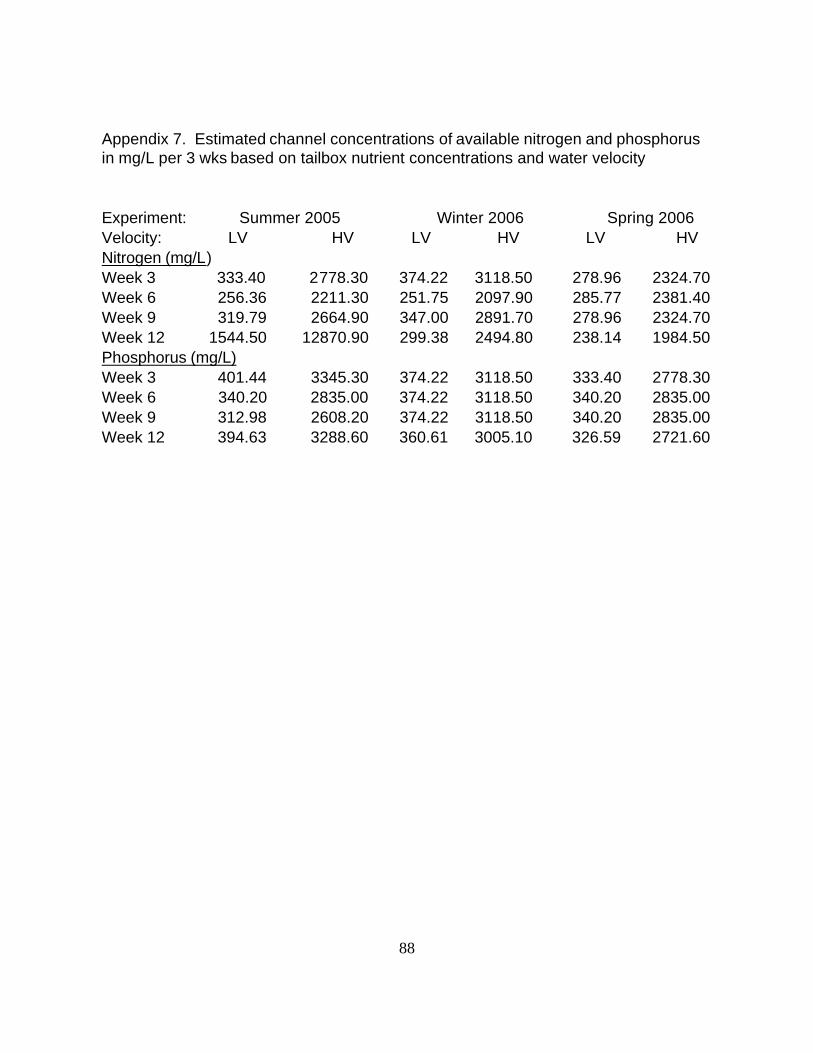
88
Appendix 7. Estimated channel concentrations of available nitrogen and phosphorus in mg/L per 3 wks based on tailbox nutrient concentrations and water velocity Experiment: Summer 2005 Winter 2006 Spring 2006 Velocity: LV HV LV HV LV HV Nitrogen (mg/L) Week 3 333.40 2778.30 374.22 3118.50 278.96 2324.70 Week 6 256.36 2211.30 251.75 2097.90 285.77 2381.40 Week 9 319.79 2664.90 347.00 2891.70 278.96 2324.70 Week 12 1544.50 12870.90 299.38 2494.80 238.14 1984.50 Phosphorus (mg/L) Week 3 401.44 3345.30 374.22 3118.50 333.40 2778.30 Week 6 340.20 2835.00 374.22 3118.50 340.20 2835.00 Week 9 312.98 2608.20 374.22 3118.50 340.20 2835.00 Week 12 394.63 3288.60 360.61 3005.10 326.59 2721.60
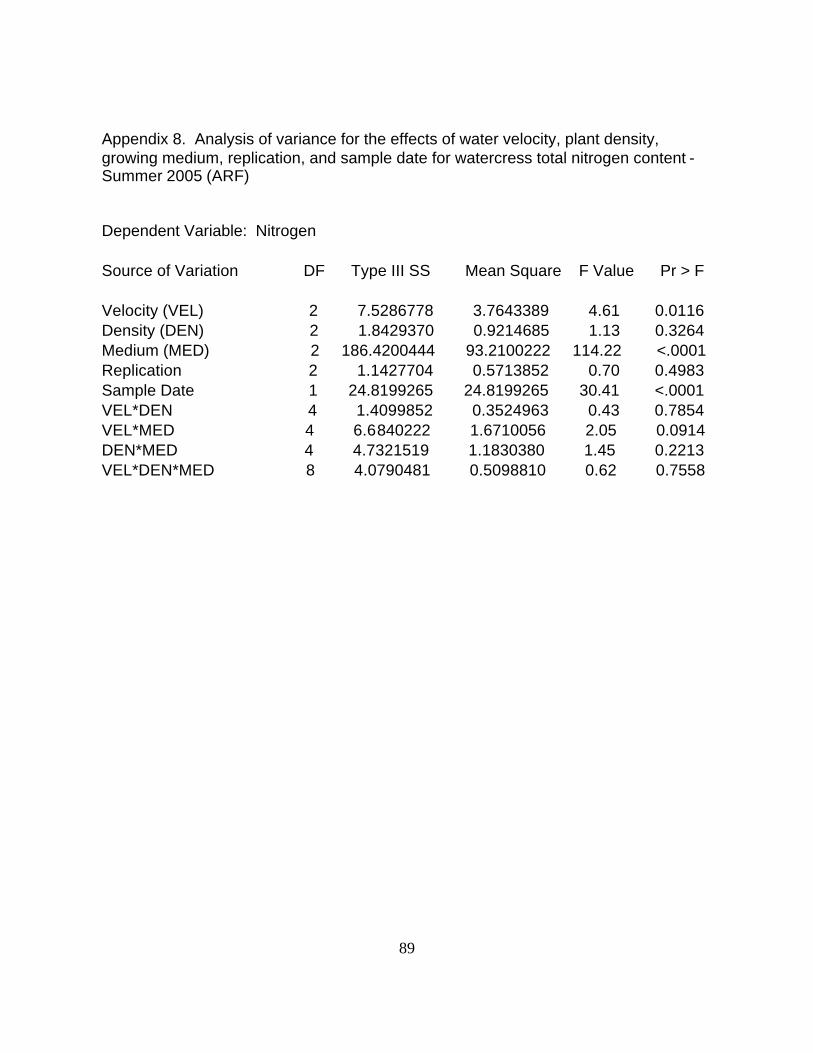
89
Appendix 8. Analysis of variance for the effects of water velocity, plant density, growing medium, replication, and sample date for watercress total nitrogen content - Summer 2005 (ARF)
Dependent Variable: Nitrogen Source of Variation DF Type III SS Mean Square F Value Pr > F Velocity (VEL) 2 7.5286778 3.7643389 4.61 0.0116 Density (DEN) 2 1.8429370 0.9214685 1.13 0.3264 Medium (MED) 2 186.4200444 93.2100222 114.22 <.0001 Replication 2 1.1427704 0.5713852 0.70 0.4983 Sample Date 1 24.8199265 24.8199265 30.41 <.0001 VEL*DEN 4 1.4099852 0.3524963 0.43 0.7854 VEL*MED 4 6.6840222 1.6710056 2.05 0.0914 DEN*MED 4 4.7321519 1.1830380 1.45 0.2213 VEL*DEN*MED 8 4.0790481 0.5098810 0.62 0.7558

90
Appendix 9. Analysis of variance for the effects of water velocity, plant density, growing medium, replication, and sample date for watercress total phosphorus content - Summer 2005 (ARF) Dependent Variable: Phosphorus Source of Variation DF Type III SS Mean Square F Value Pr > F
Velocity (VEL) 2 0.42534198 0.21267099 10.49 <.0001 Density (DEN) 2 0.02391235 0.01195617 0.59 0.5560 Medium (MED) 2 10.89474938 5.44737469 268.67 <.0001 Replication 2 0.01841605 0.00920802 0.45 0.6360 Sample Date 1 0.05013889 0.05013889 2.47 0.1182 VEL*DEN 4 0.13278395 0.03319599 1.64 0.1686 VEL*MED 4 0.37526914 0.09381728 4.63 0.0016 DEN*MED 4 0.06099877 0.01524969 0.75 0.5583 VEL*DEN*MED 8 0.03151605 0.00393951 0.19 0.9913
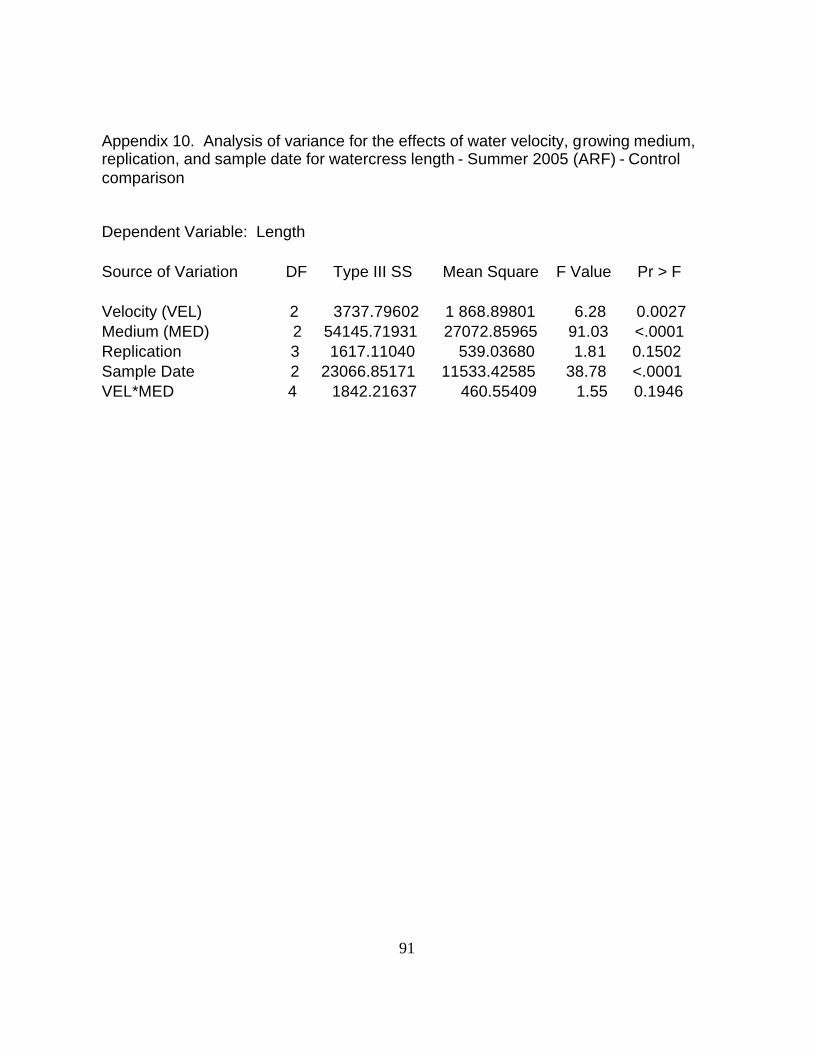
91
Appendix 10. Analysis of variance for the effects of water velocity, growing medium, replication, and sample date for watercress length - Summer 2005 (ARF) - Control comparison
Dependent Variable: Length Source of Variation DF Type III SS Mean Square F Value Pr > F Velocity (VEL) 2 3737.79602 1 868.89801 6.28 0.0027 Medium (MED) 2 54145.71931 27072.85965 91.03 <.0001 Replication 3 1617.11040 539.03680 1.81 0.1502 Sample Date 2 23066.85171 11533.42585 38.78 <.0001 VEL*MED 4 1842.21637 460.55409 1.55 0.1946
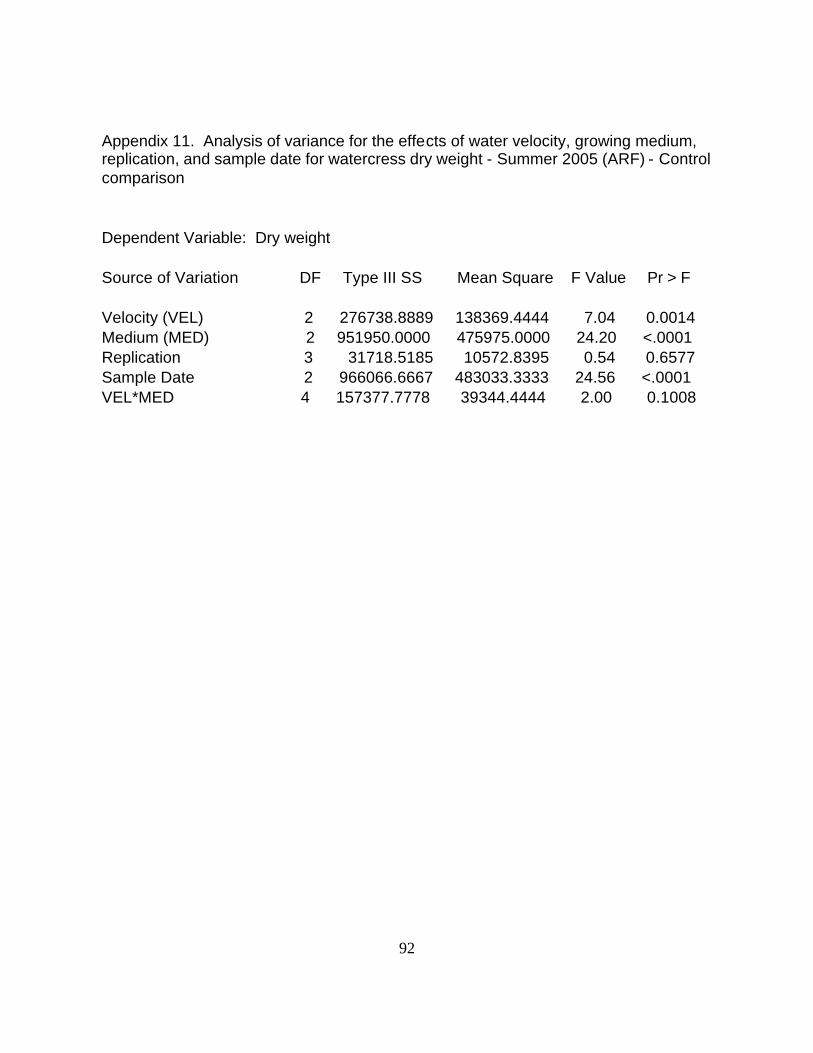
92
Appendix 11. Analysis of variance for the effects of water velocity, growing medium, replication, and sample date for watercress dry weight - Summer 2005 (ARF) - Control comparison Dependent Variable: Dry weight Source of Variation DF Type III SS Mean Square F Value Pr > F Velocity (VEL) 2 276738.8889 138369.4444 7.04 0.0014 Medium (MED) 2 951950.0000 475975.0000 24.20 <.0001 Replication 3 31718.5185 10572.8395 0.54 0.6577 Sample Date 2 966066.6667 483033.3333 24.56 <.0001 VEL*MED 4 157377.7778 39344.4444 2.00 0.1008
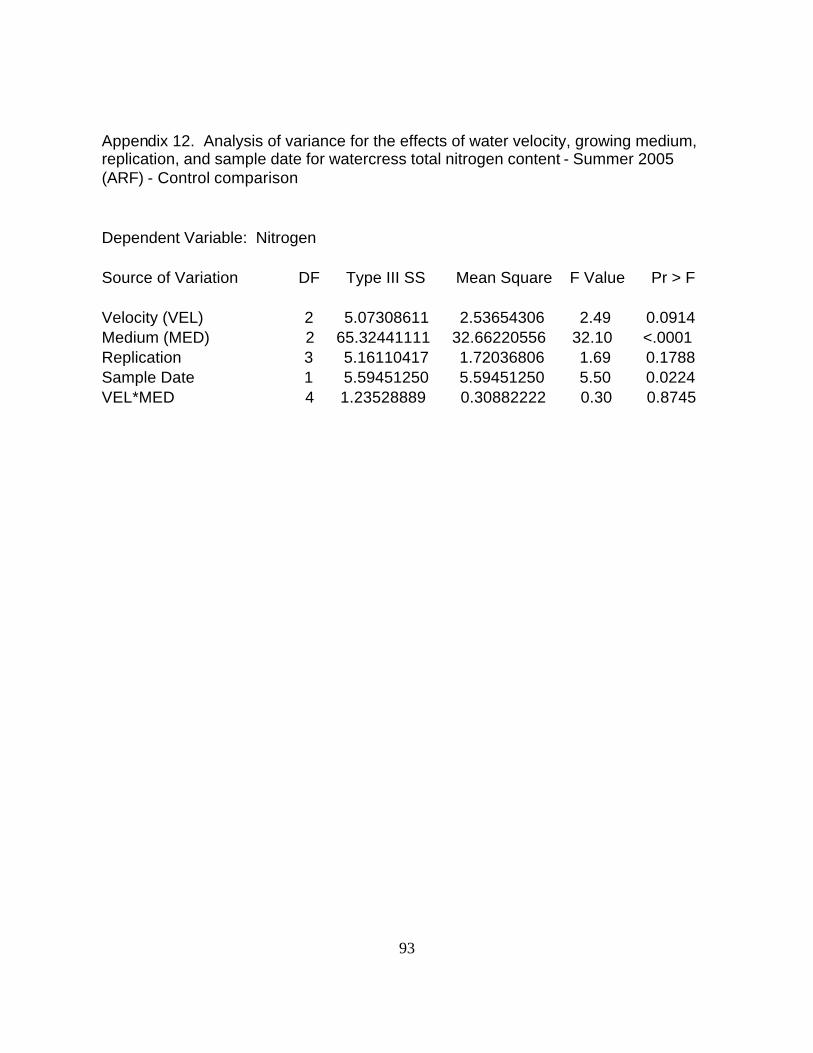
93
Appendix 12. Analysis of variance for the effects of water velocity, growing medium, replication, and sample date for watercress total nitrogen content - Summer 2005 (ARF) - Control comparison Dependent Variable: Nitrogen Source of Variation DF Type III SS Mean Square F Value Pr > F Velocity (VEL) 2 5.07308611 2.53654306 2.49 0.0914 Medium (MED) 2 65.32441111 32.66220556 32.10 <.0001 Replication 3 5.16110417 1.72036806 1.69 0.1788 Sample Date 1 5.59451250 5.59451250 5.50 0.0224 VEL*MED 4 1.23528889 0.30882222 0.30 0.8745
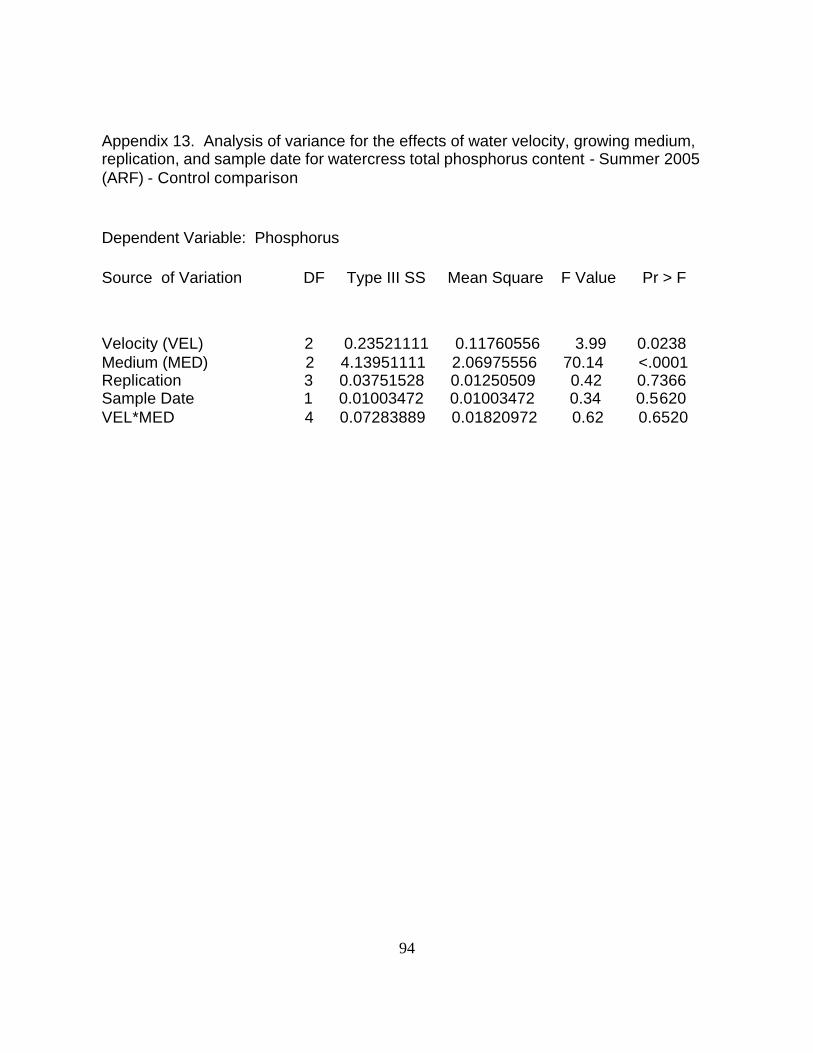
94
Appendix 13. Analysis of variance for the effects of water velocity, growing medium, replication, and sample date for watercress total phosphorus content - Summer 2005 (ARF) - Control comparison Dependent Variable: Phosphorus Source of Variation DF Type III SS Mean Square F Value Pr > F
Velocity (VEL) 2 0.23521111 0.11760556 3.99 0.0238 Medium (MED) 2 4.13951111 2.06975556 70.14 <.0001 Replication 3 0.03751528 0.01250509 0.42 0.7366 Sample Date 1 0.01003472 0.01003472 0.34 0.5620 VEL*MED 4 0.07283889 0.01820972 0.62 0.6520
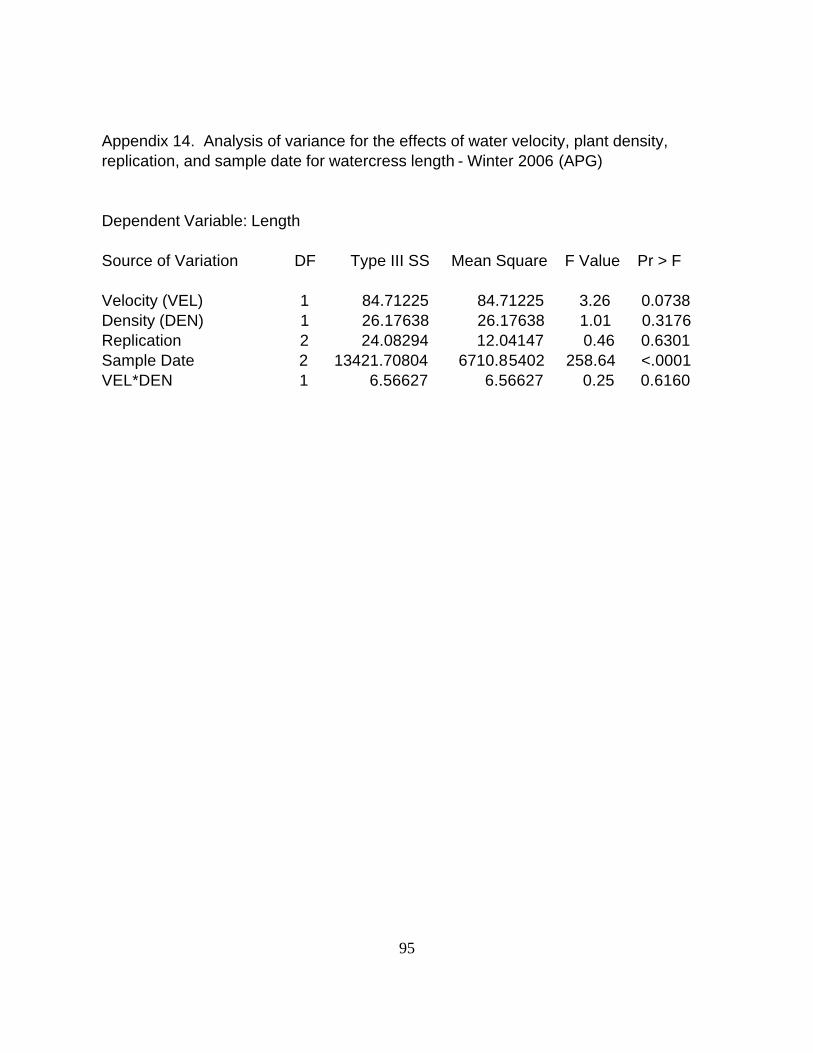
95
Appendix 14. Analysis of variance for the effects of water velocity, plant density, replication, and sample date for watercress length - Winter 2006 (APG) Dependent Variable: Length Source of Variation DF Type III SS Mean Square F Value Pr > F Velocity (VEL) 1 84.71225 84.71225 3.26 0.0738 Density (DEN) 1 26.17638 26.17638 1.01 0.3176 Replication 2 24.08294 12.04147 0.46 0.6301 Sample Date 2 13421.70804 6710.85402 258.64 <.0001 VEL*DEN 1 6.56627 6.56627 0.25 0.6160
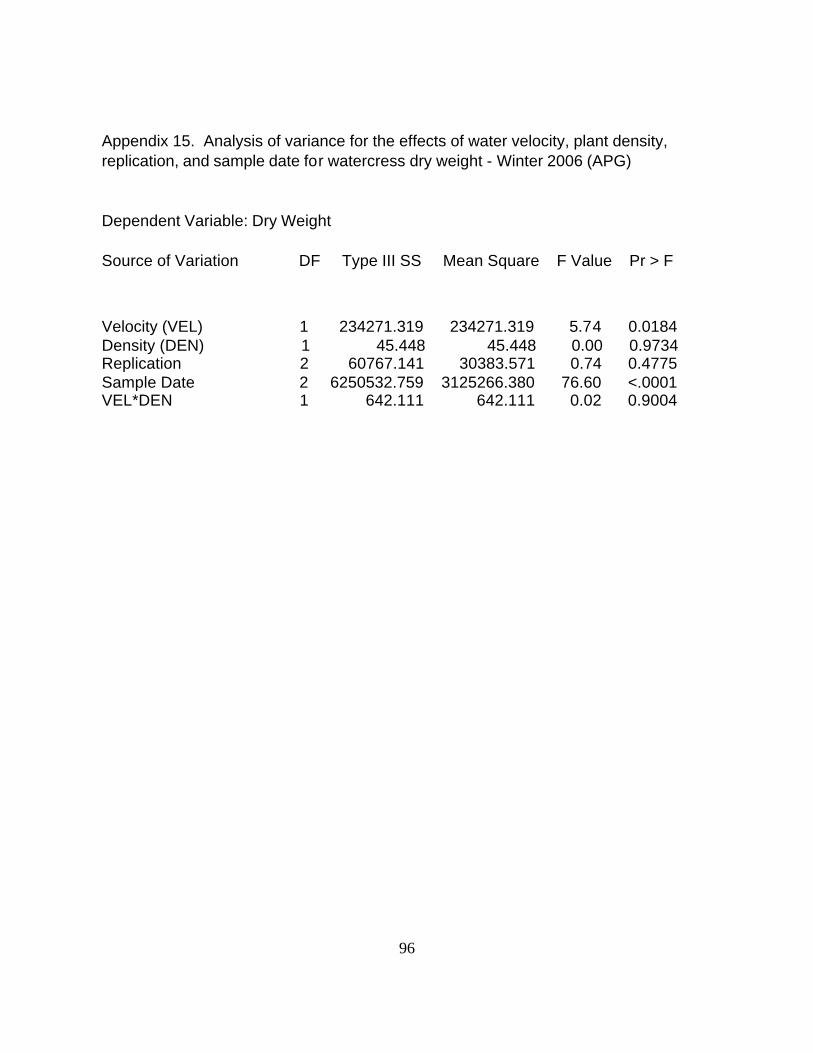
96
Appendix 15. Analysis of variance for the effects of water velocity, plant density, replication, and sample date for watercress dry weight - Winter 2006 (APG) Dependent Variable: Dry Weight Source of Variation DF Type III SS Mean Square F Value Pr > F
Velocity (VEL) 1 234271.319 234271.319 5.74 0.0184 Density (DEN) 1 45.448 45.448 0.00 0.9734 Replication 2 60767.141 30383.571 0.74 0.4775 Sample Date 2 6250532.759 3125266.380 76.60 <.0001 VEL*DEN 1 642.111 642.111 0.02 0.9004

97
Appendix 16. Analysis of variance for the effects of water velocity, plant density, replication, and sample date for watercress total nitrogen content - Winter 2006 (APG) Dependent Variable: Nitrogen Source of Variation DF Type III SS Mean Square F Value Pr > F Velocity (VEL) 1 236560251 236560251 1.36 0.2479 Density (DEN) 1 235235280 235235280 1.35 0.2492 Replication 2 135625712 67812856 0.39 0.6788 Sample Date 1 6030655488 6030655488 34.65 <.0001 VEL*DEN 1 2717558 2717558 0.02 0.9009

98
Appendix 17. Analysis of variance for the effects of water velocity, plant density, replication, and sample date for watercress total phosphorus content - Winter 2006 (APG) Dependent Variable: Phosphorus Source of Variation DF Type III SS Mean Square F Value Pr > F Velocity (VEL) 1 578888.000 578888.000 0.08 0.7756 Density (DEN) 1 2945973.556 2945973.556 0.42 0.5208 Replication 2 2722385.250 1361192.625 0.19 0.8253 Sample Date 1 962809.389 962809.389 0.14 0.7133 VEL*DEN 1 887556.056 887556.056 0.13 0.7242
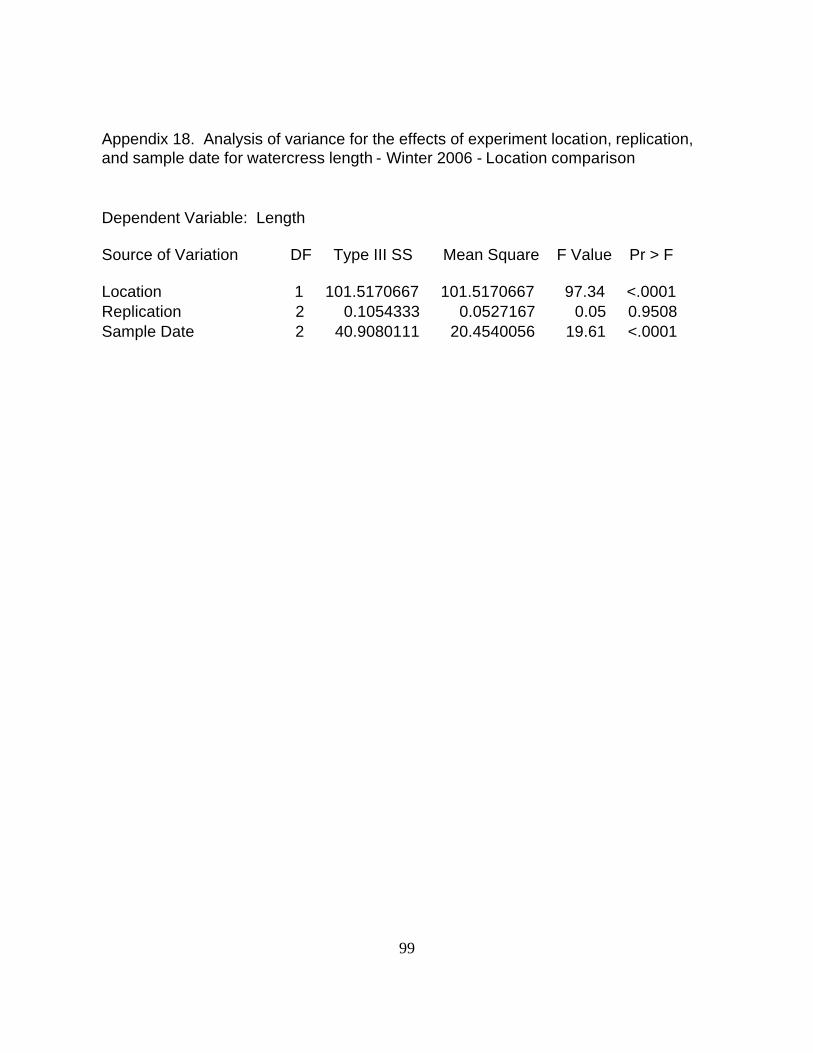
99
Appendix 18. Analysis of variance for the effects of experiment location, replication, and sample date for watercress length - Winter 2006 - Location comparison Dependent Variable: Length
Source of Variation DF Type III SS Mean Square F Value Pr > F
Location 1 101.5170667 101.5170667 97.34 <.0001 Replication 2 0.1054333 0.0527167 0.05 0.9508 Sample Date 2 40.9080111 20.4540056 19.61 <.0001

100
Appendix 19. Analysis of variance for the effects of experiment location, replication, and sample date for watercress dry weight - Winter 2006 - Location comparison Dependent Variable: Dry Weight
Source of Variation DF Type III SS Mean Square F Value Pr > F
Location 1 1515.906150 1515.906150 58.51 <.0001 Replication 2 34.762633 17.381317 0.67 0.5160 Sample Date 2 883.081411 441.540706 17.04 <.0001

101
Appendix 20. Analysis of variance for the effects of experiment location, replication, and sample date for watercress total nitrogen content - Winter 2006 - Location comparison Dependent Variable: Nitrogen
Source of Variation DF Type III SS Mean Square F Value Pr > F
Location 1 13.73937778 13.73937778 128.56 <.0001 Replication 2 0.36562222 0.18281111 1.71 0.1974 Sample Date 1 0.75111111 0.75111111 7.03 0.0125

102
Appendix 21. Analysis of variance for the effects of experiment location, replication, and sample date for watercress total phosphorus content - Winter 2006 - Location comparison Dependent Variable: Phosphorus
Source of Variation DF Type III SS Mean Square F Value Pr > F
Location 1 462959772.3 462959772.3 86.93 <.0001 Replication 2 25444863.2 12722431.6 2.39 0.1084 Sample Date 1 328520.0 328520.0 0.06 0.8055
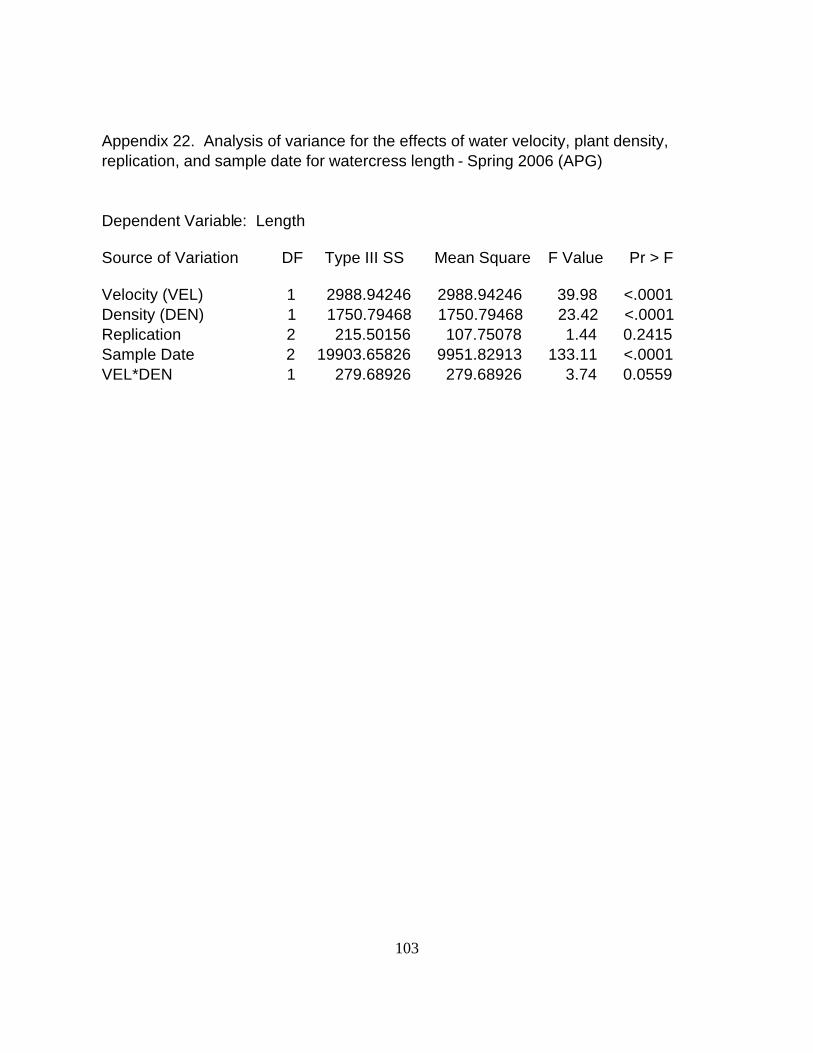
103
Appendix 22. Analysis of variance for the effects of water velocity, plant density, replication, and sample date for watercress length - Spring 2006 (APG) Dependent Variable: Length
Source of Variation DF Type III SS Mean Square F Value Pr > F
Velocity (VEL) 1 2988.94246 2988.94246 39.98 <.0001 Density (DEN) 1 1750.79468 1750.79468 23.42 <.0001 Replication 2 215.50156 107.75078 1.44 0.2415 Sample Date 2 19903.65826 9951.82913 133.11 <.0001 VEL*DEN 1 279.68926 279.68926 3.74 0.0559
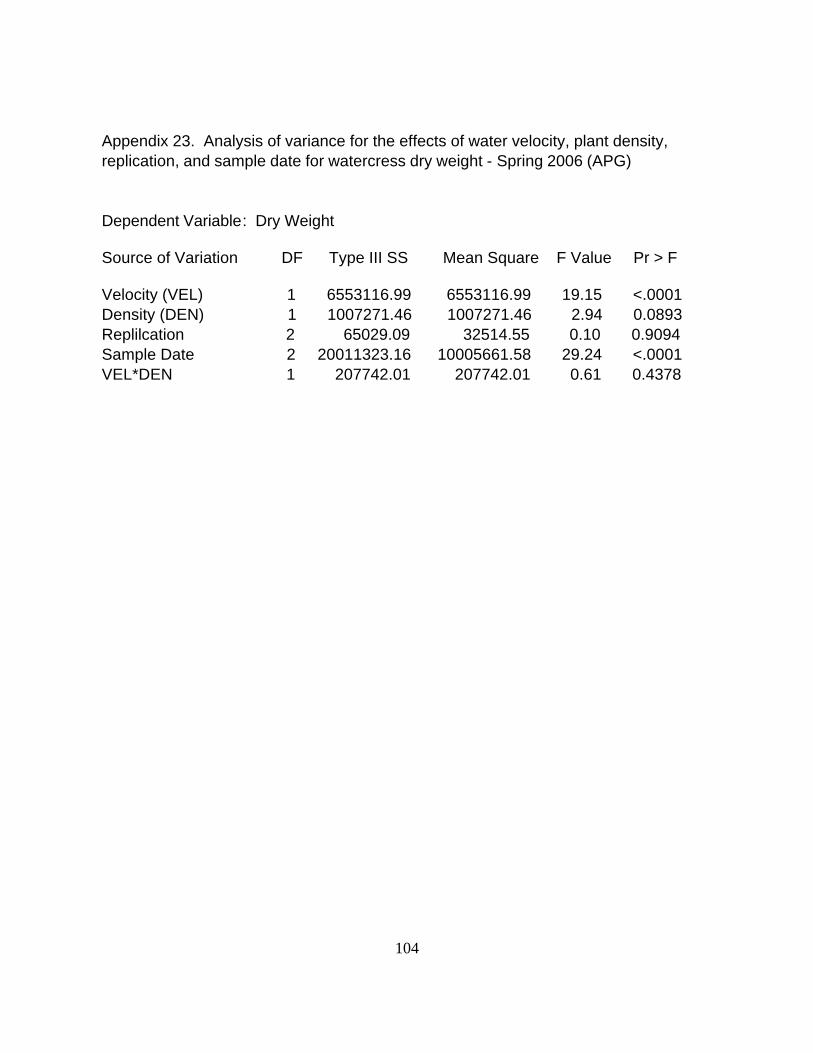
104
Appendix 23. Analysis of variance for the effects of water velocity, plant density, replication, and sample date for watercress dry weight - Spring 2006 (APG) Dependent Variable: Dry Weight
Source of Variation DF Type III SS Mean Square F Value Pr > F
Velocity (VEL) 1 6553116.99 6553116.99 19.15 <.0001 Density (DEN) 1 1007271.46 1007271.46 2.94 0.0893 Replilcation 2 65029.09 32514.55 0.10 0.9094 Sample Date 2 20011323.16 10005661.58 29.24 <.0001 VEL*DEN 1 207742.01 207742.01 0.61 0.4378
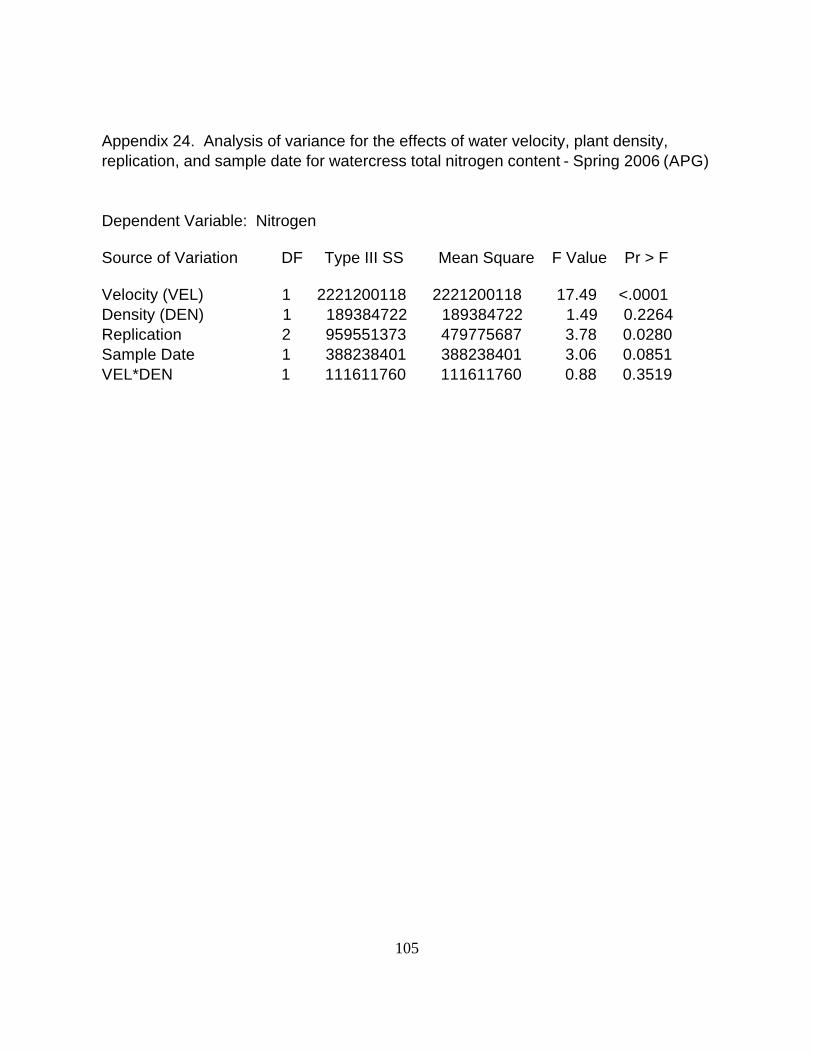
105
Appendix 24. Analysis of variance for the effects of water velocity, plant density, replication, and sample date for watercress total nitrogen content - Spring 2006 (APG) Dependent Variable: Nitrogen
Source of Variation DF Type III SS Mean Square F Value Pr > F
Velocity (VEL) 1 2221200118 2221200118 17.49 <.0001 Density (DEN) 1 189384722 189384722 1.49 0.2264 Replication 2 959551373 479775687 3.78 0.0280 Sample Date 1 388238401 388238401 3.06 0.0851 VEL*DEN 1 111611760 111611760 0.88 0.3519
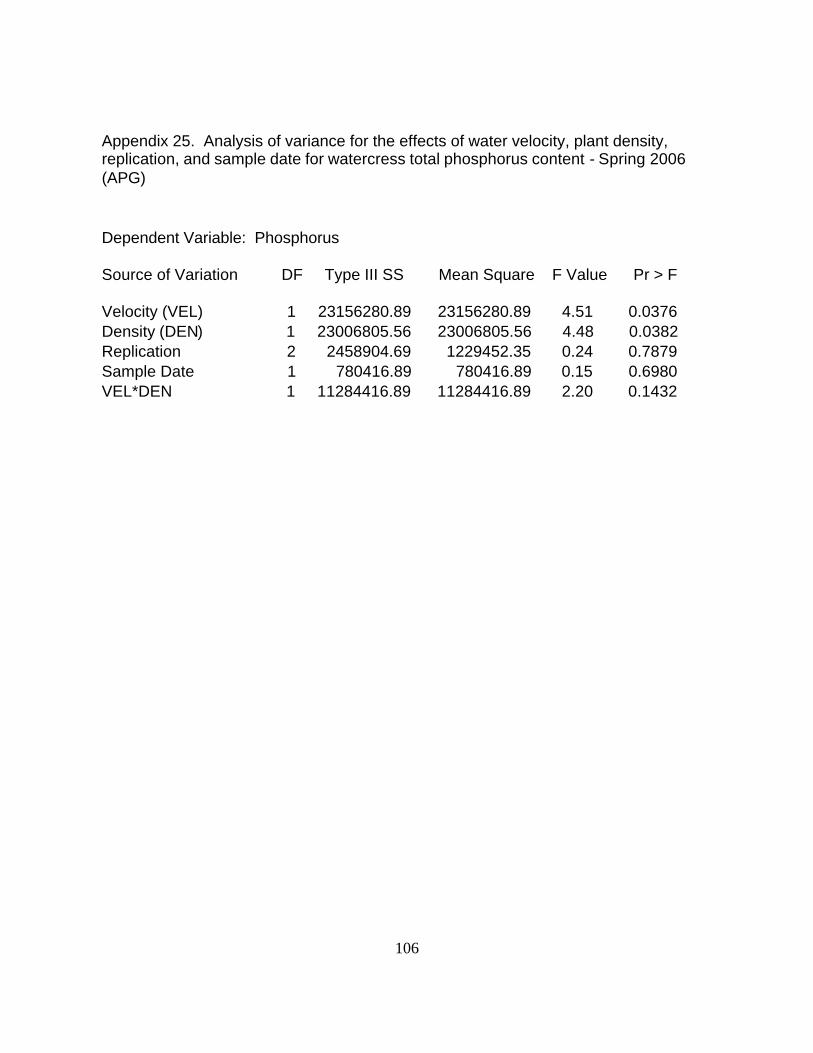
106
Appendix 25. Analysis of variance for the effects of water velocity, plant density, replication, and sample date for watercress total phosphorus content - Spring 2006 (APG) Dependent Variable: Phosphorus
Source of Variation DF Type III SS Mean Square F Value Pr > F
Velocity (VEL) 1 23156280.89 23156280.89 4.51 0.0376 Density (DEN) 1 23006805.56 23006805.56 4.48 0.0382 Replication 2 2458904.69 1229452.35 0.24 0.7879 Sample Date 1 780416.89 780416.89 0.15 0.6980 VEL*DEN 1 11284416.89 11284416.89 2.20 0.1432

107
Appendix 26. Analysis of variance for the effects of experiment location, replication, and sample date for watercress length - Spring 2006 - Location comparison Dependent Variable: Length
Source of Variation DF Type III SS Mean Square F Value Pr > F
Location 1 16.66667 16.66667 0.40 0.5291 Replication 2 121.22416 60.61208 1.46 0.2420 Sample Date 2 13996.19416 6998.09708 168.76 <.0001

108
Appendix 27. Analysis of variance for the effects of experiment location, replication, and sample date for watercress dry weight - Spring 2006 - Location comparison Dependent Variable: Dry Weight
Source of Variation DF Type III SS Mean Square F Value Pr > F
Location 1 262272.7399 262272.7399 18.40 <.0001 Replication 2 27592.0798 13796.0399 0.97 0.3871 Sample Date 2 545671.3058 272835.6529 19.15 <.0001

109
Appendix 28. Analysis of variance for the effects of experiment location, replication, and sample date for watercress total nitrogen content - Spring 2006 - Location comparison Dependent Variable: Nitrogen
Source of Variation DF Type III SS Mean Square F Value Pr > F
Location 1 3.45340278 3.45340278 42.63 <.0001 Replication 2 0.04602222 0.02301111 0.28 0.7547 Sample Date 1 0.33446944 0.33446944 4.13 0.0508
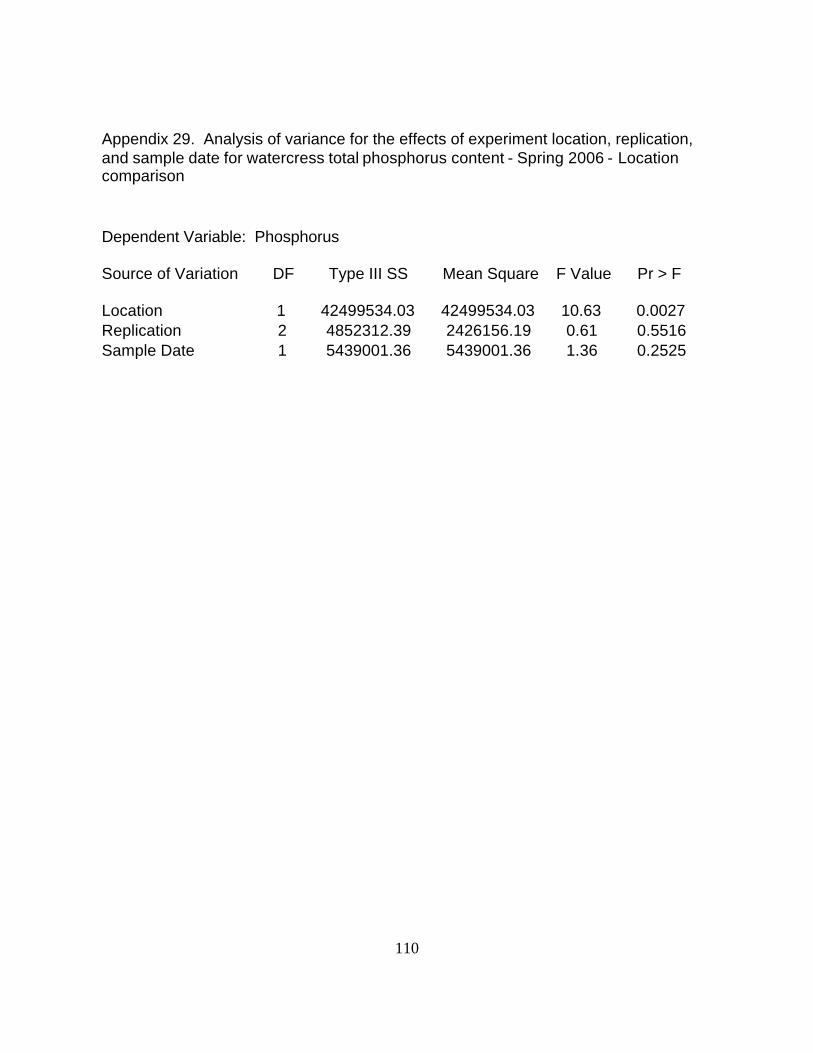
110
Appendix 29. Analysis of variance for the effects of experiment location, replication, and sample date for watercress total phosphorus content - Spring 2006 - Location comparison Dependent Variable: Phosphorus
Source of Variation DF Type III SS Mean Square F Value Pr > F
Location 1 42499534.03 42499534.03 10.63 0.0027 Replication 2 4852312.39 2426156.19 0.61 0.5516 Sample Date 1 5439001.36 5439001.36 1.36 0.2525
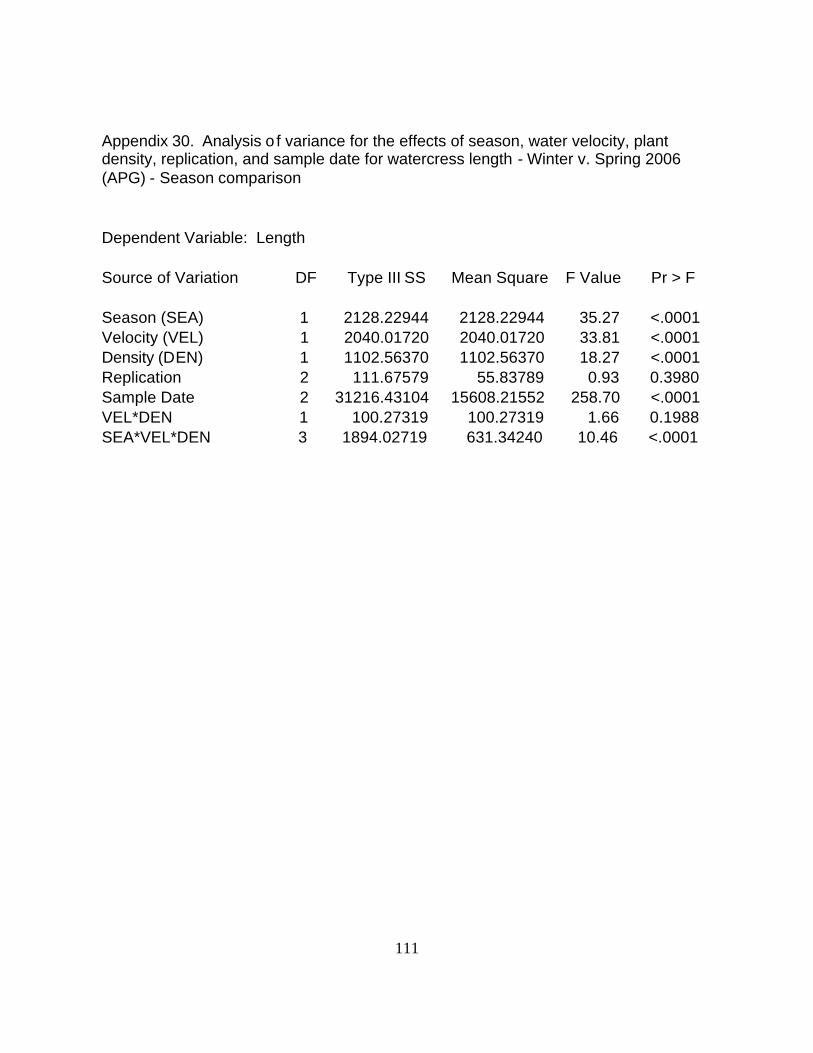
111
Appendix 30. Analysis o f variance for the effects of season, water velocity, plant density, replication, and sample date for watercress length - Winter v. Spring 2006 (APG) - Season comparison Dependent Variable: Length Source of Variation DF Type III SS Mean Square F Value Pr > F Season (SEA) 1 2128.22944 2128.22944 35.27 <.0001 Velocity (VEL) 1 2040.01720 2040.01720 33.81 <.0001 Density (DEN) 1 1102.56370 1102.56370 18.27 <.0001 Replication 2 111.67579 55.83789 0.93 0.3980 Sample Date 2 31216.43104 15608.21552 258.70 <.0001 VEL*DEN 1 100.27319 100.27319 1.66 0.1988 SEA*VEL*DEN 3 1894.02719 631.34240 10.46 <.0001

112
Appendix 31. Analysis of variance for the effects of season, water velocity, plant density, replication, and sample date for watercress dry weight - Winter v. Spring 2006 - season comparison Dependent Variable: Dry weight Source of Variation DF Type III SS Mean Square F Value Pr > F Season (SEA) 1 740458.43 740458.43 3.71 0.0553 Velocity (VEL) 1 4632729.00 4632729.00 23.24 <.0001 Density (DEN) 1 510424.44 510424.44 2.56 0.1111 Replication 2 1198.39 599.20 0.00 0.9970 Sample Date 2 24023890.03 12011945.02 60.26 <.0001 VEL*DEN 1 115741.67 115741.67 0.58 0.4470 SEA*VEL*DEN 3 2744194.22 914731.41 4.59 0.0039
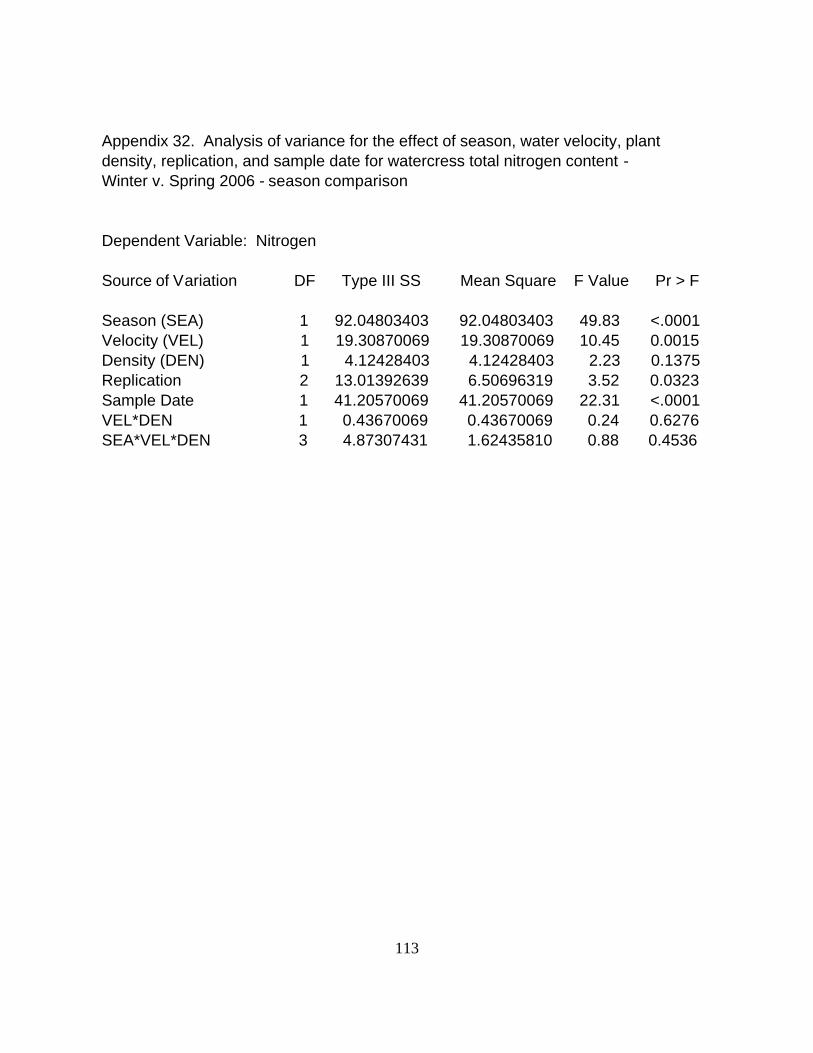
113
Appendix 32. Analysis of variance for the effect of season, water velocity, plant density, replication, and sample date for watercress total nitrogen content - Winter v. Spring 2006 - season comparison Dependent Variable: Nitrogen Source of Variation DF Type III SS Mean Square F Value Pr > F Season (SEA) 1 92.04803403 92.04803403 49.83 <.0001 Velocity (VEL) 1 19.30870069 19.30870069 10.45 0.0015 Density (DEN) 1 4.12428403 4.12428403 2.23 0.1375 Replication 2 13.01392639 6.50696319 3.52 0.0323 Sample Date 1 41.20570069 41.20570069 22.31 <.0001 VEL*DEN 1 0.43670069 0.43670069 0.24 0.6276 SEA*VEL*DEN 3 4.87307431 1.62435810 0.88 0.4536

114
Appendix 33. Analysis of Variance for the effects of season, water velocity, plant density, replication, and sample date for watercress total phosphorus content - Winter v. Spring 2006 - season comparison Dependent Variable: Phosphorus Source of Variation DF Type III SS Mean Square F Value Pr > F Season (SEA) 1 4.20933611 4.20933611 123.51 <.0001 Velocity (VEL) 1 0.32871111 0.32871111 9.64 0.0023 Density (DEN) 1 0.14951111 0.14951111 4.39 0.0381 Replication 2 0.02987639 0.01493819 0.44 0.6461 Sample Date 1 0.14694444 0.14694444 4.31 0.0398 VEL*DEN 1 0.06934444 0.06934444 2.03 0.1561 SEA*VEL*DEN 3 0.07565278 0.02521759 0.74 0.5301
115
CURRICULUM VITAE
Graduate School West Virginia University
E. Nichole Smith Date of Birth: December 8, 1978 1124 Bakers Ridge Rd., Morgantown, WV 26508 West Virginia University Bachelor of Science, Environmental Protection Bachelor of Science, Horticulture May, 2002 Thesis Title: Watercress (Nasturtium officinale) Production Utilizing Brook Trout (Salvelinus fontinalis) Flow-through Aquaculture Effluent Major Professor: Dr. Todd P. West