Embed Size (px)
Citation preview
Diversion Memo
Water Division IV
District 10

Green River Basin, Wyoming; Key Structures and DiversionsDescription and Operation Memorandum
Ada Ditch, Green River
Diversion Memo Division IV District 10
Diversion Description: Information not available at time of report.
Diversion Location:Source: Green RiverSection, Township, Range: 15, 33, 110
Conveyance Description: Open Channel Canal.
Wyoming Water Rights Summary:
Priority Date(M–D–Y)
PermitNumber
PermittedUse Acres Flow
(cfs)CumulativeFlow (cfs) Comments
11-18-1899 2372 Irrigation 490.00 7.00 7.00
06-03-1907 1719E Irrigation 62.00 0.88 7.88
08-03-1908 1942E Irrigation 227.00 3.24 11.12
Storage Rights: None.
Estimated Canal Losses: Information not available at time of report.
Irrigation Practices: Information not available at time of report.
Crop Types / Consumptive Use: Information not available at time of report.
Return Flows: Return flows are delivered to Green River near Hill Ditch1
Other Operational Information: Information not available at time of report.
Sources: 1) Williams, Linda I., “A Model of the Green River Using the Wyoming Integrated River SystemOperation Study (WIRSOS),” M.S. Thesis, University of Wyoming, Department of Civil Engineering,December 1995.
Green River Basin, Wyoming; Key Structures and DiversionsDescription and Operation Memorandum
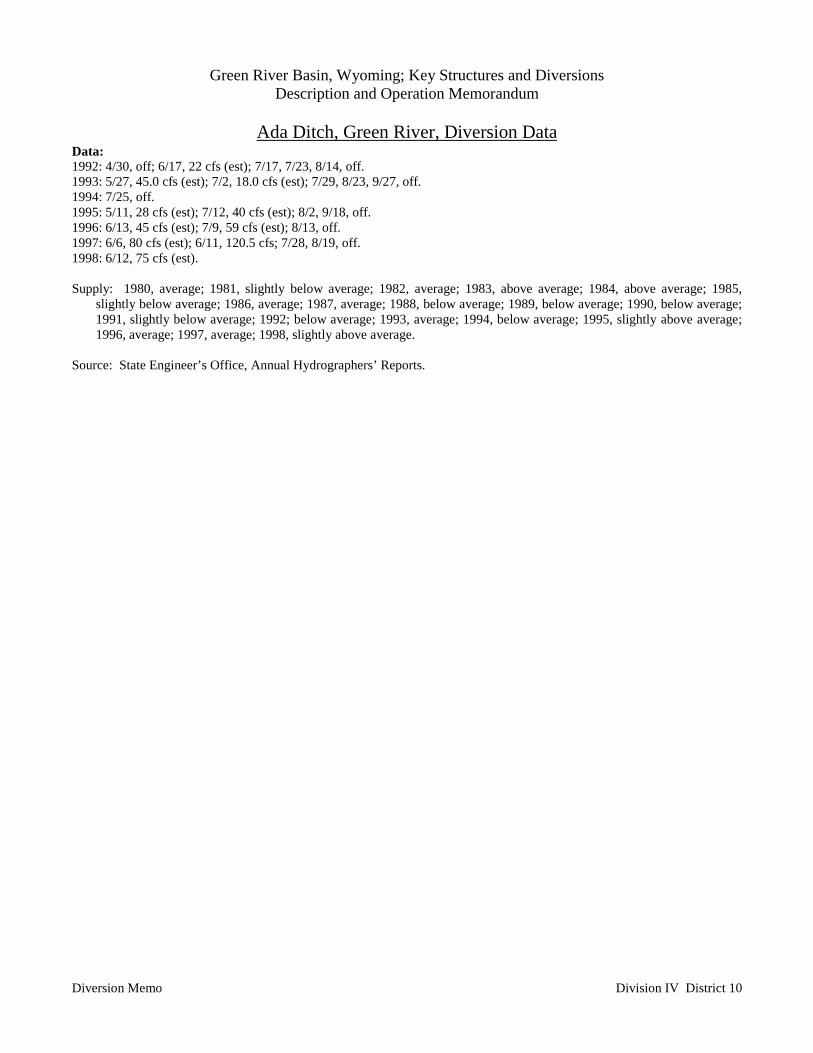
Ada Ditch, Green River, Diversion Data
Diversion Memo Division IV District 10
Data:1992: 4/30, off; 6/17, 22 cfs (est); 7/17, 7/23, 8/14, off.1993: 5/27, 45.0 cfs (est); 7/2, 18.0 cfs (est); 7/29, 8/23, 9/27, off.1994: 7/25, off.1995: 5/11, 28 cfs (est); 7/12, 40 cfs (est); 8/2, 9/18, off.1996: 6/13, 45 cfs (est); 7/9, 59 cfs (est); 8/13, off.1997: 6/6, 80 cfs (est); 6/11, 120.5 cfs; 7/28, 8/19, off.1998: 6/12, 75 cfs (est).
Supply: 1980, average; 1981, slightly below average; 1982, average; 1983, above average; 1984, above average; 1985,slightly below average; 1986, average; 1987, average; 1988, below average; 1989, below average; 1990, below average;1991, slightly below average; 1992; below average; 1993, average; 1994, below average; 1995, slightly above average;1996, average; 1997, average; 1998, slightly above average.
Source: State Engineer’s Office, Annual Hydrographers’ Reports.
Green River Basin, Wyoming; Key Structures and DiversionsDescription and Operation Memorandum
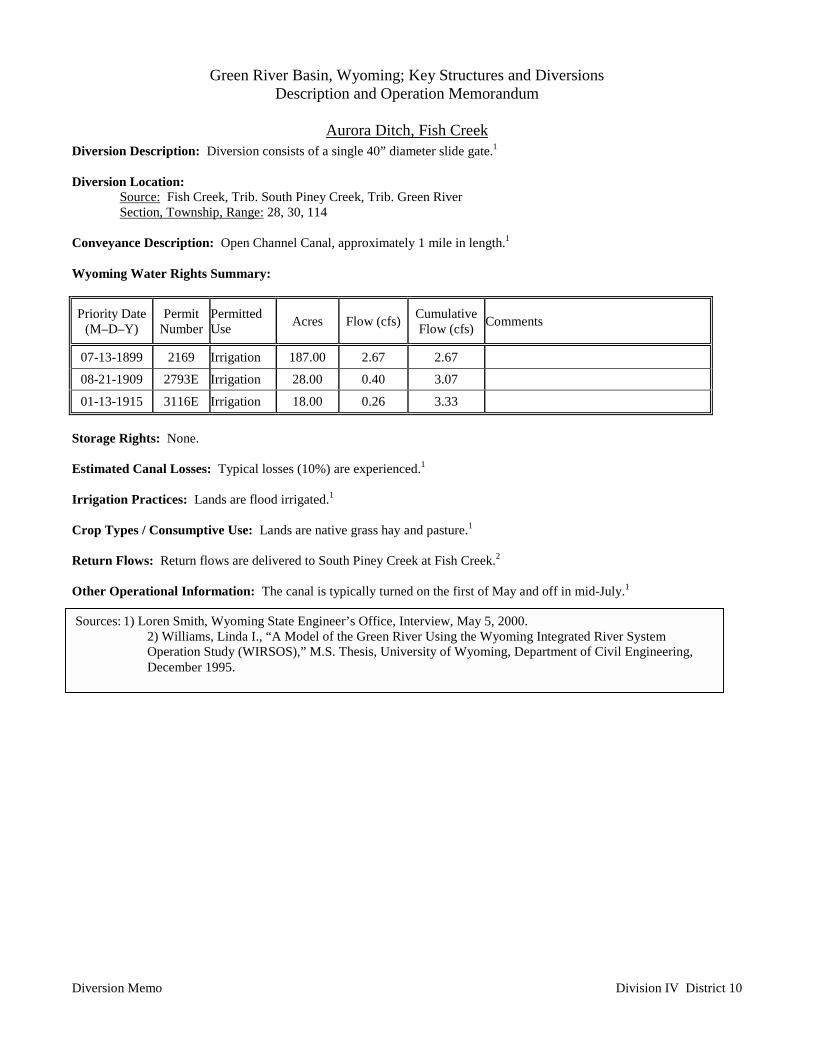
Aurora Ditch, Fish Creek
Diversion Memo Division IV District 10
Diversion Description: Diversion consists of a single 40” diameter slide gate.1
Diversion Location:Source: Fish Creek, Trib. South Piney Creek, Trib. Green RiverSection, Township, Range: 28, 30, 114
Conveyance Description: Open Channel Canal, approximately 1 mile in length.1
Wyoming Water Rights Summary:
Priority Date(M–D–Y)
PermitNumber
PermittedUse Acres Flow (cfs) Cumulative
Flow (cfs) Comments
07-13-1899 2169 Irrigation 187.00 2.67 2.67
08-21-1909 2793E Irrigation 28.00 0.40 3.07
01-13-1915 3116E Irrigation 18.00 0.26 3.33
Storage Rights: None.
Estimated Canal Losses: Typical losses (10%) are experienced.1
Irrigation Practices: Lands are flood irrigated.1
Crop Types / Consumptive Use: Lands are native grass hay and pasture.1
Return Flows: Return flows are delivered to South Piney Creek at Fish Creek.2
Other Operational Information: The canal is typically turned on the first of May and off in mid-July.1
Sources: 1) Loren Smith, Wyoming State Engineer’s Office, Interview, May 5, 2000.2) Williams, Linda I., “A Model of the Green River Using the Wyoming Integrated River SystemOperation Study (WIRSOS),” M.S. Thesis, University of Wyoming, Department of Civil Engineering,December 1995.
Green River Basin, Wyoming; Key Structures and DiversionsDescription and Operation Memorandum
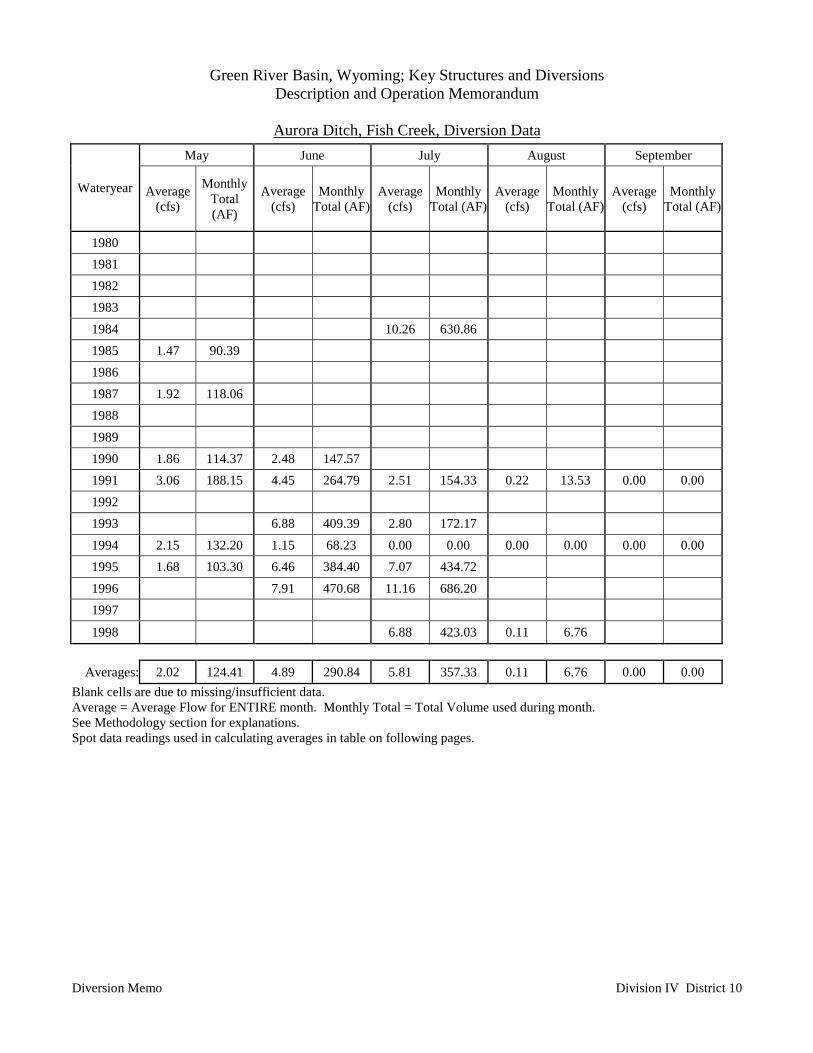
Aurora Ditch, Fish Creek, Diversion Data
Diversion Memo Division IV District 10
May June July August September
Wateryear Average(cfs)
MonthlyTotal(AF)
Average(cfs)
MonthlyTotal (AF)
Average(cfs)
MonthlyTotal (AF)
Average(cfs)
MonthlyTotal (AF)
Average(cfs)
MonthlyTotal (AF)
1980 1981 1982 1983 1984 10.26 630.86 1985 1.47 90.39 1986 1987 1.92 118.06 1988 1989 1990 1.86 114.37 2.48 147.57 1991 3.06 188.15 4.45 264.79 2.51 154.33 0.22 13.53 0.00 0.001992 1993 6.88 409.39 2.80 172.17 1994 2.15 132.20 1.15 68.23 0.00 0.00 0.00 0.00 0.00 0.001995 1.68 103.30 6.46 384.40 7.07 434.72 1996 7.91 470.68 11.16 686.20 1997
1998 6.88 423.03 0.11 6.76
Averages: 2.02 124.41 4.89 290.84 5.81 357.33 0.11 6.76 0.00 0.00Blank cells are due to missing/insufficient data.Average = Average Flow for ENTIRE month. Monthly Total = Total Volume used during month.See Methodology section for explanations.Spot data readings used in calculating averages in table on following pages.
Green River Basin, Wyoming; Key Structures and DiversionsDescription and Operation Memorandum
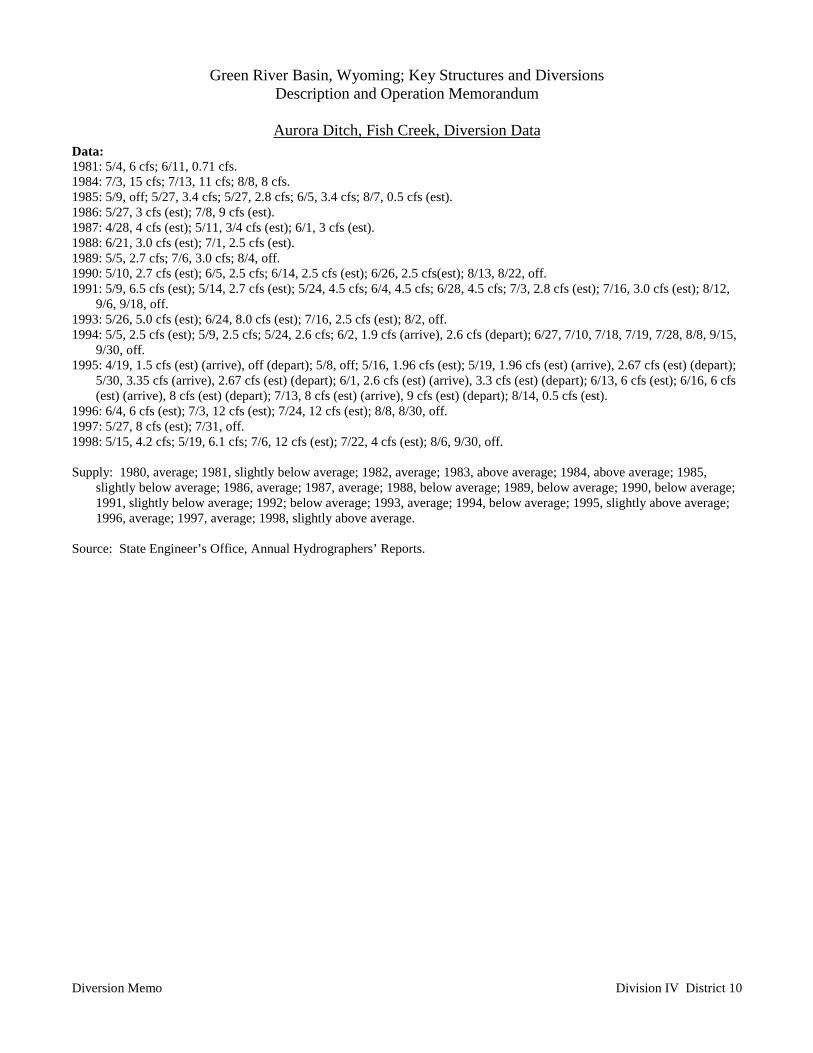
Aurora Ditch, Fish Creek, Diversion Data
Diversion Memo Division IV District 10
Data:1981: 5/4, 6 cfs; 6/11, 0.71 cfs.1984: 7/3, 15 cfs; 7/13, 11 cfs; 8/8, 8 cfs.1985: 5/9, off; 5/27, 3.4 cfs; 5/27, 2.8 cfs; 6/5, 3.4 cfs; 8/7, 0.5 cfs (est).1986: 5/27, 3 cfs (est); 7/8, 9 cfs (est).1987: 4/28, 4 cfs (est); 5/11, 3/4 cfs (est); 6/1, 3 cfs (est).1988: 6/21, 3.0 cfs (est); 7/1, 2.5 cfs (est).1989: 5/5, 2.7 cfs; 7/6, 3.0 cfs; 8/4, off.1990: 5/10, 2.7 cfs (est); 6/5, 2.5 cfs; 6/14, 2.5 cfs (est); 6/26, 2.5 cfs(est); 8/13, 8/22, off.1991: 5/9, 6.5 cfs (est); 5/14, 2.7 cfs (est); 5/24, 4.5 cfs; 6/4, 4.5 cfs; 6/28, 4.5 cfs; 7/3, 2.8 cfs (est); 7/16, 3.0 cfs (est); 8/12,
9/6, 9/18, off.1993: 5/26, 5.0 cfs (est); 6/24, 8.0 cfs (est); 7/16, 2.5 cfs (est); 8/2, off.1994: 5/5, 2.5 cfs (est); 5/9, 2.5 cfs; 5/24, 2.6 cfs; 6/2, 1.9 cfs (arrive), 2.6 cfs (depart); 6/27, 7/10, 7/18, 7/19, 7/28, 8/8, 9/15,
9/30, off.1995: 4/19, 1.5 cfs (est) (arrive), off (depart); 5/8, off; 5/16, 1.96 cfs (est); 5/19, 1.96 cfs (est) (arrive), 2.67 cfs (est) (depart);
5/30, 3.35 cfs (arrive), 2.67 cfs (est) (depart); 6/1, 2.6 cfs (est) (arrive), 3.3 cfs (est) (depart); 6/13, 6 cfs (est); 6/16, 6 cfs(est) (arrive), 8 cfs (est) (depart); 7/13, 8 cfs (est) (arrive), 9 cfs (est) (depart); 8/14, 0.5 cfs (est).
1996: 6/4, 6 cfs (est); 7/3, 12 cfs (est); 7/24, 12 cfs (est); 8/8, 8/30, off.1997: 5/27, 8 cfs (est); 7/31, off.1998: 5/15, 4.2 cfs; 5/19, 6.1 cfs; 7/6, 12 cfs (est); 7/22, 4 cfs (est); 8/6, 9/30, off.
Supply: 1980, average; 1981, slightly below average; 1982, average; 1983, above average; 1984, above average; 1985,slightly below average; 1986, average; 1987, average; 1988, below average; 1989, below average; 1990, below average;1991, slightly below average; 1992; below average; 1993, average; 1994, below average; 1995, slightly above average;1996, average; 1997, average; 1998, slightly above average.
Source: State Engineer’s Office, Annual Hydrographers’ Reports.
Green River Basin, Wyoming; Key Structures and DiversionsDescription and Operation Memorandum
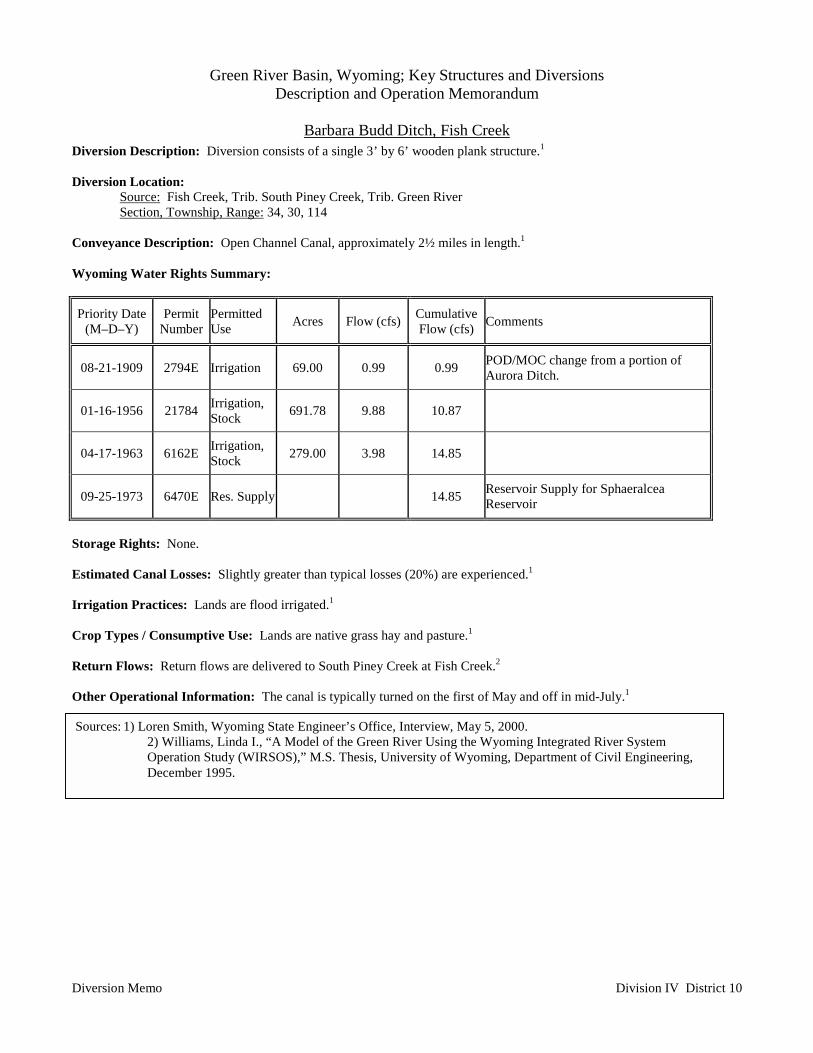
Barbara Budd Ditch, Fish Creek
Diversion Memo Division IV District 10
Diversion Description: Diversion consists of a single 3’ by 6’ wooden plank structure.1
Diversion Location:Source: Fish Creek, Trib. South Piney Creek, Trib. Green RiverSection, Township, Range: 34, 30, 114
Conveyance Description: Open Channel Canal, approximately 2½ miles in length.1
Wyoming Water Rights Summary:
Priority Date(M–D–Y)
PermitNumber
PermittedUse Acres Flow (cfs) Cumulative
Flow (cfs) Comments
08-21-1909 2794E Irrigation 69.00 0.99 0.99 POD/MOC change from a portion ofAurora Ditch.
01-16-1956 21784 Irrigation,Stock 691.78 9.88 10.87
04-17-1963 6162E Irrigation,Stock 279.00 3.98 14.85
09-25-1973 6470E Res. Supply 14.85 Reservoir Supply for SphaeralceaReservoir
Storage Rights: None.
Estimated Canal Losses: Slightly greater than typical losses (20%) are experienced.1
Irrigation Practices: Lands are flood irrigated.1
Crop Types / Consumptive Use: Lands are native grass hay and pasture.1
Return Flows: Return flows are delivered to South Piney Creek at Fish Creek.2
Other Operational Information: The canal is typically turned on the first of May and off in mid-July.1
Sources: 1) Loren Smith, Wyoming State Engineer’s Office, Interview, May 5, 2000.2) Williams, Linda I., “A Model of the Green River Using the Wyoming Integrated River SystemOperation Study (WIRSOS),” M.S. Thesis, University of Wyoming, Department of Civil Engineering,December 1995.
Green River Basin, Wyoming; Key Structures and DiversionsDescription and Operation Memorandum
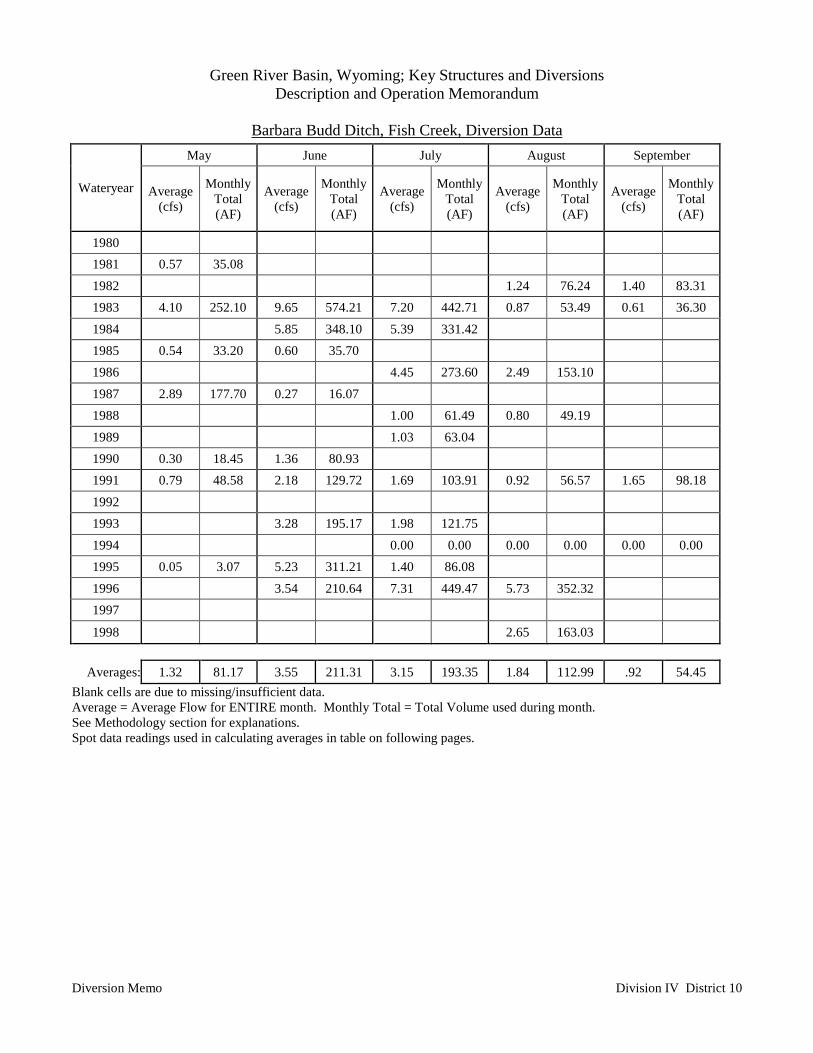
Barbara Budd Ditch, Fish Creek, Diversion Data
Diversion Memo Division IV District 10
May June July August September
Wateryear Average(cfs)
MonthlyTotal(AF)
Average(cfs)
MonthlyTotal(AF)
Average(cfs)
MonthlyTotal(AF)
Average(cfs)
MonthlyTotal(AF)
Average(cfs)
MonthlyTotal(AF)
1980 1981 0.57 35.08 1982 1.24 76.24 1.40 83.311983 4.10 252.10 9.65 574.21 7.20 442.71 0.87 53.49 0.61 36.301984 5.85 348.10 5.39 331.42 1985 0.54 33.20 0.60 35.70 1986 4.45 273.60 2.49 153.10 1987 2.89 177.70 0.27 16.07 1988 1.00 61.49 0.80 49.19 1989 1.03 63.04 1990 0.30 18.45 1.36 80.93 1991 0.79 48.58 2.18 129.72 1.69 103.91 0.92 56.57 1.65 98.181992 1993 3.28 195.17 1.98 121.75 1994 0.00 0.00 0.00 0.00 0.00 0.001995 0.05 3.07 5.23 311.21 1.40 86.08 1996 3.54 210.64 7.31 449.47 5.73 352.32 1997
1998 2.65 163.03
Averages: 1.32 81.17 3.55 211.31 3.15 193.35 1.84 112.99 .92 54.45Blank cells are due to missing/insufficient data.Average = Average Flow for ENTIRE month. Monthly Total = Total Volume used during month.See Methodology section for explanations.Spot data readings used in calculating averages in table on following pages.
Green River Basin, Wyoming; Key Structures and DiversionsDescription and Operation Memorandum
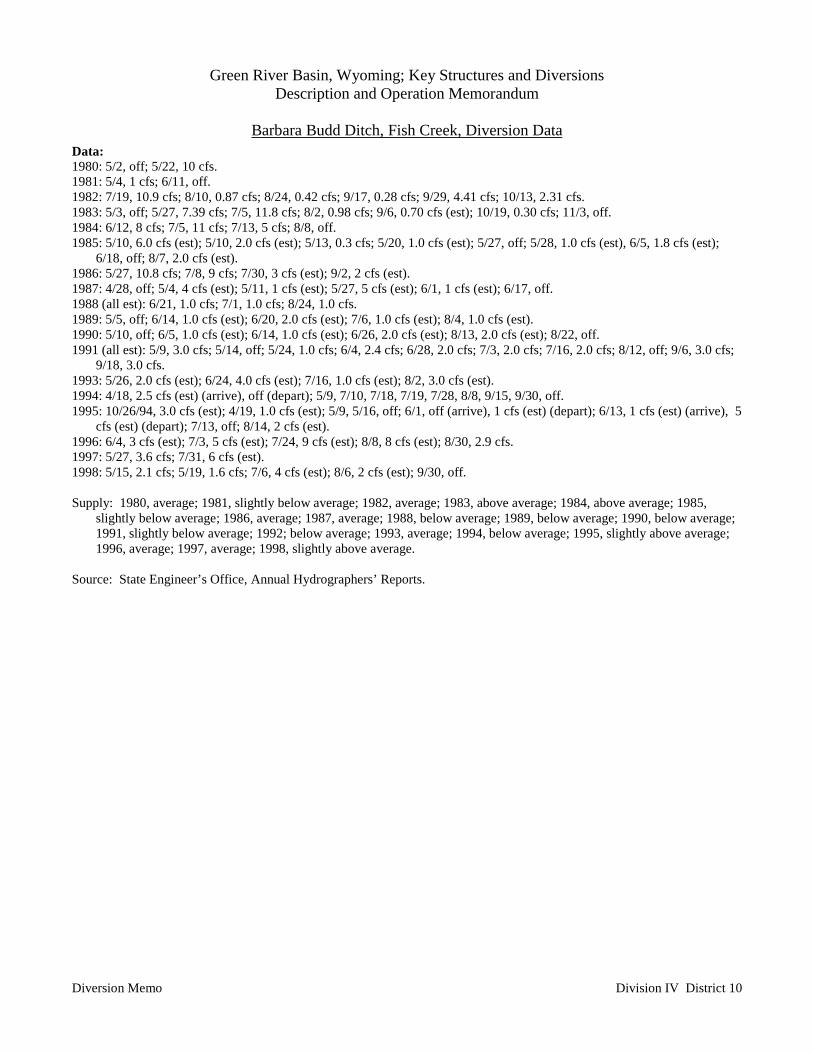
Barbara Budd Ditch, Fish Creek, Diversion Data
Diversion Memo Division IV District 10
Data:1980: 5/2, off; 5/22, 10 cfs.1981: 5/4, 1 cfs; 6/11, off.1982: 7/19, 10.9 cfs; 8/10, 0.87 cfs; 8/24, 0.42 cfs; 9/17, 0.28 cfs; 9/29, 4.41 cfs; 10/13, 2.31 cfs.1983: 5/3, off; 5/27, 7.39 cfs; 7/5, 11.8 cfs; 8/2, 0.98 cfs; 9/6, 0.70 cfs (est); 10/19, 0.30 cfs; 11/3, off.1984: 6/12, 8 cfs; 7/5, 11 cfs; 7/13, 5 cfs; 8/8, off.1985: 5/10, 6.0 cfs (est); 5/10, 2.0 cfs (est); 5/13, 0.3 cfs; 5/20, 1.0 cfs (est); 5/27, off; 5/28, 1.0 cfs (est), 6/5, 1.8 cfs (est);
6/18, off; 8/7, 2.0 cfs (est).1986: 5/27, 10.8 cfs; 7/8, 9 cfs; 7/30, 3 cfs (est); 9/2, 2 cfs (est).1987: 4/28, off; 5/4, 4 cfs (est); 5/11, 1 cfs (est); 5/27, 5 cfs (est); 6/1, 1 cfs (est); 6/17, off.1988 (all est): 6/21, 1.0 cfs; 7/1, 1.0 cfs; 8/24, 1.0 cfs.1989: 5/5, off; 6/14, 1.0 cfs (est); 6/20, 2.0 cfs (est); 7/6, 1.0 cfs (est); 8/4, 1.0 cfs (est).1990: 5/10, off; 6/5, 1.0 cfs (est); 6/14, 1.0 cfs (est); 6/26, 2.0 cfs (est); 8/13, 2.0 cfs (est); 8/22, off.1991 (all est): 5/9, 3.0 cfs; 5/14, off; 5/24, 1.0 cfs; 6/4, 2.4 cfs; 6/28, 2.0 cfs; 7/3, 2.0 cfs; 7/16, 2.0 cfs; 8/12, off; 9/6, 3.0 cfs;
9/18, 3.0 cfs.1993: 5/26, 2.0 cfs (est); 6/24, 4.0 cfs (est); 7/16, 1.0 cfs (est); 8/2, 3.0 cfs (est).1994: 4/18, 2.5 cfs (est) (arrive), off (depart); 5/9, 7/10, 7/18, 7/19, 7/28, 8/8, 9/15, 9/30, off.1995: 10/26/94, 3.0 cfs (est); 4/19, 1.0 cfs (est); 5/9, 5/16, off; 6/1, off (arrive), 1 cfs (est) (depart); 6/13, 1 cfs (est) (arrive), 5
cfs (est) (depart); 7/13, off; 8/14, 2 cfs (est).1996: 6/4, 3 cfs (est); 7/3, 5 cfs (est); 7/24, 9 cfs (est); 8/8, 8 cfs (est); 8/30, 2.9 cfs.1997: 5/27, 3.6 cfs; 7/31, 6 cfs (est).1998: 5/15, 2.1 cfs; 5/19, 1.6 cfs; 7/6, 4 cfs (est); 8/6, 2 cfs (est); 9/30, off.
Supply: 1980, average; 1981, slightly below average; 1982, average; 1983, above average; 1984, above average; 1985,slightly below average; 1986, average; 1987, average; 1988, below average; 1989, below average; 1990, below average;1991, slightly below average; 1992; below average; 1993, average; 1994, below average; 1995, slightly above average;1996, average; 1997, average; 1998, slightly above average.
Source: State Engineer’s Office, Annual Hydrographers’ Reports.
Green River Basin, Wyoming; Key Structures and DiversionsDescription and Operation Memorandum
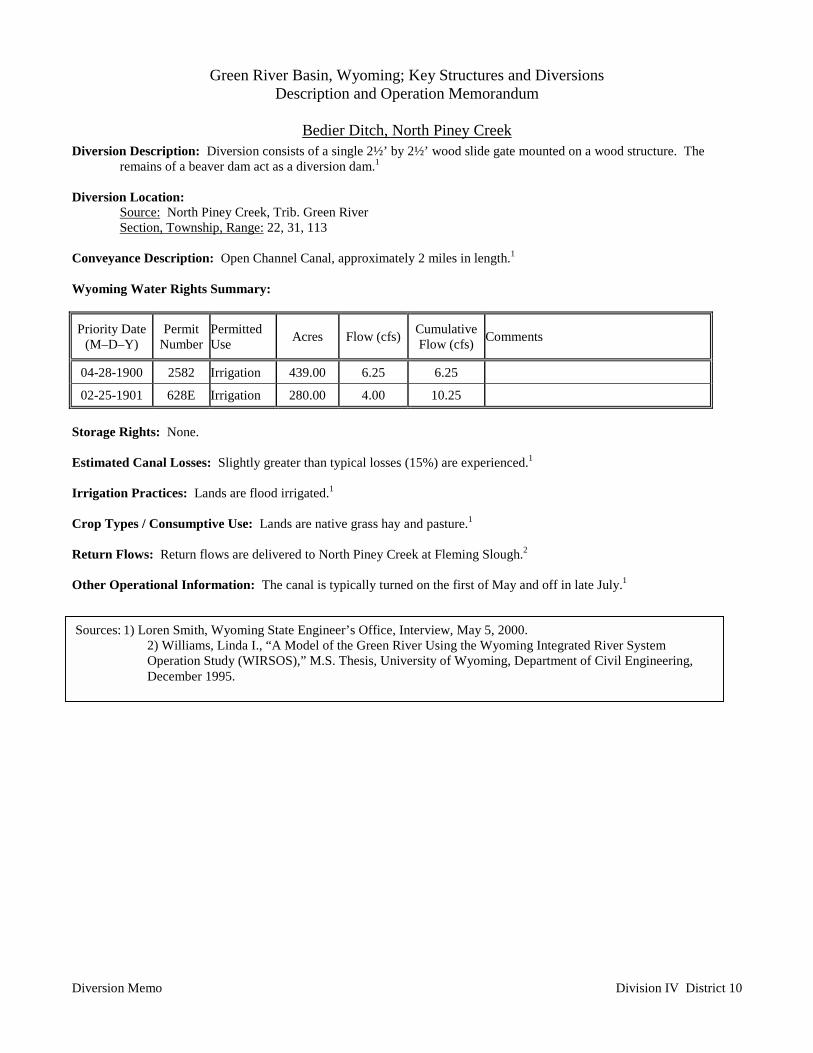
Bedier Ditch, North Piney Creek
Diversion Memo Division IV District 10
Diversion Description: Diversion consists of a single 2½’ by 2½’ wood slide gate mounted on a wood structure. Theremains of a beaver dam act as a diversion dam.1
Diversion Location:Source: North Piney Creek, Trib. Green RiverSection, Township, Range: 22, 31, 113
Conveyance Description: Open Channel Canal, approximately 2 miles in length.1
Wyoming Water Rights Summary:
Priority Date(M–D–Y)
PermitNumber
PermittedUse Acres Flow (cfs) Cumulative
Flow (cfs) Comments
04-28-1900 2582 Irrigation 439.00 6.25 6.25
02-25-1901 628E Irrigation 280.00 4.00 10.25
Storage Rights: None.
Estimated Canal Losses: Slightly greater than typical losses (15%) are experienced.1
Irrigation Practices: Lands are flood irrigated.1
Crop Types / Consumptive Use: Lands are native grass hay and pasture.1
Return Flows: Return flows are delivered to North Piney Creek at Fleming Slough.2
Other Operational Information: The canal is typically turned on the first of May and off in late July.1
Sources: 1) Loren Smith, Wyoming State Engineer’s Office, Interview, May 5, 2000.2) Williams, Linda I., “A Model of the Green River Using the Wyoming Integrated River SystemOperation Study (WIRSOS),” M.S. Thesis, University of Wyoming, Department of Civil Engineering,December 1995.
Green River Basin, Wyoming; Key Structures and DiversionsDescription and Operation Memorandum
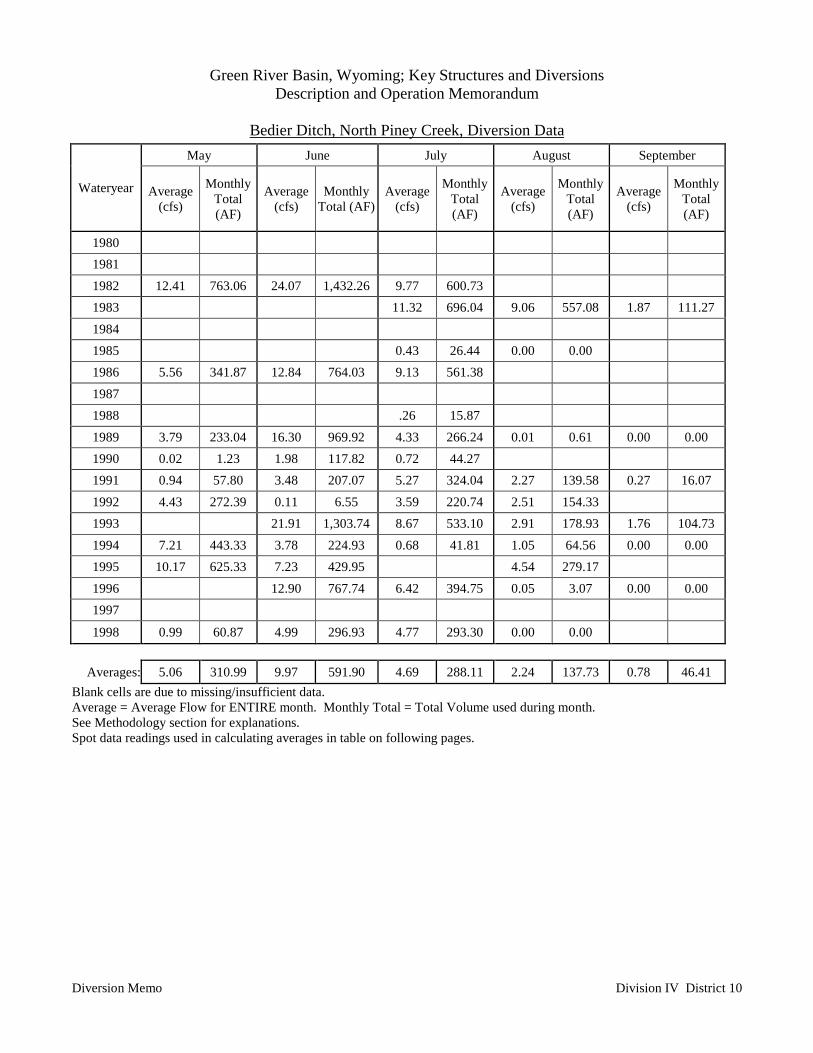
Bedier Ditch, North Piney Creek, Diversion Data
Diversion Memo Division IV District 10
May June July August September
Wateryear Average(cfs)
MonthlyTotal(AF)
Average(cfs)
MonthlyTotal (AF)
Average(cfs)
MonthlyTotal(AF)
Average(cfs)
MonthlyTotal(AF)
Average(cfs)
MonthlyTotal(AF)
1980 1981 1982 12.41 763.06 24.07 1,432.26 9.77 600.731983 11.32 696.04 9.06 557.08 1.87 111.2719841985 0.43 26.44 0.00 0.001986 5.56 341.87 12.84 764.03 9.13 561.38 1987 1988 .26 15.87 1989 3.79 233.04 16.30 969.92 4.33 266.24 0.01 0.61 0.00 0.001990 0.02 1.23 1.98 117.82 0.72 44.27 1991 0.94 57.80 3.48 207.07 5.27 324.04 2.27 139.58 0.27 16.071992 4.43 272.39 0.11 6.55 3.59 220.74 2.51 154.33 1993 21.91 1,303.74 8.67 533.10 2.91 178.93 1.76 104.731994 7.21 443.33 3.78 224.93 0.68 41.81 1.05 64.56 0.00 0.001995 10.17 625.33 7.23 429.95 4.54 279.17 1996 12.90 767.74 6.42 394.75 0.05 3.07 0.00 0.001997
1998 0.99 60.87 4.99 296.93 4.77 293.30 0.00 0.00
Averages: 5.06 310.99 9.97 591.90 4.69 288.11 2.24 137.73 0.78 46.41Blank cells are due to missing/insufficient data.Average = Average Flow for ENTIRE month. Monthly Total = Total Volume used during month.See Methodology section for explanations.Spot data readings used in calculating averages in table on following pages.

Green River Basin, Wyoming; Key Structures and DiversionsDescription and Operation Memorandum
Bedier Ditch, North Piney Creek, Diversion Data
Diversion Memo Division IV District 10
Data:1981: 6/22, 8.3 cfs; 6/26, 9 cfs; 7/8, 7.3 cfs; 7/9, 5.3 cfs; 7/13, off.1982: 5/14, 7.27 cfs; 5/21, 29.6 cfs; 6/3, 14.6 cfs; 6/18, 31.7 cfs; 7/21, 4.90 cfs; 8/12, 0.70 cfs; 10/7, 0.13 cfs; 10/22, 0.15 cfs
(est).1983: 5/20, off; 7/12, 16.0 cfs; 7/28, 19.0 cfs; 8/12, 9.45 cfs; 9/13, 1.37 cfs; 10/12, 0.80 cfs (est); 11/16, 3.00 cfs (est).1984: 5/18, 33 cfs; 5/30, 26 cfs; 7/17, 2 cfs; 8/9, 9/5, 10/2, off.1985: 6/21, 16.7 cfs; 7/1, 13.2 cfs; 7/3, 7/15, 8/21, off.1986: 5/2, off; 5/14, 5.6 cfs; 6/23, 15 cfs (est); 8/6, 4 cfs (est).1987: 5/28, 5 cfs (est); 6/25, off (rotated).1988: 7/5, 4.0 cfs; 7/7, 7/25, 9/2, off.1989: 4/25, off; 5/19, 2.3 cfs; 6/15, 22.0 cfs (est); 7/6, 5.7 cfs; 7/10, 6.0 cfs (est); 7/17, 5.0 cfs (est); 7/24, 2.0 cfs (est); 8/3,
8/16, 8/25, 8/30, off.1990: 5/3, 5/17, 5/29, off; 6/13, 2.5 cfs (est); 7/6, 2.0 cfs (est); 7/18, 7/31, 8/14, off.1991: 5/15, off; 5/20, 2.0 cfs (est); 6/5, 2.0 cfs (est); 6/11, 3.5 cfs (est); 7/1, 4.5 cfs; 7/15, 6.5 cfs; 8/2, 3.5 cfs (est); 8/19, 2.0
cfs (est); 9/16, off.1992: 4/23, off; 5/12, 3.5 cfs (est); 5/16, 6.5 cfs (est); 5/19, 6.3 cfs; 5/26, 6.5 cfs; 6/4, 6/11, 6/18, 7/7, off; 7/14, 2.0 cfs (est);
7/16, 8.0 cfs (est); 8/4, 3.0 cfs (est); 8/28, 2.0 cfs (est); 9/8, 1.5 cfs (est).1993: 5/18, 16.0 cfs (est); 6/15, 25.0 cfs (est); 7/8, 14.0 cfs (est); 7/11, 6.5 cfs; 7/19, 6.0 cfs (est); 7/23, 6.0 cfs; 7/28, 6.0 cfs
(est); 8/10, 6.5 cfs (est); 8/18, off; 9/27, 3.0 cfs (est).1994: 5/5, 8.5 cfs (est); 5/25, 6.3 cfs; 5/29, 12.5 cfs; 6/3, 13.0 cfs (est) (arrive), 8.5 cfs (depart); 6/7, 10.8 cfs; 6/9, 8.0 cfs (est)
(arrive), 6.0 cfs (est) (depart); 6/13, 6.3 cfs (est) (arrive), off (depart); 6/20, 6/22, off; 6/24, 5.5 cfs (est) (arrive), off(depart); 6/25, 6/27, 6/28, 7/1, 7/11, 7/15, off; 7/28, 2.0 cfs (est); 8/4, 2.0 cfs (est); 8/11, 3.0 cfs (est); 8/17, dry; 8/26, off;9/23, dry; 9/27, off.
1995: 10/26/94, 2.5 cfs (est); 4/20, off; 5/22, 17 cfs (est) (arrive); 5.0 cfs (est) (depart); 5/24, 6.0 cfs (est); 5/26, 8 cfs (est);6/22, 11.8 cfs; 8/3, 0.5 cfs (est); 8/11, 1 cfs (est); 8/25, 10 cfs (est); 9/12, 1 cfs (est).
1996: 4/30, 9.0 cfs; 6/10, 17 cfs (est); 7/2, 20 cfs (est); 7/19, 0.5 cfs (est); 8/14, 9/27, off.1997: 5/1, off; 5/23, 16 cfs (est); 8/8, 9/12, off.1998: 5/12, 0.5 cfs (est); 6/10, 3.5 cfs (est); 7/7, 9.5 cfs; 7/27, 8/14, 8/28, off.
Supply: 1980, average; 1981, slightly below average; 1982, average; 1983, above average; 1984, above average; 1985,slightly below average; 1986, average; 1987, average; 1988, below average; 1989, below average; 1990, below average;1991, slightly below average; 1992; below average; 1993, average; 1994, below average; 1995, slightly above average;1996, average; 1997, average; 1998, slightly above average.
Source: State Engineer’s Office, Annual Hydrographers’ Reports.

Green River Basin, Wyoming; Key Structures and DiversionsDescription and Operation Memorandum
Cottonwood Canal, Cottonwood Creek
Diversion Memo Division IV District 10
Diversion Description: Information not available at time of report.
Diversion Location:Source: Cottonwood (or Marsh) Creek, Trib. Green RiverSection, Township, Range: 21, 32, 111
Conveyance Description: Open Channel Canal.
Wyoming Water Rights Summary:
Priority Date(M–D–Y)
PermitNumber
PermittedUse Acres Flow
(cfs)CumulativeFlow (cfs) Comments
07-16-1908 8573 Irrigation,Stock 285.50 4.08 4.08 POD/MOC change from a portion of
Ranchero Ditch
12-22-1908 8795-11890
Domestic,Irrigation 3,481.60 49.71 53.79
Storage Rights: None.
Estimated Canal Losses: Information not available at time of report.
Irrigation Practices: Information not available at time of report.
Crop Types / Consumptive Use: Information not available at time of report.
Return Flows: Approximately 70% of the return flows are delivered to Upper Muddy Creek, and approximately 30% toGreen River at Bray Draw.1
Other Operational Information: Information not available at time of report.
Sources: 1) Williams, Linda I., “A Model of the Green River Using the Wyoming Integrated River SystemOperation Study (WIRSOS),” M.S. Thesis, University of Wyoming, Department of Civil Engineering,December 1995.

Green River Basin, Wyoming; Key Structures and DiversionsDescription and Operation Memorandum
Cottonwood Canal, Cottonwood Creek, Diversion Data
Diversion Memo Division IV District 10
Data:1997: 6/2, 53.0 cfs; 8/8, 30 cfs (est).
Supply: 1980, average; 1981, slightly below average; 1982, average; 1983, above average; 1984, above average; 1985,slightly below average; 1986, average; 1987, average; 1988, below average; 1989, below average; 1990, below average;1991, slightly below average; 1992; below average; 1993, average; 1994, below average; 1995, slightly above average;1996, average; 1997, average; 1998, slightly above average.
Source: State Engineer’s Office, Annual Hydrographers’ Reports.
Green River Basin, Wyoming; Key Structures and DiversionsDescription and Operation Memorandum
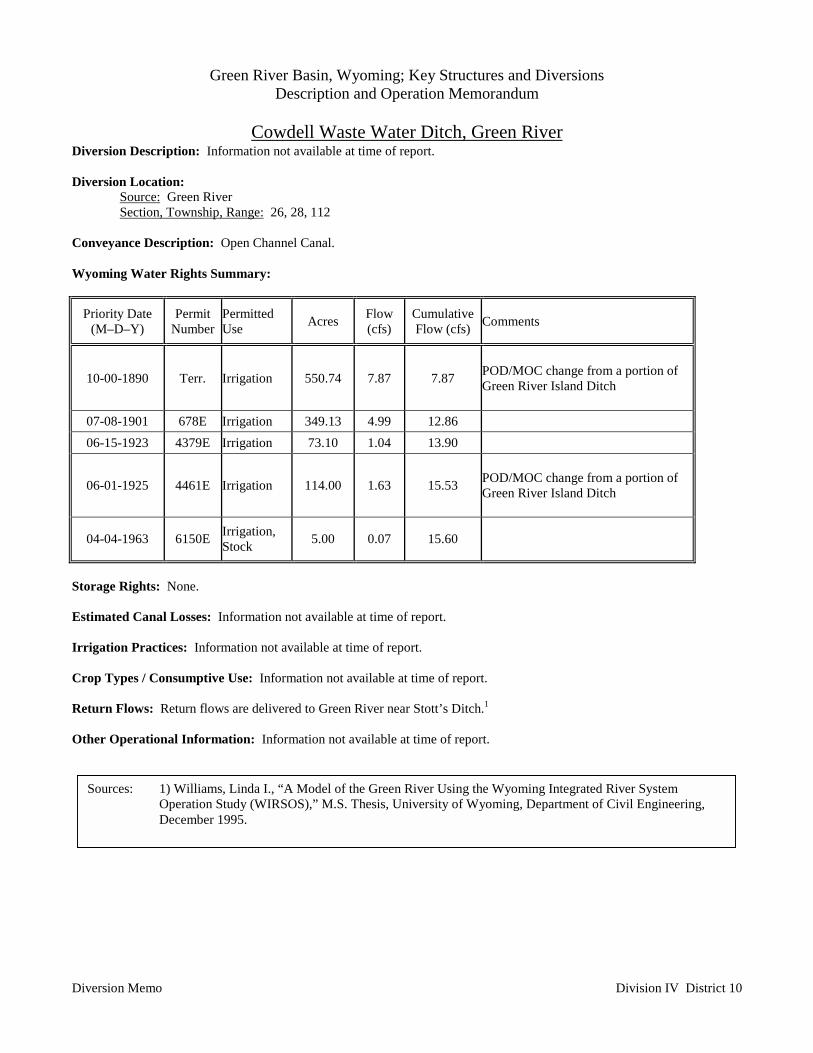
Cowdell Waste Water Ditch, Green River
Diversion Memo Division IV District 10
Diversion Description: Information not available at time of report.
Diversion Location:Source: Green RiverSection, Township, Range: 26, 28, 112
Conveyance Description: Open Channel Canal.
Wyoming Water Rights Summary:
Priority Date(M–D–Y)
PermitNumber
PermittedUse Acres Flow
(cfs)CumulativeFlow (cfs) Comments
10-00-1890 Terr. Irrigation 550.74 7.87 7.87 POD/MOC change from a portion ofGreen River Island Ditch
07-08-1901 678E Irrigation 349.13 4.99 12.86 06-15-1923 4379E Irrigation 73.10 1.04 13.90
06-01-1925 4461E Irrigation 114.00 1.63 15.53 POD/MOC change from a portion ofGreen River Island Ditch
04-04-1963 6150E Irrigation,Stock 5.00 0.07 15.60
Storage Rights: None.
Estimated Canal Losses: Information not available at time of report.
Irrigation Practices: Information not available at time of report.
Crop Types / Consumptive Use: Information not available at time of report.
Return Flows: Return flows are delivered to Green River near Stott’s Ditch.1
Other Operational Information: Information not available at time of report.
Sources: 1) Williams, Linda I., “A Model of the Green River Using the Wyoming Integrated River SystemOperation Study (WIRSOS),” M.S. Thesis, University of Wyoming, Department of Civil Engineering,December 1995.
Green River Basin, Wyoming; Key Structures and DiversionsDescription and Operation Memorandum
Cowdell Waste Water Ditch, Green River, Diversion Data
Diversion Memo Division IV District 10
No Diversion Data Available.
Green River Basin, Wyoming; Key Structures and DiversionsDescription and Operation Memorandum
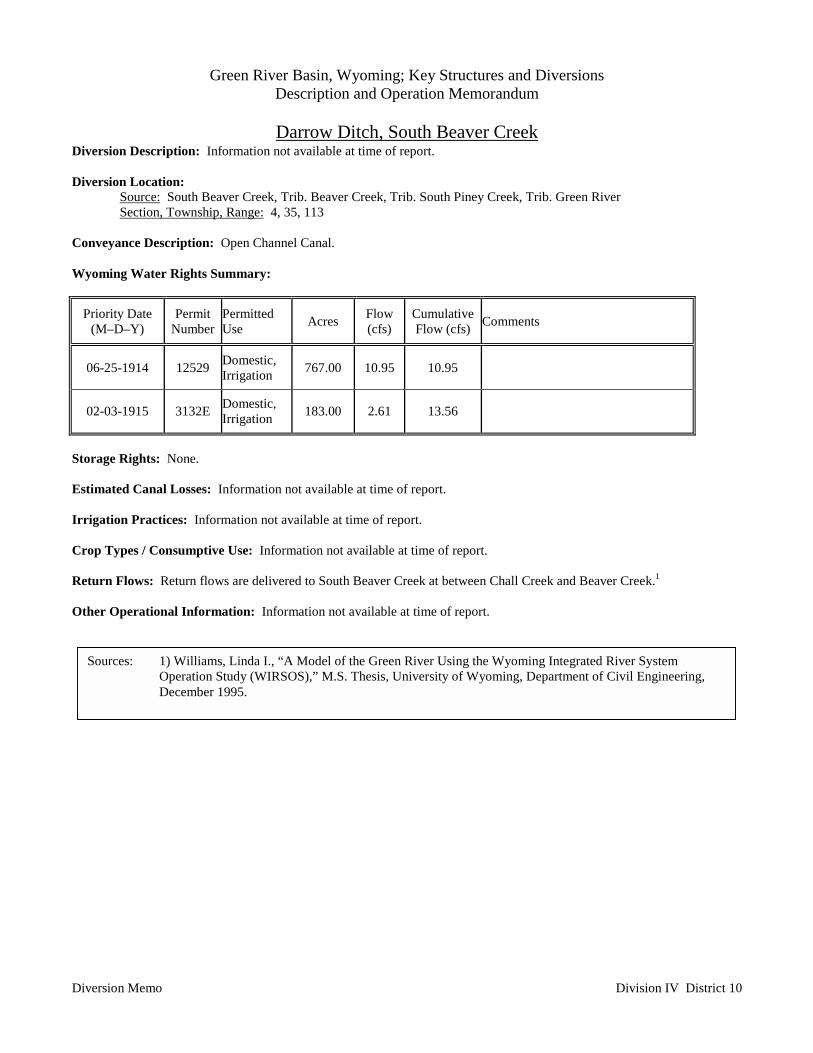
Darrow Ditch, South Beaver Creek
Diversion Memo Division IV District 10
Diversion Description: Information not available at time of report.
Diversion Location:Source: South Beaver Creek, Trib. Beaver Creek, Trib. South Piney Creek, Trib. Green RiverSection, Township, Range: 4, 35, 113
Conveyance Description: Open Channel Canal.
Wyoming Water Rights Summary:
Priority Date(M–D–Y)
PermitNumber
PermittedUse Acres Flow
(cfs)CumulativeFlow (cfs) Comments
06-25-1914 12529 Domestic,Irrigation 767.00 10.95 10.95
02-03-1915 3132E Domestic,Irrigation 183.00 2.61 13.56
Storage Rights: None.
Estimated Canal Losses: Information not available at time of report.
Irrigation Practices: Information not available at time of report.
Crop Types / Consumptive Use: Information not available at time of report.
Return Flows: Return flows are delivered to South Beaver Creek at between Chall Creek and Beaver Creek.1
Other Operational Information: Information not available at time of report.
Sources: 1) Williams, Linda I., “A Model of the Green River Using the Wyoming Integrated River SystemOperation Study (WIRSOS),” M.S. Thesis, University of Wyoming, Department of Civil Engineering,December 1995.
Green River Basin, Wyoming; Key Structures and DiversionsDescription and Operation Memorandum
Darrow Ditch, South Beaver Creek, Diversion Data
Diversion Memo Division IV District 10
No Diversion Data.
Green River Basin, Wyoming; Key Structures and DiversionsDescription and Operation Memorandum
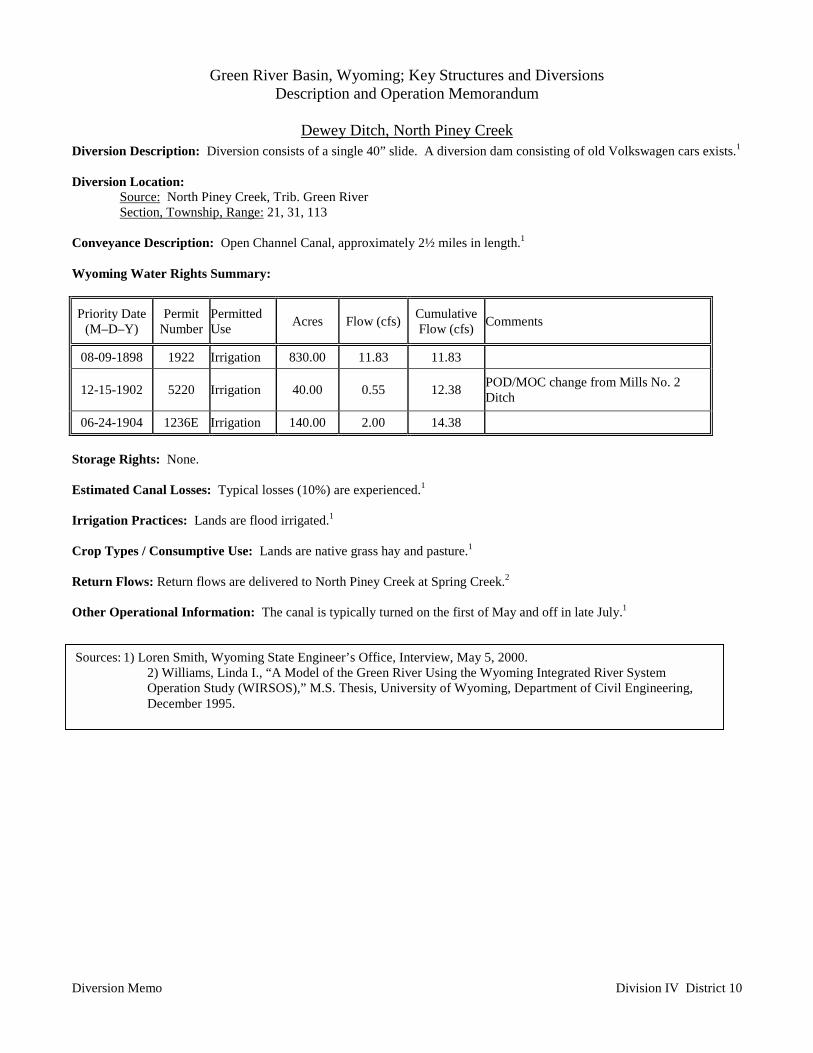
Dewey Ditch, North Piney Creek
Diversion Memo Division IV District 10
Diversion Description: Diversion consists of a single 40” slide. A diversion dam consisting of old Volkswagen cars exists.1
Diversion Location:Source: North Piney Creek, Trib. Green RiverSection, Township, Range: 21, 31, 113
Conveyance Description: Open Channel Canal, approximately 2½ miles in length.1
Wyoming Water Rights Summary:
Priority Date(M–D–Y)
PermitNumber
PermittedUse Acres Flow (cfs) Cumulative
Flow (cfs) Comments
08-09-1898 1922 Irrigation 830.00 11.83 11.83
12-15-1902 5220 Irrigation 40.00 0.55 12.38 POD/MOC change from Mills No. 2Ditch
06-24-1904 1236E Irrigation 140.00 2.00 14.38
Storage Rights: None.
Estimated Canal Losses: Typical losses (10%) are experienced.1
Irrigation Practices: Lands are flood irrigated.1
Crop Types / Consumptive Use: Lands are native grass hay and pasture.1
Return Flows: Return flows are delivered to North Piney Creek at Spring Creek.2
Other Operational Information: The canal is typically turned on the first of May and off in late July.1
Sources: 1) Loren Smith, Wyoming State Engineer’s Office, Interview, May 5, 2000.2) Williams, Linda I., “A Model of the Green River Using the Wyoming Integrated River SystemOperation Study (WIRSOS),” M.S. Thesis, University of Wyoming, Department of Civil Engineering,December 1995.
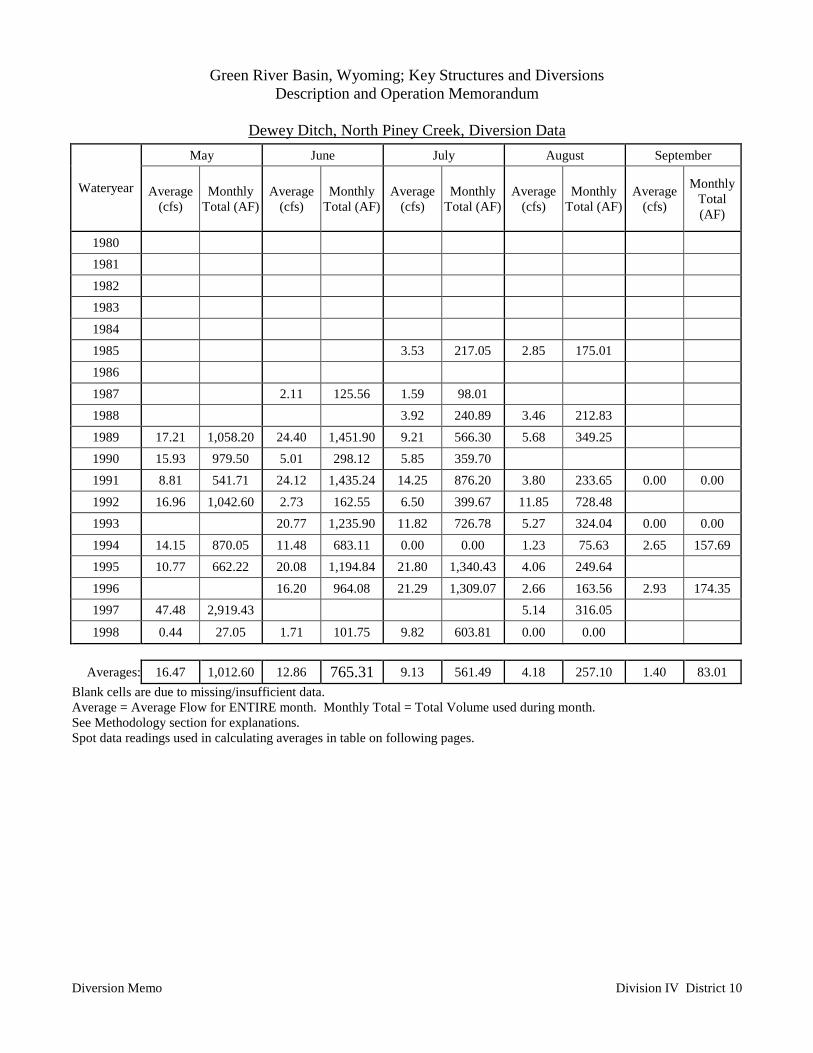
Green River Basin, Wyoming; Key Structures and DiversionsDescription and Operation Memorandum
Dewey Ditch, North Piney Creek, Diversion Data
Diversion Memo Division IV District 10
May June July August September
Wateryear Average(cfs)
MonthlyTotal (AF)
Average(cfs)
MonthlyTotal (AF)
Average(cfs)
MonthlyTotal (AF)
Average(cfs)
MonthlyTotal (AF)
Average(cfs)
MonthlyTotal(AF)
1980 1981 1982 1983 1984 1985 3.53 217.05 2.85 175.01 1986 1987 2.11 125.56 1.59 98.01 1988 3.92 240.89 3.46 212.83 1989 17.21 1,058.20 24.40 1,451.90 9.21 566.30 5.68 349.25 1990 15.93 979.50 5.01 298.12 5.85 359.70 1991 8.81 541.71 24.12 1,435.24 14.25 876.20 3.80 233.65 0.00 0.001992 16.96 1,042.60 2.73 162.55 6.50 399.67 11.85 728.48 1993 20.77 1,235.90 11.82 726.78 5.27 324.04 0.00 0.001994 14.15 870.05 11.48 683.11 0.00 0.00 1.23 75.63 2.65 157.691995 10.77 662.22 20.08 1,194.84 21.80 1,340.43 4.06 249.64 1996 16.20 964.08 21.29 1,309.07 2.66 163.56 2.93 174.351997 47.48 2,919.43 5.14 316.05
1998 0.44 27.05 1.71 101.75 9.82 603.81 0.00 0.00
Averages: 16.47 1,012.60 12.86 765.31 9.13 561.49 4.18 257.10 1.40 83.01Blank cells are due to missing/insufficient data.Average = Average Flow for ENTIRE month. Monthly Total = Total Volume used during month.See Methodology section for explanations.Spot data readings used in calculating averages in table on following pages.
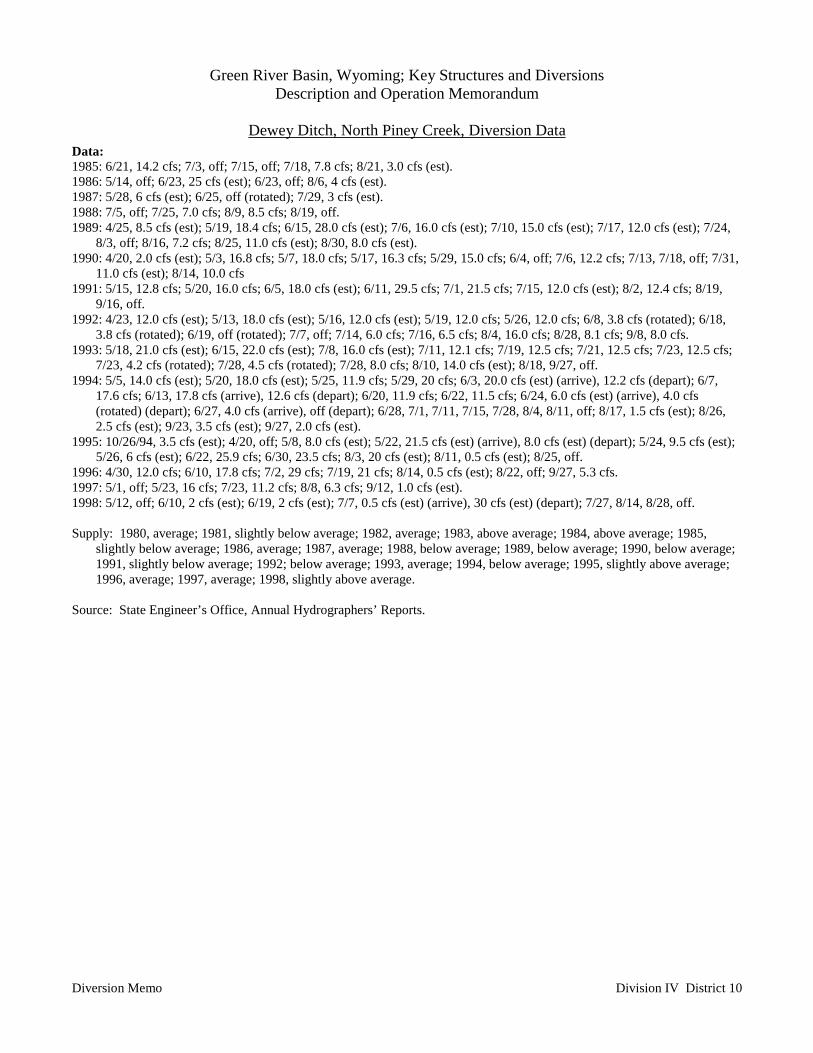
Green River Basin, Wyoming; Key Structures and DiversionsDescription and Operation Memorandum
Dewey Ditch, North Piney Creek, Diversion Data
Diversion Memo Division IV District 10
Data:1985: 6/21, 14.2 cfs; 7/3, off; 7/15, off; 7/18, 7.8 cfs; 8/21, 3.0 cfs (est).1986: 5/14, off; 6/23, 25 cfs (est); 6/23, off; 8/6, 4 cfs (est).1987: 5/28, 6 cfs (est); 6/25, off (rotated); 7/29, 3 cfs (est).1988: 7/5, off; 7/25, 7.0 cfs; 8/9, 8.5 cfs; 8/19, off.1989: 4/25, 8.5 cfs (est); 5/19, 18.4 cfs; 6/15, 28.0 cfs (est); 7/6, 16.0 cfs (est); 7/10, 15.0 cfs (est); 7/17, 12.0 cfs (est); 7/24,
8/3, off; 8/16, 7.2 cfs; 8/25, 11.0 cfs (est); 8/30, 8.0 cfs (est).1990: 4/20, 2.0 cfs (est); 5/3, 16.8 cfs; 5/7, 18.0 cfs; 5/17, 16.3 cfs; 5/29, 15.0 cfs; 6/4, off; 7/6, 12.2 cfs; 7/13, 7/18, off; 7/31,
11.0 cfs (est); 8/14, 10.0 cfs1991: 5/15, 12.8 cfs; 5/20, 16.0 cfs; 6/5, 18.0 cfs (est); 6/11, 29.5 cfs; 7/1, 21.5 cfs; 7/15, 12.0 cfs (est); 8/2, 12.4 cfs; 8/19,
9/16, off.1992: 4/23, 12.0 cfs (est); 5/13, 18.0 cfs (est); 5/16, 12.0 cfs (est); 5/19, 12.0 cfs; 5/26, 12.0 cfs; 6/8, 3.8 cfs (rotated); 6/18,
3.8 cfs (rotated); 6/19, off (rotated); 7/7, off; 7/14, 6.0 cfs; 7/16, 6.5 cfs; 8/4, 16.0 cfs; 8/28, 8.1 cfs; 9/8, 8.0 cfs.1993: 5/18, 21.0 cfs (est); 6/15, 22.0 cfs (est); 7/8, 16.0 cfs (est); 7/11, 12.1 cfs; 7/19, 12.5 cfs; 7/21, 12.5 cfs; 7/23, 12.5 cfs;
7/23, 4.2 cfs (rotated); 7/28, 4.5 cfs (rotated); 7/28, 8.0 cfs; 8/10, 14.0 cfs (est); 8/18, 9/27, off.1994: 5/5, 14.0 cfs (est); 5/20, 18.0 cfs (est); 5/25, 11.9 cfs; 5/29, 20 cfs; 6/3, 20.0 cfs (est) (arrive), 12.2 cfs (depart); 6/7,
17.6 cfs; 6/13, 17.8 cfs (arrive), 12.6 cfs (depart); 6/20, 11.9 cfs; 6/22, 11.5 cfs; 6/24, 6.0 cfs (est) (arrive), 4.0 cfs(rotated) (depart); 6/27, 4.0 cfs (arrive), off (depart); 6/28, 7/1, 7/11, 7/15, 7/28, 8/4, 8/11, off; 8/17, 1.5 cfs (est); 8/26,2.5 cfs (est); 9/23, 3.5 cfs (est); 9/27, 2.0 cfs (est).
1995: 10/26/94, 3.5 cfs (est); 4/20, off; 5/8, 8.0 cfs (est); 5/22, 21.5 cfs (est) (arrive), 8.0 cfs (est) (depart); 5/24, 9.5 cfs (est);5/26, 6 cfs (est); 6/22, 25.9 cfs; 6/30, 23.5 cfs; 8/3, 20 cfs (est); 8/11, 0.5 cfs (est); 8/25, off.
1996: 4/30, 12.0 cfs; 6/10, 17.8 cfs; 7/2, 29 cfs; 7/19, 21 cfs; 8/14, 0.5 cfs (est); 8/22, off; 9/27, 5.3 cfs.1997: 5/1, off; 5/23, 16 cfs; 7/23, 11.2 cfs; 8/8, 6.3 cfs; 9/12, 1.0 cfs (est).1998: 5/12, off; 6/10, 2 cfs (est); 6/19, 2 cfs (est); 7/7, 0.5 cfs (est) (arrive), 30 cfs (est) (depart); 7/27, 8/14, 8/28, off.
Supply: 1980, average; 1981, slightly below average; 1982, average; 1983, above average; 1984, above average; 1985,slightly below average; 1986, average; 1987, average; 1988, below average; 1989, below average; 1990, below average;1991, slightly below average; 1992; below average; 1993, average; 1994, below average; 1995, slightly above average;1996, average; 1997, average; 1998, slightly above average.
Source: State Engineer’s Office, Annual Hydrographers’ Reports.

Green River Basin, Wyoming; Key Structures and DiversionsDescription and Operation Memorandum
Essex Ditch, Cottonwood Creek
Diversion Memo Division IV District 10
Diversion Description: Information not available at time of report.
Diversion Location:Source: Cottonwood (or Marsh) Creek, Trib. Green RiverSection, Township, Range: 11, 32, 112
Conveyance Description: Open Channel Canal.
Wyoming Water Rights Summary:
Priority Date(M–D–Y)
PermitNumber
PermittedUse Acres Flow
(cfs)CumulativeFlow (cfs) Comments
04-13-1900 2544 Irrigation 863.00 12.31 12.31
08-17-1906 1588E Irrigation 40.00 0.47 12.78
12-06-1954 5768E Irrigation,Stock 371.00 5.29 18.07
Storage Rights: None.
Estimated Canal Losses: Information not available at time of report.
Irrigation Practices: Information not available at time of report.
Crop Types / Consumptive Use: Information not available at time of report.
Return Flows: Return flows are delivered to Cottonwood Creek at Cottonwood Canal.1
Other Operational Information: Information not available at time of report.
Sources: 1) Williams, Linda I., “A Model of the Green River Using the Wyoming Integrated River SystemOperation Study (WIRSOS),” M.S. Thesis, University of Wyoming, Department of Civil Engineering,December 1995.
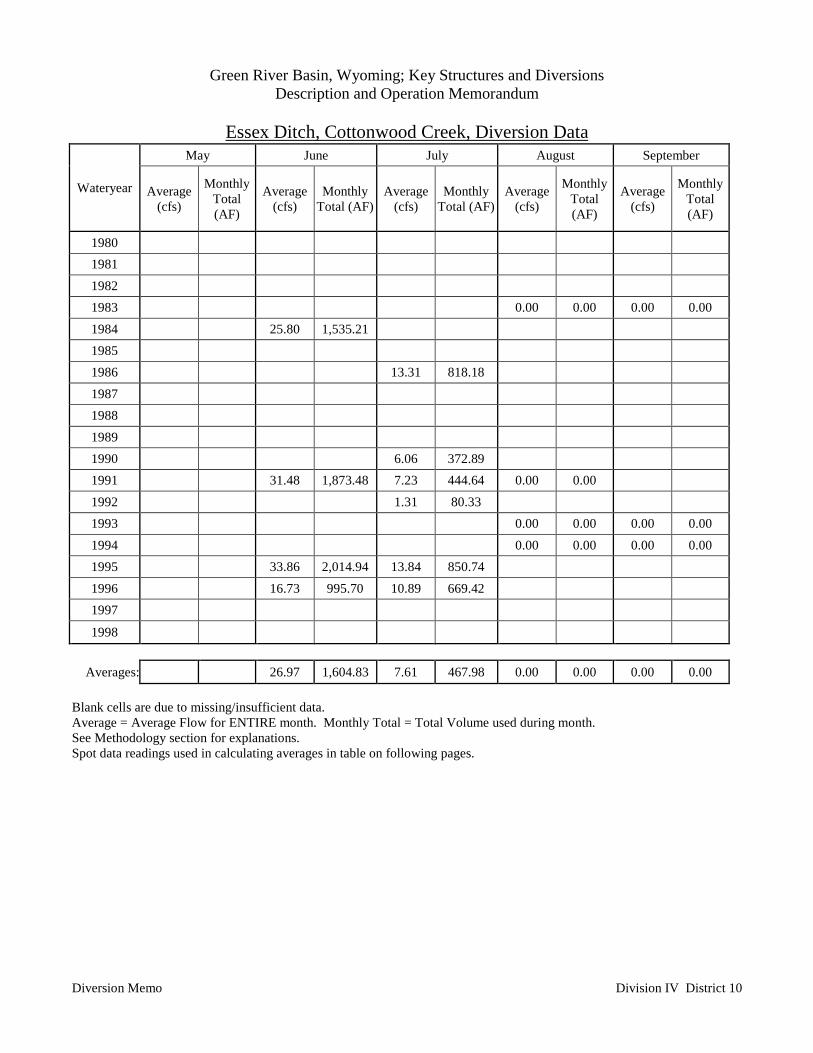
Green River Basin, Wyoming; Key Structures and DiversionsDescription and Operation Memorandum
Essex Ditch, Cottonwood Creek, Diversion Data
Diversion Memo Division IV District 10
May June July August September
Wateryear Average(cfs)
MonthlyTotal(AF)
Average(cfs)
MonthlyTotal (AF)
Average(cfs)
MonthlyTotal (AF)
Average(cfs)
MonthlyTotal(AF)
Average(cfs)
MonthlyTotal(AF)
1980 1981 1982 1983 0.00 0.00 0.00 0.001984 25.80 1,535.21 1985 1986 13.31 818.18 1987 1988 1989 1990 6.06 372.89 1991 31.48 1,873.48 7.23 444.64 0.00 0.00 1992 1.31 80.33 1993 0.00 0.00 0.00 0.001994 0.00 0.00 0.00 0.001995 33.86 2,014.94 13.84 850.74 1996 16.73 995.70 10.89 669.42 1997
1998
Averages: 26.97 1,604.83 7.61 467.98 0.00 0.00 0.00 0.00
Blank cells are due to missing/insufficient data.Average = Average Flow for ENTIRE month. Monthly Total = Total Volume used during month.See Methodology section for explanations.Spot data readings used in calculating averages in table on following pages.

Green River Basin, Wyoming; Key Structures and DiversionsDescription and Operation Memorandum
Essex Ditch, Cottonwood Creek, Diversion Data
Diversion Memo Division IV District 10
Data:1983: 6/16, 52.3 cfs; 7/27, 8/10, 9/14, 10/13, off; 11/3, 3.64 cfs.1984: 5/16, 3 cfs; 5/29, 42 cfs; 6/13, 19 cfs; 6/26, 48 cfs; 9/10, off.1986: 5/20, 37.4 cfs; 5/23, 47.0 cfs; 7/3, 55 cfs (est); 7/18, 7/29, 8/11, off.1990: 6/15, 23.0 cfs (est); 7/17, 8.0 cfs (est); 8/29, off.1991: 5/28, 30.0 cfs (est); 6/16, 36.6 cfs; 7/22, 8/9, 9/4, off.1992: 4/24, 6/22, 6/27, 7/1, off; 7/8, 3.0 cfs (est); 7/28, off.1993: 5/19, 28.0 cfs; 6/16, 48.0 cfs; 8/4, 8/30, 9/27, off.1994: 5/18, 36.0 cfs (est); 6/21, 24 cfs (est); 7/6, 7/29, 8/25, 9/7, off.1995: 6/4, 38.0 cfs (est); 6/27, 38 cfs (est); 7/27, off; 8/4, 0.5 cfs (est).1996: 6/14, 30 cfs (est); 6/27, 30 cfs (est); 7/26, 1 cfs (est).1997: 5/15, 50 cfs (est); 7/14, 2 cfs (est).1998: 7/2, 50 cfs (est).
Supply: 1980, average; 1981, slightly below average; 1982, average; 1983, above average; 1984, above average; 1985,slightly below average; 1986, average; 1987, average; 1988, below average; 1989, below average; 1990, below average;1991, slightly below average; 1992; below average; 1993, average; 1994, below average; 1995, slightly above average;1996, average; 1997, average; 1998, slightly above average.
Source: State Engineer’s Office, Annual Hydrographers’ Reports.
Green River Basin, Wyoming; Key Structures and DiversionsDescription and Operation Memorandum
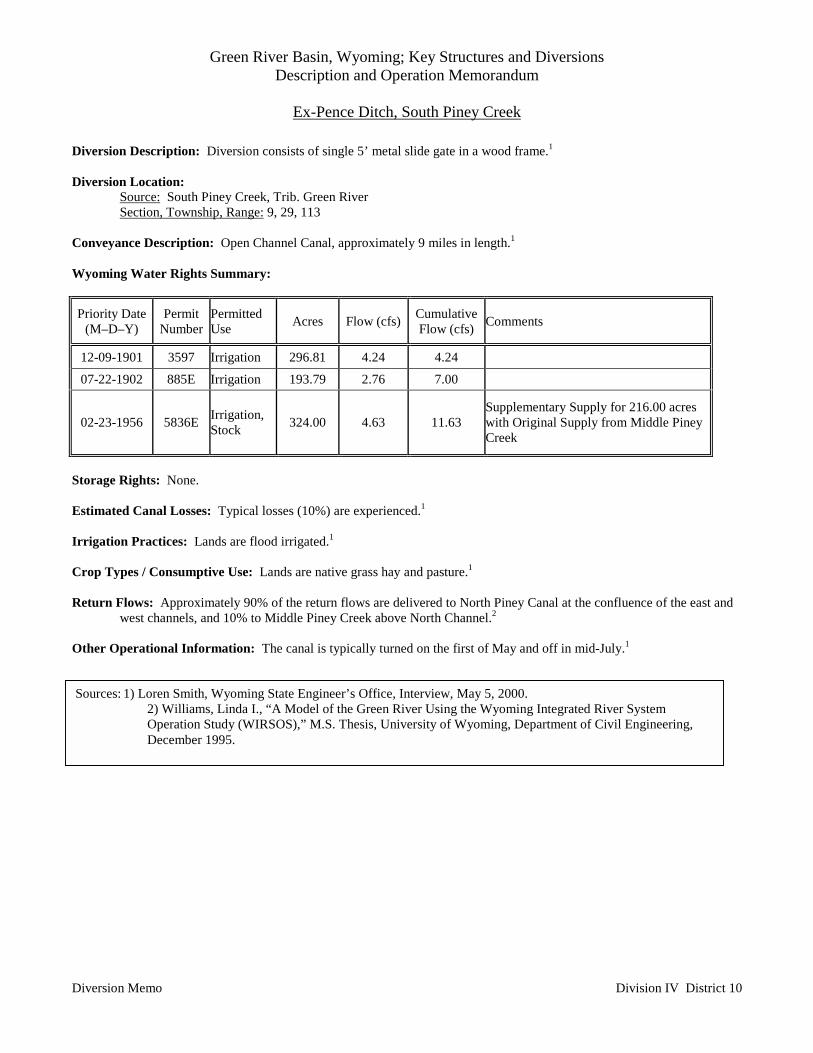
Ex-Pence Ditch, South Piney Creek
Diversion Memo Division IV District 10
Diversion Description: Diversion consists of single 5’ metal slide gate in a wood frame.1
Diversion Location:Source: South Piney Creek, Trib. Green RiverSection, Township, Range: 9, 29, 113
Conveyance Description: Open Channel Canal, approximately 9 miles in length.1
Wyoming Water Rights Summary:
Priority Date(M–D–Y)
PermitNumber
PermittedUse Acres Flow (cfs) Cumulative
Flow (cfs) Comments
12-09-1901 3597 Irrigation 296.81 4.24 4.24
07-22-1902 885E Irrigation 193.79 2.76 7.00
02-23-1956 5836E Irrigation,Stock 324.00 4.63 11.63
Supplementary Supply for 216.00 acreswith Original Supply from Middle PineyCreek
Storage Rights: None.
Estimated Canal Losses: Typical losses (10%) are experienced.1
Irrigation Practices: Lands are flood irrigated.1
Crop Types / Consumptive Use: Lands are native grass hay and pasture.1
Return Flows: Approximately 90% of the return flows are delivered to North Piney Canal at the confluence of the east andwest channels, and 10% to Middle Piney Creek above North Channel.2
Other Operational Information: The canal is typically turned on the first of May and off in mid-July.1
Sources: 1) Loren Smith, Wyoming State Engineer’s Office, Interview, May 5, 2000.2) Williams, Linda I., “A Model of the Green River Using the Wyoming Integrated River SystemOperation Study (WIRSOS),” M.S. Thesis, University of Wyoming, Department of Civil Engineering,December 1995.
Green River Basin, Wyoming; Key Structures and DiversionsDescription and Operation Memorandum
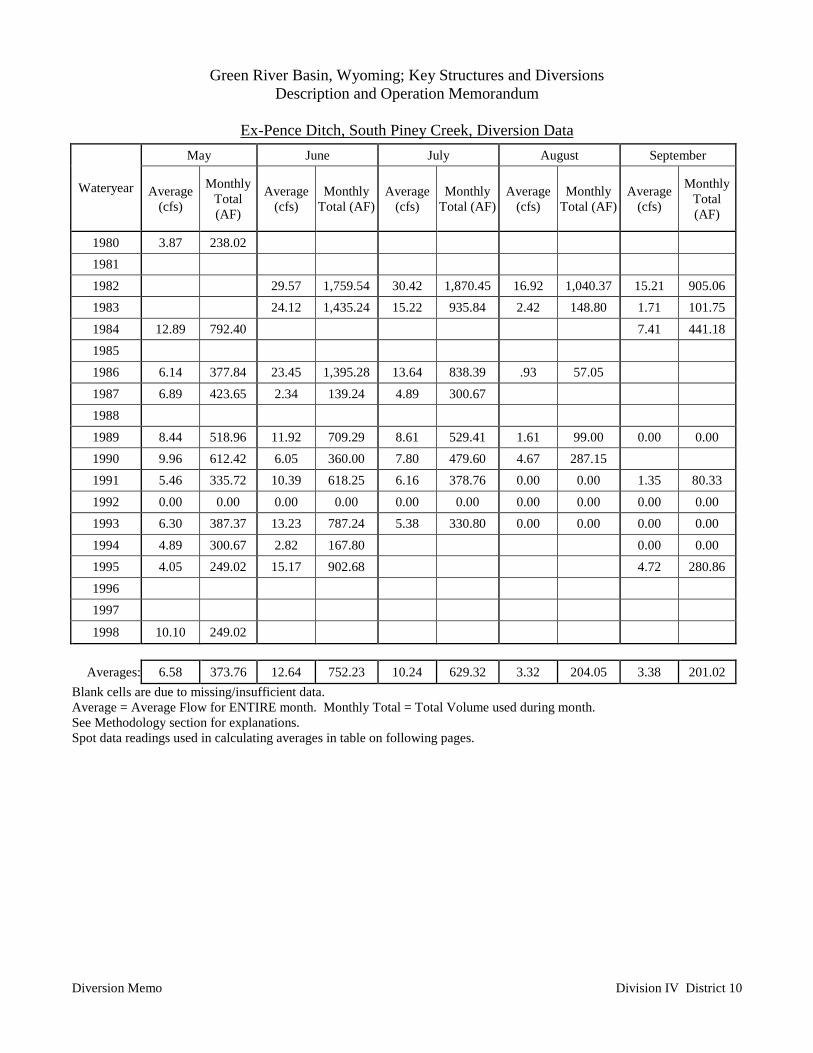
Ex-Pence Ditch, South Piney Creek, Diversion Data
Diversion Memo Division IV District 10
May June July August September
Wateryear Average(cfs)
MonthlyTotal(AF)
Average(cfs)
MonthlyTotal (AF)
Average(cfs)
MonthlyTotal (AF)
Average(cfs)
MonthlyTotal (AF)
Average(cfs)
MonthlyTotal(AF)
1980 3.87 238.02 1981 1982 29.57 1,759.54 30.42 1,870.45 16.92 1,040.37 15.21 905.061983 24.12 1,435.24 15.22 935.84 2.42 148.80 1.71 101.751984 12.89 792.40 7.41 441.181985 1986 6.14 377.84 23.45 1,395.28 13.64 838.39 .93 57.05 1987 6.89 423.65 2.34 139.24 4.89 300.67 1988 1989 8.44 518.96 11.92 709.29 8.61 529.41 1.61 99.00 0.00 0.001990 9.96 612.42 6.05 360.00 7.80 479.60 4.67 287.15 1991 5.46 335.72 10.39 618.25 6.16 378.76 0.00 0.00 1.35 80.331992 0.00 0.00 0.00 0.00 0.00 0.00 0.00 0.00 0.00 0.001993 6.30 387.37 13.23 787.24 5.38 330.80 0.00 0.00 0.00 0.001994 4.89 300.67 2.82 167.80 0.00 0.001995 4.05 249.02 15.17 902.68 4.72 280.861996 1997
1998 10.10 249.02
Averages: 6.58 373.76 12.64 752.23 10.24 629.32 3.32 204.05 3.38 201.02Blank cells are due to missing/insufficient data.Average = Average Flow for ENTIRE month. Monthly Total = Total Volume used during month.See Methodology section for explanations.Spot data readings used in calculating averages in table on following pages.
Green River Basin, Wyoming; Key Structures and DiversionsDescription and Operation Memorandum
Ex-Pence Ditch, South Piney Creek, Diversion Data
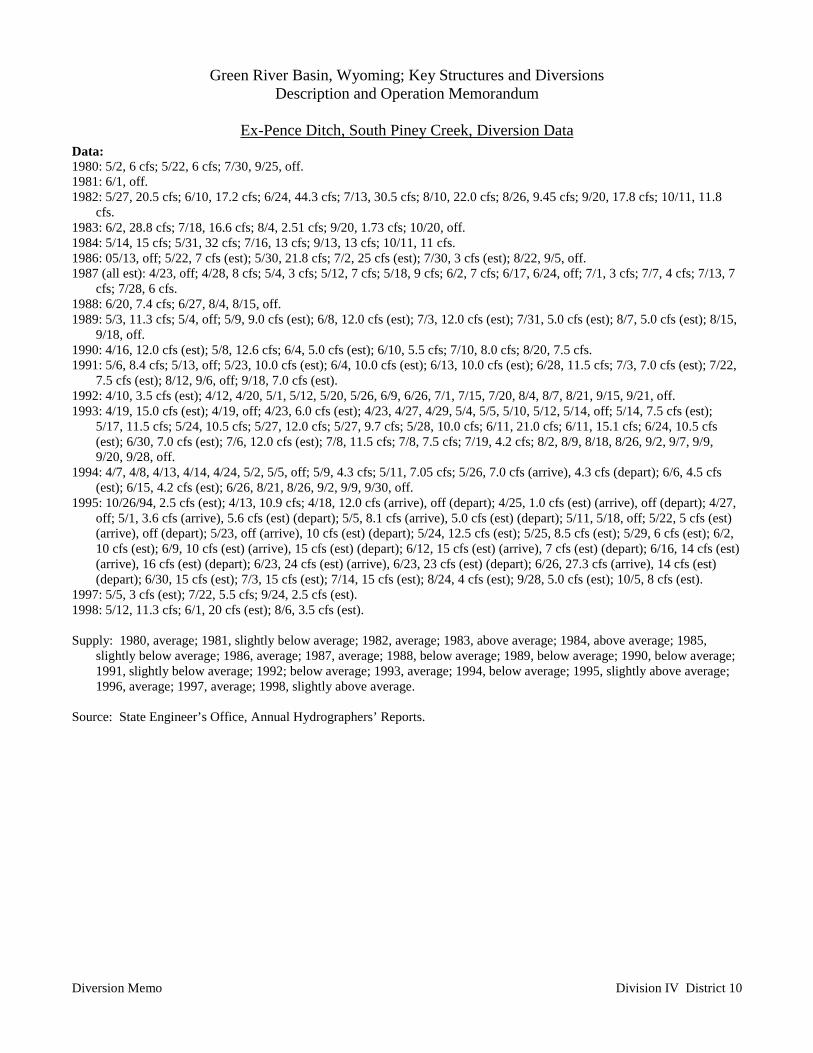
Diversion Memo Division IV District 10
Data:1980: 5/2, 6 cfs; 5/22, 6 cfs; 7/30, 9/25, off.1981: 6/1, off.1982: 5/27, 20.5 cfs; 6/10, 17.2 cfs; 6/24, 44.3 cfs; 7/13, 30.5 cfs; 8/10, 22.0 cfs; 8/26, 9.45 cfs; 9/20, 17.8 cfs; 10/11, 11.8
cfs.1983: 6/2, 28.8 cfs; 7/18, 16.6 cfs; 8/4, 2.51 cfs; 9/20, 1.73 cfs; 10/20, off.1984: 5/14, 15 cfs; 5/31, 32 cfs; 7/16, 13 cfs; 9/13, 13 cfs; 10/11, 11 cfs.1986: 05/13, off; 5/22, 7 cfs (est); 5/30, 21.8 cfs; 7/2, 25 cfs (est); 7/30, 3 cfs (est); 8/22, 9/5, off.1987 (all est): 4/23, off; 4/28, 8 cfs; 5/4, 3 cfs; 5/12, 7 cfs; 5/18, 9 cfs; 6/2, 7 cfs; 6/17, 6/24, off; 7/1, 3 cfs; 7/7, 4 cfs; 7/13, 7
cfs; 7/28, 6 cfs.1988: 6/20, 7.4 cfs; 6/27, 8/4, 8/15, off.1989: 5/3, 11.3 cfs; 5/4, off; 5/9, 9.0 cfs (est); 6/8, 12.0 cfs (est); 7/3, 12.0 cfs (est); 7/31, 5.0 cfs (est); 8/7, 5.0 cfs (est); 8/15,
9/18, off.1990: 4/16, 12.0 cfs (est); 5/8, 12.6 cfs; 6/4, 5.0 cfs (est); 6/10, 5.5 cfs; 7/10, 8.0 cfs; 8/20, 7.5 cfs.1991: 5/6, 8.4 cfs; 5/13, off; 5/23, 10.0 cfs (est); 6/4, 10.0 cfs (est); 6/13, 10.0 cfs (est); 6/28, 11.5 cfs; 7/3, 7.0 cfs (est); 7/22,
7.5 cfs (est); 8/12, 9/6, off; 9/18, 7.0 cfs (est).1992: 4/10, 3.5 cfs (est); 4/12, 4/20, 5/1, 5/12, 5/20, 5/26, 6/9, 6/26, 7/1, 7/15, 7/20, 8/4, 8/7, 8/21, 9/15, 9/21, off.1993: 4/19, 15.0 cfs (est); 4/19, off; 4/23, 6.0 cfs (est); 4/23, 4/27, 4/29, 5/4, 5/5, 5/10, 5/12, 5/14, off; 5/14, 7.5 cfs (est);
5/17, 11.5 cfs; 5/24, 10.5 cfs; 5/27, 12.0 cfs; 5/27, 9.7 cfs; 5/28, 10.0 cfs; 6/11, 21.0 cfs; 6/11, 15.1 cfs; 6/24, 10.5 cfs(est); 6/30, 7.0 cfs (est); 7/6, 12.0 cfs (est); 7/8, 11.5 cfs; 7/8, 7.5 cfs; 7/19, 4.2 cfs; 8/2, 8/9, 8/18, 8/26, 9/2, 9/7, 9/9,9/20, 9/28, off.
1994: 4/7, 4/8, 4/13, 4/14, 4/24, 5/2, 5/5, off; 5/9, 4.3 cfs; 5/11, 7.05 cfs; 5/26, 7.0 cfs (arrive), 4.3 cfs (depart); 6/6, 4.5 cfs(est); 6/15, 4.2 cfs (est); 6/26, 8/21, 8/26, 9/2, 9/9, 9/30, off.
1995: 10/26/94, 2.5 cfs (est); 4/13, 10.9 cfs; 4/18, 12.0 cfs (arrive), off (depart); 4/25, 1.0 cfs (est) (arrive), off (depart); 4/27,off; 5/1, 3.6 cfs (arrive), 5.6 cfs (est) (depart); 5/5, 8.1 cfs (arrive), 5.0 cfs (est) (depart); 5/11, 5/18, off; 5/22, 5 cfs (est)(arrive), off (depart); 5/23, off (arrive), 10 cfs (est) (depart); 5/24, 12.5 cfs (est); 5/25, 8.5 cfs (est); 5/29, 6 cfs (est); 6/2,10 cfs (est); 6/9, 10 cfs (est) (arrive), 15 cfs (est) (depart); 6/12, 15 cfs (est) (arrive), 7 cfs (est) (depart); 6/16, 14 cfs (est)(arrive), 16 cfs (est) (depart); 6/23, 24 cfs (est) (arrive), 6/23, 23 cfs (est) (depart); 6/26, 27.3 cfs (arrive), 14 cfs (est)(depart); 6/30, 15 cfs (est); 7/3, 15 cfs (est); 7/14, 15 cfs (est); 8/24, 4 cfs (est); 9/28, 5.0 cfs (est); 10/5, 8 cfs (est).
1997: 5/5, 3 cfs (est); 7/22, 5.5 cfs; 9/24, 2.5 cfs (est).1998: 5/12, 11.3 cfs; 6/1, 20 cfs (est); 8/6, 3.5 cfs (est).
Supply: 1980, average; 1981, slightly below average; 1982, average; 1983, above average; 1984, above average; 1985,slightly below average; 1986, average; 1987, average; 1988, below average; 1989, below average; 1990, below average;1991, slightly below average; 1992; below average; 1993, average; 1994, below average; 1995, slightly above average;1996, average; 1997, average; 1998, slightly above average.
Source: State Engineer’s Office, Annual Hydrographers’ Reports.

Green River Basin, Wyoming; Key Structures and DiversionsDescription and Operation Memorandum
Fleming Ditch, North Piney Creek
Diversion Memo Division IV District 10
Diversion Description: Diversion consists of a single 24” diameter Waterman slide gate mounted on a concrete structure.1
Diversion Location:Source: North Piney Creek, Trib. Green RiverSection, Township, Range: 22, 31, 113
Conveyance Description: Open Channel Canal, approximately 1 mile in length.1
Wyoming Water Rights Summary:
Priority Date(M–D–Y)
PermitNumber
PermittedUse Acres Flow (cfs) Cumulative
Flow (cfs) Comments
06-29-1899 2189 Irrigation 625.00 8.91 8.92
05-17-1902 832E Irrigation 449.00 6.41 15.33
Storage Rights: None.
Estimated Canal Losses: Typical losses (10%) are experienced.1
Irrigation Practices: Lands are flood irrigated.1
Crop Types / Consumptive Use: Lands are native grass hay and pasture.1
Return Flows: Return flows are delivered to North Piney Creek at Fleming Slough.2
Other Operational Information: The canal is typically turned on the first of May and off in late July.1
Sources: 1) Loren Smith, Wyoming State Engineer’s Office, Interview, May 5, 2000.2) Williams, Linda I., “A Model of the Green River Using the Wyoming Integrated River SystemOperation Study (WIRSOS),” M.S. Thesis, University of Wyoming, Department of Civil Engineering,December 1995.
Green River Basin, Wyoming; Key Structures and DiversionsDescription and Operation Memorandum
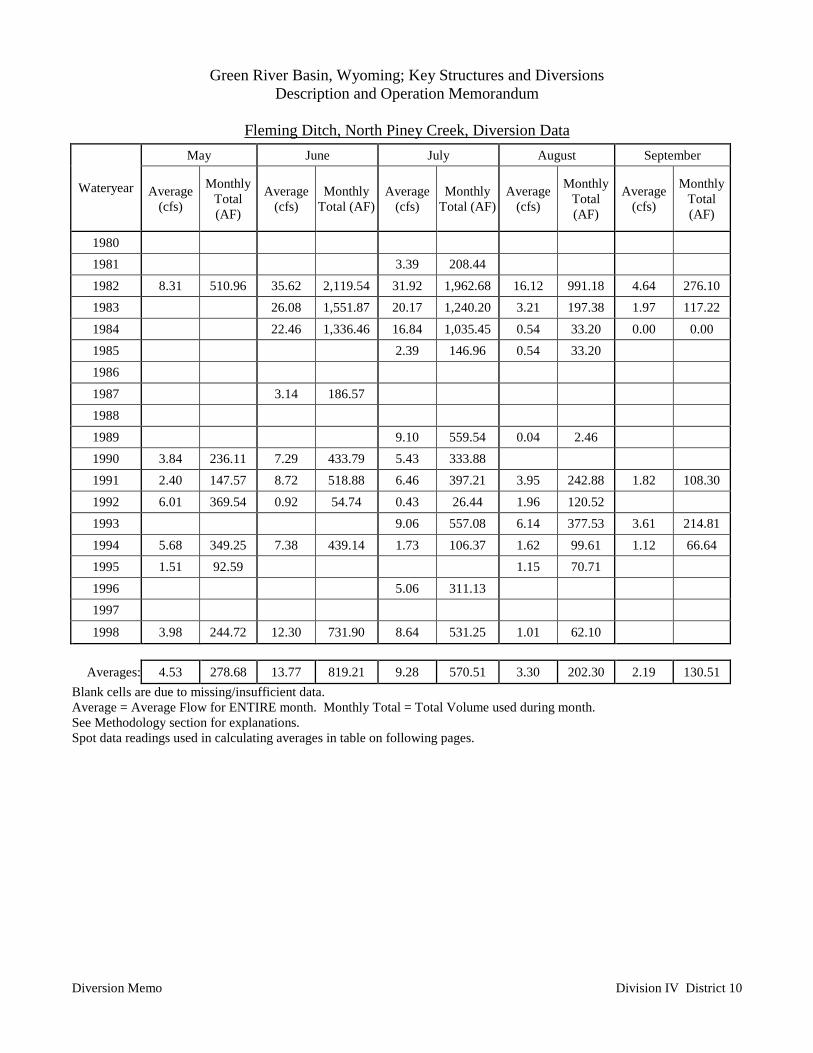
Fleming Ditch, North Piney Creek, Diversion Data
Diversion Memo Division IV District 10
May June July August September
Wateryear Average(cfs)
MonthlyTotal(AF)
Average(cfs)
MonthlyTotal (AF)
Average(cfs)
MonthlyTotal (AF)
Average(cfs)
MonthlyTotal(AF)
Average(cfs)
MonthlyTotal(AF)
1980 1981 3.39 208.44 1982 8.31 510.96 35.62 2,119.54 31.92 1,962.68 16.12 991.18 4.64 276.101983 26.08 1,551.87 20.17 1,240.20 3.21 197.38 1.97 117.221984 22.46 1,336.46 16.84 1,035.45 0.54 33.20 0.00 0.001985 2.39 146.96 0.54 33.20 1986 1987 3.14 186.57 1988 1989 9.10 559.54 0.04 2.461990 3.84 236.11 7.29 433.79 5.43 333.88 1991 2.40 147.57 8.72 518.88 6.46 397.21 3.95 242.88 1.82 108.301992 6.01 369.54 0.92 54.74 0.43 26.44 1.96 120.52 1993 9.06 557.08 6.14 377.53 3.61 214.811994 5.68 349.25 7.38 439.14 1.73 106.37 1.62 99.61 1.12 66.641995 1.51 92.59 1.15 70.71 1996 5.06 311.131997
1998 3.98 244.72 12.30 731.90 8.64 531.25 1.01 62.10
Averages: 4.53 278.68 13.77 819.21 9.28 570.51 3.30 202.30 2.19 130.51Blank cells are due to missing/insufficient data.Average = Average Flow for ENTIRE month. Monthly Total = Total Volume used during month.See Methodology section for explanations.Spot data readings used in calculating averages in table on following pages.
Green River Basin, Wyoming; Key Structures and DiversionsDescription and Operation Memorandum
Fleming Ditch, North Piney Creek, Diversion Data
Diversion Memo Division IV District 10
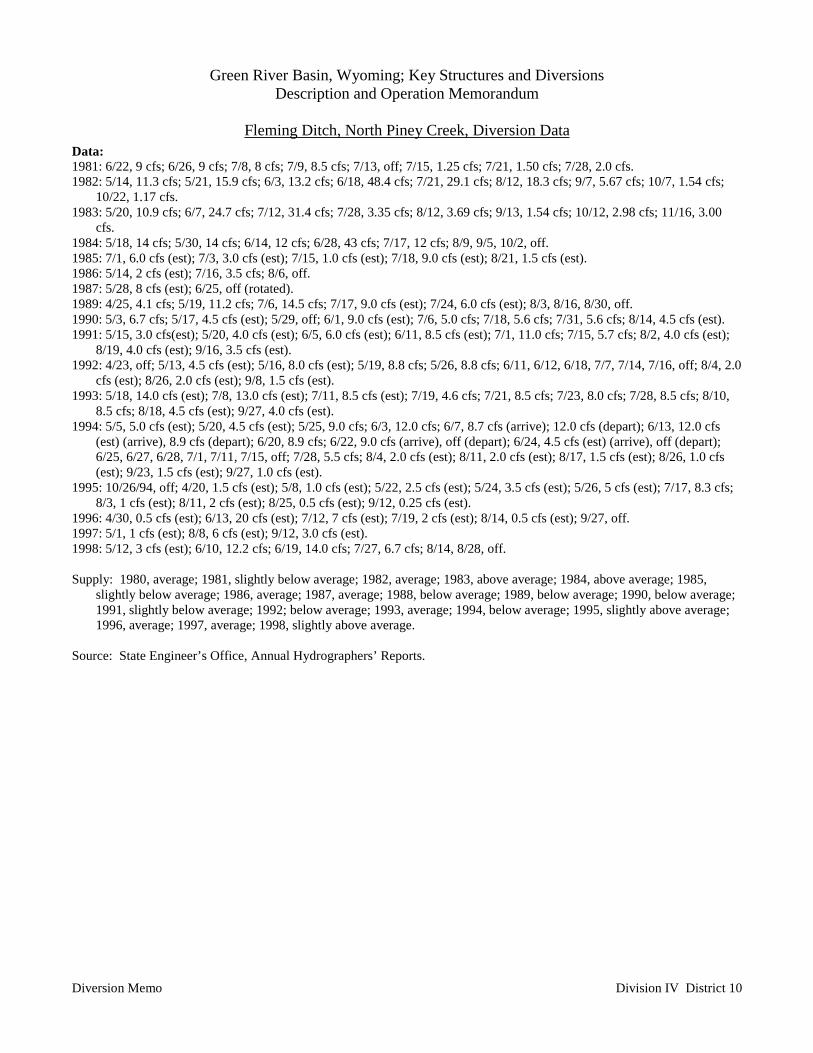
Data:1981: 6/22, 9 cfs; 6/26, 9 cfs; 7/8, 8 cfs; 7/9, 8.5 cfs; 7/13, off; 7/15, 1.25 cfs; 7/21, 1.50 cfs; 7/28, 2.0 cfs.1982: 5/14, 11.3 cfs; 5/21, 15.9 cfs; 6/3, 13.2 cfs; 6/18, 48.4 cfs; 7/21, 29.1 cfs; 8/12, 18.3 cfs; 9/7, 5.67 cfs; 10/7, 1.54 cfs;
10/22, 1.17 cfs.1983: 5/20, 10.9 cfs; 6/7, 24.7 cfs; 7/12, 31.4 cfs; 7/28, 3.35 cfs; 8/12, 3.69 cfs; 9/13, 1.54 cfs; 10/12, 2.98 cfs; 11/16, 3.00
cfs.1984: 5/18, 14 cfs; 5/30, 14 cfs; 6/14, 12 cfs; 6/28, 43 cfs; 7/17, 12 cfs; 8/9, 9/5, 10/2, off.1985: 7/1, 6.0 cfs (est); 7/3, 3.0 cfs (est); 7/15, 1.0 cfs (est); 7/18, 9.0 cfs (est); 8/21, 1.5 cfs (est).1986: 5/14, 2 cfs (est); 7/16, 3.5 cfs; 8/6, off.1987: 5/28, 8 cfs (est); 6/25, off (rotated).1989: 4/25, 4.1 cfs; 5/19, 11.2 cfs; 7/6, 14.5 cfs; 7/17, 9.0 cfs (est); 7/24, 6.0 cfs (est); 8/3, 8/16, 8/30, off.1990: 5/3, 6.7 cfs; 5/17, 4.5 cfs (est); 5/29, off; 6/1, 9.0 cfs (est); 7/6, 5.0 cfs; 7/18, 5.6 cfs; 7/31, 5.6 cfs; 8/14, 4.5 cfs (est).1991: 5/15, 3.0 cfs(est); 5/20, 4.0 cfs (est); 6/5, 6.0 cfs (est); 6/11, 8.5 cfs (est); 7/1, 11.0 cfs; 7/15, 5.7 cfs; 8/2, 4.0 cfs (est);
8/19, 4.0 cfs (est); 9/16, 3.5 cfs (est).1992: 4/23, off; 5/13, 4.5 cfs (est); 5/16, 8.0 cfs (est); 5/19, 8.8 cfs; 5/26, 8.8 cfs; 6/11, 6/12, 6/18, 7/7, 7/14, 7/16, off; 8/4, 2.0
cfs (est); 8/26, 2.0 cfs (est); 9/8, 1.5 cfs (est).1993: 5/18, 14.0 cfs (est); 7/8, 13.0 cfs (est); 7/11, 8.5 cfs (est); 7/19, 4.6 cfs; 7/21, 8.5 cfs; 7/23, 8.0 cfs; 7/28, 8.5 cfs; 8/10,
8.5 cfs; 8/18, 4.5 cfs (est); 9/27, 4.0 cfs (est).1994: 5/5, 5.0 cfs (est); 5/20, 4.5 cfs (est); 5/25, 9.0 cfs; 6/3, 12.0 cfs; 6/7, 8.7 cfs (arrive); 12.0 cfs (depart); 6/13, 12.0 cfs
(est) (arrive), 8.9 cfs (depart); 6/20, 8.9 cfs; 6/22, 9.0 cfs (arrive), off (depart); 6/24, 4.5 cfs (est) (arrive), off (depart);6/25, 6/27, 6/28, 7/1, 7/11, 7/15, off; 7/28, 5.5 cfs; 8/4, 2.0 cfs (est); 8/11, 2.0 cfs (est); 8/17, 1.5 cfs (est); 8/26, 1.0 cfs(est); 9/23, 1.5 cfs (est); 9/27, 1.0 cfs (est).
1995: 10/26/94, off; 4/20, 1.5 cfs (est); 5/8, 1.0 cfs (est); 5/22, 2.5 cfs (est); 5/24, 3.5 cfs (est); 5/26, 5 cfs (est); 7/17, 8.3 cfs;8/3, 1 cfs (est); 8/11, 2 cfs (est); 8/25, 0.5 cfs (est); 9/12, 0.25 cfs (est).
1996: 4/30, 0.5 cfs (est); 6/13, 20 cfs (est); 7/12, 7 cfs (est); 7/19, 2 cfs (est); 8/14, 0.5 cfs (est); 9/27, off.1997: 5/1, 1 cfs (est); 8/8, 6 cfs (est); 9/12, 3.0 cfs (est).1998: 5/12, 3 cfs (est); 6/10, 12.2 cfs; 6/19, 14.0 cfs; 7/27, 6.7 cfs; 8/14, 8/28, off.
Supply: 1980, average; 1981, slightly below average; 1982, average; 1983, above average; 1984, above average; 1985,slightly below average; 1986, average; 1987, average; 1988, below average; 1989, below average; 1990, below average;1991, slightly below average; 1992; below average; 1993, average; 1994, below average; 1995, slightly above average;1996, average; 1997, average; 1998, slightly above average.
Source: State Engineer’s Office, Annual Hydrographers’ Reports.
Green River Basin, Wyoming; Key Structures and DiversionsDescription and Operation Memorandum
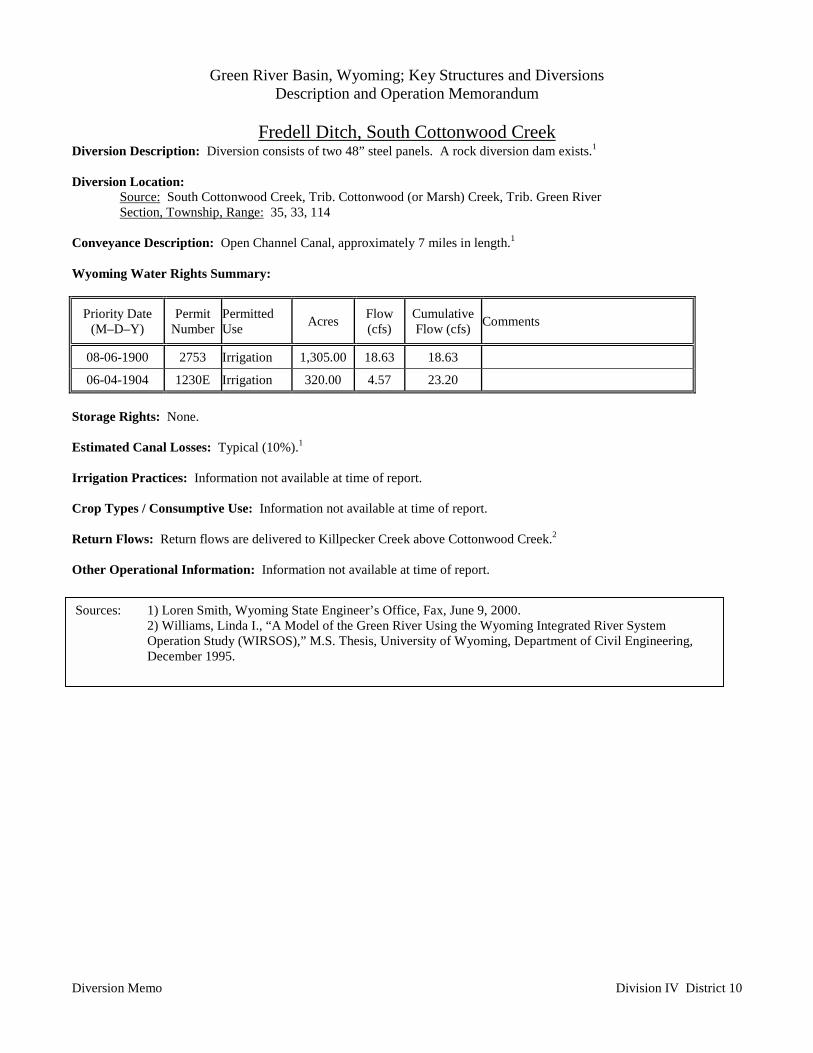
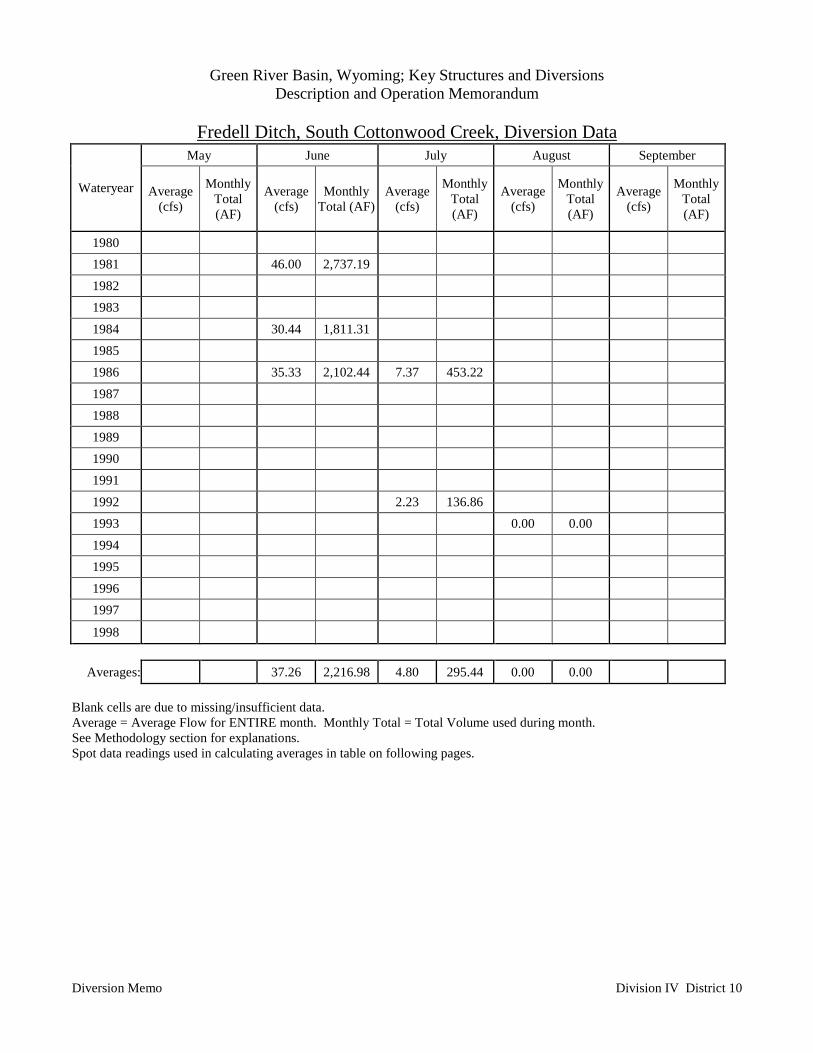
Fredell Ditch, South Cottonwood Creek
Diversion Memo Division IV District 10
Diversion Description: Diversion consists of two 48” steel panels. A rock diversion dam exists.1
Diversion Location:Source: South Cottonwood Creek, Trib. Cottonwood (or Marsh) Creek, Trib. Green RiverSection, Township, Range: 35, 33, 114
Conveyance Description: Open Channel Canal, approximately 7 miles in length.1
Wyoming Water Rights Summary:
Priority Date(M–D–Y)
PermitNumber
PermittedUse Acres Flow
(cfs)CumulativeFlow (cfs) Comments
08-06-1900 2753 Irrigation 1,305.00 18.63 18.63
06-04-1904 1230E Irrigation 320.00 4.57 23.20
Storage Rights: None.
Estimated Canal Losses: Typical (10%).1
Irrigation Practices: Information not available at time of report.
Crop Types / Consumptive Use: Information not available at time of report.
Return Flows: Return flows are delivered to Killpecker Creek above Cottonwood Creek.2
Other Operational Information: Information not available at time of report.
Sources: 1) Loren Smith, Wyoming State Engineer’s Office, Fax, June 9, 2000.2) Williams, Linda I., “A Model of the Green River Using the Wyoming Integrated River SystemOperation Study (WIRSOS),” M.S. Thesis, University of Wyoming, Department of Civil Engineering,December 1995.
Green River Basin, Wyoming; Key Structures and DiversionsDescription and Operation Memorandum
Fredell Ditch, South Cottonwood Creek, Diversion Data
Diversion Memo Division IV District 10
May June July August September
Wateryear Average(cfs)
MonthlyTotal(AF)
Average(cfs)
MonthlyTotal (AF)
Average(cfs)
MonthlyTotal(AF)
Average(cfs)
MonthlyTotal(AF)
Average(cfs)
MonthlyTotal(AF)
1980 1981 46.00 2,737.19 1982 1983 1984 30.44 1,811.31 1985 1986 35.33 2,102.44 7.37 453.22 1987 1988 1989 1990 1991 1992 2.23 136.86 1993 0.00 0.00 1994 1995 1996 1997
1998
Averages: 37.26 2,216.98 4.80 295.44 0.00 0.00
Blank cells are due to missing/insufficient data.Average = Average Flow for ENTIRE month. Monthly Total = Total Volume used during month.See Methodology section for explanations.Spot data readings used in calculating averages in table on following pages.
Green River Basin, Wyoming; Key Structures and DiversionsDescription and Operation Memorandum
Fredell Ditch, South Cottonwood Creek, Diversion Data
Diversion Memo Division IV District 10
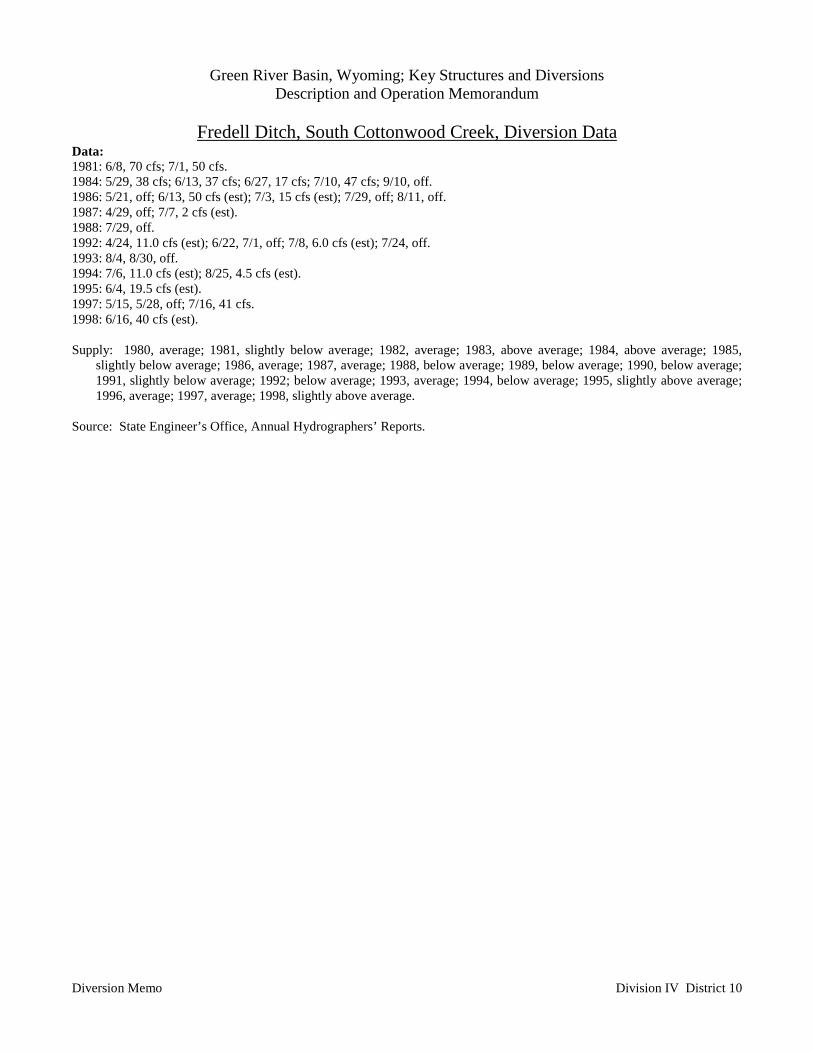
Data:1981: 6/8, 70 cfs; 7/1, 50 cfs.1984: 5/29, 38 cfs; 6/13, 37 cfs; 6/27, 17 cfs; 7/10, 47 cfs; 9/10, off.1986: 5/21, off; 6/13, 50 cfs (est); 7/3, 15 cfs (est); 7/29, off; 8/11, off.1987: 4/29, off; 7/7, 2 cfs (est).1988: 7/29, off.1992: 4/24, 11.0 cfs (est); 6/22, 7/1, off; 7/8, 6.0 cfs (est); 7/24, off.1993: 8/4, 8/30, off.1994: 7/6, 11.0 cfs (est); 8/25, 4.5 cfs (est).1995: 6/4, 19.5 cfs (est).1997: 5/15, 5/28, off; 7/16, 41 cfs.1998: 6/16, 40 cfs (est).
Supply: 1980, average; 1981, slightly below average; 1982, average; 1983, above average; 1984, above average; 1985,slightly below average; 1986, average; 1987, average; 1988, below average; 1989, below average; 1990, below average;1991, slightly below average; 1992; below average; 1993, average; 1994, below average; 1995, slightly above average;1996, average; 1997, average; 1998, slightly above average.
Source: State Engineer’s Office, Annual Hydrographers’ Reports.
Green River Basin, Wyoming; Key Structures and DiversionsDescription and Operation Memorandum
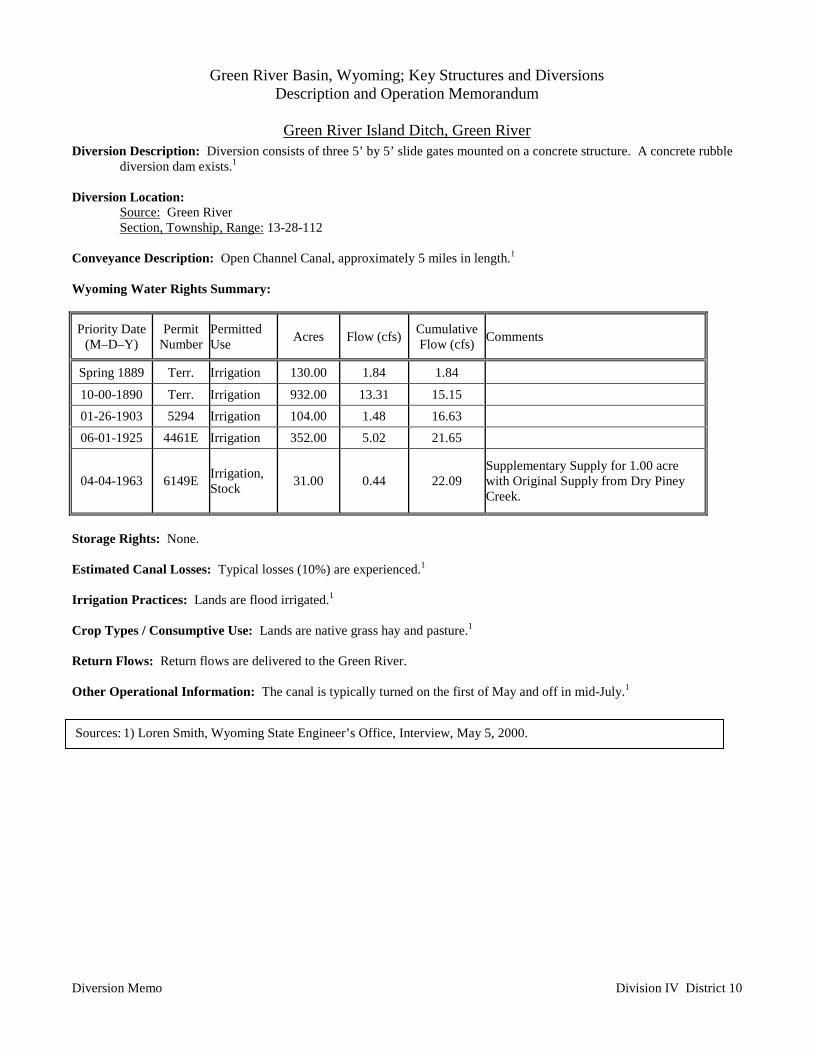
Green River Island Ditch, Green River
Diversion Memo Division IV District 10
Diversion Description: Diversion consists of three 5’ by 5’ slide gates mounted on a concrete structure. A concrete rubblediversion dam exists.1
Diversion Location:Source: Green RiverSection, Township, Range: 13-28-112
Conveyance Description: Open Channel Canal, approximately 5 miles in length.1
Wyoming Water Rights Summary:
Priority Date(M–D–Y)
PermitNumber
PermittedUse Acres Flow (cfs) Cumulative
Flow (cfs) Comments
Spring 1889 Terr. Irrigation 130.00 1.84 1.84
10-00-1890 Terr. Irrigation 932.00 13.31 15.15 01-26-1903 5294 Irrigation 104.00 1.48 16.63 06-01-1925 4461E Irrigation 352.00 5.02 21.65
04-04-1963 6149E Irrigation,Stock 31.00 0.44 22.09
Supplementary Supply for 1.00 acrewith Original Supply from Dry PineyCreek.
Storage Rights: None.
Estimated Canal Losses: Typical losses (10%) are experienced.1
Irrigation Practices: Lands are flood irrigated.1
Crop Types / Consumptive Use: Lands are native grass hay and pasture.1
Return Flows: Return flows are delivered to the Green River.
Other Operational Information: The canal is typically turned on the first of May and off in mid-July.1
Sources: 1) Loren Smith, Wyoming State Engineer’s Office, Interview, May 5, 2000.
Green River Basin, Wyoming; Key Structures and DiversionsDescription and Operation Memorandum
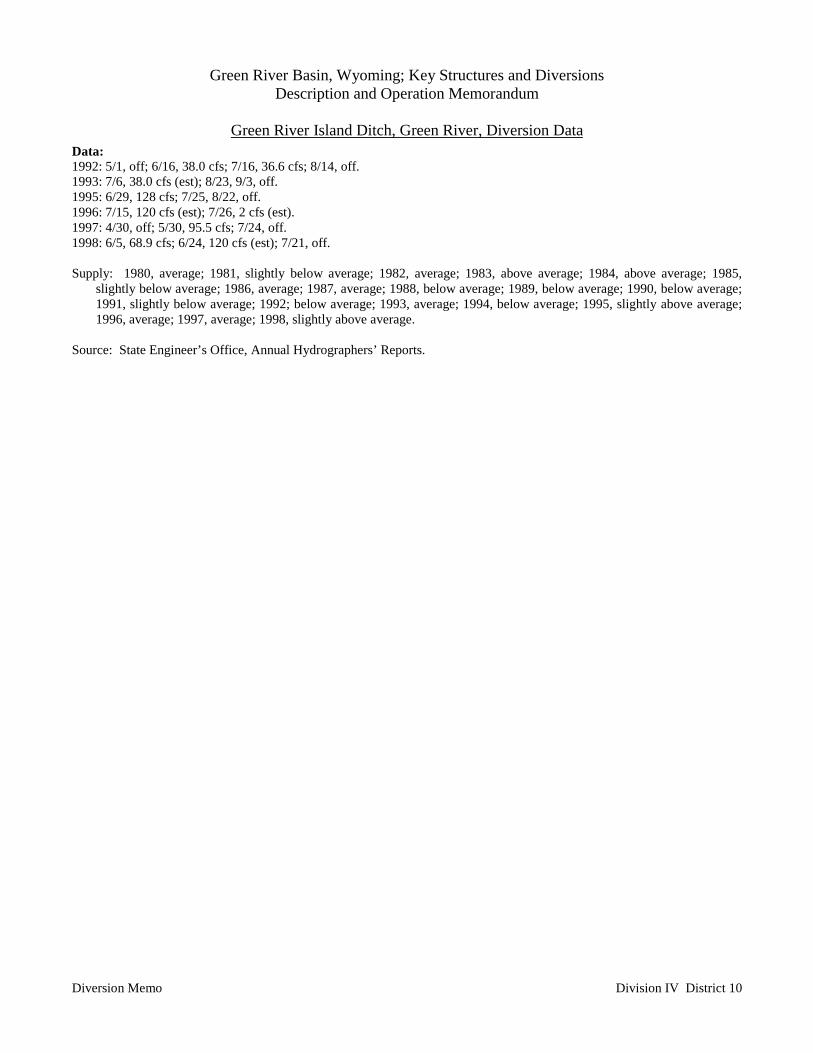
Green River Island Ditch, Green River, Diversion Data
Diversion Memo Division IV District 10
Data:1992: 5/1, off; 6/16, 38.0 cfs; 7/16, 36.6 cfs; 8/14, off.1993: 7/6, 38.0 cfs (est); 8/23, 9/3, off.1995: 6/29, 128 cfs; 7/25, 8/22, off.1996: 7/15, 120 cfs (est); 7/26, 2 cfs (est).1997: 4/30, off; 5/30, 95.5 cfs; 7/24, off.1998: 6/5, 68.9 cfs; 6/24, 120 cfs (est); 7/21, off.
Supply: 1980, average; 1981, slightly below average; 1982, average; 1983, above average; 1984, above average; 1985,slightly below average; 1986, average; 1987, average; 1988, below average; 1989, below average; 1990, below average;1991, slightly below average; 1992; below average; 1993, average; 1994, below average; 1995, slightly above average;1996, average; 1997, average; 1998, slightly above average.
Source: State Engineer’s Office, Annual Hydrographers’ Reports.
Green River Basin, Wyoming; Key Structures and DiversionsDescription and Operation Memorandum
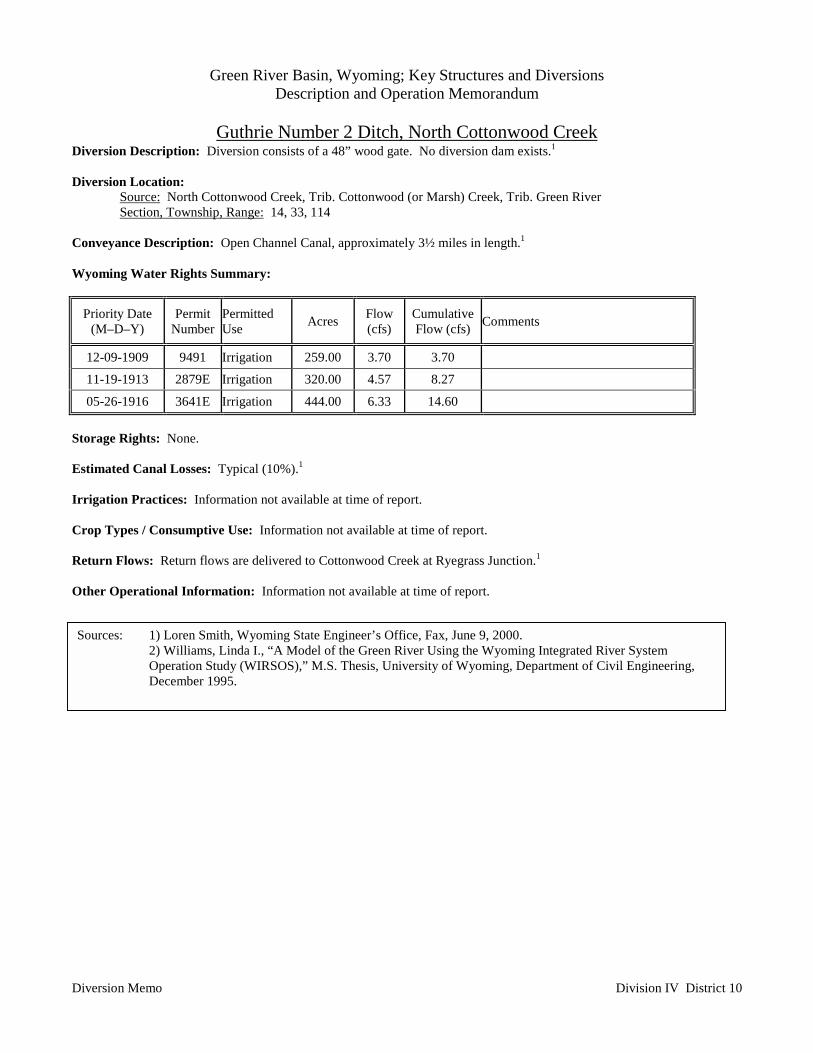
Guthrie Number 2 Ditch, North Cottonwood Creek
Diversion Memo Division IV District 10
Diversion Description: Diversion consists of a 48” wood gate. No diversion dam exists.1
Diversion Location:Source: North Cottonwood Creek, Trib. Cottonwood (or Marsh) Creek, Trib. Green RiverSection, Township, Range: 14, 33, 114
Conveyance Description: Open Channel Canal, approximately 3½ miles in length.1
Wyoming Water Rights Summary:
Priority Date(M–D–Y)
PermitNumber
PermittedUse Acres Flow
(cfs)CumulativeFlow (cfs) Comments
12-09-1909 9491 Irrigation 259.00 3.70 3.70
11-19-1913 2879E Irrigation 320.00 4.57 8.27
05-26-1916 3641E Irrigation 444.00 6.33 14.60
Storage Rights: None.
Estimated Canal Losses: Typical (10%).1
Irrigation Practices: Information not available at time of report.
Crop Types / Consumptive Use: Information not available at time of report.
Return Flows: Return flows are delivered to Cottonwood Creek at Ryegrass Junction.1
Other Operational Information: Information not available at time of report.
Sources: 1) Loren Smith, Wyoming State Engineer’s Office, Fax, June 9, 2000.2) Williams, Linda I., “A Model of the Green River Using the Wyoming Integrated River SystemOperation Study (WIRSOS),” M.S. Thesis, University of Wyoming, Department of Civil Engineering,December 1995.
Green River Basin, Wyoming; Key Structures and DiversionsDescription and Operation Memorandum
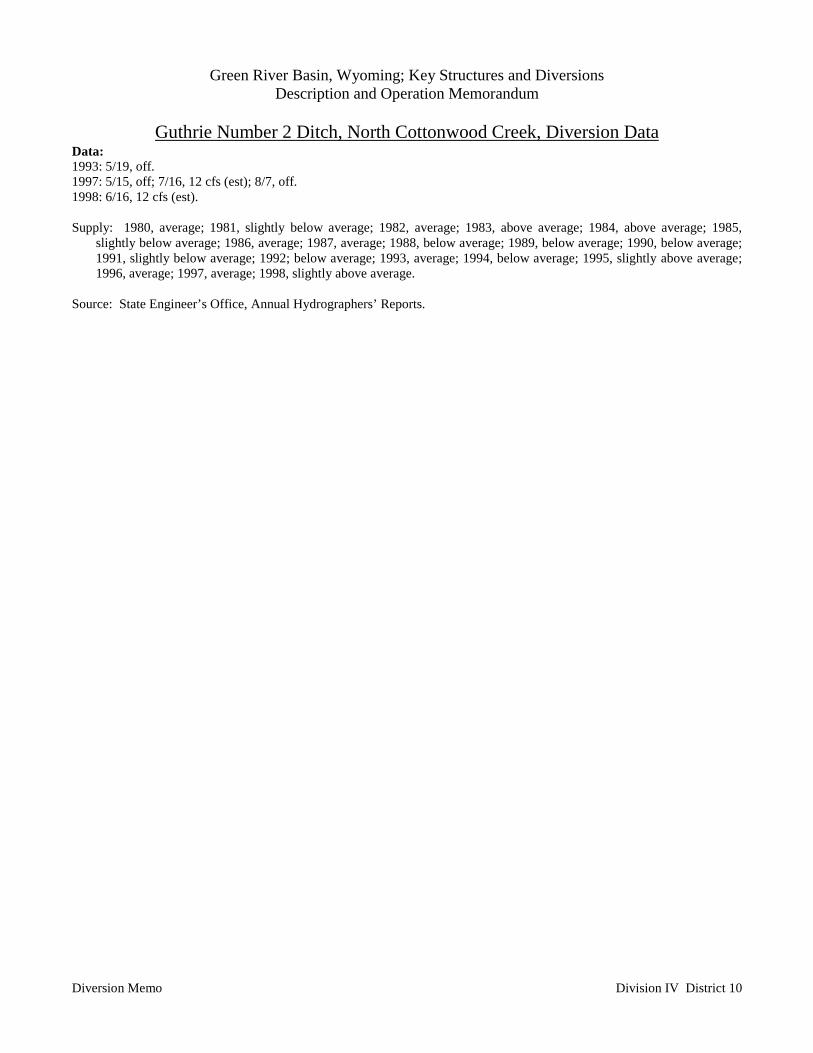
Guthrie Number 2 Ditch, North Cottonwood Creek, Diversion Data
Diversion Memo Division IV District 10
Data:1993: 5/19, off.1997: 5/15, off; 7/16, 12 cfs (est); 8/7, off.1998: 6/16, 12 cfs (est).
Supply: 1980, average; 1981, slightly below average; 1982, average; 1983, above average; 1984, above average; 1985,slightly below average; 1986, average; 1987, average; 1988, below average; 1989, below average; 1990, below average;1991, slightly below average; 1992; below average; 1993, average; 1994, below average; 1995, slightly above average;1996, average; 1997, average; 1998, slightly above average.
Source: State Engineer’s Office, Annual Hydrographers’ Reports.
Green River Basin, Wyoming; Key Structures and DiversionsDescription and Operation Memorandum
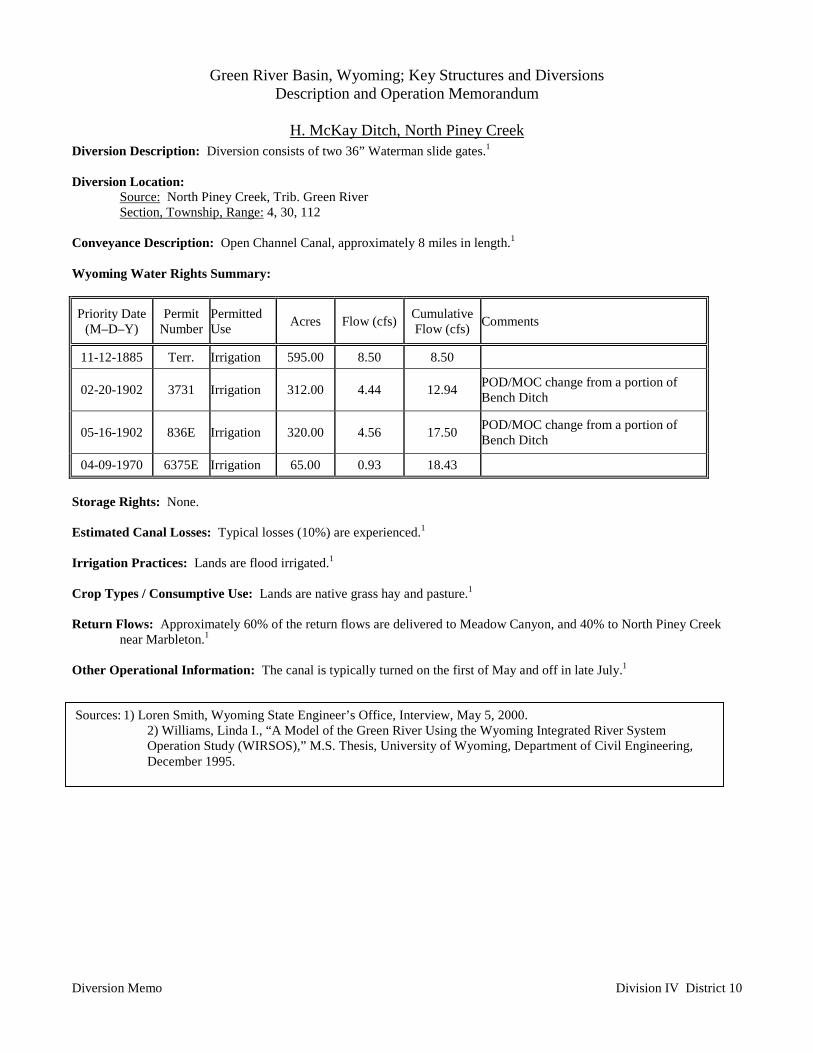
H. McKay Ditch, North Piney Creek
Diversion Memo Division IV District 10
Diversion Description: Diversion consists of two 36” Waterman slide gates.1
Diversion Location:Source: North Piney Creek, Trib. Green RiverSection, Township, Range: 4, 30, 112
Conveyance Description: Open Channel Canal, approximately 8 miles in length.1
Wyoming Water Rights Summary:
Priority Date(M–D–Y)
PermitNumber
PermittedUse Acres Flow (cfs) Cumulative
Flow (cfs) Comments
11-12-1885 Terr. Irrigation 595.00 8.50 8.50
02-20-1902 3731 Irrigation 312.00 4.44 12.94 POD/MOC change from a portion ofBench Ditch
05-16-1902 836E Irrigation 320.00 4.56 17.50 POD/MOC change from a portion ofBench Ditch
04-09-1970 6375E Irrigation 65.00 0.93 18.43
Storage Rights: None.
Estimated Canal Losses: Typical losses (10%) are experienced.1
Irrigation Practices: Lands are flood irrigated.1
Crop Types / Consumptive Use: Lands are native grass hay and pasture.1
Return Flows: Approximately 60% of the return flows are delivered to Meadow Canyon, and 40% to North Piney Creeknear Marbleton.1
Other Operational Information: The canal is typically turned on the first of May and off in late July.1
Sources: 1) Loren Smith, Wyoming State Engineer’s Office, Interview, May 5, 2000.2) Williams, Linda I., “A Model of the Green River Using the Wyoming Integrated River SystemOperation Study (WIRSOS),” M.S. Thesis, University of Wyoming, Department of Civil Engineering,December 1995.
Green River Basin, Wyoming; Key Structures and DiversionsDescription and Operation Memorandum
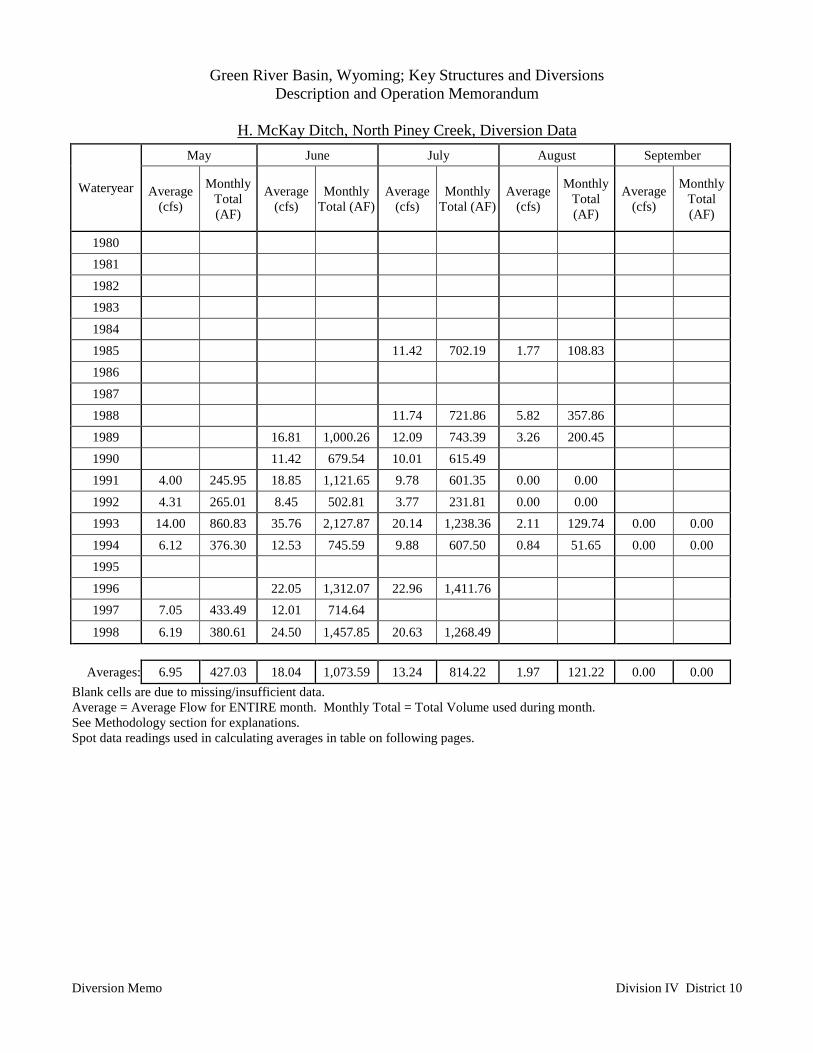
H. McKay Ditch, North Piney Creek, Diversion Data
Diversion Memo Division IV District 10
May June July August September
Wateryear Average(cfs)
MonthlyTotal(AF)
Average(cfs)
MonthlyTotal (AF)
Average(cfs)
MonthlyTotal (AF)
Average(cfs)
MonthlyTotal(AF)
Average(cfs)
MonthlyTotal(AF)
1980 1981 1982 1983 1984 1985 11.42 702.19 1.77 108.83 1986 1987 1988 11.74 721.86 5.82 357.86 1989 16.81 1,000.26 12.09 743.39 3.26 200.45 1990 11.42 679.54 10.01 615.49 1991 4.00 245.95 18.85 1,121.65 9.78 601.35 0.00 0.00 1992 4.31 265.01 8.45 502.81 3.77 231.81 0.00 0.00 1993 14.00 860.83 35.76 2,127.87 20.14 1,238.36 2.11 129.74 0.00 0.001994 6.12 376.30 12.53 745.59 9.88 607.50 0.84 51.65 0.00 0.001995 1996 22.05 1,312.07 22.96 1,411.76 1997 7.05 433.49 12.01 714.64
1998 6.19 380.61 24.50 1,457.85 20.63 1,268.49
Averages: 6.95 427.03 18.04 1,073.59 13.24 814.22 1.97 121.22 0.00 0.00Blank cells are due to missing/insufficient data.Average = Average Flow for ENTIRE month. Monthly Total = Total Volume used during month.See Methodology section for explanations.Spot data readings used in calculating averages in table on following pages.
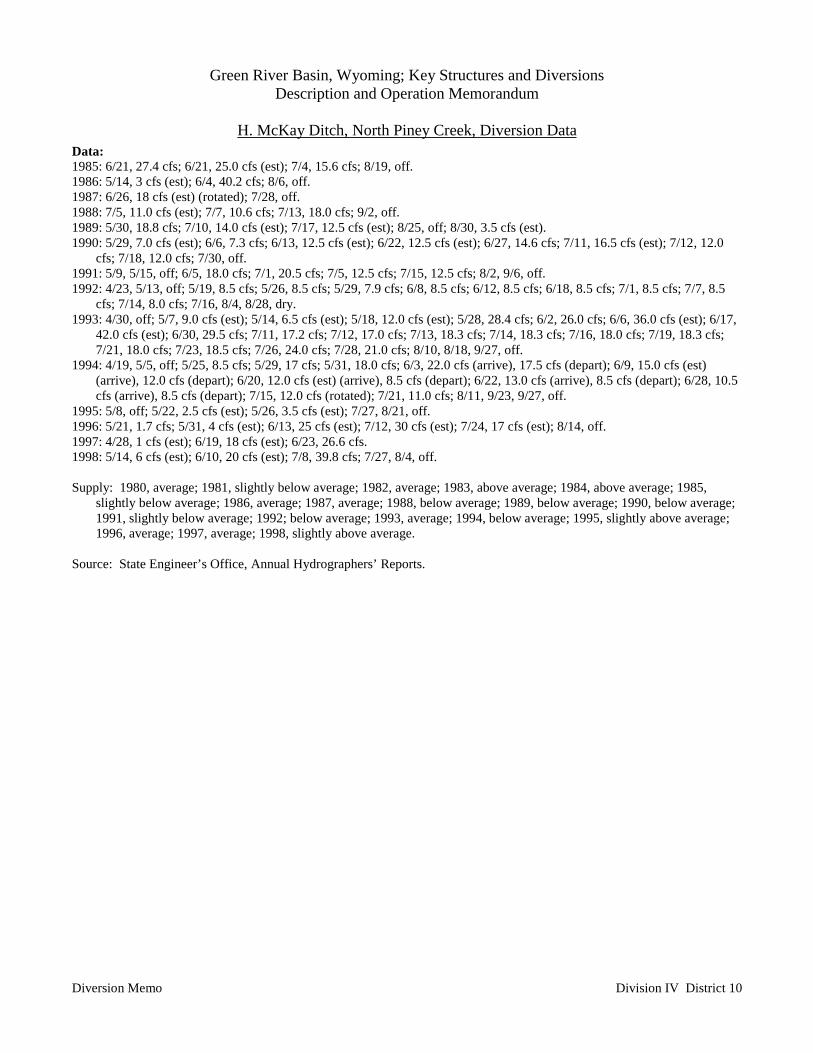
Green River Basin, Wyoming; Key Structures and DiversionsDescription and Operation Memorandum
H. McKay Ditch, North Piney Creek, Diversion Data
Diversion Memo Division IV District 10
Data:1985: 6/21, 27.4 cfs; 6/21, 25.0 cfs (est); 7/4, 15.6 cfs; 8/19, off.1986: 5/14, 3 cfs (est); 6/4, 40.2 cfs; 8/6, off.1987: 6/26, 18 cfs (est) (rotated); 7/28, off.1988: 7/5, 11.0 cfs (est); 7/7, 10.6 cfs; 7/13, 18.0 cfs; 9/2, off.1989: 5/30, 18.8 cfs; 7/10, 14.0 cfs (est); 7/17, 12.5 cfs (est); 8/25, off; 8/30, 3.5 cfs (est).1990: 5/29, 7.0 cfs (est); 6/6, 7.3 cfs; 6/13, 12.5 cfs (est); 6/22, 12.5 cfs (est); 6/27, 14.6 cfs; 7/11, 16.5 cfs (est); 7/12, 12.0
cfs; 7/18, 12.0 cfs; 7/30, off.1991: 5/9, 5/15, off; 6/5, 18.0 cfs; 7/1, 20.5 cfs; 7/5, 12.5 cfs; 7/15, 12.5 cfs; 8/2, 9/6, off.1992: 4/23, 5/13, off; 5/19, 8.5 cfs; 5/26, 8.5 cfs; 5/29, 7.9 cfs; 6/8, 8.5 cfs; 6/12, 8.5 cfs; 6/18, 8.5 cfs; 7/1, 8.5 cfs; 7/7, 8.5
cfs; 7/14, 8.0 cfs; 7/16, 8/4, 8/28, dry.1993: 4/30, off; 5/7, 9.0 cfs (est); 5/14, 6.5 cfs (est); 5/18, 12.0 cfs (est); 5/28, 28.4 cfs; 6/2, 26.0 cfs; 6/6, 36.0 cfs (est); 6/17,
42.0 cfs (est); 6/30, 29.5 cfs; 7/11, 17.2 cfs; 7/12, 17.0 cfs; 7/13, 18.3 cfs; 7/14, 18.3 cfs; 7/16, 18.0 cfs; 7/19, 18.3 cfs;7/21, 18.0 cfs; 7/23, 18.5 cfs; 7/26, 24.0 cfs; 7/28, 21.0 cfs; 8/10, 8/18, 9/27, off.
1994: 4/19, 5/5, off; 5/25, 8.5 cfs; 5/29, 17 cfs; 5/31, 18.0 cfs; 6/3, 22.0 cfs (arrive), 17.5 cfs (depart); 6/9, 15.0 cfs (est)(arrive), 12.0 cfs (depart); 6/20, 12.0 cfs (est) (arrive), 8.5 cfs (depart); 6/22, 13.0 cfs (arrive), 8.5 cfs (depart); 6/28, 10.5cfs (arrive), 8.5 cfs (depart); 7/15, 12.0 cfs (rotated); 7/21, 11.0 cfs; 8/11, 9/23, 9/27, off.
1995: 5/8, off; 5/22, 2.5 cfs (est); 5/26, 3.5 cfs (est); 7/27, 8/21, off.1996: 5/21, 1.7 cfs; 5/31, 4 cfs (est); 6/13, 25 cfs (est); 7/12, 30 cfs (est); 7/24, 17 cfs (est); 8/14, off.1997: 4/28, 1 cfs (est); 6/19, 18 cfs (est); 6/23, 26.6 cfs.1998: 5/14, 6 cfs (est); 6/10, 20 cfs (est); 7/8, 39.8 cfs; 7/27, 8/4, off.
Supply: 1980, average; 1981, slightly below average; 1982, average; 1983, above average; 1984, above average; 1985,slightly below average; 1986, average; 1987, average; 1988, below average; 1989, below average; 1990, below average;1991, slightly below average; 1992; below average; 1993, average; 1994, below average; 1995, slightly above average;1996, average; 1997, average; 1998, slightly above average.
Source: State Engineer’s Office, Annual Hydrographers’ Reports.
Green River Basin, Wyoming; Key Structures and DiversionsDescription and Operation Memorandum
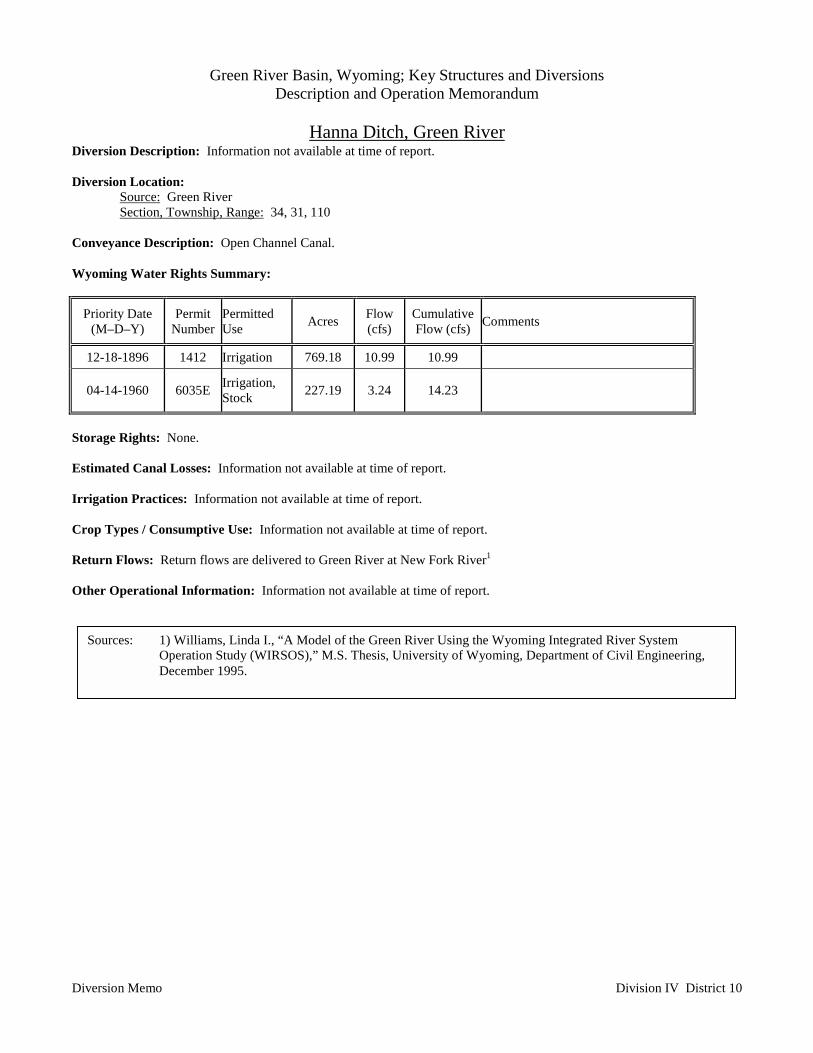
Hanna Ditch, Green River
Diversion Memo Division IV District 10
Diversion Description: Information not available at time of report.
Diversion Location:Source: Green RiverSection, Township, Range: 34, 31, 110
Conveyance Description: Open Channel Canal.
Wyoming Water Rights Summary:
Priority Date(M–D–Y)
PermitNumber
PermittedUse Acres Flow
(cfs)CumulativeFlow (cfs) Comments
12-18-1896 1412 Irrigation 769.18 10.99 10.99
04-14-1960 6035E Irrigation,Stock 227.19 3.24 14.23
Storage Rights: None.
Estimated Canal Losses: Information not available at time of report.
Irrigation Practices: Information not available at time of report.
Crop Types / Consumptive Use: Information not available at time of report.
Return Flows: Return flows are delivered to Green River at New Fork River1
Other Operational Information: Information not available at time of report.
Sources: 1) Williams, Linda I., “A Model of the Green River Using the Wyoming Integrated River SystemOperation Study (WIRSOS),” M.S. Thesis, University of Wyoming, Department of Civil Engineering,December 1995.
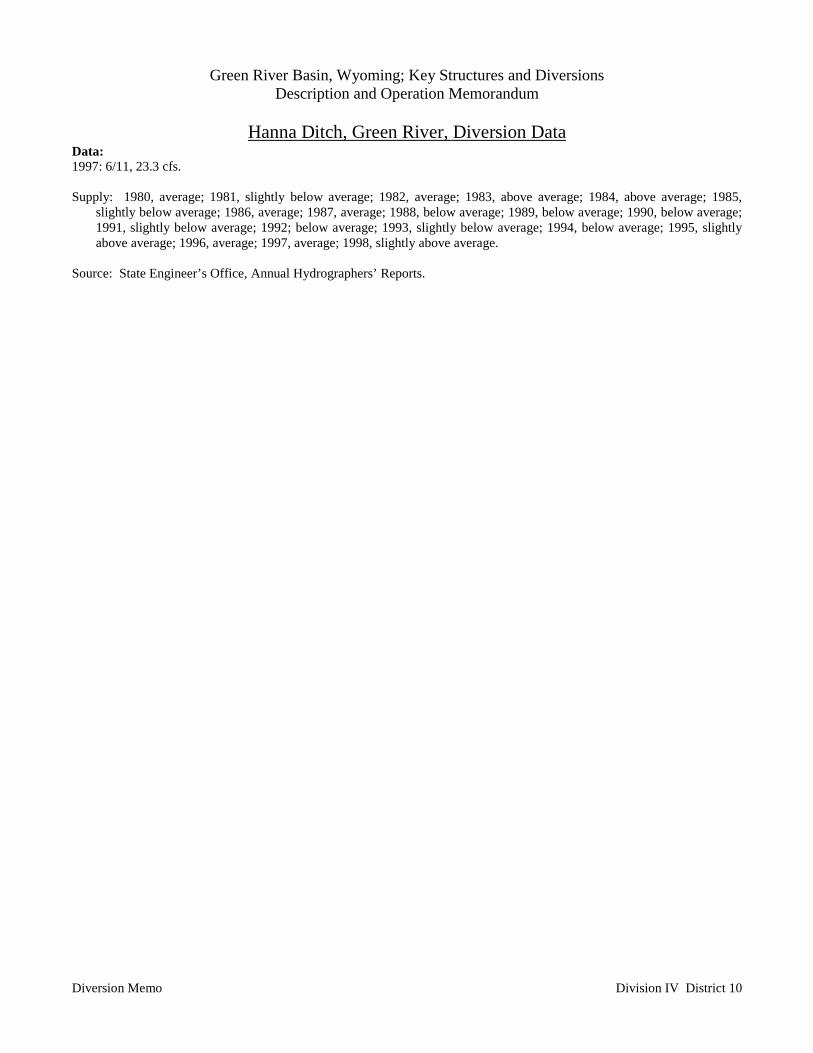
Green River Basin, Wyoming; Key Structures and DiversionsDescription and Operation Memorandum
Hanna Ditch, Green River, Diversion Data
Diversion Memo Division IV District 10
Data:1997: 6/11, 23.3 cfs.
Supply: 1980, average; 1981, slightly below average; 1982, average; 1983, above average; 1984, above average; 1985,slightly below average; 1986, average; 1987, average; 1988, below average; 1989, below average; 1990, below average;1991, slightly below average; 1992; below average; 1993, slightly below average; 1994, below average; 1995, slightlyabove average; 1996, average; 1997, average; 1998, slightly above average.
Source: State Engineer’s Office, Annual Hydrographers’ Reports.
Green River Basin, Wyoming; Key Structures and DiversionsDescription and Operation Memorandum
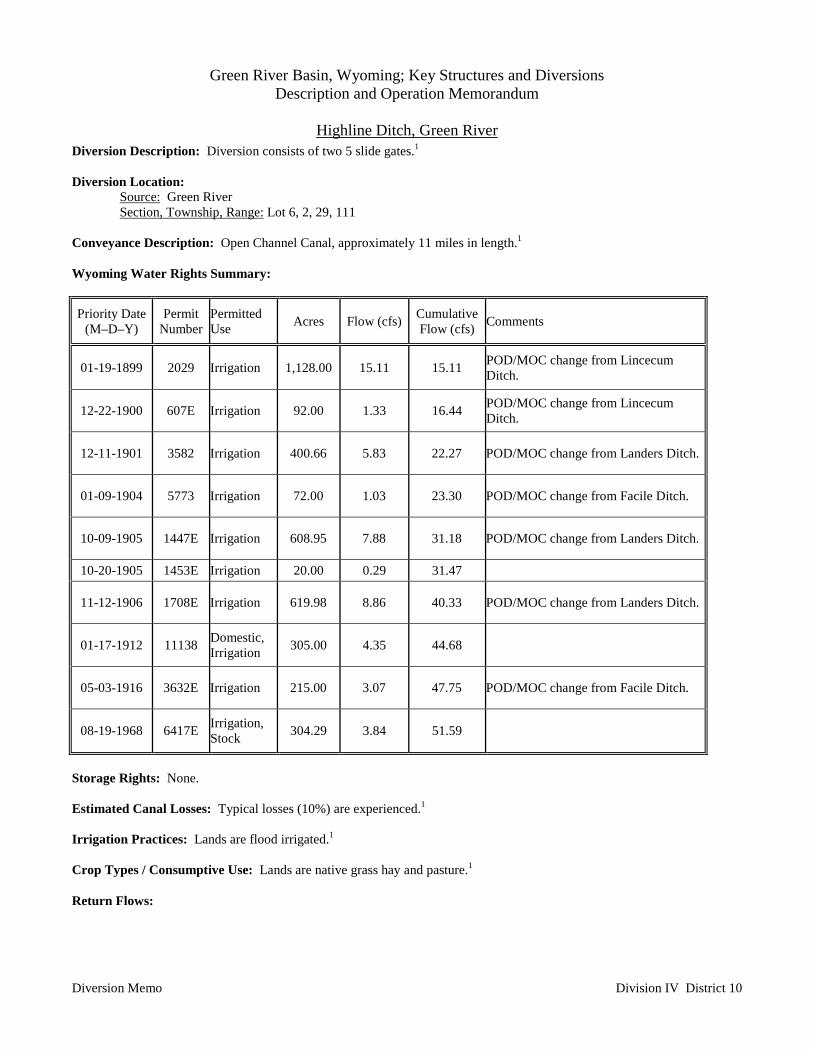
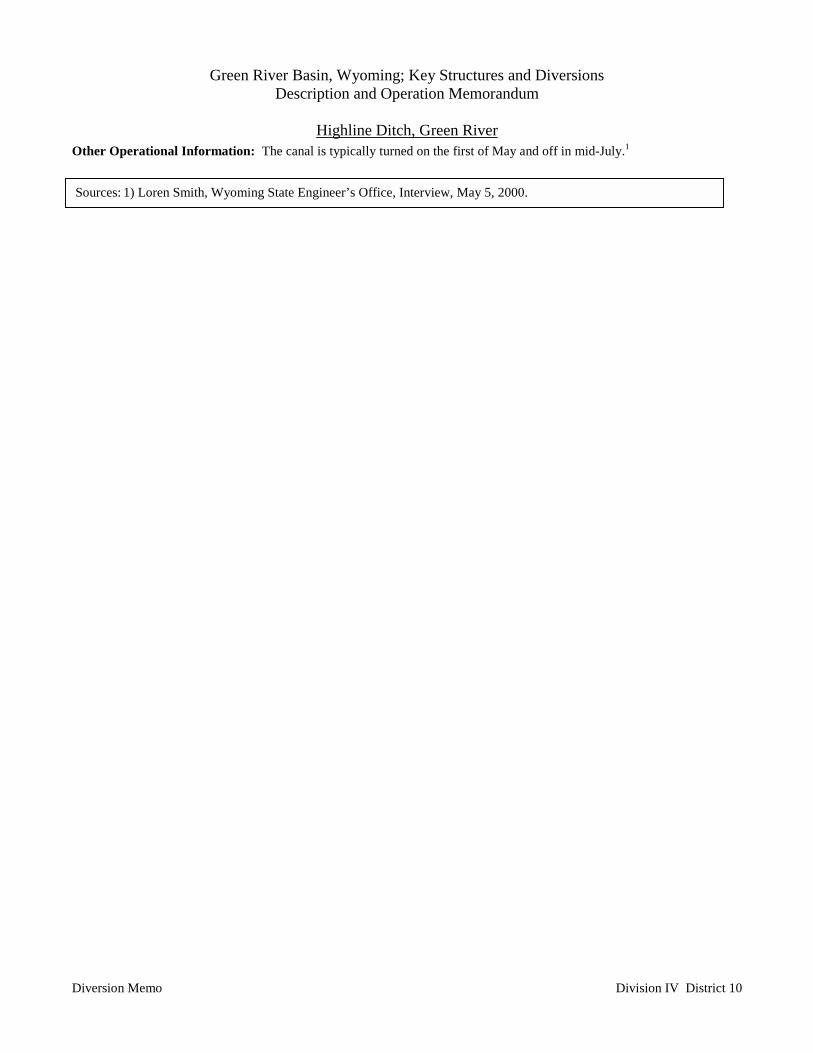
Highline Ditch, Green River
Diversion Memo Division IV District 10
Diversion Description: Diversion consists of two 5 slide gates.1
Diversion Location:Source: Green RiverSection, Township, Range: Lot 6, 2, 29, 111
Conveyance Description: Open Channel Canal, approximately 11 miles in length.1
Wyoming Water Rights Summary:
Priority Date(M–D–Y)
PermitNumber
PermittedUse Acres Flow (cfs) Cumulative
Flow (cfs) Comments
01-19-1899 2029 Irrigation 1,128.00 15.11 15.11 POD/MOC change from LincecumDitch.
12-22-1900 607E Irrigation 92.00 1.33 16.44 POD/MOC change from LincecumDitch.
12-11-1901 3582 Irrigation 400.66 5.83 22.27 POD/MOC change from Landers Ditch.
01-09-1904 5773 Irrigation 72.00 1.03 23.30 POD/MOC change from Facile Ditch.
10-09-1905 1447E Irrigation 608.95 7.88 31.18 POD/MOC change from Landers Ditch.
10-20-1905 1453E Irrigation 20.00 0.29 31.47
11-12-1906 1708E Irrigation 619.98 8.86 40.33 POD/MOC change from Landers Ditch.
01-17-1912 11138 Domestic,Irrigation 305.00 4.35 44.68
05-03-1916 3632E Irrigation 215.00 3.07 47.75 POD/MOC change from Facile Ditch.
08-19-1968 6417E Irrigation,Stock 304.29 3.84 51.59
Storage Rights: None.
Estimated Canal Losses: Typical losses (10%) are experienced.1
Irrigation Practices: Lands are flood irrigated.1
Crop Types / Consumptive Use: Lands are native grass hay and pasture.1
Return Flows:
Green River Basin, Wyoming; Key Structures and DiversionsDescription and Operation Memorandum
Highline Ditch, Green River
Diversion Memo Division IV District 10
Other Operational Information: The canal is typically turned on the first of May and off in mid-July.1
Sources: 1) Loren Smith, Wyoming State Engineer’s Office, Interview, May 5, 2000.
Green River Basin, Wyoming; Key Structures and DiversionsDescription and Operation Memorandum
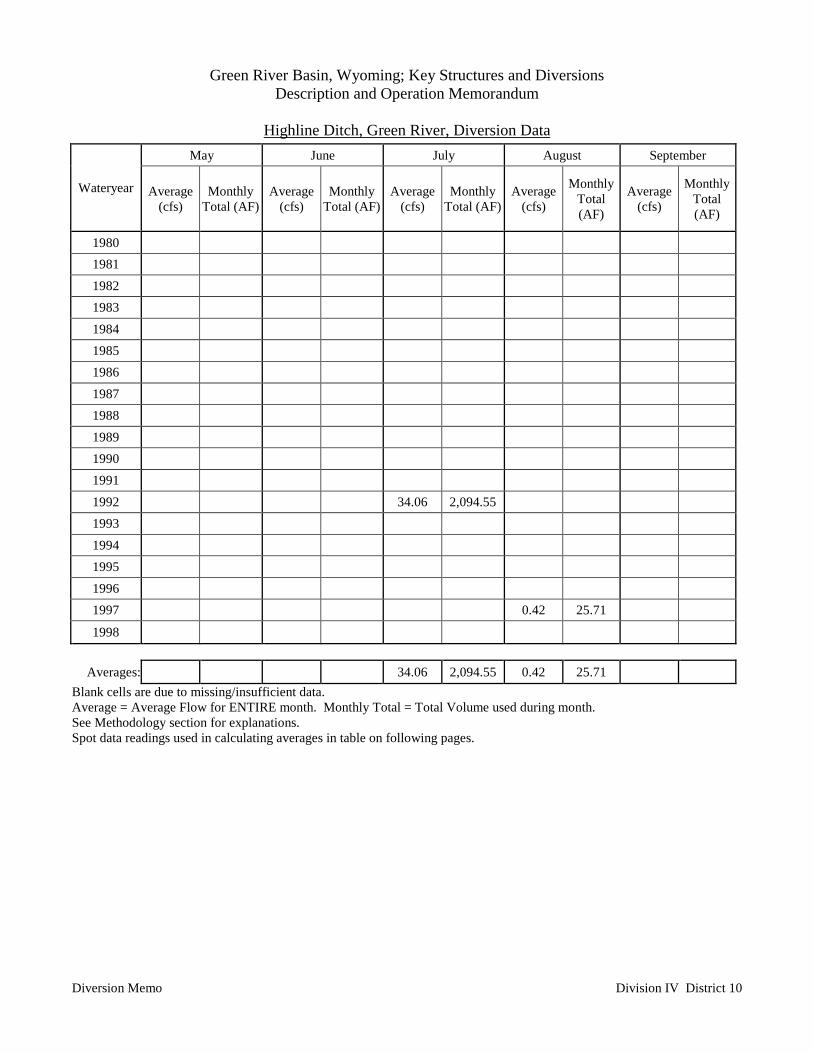
Highline Ditch, Green River, Diversion Data
Diversion Memo Division IV District 10
May June July August September
Wateryear Average(cfs)
MonthlyTotal (AF)
Average(cfs)
MonthlyTotal (AF)
Average(cfs)
MonthlyTotal (AF)
Average(cfs)
MonthlyTotal(AF)
Average(cfs)
MonthlyTotal(AF)
1980 1981 1982 1983 1984 1985 1986 1987 1988 1989 1990 1991 1992 34.06 2,094.551993 1994 1995 1996 1997 0.42 25.71
1998
Averages: 34.06 2,094.55 0.42 25.71Blank cells are due to missing/insufficient data.Average = Average Flow for ENTIRE month. Monthly Total = Total Volume used during month.See Methodology section for explanations.Spot data readings used in calculating averages in table on following pages.
Green River Basin, Wyoming; Key Structures and DiversionsDescription and Operation Memorandum
Highline Ditch, Green River, Diversion Data
Diversion Memo Division IV District 10
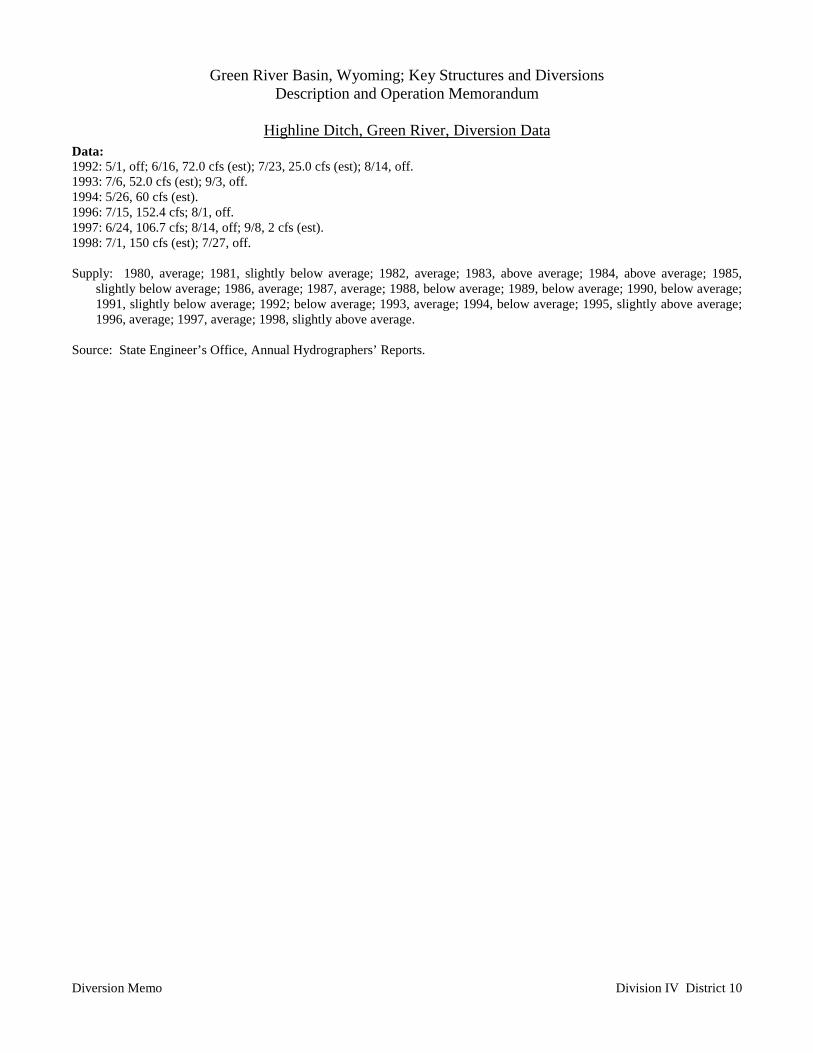
Data:1992: 5/1, off; 6/16, 72.0 cfs (est); 7/23, 25.0 cfs (est); 8/14, off.1993: 7/6, 52.0 cfs (est); 9/3, off.1994: 5/26, 60 cfs (est).1996: 7/15, 152.4 cfs; 8/1, off.1997: 6/24, 106.7 cfs; 8/14, off; 9/8, 2 cfs (est).1998: 7/1, 150 cfs (est); 7/27, off.
Supply: 1980, average; 1981, slightly below average; 1982, average; 1983, above average; 1984, above average; 1985,slightly below average; 1986, average; 1987, average; 1988, below average; 1989, below average; 1990, below average;1991, slightly below average; 1992; below average; 1993, average; 1994, below average; 1995, slightly above average;1996, average; 1997, average; 1998, slightly above average.
Source: State Engineer’s Office, Annual Hydrographers’ Reports.

Green River Basin, Wyoming; Key Structures and DiversionsDescription and Operation Memorandum
Hill Ditch, Green River
Diversion Memo Division IV District 10
Diversion Description: Information not available at time of report.
Diversion Location:Source: Green RiverSection, Township, Range: 16, 32, 110
Conveyance Description: Open Channel Canal.
Wyoming Water Rights Summary:
Priority Date(M–D–Y)
PermitNumber
PermittedUse Acres Flow
(cfs)CumulativeFlow (cfs) Comments
10-15-1897 1625 Irrigation 723.00 10.32 10.32
04-10-1902 812E Irrigation 446.00 6.37 16.69
06-30-1908 1913E Domestic,Irrigation 450.00 6.43 23.12
11-05-1934 4992E Domestic,Irrigation 146.00 2.08 25.20
05-07-1971 6423E Irrigation 218.00 3.11 28.31
Storage Rights: None.
Estimated Canal Losses: Information not available at time of report.
Irrigation Practices: Information not available at time of report.
Crop Types / Consumptive Use: Information not available at time of report.
Return Flows: Approximately 65% of the return flows are delivered to Green River at Crandall Ditch, and approximately35% to Green River at New Fork River.1
Other Operational Information: Information not available at time of report.
Sources: 1) Williams, Linda I., “A Model of the Green River Using the Wyoming Integrated River SystemOperation Study (WIRSOS),” M.S. Thesis, University of Wyoming, Department of Civil Engineering,December 1995.

Green River Basin, Wyoming; Key Structures and DiversionsDescription and Operation Memorandum
Hill Ditch, Green River, Diversion Data
Diversion Memo Division IV District 10
May June July August September
Wateryear Average(cfs)
MonthlyTotal(AF)
Average(cfs)
MonthlyTotal (AF)
Average(cfs)
MonthlyTotal (AF)
Average(cfs)
MonthlyTotal(AF)
Average(cfs)
MonthlyTotal(AF)
1980 1981 1982 1983 1984 1985 1986 1987 1988 1989 1990 1991 1992 9.69 595.811993 11.22 689.89 0.00 0.00 0.00 0.001994 1995 9.80 602.601996 17.58 1,046.36 1997 0.00 0.00
1998 27.00 1,606.61
Averages: 18.79 1,326.49 10.24 629.43 0.00 0.00 0.00 0.00
Blank cells are due to missing/insufficient data.Average = Average Flow for ENTIRE month. Monthly Total = Total Volume used during month.See Methodology section for explanations.Spot data readings used in calculating averages in table on following pages.
Green River Basin, Wyoming; Key Structures and DiversionsDescription and Operation Memorandum
Hill Ditch, Green River, Diversion Data
Diversion Memo Division IV District 10
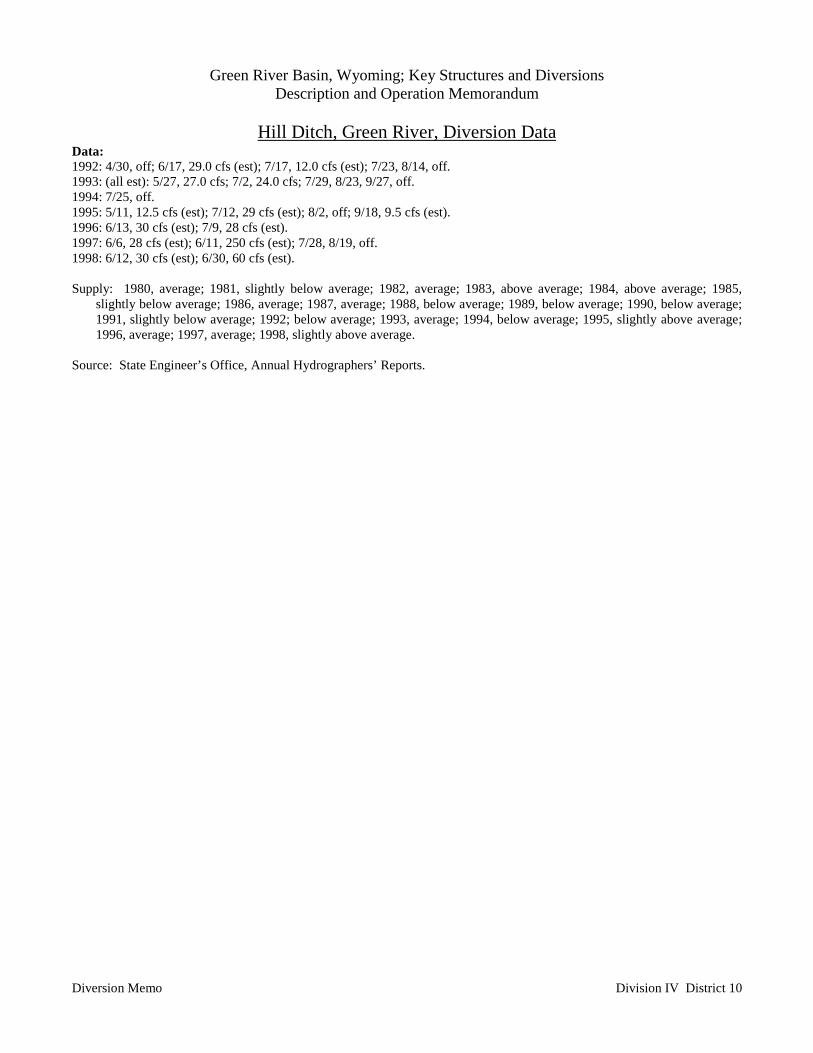
Data:1992: 4/30, off; 6/17, 29.0 cfs (est); 7/17, 12.0 cfs (est); 7/23, 8/14, off.1993: (all est): 5/27, 27.0 cfs; 7/2, 24.0 cfs; 7/29, 8/23, 9/27, off.1994: 7/25, off.1995: 5/11, 12.5 cfs (est); 7/12, 29 cfs (est); 8/2, off; 9/18, 9.5 cfs (est).1996: 6/13, 30 cfs (est); 7/9, 28 cfs (est).1997: 6/6, 28 cfs (est); 6/11, 250 cfs (est); 7/28, 8/19, off.1998: 6/12, 30 cfs (est); 6/30, 60 cfs (est).
Supply: 1980, average; 1981, slightly below average; 1982, average; 1983, above average; 1984, above average; 1985,slightly below average; 1986, average; 1987, average; 1988, below average; 1989, below average; 1990, below average;1991, slightly below average; 1992; below average; 1993, average; 1994, below average; 1995, slightly above average;1996, average; 1997, average; 1998, slightly above average.
Source: State Engineer’s Office, Annual Hydrographers’ Reports.
Green River Basin, Wyoming; Key Structures and DiversionsDescription and Operation Memorandum
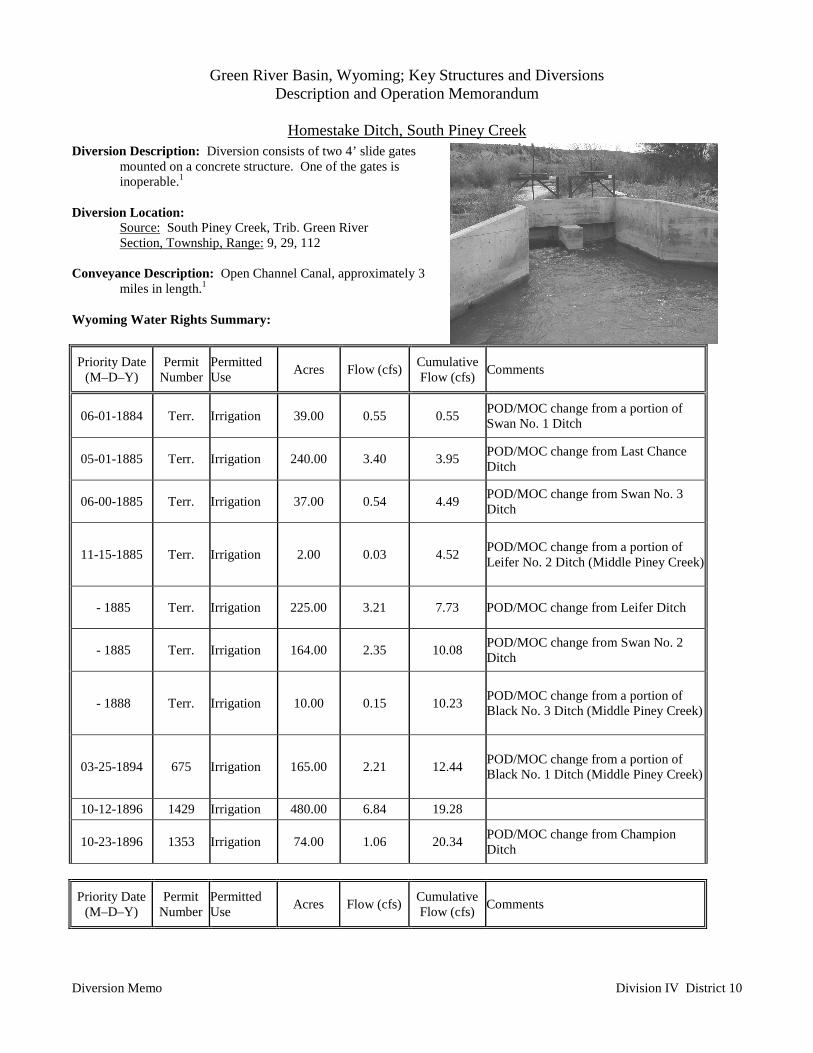
Homestake Ditch, South Piney Creek
Diversion Memo Division IV District 10
Diversion Description: Diversion consists of two 4’ slide gatesmounted on a concrete structure. One of the gates isinoperable.1
Diversion Location:Source: South Piney Creek, Trib. Green RiverSection, Township, Range: 9, 29, 112
Conveyance Description: Open Channel Canal, approximately 3miles in length.1
Wyoming Water Rights Summary:
Priority Date(M–D–Y)
PermitNumber
PermittedUse Acres Flow (cfs) Cumulative
Flow (cfs) Comments
06-01-1884 Terr. Irrigation 39.00 0.55 0.55 POD/MOC change from a portion ofSwan No. 1 Ditch
05-01-1885 Terr. Irrigation 240.00 3.40 3.95 POD/MOC change from Last ChanceDitch
06-00-1885 Terr. Irrigation 37.00 0.54 4.49 POD/MOC change from Swan No. 3Ditch
11-15-1885 Terr. Irrigation 2.00 0.03 4.52 POD/MOC change from a portion ofLeifer No. 2 Ditch (Middle Piney Creek)
- 1885 Terr. Irrigation 225.00 3.21 7.73 POD/MOC change from Leifer Ditch
- 1885 Terr. Irrigation 164.00 2.35 10.08 POD/MOC change from Swan No. 2Ditch
- 1888 Terr. Irrigation 10.00 0.15 10.23 POD/MOC change from a portion ofBlack No. 3 Ditch (Middle Piney Creek)
03-25-1894 675 Irrigation 165.00 2.21 12.44 POD/MOC change from a portion ofBlack No. 1 Ditch (Middle Piney Creek)
10-12-1896 1429 Irrigation 480.00 6.84 19.28
10-23-1896 1353 Irrigation 74.00 1.06 20.34 POD/MOC change from ChampionDitch
Priority Date(M–D–Y)
PermitNumber
PermittedUse Acres Flow (cfs) Cumulative
Flow (cfs) Comments
Green River Basin, Wyoming; Key Structures and DiversionsDescription and Operation Memorandum
Homestake Ditch, South Piney Creek
Diversion Memo Division IV District 10
09-26-1898 1957 Irrigation 108.00 1.54 21.88 POD/MOC change from a portion ofSwan No. 1 Ditch
05-13-1901 3177 Irrigation 55.00 0.79 22.67 POD/MOC change from Bolinger Ditch.
05-26-1911 10714 Irrigation 82.00 1.17 23.84 POD/MOC change from May Ditch.
05-26-1911 2476E Irrigation 40.00 0.57 24.41
05-26-1911 2477E Irrigation 18.00 0.26 24.67 POD/MOC change from ChampionDitch
09-20-1969 6320E Irrigation 247.33 3.53 28.20
Supplementary Supply for 380.00 acreswith Original Supply from Middle PineyCreek and Spring Creek (trib. SouthPiney Creek).
Storage Rights: None.
Estimated Canal Losses: Typical losses (10%) are experienced.1
Irrigation Practices: Lands are flood irrigated.1
Crop Types / Consumptive Use: Lands are native grass hay and pasture.1
Return Flows: Approximately 75% of the return flows are delivered to Middle Piney Creek above North Channel, and 25%to North Piney Creek at West Meadow Canyon.2
Other Operational Information: The canal is typically turned on the first of May and off in mid-July.1
Sources: 1) Loren Smith, Wyoming State Engineer’s Office, Interview, May 5, 2000.2) Williams, Linda I., “A Model of the Green River Using the Wyoming Integrated River SystemOperation Study (WIRSOS),” M.S. Thesis, University of Wyoming, Department of Civil Engineering,December 1995.
Green River Basin, Wyoming; Key Structures and DiversionsDescription and Operation Memorandum
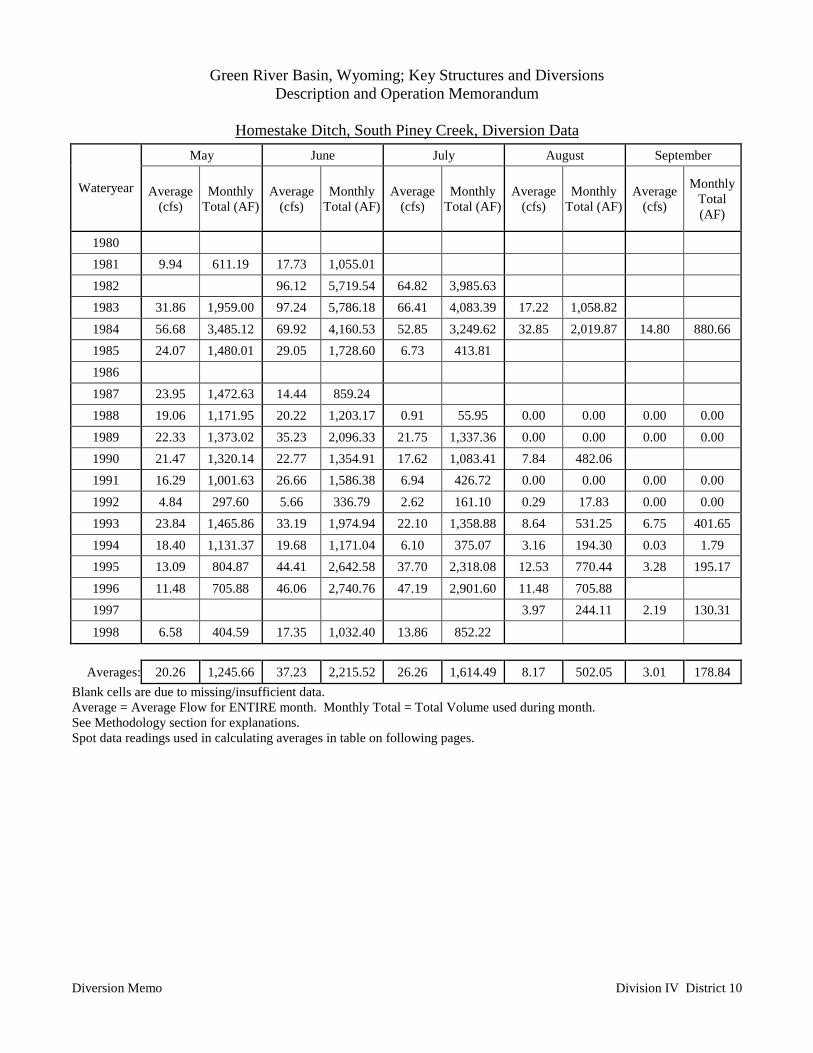
Homestake Ditch, South Piney Creek, Diversion Data
Diversion Memo Division IV District 10
May June July August September
Wateryear Average(cfs)
MonthlyTotal (AF)
Average(cfs)
MonthlyTotal (AF)
Average(cfs)
MonthlyTotal (AF)
Average(cfs)
MonthlyTotal (AF)
Average(cfs)
MonthlyTotal(AF)
1980 1981 9.94 611.19 17.73 1,055.01 1982 96.12 5,719.54 64.82 3,985.631983 31.86 1,959.00 97.24 5,786.18 66.41 4,083.39 17.22 1,058.821984 56.68 3,485.12 69.92 4,160.53 52.85 3,249.62 32.85 2,019.87 14.80 880.661985 24.07 1,480.01 29.05 1,728.60 6.73 413.811986 1987 23.95 1,472.63 14.44 859.24 1988 19.06 1,171.95 20.22 1,203.17 0.91 55.95 0.00 0.00 0.00 0.001989 22.33 1,373.02 35.23 2,096.33 21.75 1,337.36 0.00 0.00 0.00 0.001990 21.47 1,320.14 22.77 1,354.91 17.62 1,083.41 7.84 482.06 1991 16.29 1,001.63 26.66 1,586.38 6.94 426.72 0.00 0.00 0.00 0.001992 4.84 297.60 5.66 336.79 2.62 161.10 0.29 17.83 0.00 0.001993 23.84 1,465.86 33.19 1,974.94 22.10 1,358.88 8.64 531.25 6.75 401.651994 18.40 1,131.37 19.68 1,171.04 6.10 375.07 3.16 194.30 0.03 1.791995 13.09 804.87 44.41 2,642.58 37.70 2,318.08 12.53 770.44 3.28 195.171996 11.48 705.88 46.06 2,740.76 47.19 2,901.60 11.48 705.88 1997 3.97 244.11 2.19 130.31
1998 6.58 404.59 17.35 1,032.40 13.86 852.22
Averages: 20.26 1,245.66 37.23 2,215.52 26.26 1,614.49 8.17 502.05 3.01 178.84Blank cells are due to missing/insufficient data.Average = Average Flow for ENTIRE month. Monthly Total = Total Volume used during month.See Methodology section for explanations.Spot data readings used in calculating averages in table on following pages.
Green River Basin, Wyoming; Key Structures and DiversionsDescription and Operation Memorandum
Homestake Ditch, South Piney Creek, Diversion Data
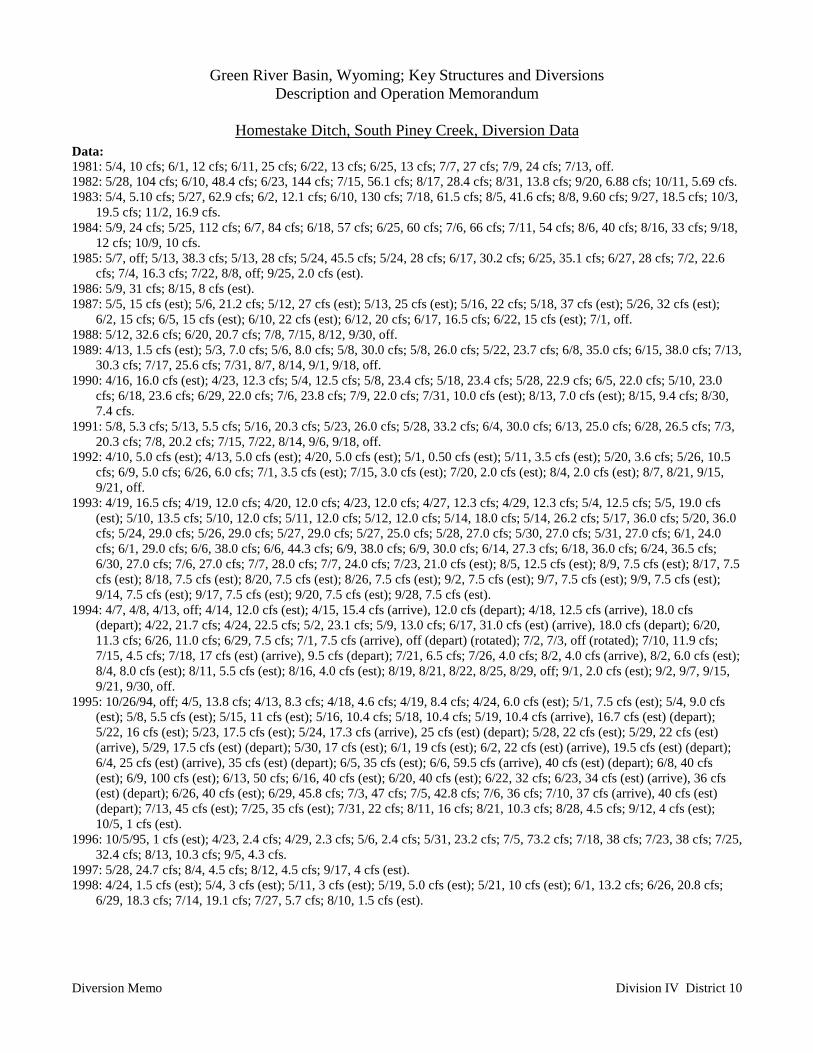
Diversion Memo Division IV District 10
Data:1981: 5/4, 10 cfs; 6/1, 12 cfs; 6/11, 25 cfs; 6/22, 13 cfs; 6/25, 13 cfs; 7/7, 27 cfs; 7/9, 24 cfs; 7/13, off.1982: 5/28, 104 cfs; 6/10, 48.4 cfs; 6/23, 144 cfs; 7/15, 56.1 cfs; 8/17, 28.4 cfs; 8/31, 13.8 cfs; 9/20, 6.88 cfs; 10/11, 5.69 cfs.1983: 5/4, 5.10 cfs; 5/27, 62.9 cfs; 6/2, 12.1 cfs; 6/10, 130 cfs; 7/18, 61.5 cfs; 8/5, 41.6 cfs; 8/8, 9.60 cfs; 9/27, 18.5 cfs; 10/3,
19.5 cfs; 11/2, 16.9 cfs.1984: 5/9, 24 cfs; 5/25, 112 cfs; 6/7, 84 cfs; 6/18, 57 cfs; 6/25, 60 cfs; 7/6, 66 cfs; 7/11, 54 cfs; 8/6, 40 cfs; 8/16, 33 cfs; 9/18,
12 cfs; 10/9, 10 cfs.1985: 5/7, off; 5/13, 38.3 cfs; 5/13, 28 cfs; 5/24, 45.5 cfs; 5/24, 28 cfs; 6/17, 30.2 cfs; 6/25, 35.1 cfs; 6/27, 28 cfs; 7/2, 22.6
cfs; 7/4, 16.3 cfs; 7/22, 8/8, off; 9/25, 2.0 cfs (est).1986: 5/9, 31 cfs; 8/15, 8 cfs (est).1987: 5/5, 15 cfs (est); 5/6, 21.2 cfs; 5/12, 27 cfs (est); 5/13, 25 cfs (est); 5/16, 22 cfs; 5/18, 37 cfs (est); 5/26, 32 cfs (est);
6/2, 15 cfs; 6/5, 15 cfs (est); 6/10, 22 cfs (est); 6/12, 20 cfs; 6/17, 16.5 cfs; 6/22, 15 cfs (est); 7/1, off.1988: 5/12, 32.6 cfs; 6/20, 20.7 cfs; 7/8, 7/15, 8/12, 9/30, off.1989: 4/13, 1.5 cfs (est); 5/3, 7.0 cfs; 5/6, 8.0 cfs; 5/8, 30.0 cfs; 5/8, 26.0 cfs; 5/22, 23.7 cfs; 6/8, 35.0 cfs; 6/15, 38.0 cfs; 7/13,
30.3 cfs; 7/17, 25.6 cfs; 7/31, 8/7, 8/14, 9/1, 9/18, off.1990: 4/16, 16.0 cfs (est); 4/23, 12.3 cfs; 5/4, 12.5 cfs; 5/8, 23.4 cfs; 5/18, 23.4 cfs; 5/28, 22.9 cfs; 6/5, 22.0 cfs; 5/10, 23.0
cfs; 6/18, 23.6 cfs; 6/29, 22.0 cfs; 7/6, 23.8 cfs; 7/9, 22.0 cfs; 7/31, 10.0 cfs (est); 8/13, 7.0 cfs (est); 8/15, 9.4 cfs; 8/30,7.4 cfs.
1991: 5/8, 5.3 cfs; 5/13, 5.5 cfs; 5/16, 20.3 cfs; 5/23, 26.0 cfs; 5/28, 33.2 cfs; 6/4, 30.0 cfs; 6/13, 25.0 cfs; 6/28, 26.5 cfs; 7/3,20.3 cfs; 7/8, 20.2 cfs; 7/15, 7/22, 8/14, 9/6, 9/18, off.
1992: 4/10, 5.0 cfs (est); 4/13, 5.0 cfs (est); 4/20, 5.0 cfs (est); 5/1, 0.50 cfs (est); 5/11, 3.5 cfs (est); 5/20, 3.6 cfs; 5/26, 10.5cfs; 6/9, 5.0 cfs; 6/26, 6.0 cfs; 7/1, 3.5 cfs (est); 7/15, 3.0 cfs (est); 7/20, 2.0 cfs (est); 8/4, 2.0 cfs (est); 8/7, 8/21, 9/15,9/21, off.
1993: 4/19, 16.5 cfs; 4/19, 12.0 cfs; 4/20, 12.0 cfs; 4/23, 12.0 cfs; 4/27, 12.3 cfs; 4/29, 12.3 cfs; 5/4, 12.5 cfs; 5/5, 19.0 cfs(est); 5/10, 13.5 cfs; 5/10, 12.0 cfs; 5/11, 12.0 cfs; 5/12, 12.0 cfs; 5/14, 18.0 cfs; 5/14, 26.2 cfs; 5/17, 36.0 cfs; 5/20, 36.0cfs; 5/24, 29.0 cfs; 5/26, 29.0 cfs; 5/27, 29.0 cfs; 5/27, 25.0 cfs; 5/28, 27.0 cfs; 5/30, 27.0 cfs; 5/31, 27.0 cfs; 6/1, 24.0cfs; 6/1, 29.0 cfs; 6/6, 38.0 cfs; 6/6, 44.3 cfs; 6/9, 38.0 cfs; 6/9, 30.0 cfs; 6/14, 27.3 cfs; 6/18, 36.0 cfs; 6/24, 36.5 cfs;6/30, 27.0 cfs; 7/6, 27.0 cfs; 7/7, 28.0 cfs; 7/7, 24.0 cfs; 7/23, 21.0 cfs (est); 8/5, 12.5 cfs (est); 8/9, 7.5 cfs (est); 8/17, 7.5cfs (est); 8/18, 7.5 cfs (est); 8/20, 7.5 cfs (est); 8/26, 7.5 cfs (est); 9/2, 7.5 cfs (est); 9/7, 7.5 cfs (est); 9/9, 7.5 cfs (est);9/14, 7.5 cfs (est); 9/17, 7.5 cfs (est); 9/20, 7.5 cfs (est); 9/28, 7.5 cfs (est).
1994: 4/7, 4/8, 4/13, off; 4/14, 12.0 cfs (est); 4/15, 15.4 cfs (arrive), 12.0 cfs (depart); 4/18, 12.5 cfs (arrive), 18.0 cfs(depart); 4/22, 21.7 cfs; 4/24, 22.5 cfs; 5/2, 23.1 cfs; 5/9, 13.0 cfs; 6/17, 31.0 cfs (est) (arrive), 18.0 cfs (depart); 6/20,11.3 cfs; 6/26, 11.0 cfs; 6/29, 7.5 cfs; 7/1, 7.5 cfs (arrive), off (depart) (rotated); 7/2, 7/3, off (rotated); 7/10, 11.9 cfs;7/15, 4.5 cfs; 7/18, 17 cfs (est) (arrive), 9.5 cfs (depart); 7/21, 6.5 cfs; 7/26, 4.0 cfs; 8/2, 4.0 cfs (arrive), 8/2, 6.0 cfs (est);8/4, 8.0 cfs (est); 8/11, 5.5 cfs (est); 8/16, 4.0 cfs (est); 8/19, 8/21, 8/22, 8/25, 8/29, off; 9/1, 2.0 cfs (est); 9/2, 9/7, 9/15,9/21, 9/30, off.
1995: 10/26/94, off; 4/5, 13.8 cfs; 4/13, 8.3 cfs; 4/18, 4.6 cfs; 4/19, 8.4 cfs; 4/24, 6.0 cfs (est); 5/1, 7.5 cfs (est); 5/4, 9.0 cfs(est); 5/8, 5.5 cfs (est); 5/15, 11 cfs (est); 5/16, 10.4 cfs; 5/18, 10.4 cfs; 5/19, 10.4 cfs (arrive), 16.7 cfs (est) (depart);5/22, 16 cfs (est); 5/23, 17.5 cfs (est); 5/24, 17.3 cfs (arrive), 25 cfs (est) (depart); 5/28, 22 cfs (est); 5/29, 22 cfs (est)(arrive), 5/29, 17.5 cfs (est) (depart); 5/30, 17 cfs (est); 6/1, 19 cfs (est); 6/2, 22 cfs (est) (arrive), 19.5 cfs (est) (depart);6/4, 25 cfs (est) (arrive), 35 cfs (est) (depart); 6/5, 35 cfs (est); 6/6, 59.5 cfs (arrive), 40 cfs (est) (depart); 6/8, 40 cfs(est); 6/9, 100 cfs (est); 6/13, 50 cfs; 6/16, 40 cfs (est); 6/20, 40 cfs (est); 6/22, 32 cfs; 6/23, 34 cfs (est) (arrive), 36 cfs(est) (depart); 6/26, 40 cfs (est); 6/29, 45.8 cfs; 7/3, 47 cfs; 7/5, 42.8 cfs; 7/6, 36 cfs; 7/10, 37 cfs (arrive), 40 cfs (est)(depart); 7/13, 45 cfs (est); 7/25, 35 cfs (est); 7/31, 22 cfs; 8/11, 16 cfs; 8/21, 10.3 cfs; 8/28, 4.5 cfs; 9/12, 4 cfs (est);10/5, 1 cfs (est).
1996: 10/5/95, 1 cfs (est); 4/23, 2.4 cfs; 4/29, 2.3 cfs; 5/6, 2.4 cfs; 5/31, 23.2 cfs; 7/5, 73.2 cfs; 7/18, 38 cfs; 7/23, 38 cfs; 7/25,32.4 cfs; 8/13, 10.3 cfs; 9/5, 4.3 cfs.
1997: 5/28, 24.7 cfs; 8/4, 4.5 cfs; 8/12, 4.5 cfs; 9/17, 4 cfs (est).1998: 4/24, 1.5 cfs (est); 5/4, 3 cfs (est); 5/11, 3 cfs (est); 5/19, 5.0 cfs (est); 5/21, 10 cfs (est); 6/1, 13.2 cfs; 6/26, 20.8 cfs;
6/29, 18.3 cfs; 7/14, 19.1 cfs; 7/27, 5.7 cfs; 8/10, 1.5 cfs (est).
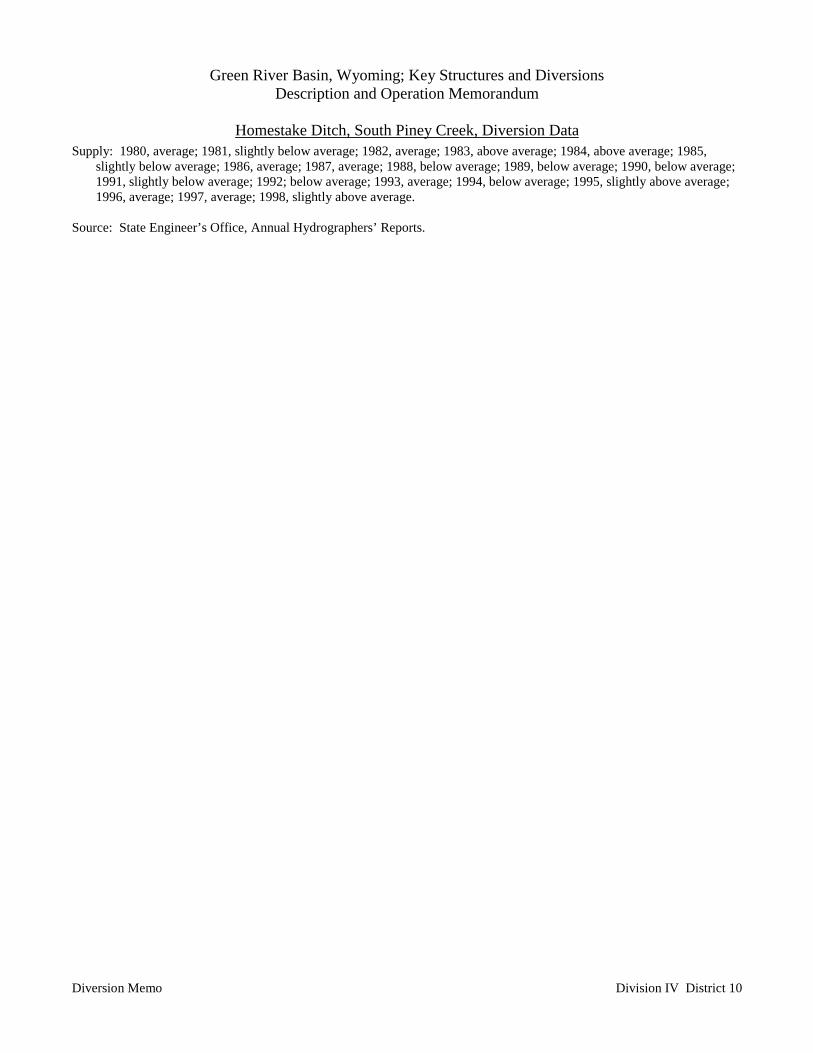
Green River Basin, Wyoming; Key Structures and DiversionsDescription and Operation Memorandum
Homestake Ditch, South Piney Creek, Diversion Data
Diversion Memo Division IV District 10
Supply: 1980, average; 1981, slightly below average; 1982, average; 1983, above average; 1984, above average; 1985,slightly below average; 1986, average; 1987, average; 1988, below average; 1989, below average; 1990, below average;1991, slightly below average; 1992; below average; 1993, average; 1994, below average; 1995, slightly above average;1996, average; 1997, average; 1998, slightly above average.
Source: State Engineer’s Office, Annual Hydrographers’ Reports.
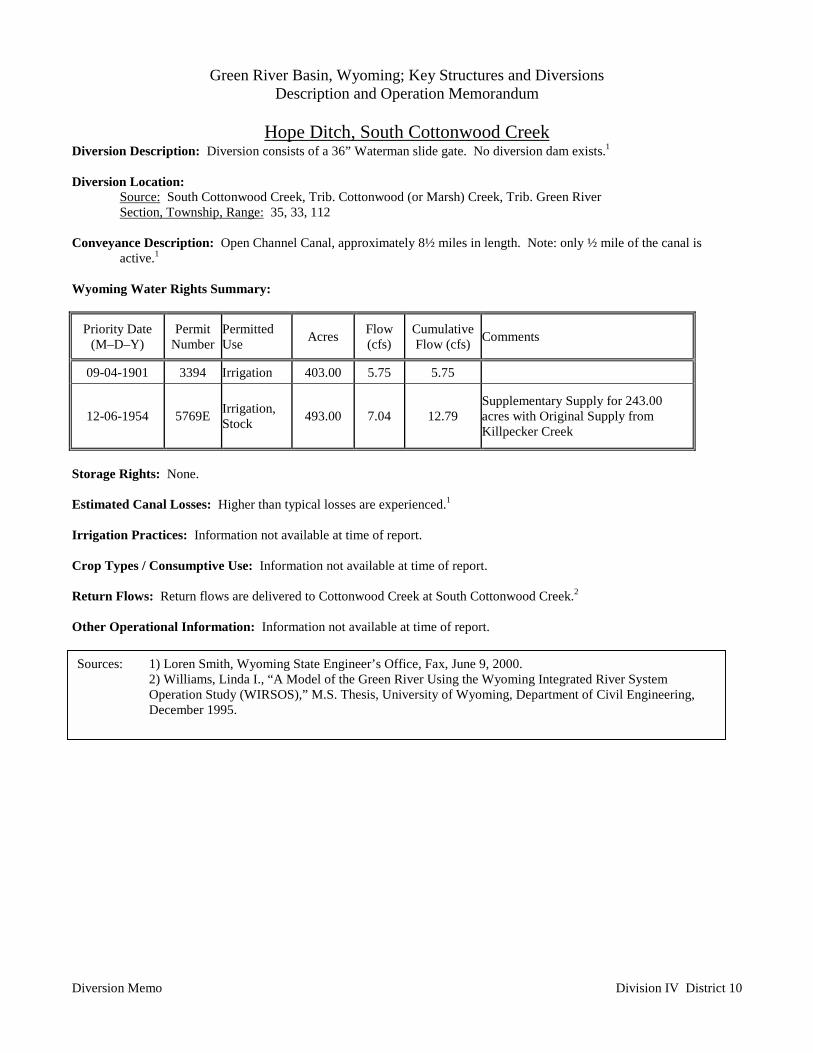
Green River Basin, Wyoming; Key Structures and DiversionsDescription and Operation Memorandum
Hope Ditch, South Cottonwood Creek
Diversion Memo Division IV District 10
Diversion Description: Diversion consists of a 36” Waterman slide gate. No diversion dam exists.1
Diversion Location:Source: South Cottonwood Creek, Trib. Cottonwood (or Marsh) Creek, Trib. Green RiverSection, Township, Range: 35, 33, 112
Conveyance Description: Open Channel Canal, approximately 8½ miles in length. Note: only ½ mile of the canal isactive.1
Wyoming Water Rights Summary:
Priority Date(M–D–Y)
PermitNumber
PermittedUse Acres Flow
(cfs)CumulativeFlow (cfs) Comments
09-04-1901 3394 Irrigation 403.00 5.75 5.75
12-06-1954 5769E Irrigation,Stock 493.00 7.04 12.79
Supplementary Supply for 243.00acres with Original Supply fromKillpecker Creek
Storage Rights: None.
Estimated Canal Losses: Higher than typical losses are experienced.1
Irrigation Practices: Information not available at time of report.
Crop Types / Consumptive Use: Information not available at time of report.
Return Flows: Return flows are delivered to Cottonwood Creek at South Cottonwood Creek.2
Other Operational Information: Information not available at time of report.
Sources: 1) Loren Smith, Wyoming State Engineer’s Office, Fax, June 9, 2000.2) Williams, Linda I., “A Model of the Green River Using the Wyoming Integrated River SystemOperation Study (WIRSOS),” M.S. Thesis, University of Wyoming, Department of Civil Engineering,December 1995.
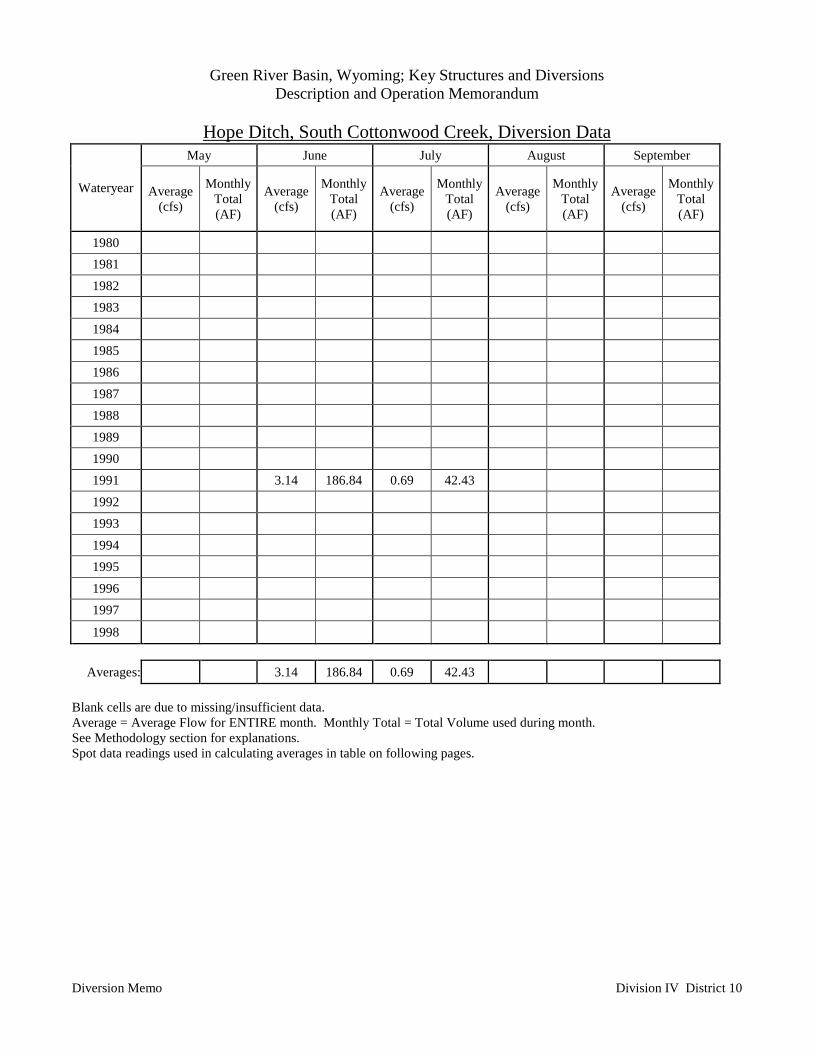
Green River Basin, Wyoming; Key Structures and DiversionsDescription and Operation Memorandum
Hope Ditch, South Cottonwood Creek, Diversion Data
Diversion Memo Division IV District 10
May June July August September
Wateryear Average(cfs)
MonthlyTotal(AF)
Average(cfs)
MonthlyTotal(AF)
Average(cfs)
MonthlyTotal(AF)
Average(cfs)
MonthlyTotal(AF)
Average(cfs)
MonthlyTotal(AF)
1980 1981 1982 1983 1984 1985 1986 1987 1988 1989 1990 1991 3.14 186.84 0.69 42.43 1992 1993 1994 1995 1996 1997
1998
Averages: 3.14 186.84 0.69 42.43
Blank cells are due to missing/insufficient data.Average = Average Flow for ENTIRE month. Monthly Total = Total Volume used during month.See Methodology section for explanations.Spot data readings used in calculating averages in table on following pages.
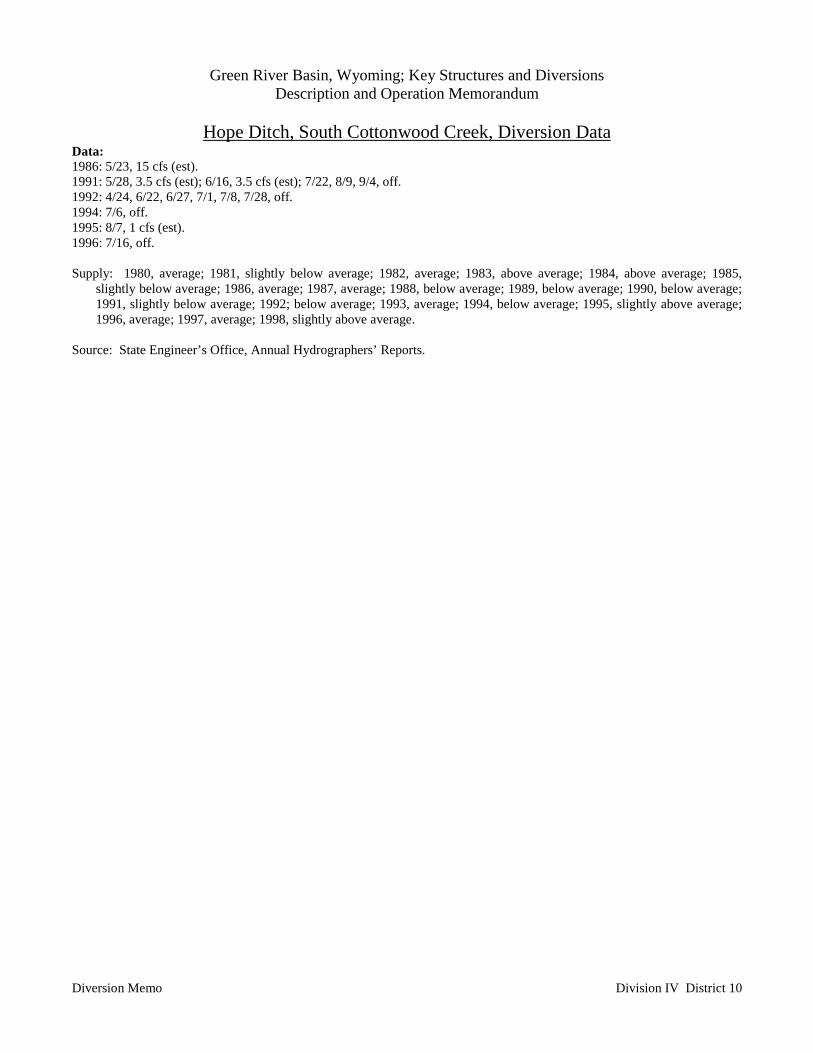
Green River Basin, Wyoming; Key Structures and DiversionsDescription and Operation Memorandum
Hope Ditch, South Cottonwood Creek, Diversion Data
Diversion Memo Division IV District 10
Data:1986: 5/23, 15 cfs (est).1991: 5/28, 3.5 cfs (est); 6/16, 3.5 cfs (est); 7/22, 8/9, 9/4, off.1992: 4/24, 6/22, 6/27, 7/1, 7/8, 7/28, off.1994: 7/6, off.1995: 8/7, 1 cfs (est).1996: 7/16, off.
Supply: 1980, average; 1981, slightly below average; 1982, average; 1983, above average; 1984, above average; 1985,slightly below average; 1986, average; 1987, average; 1988, below average; 1989, below average; 1990, below average;1991, slightly below average; 1992; below average; 1993, average; 1994, below average; 1995, slightly above average;1996, average; 1997, average; 1998, slightly above average.
Source: State Engineer’s Office, Annual Hydrographers’ Reports.
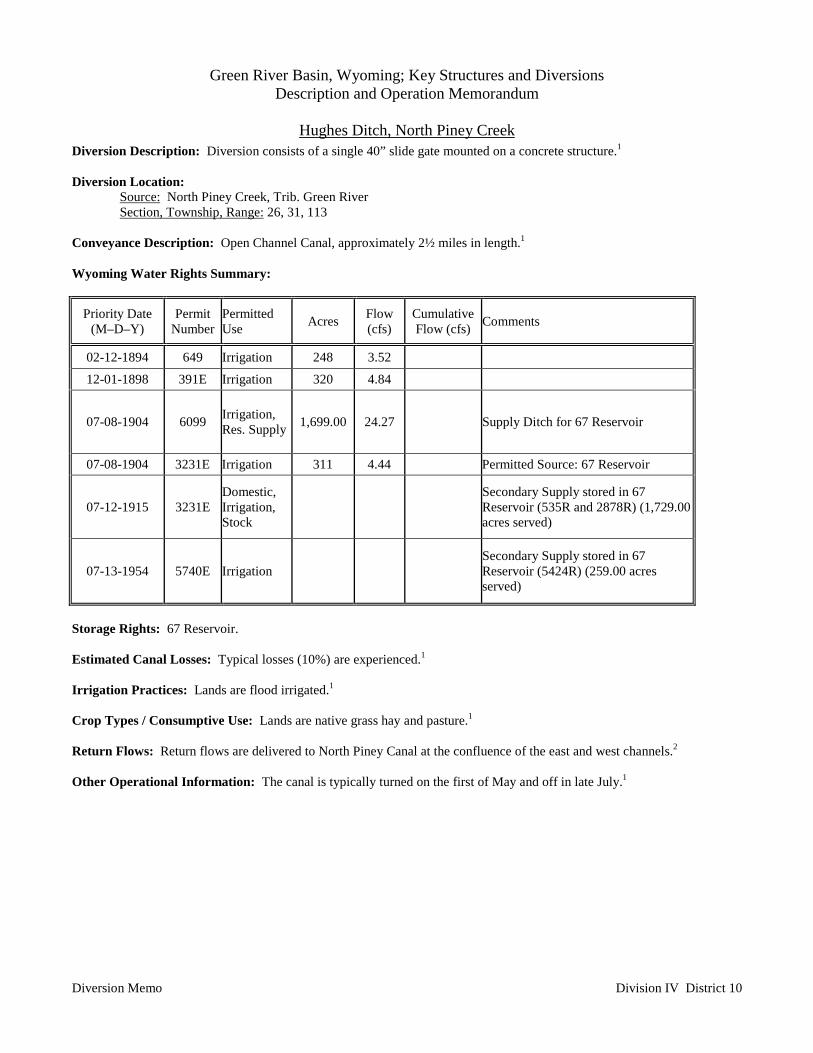
Green River Basin, Wyoming; Key Structures and DiversionsDescription and Operation Memorandum
Hughes Ditch, North Piney Creek
Diversion Memo Division IV District 10
Diversion Description: Diversion consists of a single 40” slide gate mounted on a concrete structure.1
Diversion Location:Source: North Piney Creek, Trib. Green RiverSection, Township, Range: 26, 31, 113
Conveyance Description: Open Channel Canal, approximately 2½ miles in length.1
Wyoming Water Rights Summary:
Priority Date(M–D–Y)
PermitNumber
PermittedUse Acres Flow
(cfs)CumulativeFlow (cfs) Comments
02-12-1894 649 Irrigation 248 3.52
12-01-1898 391E Irrigation 320 4.84
07-08-1904 6099 Irrigation,Res. Supply 1,699.00 24.27 Supply Ditch for 67 Reservoir
07-08-1904 3231E Irrigation 311 4.44 Permitted Source: 67 Reservoir
07-12-1915 3231EDomestic,Irrigation,Stock
Secondary Supply stored in 67Reservoir (535R and 2878R) (1,729.00acres served)
07-13-1954 5740E Irrigation Secondary Supply stored in 67Reservoir (5424R) (259.00 acresserved)
Storage Rights: 67 Reservoir.
Estimated Canal Losses: Typical losses (10%) are experienced.1
Irrigation Practices: Lands are flood irrigated.1
Crop Types / Consumptive Use: Lands are native grass hay and pasture.1
Return Flows: Return flows are delivered to North Piney Canal at the confluence of the east and west channels.2
Other Operational Information: The canal is typically turned on the first of May and off in late July.1
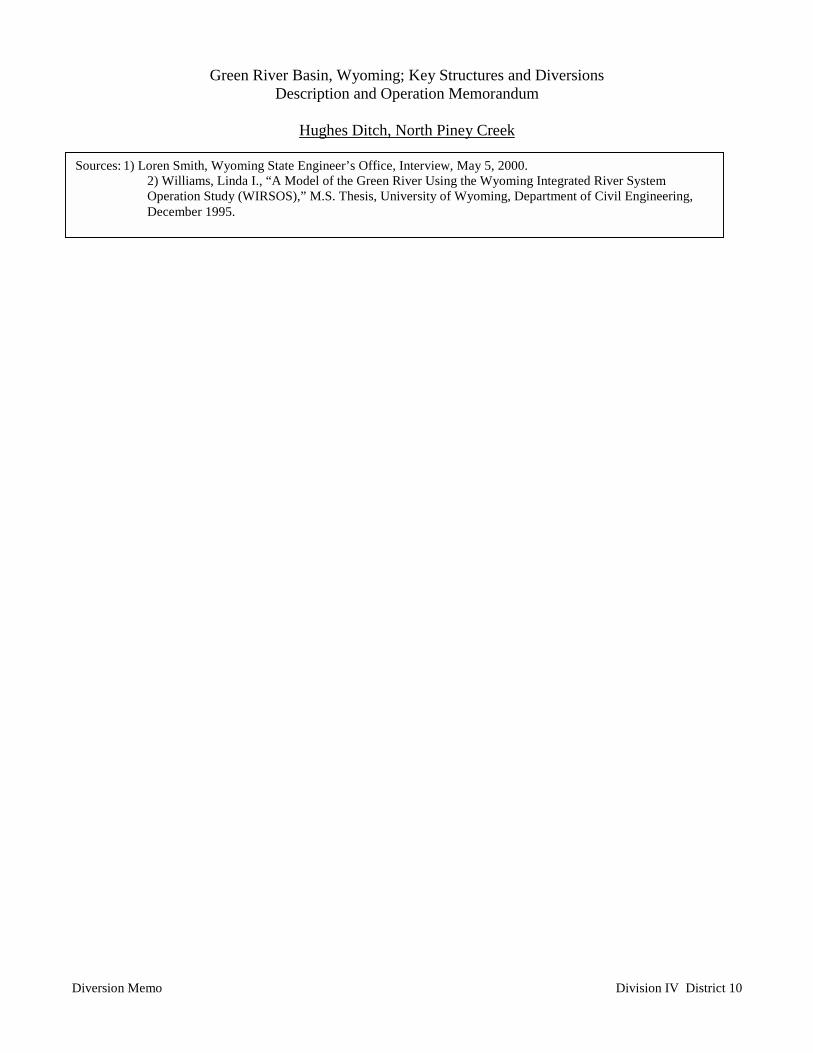
Green River Basin, Wyoming; Key Structures and DiversionsDescription and Operation Memorandum
Hughes Ditch, North Piney Creek
Diversion Memo Division IV District 10
Sources: 1) Loren Smith, Wyoming State Engineer’s Office, Interview, May 5, 2000.2) Williams, Linda I., “A Model of the Green River Using the Wyoming Integrated River SystemOperation Study (WIRSOS),” M.S. Thesis, University of Wyoming, Department of Civil Engineering,December 1995.

Green River Basin, Wyoming; Key Structures and DiversionsDescription and Operation Memorandum
Hughes Ditch, North Piney Creek, Diversion Data
Diversion Memo Division IV District 10
May June July August September
Wateryear Average(cfs)
MonthlyTotal (AF)
Average(cfs)
MonthlyTotal (AF)
Average(cfs)
MonthlyTotal (AF)
Average(cfs)
MonthlyTotal(AF)
Average(cfs)
MonthlyTotal(AF)
1972 2.95 175.48 1.91 117.72 2.36 145.31 1.89 112.541975 1.51 92.85 2.85 169.59 2.69 165.40 3.25 199.83 1980 1981 1982 6.25 384.30 19.39 1,153.79 7.85 482.68 1.24 76.24 0.61 36.301983 1984 15.05 895.54 15.49 952.44 1985 4.39 269.93 1.79 110.06 1986 1987 2.71 161.26 2.71 166.63 1988 1.30 79.93 3.02 185.69 1989 12.23 751.99 20.57 1,224.00 9.29 571.22 7.29 448.24 1990 8.96 550.93 10.43 620.63 7.28 447.63 1991 4.07 250.25 10.59 630.15 8.26 507.89 6.81 418.73 3.73 221.951992 6.06 372.61 5.54 329.65 3.71 228.12 1993 11.21 689.28 17.42 1,036.56 9.75 599.50 7.02 431.64 4.46 265.391994 9.36 575.52 7.54 448.42 0.65 39.97 1.00 61.49 0.00 0.001995 3.35 205.98 5.92 352.26 1.36 83.62 1996 20.69 1,272.18 30.17 1,795.24 15.78 970.27 5.65 347.40 1.54 91.641997 11.19 688.05 13.80 821.16 10.60 651.77 0.46 28.28 0.00 0.00
1998 6.70 411.97 18.41 1,095.47 23.85 1,466.48
Averages: 8.47 520.49 12.22 727.28 7.46 458.89 3.63 222.99 1.75 103.97Data in italics from USGS gaging station 002290.00, see attached data sheets.Blank cells are due to missing/insufficient data.Average = Average Flow for ENTIRE month. Monthly Total = Total Volume used during month.See Methodology section for explanations.Spot data readings used in calculating averages in table on following pages.
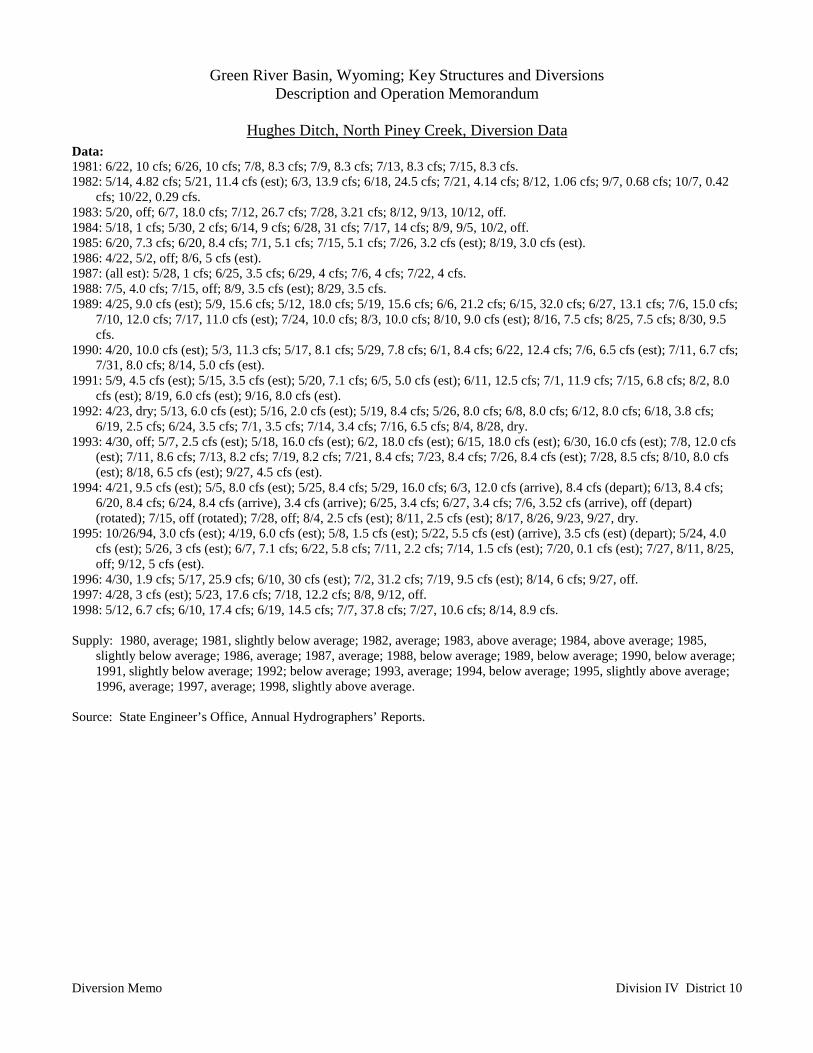
Green River Basin, Wyoming; Key Structures and DiversionsDescription and Operation Memorandum
Hughes Ditch, North Piney Creek, Diversion Data
Diversion Memo Division IV District 10
Data:1981: 6/22, 10 cfs; 6/26, 10 cfs; 7/8, 8.3 cfs; 7/9, 8.3 cfs; 7/13, 8.3 cfs; 7/15, 8.3 cfs.1982: 5/14, 4.82 cfs; 5/21, 11.4 cfs (est); 6/3, 13.9 cfs; 6/18, 24.5 cfs; 7/21, 4.14 cfs; 8/12, 1.06 cfs; 9/7, 0.68 cfs; 10/7, 0.42
cfs; 10/22, 0.29 cfs.1983: 5/20, off; 6/7, 18.0 cfs; 7/12, 26.7 cfs; 7/28, 3.21 cfs; 8/12, 9/13, 10/12, off.1984: 5/18, 1 cfs; 5/30, 2 cfs; 6/14, 9 cfs; 6/28, 31 cfs; 7/17, 14 cfs; 8/9, 9/5, 10/2, off.1985: 6/20, 7.3 cfs; 6/20, 8.4 cfs; 7/1, 5.1 cfs; 7/15, 5.1 cfs; 7/26, 3.2 cfs (est); 8/19, 3.0 cfs (est).1986: 4/22, 5/2, off; 8/6, 5 cfs (est).1987: (all est): 5/28, 1 cfs; 6/25, 3.5 cfs; 6/29, 4 cfs; 7/6, 4 cfs; 7/22, 4 cfs.1988: 7/5, 4.0 cfs; 7/15, off; 8/9, 3.5 cfs (est); 8/29, 3.5 cfs.1989: 4/25, 9.0 cfs (est); 5/9, 15.6 cfs; 5/12, 18.0 cfs; 5/19, 15.6 cfs; 6/6, 21.2 cfs; 6/15, 32.0 cfs; 6/27, 13.1 cfs; 7/6, 15.0 cfs;
7/10, 12.0 cfs; 7/17, 11.0 cfs (est); 7/24, 10.0 cfs; 8/3, 10.0 cfs; 8/10, 9.0 cfs (est); 8/16, 7.5 cfs; 8/25, 7.5 cfs; 8/30, 9.5cfs.
1990: 4/20, 10.0 cfs (est); 5/3, 11.3 cfs; 5/17, 8.1 cfs; 5/29, 7.8 cfs; 6/1, 8.4 cfs; 6/22, 12.4 cfs; 7/6, 6.5 cfs (est); 7/11, 6.7 cfs;7/31, 8.0 cfs; 8/14, 5.0 cfs (est).
1991: 5/9, 4.5 cfs (est); 5/15, 3.5 cfs (est); 5/20, 7.1 cfs; 6/5, 5.0 cfs (est); 6/11, 12.5 cfs; 7/1, 11.9 cfs; 7/15, 6.8 cfs; 8/2, 8.0cfs (est); 8/19, 6.0 cfs (est); 9/16, 8.0 cfs (est).
1992: 4/23, dry; 5/13, 6.0 cfs (est); 5/16, 2.0 cfs (est); 5/19, 8.4 cfs; 5/26, 8.0 cfs; 6/8, 8.0 cfs; 6/12, 8.0 cfs; 6/18, 3.8 cfs;6/19, 2.5 cfs; 6/24, 3.5 cfs; 7/1, 3.5 cfs; 7/14, 3.4 cfs; 7/16, 6.5 cfs; 8/4, 8/28, dry.
1993: 4/30, off; 5/7, 2.5 cfs (est); 5/18, 16.0 cfs (est); 6/2, 18.0 cfs (est); 6/15, 18.0 cfs (est); 6/30, 16.0 cfs (est); 7/8, 12.0 cfs(est); 7/11, 8.6 cfs; 7/13, 8.2 cfs; 7/19, 8.2 cfs; 7/21, 8.4 cfs; 7/23, 8.4 cfs; 7/26, 8.4 cfs (est); 7/28, 8.5 cfs; 8/10, 8.0 cfs(est); 8/18, 6.5 cfs (est); 9/27, 4.5 cfs (est).
1994: 4/21, 9.5 cfs (est); 5/5, 8.0 cfs (est); 5/25, 8.4 cfs; 5/29, 16.0 cfs; 6/3, 12.0 cfs (arrive), 8.4 cfs (depart); 6/13, 8.4 cfs;6/20, 8.4 cfs; 6/24, 8.4 cfs (arrive), 3.4 cfs (arrive); 6/25, 3.4 cfs; 6/27, 3.4 cfs; 7/6, 3.52 cfs (arrive), off (depart)(rotated); 7/15, off (rotated); 7/28, off; 8/4, 2.5 cfs (est); 8/11, 2.5 cfs (est); 8/17, 8/26, 9/23, 9/27, dry.
1995: 10/26/94, 3.0 cfs (est); 4/19, 6.0 cfs (est); 5/8, 1.5 cfs (est); 5/22, 5.5 cfs (est) (arrive), 3.5 cfs (est) (depart); 5/24, 4.0cfs (est); 5/26, 3 cfs (est); 6/7, 7.1 cfs; 6/22, 5.8 cfs; 7/11, 2.2 cfs; 7/14, 1.5 cfs (est); 7/20, 0.1 cfs (est); 7/27, 8/11, 8/25,off; 9/12, 5 cfs (est).
1996: 4/30, 1.9 cfs; 5/17, 25.9 cfs; 6/10, 30 cfs (est); 7/2, 31.2 cfs; 7/19, 9.5 cfs (est); 8/14, 6 cfs; 9/27, off.1997: 4/28, 3 cfs (est); 5/23, 17.6 cfs; 7/18, 12.2 cfs; 8/8, 9/12, off.1998: 5/12, 6.7 cfs; 6/10, 17.4 cfs; 6/19, 14.5 cfs; 7/7, 37.8 cfs; 7/27, 10.6 cfs; 8/14, 8.9 cfs.
Supply: 1980, average; 1981, slightly below average; 1982, average; 1983, above average; 1984, above average; 1985,slightly below average; 1986, average; 1987, average; 1988, below average; 1989, below average; 1990, below average;1991, slightly below average; 1992; below average; 1993, average; 1994, below average; 1995, slightly above average;1996, average; 1997, average; 1998, slightly above average.
Source: State Engineer’s Office, Annual Hydrographers’ Reports.
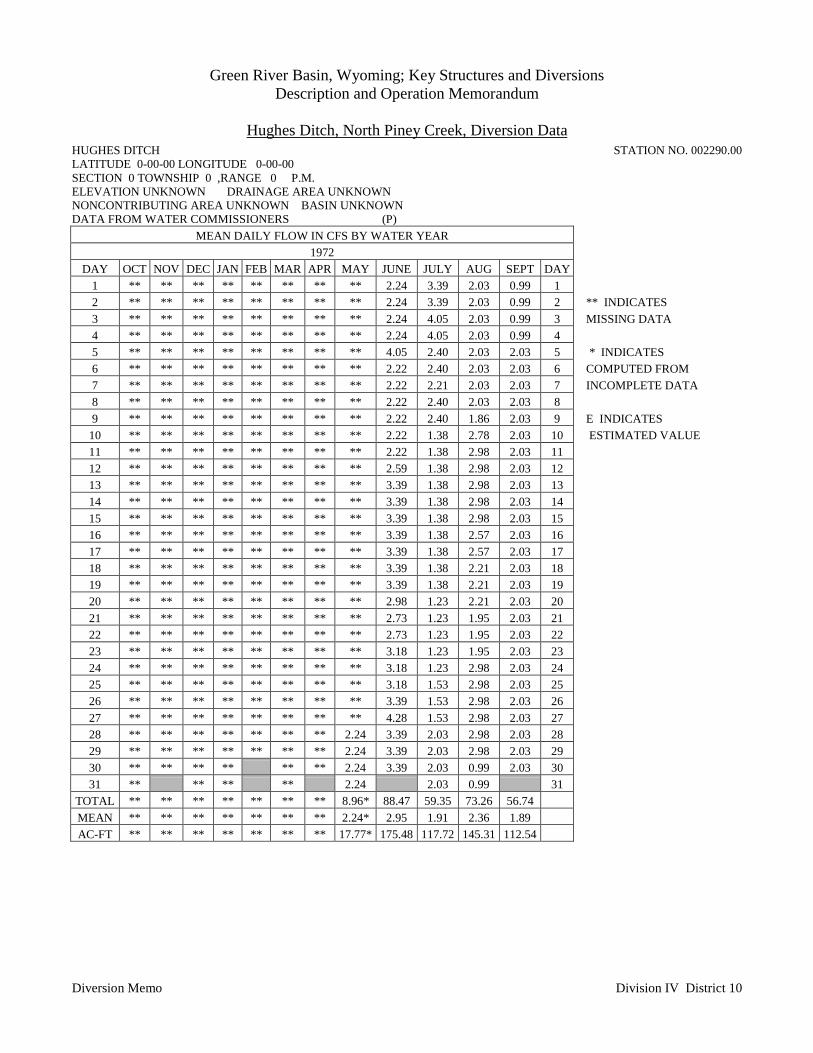
Green River Basin, Wyoming; Key Structures and DiversionsDescription and Operation Memorandum
Hughes Ditch, North Piney Creek, Diversion Data
Diversion Memo Division IV District 10
HUGHES DITCH STATION NO. 002290.00LATITUDE 0-00-00 LONGITUDE 0-00-00SECTION 0 TOWNSHIP 0 ,RANGE 0 P.M.ELEVATION UNKNOWN DRAINAGE AREA UNKNOWNNONCONTRIBUTING AREA UNKNOWN BASIN UNKNOWNDATA FROM WATER COMMISSIONERS (P)
MEAN DAILY FLOW IN CFS BY WATER YEAR1972
DAY OCT NOV DEC JAN FEB MAR APR MAY JUNE JULY AUG SEPT DAY1 ** ** ** ** ** ** ** ** 2.24 3.39 2.03 0.99 12 ** ** ** ** ** ** ** ** 2.24 3.39 2.03 0.99 2 ** INDICATES3 ** ** ** ** ** ** ** ** 2.24 4.05 2.03 0.99 3 MISSING DATA4 ** ** ** ** ** ** ** ** 2.24 4.05 2.03 0.99 45 ** ** ** ** ** ** ** ** 4.05 2.40 2.03 2.03 5 * INDICATES6 ** ** ** ** ** ** ** ** 2.22 2.40 2.03 2.03 6 COMPUTED FROM7 ** ** ** ** ** ** ** ** 2.22 2.21 2.03 2.03 7 INCOMPLETE DATA8 ** ** ** ** ** ** ** ** 2.22 2.40 2.03 2.03 89 ** ** ** ** ** ** ** ** 2.22 2.40 1.86 2.03 9 E INDICATES
10 ** ** ** ** ** ** ** ** 2.22 1.38 2.78 2.03 10 ESTIMATED VALUE11 ** ** ** ** ** ** ** ** 2.22 1.38 2.98 2.03 1112 ** ** ** ** ** ** ** ** 2.59 1.38 2.98 2.03 1213 ** ** ** ** ** ** ** ** 3.39 1.38 2.98 2.03 1314 ** ** ** ** ** ** ** ** 3.39 1.38 2.98 2.03 1415 ** ** ** ** ** ** ** ** 3.39 1.38 2.98 2.03 1516 ** ** ** ** ** ** ** ** 3.39 1.38 2.57 2.03 1617 ** ** ** ** ** ** ** ** 3.39 1.38 2.57 2.03 1718 ** ** ** ** ** ** ** ** 3.39 1.38 2.21 2.03 1819 ** ** ** ** ** ** ** ** 3.39 1.38 2.21 2.03 1920 ** ** ** ** ** ** ** ** 2.98 1.23 2.21 2.03 2021 ** ** ** ** ** ** ** ** 2.73 1.23 1.95 2.03 2122 ** ** ** ** ** ** ** ** 2.73 1.23 1.95 2.03 2223 ** ** ** ** ** ** ** ** 3.18 1.23 1.95 2.03 2324 ** ** ** ** ** ** ** ** 3.18 1.23 2.98 2.03 2425 ** ** ** ** ** ** ** ** 3.18 1.53 2.98 2.03 2526 ** ** ** ** ** ** ** ** 3.39 1.53 2.98 2.03 2627 ** ** ** ** ** ** ** ** 4.28 1.53 2.98 2.03 2728 ** ** ** ** ** ** ** 2.24 3.39 2.03 2.98 2.03 2829 ** ** ** ** ** ** ** 2.24 3.39 2.03 2.98 2.03 2930 ** ** ** ** ** ** 2.24 3.39 2.03 0.99 2.03 3031 ** ** ** ** 2.24 2.03 0.99 31
TOTAL ** ** ** ** ** ** ** 8.96* 88.47 59.35 73.26 56.74 MEAN ** ** ** ** ** ** ** 2.24* 2.95 1.91 2.36 1.89 AC-FT ** ** ** ** ** ** ** 17.77* 175.48 117.72 145.31 112.54
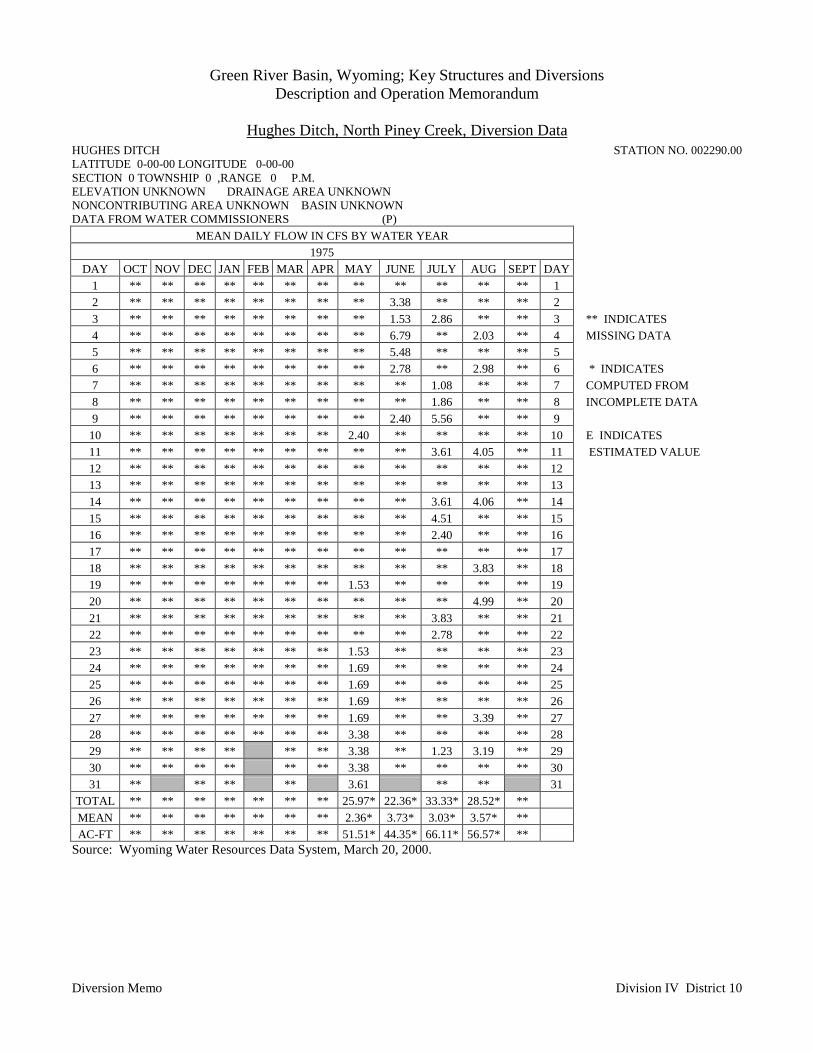
Green River Basin, Wyoming; Key Structures and DiversionsDescription and Operation Memorandum
Hughes Ditch, North Piney Creek, Diversion Data
Diversion Memo Division IV District 10
HUGHES DITCH STATION NO. 002290.00LATITUDE 0-00-00 LONGITUDE 0-00-00SECTION 0 TOWNSHIP 0 ,RANGE 0 P.M.ELEVATION UNKNOWN DRAINAGE AREA UNKNOWNNONCONTRIBUTING AREA UNKNOWN BASIN UNKNOWNDATA FROM WATER COMMISSIONERS (P)
MEAN DAILY FLOW IN CFS BY WATER YEAR1975
DAY OCT NOV DEC JAN FEB MAR APR MAY JUNE JULY AUG SEPT DAY1 ** ** ** ** ** ** ** ** ** ** ** ** 12 ** ** ** ** ** ** ** ** 3.38 ** ** ** 23 ** ** ** ** ** ** ** ** 1.53 2.86 ** ** 3 ** INDICATES4 ** ** ** ** ** ** ** ** 6.79 ** 2.03 ** 4 MISSING DATA5 ** ** ** ** ** ** ** ** 5.48 ** ** ** 56 ** ** ** ** ** ** ** ** 2.78 ** 2.98 ** 6 * INDICATES7 ** ** ** ** ** ** ** ** ** 1.08 ** ** 7 COMPUTED FROM8 ** ** ** ** ** ** ** ** ** 1.86 ** ** 8 INCOMPLETE DATA9 ** ** ** ** ** ** ** ** 2.40 5.56 ** ** 9
10 ** ** ** ** ** ** ** 2.40 ** ** ** ** 10 E INDICATES11 ** ** ** ** ** ** ** ** ** 3.61 4.05 ** 11 ESTIMATED VALUE12 ** ** ** ** ** ** ** ** ** ** ** ** 1213 ** ** ** ** ** ** ** ** ** ** ** ** 1314 ** ** ** ** ** ** ** ** ** 3.61 4.06 ** 1415 ** ** ** ** ** ** ** ** ** 4.51 ** ** 1516 ** ** ** ** ** ** ** ** ** 2.40 ** ** 1617 ** ** ** ** ** ** ** ** ** ** ** ** 1718 ** ** ** ** ** ** ** ** ** ** 3.83 ** 1819 ** ** ** ** ** ** ** 1.53 ** ** ** ** 1920 ** ** ** ** ** ** ** ** ** ** 4.99 ** 2021 ** ** ** ** ** ** ** ** ** 3.83 ** ** 2122 ** ** ** ** ** ** ** ** ** 2.78 ** ** 2223 ** ** ** ** ** ** ** 1.53 ** ** ** ** 2324 ** ** ** ** ** ** ** 1.69 ** ** ** ** 2425 ** ** ** ** ** ** ** 1.69 ** ** ** ** 2526 ** ** ** ** ** ** ** 1.69 ** ** ** ** 2627 ** ** ** ** ** ** ** 1.69 ** ** 3.39 ** 2728 ** ** ** ** ** ** ** 3.38 ** ** ** ** 2829 ** ** ** ** ** ** 3.38 ** 1.23 3.19 ** 2930 ** ** ** ** ** ** 3.38 ** ** ** ** 3031 ** ** ** ** 3.61 ** ** 31
TOTAL ** ** ** ** ** ** ** 25.97* 22.36* 33.33* 28.52* ** MEAN ** ** ** ** ** ** ** 2.36* 3.73* 3.03* 3.57* ** AC-FT ** ** ** ** ** ** ** 51.51* 44.35* 66.11* 56.57* **
Source: Wyoming Water Resources Data System, March 20, 2000.
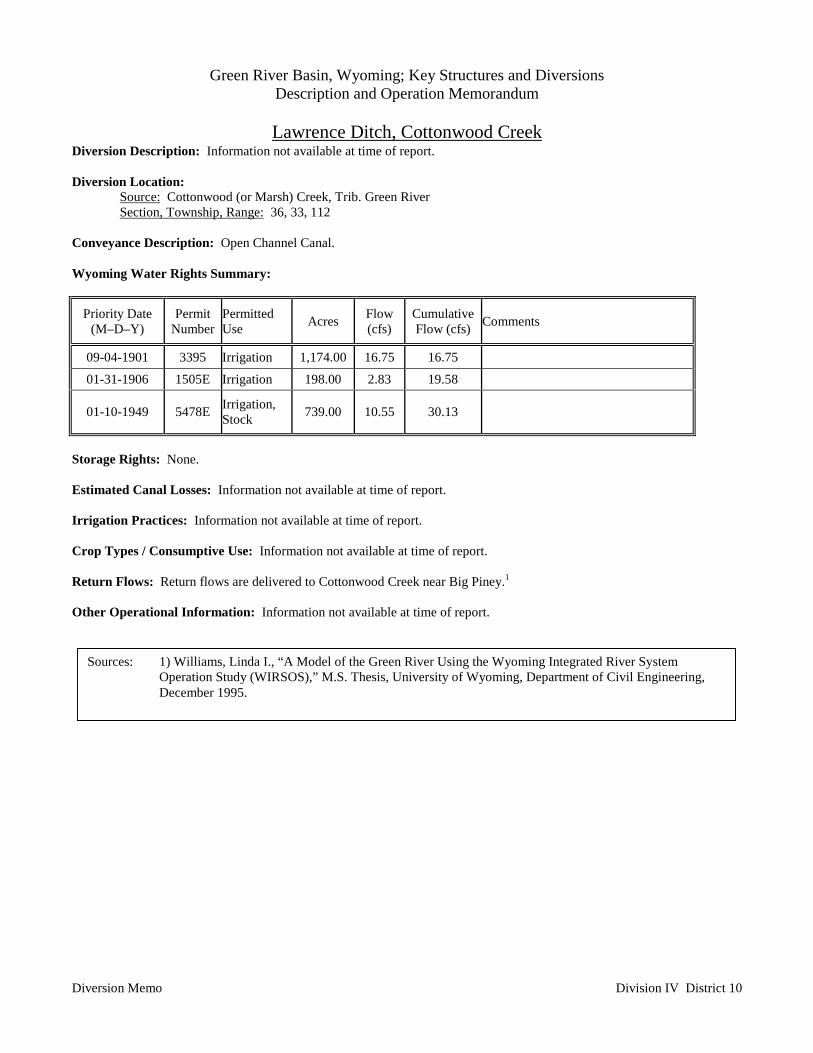
Green River Basin, Wyoming; Key Structures and DiversionsDescription and Operation Memorandum
Lawrence Ditch, Cottonwood Creek
Diversion Memo Division IV District 10
Diversion Description: Information not available at time of report.
Diversion Location:Source: Cottonwood (or Marsh) Creek, Trib. Green RiverSection, Township, Range: 36, 33, 112
Conveyance Description: Open Channel Canal.
Wyoming Water Rights Summary:
Priority Date(M–D–Y)
PermitNumber
PermittedUse Acres Flow
(cfs)CumulativeFlow (cfs) Comments
09-04-1901 3395 Irrigation 1,174.00 16.75 16.75
01-31-1906 1505E Irrigation 198.00 2.83 19.58
01-10-1949 5478E Irrigation,Stock 739.00 10.55 30.13
Storage Rights: None.
Estimated Canal Losses: Information not available at time of report.
Irrigation Practices: Information not available at time of report.
Crop Types / Consumptive Use: Information not available at time of report.
Return Flows: Return flows are delivered to Cottonwood Creek near Big Piney.1
Other Operational Information: Information not available at time of report.
Sources: 1) Williams, Linda I., “A Model of the Green River Using the Wyoming Integrated River SystemOperation Study (WIRSOS),” M.S. Thesis, University of Wyoming, Department of Civil Engineering,December 1995.
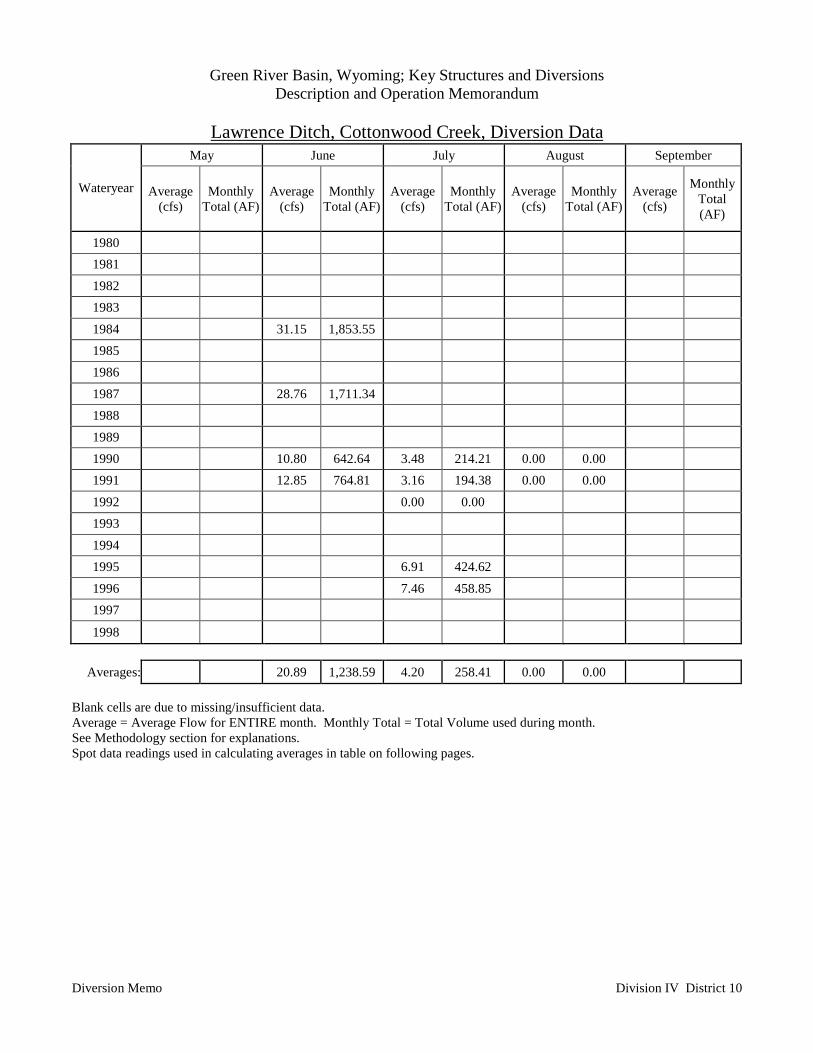
Green River Basin, Wyoming; Key Structures and DiversionsDescription and Operation Memorandum
Lawrence Ditch, Cottonwood Creek, Diversion Data
Diversion Memo Division IV District 10
May June July August September
Wateryear Average(cfs)
MonthlyTotal (AF)
Average(cfs)
MonthlyTotal (AF)
Average(cfs)
MonthlyTotal (AF)
Average(cfs)
MonthlyTotal (AF)
Average(cfs)
MonthlyTotal(AF)
1980 1981 1982 1983 1984 31.15 1,853.551985 19861987 28.76 1,711.341988 1989 1990 10.80 642.64 3.48 214.21 0.00 0.001991 12.85 764.81 3.16 194.38 0.00 0.001992 0.00 0.001993 1994 1995 6.91 424.62 1996 7.46 458.85 1997
1998
Averages: 20.89 1,238.59 4.20 258.41 0.00 0.00
Blank cells are due to missing/insufficient data.Average = Average Flow for ENTIRE month. Monthly Total = Total Volume used during month.See Methodology section for explanations.Spot data readings used in calculating averages in table on following pages.
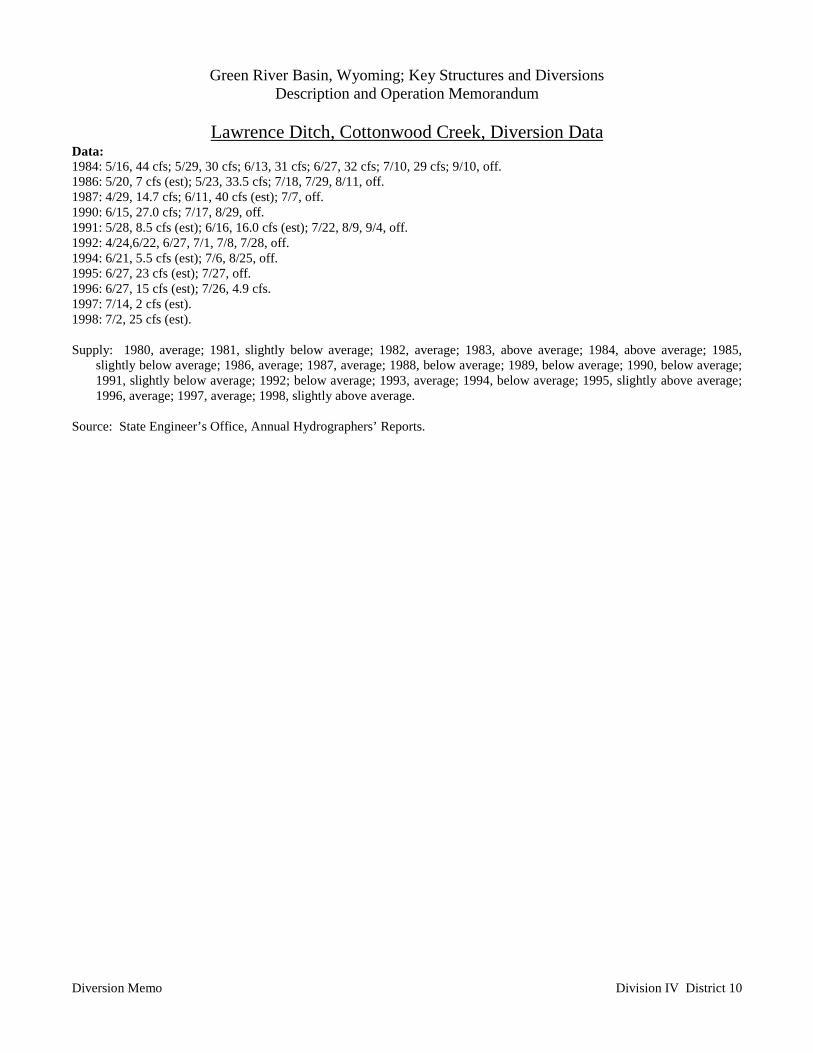
Green River Basin, Wyoming; Key Structures and DiversionsDescription and Operation Memorandum
Lawrence Ditch, Cottonwood Creek, Diversion Data
Diversion Memo Division IV District 10
Data:1984: 5/16, 44 cfs; 5/29, 30 cfs; 6/13, 31 cfs; 6/27, 32 cfs; 7/10, 29 cfs; 9/10, off.1986: 5/20, 7 cfs (est); 5/23, 33.5 cfs; 7/18, 7/29, 8/11, off.1987: 4/29, 14.7 cfs; 6/11, 40 cfs (est); 7/7, off.1990: 6/15, 27.0 cfs; 7/17, 8/29, off.1991: 5/28, 8.5 cfs (est); 6/16, 16.0 cfs (est); 7/22, 8/9, 9/4, off.1992: 4/24,6/22, 6/27, 7/1, 7/8, 7/28, off.1994: 6/21, 5.5 cfs (est); 7/6, 8/25, off.1995: 6/27, 23 cfs (est); 7/27, off.1996: 6/27, 15 cfs (est); 7/26, 4.9 cfs.1997: 7/14, 2 cfs (est).1998: 7/2, 25 cfs (est).
Supply: 1980, average; 1981, slightly below average; 1982, average; 1983, above average; 1984, above average; 1985,slightly below average; 1986, average; 1987, average; 1988, below average; 1989, below average; 1990, below average;1991, slightly below average; 1992; below average; 1993, average; 1994, below average; 1995, slightly above average;1996, average; 1997, average; 1998, slightly above average.
Source: State Engineer’s Office, Annual Hydrographers’ Reports.
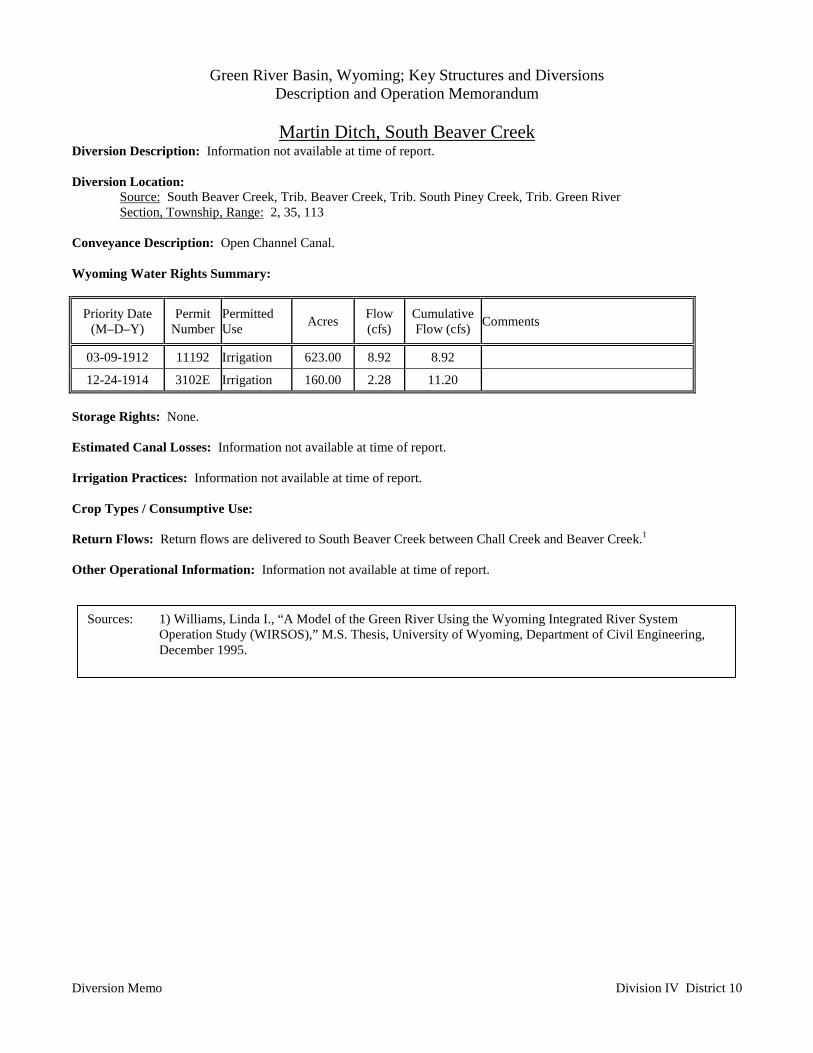
Green River Basin, Wyoming; Key Structures and DiversionsDescription and Operation Memorandum
Martin Ditch, South Beaver Creek
Diversion Memo Division IV District 10
Diversion Description: Information not available at time of report.
Diversion Location:Source: South Beaver Creek, Trib. Beaver Creek, Trib. South Piney Creek, Trib. Green RiverSection, Township, Range: 2, 35, 113
Conveyance Description: Open Channel Canal.
Wyoming Water Rights Summary:
Priority Date(M–D–Y)
PermitNumber
PermittedUse Acres Flow
(cfs)CumulativeFlow (cfs) Comments
03-09-1912 11192 Irrigation 623.00 8.92 8.92
12-24-1914 3102E Irrigation 160.00 2.28 11.20
Storage Rights: None.
Estimated Canal Losses: Information not available at time of report.
Irrigation Practices: Information not available at time of report.
Crop Types / Consumptive Use:
Return Flows: Return flows are delivered to South Beaver Creek between Chall Creek and Beaver Creek.1
Other Operational Information: Information not available at time of report.
Sources: 1) Williams, Linda I., “A Model of the Green River Using the Wyoming Integrated River SystemOperation Study (WIRSOS),” M.S. Thesis, University of Wyoming, Department of Civil Engineering,December 1995.

Green River Basin, Wyoming; Key Structures and DiversionsDescription and Operation Memorandum
Martin Ditch, South Beaver Creek, Diversion Data
Diversion Memo Division IV District 10
No Diversion Data Available.
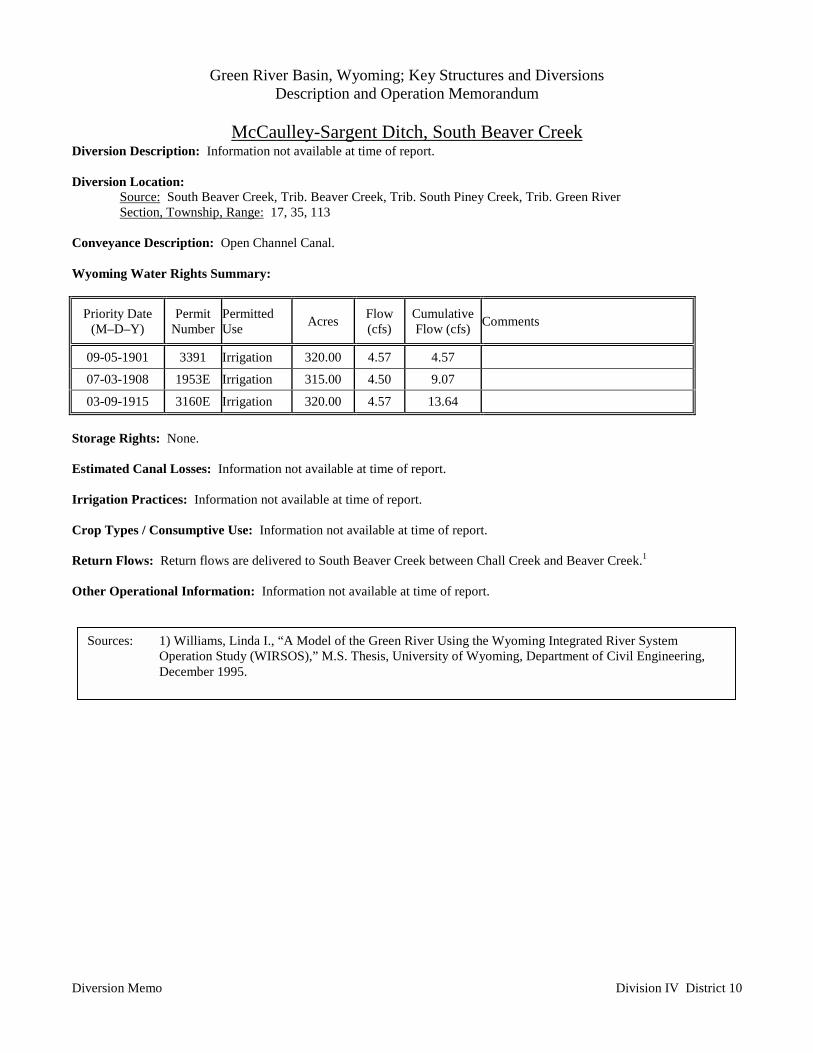
Green River Basin, Wyoming; Key Structures and DiversionsDescription and Operation Memorandum
McCaulley-Sargent Ditch, South Beaver Creek
Diversion Memo Division IV District 10
Diversion Description: Information not available at time of report.
Diversion Location:Source: South Beaver Creek, Trib. Beaver Creek, Trib. South Piney Creek, Trib. Green RiverSection, Township, Range: 17, 35, 113
Conveyance Description: Open Channel Canal.
Wyoming Water Rights Summary:
Priority Date(M–D–Y)
PermitNumber
PermittedUse Acres Flow
(cfs)CumulativeFlow (cfs) Comments
09-05-1901 3391 Irrigation 320.00 4.57 4.57
07-03-1908 1953E Irrigation 315.00 4.50 9.07
03-09-1915 3160E Irrigation 320.00 4.57 13.64
Storage Rights: None.
Estimated Canal Losses: Information not available at time of report.
Irrigation Practices: Information not available at time of report.
Crop Types / Consumptive Use: Information not available at time of report.
Return Flows: Return flows are delivered to South Beaver Creek between Chall Creek and Beaver Creek.1
Other Operational Information: Information not available at time of report.
Sources: 1) Williams, Linda I., “A Model of the Green River Using the Wyoming Integrated River SystemOperation Study (WIRSOS),” M.S. Thesis, University of Wyoming, Department of Civil Engineering,December 1995.
Green River Basin, Wyoming; Key Structures and DiversionsDescription and Operation Memorandum
McCaulley-Sargent Ditch, South Beaver Creek, Diversion Data
Diversion Memo Division IV District 10
No Diversion Data Available.
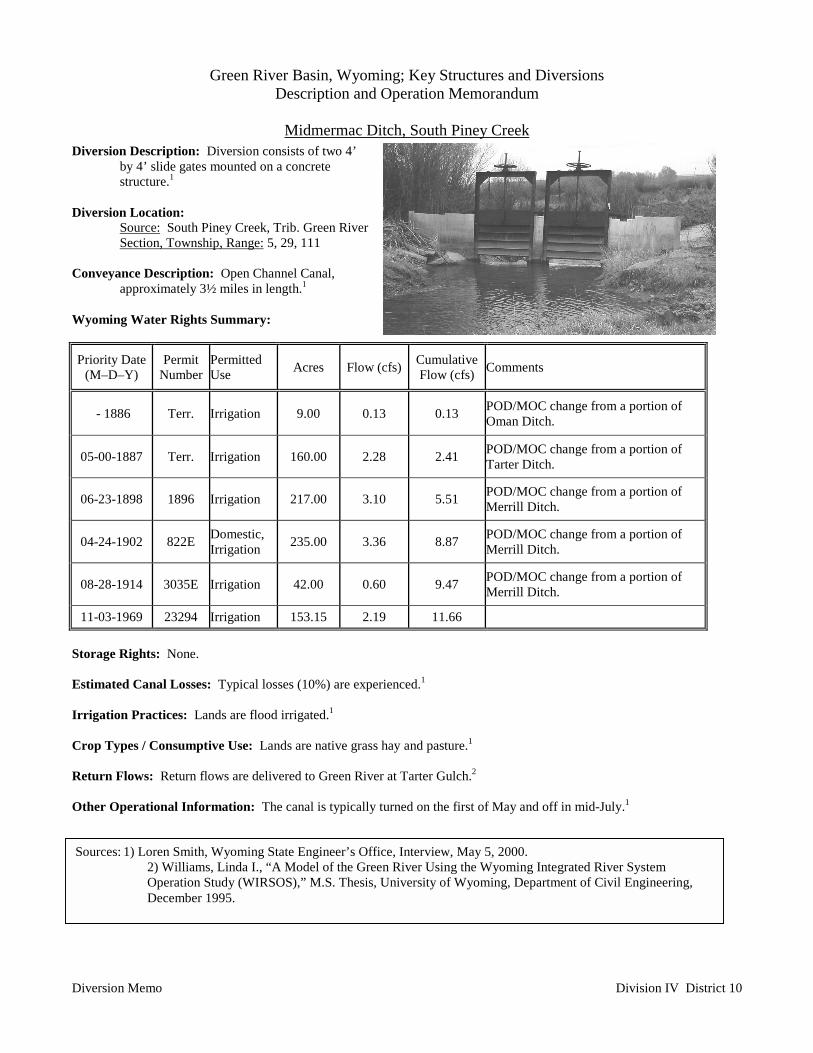
Green River Basin, Wyoming; Key Structures and DiversionsDescription and Operation Memorandum
Midmermac Ditch, South Piney Creek
Diversion Memo Division IV District 10
Diversion Description: Diversion consists of two 4’by 4’ slide gates mounted on a concretestructure.1
Diversion Location:Source: South Piney Creek, Trib. Green RiverSection, Township, Range: 5, 29, 111
Conveyance Description: Open Channel Canal,approximately 3½ miles in length.1
Wyoming Water Rights Summary:
Priority Date(M–D–Y)
PermitNumber
PermittedUse Acres Flow (cfs) Cumulative
Flow (cfs) Comments
- 1886 Terr. Irrigation 9.00 0.13 0.13 POD/MOC change from a portion ofOman Ditch.
05-00-1887 Terr. Irrigation 160.00 2.28 2.41 POD/MOC change from a portion ofTarter Ditch.
06-23-1898 1896 Irrigation 217.00 3.10 5.51 POD/MOC change from a portion ofMerrill Ditch.
04-24-1902 822E Domestic,Irrigation 235.00 3.36 8.87 POD/MOC change from a portion of
Merrill Ditch.
08-28-1914 3035E Irrigation 42.00 0.60 9.47 POD/MOC change from a portion ofMerrill Ditch.
11-03-1969 23294 Irrigation 153.15 2.19 11.66
Storage Rights: None.
Estimated Canal Losses: Typical losses (10%) are experienced.1
Irrigation Practices: Lands are flood irrigated.1
Crop Types / Consumptive Use: Lands are native grass hay and pasture.1
Return Flows: Return flows are delivered to Green River at Tarter Gulch.2
Other Operational Information: The canal is typically turned on the first of May and off in mid-July.1
Sources: 1) Loren Smith, Wyoming State Engineer’s Office, Interview, May 5, 2000.2) Williams, Linda I., “A Model of the Green River Using the Wyoming Integrated River SystemOperation Study (WIRSOS),” M.S. Thesis, University of Wyoming, Department of Civil Engineering,December 1995.
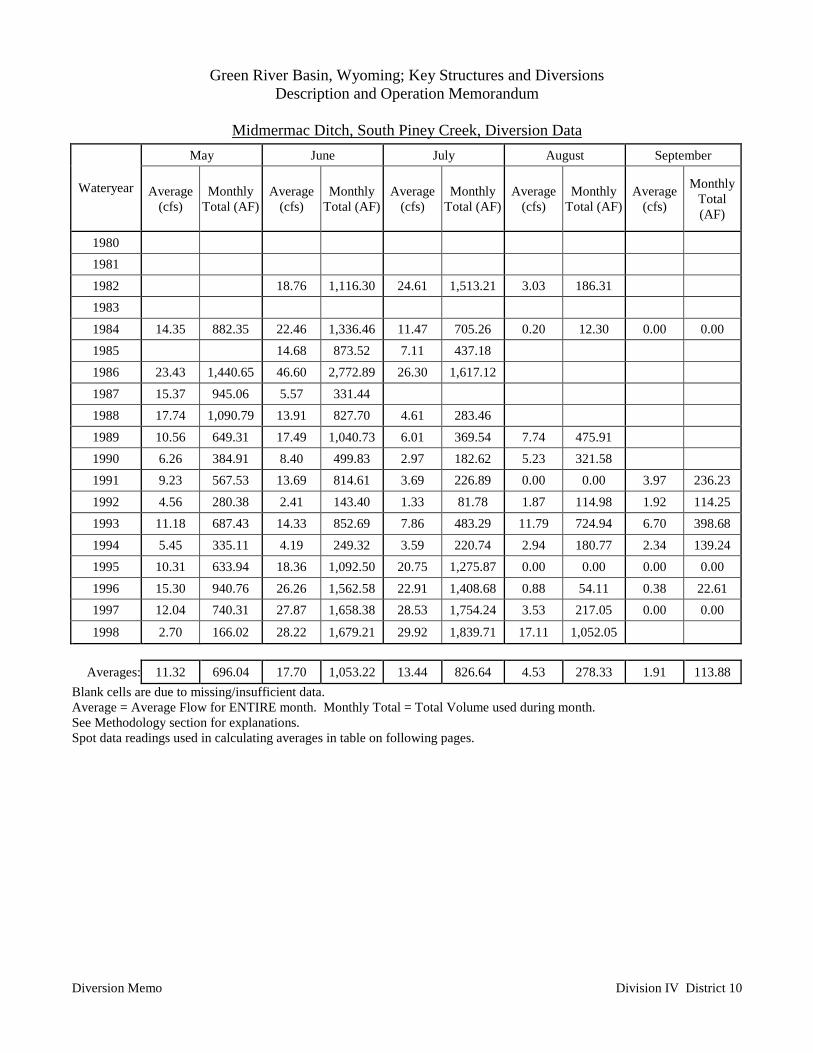
Green River Basin, Wyoming; Key Structures and DiversionsDescription and Operation Memorandum
Midmermac Ditch, South Piney Creek, Diversion Data
Diversion Memo Division IV District 10
May June July August September
Wateryear Average(cfs)
MonthlyTotal (AF)
Average(cfs)
MonthlyTotal (AF)
Average(cfs)
MonthlyTotal (AF)
Average(cfs)
MonthlyTotal (AF)
Average(cfs)
MonthlyTotal(AF)
1980 1981 1982 18.76 1,116.30 24.61 1,513.21 3.03 186.31 1983 1984 14.35 882.35 22.46 1,336.46 11.47 705.26 0.20 12.30 0.00 0.001985 14.68 873.52 7.11 437.18 1986 23.43 1,440.65 46.60 2,772.89 26.30 1,617.12 1987 15.37 945.06 5.57 331.44 1988 17.74 1,090.79 13.91 827.70 4.61 283.46 1989 10.56 649.31 17.49 1,040.73 6.01 369.54 7.74 475.91 1990 6.26 384.91 8.40 499.83 2.97 182.62 5.23 321.58 1991 9.23 567.53 13.69 814.61 3.69 226.89 0.00 0.00 3.97 236.231992 4.56 280.38 2.41 143.40 1.33 81.78 1.87 114.98 1.92 114.251993 11.18 687.43 14.33 852.69 7.86 483.29 11.79 724.94 6.70 398.681994 5.45 335.11 4.19 249.32 3.59 220.74 2.94 180.77 2.34 139.241995 10.31 633.94 18.36 1,092.50 20.75 1,275.87 0.00 0.00 0.00 0.001996 15.30 940.76 26.26 1,562.58 22.91 1,408.68 0.88 54.11 0.38 22.611997 12.04 740.31 27.87 1,658.38 28.53 1,754.24 3.53 217.05 0.00 0.00
1998 2.70 166.02 28.22 1,679.21 29.92 1,839.71 17.11 1,052.05
Averages: 11.32 696.04 17.70 1,053.22 13.44 826.64 4.53 278.33 1.91 113.88Blank cells are due to missing/insufficient data.Average = Average Flow for ENTIRE month. Monthly Total = Total Volume used during month.See Methodology section for explanations.Spot data readings used in calculating averages in table on following pages.
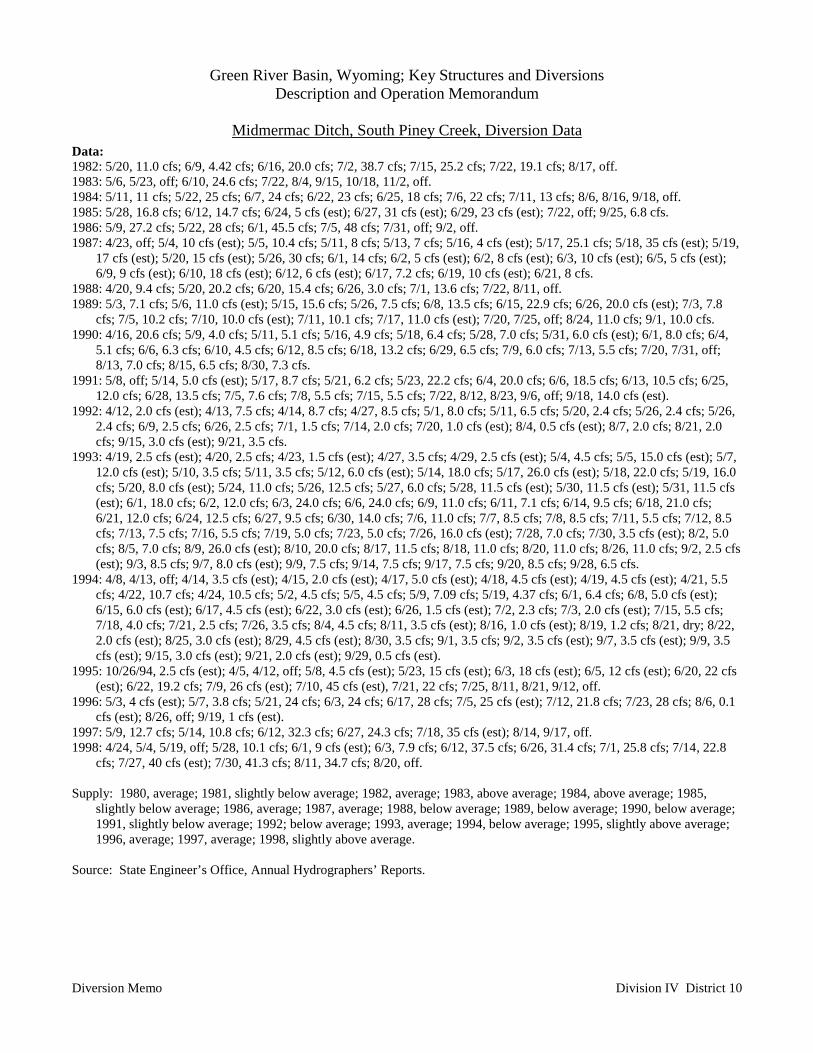
Green River Basin, Wyoming; Key Structures and DiversionsDescription and Operation Memorandum
Midmermac Ditch, South Piney Creek, Diversion Data
Diversion Memo Division IV District 10
Data:1982: 5/20, 11.0 cfs; 6/9, 4.42 cfs; 6/16, 20.0 cfs; 7/2, 38.7 cfs; 7/15, 25.2 cfs; 7/22, 19.1 cfs; 8/17, off.1983: 5/6, 5/23, off; 6/10, 24.6 cfs; 7/22, 8/4, 9/15, 10/18, 11/2, off.1984: 5/11, 11 cfs; 5/22, 25 cfs; 6/7, 24 cfs; 6/22, 23 cfs; 6/25, 18 cfs; 7/6, 22 cfs; 7/11, 13 cfs; 8/6, 8/16, 9/18, off.1985: 5/28, 16.8 cfs; 6/12, 14.7 cfs; 6/24, 5 cfs (est); 6/27, 31 cfs (est); 6/29, 23 cfs (est); 7/22, off; 9/25, 6.8 cfs.1986: 5/9, 27.2 cfs; 5/22, 28 cfs; 6/1, 45.5 cfs; 7/5, 48 cfs; 7/31, off; 9/2, off.1987: 4/23, off; 5/4, 10 cfs (est); 5/5, 10.4 cfs; 5/11, 8 cfs; 5/13, 7 cfs; 5/16, 4 cfs (est); 5/17, 25.1 cfs; 5/18, 35 cfs (est); 5/19,
17 cfs (est); 5/20, 15 cfs (est); 5/26, 30 cfs; 6/1, 14 cfs; 6/2, 5 cfs (est); 6/2, 8 cfs (est); 6/3, 10 cfs (est); 6/5, 5 cfs (est);6/9, 9 cfs (est); 6/10, 18 cfs (est); 6/12, 6 cfs (est); 6/17, 7.2 cfs; 6/19, 10 cfs (est); 6/21, 8 cfs.
1988: 4/20, 9.4 cfs; 5/20, 20.2 cfs; 6/20, 15.4 cfs; 6/26, 3.0 cfs; 7/1, 13.6 cfs; 7/22, 8/11, off.1989: 5/3, 7.1 cfs; 5/6, 11.0 cfs (est); 5/15, 15.6 cfs; 5/26, 7.5 cfs; 6/8, 13.5 cfs; 6/15, 22.9 cfs; 6/26, 20.0 cfs (est); 7/3, 7.8
cfs; 7/5, 10.2 cfs; 7/10, 10.0 cfs (est); 7/11, 10.1 cfs; 7/17, 11.0 cfs (est); 7/20, 7/25, off; 8/24, 11.0 cfs; 9/1, 10.0 cfs.1990: 4/16, 20.6 cfs; 5/9, 4.0 cfs; 5/11, 5.1 cfs; 5/16, 4.9 cfs; 5/18, 6.4 cfs; 5/28, 7.0 cfs; 5/31, 6.0 cfs (est); 6/1, 8.0 cfs; 6/4,
5.1 cfs; 6/6, 6.3 cfs; 6/10, 4.5 cfs; 6/12, 8.5 cfs; 6/18, 13.2 cfs; 6/29, 6.5 cfs; 7/9, 6.0 cfs; 7/13, 5.5 cfs; 7/20, 7/31, off;8/13, 7.0 cfs; 8/15, 6.5 cfs; 8/30, 7.3 cfs.
1991: 5/8, off; 5/14, 5.0 cfs (est); 5/17, 8.7 cfs; 5/21, 6.2 cfs; 5/23, 22.2 cfs; 6/4, 20.0 cfs; 6/6, 18.5 cfs; 6/13, 10.5 cfs; 6/25,12.0 cfs; 6/28, 13.5 cfs; 7/5, 7.6 cfs; 7/8, 5.5 cfs; 7/15, 5.5 cfs; 7/22, 8/12, 8/23, 9/6, off; 9/18, 14.0 cfs (est).
1992: 4/12, 2.0 cfs (est); 4/13, 7.5 cfs; 4/14, 8.7 cfs; 4/27, 8.5 cfs; 5/1, 8.0 cfs; 5/11, 6.5 cfs; 5/20, 2.4 cfs; 5/26, 2.4 cfs; 5/26,2.4 cfs; 6/9, 2.5 cfs; 6/26, 2.5 cfs; 7/1, 1.5 cfs; 7/14, 2.0 cfs; 7/20, 1.0 cfs (est); 8/4, 0.5 cfs (est); 8/7, 2.0 cfs; 8/21, 2.0cfs; 9/15, 3.0 cfs (est); 9/21, 3.5 cfs.
1993: 4/19, 2.5 cfs (est); 4/20, 2.5 cfs; 4/23, 1.5 cfs (est); 4/27, 3.5 cfs; 4/29, 2.5 cfs (est); 5/4, 4.5 cfs; 5/5, 15.0 cfs (est); 5/7,12.0 cfs (est); 5/10, 3.5 cfs; 5/11, 3.5 cfs; 5/12, 6.0 cfs (est); 5/14, 18.0 cfs; 5/17, 26.0 cfs (est); 5/18, 22.0 cfs; 5/19, 16.0cfs; 5/20, 8.0 cfs (est); 5/24, 11.0 cfs; 5/26, 12.5 cfs; 5/27, 6.0 cfs; 5/28, 11.5 cfs (est); 5/30, 11.5 cfs (est); 5/31, 11.5 cfs(est); 6/1, 18.0 cfs; 6/2, 12.0 cfs; 6/3, 24.0 cfs; 6/6, 24.0 cfs; 6/9, 11.0 cfs; 6/11, 7.1 cfs; 6/14, 9.5 cfs; 6/18, 21.0 cfs;6/21, 12.0 cfs; 6/24, 12.5 cfs; 6/27, 9.5 cfs; 6/30, 14.0 cfs; 7/6, 11.0 cfs; 7/7, 8.5 cfs; 7/8, 8.5 cfs; 7/11, 5.5 cfs; 7/12, 8.5cfs; 7/13, 7.5 cfs; 7/16, 5.5 cfs; 7/19, 5.0 cfs; 7/23, 5.0 cfs; 7/26, 16.0 cfs (est); 7/28, 7.0 cfs; 7/30, 3.5 cfs (est); 8/2, 5.0cfs; 8/5, 7.0 cfs; 8/9, 26.0 cfs (est); 8/10, 20.0 cfs; 8/17, 11.5 cfs; 8/18, 11.0 cfs; 8/20, 11.0 cfs; 8/26, 11.0 cfs; 9/2, 2.5 cfs(est); 9/3, 8.5 cfs; 9/7, 8.0 cfs (est); 9/9, 7.5 cfs; 9/14, 7.5 cfs; 9/17, 7.5 cfs; 9/20, 8.5 cfs; 9/28, 6.5 cfs.
1994: 4/8, 4/13, off; 4/14, 3.5 cfs (est); 4/15, 2.0 cfs (est); 4/17, 5.0 cfs (est); 4/18, 4.5 cfs (est); 4/19, 4.5 cfs (est); 4/21, 5.5cfs; 4/22, 10.7 cfs; 4/24, 10.5 cfs; 5/2, 4.5 cfs; 5/5, 4.5 cfs; 5/9, 7.09 cfs; 5/19, 4.37 cfs; 6/1, 6.4 cfs; 6/8, 5.0 cfs (est);6/15, 6.0 cfs (est); 6/17, 4.5 cfs (est); 6/22, 3.0 cfs (est); 6/26, 1.5 cfs (est); 7/2, 2.3 cfs; 7/3, 2.0 cfs (est); 7/15, 5.5 cfs;7/18, 4.0 cfs; 7/21, 2.5 cfs; 7/26, 3.5 cfs; 8/4, 4.5 cfs; 8/11, 3.5 cfs (est); 8/16, 1.0 cfs (est); 8/19, 1.2 cfs; 8/21, dry; 8/22,2.0 cfs (est); 8/25, 3.0 cfs (est); 8/29, 4.5 cfs (est); 8/30, 3.5 cfs; 9/1, 3.5 cfs; 9/2, 3.5 cfs (est); 9/7, 3.5 cfs (est); 9/9, 3.5cfs (est); 9/15, 3.0 cfs (est); 9/21, 2.0 cfs (est); 9/29, 0.5 cfs (est).
1995: 10/26/94, 2.5 cfs (est); 4/5, 4/12, off; 5/8, 4.5 cfs (est); 5/23, 15 cfs (est); 6/3, 18 cfs (est); 6/5, 12 cfs (est); 6/20, 22 cfs(est); 6/22, 19.2 cfs; 7/9, 26 cfs (est); 7/10, 45 cfs (est), 7/21, 22 cfs; 7/25, 8/11, 8/21, 9/12, off.
1996: 5/3, 4 cfs (est); 5/7, 3.8 cfs; 5/21, 24 cfs; 6/3, 24 cfs; 6/17, 28 cfs; 7/5, 25 cfs (est); 7/12, 21.8 cfs; 7/23, 28 cfs; 8/6, 0.1cfs (est); 8/26, off; 9/19, 1 cfs (est).
1997: 5/9, 12.7 cfs; 5/14, 10.8 cfs; 6/12, 32.3 cfs; 6/27, 24.3 cfs; 7/18, 35 cfs (est); 8/14, 9/17, off.1998: 4/24, 5/4, 5/19, off; 5/28, 10.1 cfs; 6/1, 9 cfs (est); 6/3, 7.9 cfs; 6/12, 37.5 cfs; 6/26, 31.4 cfs; 7/1, 25.8 cfs; 7/14, 22.8
cfs; 7/27, 40 cfs (est); 7/30, 41.3 cfs; 8/11, 34.7 cfs; 8/20, off.
Supply: 1980, average; 1981, slightly below average; 1982, average; 1983, above average; 1984, above average; 1985,slightly below average; 1986, average; 1987, average; 1988, below average; 1989, below average; 1990, below average;1991, slightly below average; 1992; below average; 1993, average; 1994, below average; 1995, slightly above average;1996, average; 1997, average; 1998, slightly above average.
Source: State Engineer’s Office, Annual Hydrographers’ Reports.
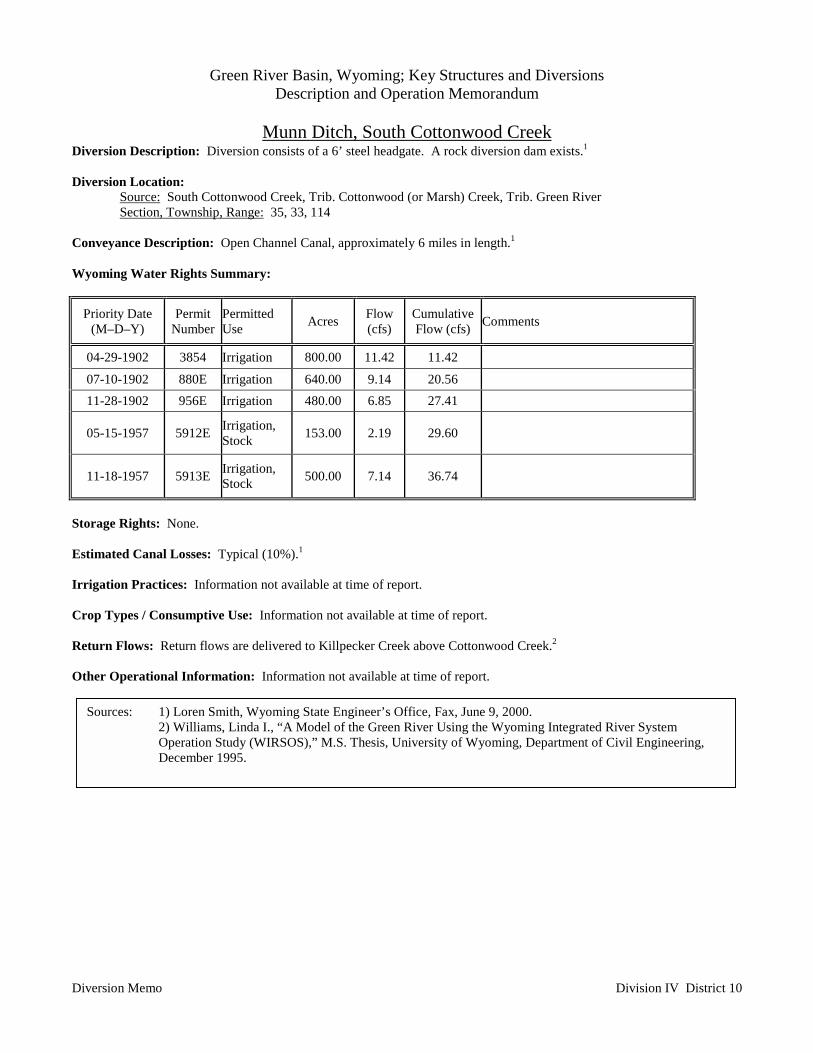
Green River Basin, Wyoming; Key Structures and DiversionsDescription and Operation Memorandum
Munn Ditch, South Cottonwood Creek
Diversion Memo Division IV District 10
Diversion Description: Diversion consists of a 6’ steel headgate. A rock diversion dam exists.1
Diversion Location:Source: South Cottonwood Creek, Trib. Cottonwood (or Marsh) Creek, Trib. Green RiverSection, Township, Range: 35, 33, 114
Conveyance Description: Open Channel Canal, approximately 6 miles in length.1
Wyoming Water Rights Summary:
Priority Date(M–D–Y)
PermitNumber
PermittedUse Acres Flow
(cfs)CumulativeFlow (cfs) Comments
04-29-1902 3854 Irrigation 800.00 11.42 11.42
07-10-1902 880E Irrigation 640.00 9.14 20.56 11-28-1902 956E Irrigation 480.00 6.85 27.41
05-15-1957 5912E Irrigation,Stock 153.00 2.19 29.60
11-18-1957 5913E Irrigation,Stock 500.00 7.14 36.74
Storage Rights: None.
Estimated Canal Losses: Typical (10%).1
Irrigation Practices: Information not available at time of report.
Crop Types / Consumptive Use: Information not available at time of report.
Return Flows: Return flows are delivered to Killpecker Creek above Cottonwood Creek.2
Other Operational Information: Information not available at time of report.
Sources: 1) Loren Smith, Wyoming State Engineer’s Office, Fax, June 9, 2000.2) Williams, Linda I., “A Model of the Green River Using the Wyoming Integrated River SystemOperation Study (WIRSOS),” M.S. Thesis, University of Wyoming, Department of Civil Engineering,December 1995.
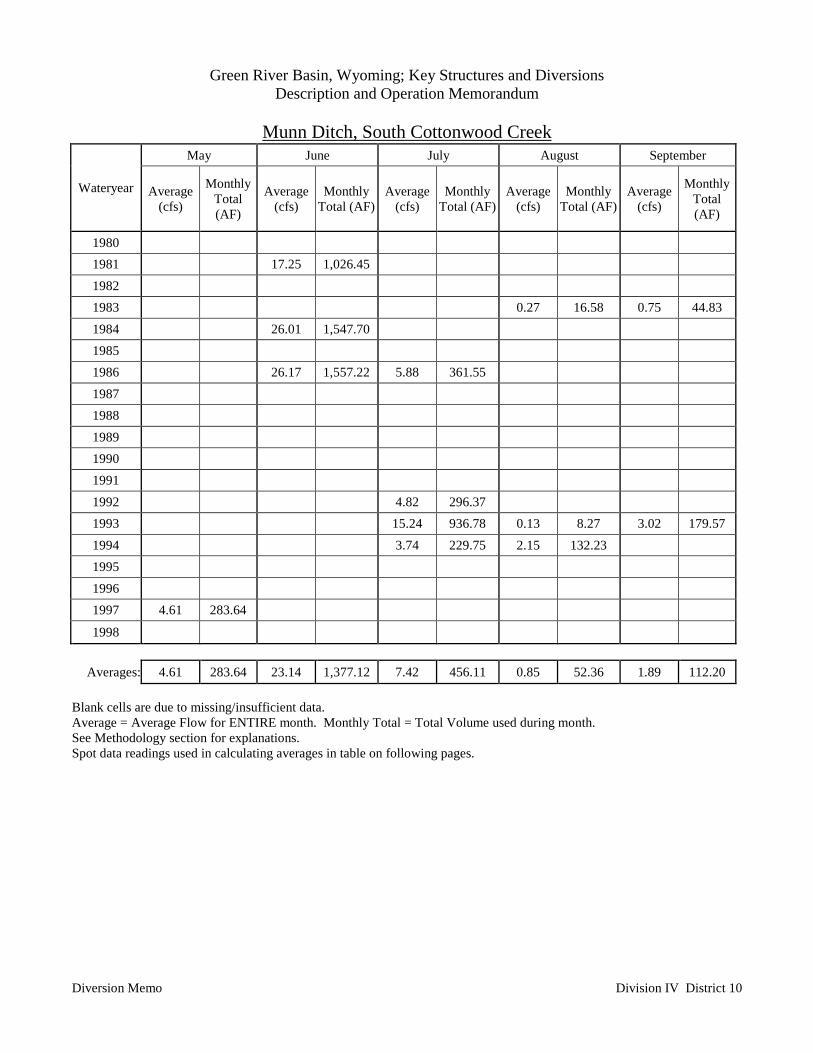
Green River Basin, Wyoming; Key Structures and DiversionsDescription and Operation Memorandum
Munn Ditch, South Cottonwood Creek
Diversion Memo Division IV District 10
May June July August September
Wateryear Average(cfs)
MonthlyTotal(AF)
Average(cfs)
MonthlyTotal (AF)
Average(cfs)
MonthlyTotal (AF)
Average(cfs)
MonthlyTotal (AF)
Average(cfs)
MonthlyTotal(AF)
1980 1981 17.25 1,026.45 1982 1983 0.27 16.58 0.75 44.831984 26.01 1,547.701985 1986 26.17 1,557.22 5.88 361.551987 1988 1989 1990 1991 1992 4.82 296.371993 15.24 936.78 0.13 8.27 3.02 179.571994 3.74 229.75 2.15 132.23 1995 1996 1997 4.61 283.64
1998
Averages: 4.61 283.64 23.14 1,377.12 7.42 456.11 0.85 52.36 1.89 112.20
Blank cells are due to missing/insufficient data.Average = Average Flow for ENTIRE month. Monthly Total = Total Volume used during month.See Methodology section for explanations.Spot data readings used in calculating averages in table on following pages.
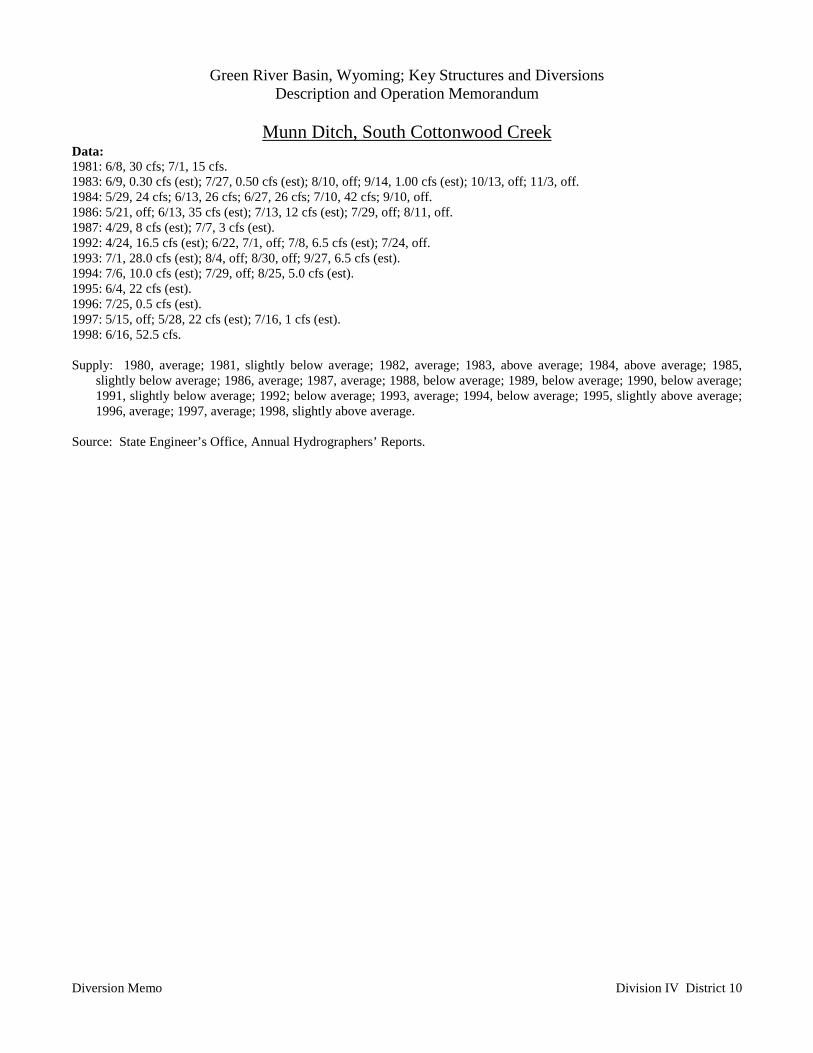
Green River Basin, Wyoming; Key Structures and DiversionsDescription and Operation Memorandum
Munn Ditch, South Cottonwood Creek
Diversion Memo Division IV District 10
Data:1981: 6/8, 30 cfs; 7/1, 15 cfs.1983: 6/9, 0.30 cfs (est); 7/27, 0.50 cfs (est); 8/10, off; 9/14, 1.00 cfs (est); 10/13, off; 11/3, off.1984: 5/29, 24 cfs; 6/13, 26 cfs; 6/27, 26 cfs; 7/10, 42 cfs; 9/10, off.1986: 5/21, off; 6/13, 35 cfs (est); 7/13, 12 cfs (est); 7/29, off; 8/11, off.1987: 4/29, 8 cfs (est); 7/7, 3 cfs (est).1992: 4/24, 16.5 cfs (est); 6/22, 7/1, off; 7/8, 6.5 cfs (est); 7/24, off.1993: 7/1, 28.0 cfs (est); 8/4, off; 8/30, off; 9/27, 6.5 cfs (est).1994: 7/6, 10.0 cfs (est); 7/29, off; 8/25, 5.0 cfs (est).1995: 6/4, 22 cfs (est).1996: 7/25, 0.5 cfs (est).1997: 5/15, off; 5/28, 22 cfs (est); 7/16, 1 cfs (est).1998: 6/16, 52.5 cfs.
Supply: 1980, average; 1981, slightly below average; 1982, average; 1983, above average; 1984, above average; 1985,slightly below average; 1986, average; 1987, average; 1988, below average; 1989, below average; 1990, below average;1991, slightly below average; 1992; below average; 1993, average; 1994, below average; 1995, slightly above average;1996, average; 1997, average; 1998, slightly above average.
Source: State Engineer’s Office, Annual Hydrographers’ Reports.
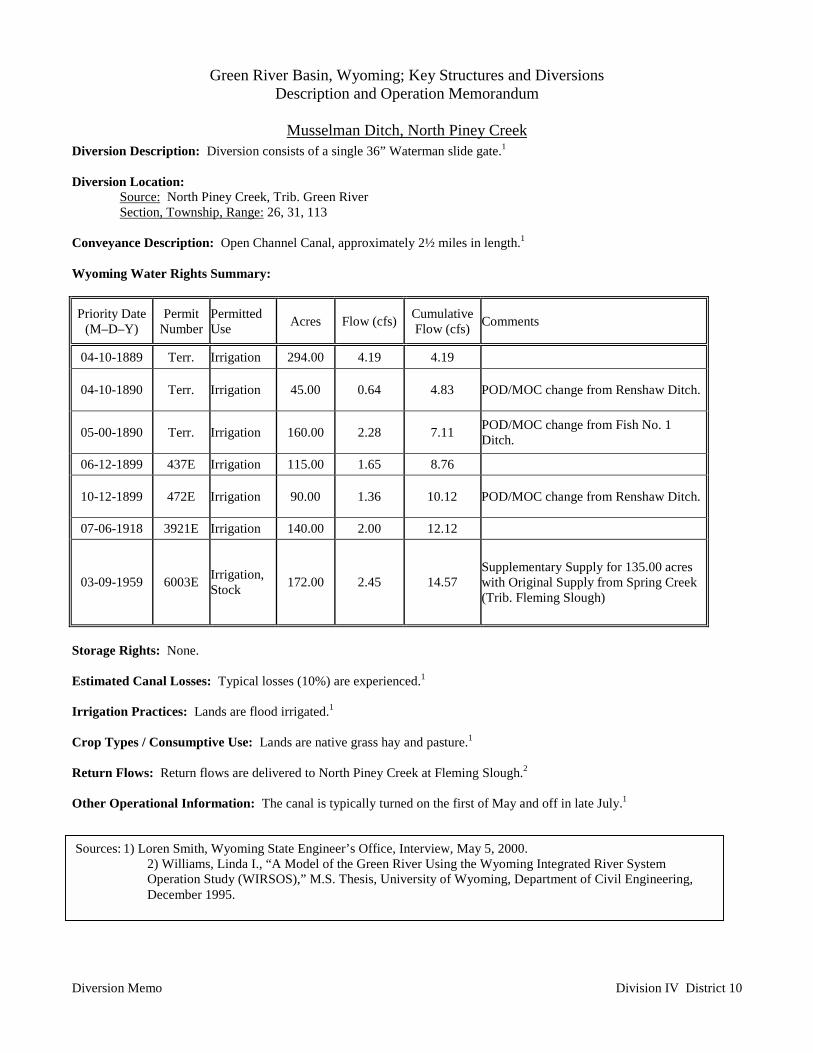
Green River Basin, Wyoming; Key Structures and DiversionsDescription and Operation Memorandum
Musselman Ditch, North Piney Creek
Diversion Memo Division IV District 10
Diversion Description: Diversion consists of a single 36” Waterman slide gate.1
Diversion Location:Source: North Piney Creek, Trib. Green RiverSection, Township, Range: 26, 31, 113
Conveyance Description: Open Channel Canal, approximately 2½ miles in length.1
Wyoming Water Rights Summary:
Priority Date(M–D–Y)
PermitNumber
PermittedUse Acres Flow (cfs) Cumulative
Flow (cfs) Comments
04-10-1889 Terr. Irrigation 294.00 4.19 4.19
04-10-1890 Terr. Irrigation 45.00 0.64 4.83 POD/MOC change from Renshaw Ditch.
05-00-1890 Terr. Irrigation 160.00 2.28 7.11 POD/MOC change from Fish No. 1Ditch.
06-12-1899 437E Irrigation 115.00 1.65 8.76
10-12-1899 472E Irrigation 90.00 1.36 10.12 POD/MOC change from Renshaw Ditch.
07-06-1918 3921E Irrigation 140.00 2.00 12.12
03-09-1959 6003E Irrigation,Stock 172.00 2.45 14.57
Supplementary Supply for 135.00 acreswith Original Supply from Spring Creek(Trib. Fleming Slough)
Storage Rights: None.
Estimated Canal Losses: Typical losses (10%) are experienced.1
Irrigation Practices: Lands are flood irrigated.1
Crop Types / Consumptive Use: Lands are native grass hay and pasture.1
Return Flows: Return flows are delivered to North Piney Creek at Fleming Slough.2
Other Operational Information: The canal is typically turned on the first of May and off in late July.1
Sources: 1) Loren Smith, Wyoming State Engineer’s Office, Interview, May 5, 2000.2) Williams, Linda I., “A Model of the Green River Using the Wyoming Integrated River SystemOperation Study (WIRSOS),” M.S. Thesis, University of Wyoming, Department of Civil Engineering,December 1995.
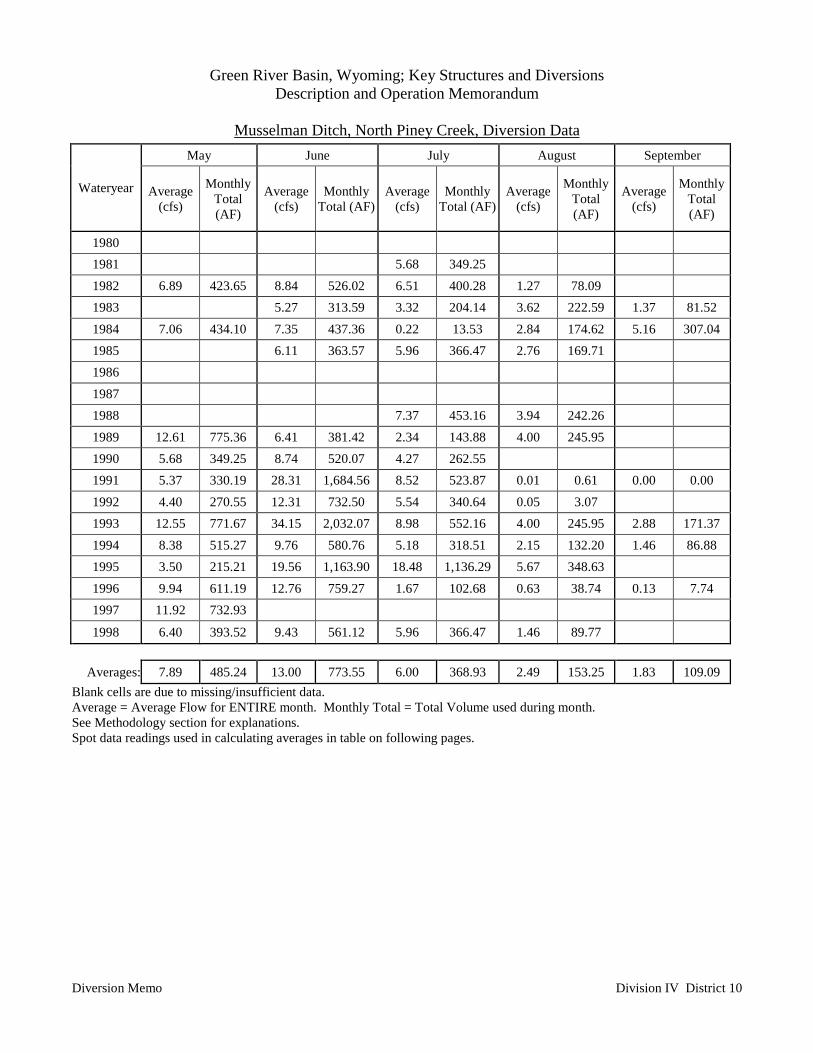
Green River Basin, Wyoming; Key Structures and DiversionsDescription and Operation Memorandum
Musselman Ditch, North Piney Creek, Diversion Data
Diversion Memo Division IV District 10
May June July August September
Wateryear Average(cfs)
MonthlyTotal(AF)
Average(cfs)
MonthlyTotal (AF)
Average(cfs)
MonthlyTotal (AF)
Average(cfs)
MonthlyTotal(AF)
Average(cfs)
MonthlyTotal(AF)
1980 1981 5.68 349.25 1982 6.89 423.65 8.84 526.02 6.51 400.28 1.27 78.09 1983 5.27 313.59 3.32 204.14 3.62 222.59 1.37 81.521984 7.06 434.10 7.35 437.36 0.22 13.53 2.84 174.62 5.16 307.041985 6.11 363.57 5.96 366.47 2.76 169.71 1986 1987 1988 7.37 453.16 3.94 242.26 1989 12.61 775.36 6.41 381.42 2.34 143.88 4.00 245.95 1990 5.68 349.25 8.74 520.07 4.27 262.55 1991 5.37 330.19 28.31 1,684.56 8.52 523.87 0.01 0.61 0.00 0.001992 4.40 270.55 12.31 732.50 5.54 340.64 0.05 3.07 1993 12.55 771.67 34.15 2,032.07 8.98 552.16 4.00 245.95 2.88 171.371994 8.38 515.27 9.76 580.76 5.18 318.51 2.15 132.20 1.46 86.881995 3.50 215.21 19.56 1,163.90 18.48 1,136.29 5.67 348.63 1996 9.94 611.19 12.76 759.27 1.67 102.68 0.63 38.74 0.13 7.741997 11.92 732.93
1998 6.40 393.52 9.43 561.12 5.96 366.47 1.46 89.77
Averages: 7.89 485.24 13.00 773.55 6.00 368.93 2.49 153.25 1.83 109.09Blank cells are due to missing/insufficient data.Average = Average Flow for ENTIRE month. Monthly Total = Total Volume used during month.See Methodology section for explanations.Spot data readings used in calculating averages in table on following pages.
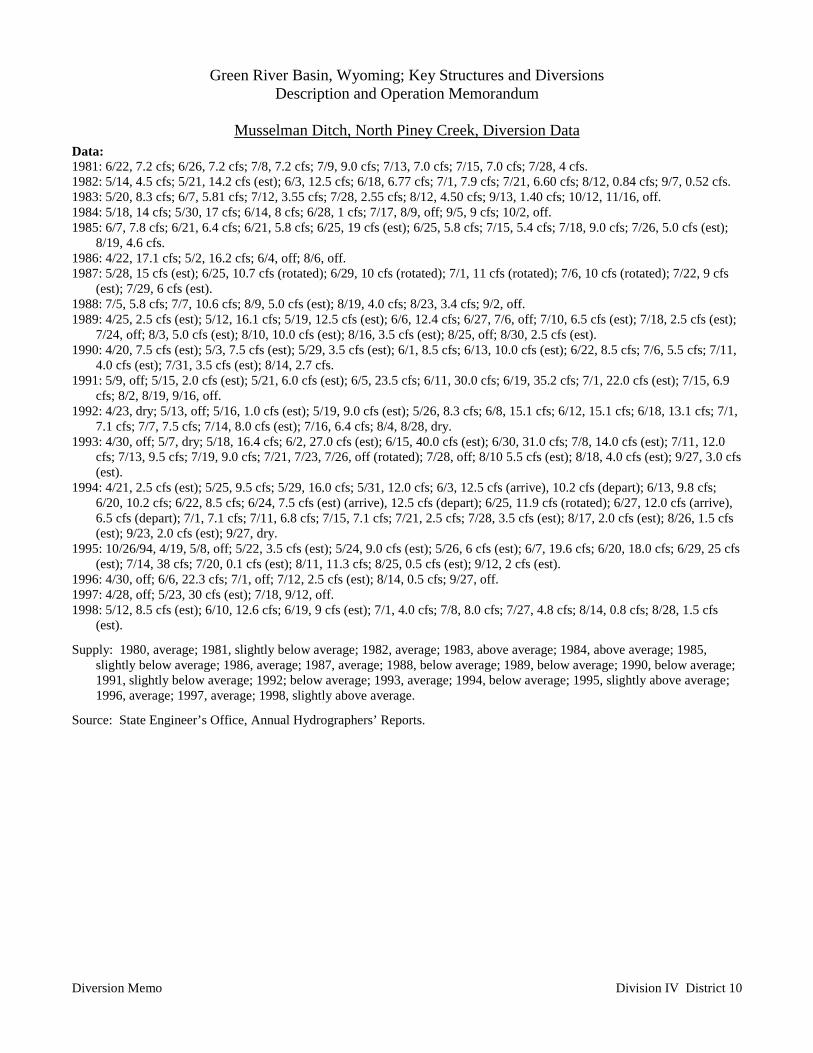
Green River Basin, Wyoming; Key Structures and DiversionsDescription and Operation Memorandum
Musselman Ditch, North Piney Creek, Diversion Data
Diversion Memo Division IV District 10
Data:1981: 6/22, 7.2 cfs; 6/26, 7.2 cfs; 7/8, 7.2 cfs; 7/9, 9.0 cfs; 7/13, 7.0 cfs; 7/15, 7.0 cfs; 7/28, 4 cfs.1982: 5/14, 4.5 cfs; 5/21, 14.2 cfs (est); 6/3, 12.5 cfs; 6/18, 6.77 cfs; 7/1, 7.9 cfs; 7/21, 6.60 cfs; 8/12, 0.84 cfs; 9/7, 0.52 cfs.1983: 5/20, 8.3 cfs; 6/7, 5.81 cfs; 7/12, 3.55 cfs; 7/28, 2.55 cfs; 8/12, 4.50 cfs; 9/13, 1.40 cfs; 10/12, 11/16, off.1984: 5/18, 14 cfs; 5/30, 17 cfs; 6/14, 8 cfs; 6/28, 1 cfs; 7/17, 8/9, off; 9/5, 9 cfs; 10/2, off.1985: 6/7, 7.8 cfs; 6/21, 6.4 cfs; 6/21, 5.8 cfs; 6/25, 19 cfs (est); 6/25, 5.8 cfs; 7/15, 5.4 cfs; 7/18, 9.0 cfs; 7/26, 5.0 cfs (est);
8/19, 4.6 cfs.1986: 4/22, 17.1 cfs; 5/2, 16.2 cfs; 6/4, off; 8/6, off.1987: 5/28, 15 cfs (est); 6/25, 10.7 cfs (rotated); 6/29, 10 cfs (rotated); 7/1, 11 cfs (rotated); 7/6, 10 cfs (rotated); 7/22, 9 cfs
(est); 7/29, 6 cfs (est).1988: 7/5, 5.8 cfs; 7/7, 10.6 cfs; 8/9, 5.0 cfs (est); 8/19, 4.0 cfs; 8/23, 3.4 cfs; 9/2, off.1989: 4/25, 2.5 cfs (est); 5/12, 16.1 cfs; 5/19, 12.5 cfs (est); 6/6, 12.4 cfs; 6/27, 7/6, off; 7/10, 6.5 cfs (est); 7/18, 2.5 cfs (est);
7/24, off; 8/3, 5.0 cfs (est); 8/10, 10.0 cfs (est); 8/16, 3.5 cfs (est); 8/25, off; 8/30, 2.5 cfs (est).1990: 4/20, 7.5 cfs (est); 5/3, 7.5 cfs (est); 5/29, 3.5 cfs (est); 6/1, 8.5 cfs; 6/13, 10.0 cfs (est); 6/22, 8.5 cfs; 7/6, 5.5 cfs; 7/11,
4.0 cfs (est); 7/31, 3.5 cfs (est); 8/14, 2.7 cfs.1991: 5/9, off; 5/15, 2.0 cfs (est); 5/21, 6.0 cfs (est); 6/5, 23.5 cfs; 6/11, 30.0 cfs; 6/19, 35.2 cfs; 7/1, 22.0 cfs (est); 7/15, 6.9
cfs; 8/2, 8/19, 9/16, off.1992: 4/23, dry; 5/13, off; 5/16, 1.0 cfs (est); 5/19, 9.0 cfs (est); 5/26, 8.3 cfs; 6/8, 15.1 cfs; 6/12, 15.1 cfs; 6/18, 13.1 cfs; 7/1,
7.1 cfs; 7/7, 7.5 cfs; 7/14, 8.0 cfs (est); 7/16, 6.4 cfs; 8/4, 8/28, dry.1993: 4/30, off; 5/7, dry; 5/18, 16.4 cfs; 6/2, 27.0 cfs (est); 6/15, 40.0 cfs (est); 6/30, 31.0 cfs; 7/8, 14.0 cfs (est); 7/11, 12.0
cfs; 7/13, 9.5 cfs; 7/19, 9.0 cfs; 7/21, 7/23, 7/26, off (rotated); 7/28, off; 8/10 5.5 cfs (est); 8/18, 4.0 cfs (est); 9/27, 3.0 cfs(est).
1994: 4/21, 2.5 cfs (est); 5/25, 9.5 cfs; 5/29, 16.0 cfs; 5/31, 12.0 cfs; 6/3, 12.5 cfs (arrive), 10.2 cfs (depart); 6/13, 9.8 cfs;6/20, 10.2 cfs; 6/22, 8.5 cfs; 6/24, 7.5 cfs (est) (arrive), 12.5 cfs (depart); 6/25, 11.9 cfs (rotated); 6/27, 12.0 cfs (arrive),6.5 cfs (depart); 7/1, 7.1 cfs; 7/11, 6.8 cfs; 7/15, 7.1 cfs; 7/21, 2.5 cfs; 7/28, 3.5 cfs (est); 8/17, 2.0 cfs (est); 8/26, 1.5 cfs(est); 9/23, 2.0 cfs (est); 9/27, dry.
1995: 10/26/94, 4/19, 5/8, off; 5/22, 3.5 cfs (est); 5/24, 9.0 cfs (est); 5/26, 6 cfs (est); 6/7, 19.6 cfs; 6/20, 18.0 cfs; 6/29, 25 cfs(est); 7/14, 38 cfs; 7/20, 0.1 cfs (est); 8/11, 11.3 cfs; 8/25, 0.5 cfs (est); 9/12, 2 cfs (est).
1996: 4/30, off; 6/6, 22.3 cfs; 7/1, off; 7/12, 2.5 cfs (est); 8/14, 0.5 cfs; 9/27, off.1997: 4/28, off; 5/23, 30 cfs (est); 7/18, 9/12, off.1998: 5/12, 8.5 cfs (est); 6/10, 12.6 cfs; 6/19, 9 cfs (est); 7/1, 4.0 cfs; 7/8, 8.0 cfs; 7/27, 4.8 cfs; 8/14, 0.8 cfs; 8/28, 1.5 cfs
(est).
Supply: 1980, average; 1981, slightly below average; 1982, average; 1983, above average; 1984, above average; 1985,slightly below average; 1986, average; 1987, average; 1988, below average; 1989, below average; 1990, below average;1991, slightly below average; 1992; below average; 1993, average; 1994, below average; 1995, slightly above average;1996, average; 1997, average; 1998, slightly above average.
Source: State Engineer’s Office, Annual Hydrographers’ Reports.
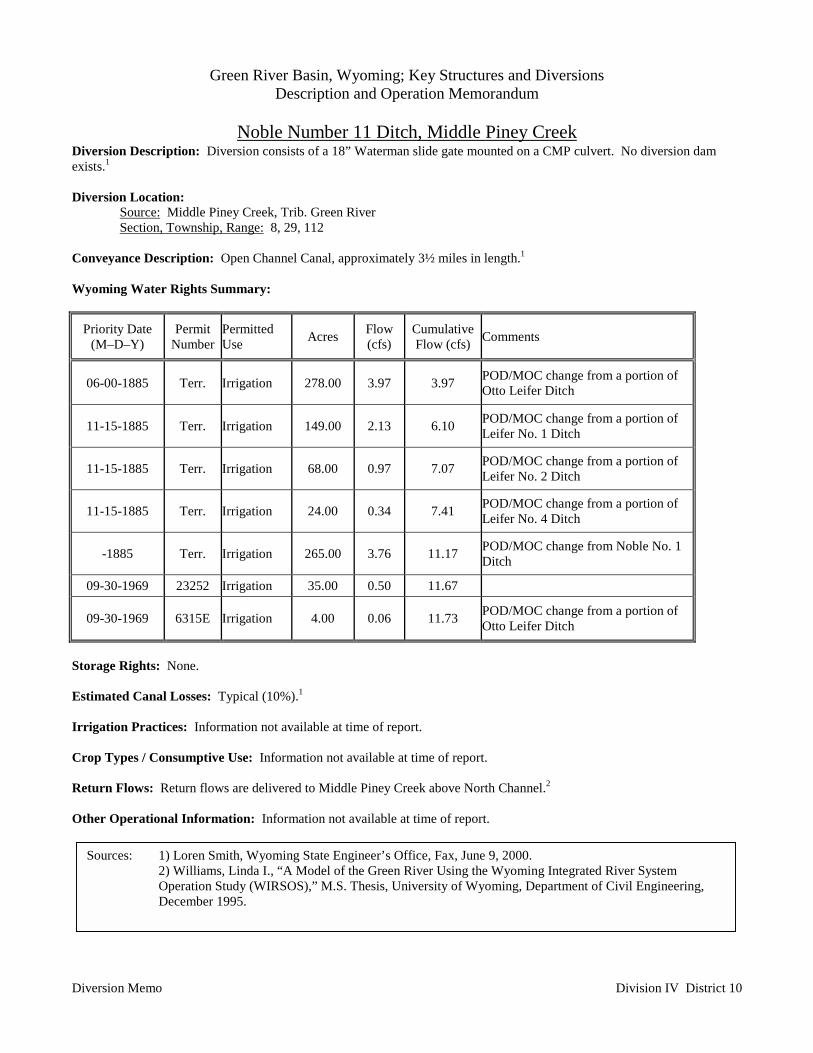
Green River Basin, Wyoming; Key Structures and DiversionsDescription and Operation Memorandum
Noble Number 11 Ditch, Middle Piney Creek
Diversion Memo Division IV District 10
Diversion Description: Diversion consists of a 18” Waterman slide gate mounted on a CMP culvert. No diversion damexists.1
Diversion Location:Source: Middle Piney Creek, Trib. Green RiverSection, Township, Range: 8, 29, 112
Conveyance Description: Open Channel Canal, approximately 3½ miles in length.1
Wyoming Water Rights Summary:
Priority Date(M–D–Y)
PermitNumber
PermittedUse Acres Flow
(cfs)CumulativeFlow (cfs) Comments
06-00-1885 Terr. Irrigation 278.00 3.97 3.97 POD/MOC change from a portion ofOtto Leifer Ditch
11-15-1885 Terr. Irrigation 149.00 2.13 6.10 POD/MOC change from a portion ofLeifer No. 1 Ditch
11-15-1885 Terr. Irrigation 68.00 0.97 7.07 POD/MOC change from a portion ofLeifer No. 2 Ditch
11-15-1885 Terr. Irrigation 24.00 0.34 7.41 POD/MOC change from a portion ofLeifer No. 4 Ditch
-1885 Terr. Irrigation 265.00 3.76 11.17 POD/MOC change from Noble No. 1Ditch
09-30-1969 23252 Irrigation 35.00 0.50 11.67
09-30-1969 6315E Irrigation 4.00 0.06 11.73 POD/MOC change from a portion ofOtto Leifer Ditch
Storage Rights: None.
Estimated Canal Losses: Typical (10%).1
Irrigation Practices: Information not available at time of report.
Crop Types / Consumptive Use: Information not available at time of report.
Return Flows: Return flows are delivered to Middle Piney Creek above North Channel.2
Other Operational Information: Information not available at time of report.
Sources: 1) Loren Smith, Wyoming State Engineer’s Office, Fax, June 9, 2000.2) Williams, Linda I., “A Model of the Green River Using the Wyoming Integrated River SystemOperation Study (WIRSOS),” M.S. Thesis, University of Wyoming, Department of Civil Engineering,December 1995.
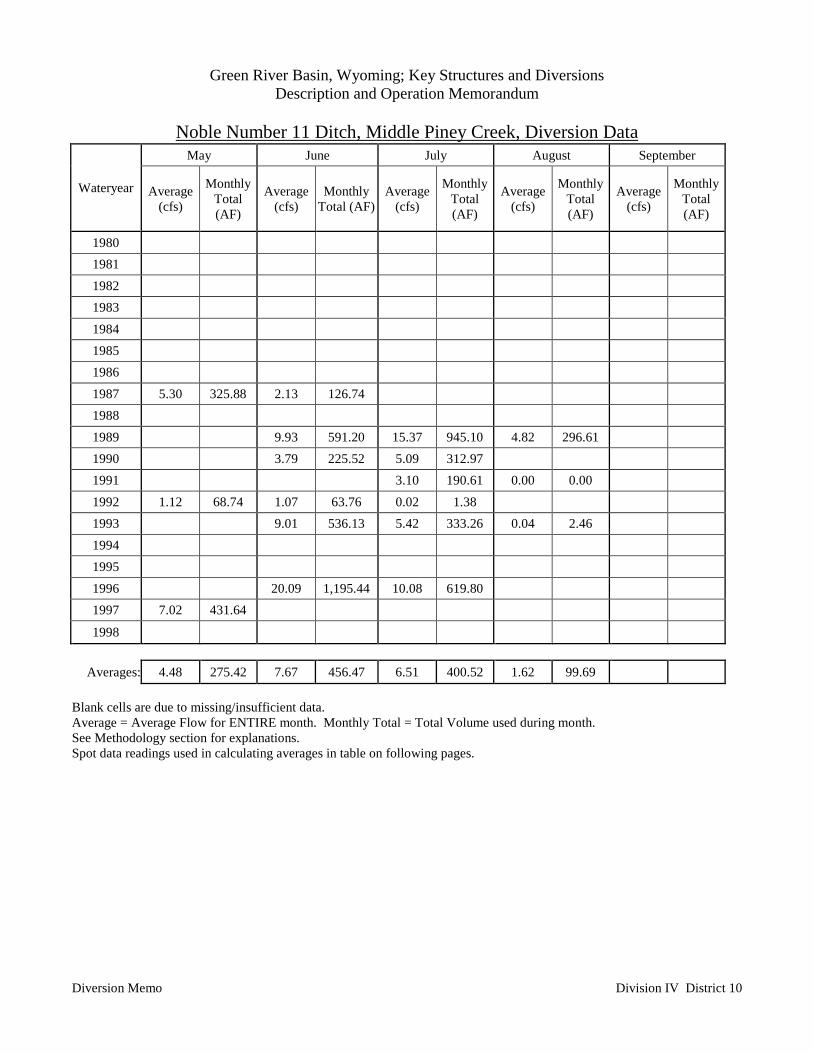
Green River Basin, Wyoming; Key Structures and DiversionsDescription and Operation Memorandum
Noble Number 11 Ditch, Middle Piney Creek, Diversion Data
Diversion Memo Division IV District 10
May June July August September
Wateryear Average(cfs)
MonthlyTotal(AF)
Average(cfs)
MonthlyTotal (AF)
Average(cfs)
MonthlyTotal(AF)
Average(cfs)
MonthlyTotal(AF)
Average(cfs)
MonthlyTotal(AF)
1980 1981 1982 1983 1984 1985 1986 1987 5.30 325.88 2.13 126.74 1988 1989 9.93 591.20 15.37 945.10 4.82 296.61 1990 3.79 225.52 5.09 312.97 1991 3.10 190.61 0.00 0.001992 1.12 68.74 1.07 63.76 0.02 1.38 1993 9.01 536.13 5.42 333.26 0.04 2.46 1994 1995 1996 20.09 1,195.44 10.08 619.80 1997 7.02 431.64
1998
Averages: 4.48 275.42 7.67 456.47 6.51 400.52 1.62 99.69
Blank cells are due to missing/insufficient data.Average = Average Flow for ENTIRE month. Monthly Total = Total Volume used during month.See Methodology section for explanations.Spot data readings used in calculating averages in table on following pages.
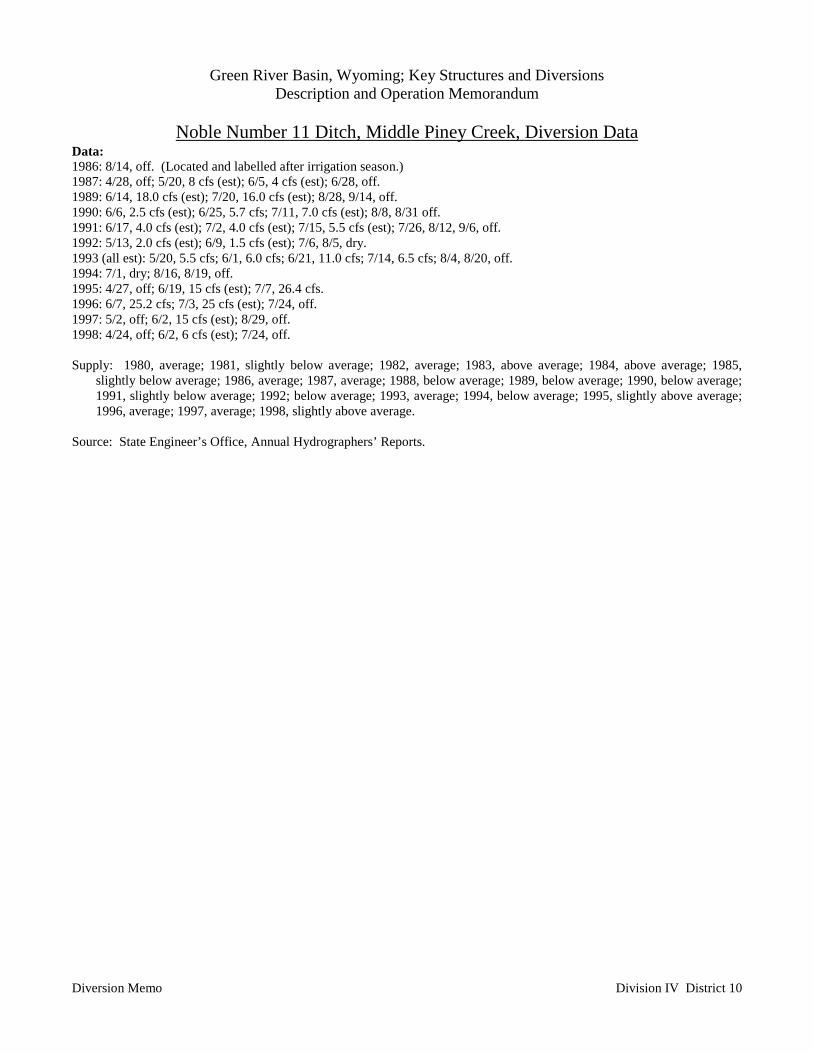
Green River Basin, Wyoming; Key Structures and DiversionsDescription and Operation Memorandum
Noble Number 11 Ditch, Middle Piney Creek, Diversion Data
Diversion Memo Division IV District 10
Data:1986: 8/14, off. (Located and labelled after irrigation season.)1987: 4/28, off; 5/20, 8 cfs (est); 6/5, 4 cfs (est); 6/28, off.1989: 6/14, 18.0 cfs (est); 7/20, 16.0 cfs (est); 8/28, 9/14, off.1990: 6/6, 2.5 cfs (est); 6/25, 5.7 cfs; 7/11, 7.0 cfs (est); 8/8, 8/31 off.1991: 6/17, 4.0 cfs (est); 7/2, 4.0 cfs (est); 7/15, 5.5 cfs (est); 7/26, 8/12, 9/6, off.1992: 5/13, 2.0 cfs (est); 6/9, 1.5 cfs (est); 7/6, 8/5, dry.1993 (all est): 5/20, 5.5 cfs; 6/1, 6.0 cfs; 6/21, 11.0 cfs; 7/14, 6.5 cfs; 8/4, 8/20, off.1994: 7/1, dry; 8/16, 8/19, off.1995: 4/27, off; 6/19, 15 cfs (est); 7/7, 26.4 cfs.1996: 6/7, 25.2 cfs; 7/3, 25 cfs (est); 7/24, off.1997: 5/2, off; 6/2, 15 cfs (est); 8/29, off.1998: 4/24, off; 6/2, 6 cfs (est); 7/24, off.
Supply: 1980, average; 1981, slightly below average; 1982, average; 1983, above average; 1984, above average; 1985,slightly below average; 1986, average; 1987, average; 1988, below average; 1989, below average; 1990, below average;1991, slightly below average; 1992; below average; 1993, average; 1994, below average; 1995, slightly above average;1996, average; 1997, average; 1998, slightly above average.
Source: State Engineer’s Office, Annual Hydrographers’ Reports.
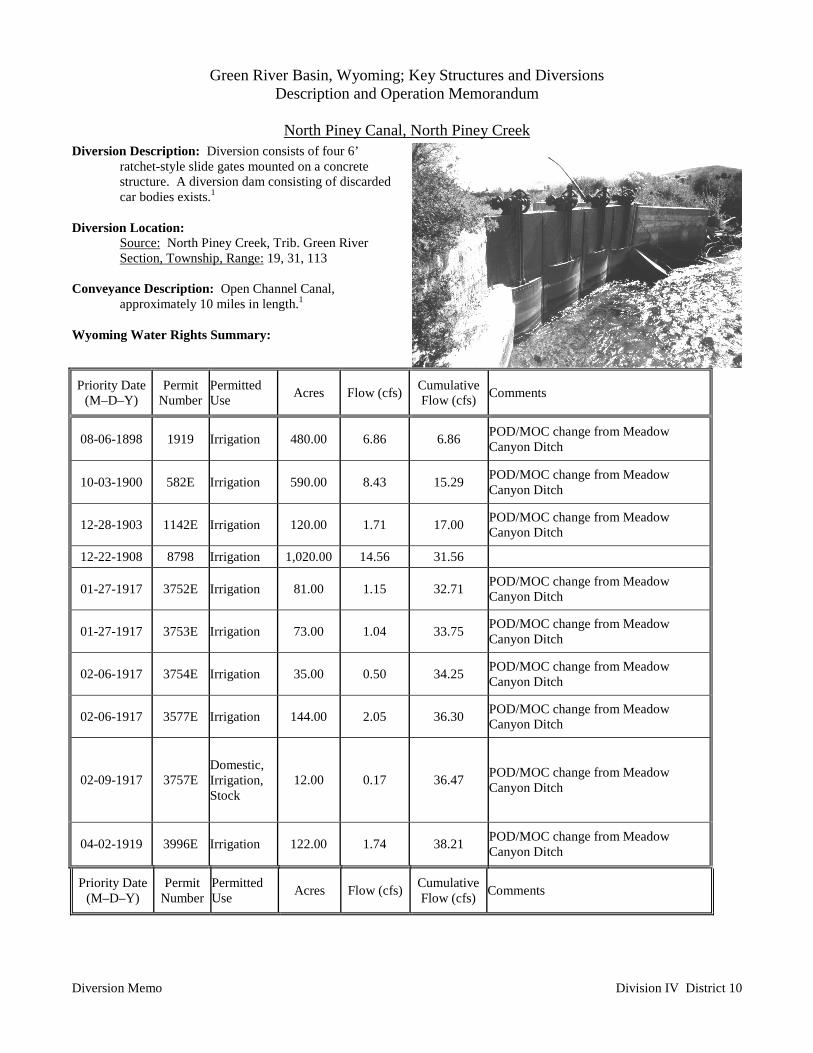
Green River Basin, Wyoming; Key Structures and DiversionsDescription and Operation Memorandum
North Piney Canal, North Piney Creek
Diversion Memo Division IV District 10
Diversion Description: Diversion consists of four 6’ratchet-style slide gates mounted on a concretestructure. A diversion dam consisting of discardedcar bodies exists.1
Diversion Location:Source: North Piney Creek, Trib. Green RiverSection, Township, Range: 19, 31, 113
Conveyance Description: Open Channel Canal,approximately 10 miles in length.1
Wyoming Water Rights Summary:
Priority Date(M–D–Y)
PermitNumber
PermittedUse Acres Flow (cfs) Cumulative
Flow (cfs) Comments
08-06-1898 1919 Irrigation 480.00 6.86 6.86 POD/MOC change from MeadowCanyon Ditch
10-03-1900 582E Irrigation 590.00 8.43 15.29 POD/MOC change from MeadowCanyon Ditch
12-28-1903 1142E Irrigation 120.00 1.71 17.00 POD/MOC change from MeadowCanyon Ditch
12-22-1908 8798 Irrigation 1,020.00 14.56 31.56
01-27-1917 3752E Irrigation 81.00 1.15 32.71 POD/MOC change from MeadowCanyon Ditch
01-27-1917 3753E Irrigation 73.00 1.04 33.75 POD/MOC change from MeadowCanyon Ditch
02-06-1917 3754E Irrigation 35.00 0.50 34.25 POD/MOC change from MeadowCanyon Ditch
02-06-1917 3577E Irrigation 144.00 2.05 36.30 POD/MOC change from MeadowCanyon Ditch
02-09-1917 3757EDomestic,Irrigation,Stock
12.00 0.17 36.47 POD/MOC change from MeadowCanyon Ditch
04-02-1919 3996E Irrigation 122.00 1.74 38.21 POD/MOC change from MeadowCanyon Ditch
Priority Date(M–D–Y)
PermitNumber
PermittedUse Acres Flow (cfs) Cumulative
Flow (cfs) Comments
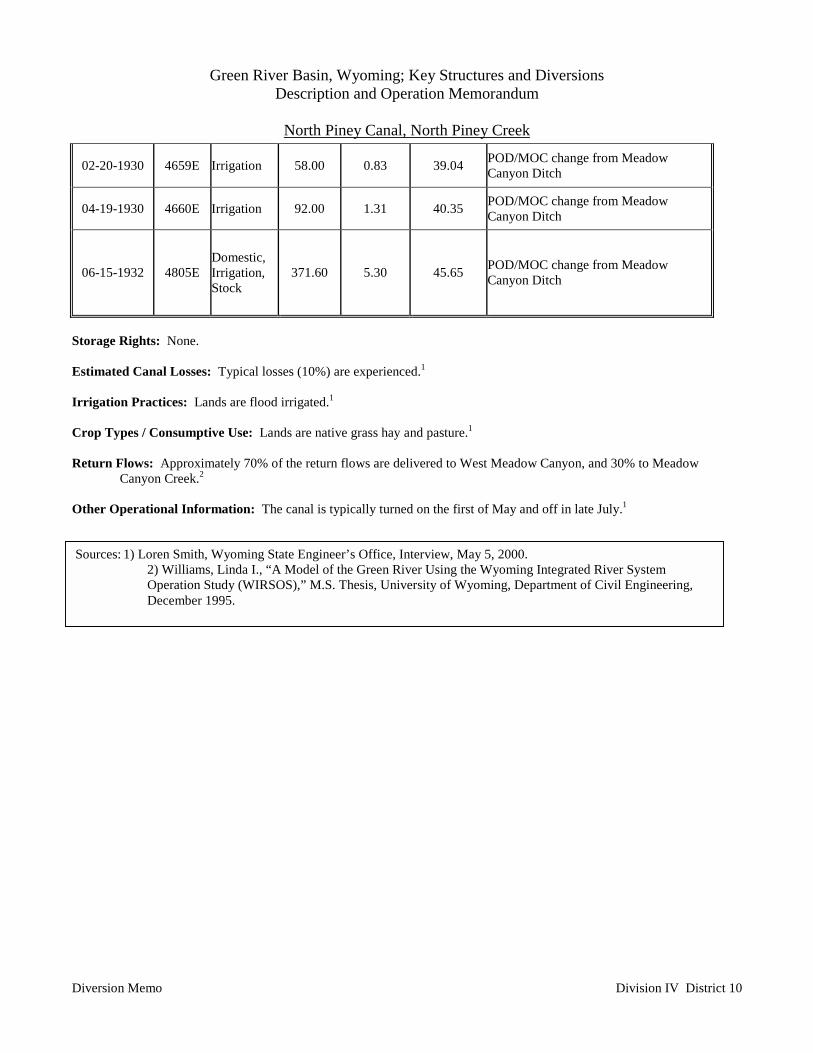
Green River Basin, Wyoming; Key Structures and DiversionsDescription and Operation Memorandum
North Piney Canal, North Piney Creek
Diversion Memo Division IV District 10
02-20-1930 4659E Irrigation 58.00 0.83 39.04 POD/MOC change from MeadowCanyon Ditch
04-19-1930 4660E Irrigation 92.00 1.31 40.35 POD/MOC change from MeadowCanyon Ditch
06-15-1932 4805EDomestic,Irrigation,Stock
371.60 5.30 45.65 POD/MOC change from MeadowCanyon Ditch
Storage Rights: None.
Estimated Canal Losses: Typical losses (10%) are experienced.1
Irrigation Practices: Lands are flood irrigated.1
Crop Types / Consumptive Use: Lands are native grass hay and pasture.1
Return Flows: Approximately 70% of the return flows are delivered to West Meadow Canyon, and 30% to MeadowCanyon Creek.2
Other Operational Information: The canal is typically turned on the first of May and off in late July.1
Sources: 1) Loren Smith, Wyoming State Engineer’s Office, Interview, May 5, 2000.2) Williams, Linda I., “A Model of the Green River Using the Wyoming Integrated River SystemOperation Study (WIRSOS),” M.S. Thesis, University of Wyoming, Department of Civil Engineering,December 1995.
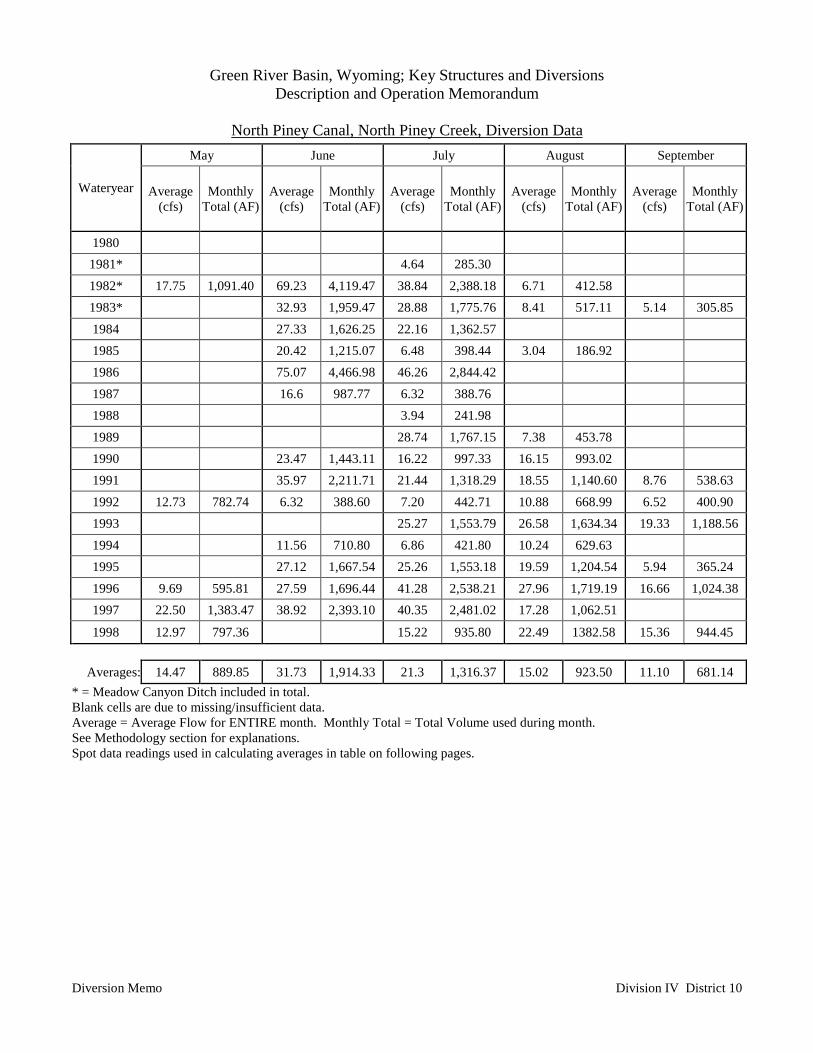
Green River Basin, Wyoming; Key Structures and DiversionsDescription and Operation Memorandum
North Piney Canal, North Piney Creek, Diversion Data
Diversion Memo Division IV District 10
May June July August September
Wateryear Average(cfs)
MonthlyTotal (AF)
Average(cfs)
MonthlyTotal (AF)
Average(cfs)
MonthlyTotal (AF)
Average(cfs)
MonthlyTotal (AF)
Average(cfs)
MonthlyTotal (AF)
1980 1981* 4.64 285.30 1982* 17.75 1,091.40 69.23 4,119.47 38.84 2,388.18 6.71 412.58 1983* 32.93 1,959.47 28.88 1,775.76 8.41 517.11 5.14 305.851984 27.33 1,626.25 22.16 1,362.571985 20.42 1,215.07 6.48 398.44 3.04 186.92 1986 75.07 4,466.98 46.26 2,844.42 1987 16.6 987.77 6.32 388.761988 3.94 241.98 1989 28.74 1,767.15 7.38 453.78 1990 23.47 1,443.11 16.22 997.33 16.15 993.021991 35.97 2,211.71 21.44 1,318.29 18.55 1,140.60 8.76 538.631992 12.73 782.74 6.32 388.60 7.20 442.71 10.88 668.99 6.52 400.901993 25.27 1,553.79 26.58 1,634.34 19.33 1,188.561994 11.56 710.80 6.86 421.80 10.24 629.63 1995 27.12 1,667.54 25.26 1,553.18 19.59 1,204.54 5.94 365.241996 9.69 595.81 27.59 1,696.44 41.28 2,538.21 27.96 1,719.19 16.66 1,024.381997 22.50 1,383.47 38.92 2,393.10 40.35 2,481.02 17.28 1,062.51
1998 12.97 797.36 15.22 935.80 22.49 1382.58 15.36 944.45
Averages: 14.47 889.85 31.73 1,914.33 21.3 1,316.37 15.02 923.50 11.10 681.14* = Meadow Canyon Ditch included in total.Blank cells are due to missing/insufficient data.Average = Average Flow for ENTIRE month. Monthly Total = Total Volume used during month.See Methodology section for explanations.Spot data readings used in calculating averages in table on following pages.
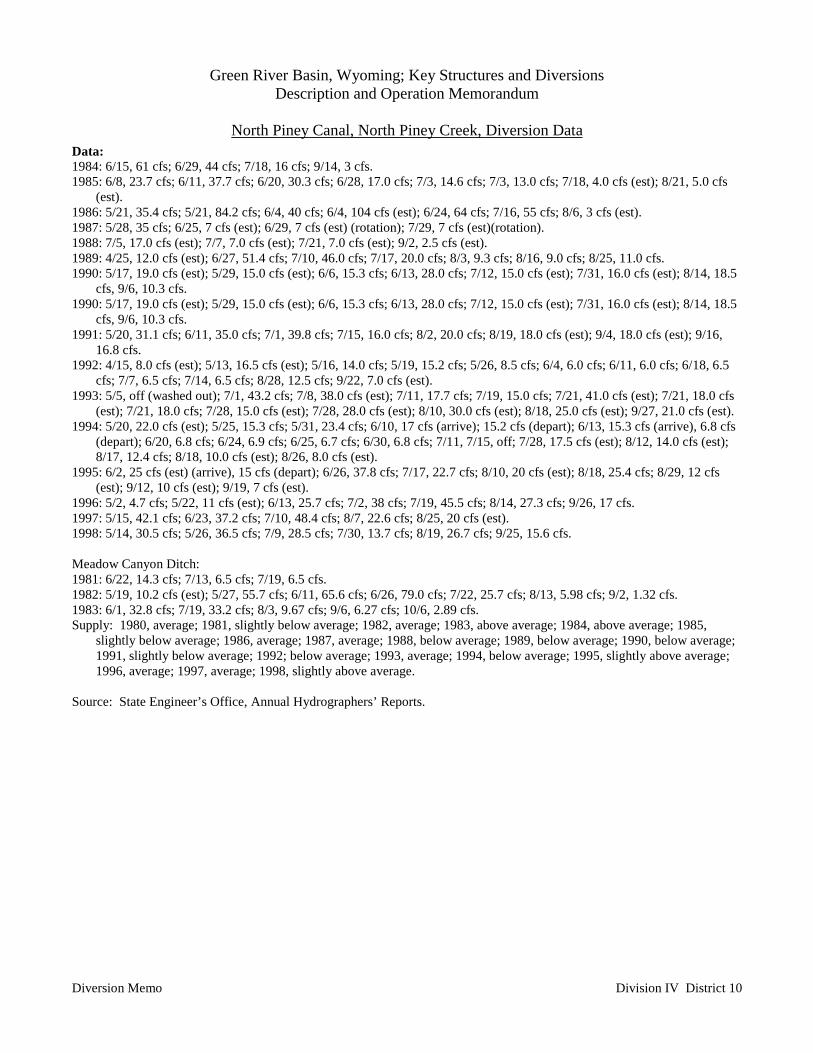
Green River Basin, Wyoming; Key Structures and DiversionsDescription and Operation Memorandum
North Piney Canal, North Piney Creek, Diversion Data
Diversion Memo Division IV District 10
Data:1984: 6/15, 61 cfs; 6/29, 44 cfs; 7/18, 16 cfs; 9/14, 3 cfs.1985: 6/8, 23.7 cfs; 6/11, 37.7 cfs; 6/20, 30.3 cfs; 6/28, 17.0 cfs; 7/3, 14.6 cfs; 7/3, 13.0 cfs; 7/18, 4.0 cfs (est); 8/21, 5.0 cfs
(est).1986: 5/21, 35.4 cfs; 5/21, 84.2 cfs; 6/4, 40 cfs; 6/4, 104 cfs (est); 6/24, 64 cfs; 7/16, 55 cfs; 8/6, 3 cfs (est).1987: 5/28, 35 cfs; 6/25, 7 cfs (est); 6/29, 7 cfs (est) (rotation); 7/29, 7 cfs (est)(rotation).1988: 7/5, 17.0 cfs (est); 7/7, 7.0 cfs (est); 7/21, 7.0 cfs (est); 9/2, 2.5 cfs (est).1989: 4/25, 12.0 cfs (est); 6/27, 51.4 cfs; 7/10, 46.0 cfs; 7/17, 20.0 cfs; 8/3, 9.3 cfs; 8/16, 9.0 cfs; 8/25, 11.0 cfs.1990: 5/17, 19.0 cfs (est); 5/29, 15.0 cfs (est); 6/6, 15.3 cfs; 6/13, 28.0 cfs; 7/12, 15.0 cfs (est); 7/31, 16.0 cfs (est); 8/14, 18.5
cfs, 9/6, 10.3 cfs.1990: 5/17, 19.0 cfs (est); 5/29, 15.0 cfs (est); 6/6, 15.3 cfs; 6/13, 28.0 cfs; 7/12, 15.0 cfs (est); 7/31, 16.0 cfs (est); 8/14, 18.5
cfs, 9/6, 10.3 cfs.1991: 5/20, 31.1 cfs; 6/11, 35.0 cfs; 7/1, 39.8 cfs; 7/15, 16.0 cfs; 8/2, 20.0 cfs; 8/19, 18.0 cfs (est); 9/4, 18.0 cfs (est); 9/16,
16.8 cfs.1992: 4/15, 8.0 cfs (est); 5/13, 16.5 cfs (est); 5/16, 14.0 cfs; 5/19, 15.2 cfs; 5/26, 8.5 cfs; 6/4, 6.0 cfs; 6/11, 6.0 cfs; 6/18, 6.5
cfs; 7/7, 6.5 cfs; 7/14, 6.5 cfs; 8/28, 12.5 cfs; 9/22, 7.0 cfs (est).1993: 5/5, off (washed out); 7/1, 43.2 cfs; 7/8, 38.0 cfs (est); 7/11, 17.7 cfs; 7/19, 15.0 cfs; 7/21, 41.0 cfs (est); 7/21, 18.0 cfs
(est); 7/21, 18.0 cfs; 7/28, 15.0 cfs (est); 7/28, 28.0 cfs (est); 8/10, 30.0 cfs (est); 8/18, 25.0 cfs (est); 9/27, 21.0 cfs (est).1994: 5/20, 22.0 cfs (est); 5/25, 15.3 cfs; 5/31, 23.4 cfs; 6/10, 17 cfs (arrive); 15.2 cfs (depart); 6/13, 15.3 cfs (arrive), 6.8 cfs
(depart); 6/20, 6.8 cfs; 6/24, 6.9 cfs; 6/25, 6.7 cfs; 6/30, 6.8 cfs; 7/11, 7/15, off; 7/28, 17.5 cfs (est); 8/12, 14.0 cfs (est);8/17, 12.4 cfs; 8/18, 10.0 cfs (est); 8/26, 8.0 cfs (est).
1995: 6/2, 25 cfs (est) (arrive), 15 cfs (depart); 6/26, 37.8 cfs; 7/17, 22.7 cfs; 8/10, 20 cfs (est); 8/18, 25.4 cfs; 8/29, 12 cfs(est); 9/12, 10 cfs (est); 9/19, 7 cfs (est).
1996: 5/2, 4.7 cfs; 5/22, 11 cfs (est); 6/13, 25.7 cfs; 7/2, 38 cfs; 7/19, 45.5 cfs; 8/14, 27.3 cfs; 9/26, 17 cfs.1997: 5/15, 42.1 cfs; 6/23, 37.2 cfs; 7/10, 48.4 cfs; 8/7, 22.6 cfs; 8/25, 20 cfs (est).1998: 5/14, 30.5 cfs; 5/26, 36.5 cfs; 7/9, 28.5 cfs; 7/30, 13.7 cfs; 8/19, 26.7 cfs; 9/25, 15.6 cfs.
Meadow Canyon Ditch:1981: 6/22, 14.3 cfs; 7/13, 6.5 cfs; 7/19, 6.5 cfs.1982: 5/19, 10.2 cfs (est); 5/27, 55.7 cfs; 6/11, 65.6 cfs; 6/26, 79.0 cfs; 7/22, 25.7 cfs; 8/13, 5.98 cfs; 9/2, 1.32 cfs.1983: 6/1, 32.8 cfs; 7/19, 33.2 cfs; 8/3, 9.67 cfs; 9/6, 6.27 cfs; 10/6, 2.89 cfs.Supply: 1980, average; 1981, slightly below average; 1982, average; 1983, above average; 1984, above average; 1985,
slightly below average; 1986, average; 1987, average; 1988, below average; 1989, below average; 1990, below average;1991, slightly below average; 1992; below average; 1993, average; 1994, below average; 1995, slightly above average;1996, average; 1997, average; 1998, slightly above average.
Source: State Engineer’s Office, Annual Hydrographers’ Reports.

Green River Basin, Wyoming; Key Structures and DiversionsDescription and Operation Memorandum
Olson-Murdock-Hanna Ditch, Green River
Diversion Memo Division IV District 10
Diversion Description: Information not available at time of report.
Diversion Location:Source: Green RiverSection, Township, Range: 9, 30, 110
Conveyance Description: Open Channel Canal.
Wyoming Water Rights Summary:
Priority Date(M–D–Y)
PermitNumber
PermittedUse Acres Flow
(cfs)CumulativeFlow (cfs) Comments
12-18-1896 1412 Irrigation 767.28 10.96 10.96 POD/MOC change from a portion ofHanna Ditch
07-29-1912 2656E Irrigation 86.00 1.23 12.19 POD/MOC change from a portion ofHanna Ditch
04-14-1960 22258 Irrigation,Stock 183.00 2.71 14.90
Storage Rights: None.
Estimated Canal Losses: Information not available at time of report.
Irrigation Practices: Information not available at time of report.
Crop Types / Consumptive Use: Information not available at time of report.
Return Flows: Return flows are delivered to Green River at Crandell Ditch.1
Other Operational Information: Information not available at time of report.
Sources: 1) Williams, Linda I., “A Model of the Green River Using the Wyoming Integrated River SystemOperation Study (WIRSOS),” M.S. Thesis, University of Wyoming, Department of Civil Engineering,December 1995.
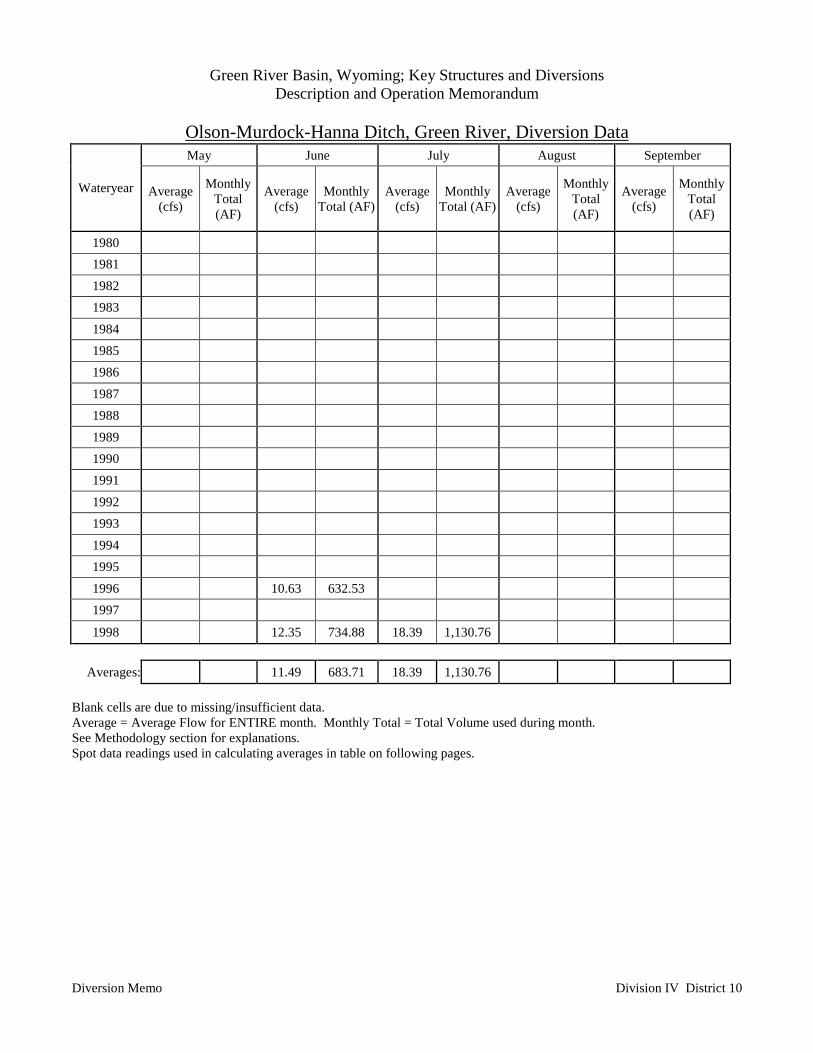
Green River Basin, Wyoming; Key Structures and DiversionsDescription and Operation Memorandum
Olson-Murdock-Hanna Ditch, Green River, Diversion Data
Diversion Memo Division IV District 10
May June July August September
Wateryear Average(cfs)
MonthlyTotal(AF)
Average(cfs)
MonthlyTotal (AF)
Average(cfs)
MonthlyTotal (AF)
Average(cfs)
MonthlyTotal(AF)
Average(cfs)
MonthlyTotal(AF)
1980 1981 1982 1983 1984 1985 1986 1987 1988 1989 1990 1991 1992 1993 1994 1995 1996 10.63 632.53 1997
1998 12.35 734.88 18.39 1,130.76
Averages: 11.49 683.71 18.39 1,130.76
Blank cells are due to missing/insufficient data.Average = Average Flow for ENTIRE month. Monthly Total = Total Volume used during month.See Methodology section for explanations.Spot data readings used in calculating averages in table on following pages.
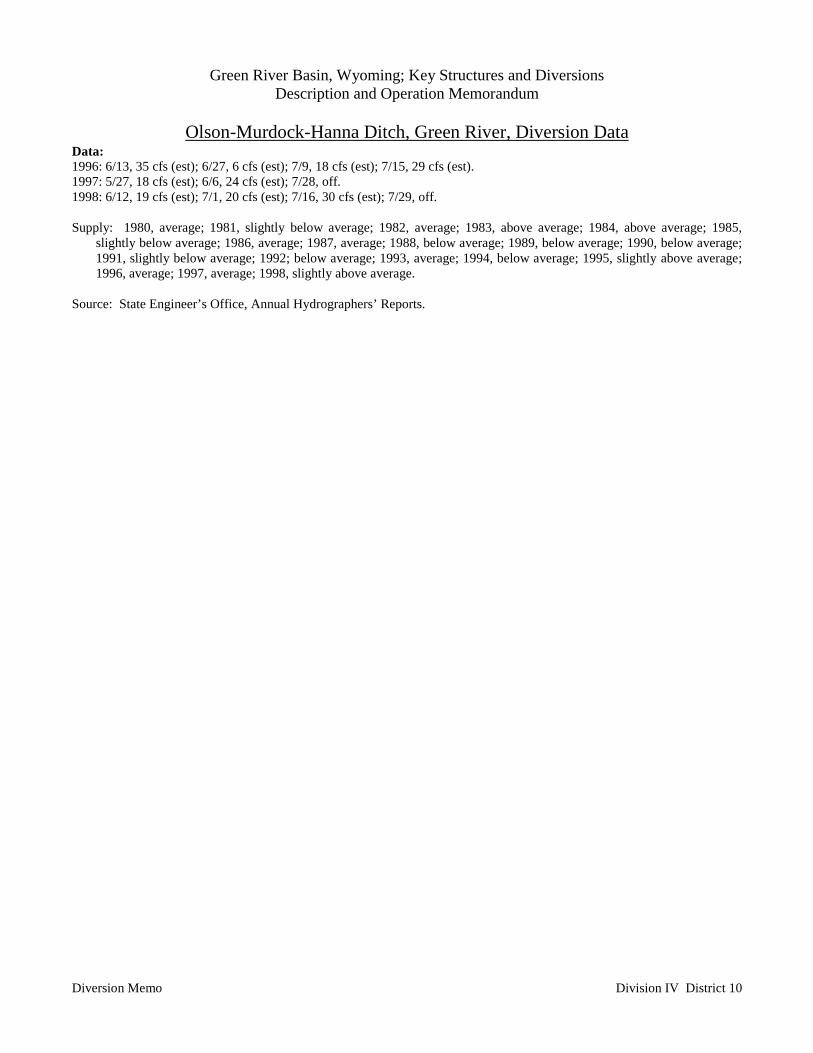
Green River Basin, Wyoming; Key Structures and DiversionsDescription and Operation Memorandum
Olson-Murdock-Hanna Ditch, Green River, Diversion Data
Diversion Memo Division IV District 10
Data:1996: 6/13, 35 cfs (est); 6/27, 6 cfs (est); 7/9, 18 cfs (est); 7/15, 29 cfs (est).1997: 5/27, 18 cfs (est); 6/6, 24 cfs (est); 7/28, off.1998: 6/12, 19 cfs (est); 7/1, 20 cfs (est); 7/16, 30 cfs (est); 7/29, off.
Supply: 1980, average; 1981, slightly below average; 1982, average; 1983, above average; 1984, above average; 1985,slightly below average; 1986, average; 1987, average; 1988, below average; 1989, below average; 1990, below average;1991, slightly below average; 1992; below average; 1993, average; 1994, below average; 1995, slightly above average;1996, average; 1997, average; 1998, slightly above average.
Source: State Engineer’s Office, Annual Hydrographers’ Reports.
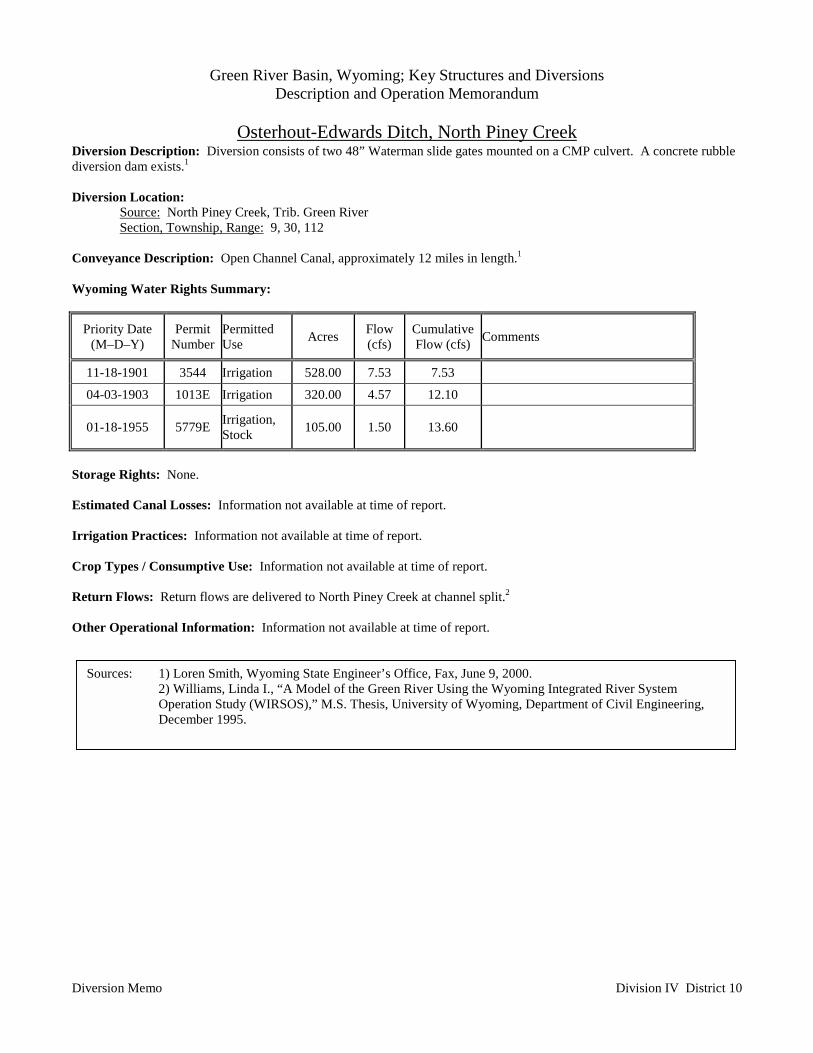
Green River Basin, Wyoming; Key Structures and DiversionsDescription and Operation Memorandum
Osterhout-Edwards Ditch, North Piney Creek
Diversion Memo Division IV District 10
Diversion Description: Diversion consists of two 48” Waterman slide gates mounted on a CMP culvert. A concrete rubblediversion dam exists.1
Diversion Location:Source: North Piney Creek, Trib. Green RiverSection, Township, Range: 9, 30, 112
Conveyance Description: Open Channel Canal, approximately 12 miles in length.1
Wyoming Water Rights Summary:
Priority Date(M–D–Y)
PermitNumber
PermittedUse Acres Flow
(cfs)CumulativeFlow (cfs) Comments
11-18-1901 3544 Irrigation 528.00 7.53 7.53
04-03-1903 1013E Irrigation 320.00 4.57 12.10
01-18-1955 5779E Irrigation,Stock 105.00 1.50 13.60
Storage Rights: None.
Estimated Canal Losses: Information not available at time of report.
Irrigation Practices: Information not available at time of report.
Crop Types / Consumptive Use: Information not available at time of report.
Return Flows: Return flows are delivered to North Piney Creek at channel split.2
Other Operational Information: Information not available at time of report.
Sources: 1) Loren Smith, Wyoming State Engineer’s Office, Fax, June 9, 2000.2) Williams, Linda I., “A Model of the Green River Using the Wyoming Integrated River SystemOperation Study (WIRSOS),” M.S. Thesis, University of Wyoming, Department of Civil Engineering,December 1995.
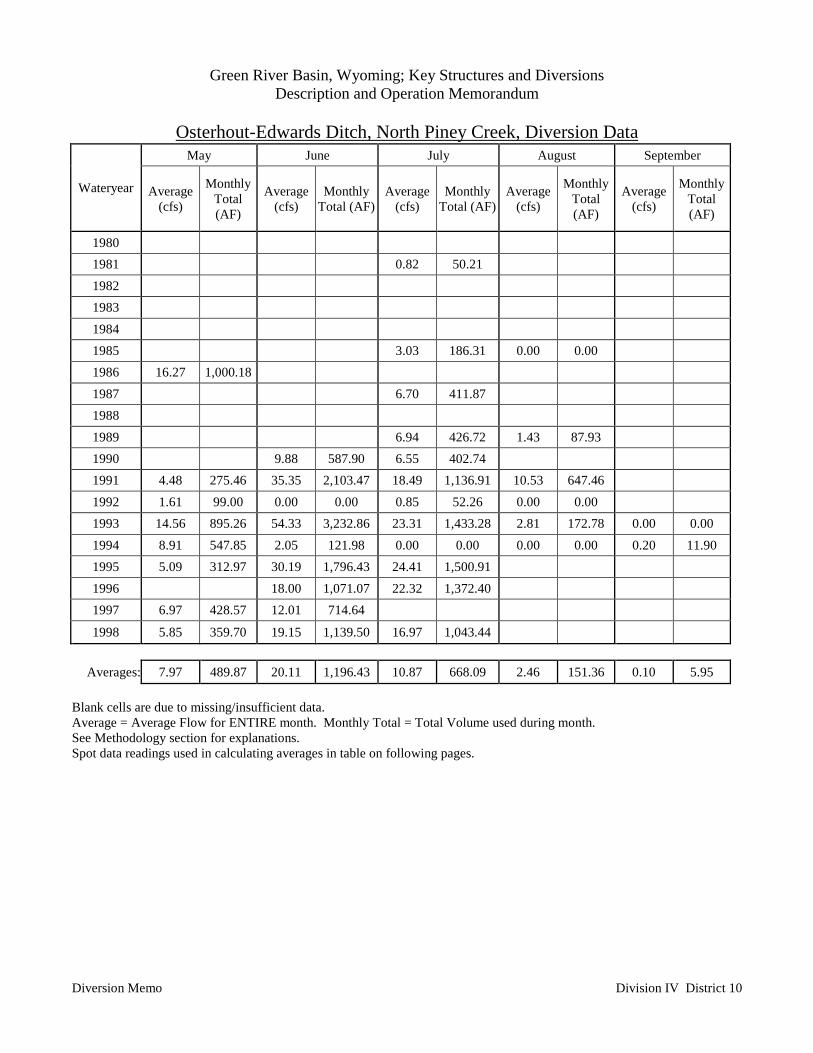
Green River Basin, Wyoming; Key Structures and DiversionsDescription and Operation Memorandum
Osterhout-Edwards Ditch, North Piney Creek, Diversion Data
Diversion Memo Division IV District 10
May June July August September
Wateryear Average(cfs)
MonthlyTotal(AF)
Average(cfs)
MonthlyTotal (AF)
Average(cfs)
MonthlyTotal (AF)
Average(cfs)
MonthlyTotal(AF)
Average(cfs)
MonthlyTotal(AF)
1980 1981 0.82 50.21 1982 1983 1984 1985 3.03 186.31 0.00 0.00 1986 16.27 1,000.18 1987 6.70 411.87 1988 1989 6.94 426.72 1.43 87.93 1990 9.88 587.90 6.55 402.74 1991 4.48 275.46 35.35 2,103.47 18.49 1,136.91 10.53 647.46 1992 1.61 99.00 0.00 0.00 0.85 52.26 0.00 0.00 1993 14.56 895.26 54.33 3,232.86 23.31 1,433.28 2.81 172.78 0.00 0.001994 8.91 547.85 2.05 121.98 0.00 0.00 0.00 0.00 0.20 11.901995 5.09 312.97 30.19 1,796.43 24.41 1,500.91 1996 18.00 1,071.07 22.32 1,372.40 1997 6.97 428.57 12.01 714.64
1998 5.85 359.70 19.15 1,139.50 16.97 1,043.44
Averages: 7.97 489.87 20.11 1,196.43 10.87 668.09 2.46 151.36 0.10 5.95
Blank cells are due to missing/insufficient data.Average = Average Flow for ENTIRE month. Monthly Total = Total Volume used during month.See Methodology section for explanations.Spot data readings used in calculating averages in table on following pages.
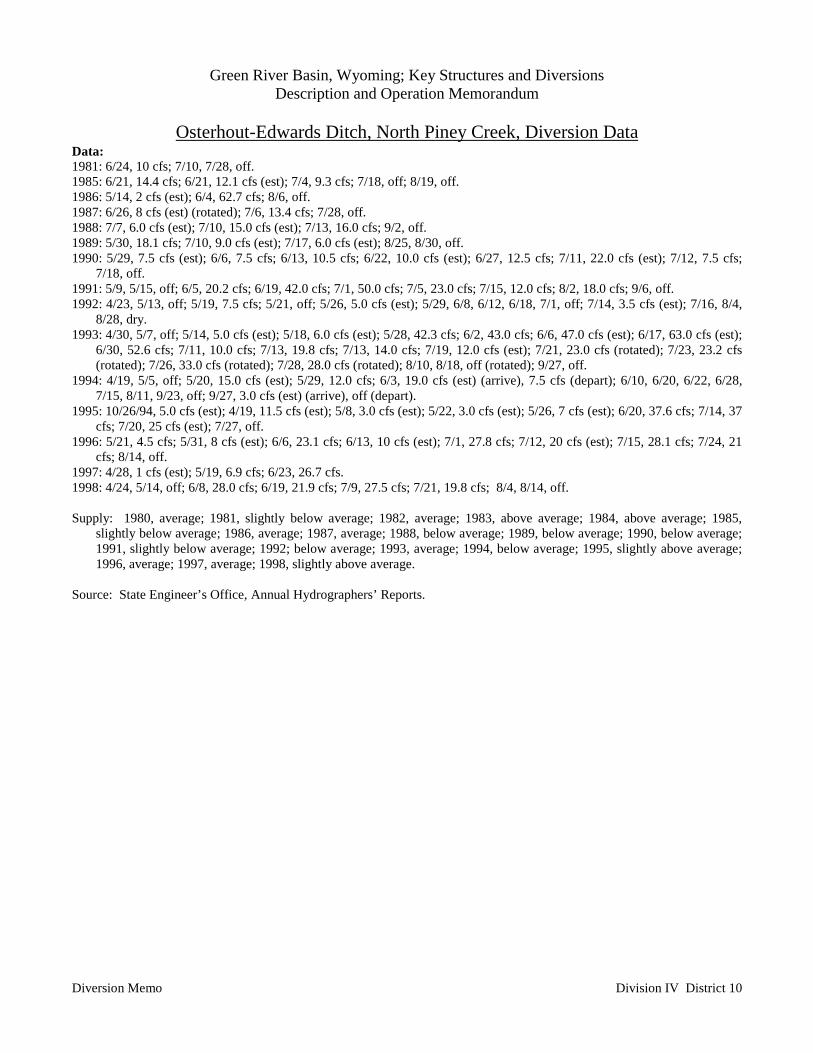
Green River Basin, Wyoming; Key Structures and DiversionsDescription and Operation Memorandum
Osterhout-Edwards Ditch, North Piney Creek, Diversion Data
Diversion Memo Division IV District 10
Data:1981: 6/24, 10 cfs; 7/10, 7/28, off.1985: 6/21, 14.4 cfs; 6/21, 12.1 cfs (est); 7/4, 9.3 cfs; 7/18, off; 8/19, off.1986: 5/14, 2 cfs (est); 6/4, 62.7 cfs; 8/6, off.1987: 6/26, 8 cfs (est) (rotated); 7/6, 13.4 cfs; 7/28, off.1988: 7/7, 6.0 cfs (est); 7/10, 15.0 cfs (est); 7/13, 16.0 cfs; 9/2, off.1989: 5/30, 18.1 cfs; 7/10, 9.0 cfs (est); 7/17, 6.0 cfs (est); 8/25, 8/30, off.1990: 5/29, 7.5 cfs (est); 6/6, 7.5 cfs; 6/13, 10.5 cfs; 6/22, 10.0 cfs (est); 6/27, 12.5 cfs; 7/11, 22.0 cfs (est); 7/12, 7.5 cfs;
7/18, off.1991: 5/9, 5/15, off; 6/5, 20.2 cfs; 6/19, 42.0 cfs; 7/1, 50.0 cfs; 7/5, 23.0 cfs; 7/15, 12.0 cfs; 8/2, 18.0 cfs; 9/6, off.1992: 4/23, 5/13, off; 5/19, 7.5 cfs; 5/21, off; 5/26, 5.0 cfs (est); 5/29, 6/8, 6/12, 6/18, 7/1, off; 7/14, 3.5 cfs (est); 7/16, 8/4,
8/28, dry.1993: 4/30, 5/7, off; 5/14, 5.0 cfs (est); 5/18, 6.0 cfs (est); 5/28, 42.3 cfs; 6/2, 43.0 cfs; 6/6, 47.0 cfs (est); 6/17, 63.0 cfs (est);
6/30, 52.6 cfs; 7/11, 10.0 cfs; 7/13, 19.8 cfs; 7/13, 14.0 cfs; 7/19, 12.0 cfs (est); 7/21, 23.0 cfs (rotated); 7/23, 23.2 cfs(rotated); 7/26, 33.0 cfs (rotated); 7/28, 28.0 cfs (rotated); 8/10, 8/18, off (rotated); 9/27, off.
1994: 4/19, 5/5, off; 5/20, 15.0 cfs (est); 5/29, 12.0 cfs; 6/3, 19.0 cfs (est) (arrive), 7.5 cfs (depart); 6/10, 6/20, 6/22, 6/28,7/15, 8/11, 9/23, off; 9/27, 3.0 cfs (est) (arrive), off (depart).
1995: 10/26/94, 5.0 cfs (est); 4/19, 11.5 cfs (est); 5/8, 3.0 cfs (est); 5/22, 3.0 cfs (est); 5/26, 7 cfs (est); 6/20, 37.6 cfs; 7/14, 37cfs; 7/20, 25 cfs (est); 7/27, off.
1996: 5/21, 4.5 cfs; 5/31, 8 cfs (est); 6/6, 23.1 cfs; 6/13, 10 cfs (est); 7/1, 27.8 cfs; 7/12, 20 cfs (est); 7/15, 28.1 cfs; 7/24, 21cfs; 8/14, off.
1997: 4/28, 1 cfs (est); 5/19, 6.9 cfs; 6/23, 26.7 cfs.1998: 4/24, 5/14, off; 6/8, 28.0 cfs; 6/19, 21.9 cfs; 7/9, 27.5 cfs; 7/21, 19.8 cfs; 8/4, 8/14, off.
Supply: 1980, average; 1981, slightly below average; 1982, average; 1983, above average; 1984, above average; 1985,slightly below average; 1986, average; 1987, average; 1988, below average; 1989, below average; 1990, below average;1991, slightly below average; 1992; below average; 1993, average; 1994, below average; 1995, slightly above average;1996, average; 1997, average; 1998, slightly above average.
Source: State Engineer’s Office, Annual Hydrographers’ Reports.
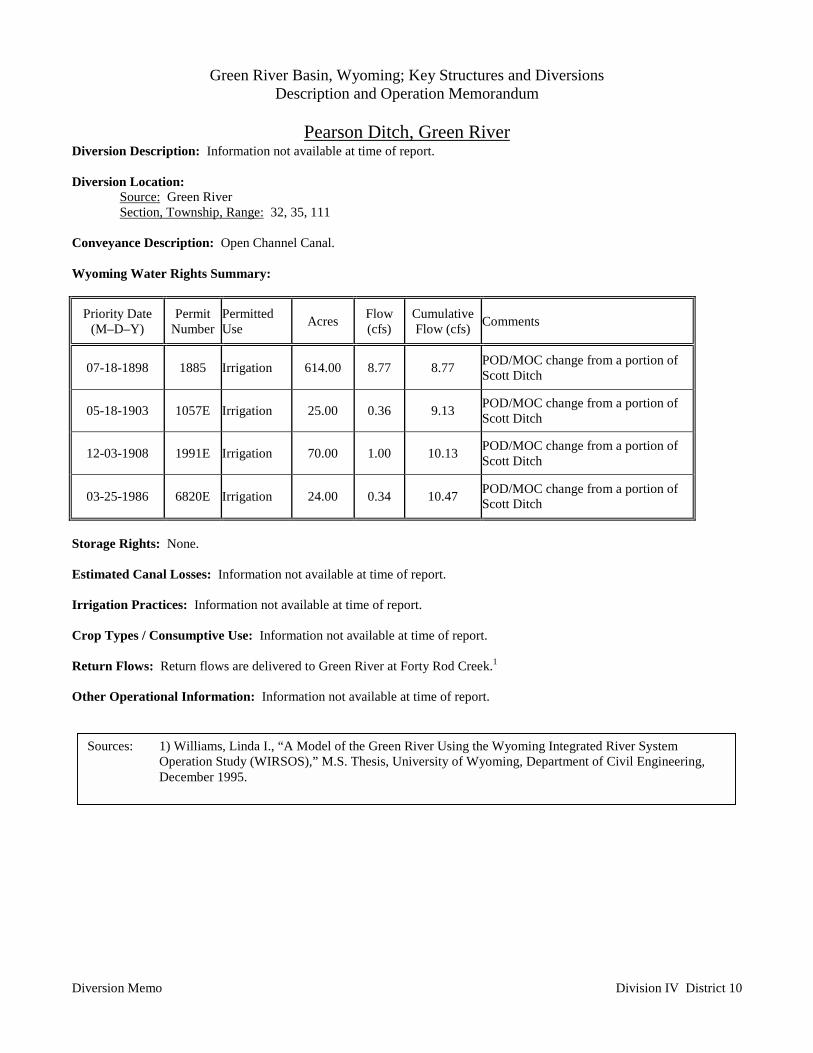
Green River Basin, Wyoming; Key Structures and DiversionsDescription and Operation Memorandum
Pearson Ditch, Green River
Diversion Memo Division IV District 10
Diversion Description: Information not available at time of report.
Diversion Location:Source: Green RiverSection, Township, Range: 32, 35, 111
Conveyance Description: Open Channel Canal.
Wyoming Water Rights Summary:
Priority Date(M–D–Y)
PermitNumber
PermittedUse Acres Flow
(cfs)CumulativeFlow (cfs) Comments
07-18-1898 1885 Irrigation 614.00 8.77 8.77 POD/MOC change from a portion ofScott Ditch
05-18-1903 1057E Irrigation 25.00 0.36 9.13 POD/MOC change from a portion ofScott Ditch
12-03-1908 1991E Irrigation 70.00 1.00 10.13 POD/MOC change from a portion ofScott Ditch
03-25-1986 6820E Irrigation 24.00 0.34 10.47 POD/MOC change from a portion ofScott Ditch
Storage Rights: None.
Estimated Canal Losses: Information not available at time of report.
Irrigation Practices: Information not available at time of report.
Crop Types / Consumptive Use: Information not available at time of report.
Return Flows: Return flows are delivered to Green River at Forty Rod Creek.1
Other Operational Information: Information not available at time of report.
Sources: 1) Williams, Linda I., “A Model of the Green River Using the Wyoming Integrated River SystemOperation Study (WIRSOS),” M.S. Thesis, University of Wyoming, Department of Civil Engineering,December 1995.
Green River Basin, Wyoming; Key Structures and DiversionsDescription and Operation Memorandum
Pearson Ditch, Green River, Diversion Data
Diversion Memo Division IV District 10
No Diversion Data Available.
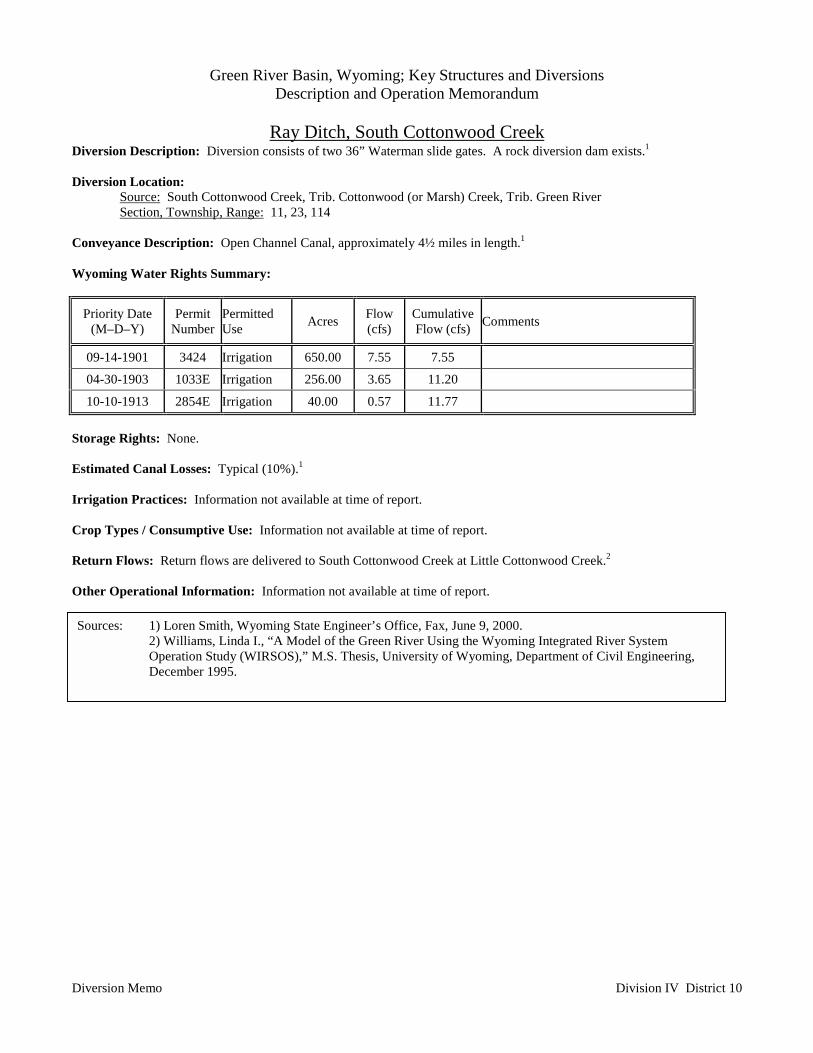
Green River Basin, Wyoming; Key Structures and DiversionsDescription and Operation Memorandum
Ray Ditch, South Cottonwood Creek
Diversion Memo Division IV District 10
Diversion Description: Diversion consists of two 36” Waterman slide gates. A rock diversion dam exists.1
Diversion Location:Source: South Cottonwood Creek, Trib. Cottonwood (or Marsh) Creek, Trib. Green RiverSection, Township, Range: 11, 23, 114
Conveyance Description: Open Channel Canal, approximately 4½ miles in length.1
Wyoming Water Rights Summary:
Priority Date(M–D–Y)
PermitNumber
PermittedUse Acres Flow
(cfs)CumulativeFlow (cfs) Comments
09-14-1901 3424 Irrigation 650.00 7.55 7.55
04-30-1903 1033E Irrigation 256.00 3.65 11.20
10-10-1913 2854E Irrigation 40.00 0.57 11.77
Storage Rights: None.
Estimated Canal Losses: Typical (10%).1
Irrigation Practices: Information not available at time of report.
Crop Types / Consumptive Use: Information not available at time of report.
Return Flows: Return flows are delivered to South Cottonwood Creek at Little Cottonwood Creek.2
Other Operational Information: Information not available at time of report.
Sources: 1) Loren Smith, Wyoming State Engineer’s Office, Fax, June 9, 2000.2) Williams, Linda I., “A Model of the Green River Using the Wyoming Integrated River SystemOperation Study (WIRSOS),” M.S. Thesis, University of Wyoming, Department of Civil Engineering,December 1995.

Green River Basin, Wyoming; Key Structures and DiversionsDescription and Operation Memorandum
Ray Ditch, South Cottonwood Creek, Diversion Data
Diversion Memo Division IV District 10
Data:1986: 5/15, 8 cfs (est); 5/21, 6 cfs (est); 6/13, 15 cfs (est); 7/3, 3 cfs (est); 7/29, 8/11, off.1987: 4/29, 1 cfs (est); 7/7, 0.5 cfs (est).1990: 6/15, 8.0 cfs (est); 7/17, 8.0 cfs (est); 8/29, off.1991: 5/28, 10.0 cfs (est); 6/16, 9.5 cfs (est); 7/22, 8/9, 9/4, off.1992: 6/22, 7/1, off; 7/8, 3.0 cfs (est); 7/24, off.1993: 6/16, 22.0 cfs (est).1994: 7/6, 7.0 cfs (est); 8/25, 1.5 cfs (est).
Supply: 1980, average; 1981, slightly below average; 1982, average; 1983, above average; 1984, above average; 1985,slightly below average; 1986, average; 1987, average; 1988, below average; 1989, below average; 1990, below average;1991, slightly below average; 1992; below average; 1993, average; 1994, below average; 1995, slightly above average;1996, average; 1997, average; 1998, slightly above average.
Source: State Engineer’s Office, Annual Hydrographers’ Reports.
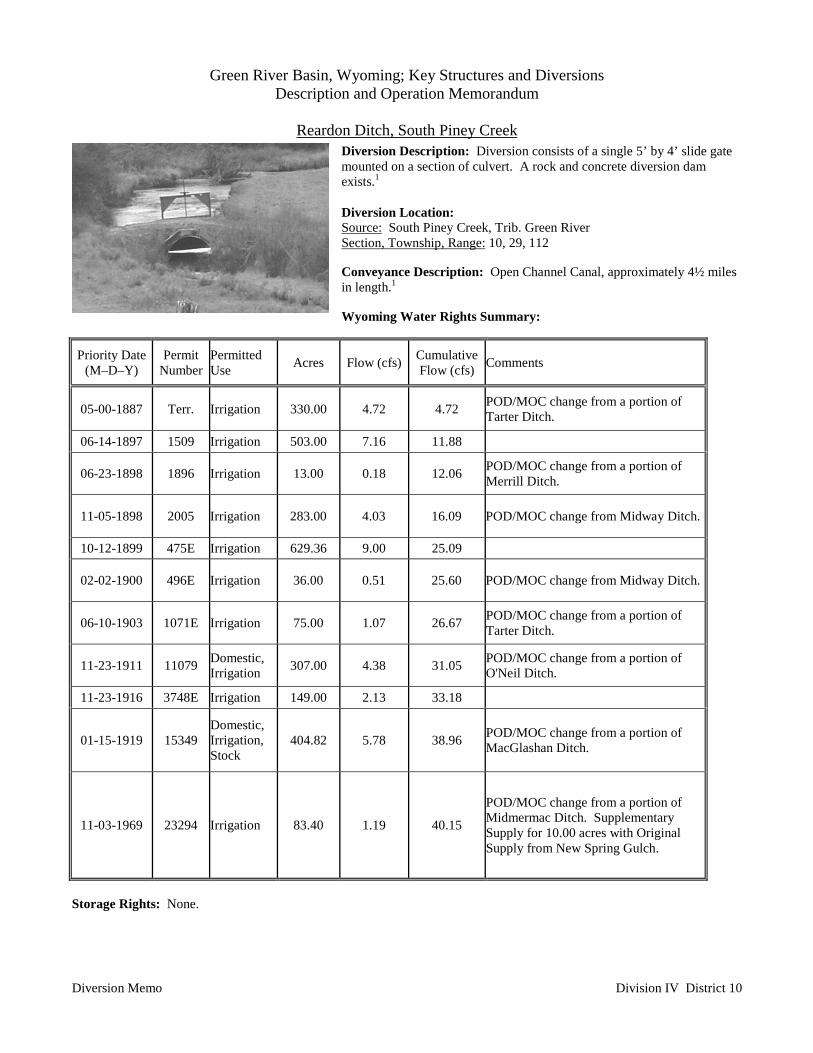
Green River Basin, Wyoming; Key Structures and DiversionsDescription and Operation Memorandum
Reardon Ditch, South Piney Creek
Diversion Memo Division IV District 10
Diversion Description: Diversion consists of a single 5’ by 4’ slide gatemounted on a section of culvert. A rock and concrete diversion damexists.1
Diversion Location:Source: South Piney Creek, Trib. Green RiverSection, Township, Range: 10, 29, 112
Conveyance Description: Open Channel Canal, approximately 4½ milesin length.1
Wyoming Water Rights Summary:
Priority Date(M–D–Y)
PermitNumber
PermittedUse Acres Flow (cfs) Cumulative
Flow (cfs) Comments
05-00-1887 Terr. Irrigation 330.00 4.72 4.72 POD/MOC change from a portion ofTarter Ditch.
06-14-1897 1509 Irrigation 503.00 7.16 11.88
06-23-1898 1896 Irrigation 13.00 0.18 12.06 POD/MOC change from a portion ofMerrill Ditch.
11-05-1898 2005 Irrigation 283.00 4.03 16.09 POD/MOC change from Midway Ditch.
10-12-1899 475E Irrigation 629.36 9.00 25.09
02-02-1900 496E Irrigation 36.00 0.51 25.60 POD/MOC change from Midway Ditch.
06-10-1903 1071E Irrigation 75.00 1.07 26.67 POD/MOC change from a portion ofTarter Ditch.
11-23-1911 11079 Domestic,Irrigation 307.00 4.38 31.05 POD/MOC change from a portion of
O'Neil Ditch.
11-23-1916 3748E Irrigation 149.00 2.13 33.18
01-15-1919 15349Domestic,Irrigation,Stock
404.82 5.78 38.96 POD/MOC change from a portion ofMacGlashan Ditch.
11-03-1969 23294 Irrigation 83.40 1.19 40.15
POD/MOC change from a portion ofMidmermac Ditch. SupplementarySupply for 10.00 acres with OriginalSupply from New Spring Gulch.
Storage Rights: None.

Green River Basin, Wyoming; Key Structures and DiversionsDescription and Operation Memorandum
Reardon Ditch, South Piney Creek
Diversion Memo Division IV District 10
Estimated Canal Losses: Typical losses (10%) are experienced.1
Irrigation Practices: Lands are flood irrigated.1
Crop Types / Consumptive Use: Approximately 140 acres are alfalfa; remaining lands are native grass hay and pasture.1
Return Flows: Return flows are delivered to Green River at Tarter Gulch.2
Other Operational Information: The canal is typically turned on the first of May and off in mid-July.1
Sources: 1) Loren Smith, Wyoming State Engineer’s Office, Interview, May 5, 2000.2) Williams, Linda I., “A Model of the Green River Using the Wyoming Integrated River SystemOperation Study (WIRSOS),” M.S. Thesis, University of Wyoming, Department of Civil Engineering,December 1995.

Green River Basin, Wyoming; Key Structures and DiversionsDescription and Operation Memorandum
Reardon Ditch, South Piney Creek, Diversion Data
Diversion Memo Division IV District 10
May June July August September
Wateryear Average(cfs)
MonthlyTotal (AF)
Average(cfs)
MonthlyTotal (AF)
Average(cfs)
MonthlyTotal (AF)
Average(cfs)
MonthlyTotal(AF)
Average(cfs)
MonthlyTotal (AF)
1980 1981 9.95 611.80 13.67 813.42 8.37 514.65 10.99 675.75 0.00 0.001982 22.52 1,384.70 39.94 2,376.60 28.28 1,738.87 1983 22.38 1,376.09 40.49 2,409.32 24.88 1,529.81 7.49 460.54 0.00 0.001984 28.36 1,743.79 43.21 2,571.17 27.13 1,668.16 2.87 176.47 0.00 0.001985 19.70 1,211.31 29.71 1,767.87 20.16 1,239.59 8.40 516.50 4.60 273.721986 23.72 1,458.49 75.07 4,466.98 46.26 2,844.42 1.48 91.00 0.00 0.001987 34.27 2,107.18 20.57 1,224.00 20.97 1,289.40 6.11 375.69 2.50 148.761988 25.22 1,550.72 25.50 1,517.36 10.48 644.39 4.98 306.21 3.46 205.881989 24.17 1,486.16 47.08 2,801.45 25.77 1,584.54 13.43 825.78 1.30 77.361990 1991 25.57 1,572.24 39.88 2,373.02 23.69 1,456.64 0.47 28.90 0.00 0.001992 13.57 834.39 7.15 425.45 4.24 260.71 1.84 113.14 0.89 52.961993 25.33 1,557.48 41.01 2,440.26 29.56 1,817.57 9.64 592.74 18.54 1,103.211994 22.25 1,368.10 13.67 813.42 4.62 284.07 3.35 205.98 2.53 150.551995 22.68 1,394.54 54.32 3,232.26 21.02 1,292.47 12.13 745.84 3.34 198.741996 30.21 1,857.54 42.02 2,500.36 15.69 964.74 16.16 993.64 8.95 532.561997 19.09 1,173.80 40.87 2,431.93 21.43 1,317.68 6.73 413.81 7.11 423.07
1998 36.32 2,233.23 30.00 1,785.12 28.73 1,766.54 2.47 151.87 0.06 3.57
Averages: 23.84 1,465.97 35.54 2,114.71 21.25 1,306.72 6.78 417.12 3.33 198.15Blank cells are due to missing/insufficient data.Average = Average Flow for ENTIRE month. Monthly Total = Total Volume used during month.See Methodology section for explanations.Spot data readings used in calculating averages in table on following pages.
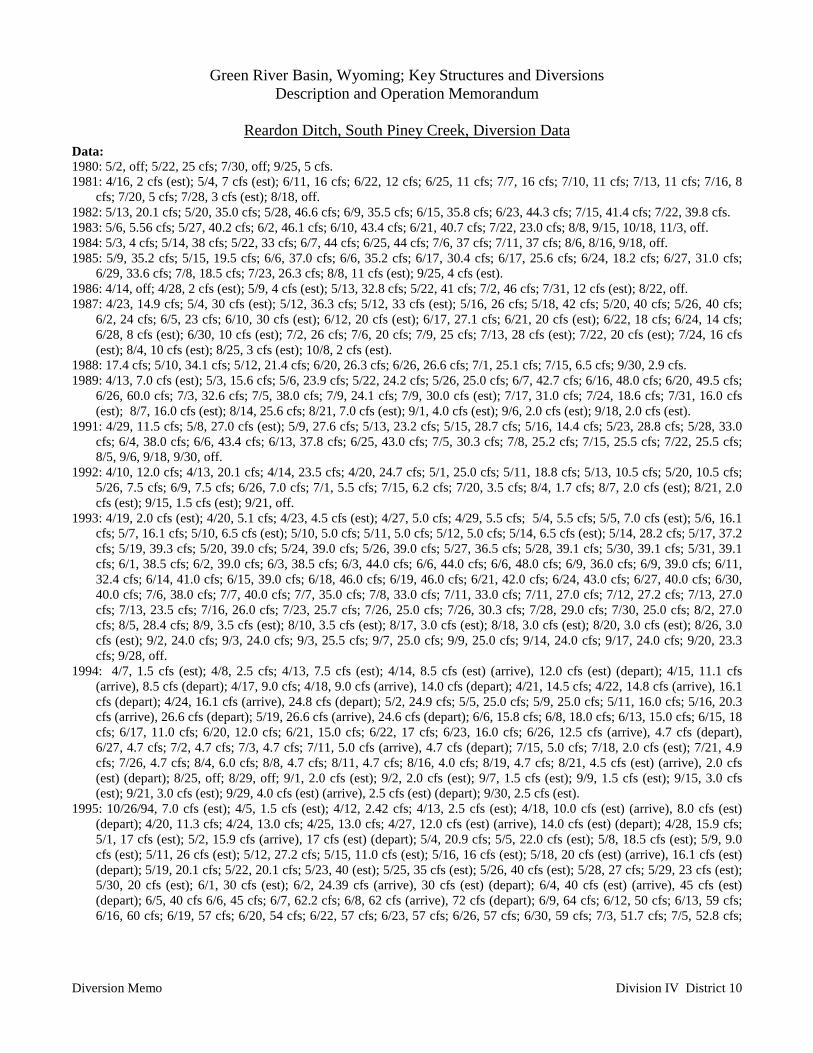
Green River Basin, Wyoming; Key Structures and DiversionsDescription and Operation Memorandum
Reardon Ditch, South Piney Creek, Diversion Data
Diversion Memo Division IV District 10
Data:1980: 5/2, off; 5/22, 25 cfs; 7/30, off; 9/25, 5 cfs.1981: 4/16, 2 cfs (est); 5/4, 7 cfs (est); 6/11, 16 cfs; 6/22, 12 cfs; 6/25, 11 cfs; 7/7, 16 cfs; 7/10, 11 cfs; 7/13, 11 cfs; 7/16, 8
cfs; 7/20, 5 cfs; 7/28, 3 cfs (est); 8/18, off.1982: 5/13, 20.1 cfs; 5/20, 35.0 cfs; 5/28, 46.6 cfs; 6/9, 35.5 cfs; 6/15, 35.8 cfs; 6/23, 44.3 cfs; 7/15, 41.4 cfs; 7/22, 39.8 cfs.1983: 5/6, 5.56 cfs; 5/27, 40.2 cfs; 6/2, 46.1 cfs; 6/10, 43.4 cfs; 6/21, 40.7 cfs; 7/22, 23.0 cfs; 8/8, 9/15, 10/18, 11/3, off.1984: 5/3, 4 cfs; 5/14, 38 cfs; 5/22, 33 cfs; 6/7, 44 cfs; 6/25, 44 cfs; 7/6, 37 cfs; 7/11, 37 cfs; 8/6, 8/16, 9/18, off.1985: 5/9, 35.2 cfs; 5/15, 19.5 cfs; 6/6, 37.0 cfs; 6/6, 35.2 cfs; 6/17, 30.4 cfs; 6/17, 25.6 cfs; 6/24, 18.2 cfs; 6/27, 31.0 cfs;
6/29, 33.6 cfs; 7/8, 18.5 cfs; 7/23, 26.3 cfs; 8/8, 11 cfs (est); 9/25, 4 cfs (est).1986: 4/14, off; 4/28, 2 cfs (est); 5/9, 4 cfs (est); 5/13, 32.8 cfs; 5/22, 41 cfs; 7/2, 46 cfs; 7/31, 12 cfs (est); 8/22, off.1987: 4/23, 14.9 cfs; 5/4, 30 cfs (est); 5/12, 36.3 cfs; 5/12, 33 cfs (est); 5/16, 26 cfs; 5/18, 42 cfs; 5/20, 40 cfs; 5/26, 40 cfs;
6/2, 24 cfs; 6/5, 23 cfs; 6/10, 30 cfs (est); 6/12, 20 cfs (est); 6/17, 27.1 cfs; 6/21, 20 cfs (est); 6/22, 18 cfs; 6/24, 14 cfs;6/28, 8 cfs (est); 6/30, 10 cfs (est); 7/2, 26 cfs; 7/6, 20 cfs; 7/9, 25 cfs; 7/13, 28 cfs (est); 7/22, 20 cfs (est); 7/24, 16 cfs(est); 8/4, 10 cfs (est); 8/25, 3 cfs (est); 10/8, 2 cfs (est).
1988: 17.4 cfs; 5/10, 34.1 cfs; 5/12, 21.4 cfs; 6/20, 26.3 cfs; 6/26, 26.6 cfs; 7/1, 25.1 cfs; 7/15, 6.5 cfs; 9/30, 2.9 cfs.1989: 4/13, 7.0 cfs (est); 5/3, 15.6 cfs; 5/6, 23.9 cfs; 5/22, 24.2 cfs; 5/26, 25.0 cfs; 6/7, 42.7 cfs; 6/16, 48.0 cfs; 6/20, 49.5 cfs;
6/26, 60.0 cfs; 7/3, 32.6 cfs; 7/5, 38.0 cfs; 7/9, 24.1 cfs; 7/9, 30.0 cfs (est); 7/17, 31.0 cfs; 7/24, 18.6 cfs; 7/31, 16.0 cfs(est); 8/7, 16.0 cfs (est); 8/14, 25.6 cfs; 8/21, 7.0 cfs (est); 9/1, 4.0 cfs (est); 9/6, 2.0 cfs (est); 9/18, 2.0 cfs (est).
1991: 4/29, 11.5 cfs; 5/8, 27.0 cfs (est); 5/9, 27.6 cfs; 5/13, 23.2 cfs; 5/15, 28.7 cfs; 5/16, 14.4 cfs; 5/23, 28.8 cfs; 5/28, 33.0cfs; 6/4, 38.0 cfs; 6/6, 43.4 cfs; 6/13, 37.8 cfs; 6/25, 43.0 cfs; 7/5, 30.3 cfs; 7/8, 25.2 cfs; 7/15, 25.5 cfs; 7/22, 25.5 cfs;8/5, 9/6, 9/18, 9/30, off.
1992: 4/10, 12.0 cfs; 4/13, 20.1 cfs; 4/14, 23.5 cfs; 4/20, 24.7 cfs; 5/1, 25.0 cfs; 5/11, 18.8 cfs; 5/13, 10.5 cfs; 5/20, 10.5 cfs;5/26, 7.5 cfs; 6/9, 7.5 cfs; 6/26, 7.0 cfs; 7/1, 5.5 cfs; 7/15, 6.2 cfs; 7/20, 3.5 cfs; 8/4, 1.7 cfs; 8/7, 2.0 cfs (est); 8/21, 2.0cfs (est); 9/15, 1.5 cfs (est); 9/21, off.
1993: 4/19, 2.0 cfs (est); 4/20, 5.1 cfs; 4/23, 4.5 cfs (est); 4/27, 5.0 cfs; 4/29, 5.5 cfs; 5/4, 5.5 cfs; 5/5, 7.0 cfs (est); 5/6, 16.1cfs; 5/7, 16.1 cfs; 5/10, 6.5 cfs (est); 5/10, 5.0 cfs; 5/11, 5.0 cfs; 5/12, 5.0 cfs; 5/14, 6.5 cfs (est); 5/14, 28.2 cfs; 5/17, 37.2cfs; 5/19, 39.3 cfs; 5/20, 39.0 cfs; 5/24, 39.0 cfs; 5/26, 39.0 cfs; 5/27, 36.5 cfs; 5/28, 39.1 cfs; 5/30, 39.1 cfs; 5/31, 39.1cfs; 6/1, 38.5 cfs; 6/2, 39.0 cfs; 6/3, 38.5 cfs; 6/3, 44.0 cfs; 6/6, 44.0 cfs; 6/6, 48.0 cfs; 6/9, 36.0 cfs; 6/9, 39.0 cfs; 6/11,32.4 cfs; 6/14, 41.0 cfs; 6/15, 39.0 cfs; 6/18, 46.0 cfs; 6/19, 46.0 cfs; 6/21, 42.0 cfs; 6/24, 43.0 cfs; 6/27, 40.0 cfs; 6/30,40.0 cfs; 7/6, 38.0 cfs; 7/7, 40.0 cfs; 7/7, 35.0 cfs; 7/8, 33.0 cfs; 7/11, 33.0 cfs; 7/11, 27.0 cfs; 7/12, 27.2 cfs; 7/13, 27.0cfs; 7/13, 23.5 cfs; 7/16, 26.0 cfs; 7/23, 25.7 cfs; 7/26, 25.0 cfs; 7/26, 30.3 cfs; 7/28, 29.0 cfs; 7/30, 25.0 cfs; 8/2, 27.0cfs; 8/5, 28.4 cfs; 8/9, 3.5 cfs (est); 8/10, 3.5 cfs (est); 8/17, 3.0 cfs (est); 8/18, 3.0 cfs (est); 8/20, 3.0 cfs (est); 8/26, 3.0cfs (est); 9/2, 24.0 cfs; 9/3, 24.0 cfs; 9/3, 25.5 cfs; 9/7, 25.0 cfs; 9/9, 25.0 cfs; 9/14, 24.0 cfs; 9/17, 24.0 cfs; 9/20, 23.3cfs; 9/28, off.
1994: 4/7, 1.5 cfs (est); 4/8, 2.5 cfs; 4/13, 7.5 cfs (est); 4/14, 8.5 cfs (est) (arrive), 12.0 cfs (est) (depart); 4/15, 11.1 cfs(arrive), 8.5 cfs (depart); 4/17, 9.0 cfs; 4/18, 9.0 cfs (arrive), 14.0 cfs (depart); 4/21, 14.5 cfs; 4/22, 14.8 cfs (arrive), 16.1cfs (depart); 4/24, 16.1 cfs (arrive), 24.8 cfs (depart); 5/2, 24.9 cfs; 5/5, 25.0 cfs; 5/9, 25.0 cfs; 5/11, 16.0 cfs; 5/16, 20.3cfs (arrive), 26.6 cfs (depart); 5/19, 26.6 cfs (arrive), 24.6 cfs (depart); 6/6, 15.8 cfs; 6/8, 18.0 cfs; 6/13, 15.0 cfs; 6/15, 18cfs; 6/17, 11.0 cfs; 6/20, 12.0 cfs; 6/21, 15.0 cfs; 6/22, 17 cfs; 6/23, 16.0 cfs; 6/26, 12.5 cfs (arrive), 4.7 cfs (depart),6/27, 4.7 cfs; 7/2, 4.7 cfs; 7/3, 4.7 cfs; 7/11, 5.0 cfs (arrive), 4.7 cfs (depart); 7/15, 5.0 cfs; 7/18, 2.0 cfs (est); 7/21, 4.9cfs; 7/26, 4.7 cfs; 8/4, 6.0 cfs; 8/8, 4.7 cfs; 8/11, 4.7 cfs; 8/16, 4.0 cfs; 8/19, 4.7 cfs; 8/21, 4.5 cfs (est) (arrive), 2.0 cfs(est) (depart); 8/25, off; 8/29, off; 9/1, 2.0 cfs (est); 9/2, 2.0 cfs (est); 9/7, 1.5 cfs (est); 9/9, 1.5 cfs (est); 9/15, 3.0 cfs(est); 9/21, 3.0 cfs (est); 9/29, 4.0 cfs (est) (arrive), 2.5 cfs (est) (depart); 9/30, 2.5 cfs (est).
1995: 10/26/94, 7.0 cfs (est); 4/5, 1.5 cfs (est); 4/12, 2.42 cfs; 4/13, 2.5 cfs (est); 4/18, 10.0 cfs (est) (arrive), 8.0 cfs (est)(depart); 4/20, 11.3 cfs; 4/24, 13.0 cfs; 4/25, 13.0 cfs; 4/27, 12.0 cfs (est) (arrive), 14.0 cfs (est) (depart); 4/28, 15.9 cfs;5/1, 17 cfs (est); 5/2, 15.9 cfs (arrive), 17 cfs (est) (depart); 5/4, 20.9 cfs; 5/5, 22.0 cfs (est); 5/8, 18.5 cfs (est); 5/9, 9.0cfs (est); 5/11, 26 cfs (est); 5/12, 27.2 cfs; 5/15, 11.0 cfs (est); 5/16, 16 cfs (est); 5/18, 20 cfs (est) (arrive), 16.1 cfs (est)(depart); 5/19, 20.1 cfs; 5/22, 20.1 cfs; 5/23, 40 (est); 5/25, 35 cfs (est); 5/26, 40 cfs (est); 5/28, 27 cfs; 5/29, 23 cfs (est);5/30, 20 cfs (est); 6/1, 30 cfs (est); 6/2, 24.39 cfs (arrive), 30 cfs (est) (depart); 6/4, 40 cfs (est) (arrive), 45 cfs (est)(depart); 6/5, 40 cfs 6/6, 45 cfs; 6/7, 62.2 cfs; 6/8, 62 cfs (arrive), 72 cfs (depart); 6/9, 64 cfs; 6/12, 50 cfs; 6/13, 59 cfs;6/16, 60 cfs; 6/19, 57 cfs; 6/20, 54 cfs; 6/22, 57 cfs; 6/23, 57 cfs; 6/26, 57 cfs; 6/30, 59 cfs; 7/3, 51.7 cfs; 7/5, 52.8 cfs;
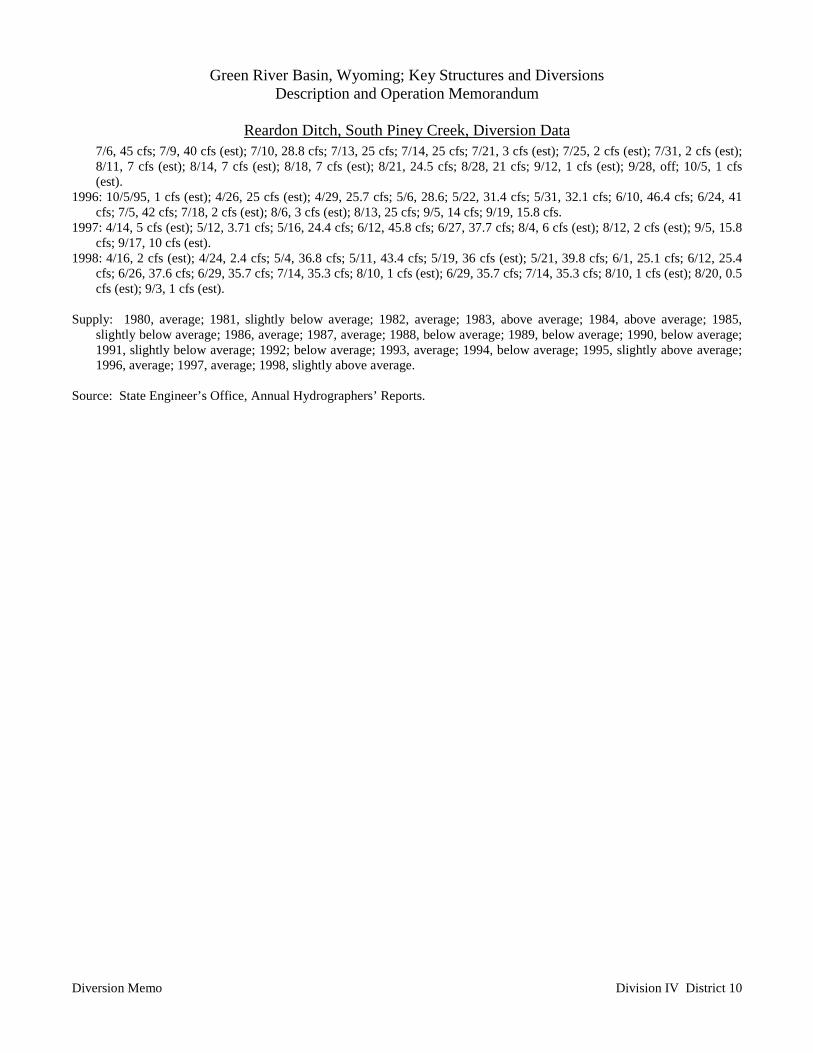
Green River Basin, Wyoming; Key Structures and DiversionsDescription and Operation Memorandum
Reardon Ditch, South Piney Creek, Diversion Data
Diversion Memo Division IV District 10
7/6, 45 cfs; 7/9, 40 cfs (est); 7/10, 28.8 cfs; 7/13, 25 cfs; 7/14, 25 cfs; 7/21, 3 cfs (est); 7/25, 2 cfs (est); 7/31, 2 cfs (est);8/11, 7 cfs (est); 8/14, 7 cfs (est); 8/18, 7 cfs (est); 8/21, 24.5 cfs; 8/28, 21 cfs; 9/12, 1 cfs (est); 9/28, off; 10/5, 1 cfs(est).
1996: 10/5/95, 1 cfs (est); 4/26, 25 cfs (est); 4/29, 25.7 cfs; 5/6, 28.6; 5/22, 31.4 cfs; 5/31, 32.1 cfs; 6/10, 46.4 cfs; 6/24, 41cfs; 7/5, 42 cfs; 7/18, 2 cfs (est); 8/6, 3 cfs (est); 8/13, 25 cfs; 9/5, 14 cfs; 9/19, 15.8 cfs.
1997: 4/14, 5 cfs (est); 5/12, 3.71 cfs; 5/16, 24.4 cfs; 6/12, 45.8 cfs; 6/27, 37.7 cfs; 8/4, 6 cfs (est); 8/12, 2 cfs (est); 9/5, 15.8cfs; 9/17, 10 cfs (est).
1998: 4/16, 2 cfs (est); 4/24, 2.4 cfs; 5/4, 36.8 cfs; 5/11, 43.4 cfs; 5/19, 36 cfs (est); 5/21, 39.8 cfs; 6/1, 25.1 cfs; 6/12, 25.4cfs; 6/26, 37.6 cfs; 6/29, 35.7 cfs; 7/14, 35.3 cfs; 8/10, 1 cfs (est); 6/29, 35.7 cfs; 7/14, 35.3 cfs; 8/10, 1 cfs (est); 8/20, 0.5cfs (est); 9/3, 1 cfs (est).
Supply: 1980, average; 1981, slightly below average; 1982, average; 1983, above average; 1984, above average; 1985,slightly below average; 1986, average; 1987, average; 1988, below average; 1989, below average; 1990, below average;1991, slightly below average; 1992; below average; 1993, average; 1994, below average; 1995, slightly above average;1996, average; 1997, average; 1998, slightly above average.
Source: State Engineer’s Office, Annual Hydrographers’ Reports.
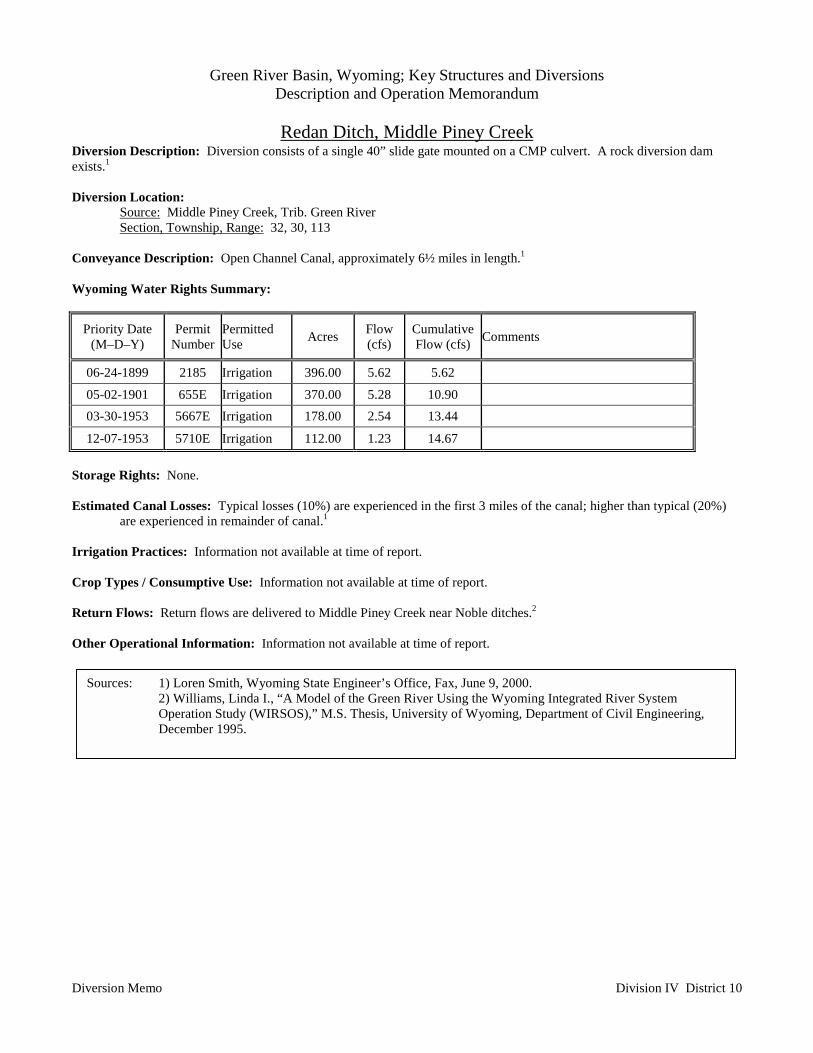
Green River Basin, Wyoming; Key Structures and DiversionsDescription and Operation Memorandum
Redan Ditch, Middle Piney Creek
Diversion Memo Division IV District 10
Diversion Description: Diversion consists of a single 40” slide gate mounted on a CMP culvert. A rock diversion damexists.1
Diversion Location:Source: Middle Piney Creek, Trib. Green RiverSection, Township, Range: 32, 30, 113
Conveyance Description: Open Channel Canal, approximately 6½ miles in length.1
Wyoming Water Rights Summary:
Priority Date(M–D–Y)
PermitNumber
PermittedUse Acres Flow
(cfs)CumulativeFlow (cfs) Comments
06-24-1899 2185 Irrigation 396.00 5.62 5.62
05-02-1901 655E Irrigation 370.00 5.28 10.90 03-30-1953 5667E Irrigation 178.00 2.54 13.44
12-07-1953 5710E Irrigation 112.00 1.23 14.67
Storage Rights: None.
Estimated Canal Losses: Typical losses (10%) are experienced in the first 3 miles of the canal; higher than typical (20%)are experienced in remainder of canal.1
Irrigation Practices: Information not available at time of report.
Crop Types / Consumptive Use: Information not available at time of report.
Return Flows: Return flows are delivered to Middle Piney Creek near Noble ditches.2
Other Operational Information: Information not available at time of report.
Sources: 1) Loren Smith, Wyoming State Engineer’s Office, Fax, June 9, 2000.2) Williams, Linda I., “A Model of the Green River Using the Wyoming Integrated River SystemOperation Study (WIRSOS),” M.S. Thesis, University of Wyoming, Department of Civil Engineering,December 1995.
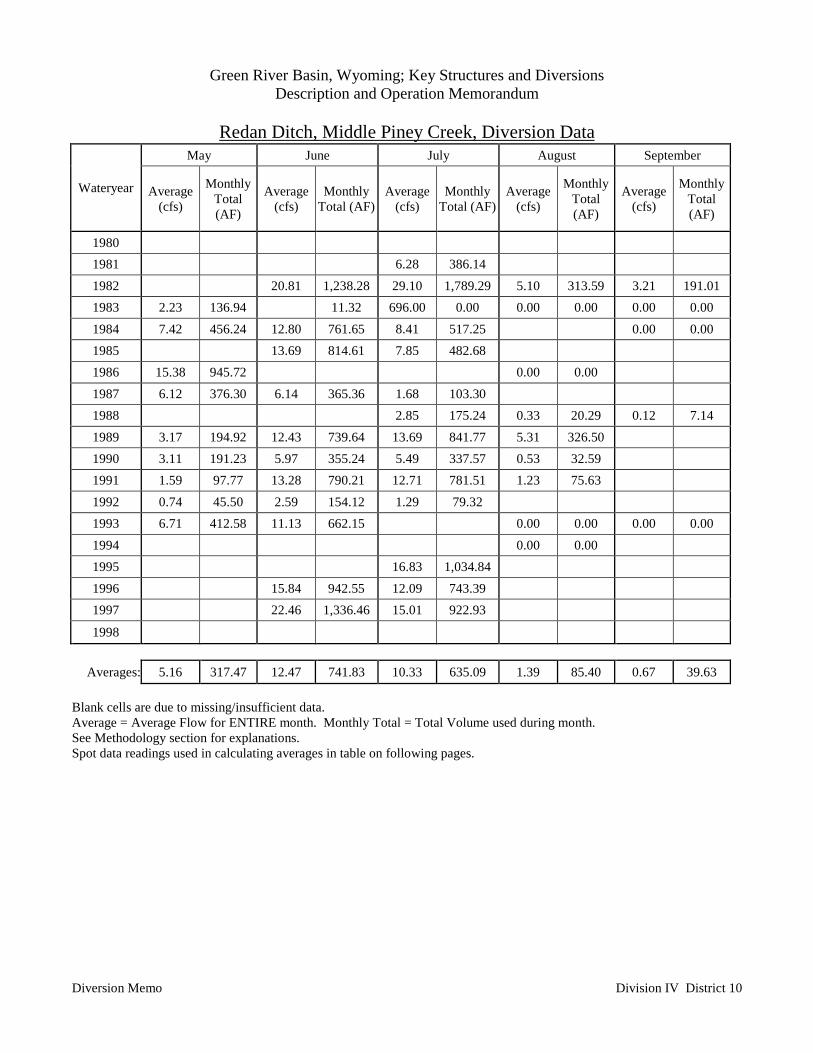
Green River Basin, Wyoming; Key Structures and DiversionsDescription and Operation Memorandum
Redan Ditch, Middle Piney Creek, Diversion Data
Diversion Memo Division IV District 10
May June July August September
Wateryear Average(cfs)
MonthlyTotal(AF)
Average(cfs)
MonthlyTotal (AF)
Average(cfs)
MonthlyTotal (AF)
Average(cfs)
MonthlyTotal(AF)
Average(cfs)
MonthlyTotal(AF)
1980 1981 6.28 386.14 1982 20.81 1,238.28 29.10 1,789.29 5.10 313.59 3.21 191.011983 2.23 136.94 11.32 696.00 0.00 0.00 0.00 0.00 0.001984 7.42 456.24 12.80 761.65 8.41 517.25 0.00 0.001985 13.69 814.61 7.85 482.68 1986 15.38 945.72 0.00 0.00 1987 6.12 376.30 6.14 365.36 1.68 103.30 1988 2.85 175.24 0.33 20.29 0.12 7.141989 3.17 194.92 12.43 739.64 13.69 841.77 5.31 326.50 1990 3.11 191.23 5.97 355.24 5.49 337.57 0.53 32.59 1991 1.59 97.77 13.28 790.21 12.71 781.51 1.23 75.63 1992 0.74 45.50 2.59 154.12 1.29 79.32 1993 6.71 412.58 11.13 662.15 0.00 0.00 0.00 0.001994 0.00 0.00 1995 16.83 1,034.84 1996 15.84 942.55 12.09 743.39 1997 22.46 1,336.46 15.01 922.93
1998
Averages: 5.16 317.47 12.47 741.83 10.33 635.09 1.39 85.40 0.67 39.63
Blank cells are due to missing/insufficient data.Average = Average Flow for ENTIRE month. Monthly Total = Total Volume used during month.See Methodology section for explanations.Spot data readings used in calculating averages in table on following pages.
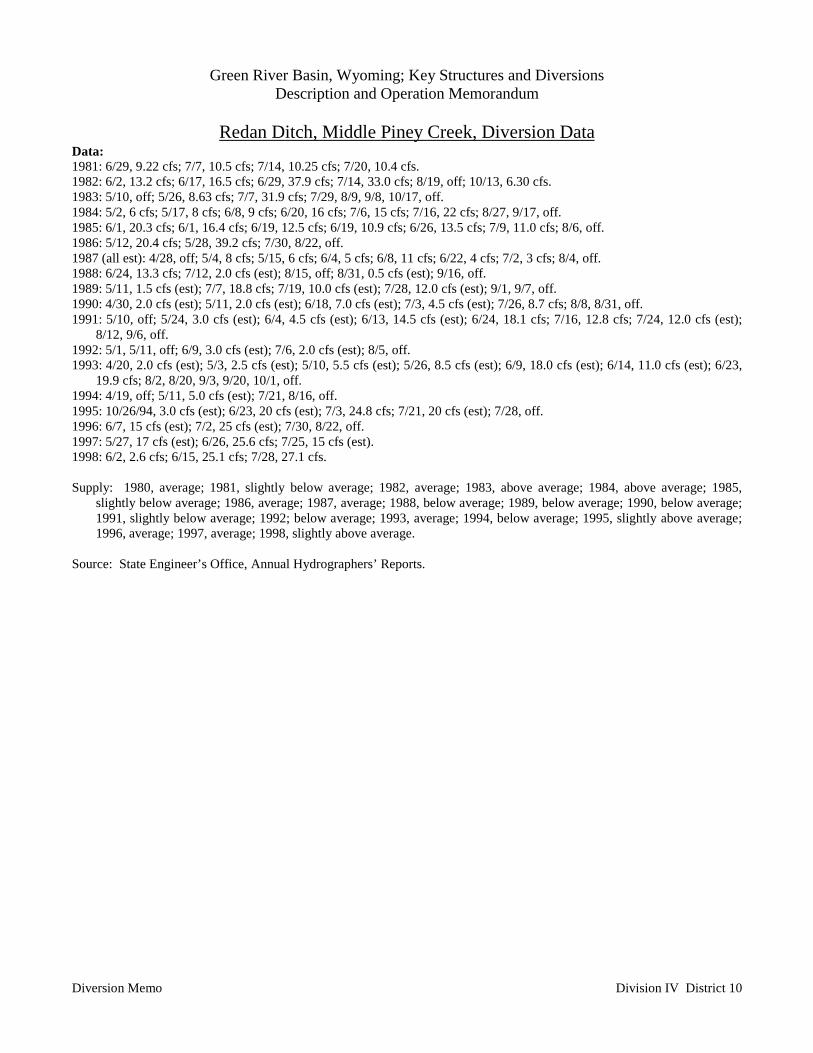
Green River Basin, Wyoming; Key Structures and DiversionsDescription and Operation Memorandum
Redan Ditch, Middle Piney Creek, Diversion Data
Diversion Memo Division IV District 10
Data:1981: 6/29, 9.22 cfs; 7/7, 10.5 cfs; 7/14, 10.25 cfs; 7/20, 10.4 cfs.1982: 6/2, 13.2 cfs; 6/17, 16.5 cfs; 6/29, 37.9 cfs; 7/14, 33.0 cfs; 8/19, off; 10/13, 6.30 cfs.1983: 5/10, off; 5/26, 8.63 cfs; 7/7, 31.9 cfs; 7/29, 8/9, 9/8, 10/17, off.1984: 5/2, 6 cfs; 5/17, 8 cfs; 6/8, 9 cfs; 6/20, 16 cfs; 7/6, 15 cfs; 7/16, 22 cfs; 8/27, 9/17, off.1985: 6/1, 20.3 cfs; 6/1, 16.4 cfs; 6/19, 12.5 cfs; 6/19, 10.9 cfs; 6/26, 13.5 cfs; 7/9, 11.0 cfs; 8/6, off.1986: 5/12, 20.4 cfs; 5/28, 39.2 cfs; 7/30, 8/22, off.1987 (all est): 4/28, off; 5/4, 8 cfs; 5/15, 6 cfs; 6/4, 5 cfs; 6/8, 11 cfs; 6/22, 4 cfs; 7/2, 3 cfs; 8/4, off.1988: 6/24, 13.3 cfs; 7/12, 2.0 cfs (est); 8/15, off; 8/31, 0.5 cfs (est); 9/16, off.1989: 5/11, 1.5 cfs (est); 7/7, 18.8 cfs; 7/19, 10.0 cfs (est); 7/28, 12.0 cfs (est); 9/1, 9/7, off.1990: 4/30, 2.0 cfs (est); 5/11, 2.0 cfs (est); 6/18, 7.0 cfs (est); 7/3, 4.5 cfs (est); 7/26, 8.7 cfs; 8/8, 8/31, off.1991: 5/10, off; 5/24, 3.0 cfs (est); 6/4, 4.5 cfs (est); 6/13, 14.5 cfs (est); 6/24, 18.1 cfs; 7/16, 12.8 cfs; 7/24, 12.0 cfs (est);
8/12, 9/6, off.1992: 5/1, 5/11, off; 6/9, 3.0 cfs (est); 7/6, 2.0 cfs (est); 8/5, off.1993: 4/20, 2.0 cfs (est); 5/3, 2.5 cfs (est); 5/10, 5.5 cfs (est); 5/26, 8.5 cfs (est); 6/9, 18.0 cfs (est); 6/14, 11.0 cfs (est); 6/23,
19.9 cfs; 8/2, 8/20, 9/3, 9/20, 10/1, off.1994: 4/19, off; 5/11, 5.0 cfs (est); 7/21, 8/16, off.1995: 10/26/94, 3.0 cfs (est); 6/23, 20 cfs (est); 7/3, 24.8 cfs; 7/21, 20 cfs (est); 7/28, off.1996: 6/7, 15 cfs (est); 7/2, 25 cfs (est); 7/30, 8/22, off.1997: 5/27, 17 cfs (est); 6/26, 25.6 cfs; 7/25, 15 cfs (est).1998: 6/2, 2.6 cfs; 6/15, 25.1 cfs; 7/28, 27.1 cfs.
Supply: 1980, average; 1981, slightly below average; 1982, average; 1983, above average; 1984, above average; 1985,slightly below average; 1986, average; 1987, average; 1988, below average; 1989, below average; 1990, below average;1991, slightly below average; 1992; below average; 1993, average; 1994, below average; 1995, slightly above average;1996, average; 1997, average; 1998, slightly above average.
Source: State Engineer’s Office, Annual Hydrographers’ Reports.
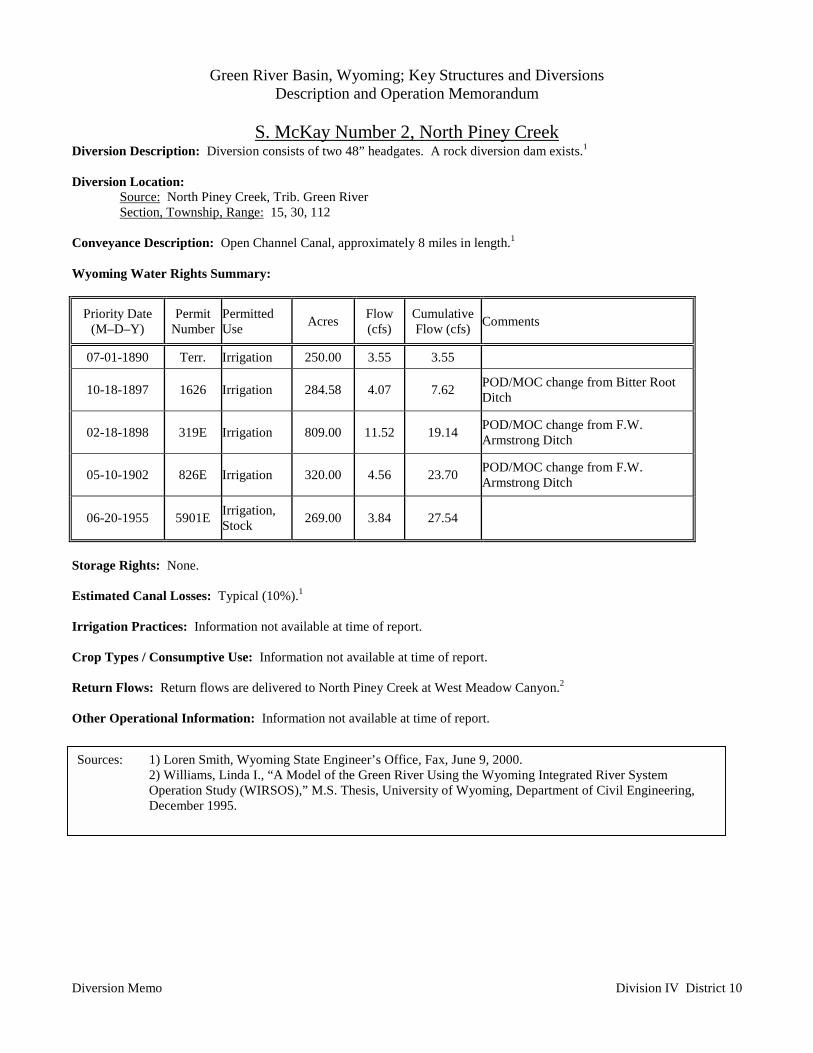
Green River Basin, Wyoming; Key Structures and DiversionsDescription and Operation Memorandum
S. McKay Number 2, North Piney Creek
Diversion Memo Division IV District 10
Diversion Description: Diversion consists of two 48” headgates. A rock diversion dam exists.1
Diversion Location:Source: North Piney Creek, Trib. Green RiverSection, Township, Range: 15, 30, 112
Conveyance Description: Open Channel Canal, approximately 8 miles in length.1
Wyoming Water Rights Summary:
Priority Date(M–D–Y)
PermitNumber
PermittedUse Acres Flow
(cfs)CumulativeFlow (cfs) Comments
07-01-1890 Terr. Irrigation 250.00 3.55 3.55
10-18-1897 1626 Irrigation 284.58 4.07 7.62 POD/MOC change from Bitter RootDitch
02-18-1898 319E Irrigation 809.00 11.52 19.14 POD/MOC change from F.W.Armstrong Ditch
05-10-1902 826E Irrigation 320.00 4.56 23.70 POD/MOC change from F.W.Armstrong Ditch
06-20-1955 5901E Irrigation,Stock 269.00 3.84 27.54
Storage Rights: None.
Estimated Canal Losses: Typical (10%).1
Irrigation Practices: Information not available at time of report.
Crop Types / Consumptive Use: Information not available at time of report.
Return Flows: Return flows are delivered to North Piney Creek at West Meadow Canyon.2
Other Operational Information: Information not available at time of report.
Sources: 1) Loren Smith, Wyoming State Engineer’s Office, Fax, June 9, 2000.2) Williams, Linda I., “A Model of the Green River Using the Wyoming Integrated River SystemOperation Study (WIRSOS),” M.S. Thesis, University of Wyoming, Department of Civil Engineering,December 1995.

Green River Basin, Wyoming; Key Structures and DiversionsDescription and Operation Memorandum
S. McKay Number 2, North Piney Creek, Diversion Data
Diversion Memo Division IV District 10
May June July August September
Wateryear Average(cfs)
MonthlyTotal(AF)
Average(cfs)
MonthlyTotal (AF)
Average(cfs)
MonthlyTotal (AF)
Average(cfs)
MonthlyTotal(AF)
Average(cfs)
MonthlyTotal(AF)
1980 1981 1982 1983 1984 1985 1986 1987 1988 3.21 197.38 1989 15.79 939.57 7.06 434.10 1.44 88.54 1990 6.65 395.70 2.61 160.48 1991 1.10 67.64 9.96 592.66 14.40 885.42 1992 10.76 661.61 15.71 934.81 1.36 83.62 0.00 0.00 1993 12.03 739.70 31.69 1,885.69 18.74 1,152.28 1.31 80.55 0.00 0.001994 1995 3.42 210.29 28.22 1,679.21 27.14 1,668.77 1996 6.34 389.83 23.98 1,426.91 10.55 648.69 4.70 288.99 4.25 252.891997 21.40 1,273.39 4.08 250.87 8.35 513.42
1998 4.39 269.93 9.60 571.24 9.57 588.44
Averages: 6.34 389.83 18.11 1,077.69 10.61 652.52 3.17 194.81 2.13 126.45
Blank cells are due to missing/insufficient data.Average = Average Flow for ENTIRE month. Monthly Total = Total Volume used during month.See Methodology section for explanations.Spot data readings used in calculating averages in table on following pages.
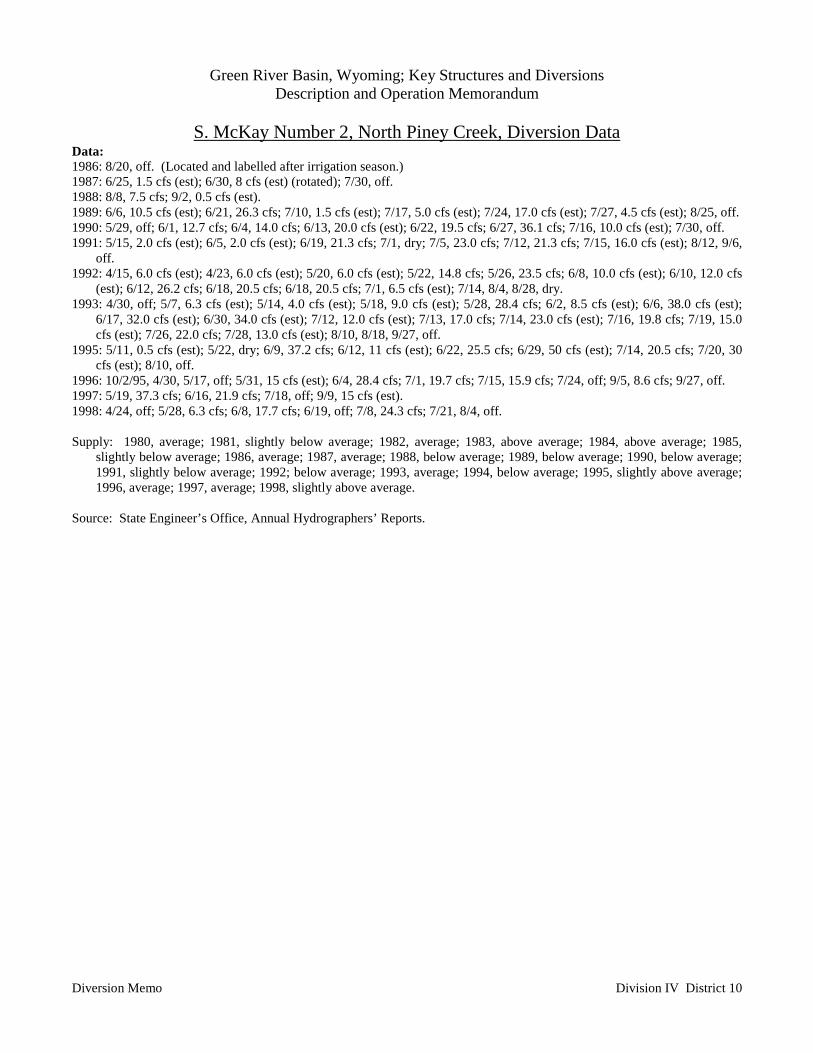
Green River Basin, Wyoming; Key Structures and DiversionsDescription and Operation Memorandum
S. McKay Number 2, North Piney Creek, Diversion Data
Diversion Memo Division IV District 10
Data:1986: 8/20, off. (Located and labelled after irrigation season.)1987: 6/25, 1.5 cfs (est); 6/30, 8 cfs (est) (rotated); 7/30, off.1988: 8/8, 7.5 cfs; 9/2, 0.5 cfs (est).1989: 6/6, 10.5 cfs (est); 6/21, 26.3 cfs; 7/10, 1.5 cfs (est); 7/17, 5.0 cfs (est); 7/24, 17.0 cfs (est); 7/27, 4.5 cfs (est); 8/25, off.1990: 5/29, off; 6/1, 12.7 cfs; 6/4, 14.0 cfs; 6/13, 20.0 cfs (est); 6/22, 19.5 cfs; 6/27, 36.1 cfs; 7/16, 10.0 cfs (est); 7/30, off.1991: 5/15, 2.0 cfs (est); 6/5, 2.0 cfs (est); 6/19, 21.3 cfs; 7/1, dry; 7/5, 23.0 cfs; 7/12, 21.3 cfs; 7/15, 16.0 cfs (est); 8/12, 9/6,
off.1992: 4/15, 6.0 cfs (est); 4/23, 6.0 cfs (est); 5/20, 6.0 cfs (est); 5/22, 14.8 cfs; 5/26, 23.5 cfs; 6/8, 10.0 cfs (est); 6/10, 12.0 cfs
(est); 6/12, 26.2 cfs; 6/18, 20.5 cfs; 6/18, 20.5 cfs; 7/1, 6.5 cfs (est); 7/14, 8/4, 8/28, dry.1993: 4/30, off; 5/7, 6.3 cfs (est); 5/14, 4.0 cfs (est); 5/18, 9.0 cfs (est); 5/28, 28.4 cfs; 6/2, 8.5 cfs (est); 6/6, 38.0 cfs (est);
6/17, 32.0 cfs (est); 6/30, 34.0 cfs (est); 7/12, 12.0 cfs (est); 7/13, 17.0 cfs; 7/14, 23.0 cfs (est); 7/16, 19.8 cfs; 7/19, 15.0cfs (est); 7/26, 22.0 cfs; 7/28, 13.0 cfs (est); 8/10, 8/18, 9/27, off.
1995: 5/11, 0.5 cfs (est); 5/22, dry; 6/9, 37.2 cfs; 6/12, 11 cfs (est); 6/22, 25.5 cfs; 6/29, 50 cfs (est); 7/14, 20.5 cfs; 7/20, 30cfs (est); 8/10, off.
1996: 10/2/95, 4/30, 5/17, off; 5/31, 15 cfs (est); 6/4, 28.4 cfs; 7/1, 19.7 cfs; 7/15, 15.9 cfs; 7/24, off; 9/5, 8.6 cfs; 9/27, off.1997: 5/19, 37.3 cfs; 6/16, 21.9 cfs; 7/18, off; 9/9, 15 cfs (est).1998: 4/24, off; 5/28, 6.3 cfs; 6/8, 17.7 cfs; 6/19, off; 7/8, 24.3 cfs; 7/21, 8/4, off.
Supply: 1980, average; 1981, slightly below average; 1982, average; 1983, above average; 1984, above average; 1985,slightly below average; 1986, average; 1987, average; 1988, below average; 1989, below average; 1990, below average;1991, slightly below average; 1992; below average; 1993, average; 1994, below average; 1995, slightly above average;1996, average; 1997, average; 1998, slightly above average.
Source: State Engineer’s Office, Annual Hydrographers’ Reports.
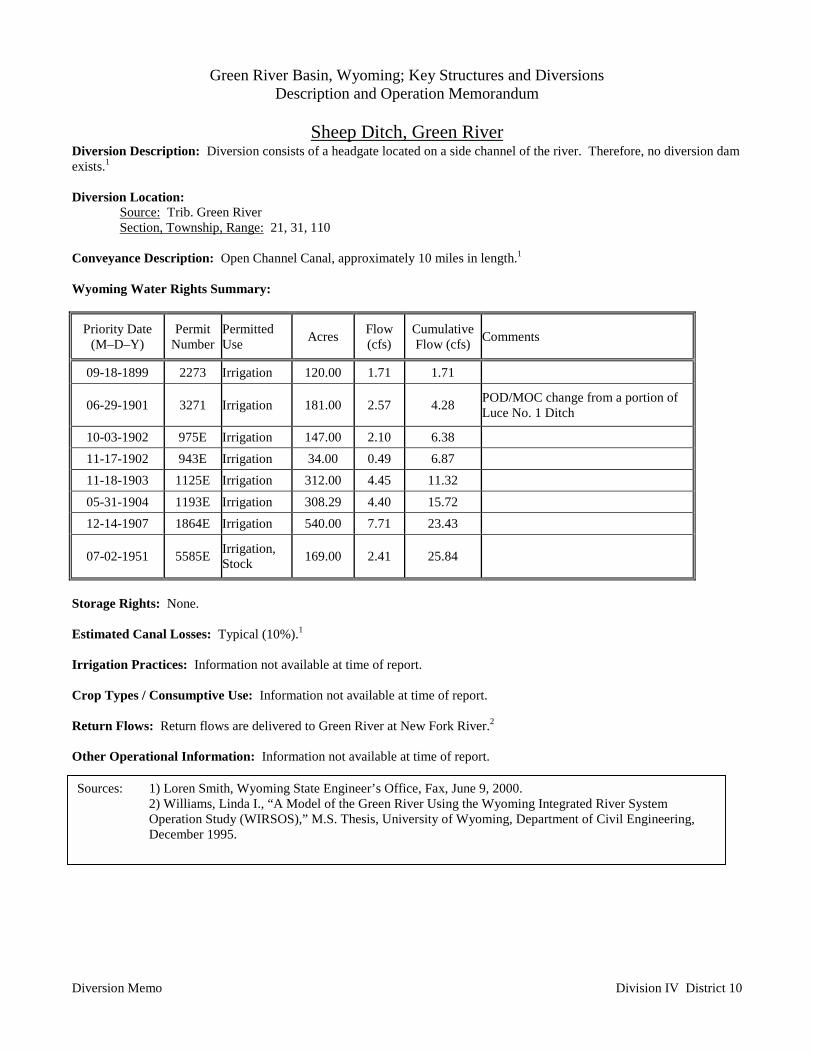
Green River Basin, Wyoming; Key Structures and DiversionsDescription and Operation Memorandum
Sheep Ditch, Green River
Diversion Memo Division IV District 10
Diversion Description: Diversion consists of a headgate located on a side channel of the river. Therefore, no diversion damexists.1
Diversion Location:Source: Trib. Green RiverSection, Township, Range: 21, 31, 110
Conveyance Description: Open Channel Canal, approximately 10 miles in length.1
Wyoming Water Rights Summary:
Priority Date(M–D–Y)
PermitNumber
PermittedUse Acres Flow
(cfs)CumulativeFlow (cfs) Comments
09-18-1899 2273 Irrigation 120.00 1.71 1.71
06-29-1901 3271 Irrigation 181.00 2.57 4.28 POD/MOC change from a portion ofLuce No. 1 Ditch
10-03-1902 975E Irrigation 147.00 2.10 6.38 11-17-1902 943E Irrigation 34.00 0.49 6.87 11-18-1903 1125E Irrigation 312.00 4.45 11.32 05-31-1904 1193E Irrigation 308.29 4.40 15.72 12-14-1907 1864E Irrigation 540.00 7.71 23.43
07-02-1951 5585E Irrigation,Stock 169.00 2.41 25.84
Storage Rights: None.
Estimated Canal Losses: Typical (10%).1
Irrigation Practices: Information not available at time of report.
Crop Types / Consumptive Use: Information not available at time of report.
Return Flows: Return flows are delivered to Green River at New Fork River.2
Other Operational Information: Information not available at time of report.
Sources: 1) Loren Smith, Wyoming State Engineer’s Office, Fax, June 9, 2000.2) Williams, Linda I., “A Model of the Green River Using the Wyoming Integrated River SystemOperation Study (WIRSOS),” M.S. Thesis, University of Wyoming, Department of Civil Engineering,December 1995.

Green River Basin, Wyoming; Key Structures and DiversionsDescription and Operation Memorandum
Sheep Ditch, Green River, Diversion Data
Diversion Memo Division IV District 10
May June July August September
Wateryear Average(cfs)
MonthlyTotal(AF)
Average(cfs)
MonthlyTotal (AF)
Average(cfs)
MonthlyTotal (AF)
Average(cfs)
MonthlyTotal(AF)
Average(cfs)
MonthlyTotal(AF)
1980 1981 1982 1983 1984 1985 1986 1987 1988 1989 1990 1991 1992 7.53 448.07 10.98 675.13 1993 9.35 574.91 0.00 0.00 0.00 0.001994 1995 15.87 975.81 0.02 1.23 0.00 0.001996 11.80 702.15 14.19 872.511997 0.92 56.57
1998 39.90 2,374.21 74.84 4,601.73
Averages: 19.74 1,174.81 25.05 1,540.02 0.31 19.27 0.00 0.00
Blank cells are due to missing/insufficient data.Average = Average Flow for ENTIRE month. Monthly Total = Total Volume used during month.See Methodology section for explanations.Spot data readings used in calculating averages in table on following pages.
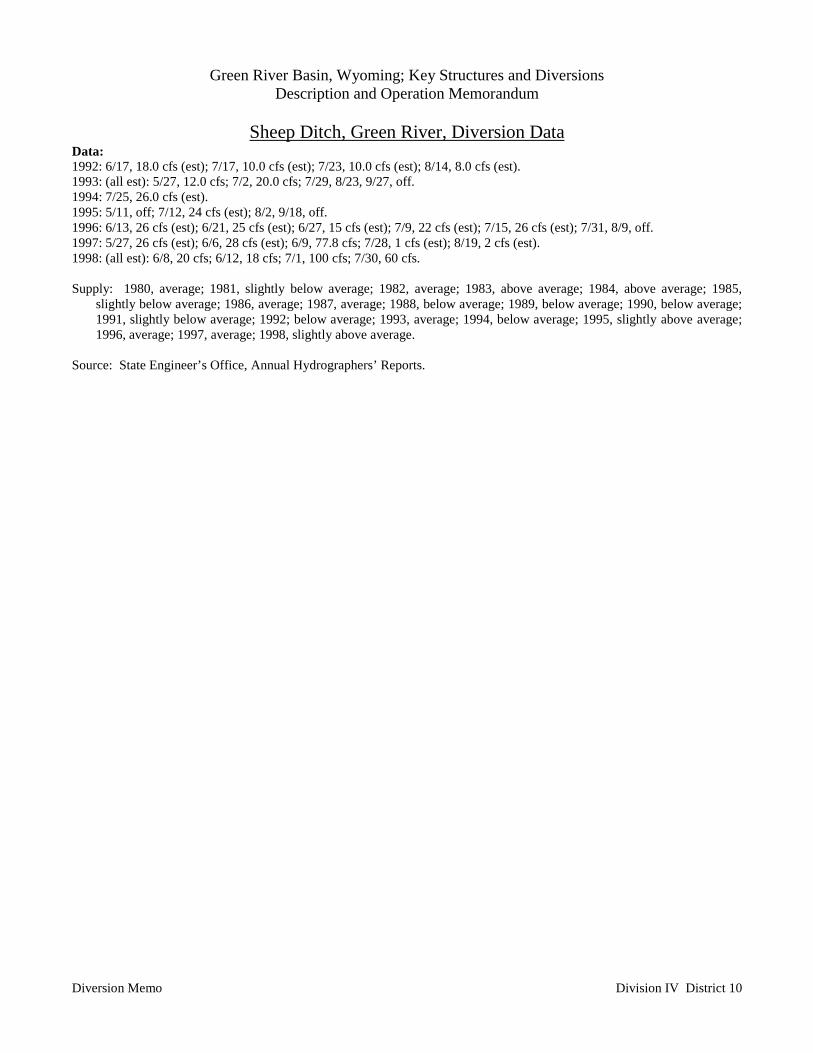
Green River Basin, Wyoming; Key Structures and DiversionsDescription and Operation Memorandum
Sheep Ditch, Green River, Diversion Data
Diversion Memo Division IV District 10
Data:1992: 6/17, 18.0 cfs (est); 7/17, 10.0 cfs (est); 7/23, 10.0 cfs (est); 8/14, 8.0 cfs (est).1993: (all est): 5/27, 12.0 cfs; 7/2, 20.0 cfs; 7/29, 8/23, 9/27, off.1994: 7/25, 26.0 cfs (est).1995: 5/11, off; 7/12, 24 cfs (est); 8/2, 9/18, off.1996: 6/13, 26 cfs (est); 6/21, 25 cfs (est); 6/27, 15 cfs (est); 7/9, 22 cfs (est); 7/15, 26 cfs (est); 7/31, 8/9, off.1997: 5/27, 26 cfs (est); 6/6, 28 cfs (est); 6/9, 77.8 cfs; 7/28, 1 cfs (est); 8/19, 2 cfs (est).1998: (all est): 6/8, 20 cfs; 6/12, 18 cfs; 7/1, 100 cfs; 7/30, 60 cfs.
Supply: 1980, average; 1981, slightly below average; 1982, average; 1983, above average; 1984, above average; 1985,slightly below average; 1986, average; 1987, average; 1988, below average; 1989, below average; 1990, below average;1991, slightly below average; 1992; below average; 1993, average; 1994, below average; 1995, slightly above average;1996, average; 1997, average; 1998, slightly above average.
Source: State Engineer’s Office, Annual Hydrographers’ Reports.
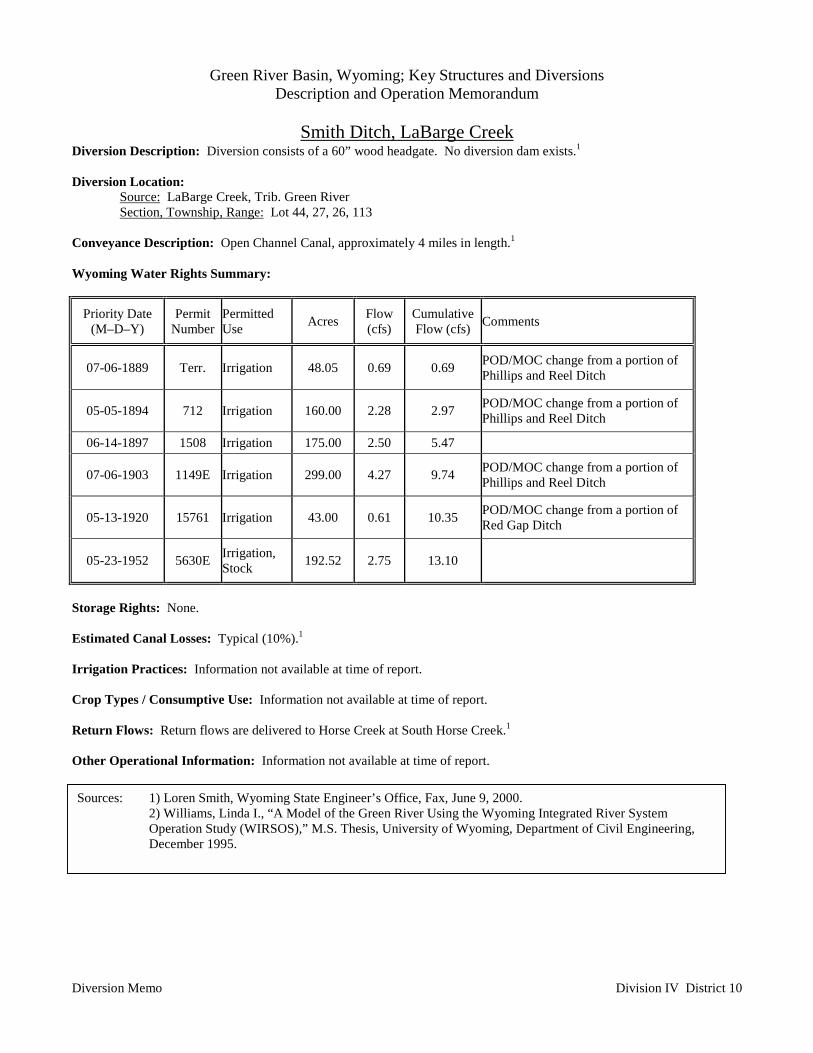
Green River Basin, Wyoming; Key Structures and DiversionsDescription and Operation Memorandum
Smith Ditch, LaBarge Creek
Diversion Memo Division IV District 10
Diversion Description: Diversion consists of a 60” wood headgate. No diversion dam exists.1
Diversion Location:Source: LaBarge Creek, Trib. Green RiverSection, Township, Range: Lot 44, 27, 26, 113
Conveyance Description: Open Channel Canal, approximately 4 miles in length.1
Wyoming Water Rights Summary:
Priority Date(M–D–Y)
PermitNumber
PermittedUse Acres Flow
(cfs)CumulativeFlow (cfs) Comments
07-06-1889 Terr. Irrigation 48.05 0.69 0.69 POD/MOC change from a portion ofPhillips and Reel Ditch
05-05-1894 712 Irrigation 160.00 2.28 2.97 POD/MOC change from a portion ofPhillips and Reel Ditch
06-14-1897 1508 Irrigation 175.00 2.50 5.47
07-06-1903 1149E Irrigation 299.00 4.27 9.74 POD/MOC change from a portion ofPhillips and Reel Ditch
05-13-1920 15761 Irrigation 43.00 0.61 10.35 POD/MOC change from a portion ofRed Gap Ditch
05-23-1952 5630E Irrigation,Stock 192.52 2.75 13.10
Storage Rights: None.
Estimated Canal Losses: Typical (10%).1
Irrigation Practices: Information not available at time of report.
Crop Types / Consumptive Use: Information not available at time of report.
Return Flows: Return flows are delivered to Horse Creek at South Horse Creek.1
Other Operational Information: Information not available at time of report.
Sources: 1) Loren Smith, Wyoming State Engineer’s Office, Fax, June 9, 2000.2) Williams, Linda I., “A Model of the Green River Using the Wyoming Integrated River SystemOperation Study (WIRSOS),” M.S. Thesis, University of Wyoming, Department of Civil Engineering,December 1995.
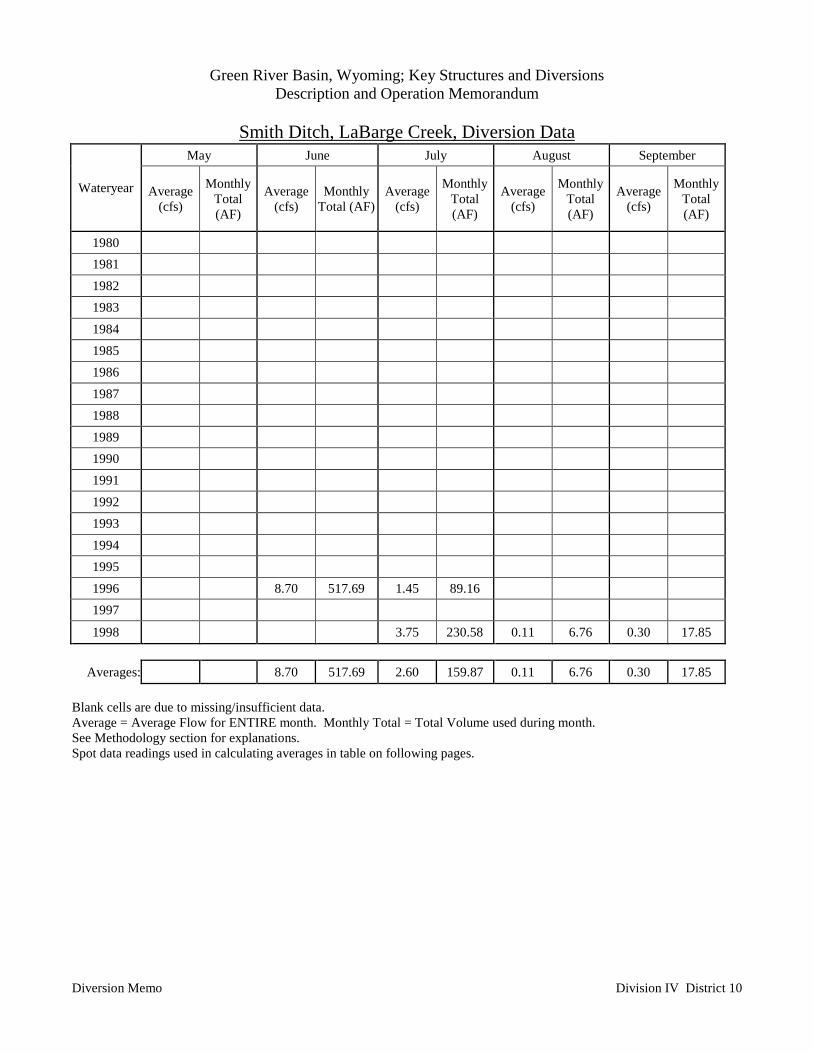
Green River Basin, Wyoming; Key Structures and DiversionsDescription and Operation Memorandum
Smith Ditch, LaBarge Creek, Diversion Data
Diversion Memo Division IV District 10
May June July August September
Wateryear Average(cfs)
MonthlyTotal(AF)
Average(cfs)
MonthlyTotal (AF)
Average(cfs)
MonthlyTotal(AF)
Average(cfs)
MonthlyTotal(AF)
Average(cfs)
MonthlyTotal(AF)
1980 1981 1982 1983 1984 1985 1986 1987 1988 1989 1990 1991 1992 1993 1994 1995 1996 8.70 517.69 1.45 89.16 1997
1998 3.75 230.58 0.11 6.76 0.30 17.85
Averages: 8.70 517.69 2.60 159.87 0.11 6.76 0.30 17.85
Blank cells are due to missing/insufficient data.Average = Average Flow for ENTIRE month. Monthly Total = Total Volume used during month.See Methodology section for explanations.Spot data readings used in calculating averages in table on following pages.
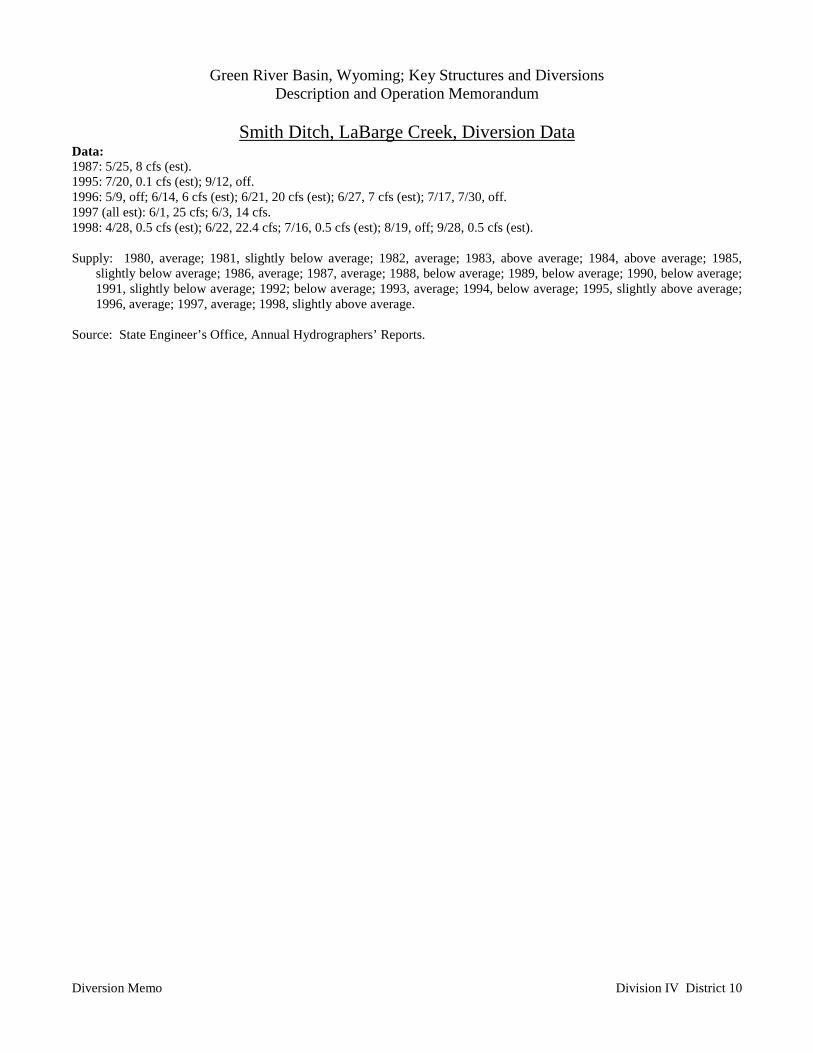
Green River Basin, Wyoming; Key Structures and DiversionsDescription and Operation Memorandum
Smith Ditch, LaBarge Creek, Diversion Data
Diversion Memo Division IV District 10
Data:1987: 5/25, 8 cfs (est).1995: 7/20, 0.1 cfs (est); 9/12, off.1996: 5/9, off; 6/14, 6 cfs (est); 6/21, 20 cfs (est); 6/27, 7 cfs (est); 7/17, 7/30, off.1997 (all est): 6/1, 25 cfs; 6/3, 14 cfs.1998: 4/28, 0.5 cfs (est); 6/22, 22.4 cfs; 7/16, 0.5 cfs (est); 8/19, off; 9/28, 0.5 cfs (est).
Supply: 1980, average; 1981, slightly below average; 1982, average; 1983, above average; 1984, above average; 1985,slightly below average; 1986, average; 1987, average; 1988, below average; 1989, below average; 1990, below average;1991, slightly below average; 1992; below average; 1993, average; 1994, below average; 1995, slightly above average;1996, average; 1997, average; 1998, slightly above average.
Source: State Engineer’s Office, Annual Hydrographers’ Reports.

Green River Basin, Wyoming; Key Structures and DiversionsDescription and Operation Memorandum
Soap Hole Ditch, Green River
Diversion Memo Division IV District 10
Diversion Description: Diversion consists of a 40” Waterman slide gate mounted on a CMP culvert. No diversion damexists.1
Diversion Location:Source: Green RiverSection, Township, Range: 10, 33, 110
Conveyance Description: Open Channel Canal, approximately 3 miles in length.1
Wyoming Water Rights Summary:
Priority Date(M–D–Y)
PermitNumber
PermittedUse Acres Flow
(cfs)CumulativeFlow (cfs) Comments
02-05-1898 1733 Irrigation 344.00 4.91 4.91
11-27-1903 1136E Irrigation 144.00 2.05 6.96 02-15-1906 1500E Irrigation 114.00 1.62 8.58 03-09-1911 2478E Irrigation 704.00 10.05 18.63 05-24-1912 2596E Irrigation 60.00 0.86 19.49
09-10-1914 3046E Domestic,Irrigation 144.00 2.06 21.55
Storage Rights: None.
Estimated Canal Losses: Less than typical losses are experienced.1
Irrigation Practices: Information not available at time of report.
Crop Types / Consumptive Use: Information not available at time of report.
Return Flows: Return flows are delivered to Green River near Hill Ditch.2
Other Operational Information: Information not available at time of report.
Sources: 1) Loren Smith, Wyoming State Engineer’s Office, Fax, June 9, 2000.2) Williams, Linda I., “A Model of the Green River Using the Wyoming Integrated River SystemOperation Study (WIRSOS),” M.S. Thesis, University of Wyoming, Department of Civil Engineering,December 1995.
Green River Basin, Wyoming; Key Structures and DiversionsDescription and Operation Memorandum
Soap Hole Ditch, Green River, Diversion Data
Diversion Memo Division IV District 10
Data:1997: 7/28, off.1998: 6/30, 66.8 cfs.
Supply: 1980, average; 1981, slightly below average; 1982, average; 1983, above average; 1984, above average; 1985,slightly below average; 1986, average; 1987, average; 1988, below average; 1989, below average; 1990, below average;1991, slightly below average; 1992; below average; 1993, average; 1994, below average; 1995, slightly above average;1996, average; 1997, average; 1998, slightly above average.
Source: State Engineer’s Office, Annual Hydrographers’ Reports.
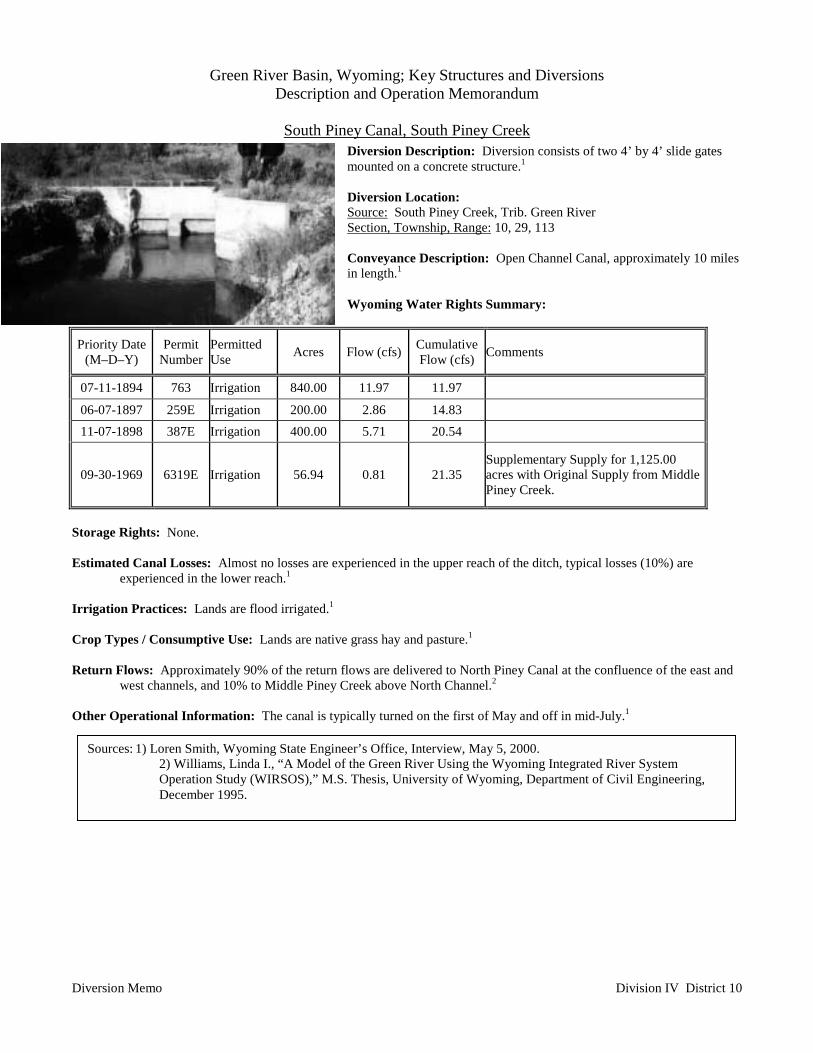
Green River Basin, Wyoming; Key Structures and DiversionsDescription and Operation Memorandum
South Piney Canal, South Piney Creek
Diversion Memo Division IV District 10
Diversion Description: Diversion consists of two 4’ by 4’ slide gatesmounted on a concrete structure.1
Diversion Location:Source: South Piney Creek, Trib. Green RiverSection, Township, Range: 10, 29, 113
Conveyance Description: Open Channel Canal, approximately 10 milesin length.1
Wyoming Water Rights Summary:
Priority Date(M–D–Y)
PermitNumber
PermittedUse Acres Flow (cfs) Cumulative
Flow (cfs) Comments
07-11-1894 763 Irrigation 840.00 11.97 11.97
06-07-1897 259E Irrigation 200.00 2.86 14.83 11-07-1898 387E Irrigation 400.00 5.71 20.54
09-30-1969 6319E Irrigation 56.94 0.81 21.35Supplementary Supply for 1,125.00acres with Original Supply from MiddlePiney Creek.
Storage Rights: None.
Estimated Canal Losses: Almost no losses are experienced in the upper reach of the ditch, typical losses (10%) areexperienced in the lower reach.1
Irrigation Practices: Lands are flood irrigated.1
Crop Types / Consumptive Use: Lands are native grass hay and pasture.1
Return Flows: Approximately 90% of the return flows are delivered to North Piney Canal at the confluence of the east andwest channels, and 10% to Middle Piney Creek above North Channel.2
Other Operational Information: The canal is typically turned on the first of May and off in mid-July.1
Sources: 1) Loren Smith, Wyoming State Engineer’s Office, Interview, May 5, 2000.2) Williams, Linda I., “A Model of the Green River Using the Wyoming Integrated River SystemOperation Study (WIRSOS),” M.S. Thesis, University of Wyoming, Department of Civil Engineering,December 1995.
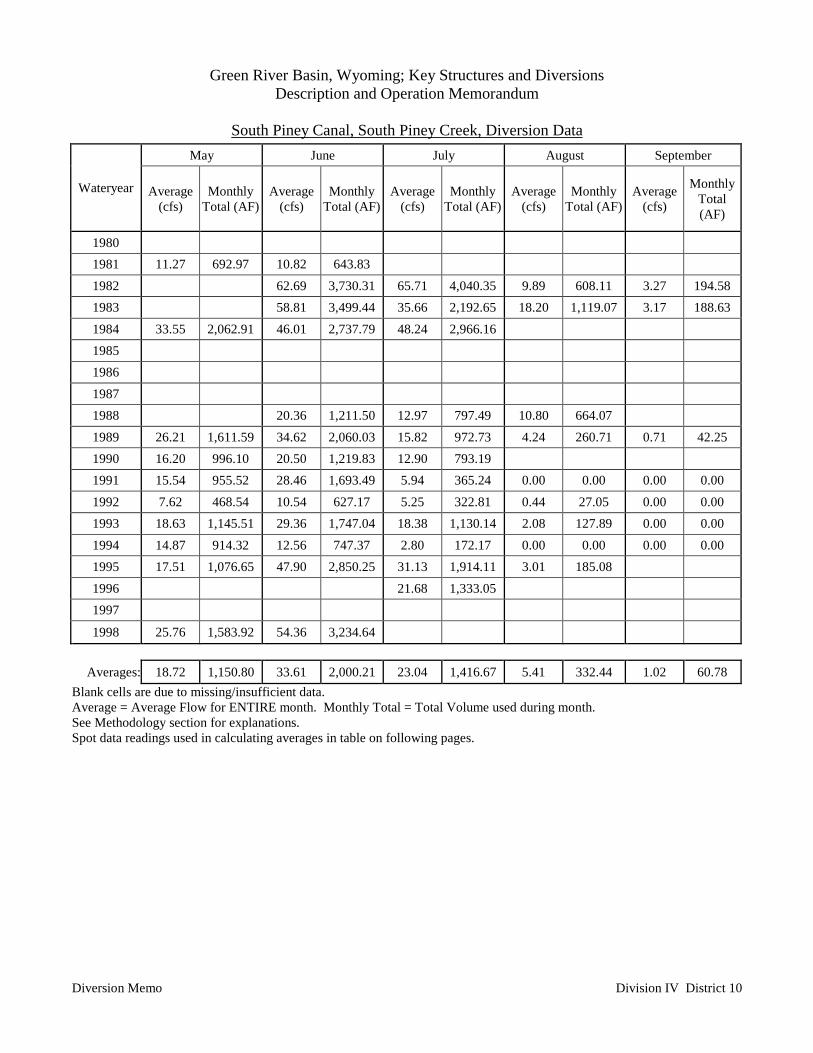
Green River Basin, Wyoming; Key Structures and DiversionsDescription and Operation Memorandum
South Piney Canal, South Piney Creek, Diversion Data
Diversion Memo Division IV District 10
May June July August September
Wateryear Average(cfs)
MonthlyTotal (AF)
Average(cfs)
MonthlyTotal (AF)
Average(cfs)
MonthlyTotal (AF)
Average(cfs)
MonthlyTotal (AF)
Average(cfs)
MonthlyTotal(AF)
1980 1981 11.27 692.97 10.82 643.83 1982 62.69 3,730.31 65.71 4,040.35 9.89 608.11 3.27 194.581983 58.81 3,499.44 35.66 2,192.65 18.20 1,119.07 3.17 188.631984 33.55 2,062.91 46.01 2,737.79 48.24 2,966.16 1985 1986 1987 1988 20.36 1,211.50 12.97 797.49 10.80 664.07 1989 26.21 1,611.59 34.62 2,060.03 15.82 972.73 4.24 260.71 0.71 42.251990 16.20 996.10 20.50 1,219.83 12.90 793.19 1991 15.54 955.52 28.46 1,693.49 5.94 365.24 0.00 0.00 0.00 0.001992 7.62 468.54 10.54 627.17 5.25 322.81 0.44 27.05 0.00 0.001993 18.63 1,145.51 29.36 1,747.04 18.38 1,130.14 2.08 127.89 0.00 0.001994 14.87 914.32 12.56 747.37 2.80 172.17 0.00 0.00 0.00 0.001995 17.51 1,076.65 47.90 2,850.25 31.13 1,914.11 3.01 185.08 1996 21.68 1,333.05 1997
1998 25.76 1,583.92 54.36 3,234.64
Averages: 18.72 1,150.80 33.61 2,000.21 23.04 1,416.67 5.41 332.44 1.02 60.78Blank cells are due to missing/insufficient data.Average = Average Flow for ENTIRE month. Monthly Total = Total Volume used during month.See Methodology section for explanations.Spot data readings used in calculating averages in table on following pages.
Green River Basin, Wyoming; Key Structures and DiversionsDescription and Operation Memorandum
South Piney Canal, South Piney Creek, Diversion Data
Diversion Memo Division IV District 10
Data:1981: 5/4, 11 cfs; 6/11, 15 cfs; 7/6, off.1982: 6/10, 73.6 cfs; 6/24, 99.6 cfs; 7/13, 77.3 cfs; 8/10, 8.47 cfs; 8/26, 4.58 cfs; 9/20, 2.95 cfs; 10/11, 2.17 cfs.1983: 73.6 cfs; 7/18, 33.1 cfs; 8/4, 24.8 cfs; 9/20, 10/20, off.1984: 5/14, 42 cfs; 5/31, 72 cfs; 6/20, 38 cfs; 6/21, 29 cfs; 7/16, 66 cfs; 8/7, off.1986: 5/30, 110 cfs (est); 6/3, headgate washed out.1988: 5/16, 21.4 cfs; 6/24, 20.5 cfs; 7/14, 12.0 cfs (est); 9/8, 10.0 cfs (est).1989: 5/3, 29.3 cfs; 5/22, 26.4 cfs; 6/8, 33.0 cfs; 6/30, 38.0 cfs (est); 7/3, 27.5 cfs; 7/25, 7.0 cfs (est); 7/31, 7.0 cfs (est); 8/7,
4.0 cfs (est); 8/15, 5.0 cfs (est); 9/18, off.1990: 5/8, 41.0 cfs; 5/9, 20.5 cfs; 6/4, 20.5 cfs; 6/10, 20.5 cfs; 6/29, 20.5 cfs; 7/10, 20.5 cfs; 7/31, 8/20, off.1991: 5/6, 7.2 cfs; 5/13, 11.5 cfs; 5/16, 15.3 cfs; 5/23, 25.0 cfs; 6/4, 28.0 cfs; 6/13, 28.0 cfs; 6/28, 30.3 cfs; 7/3, 20.0 cfs; 7/17,
8/5, 9/6, 9/18, off.1992: 4/12, 4/20, 5/1, off; 5/12, 4.5 cfs (est); 5/20, 12.0 cfs; 5/26, 12.2 cfs; 6/9, 12.0 cfs; 6/26, 9.0 cfs; 7/1, 7.5 cfs; 7/14, 6.8
cfs; 7/15, 6.0 cfs; 7/20, 3.5 cfs (est); 8/4, 3.0 cfs (est); 8/7, 8/21, 9/15, 9/21, off.1993: 4/19, 4/20, 4/23, 4/27, off; 4/29, 16.0 cfs (est); 4/29, 5/4, off; 5/5, 12.3 cfs; 5/10, 5/12, 5/14, off; 5/14, 22.8 cfs; 5/17,
37.8 cfs; 5/24, 28.0 cfs; 5/27, 30.0 cfs; 5/27, 25.0 cfs; 5/28, 25.0 cfs; 6/11, 38.0 cfs; 6/11, 27.2 cfs; 6/24, 27.2 cfs; 6/30,28.0 cfs (est); 7/6, 28.0 cfs; 7/8, 27.0 cfs; 7/8, 21.0 cfs; 7/19, 15.0 cfs; 8/2, 12.0 cfs (est); 8/2, 5.5 cfs (est); 8/5, 5.5 cfs(est); 8/18, 8/26, 9/2, 9/7, 9/9, 9/20, 9/28, off.
1994: 4/7, off; 4/14, 8.5 cfs (est); 4/22, 8.5 cfs (arrive), 17.5 cfs (depart); 5/9, 16.0 cfs; 6/6, 12.0 cfs (est); 6/15, 12.5 cfs; 6/17,15.6 cfs; 6/20, 15.5 cfs (arrive), 11.0 cfs (depart); 6/22, 12.5 cfs; 6/26, 11.0 cfs; 6/27, 11.9 cfs; 6/30, 12.5 cfs (arrive),10.5 cfs (depart); 7/3, 16.0 cfs (arrive), 11.5 cfs (depart) (rotated); 7/8, 11.9 cfs (arrive), off (depart); 8/21, 8/26, 9/2, 9/9,9/30, off.
1995: 10/26/94, off; 4/13, 16.5 cfs; 4/18, 10.0 cfs (est) (arrive), off (depart); 4/20, 6.5 cfs (arrive), 4/20, 12.7 cfs (depart);4/25, 13.1 cfs; 4/27, 13.6 cfs; 5/5, 7.33 cfs (est) (arrive), 15 cfs (est) (depart); 5/9, 14.0 cfs (est); 5/11, 13.6 cfs (est)(arrive), 14.8 cfs (est) (depart); 5/12, 16.8 cfs; 5/16, 20 cfs (est); 5/19, 20 cfs (est); 5/23, 17.9 cfs (est) (arrive), 20 cfs(est) (depart); 5/29, 25 cfs (est) (arrive), 20 cfs (est) (depart); 6/5, 22 cfs (est); 6/8, 20 cfs (est) (arrive), 35 cfs (est)(depart); 6/14, 40 cfs (est) (arrive), 50 cfs (est) (depart); 6/16, 75.9 cfs; 6/23, 60 cfs (est) (arrive), 55 cfs (est) (depart);6/30, 60 cfs (est); 7/6, 50 cfs (est); 7/13, 65 cfs (est) (arrive), 30 cfs (est) (depart); 7/27, 7 cfs (est); 8/24, 2 cfs (est).
1997: 5/5, 1 cfs (est); 7/7, 66.6 cfs; 7/22, 23 cfs (est).1998: 5/5, 72.5 cfs; 5/12, 18.1 cfs; 5/21, 18 cfs; 6/1, 40 cfs (est); 6/12, 56.9 cfs; 7/10, 59.5 cfs; 8/6, 0.5 cfs (est).
Supply: 1980, average; 1981, slightly below average; 1982, average; 1983, above average; 1984, above average; 1985,slightly below average; 1986, average; 1987, average; 1988, below average; 1989, below average; 1990, below average;1991, slightly below average; 1992; below average; 1993, average; 1994, below average; 1995, slightly above average;1996, average; 1997, average; 1998, slightly above average.
Source: State Engineer’s Office, Annual Hydrographers’ Reports.
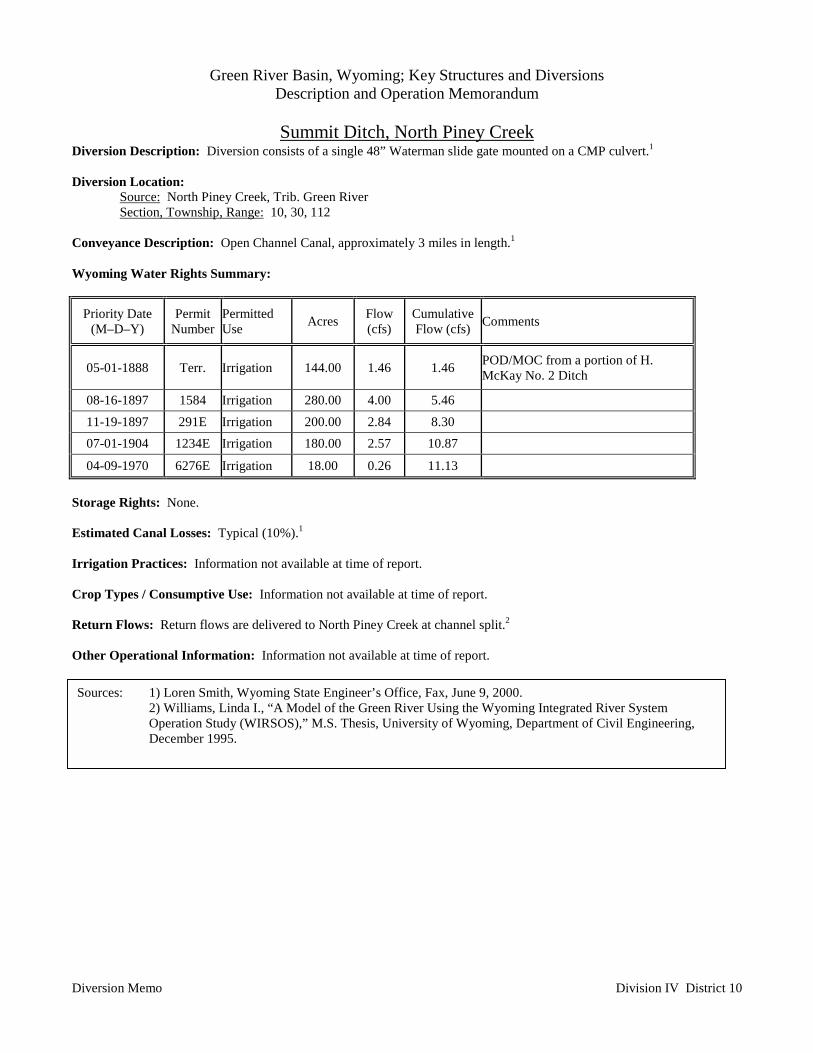
Green River Basin, Wyoming; Key Structures and DiversionsDescription and Operation Memorandum
Summit Ditch, North Piney Creek
Diversion Memo Division IV District 10
Diversion Description: Diversion consists of a single 48” Waterman slide gate mounted on a CMP culvert.1
Diversion Location:Source: North Piney Creek, Trib. Green RiverSection, Township, Range: 10, 30, 112
Conveyance Description: Open Channel Canal, approximately 3 miles in length.1
Wyoming Water Rights Summary:
Priority Date(M–D–Y)
PermitNumber
PermittedUse Acres Flow
(cfs)CumulativeFlow (cfs) Comments
05-01-1888 Terr. Irrigation 144.00 1.46 1.46 POD/MOC from a portion of H.McKay No. 2 Ditch
08-16-1897 1584 Irrigation 280.00 4.00 5.46 11-19-1897 291E Irrigation 200.00 2.84 8.30 07-01-1904 1234E Irrigation 180.00 2.57 10.87
04-09-1970 6276E Irrigation 18.00 0.26 11.13
Storage Rights: None.
Estimated Canal Losses: Typical (10%).1
Irrigation Practices: Information not available at time of report.
Crop Types / Consumptive Use: Information not available at time of report.
Return Flows: Return flows are delivered to North Piney Creek at channel split.2
Other Operational Information: Information not available at time of report.
Sources: 1) Loren Smith, Wyoming State Engineer’s Office, Fax, June 9, 2000.2) Williams, Linda I., “A Model of the Green River Using the Wyoming Integrated River SystemOperation Study (WIRSOS),” M.S. Thesis, University of Wyoming, Department of Civil Engineering,December 1995.
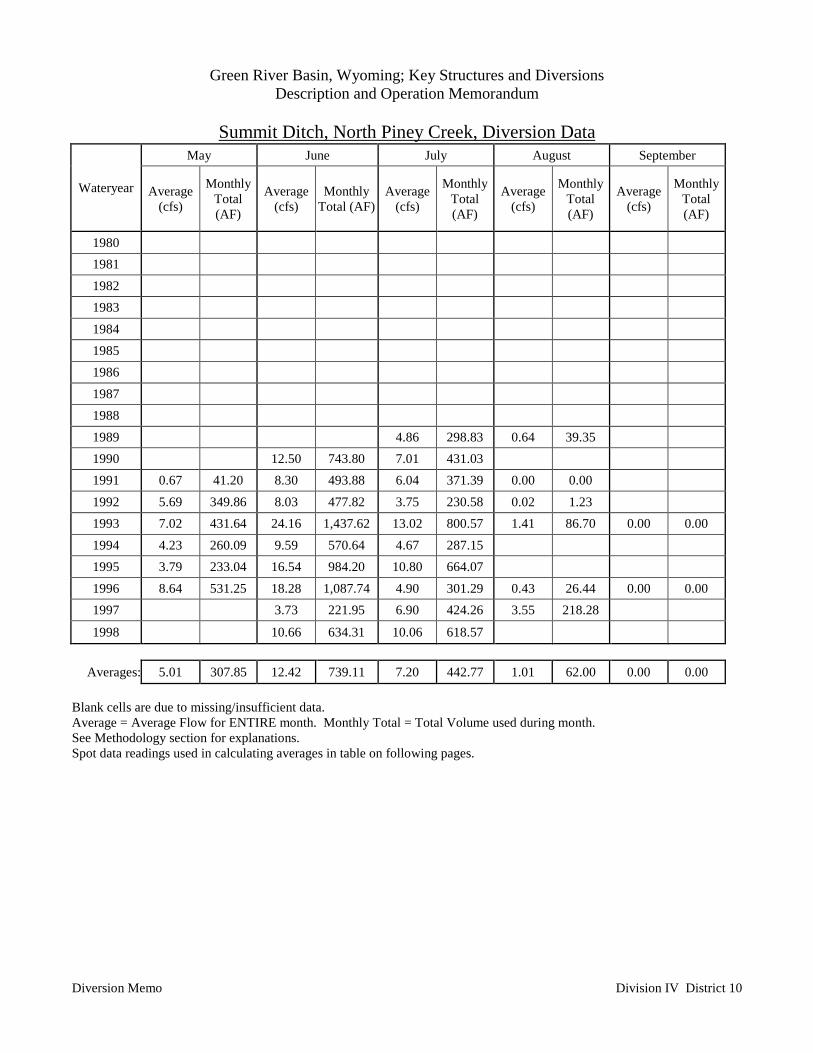
Green River Basin, Wyoming; Key Structures and DiversionsDescription and Operation Memorandum
Summit Ditch, North Piney Creek, Diversion Data
Diversion Memo Division IV District 10
May June July August September
Wateryear Average(cfs)
MonthlyTotal(AF)
Average(cfs)
MonthlyTotal (AF)
Average(cfs)
MonthlyTotal(AF)
Average(cfs)
MonthlyTotal(AF)
Average(cfs)
MonthlyTotal(AF)
1980 1981 1982 1983 1984 1985 1986 1987 1988 1989 4.86 298.83 0.64 39.35 1990 12.50 743.80 7.01 431.03 1991 0.67 41.20 8.30 493.88 6.04 371.39 0.00 0.00 1992 5.69 349.86 8.03 477.82 3.75 230.58 0.02 1.23 1993 7.02 431.64 24.16 1,437.62 13.02 800.57 1.41 86.70 0.00 0.001994 4.23 260.09 9.59 570.64 4.67 287.15 1995 3.79 233.04 16.54 984.20 10.80 664.07 1996 8.64 531.25 18.28 1,087.74 4.90 301.29 0.43 26.44 0.00 0.001997 3.73 221.95 6.90 424.26 3.55 218.28
1998 10.66 634.31 10.06 618.57
Averages: 5.01 307.85 12.42 739.11 7.20 442.77 1.01 62.00 0.00 0.00
Blank cells are due to missing/insufficient data.Average = Average Flow for ENTIRE month. Monthly Total = Total Volume used during month.See Methodology section for explanations.Spot data readings used in calculating averages in table on following pages.
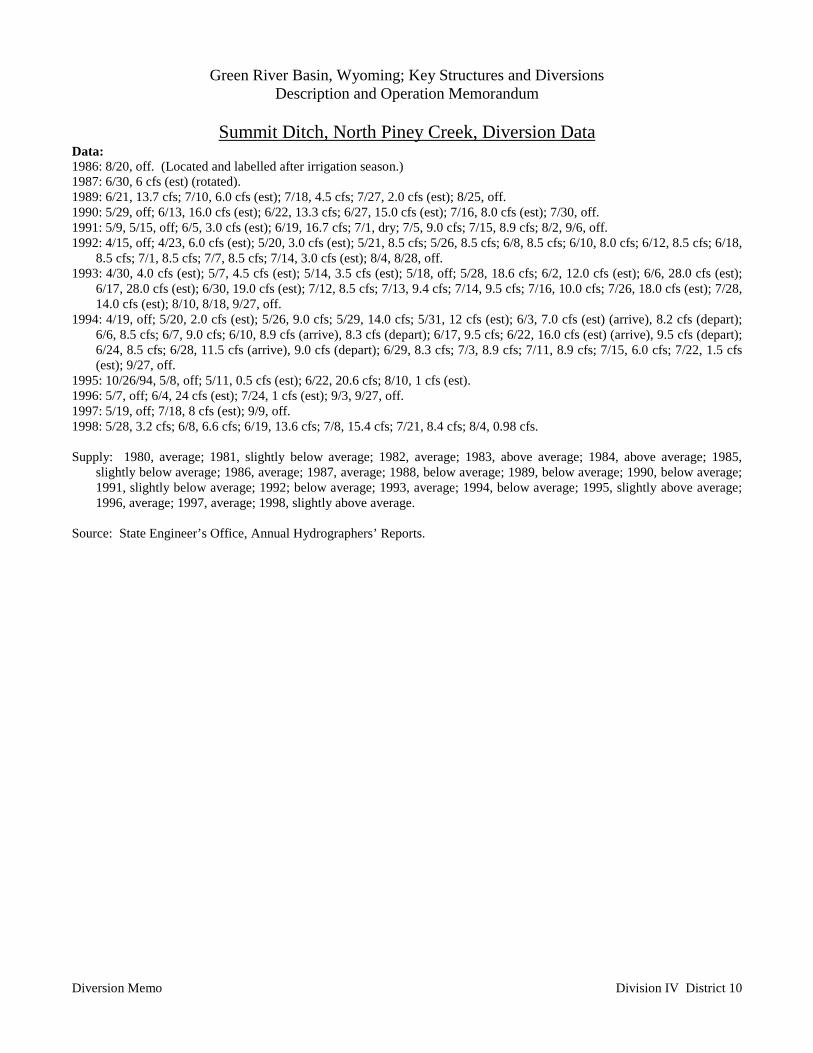
Green River Basin, Wyoming; Key Structures and DiversionsDescription and Operation Memorandum
Summit Ditch, North Piney Creek, Diversion Data
Diversion Memo Division IV District 10
Data:1986: 8/20, off. (Located and labelled after irrigation season.)1987: 6/30, 6 cfs (est) (rotated).1989: 6/21, 13.7 cfs; 7/10, 6.0 cfs (est); 7/18, 4.5 cfs; 7/27, 2.0 cfs (est); 8/25, off.1990: 5/29, off; 6/13, 16.0 cfs (est); 6/22, 13.3 cfs; 6/27, 15.0 cfs (est); 7/16, 8.0 cfs (est); 7/30, off.1991: 5/9, 5/15, off; 6/5, 3.0 cfs (est); 6/19, 16.7 cfs; 7/1, dry; 7/5, 9.0 cfs; 7/15, 8.9 cfs; 8/2, 9/6, off.1992: 4/15, off; 4/23, 6.0 cfs (est); 5/20, 3.0 cfs (est); 5/21, 8.5 cfs; 5/26, 8.5 cfs; 6/8, 8.5 cfs; 6/10, 8.0 cfs; 6/12, 8.5 cfs; 6/18,
8.5 cfs; 7/1, 8.5 cfs; 7/7, 8.5 cfs; 7/14, 3.0 cfs (est); 8/4, 8/28, off.1993: 4/30, 4.0 cfs (est); 5/7, 4.5 cfs (est); 5/14, 3.5 cfs (est); 5/18, off; 5/28, 18.6 cfs; 6/2, 12.0 cfs (est); 6/6, 28.0 cfs (est);
6/17, 28.0 cfs (est); 6/30, 19.0 cfs (est); 7/12, 8.5 cfs; 7/13, 9.4 cfs; 7/14, 9.5 cfs; 7/16, 10.0 cfs; 7/26, 18.0 cfs (est); 7/28,14.0 cfs (est); 8/10, 8/18, 9/27, off.
1994: 4/19, off; 5/20, 2.0 cfs (est); 5/26, 9.0 cfs; 5/29, 14.0 cfs; 5/31, 12 cfs (est); 6/3, 7.0 cfs (est) (arrive), 8.2 cfs (depart);6/6, 8.5 cfs; 6/7, 9.0 cfs; 6/10, 8.9 cfs (arrive), 8.3 cfs (depart); 6/17, 9.5 cfs; 6/22, 16.0 cfs (est) (arrive), 9.5 cfs (depart);6/24, 8.5 cfs; 6/28, 11.5 cfs (arrive), 9.0 cfs (depart); 6/29, 8.3 cfs; 7/3, 8.9 cfs; 7/11, 8.9 cfs; 7/15, 6.0 cfs; 7/22, 1.5 cfs(est); 9/27, off.
1995: 10/26/94, 5/8, off; 5/11, 0.5 cfs (est); 6/22, 20.6 cfs; 8/10, 1 cfs (est).1996: 5/7, off; 6/4, 24 cfs (est); 7/24, 1 cfs (est); 9/3, 9/27, off.1997: 5/19, off; 7/18, 8 cfs (est); 9/9, off.1998: 5/28, 3.2 cfs; 6/8, 6.6 cfs; 6/19, 13.6 cfs; 7/8, 15.4 cfs; 7/21, 8.4 cfs; 8/4, 0.98 cfs.
Supply: 1980, average; 1981, slightly below average; 1982, average; 1983, above average; 1984, above average; 1985,slightly below average; 1986, average; 1987, average; 1988, below average; 1989, below average; 1990, below average;1991, slightly below average; 1992; below average; 1993, average; 1994, below average; 1995, slightly above average;1996, average; 1997, average; 1998, slightly above average.
Source: State Engineer’s Office, Annual Hydrographers’ Reports.
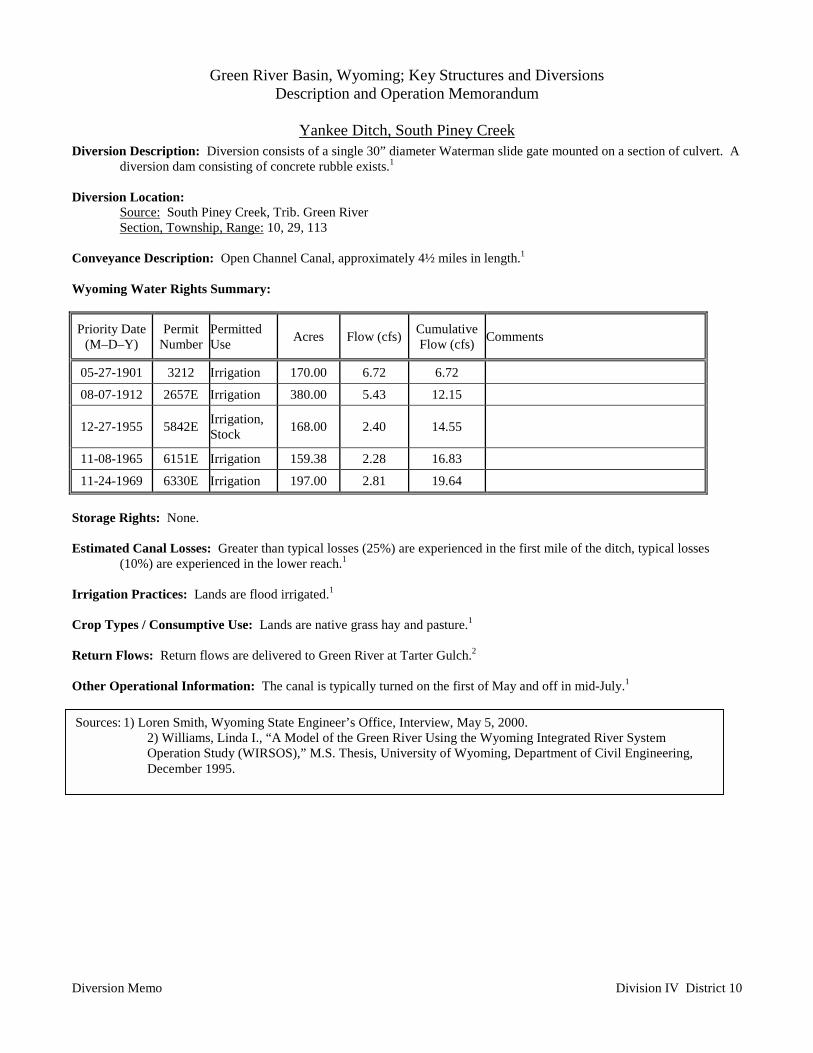
Green River Basin, Wyoming; Key Structures and DiversionsDescription and Operation Memorandum
Yankee Ditch, South Piney Creek
Diversion Memo Division IV District 10
Diversion Description: Diversion consists of a single 30” diameter Waterman slide gate mounted on a section of culvert. Adiversion dam consisting of concrete rubble exists.1
Diversion Location:Source: South Piney Creek, Trib. Green RiverSection, Township, Range: 10, 29, 113
Conveyance Description: Open Channel Canal, approximately 4½ miles in length.1
Wyoming Water Rights Summary:
Priority Date(M–D–Y)
PermitNumber
PermittedUse Acres Flow (cfs) Cumulative
Flow (cfs) Comments
05-27-1901 3212 Irrigation 170.00 6.72 6.72
08-07-1912 2657E Irrigation 380.00 5.43 12.15
12-27-1955 5842E Irrigation,Stock 168.00 2.40 14.55
11-08-1965 6151E Irrigation 159.38 2.28 16.83
11-24-1969 6330E Irrigation 197.00 2.81 19.64
Storage Rights: None.
Estimated Canal Losses: Greater than typical losses (25%) are experienced in the first mile of the ditch, typical losses(10%) are experienced in the lower reach.1
Irrigation Practices: Lands are flood irrigated.1
Crop Types / Consumptive Use: Lands are native grass hay and pasture.1
Return Flows: Return flows are delivered to Green River at Tarter Gulch.2
Other Operational Information: The canal is typically turned on the first of May and off in mid-July.1
Sources: 1) Loren Smith, Wyoming State Engineer’s Office, Interview, May 5, 2000.2) Williams, Linda I., “A Model of the Green River Using the Wyoming Integrated River SystemOperation Study (WIRSOS),” M.S. Thesis, University of Wyoming, Department of Civil Engineering,December 1995.
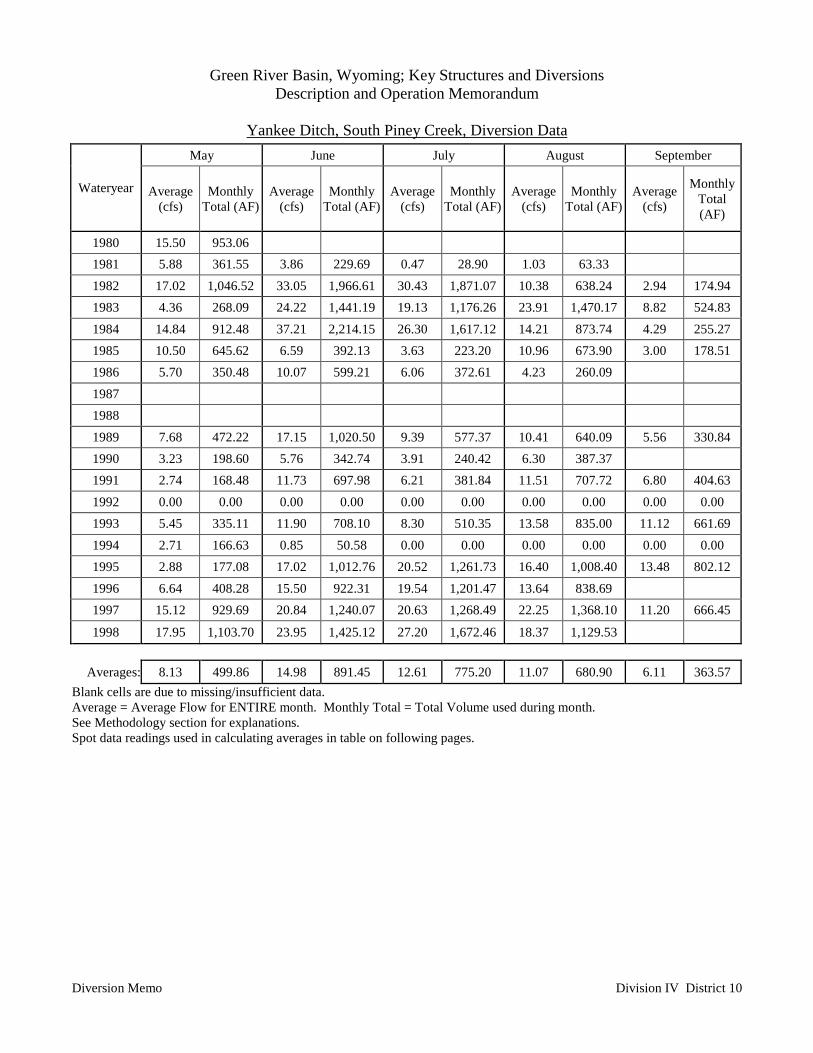
Green River Basin, Wyoming; Key Structures and DiversionsDescription and Operation Memorandum
Yankee Ditch, South Piney Creek, Diversion Data
Diversion Memo Division IV District 10
May June July August September
Wateryear Average(cfs)
MonthlyTotal (AF)
Average(cfs)
MonthlyTotal (AF)
Average(cfs)
MonthlyTotal (AF)
Average(cfs)
MonthlyTotal (AF)
Average(cfs)
MonthlyTotal(AF)
1980 15.50 953.06 1981 5.88 361.55 3.86 229.69 0.47 28.90 1.03 63.33 1982 17.02 1,046.52 33.05 1,966.61 30.43 1,871.07 10.38 638.24 2.94 174.941983 4.36 268.09 24.22 1,441.19 19.13 1,176.26 23.91 1,470.17 8.82 524.831984 14.84 912.48 37.21 2,214.15 26.30 1,617.12 14.21 873.74 4.29 255.271985 10.50 645.62 6.59 392.13 3.63 223.20 10.96 673.90 3.00 178.511986 5.70 350.48 10.07 599.21 6.06 372.61 4.23 260.09 1987 1988 1989 7.68 472.22 17.15 1,020.50 9.39 577.37 10.41 640.09 5.56 330.841990 3.23 198.60 5.76 342.74 3.91 240.42 6.30 387.37 1991 2.74 168.48 11.73 697.98 6.21 381.84 11.51 707.72 6.80 404.631992 0.00 0.00 0.00 0.00 0.00 0.00 0.00 0.00 0.00 0.001993 5.45 335.11 11.90 708.10 8.30 510.35 13.58 835.00 11.12 661.691994 2.71 166.63 0.85 50.58 0.00 0.00 0.00 0.00 0.00 0.001995 2.88 177.08 17.02 1,012.76 20.52 1,261.73 16.40 1,008.40 13.48 802.121996 6.64 408.28 15.50 922.31 19.54 1,201.47 13.64 838.69 1997 15.12 929.69 20.84 1,240.07 20.63 1,268.49 22.25 1,368.10 11.20 666.45
1998 17.95 1,103.70 23.95 1,425.12 27.20 1,672.46 18.37 1,129.53
Averages: 8.13 499.86 14.98 891.45 12.61 775.20 11.07 680.90 6.11 363.57Blank cells are due to missing/insufficient data.Average = Average Flow for ENTIRE month. Monthly Total = Total Volume used during month.See Methodology section for explanations.Spot data readings used in calculating averages in table on following pages.
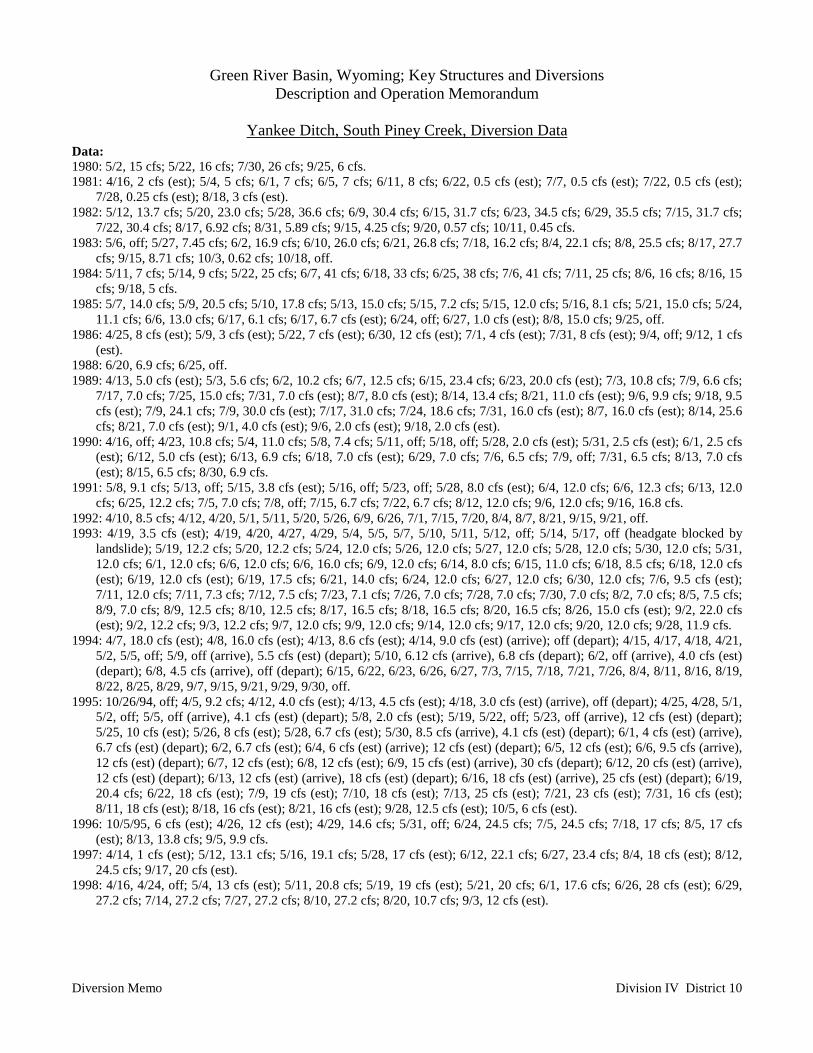
Green River Basin, Wyoming; Key Structures and DiversionsDescription and Operation Memorandum
Yankee Ditch, South Piney Creek, Diversion Data
Diversion Memo Division IV District 10
Data:1980: 5/2, 15 cfs; 5/22, 16 cfs; 7/30, 26 cfs; 9/25, 6 cfs.1981: 4/16, 2 cfs (est); 5/4, 5 cfs; 6/1, 7 cfs; 6/5, 7 cfs; 6/11, 8 cfs; 6/22, 0.5 cfs (est); 7/7, 0.5 cfs (est); 7/22, 0.5 cfs (est);
7/28, 0.25 cfs (est); 8/18, 3 cfs (est).1982: 5/12, 13.7 cfs; 5/20, 23.0 cfs; 5/28, 36.6 cfs; 6/9, 30.4 cfs; 6/15, 31.7 cfs; 6/23, 34.5 cfs; 6/29, 35.5 cfs; 7/15, 31.7 cfs;
7/22, 30.4 cfs; 8/17, 6.92 cfs; 8/31, 5.89 cfs; 9/15, 4.25 cfs; 9/20, 0.57 cfs; 10/11, 0.45 cfs.1983: 5/6, off; 5/27, 7.45 cfs; 6/2, 16.9 cfs; 6/10, 26.0 cfs; 6/21, 26.8 cfs; 7/18, 16.2 cfs; 8/4, 22.1 cfs; 8/8, 25.5 cfs; 8/17, 27.7
cfs; 9/15, 8.71 cfs; 10/3, 0.62 cfs; 10/18, off.1984: 5/11, 7 cfs; 5/14, 9 cfs; 5/22, 25 cfs; 6/7, 41 cfs; 6/18, 33 cfs; 6/25, 38 cfs; 7/6, 41 cfs; 7/11, 25 cfs; 8/6, 16 cfs; 8/16, 15
cfs; 9/18, 5 cfs.1985: 5/7, 14.0 cfs; 5/9, 20.5 cfs; 5/10, 17.8 cfs; 5/13, 15.0 cfs; 5/15, 7.2 cfs; 5/15, 12.0 cfs; 5/16, 8.1 cfs; 5/21, 15.0 cfs; 5/24,
11.1 cfs; 6/6, 13.0 cfs; 6/17, 6.1 cfs; 6/17, 6.7 cfs (est); 6/24, off; 6/27, 1.0 cfs (est); 8/8, 15.0 cfs; 9/25, off.1986: 4/25, 8 cfs (est); 5/9, 3 cfs (est); 5/22, 7 cfs (est); 6/30, 12 cfs (est); 7/1, 4 cfs (est); 7/31, 8 cfs (est); 9/4, off; 9/12, 1 cfs
(est).1988: 6/20, 6.9 cfs; 6/25, off.1989: 4/13, 5.0 cfs (est); 5/3, 5.6 cfs; 6/2, 10.2 cfs; 6/7, 12.5 cfs; 6/15, 23.4 cfs; 6/23, 20.0 cfs (est); 7/3, 10.8 cfs; 7/9, 6.6 cfs;
7/17, 7.0 cfs; 7/25, 15.0 cfs; 7/31, 7.0 cfs (est); 8/7, 8.0 cfs (est); 8/14, 13.4 cfs; 8/21, 11.0 cfs (est); 9/6, 9.9 cfs; 9/18, 9.5cfs (est); 7/9, 24.1 cfs; 7/9, 30.0 cfs (est); 7/17, 31.0 cfs; 7/24, 18.6 cfs; 7/31, 16.0 cfs (est); 8/7, 16.0 cfs (est); 8/14, 25.6cfs; 8/21, 7.0 cfs (est); 9/1, 4.0 cfs (est); 9/6, 2.0 cfs (est); 9/18, 2.0 cfs (est).
1990: 4/16, off; 4/23, 10.8 cfs; 5/4, 11.0 cfs; 5/8, 7.4 cfs; 5/11, off; 5/18, off; 5/28, 2.0 cfs (est); 5/31, 2.5 cfs (est); 6/1, 2.5 cfs(est); 6/12, 5.0 cfs (est); 6/13, 6.9 cfs; 6/18, 7.0 cfs (est); 6/29, 7.0 cfs; 7/6, 6.5 cfs; 7/9, off; 7/31, 6.5 cfs; 8/13, 7.0 cfs(est); 8/15, 6.5 cfs; 8/30, 6.9 cfs.
1991: 5/8, 9.1 cfs; 5/13, off; 5/15, 3.8 cfs (est); 5/16, off; 5/23, off; 5/28, 8.0 cfs (est); 6/4, 12.0 cfs; 6/6, 12.3 cfs; 6/13, 12.0cfs; 6/25, 12.2 cfs; 7/5, 7.0 cfs; 7/8, off; 7/15, 6.7 cfs; 7/22, 6.7 cfs; 8/12, 12.0 cfs; 9/6, 12.0 cfs; 9/16, 16.8 cfs.
1992: 4/10, 8.5 cfs; 4/12, 4/20, 5/1, 5/11, 5/20, 5/26, 6/9, 6/26, 7/1, 7/15, 7/20, 8/4, 8/7, 8/21, 9/15, 9/21, off.1993: 4/19, 3.5 cfs (est); 4/19, 4/20, 4/27, 4/29, 5/4, 5/5, 5/7, 5/10, 5/11, 5/12, off; 5/14, 5/17, off (headgate blocked by
landslide); 5/19, 12.2 cfs; 5/20, 12.2 cfs; 5/24, 12.0 cfs; 5/26, 12.0 cfs; 5/27, 12.0 cfs; 5/28, 12.0 cfs; 5/30, 12.0 cfs; 5/31,12.0 cfs; 6/1, 12.0 cfs; 6/6, 12.0 cfs; 6/6, 16.0 cfs; 6/9, 12.0 cfs; 6/14, 8.0 cfs; 6/15, 11.0 cfs; 6/18, 8.5 cfs; 6/18, 12.0 cfs(est); 6/19, 12.0 cfs (est); 6/19, 17.5 cfs; 6/21, 14.0 cfs; 6/24, 12.0 cfs; 6/27, 12.0 cfs; 6/30, 12.0 cfs; 7/6, 9.5 cfs (est);7/11, 12.0 cfs; 7/11, 7.3 cfs; 7/12, 7.5 cfs; 7/23, 7.1 cfs; 7/26, 7.0 cfs; 7/28, 7.0 cfs; 7/30, 7.0 cfs; 8/2, 7.0 cfs; 8/5, 7.5 cfs;8/9, 7.0 cfs; 8/9, 12.5 cfs; 8/10, 12.5 cfs; 8/17, 16.5 cfs; 8/18, 16.5 cfs; 8/20, 16.5 cfs; 8/26, 15.0 cfs (est); 9/2, 22.0 cfs(est); 9/2, 12.2 cfs; 9/3, 12.2 cfs; 9/7, 12.0 cfs; 9/9, 12.0 cfs; 9/14, 12.0 cfs; 9/17, 12.0 cfs; 9/20, 12.0 cfs; 9/28, 11.9 cfs.
1994: 4/7, 18.0 cfs (est); 4/8, 16.0 cfs (est); 4/13, 8.6 cfs (est); 4/14, 9.0 cfs (est) (arrive); off (depart); 4/15, 4/17, 4/18, 4/21,5/2, 5/5, off; 5/9, off (arrive), 5.5 cfs (est) (depart); 5/10, 6.12 cfs (arrive), 6.8 cfs (depart); 6/2, off (arrive), 4.0 cfs (est)(depart); 6/8, 4.5 cfs (arrive), off (depart); 6/15, 6/22, 6/23, 6/26, 6/27, 7/3, 7/15, 7/18, 7/21, 7/26, 8/4, 8/11, 8/16, 8/19,8/22, 8/25, 8/29, 9/7, 9/15, 9/21, 9/29, 9/30, off.
1995: 10/26/94, off; 4/5, 9.2 cfs; 4/12, 4.0 cfs (est); 4/13, 4.5 cfs (est); 4/18, 3.0 cfs (est) (arrive), off (depart); 4/25, 4/28, 5/1,5/2, off; 5/5, off (arrive), 4.1 cfs (est) (depart); 5/8, 2.0 cfs (est); 5/19, 5/22, off; 5/23, off (arrive), 12 cfs (est) (depart);5/25, 10 cfs (est); 5/26, 8 cfs (est); 5/28, 6.7 cfs (est); 5/30, 8.5 cfs (arrive), 4.1 cfs (est) (depart); 6/1, 4 cfs (est) (arrive),6.7 cfs (est) (depart); 6/2, 6.7 cfs (est); 6/4, 6 cfs (est) (arrive); 12 cfs (est) (depart); 6/5, 12 cfs (est); 6/6, 9.5 cfs (arrive),12 cfs (est) (depart); 6/7, 12 cfs (est); 6/8, 12 cfs (est); 6/9, 15 cfs (est) (arrive), 30 cfs (depart); 6/12, 20 cfs (est) (arrive),12 cfs (est) (depart); 6/13, 12 cfs (est) (arrive), 18 cfs (est) (depart); 6/16, 18 cfs (est) (arrive), 25 cfs (est) (depart); 6/19,20.4 cfs; 6/22, 18 cfs (est); 7/9, 19 cfs (est); 7/10, 18 cfs (est); 7/13, 25 cfs (est); 7/21, 23 cfs (est); 7/31, 16 cfs (est);8/11, 18 cfs (est); 8/18, 16 cfs (est); 8/21, 16 cfs (est); 9/28, 12.5 cfs (est); 10/5, 6 cfs (est).
1996: 10/5/95, 6 cfs (est); 4/26, 12 cfs (est); 4/29, 14.6 cfs; 5/31, off; 6/24, 24.5 cfs; 7/5, 24.5 cfs; 7/18, 17 cfs; 8/5, 17 cfs(est); 8/13, 13.8 cfs; 9/5, 9.9 cfs.
1997: 4/14, 1 cfs (est); 5/12, 13.1 cfs; 5/16, 19.1 cfs; 5/28, 17 cfs (est); 6/12, 22.1 cfs; 6/27, 23.4 cfs; 8/4, 18 cfs (est); 8/12,24.5 cfs; 9/17, 20 cfs (est).
1998: 4/16, 4/24, off; 5/4, 13 cfs (est); 5/11, 20.8 cfs; 5/19, 19 cfs (est); 5/21, 20 cfs; 6/1, 17.6 cfs; 6/26, 28 cfs (est); 6/29,27.2 cfs; 7/14, 27.2 cfs; 7/27, 27.2 cfs; 8/10, 27.2 cfs; 8/20, 10.7 cfs; 9/3, 12 cfs (est).
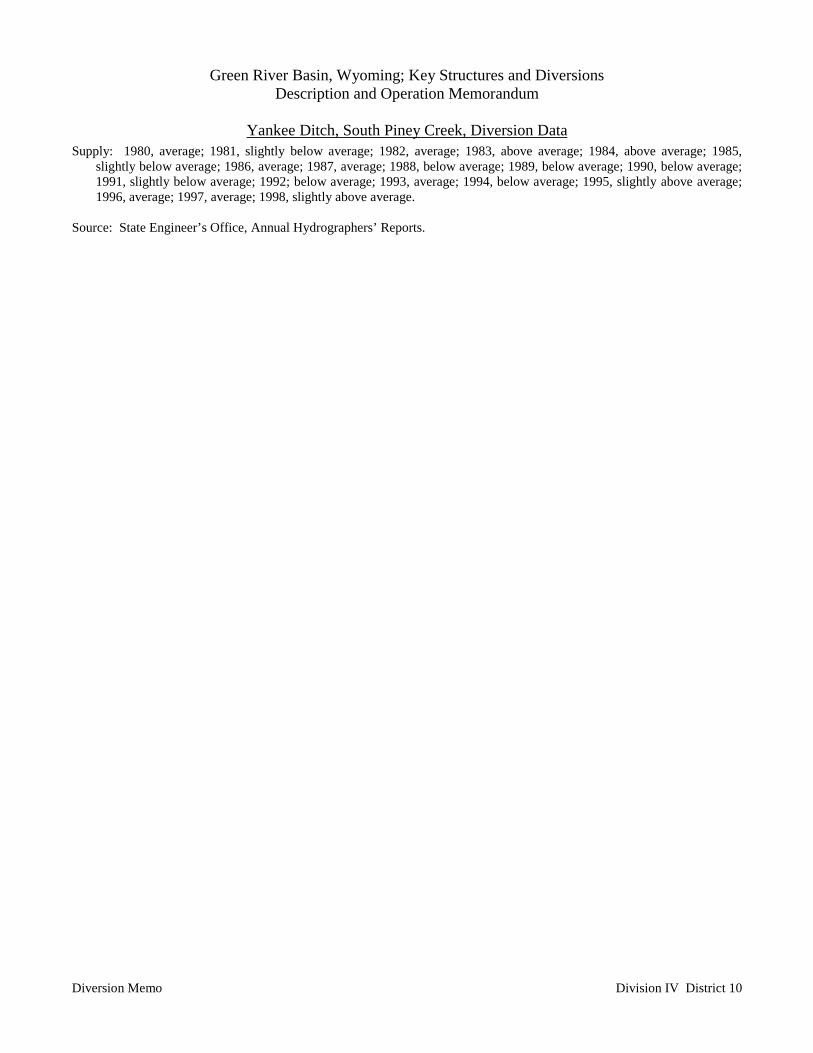
Green River Basin, Wyoming; Key Structures and DiversionsDescription and Operation Memorandum
Yankee Ditch, South Piney Creek, Diversion Data
Diversion Memo Division IV District 10
Supply: 1980, average; 1981, slightly below average; 1982, average; 1983, above average; 1984, above average; 1985,slightly below average; 1986, average; 1987, average; 1988, below average; 1989, below average; 1990, below average;1991, slightly below average; 1992; below average; 1993, average; 1994, below average; 1995, slightly above average;1996, average; 1997, average; 1998, slightly above average.
Source: State Engineer’s Office, Annual Hydrographers’ Reports.
Green River Basin, Wyoming; Key Structures and DiversionsDescription and Operation Memorandum
Yankee Ditch, South Piney Creek, Diversion Data
Diversion Memo Division IV District 10