Embed Size (px)
Citation preview
Water Emissions Accounting In Australia
Preliminary Findings2004-05
Danielle Thomson and Michael Vardon
Centre of Environment and Energy Statistics
Australian Bureau of [email protected]@abs.gov.au
Presentation outline
Brief background on water accounting in Australia
FrameworkWhat is achievable based on currently available data
Preliminary outputShortfalls in current data Issues
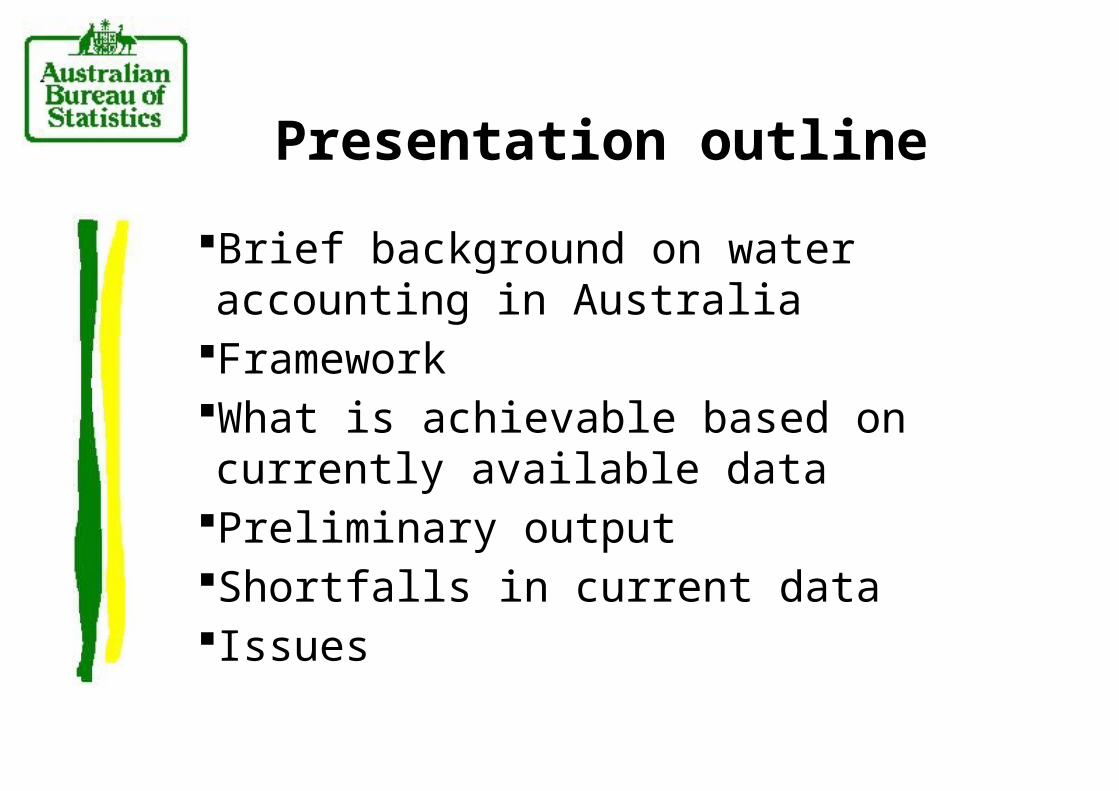
Water Account, Australia• Last released May 2004•Next edition due Nov 2006• Previous edition in 2000• 11 Chapters• Mostly water supply and use in the economy • Plus some information on water stocks, environmental flows and water trading• Data for Australia and for each of the Australian states (except NSW and ACT are combined)
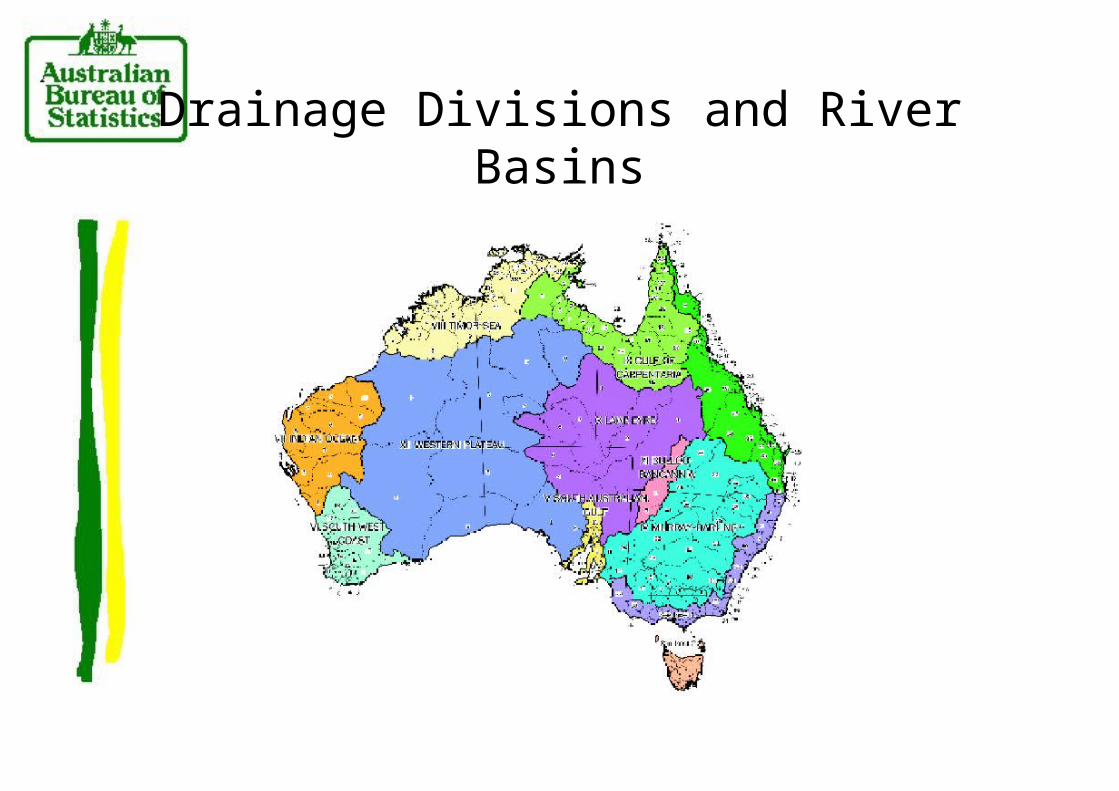
Drainage Divisions and River Basins
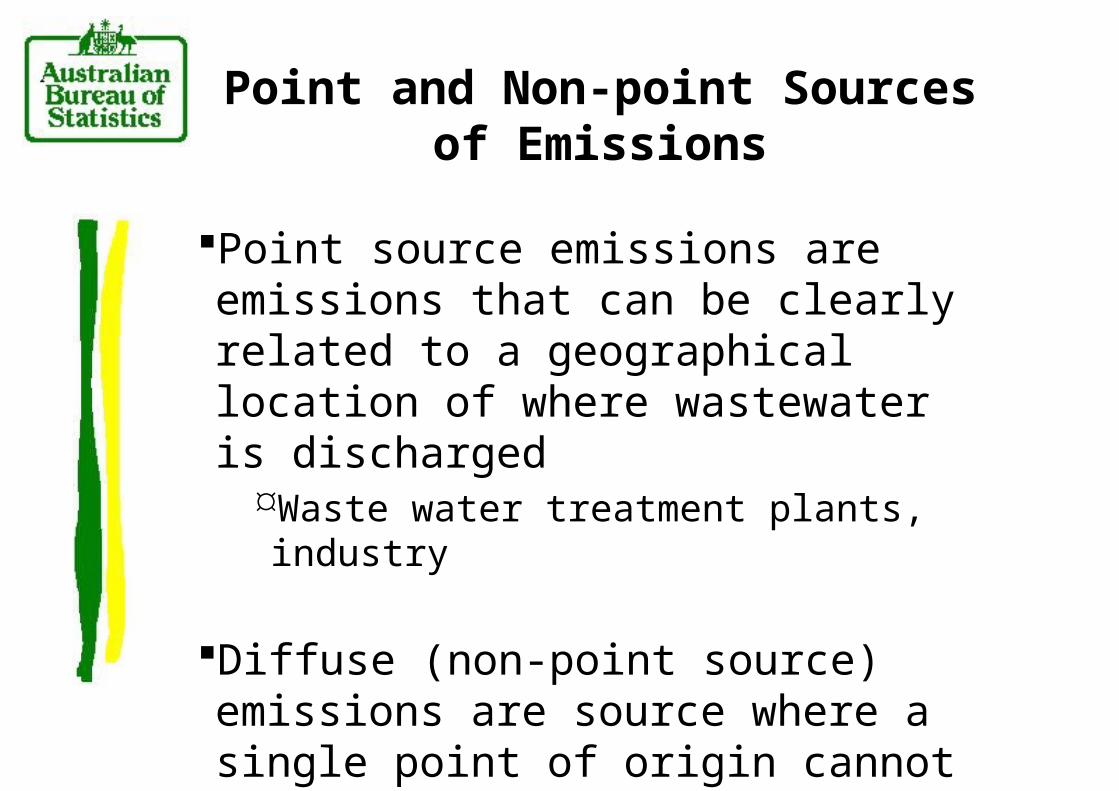
Point and Non-point Sources of Emissions
Point source emissions are emissions that can be clearly related to a geographical location of where wastewater is discharged
Waste water treatment plants, industry
Diffuse (non-point source) emissions are source where a single point of origin cannot be identified
Agriculture, forestry, urban areas
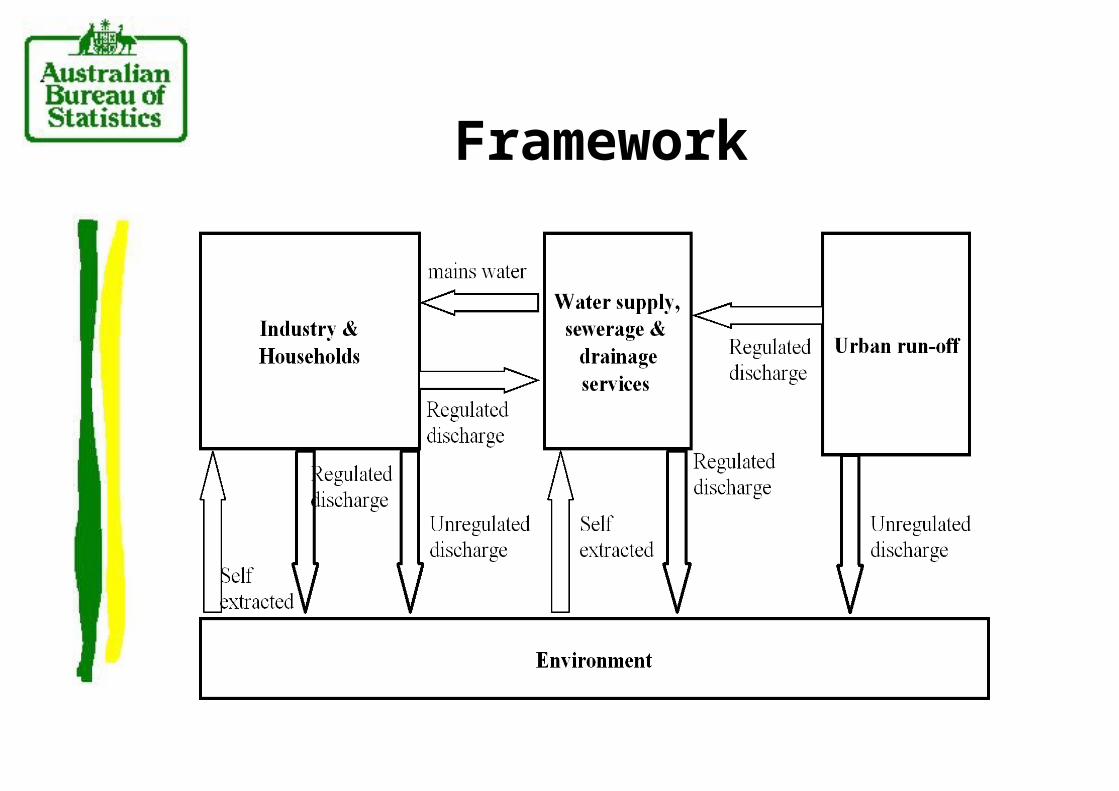
Framework
Method
Based on SEEA frameworkData from National Pollutant Inventory
Reporting on substances based on key elements reported to NPI
Data source:National Pollution Inventory
• Run by department of environment
• Over 3,000 facilities reporting
• Reporting only by facilities that exceed thresholds set by NPI (ie only large polluters required to report)
• Diffuse emissions estimated for particular catchments of interest
Preliminary Output
Point source emissions for Australia for selected substances
State/territory level data for point source emissions to water for phosphorus and nitrogen
Diffuse nutrient emissions to water by catchment
Pollution intensity ratios for selected substances
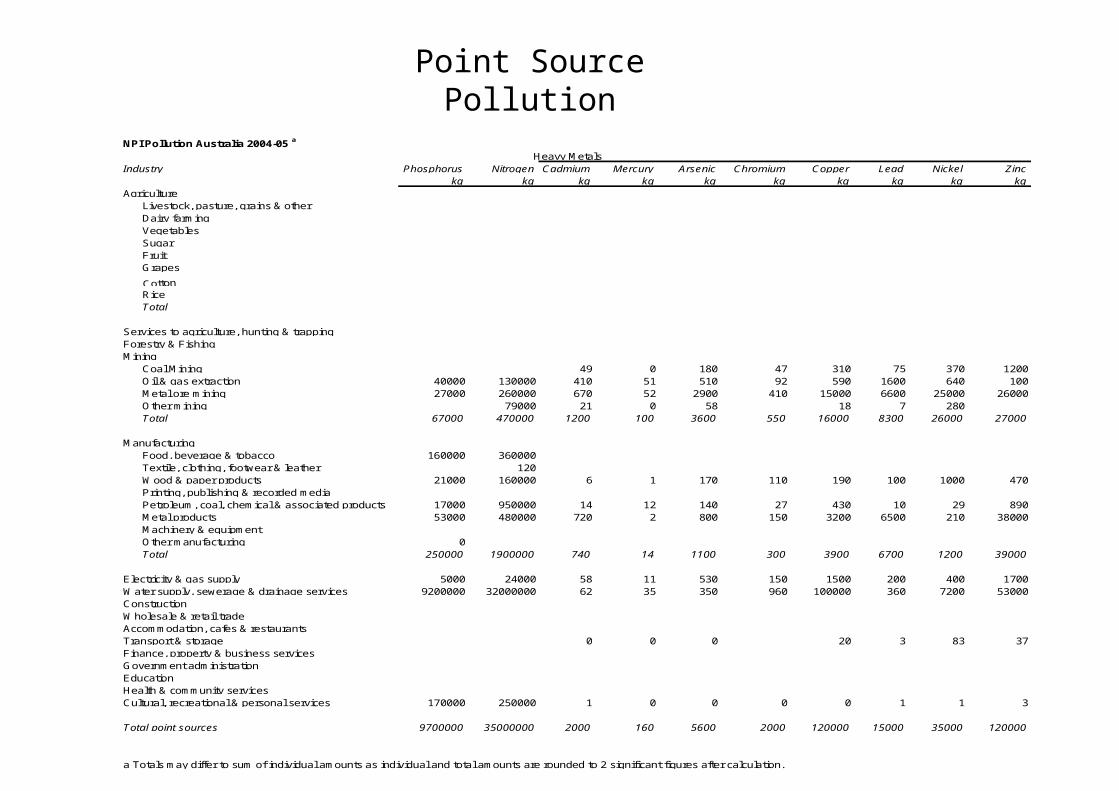
NPI Pollution Australia 2004-05 a
Heavy MetalsIndustry Phosphorus Nitrogen Cadmium Mercury Arsenic Chromium Copper Lead Nickel Zinc
kg kg kg kg kg kg kg kg kg kgAgriculture
Livestock, pasture, grains & otherDairy farmingVegetablesSugarFruitGrapes
RiceTotal
Services to agriculture, hunting & trappingForestry & FishingMining
Coal Mining 49 0 180 47 310 75 370 1200Oil & gas extraction 40000 130000 410 51 510 92 590 1600 640 100Metal ore mining 27000 260000 670 52 2900 410 15000 6600 25000 26000Other mining 79000 21 0 58 18 7 280Total 67000 470000 1200 100 3600 550 16000 8300 26000 27000
ManufacturingFood, beverage & tobacco 160000 360000Textile, clothing, footwear & leather 120Wood & paper products 21000 160000 6 1 170 110 190 100 1000 470Printing, publishing & recorded mediaPetroleum, coal, chemical & associated products 17000 950000 14 12 140 27 430 10 29 890Metal products 53000 480000 720 2 800 150 3200 6500 210 38000Machinery & equipmentOther manufacturing 0Total 250000 1900000 740 14 1100 300 3900 6700 1200 39000
Electricity & gas supply 5000 24000 58 11 530 150 1500 200 400 1700Water supply, sewerage & drainage services 9200000 32000000 62 35 350 960 100000 360 7200 53000ConstructionWholesale & retail tradeAccommodation, cafes & restaurantsTransport & storage 0 0 0 20 3 83 37Finance, property & business servicesGovernment administrationEducationHealth & community servicesCultural, recreational & personal services 170000 250000 1 0 0 0 0 1 1 3
Total point sources 9700000 35000000 2000 160 5600 2000 120000 15000 35000 120000
a Totals may differ to sum of individual amounts as individual and total amounts are rounded to 2 significant figures after calculation.
Point Source Pollution
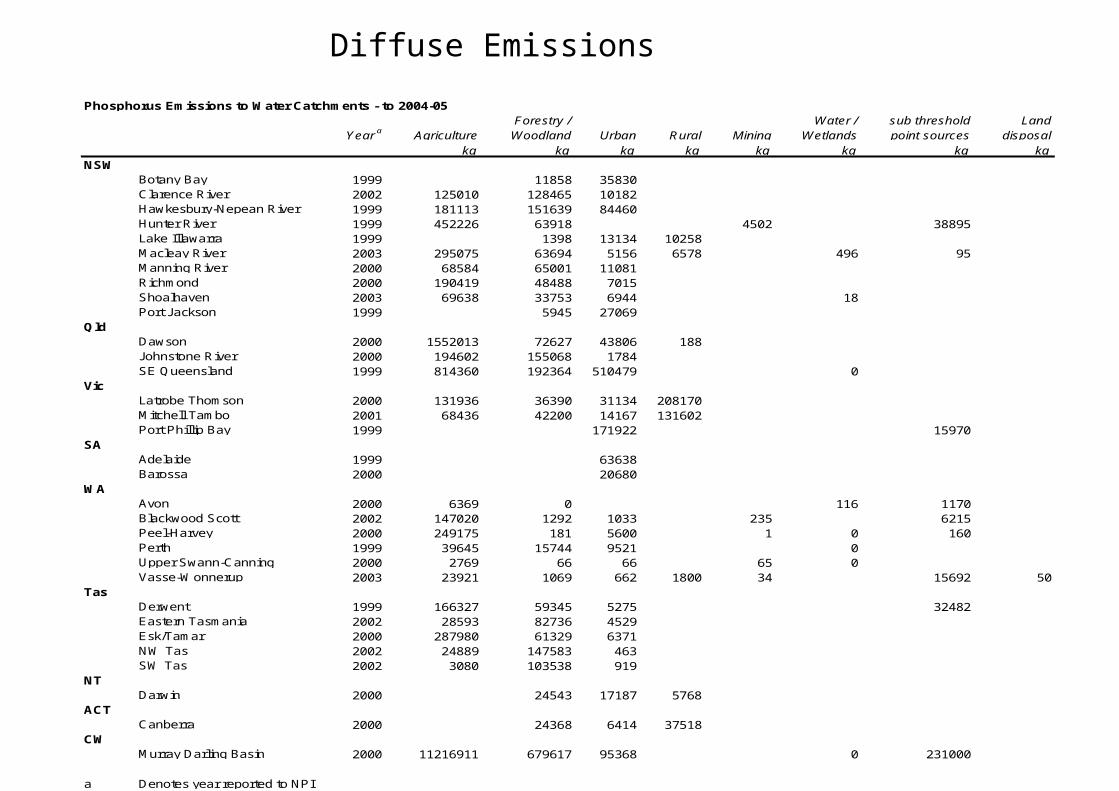
Phosphorus Emissions to Water Catchments - to 2004-05
Year a AgricultureForestry /
Woodland Urban Rural MiningWater /
Wetlandssub threshold point sources
Land disposal
kg kg kg kg kg kg kg kgNSW
Botany Bay 1999 11858 35830Clarence River 2002 125010 128465 10182Hawkesbury-Nepean River 1999 181113 151639 84460Hunter River 1999 452226 63918 4502 38895Lake Illawarra 1999 1398 13134 10258Macleay River 2003 295075 63694 5156 6578 496 95Manning River 2000 68584 65001 11081Richmond 2000 190419 48488 7015Shoalhaven 2003 69638 33753 6944 18Port Jackson 1999 5945 27069
QldDawson 2000 1552013 72627 43806 188Johnstone River 2000 194602 155068 1784SE Queensland 1999 814360 192364 510479 0
VicLatrobe Thomson 2000 131936 36390 31134 208170Mitchell Tambo 2001 68436 42200 14167 131602Port Phillip Bay 1999 171922 15970
SAAdelaide 1999 63638Barossa 2000 20680
WAAvon 2000 6369 0 116 1170Blackwood Scott 2002 147020 1292 1033 235 6215Peel-Harvey 2000 249175 181 5600 1 0 160Perth 1999 39645 15744 9521 0Upper Swann-Canning 2000 2769 66 66 65 0Vasse-Wonnerup 2003 23921 1069 662 1800 34 15692 50
TasDerwent 1999 166327 59345 5275 32482Eastern Tasmania 2002 28593 82736 4529Esk/Tamar 2000 287980 61329 6371NW Tas 2002 24889 147583 463SW Tas 2002 3080 103538 919
NTDarwin 2000 24543 17187 5768
ACTCanberra 2000 24368 6414 37518
CWMurray Darling Basin 2000 11216911 679617 95368 0 231000
a Denotes year reported to NPI
Diffuse Emissions
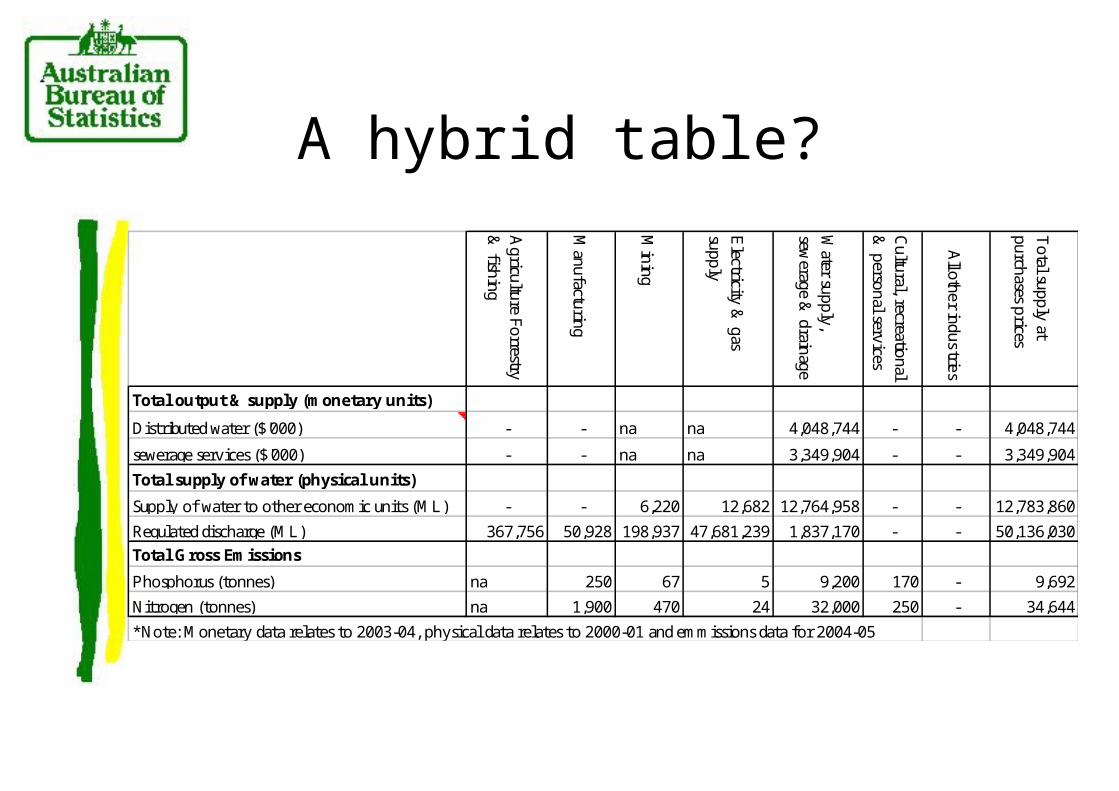
A hybrid table?
Agriculture Forrestry
& fishing
Manufacturing
Mining
Electricity &
gas supply
Water supply,
sewerage &
drainage
Cultural, recreational
& personal services
All other industries
Total supply at
purchases prices
Total output & supply (monetary units)
Distributed water ($'000) - - na na 4,048,744 - - 4,048,744
sewerage services ($'000) - - na na 3,349,904 - - 3,349,904
Total supply of water (physical units)
Supply of water to other economic units (ML) - - 6,220 12,682 12,764,958 - - 12,783,860
Regulated discharge (ML) 367,756 50,928 198,937 47,681,239 1,837,170 - - 50,136,030
Total Gross Emissions
Phosphorus (tonnes) na 250 67 5 9,200 170 - 9,692
Nitrogen (tonnes) na 1,900 470 24 32,000 250 - 34,644
*Note: Monetary data relates to 2003-04, physical data relates to 2000-01 and emmissions data for 2004-05
Phosphorus Nitrogen Cadmium Mercury Arsenic Chromium Copper Lead Nickel Zinc
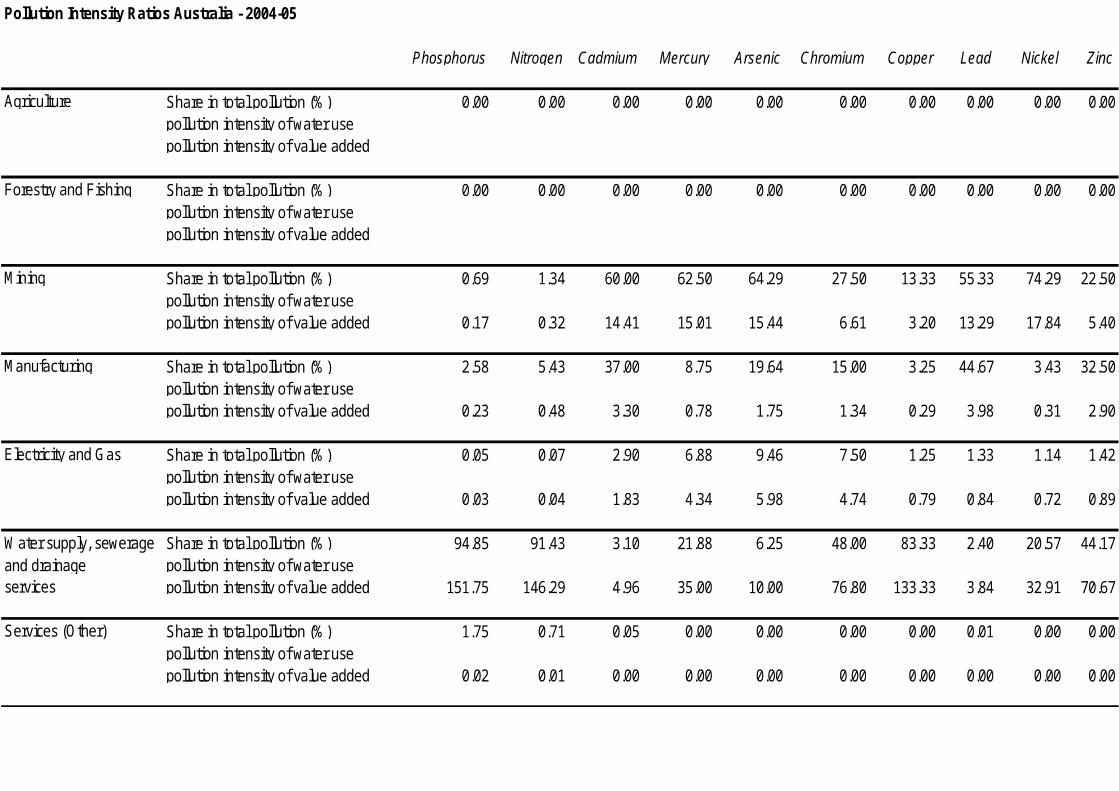
Agriculture Share in total pollution (%) 0.00 0.00 0.00 0.00 0.00 0.00 0.00 0.00 0.00 0.00pollution intensity of water usepollution intensity of value added
Forestry and Fishing Share in total pollution (%) 0.00 0.00 0.00 0.00 0.00 0.00 0.00 0.00 0.00 0.00pollution intensity of water usepollution intensity of value added
Mining Share in total pollution (%) 0.69 1.34 60.00 62.50 64.29 27.50 13.33 55.33 74.29 22.50pollution intensity of water usepollution intensity of value added 0.17 0.32 14.41 15.01 15.44 6.61 3.20 13.29 17.84 5.40
Manufacturing Share in total pollution (%) 2.58 5.43 37.00 8.75 19.64 15.00 3.25 44.67 3.43 32.50pollution intensity of water usepollution intensity of value added 0.23 0.48 3.30 0.78 1.75 1.34 0.29 3.98 0.31 2.90
Electricity and Gas Share in total pollution (%) 0.05 0.07 2.90 6.88 9.46 7.50 1.25 1.33 1.14 1.42pollution intensity of water usepollution intensity of value added 0.03 0.04 1.83 4.34 5.98 4.74 0.79 0.84 0.72 0.89
Share in total pollution (%) 94.85 91.43 3.10 21.88 6.25 48.00 83.33 2.40 20.57 44.17pollution intensity of water use
services pollution intensity of value added 151.75 146.29 4.96 35.00 10.00 76.80 133.33 3.84 32.91 70.67
Services (Other) Share in total pollution (%) 1.75 0.71 0.05 0.00 0.00 0.00 0.00 0.01 0.00 0.00pollution intensity of water usepollution intensity of value added 0.02 0.01 0.00 0.00 0.00 0.00 0.00 0.00 0.00 0.00
Pollution Intensity Ratios Australia - 2004-05
Water supply, sewerage and drainage
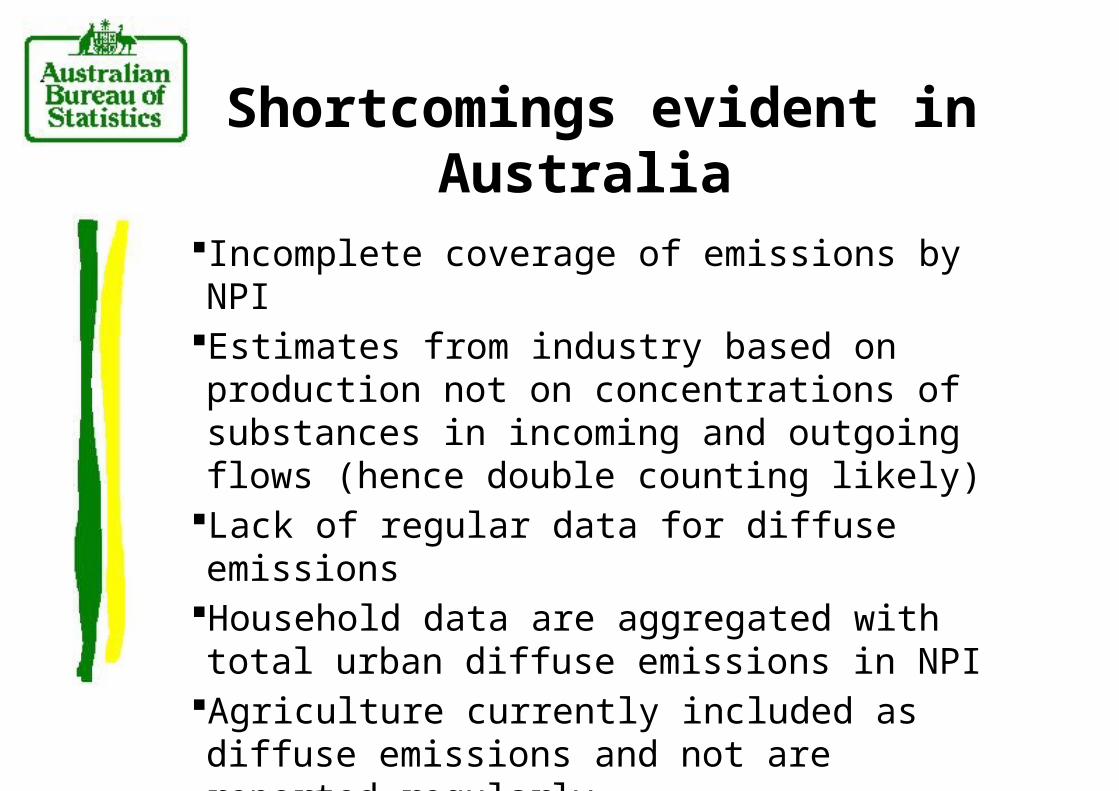
Shortcomings evident in Australia
Incomplete coverage of emissions by NPIEstimates from industry based on production not on concentrations of substances in incoming and outgoing flows (hence double counting likely)
Lack of regular data for diffuse emissionsHousehold data are aggregated with total urban diffuse emissions in NPI
Agriculture currently included as diffuse emissions and not are reported regularly
Issues
• How to work effectively with other agencies to ensure better data quality
• Need to recognise that a complete for Australia is not required (ie water pollution/water quality are not an issue for much of Australia
• Need to improve links between water emissions, water quality and river health