Embed Size (px)
Citation preview
Malaysian Journal of Mathematical Sciences 7(1): 1-15 (2013)
Water Level Trend in the Barind Area
1A.H.M. Rahmatullah Imon and
2Mushfique Ahmed
1Department of Mathematical Sciences,
Ball State University,
Muncie, Indiana, IN 47306, USA
2Department of Geology and Mining
University of Rajshahi
Rajshahi-6205, Bangladesh
E-mail: [email protected] and [email protected]
ABSTRACT
The water level trend, using monthly data of 50 observation wells − 2 in each of the 25 upazillas under Barind Multipurpose Development Authority command area in the district of Rajshahi, Bangladesh − was analyzed for the period of 1986-2004. To
determine the lean season maximum and wet season minimum trends, depth to water level was regressed over the time span a 5-year moving average instead of raw data was employed in formulating the regression equation. The slope or inclination of the regression equation, which indicated the trend of depth to water level, was mapped. A composite trend map, combining both the maximum and minimum depths, was presented that delineated distinct zones with regards to their potentiality in the Barind area. About 2/3 of the area showed gradual fall in the water level both in dry and wet seasons. Most of the remaining area, situated in the west, east and south
east, experienced lowing of the water level either in the post monsoon season or during the lean period. Only small areas in Shibganj and Gomastapur in the west and Naogaon in the east exhibited a rise in water level. Keywords: Water level, Trend, Smoothing, Nonparametric regression, Moving average regression, Contour map, Composite trend map.
1. INTRODUCTION
The Barind Tract, located in the northwest Bangladesh, is a hard
red-soil area characterized by an elevated landscape with a relatively harsh
climate. Because of its topographic setting, the surface water resource of
this area is also limited. Compared to the rest of the country, it has higher temperature and evaporation. The annual precipitation of this dry land is the
lowest in Bangladesh. The Tract, however, is endowed with one of the most
fertile soils of the country – suitable for growing all types of crop. In addition, owing to the elevated topography it is blessed by the nature as
being comparatively free form inundation by the annual flood that the rest
of the country experiences. It is also secured from ravages caused by cyclones every year elsewhere in Bangladesh. Moreover, the Brined Tract is
A.H.M. Rahmatullah Imon & Mushfique Ahmed
2 Malaysian Journal of Mathematical Sciences
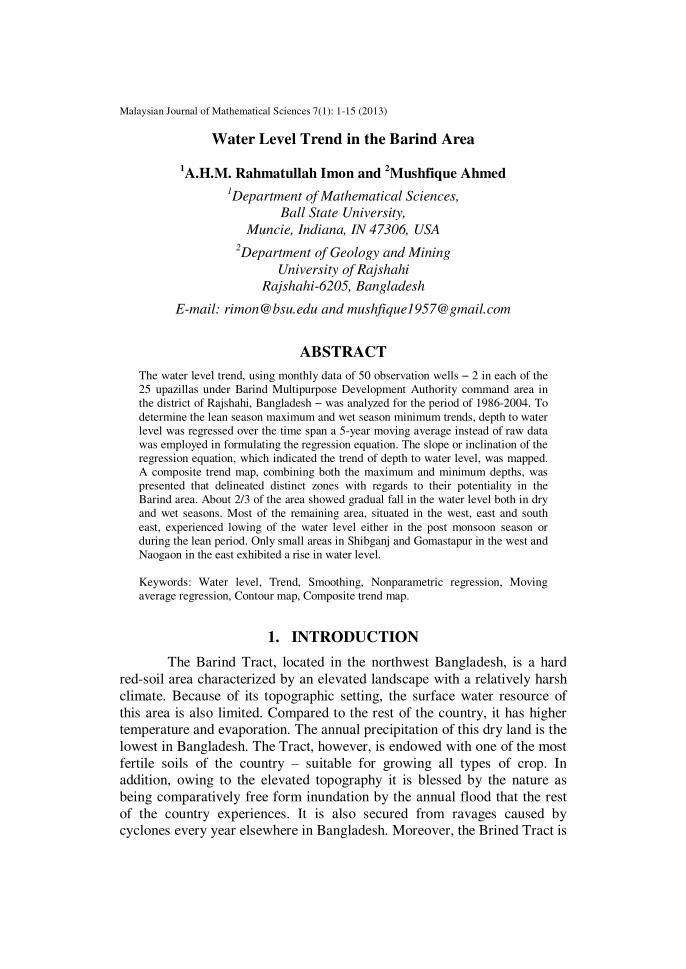
virtually safe from arsenic hazard that the country is currently facing. On the other hand, scarcity of surface water and lower rainfall compounded
with higher temperature and evapotranspiration had rendered this land
agriculturally backward. The entire tract had literally been a mono-cropped land with a cropping intensity of only 117%.
Figure 1: The Barind area
Water Level Trend in the Barind Area
Malaysian Journal of Mathematical Sciences 3
To bring the Tract under irrigation, the Barind Integrated Area Development Project (BIADP) was undertaken in 1985. The
implementation of the project, through Bangladesh Agriculture
Development Corporation (BADC), began in 1986 in 14 upazillas of greater Rajshahi District. In 1992 a separate organization – the Barind
Multipurpose Development Authority (BMDA) was formed to carry on
with the project in its 2nd
phase. Presently much larger area of the Barind
Tract and its vicinity has been incorporated in the BMDA. The area now
comprises a total 25 upazillas of greater Rajshahi District between 24°23′-
25°15′ latitude and 88°02′- 88°57′ longitude (Figure 1). The area under
BMDA is about 0.77 million hectares of which 0.6 hectares (76%) cultivable. Till date more than 1/4 of the total cultivable land has been
brought under irrigation coverage – the principal source of which is
groundwater (see Jahan et al. (2004)).
So far, the BMDA has installed 6,682 Deep Tube Wells (DTWs) in its command area (BMDA, 2002). To extend the irrigation coverage even
further, more DTWs are currently being sunk; and still more are in the
pipeline. On the basis of overall recharge conditions, a study by the Master
Plan Organization (MPO)/Groundwater Circle of Bangladesh Water Development Board (BWDB)/Sir M. McDonald and Partners found that the
total number of (2 cusec) DTWs feasible for the areas was 8,827 [see
BMDA (2001) cited in Jahan et al. (2004)]. It appears that the BMDA has been eyeing on this ad hoc estimate as their target. Meanwhile, however,
concerns are being raised against the ever-increasing utilization of
groundwater on the apprehension that we might already have reached the extraction limit of this valuable resource (e.g. Jahan (1997); BWDB
(1992)).
Scarce surface waters have made groundwater the principal source
for irrigation in the Barind. However, groundwater is also limited as there
exist constraints for its development. Of these, the utmost is the groundwater availability in the area for safe extraction in terms of yearly
groundwater recharge. Only annual renewable groundwater recharge
represented by the present maximum (dry season) and minimum (wet season) depths to groundwater level is defined as the safe extraction.
Potential in the storage occurring below the maximum depth to water level
is not be considered as withdrawal from storage would, in fact, mean
mining this natural endowment out like a non-renewable resource. The paper attempts to analyze the trend of groundwater level in the Barind area.
The characteristics of both maximum and minimum depths to groundwater
level will be looked into in detail.
A.H.M. Rahmatullah Imon & Mushfique Ahmed
4 Malaysian Journal of Mathematical Sciences
2. GEOLOGICAL ASPECTS
In this section we briefly discuss two geological aspects, hydrology
and climate of the Barind area.
Hydrogeology
The study area is characterized by the north-south dome-shaped uplifted
undulatory land in the central Barind Tract with a maximum elevation of 45 m above Mean Sea Level (MSL) (see Jahan and Ahmed (1997)). The
central Barind Tract slopes both to the west and east with a gradient of 0.94
m/km (see BWDB (1989)). The western and northern parts of the area are undulatory, while the east and southeast are plane land. Floodplains of the
rivers: Padma (Ganges), Mahananda, Atrai, Punarbhaba, etc. flowing
through the Tract constitute about 46% of the total area (see Jahan and
Ahmed (1997)).
The Barind area has a complex geological setup with heterogeneous
lithology. It is dissected into several morphological blocks by numerous faults and lineaments. Hydrogeologically, the uplifted blocks are made up
of older sediments with the intervening valleys of recent alluvium. The top
sandy to silty-clay and fine sand forms the upper Aquitard of the area. The
Pleistocene Modhupur Clay below constitutes the Composite Aquifer with a thickness of 10-60 m, which is the highest in the structurally elevated
central horst block. Underlying the Composite Aquifer is the Main Aquifer
composed of fine to coarse sand with gravel of Pleistocene Dupi Tila Formation (see Jahan and Ahmed (1997)).
Climate
Although receives considerably less rainfall, the Barind area still
experiences typical tropical monsoon climate and enjoys substantial amount
of rainfall during June-October. With retreating monsoon in late October,
groundwater recharge practically stops as rainfall – the principal source gradually wanes and ceases. November-February period is dry and cool
with almost no precipitation. With increasing evapotranspiration, as soil
loses moisture groundwater level gradually starts falling. March heralds in by pushing the mercury upward along with the groundwater abstraction.
Consequently, the lowering of water level accelerates and the groundwater
level hits its bottom limit – the maximum depth to water level. The Barind Tract endures high temperature in March-May period. June arrives with the
monsoon rainfall and the water level begins to recharge again; the process
continues throughout the entire post monsoon period. The aquifer fills itself
Water Level Trend in the Barind Area
Malaysian Journal of Mathematical Sciences 5
to the fullest just as the monsoon phases out. The groundwater level reaches its top limit closest to the land surface – the minimum depth to water level.
Records of Bangladesh Meteorological Department (BMD) show that the
temperature of the Barind varies from 5° to 45° C with a mean of 25.5° C.
Humidity is minimum (40%-70%) in winter and at the beginning of pre-monsoon. During the rest of the year, it is higher – varying from 70% to
100%. As per Bangladesh Water Development Board (BWDB) data, the
annual evaporation of the area ranges from 370 mm to 1120 mm.
3. DATA AND METHODS
The database for the present study constitutes the depth to water
level of observation wells at 50 Permanent Hydrographic Stations (PHS) in
the Barind area. These wells, two in each of the 25 upazillas under BMDA command area, routinely collect the depth to water level measured below
ground surface. Monthly water level data of observation wells from all 50
PHS for the period 1986-2004 was analyzed in this study. The data was
processed to obtain the maximum and minimum depths to water level. To determine the trends, water level was regressed over the time span. A
simple linear regression analysis was performed with water level as the
dependent variable and time the independent one using the Ordinary Least Square (OLS) method, which simply computes the ‘‘best” fit line through
the data. Jahan et al. (2004) and Hassan (2005) did exactly similar study
with the same data set but they employed the raw data for their regression analyses that generally yielded very low R-sq and insignificant impact of
the trend over time in almost all of the cases and those results are not shown
for brevity.
For this type of time series data there is evidence (Ryan (1997)) that
the OLS method often can produce poor fits. A number of nonparametric
and smoothing techniques are available in the literature (see Ryan (1997), Chatterjee and Hadi (2006), Montgomery et al. (2008)) to produce better fit
when the OLS fails to do so and since this is a time series data we believe
that the moving average regression will be a much better choice. We
employ a five-year moving average instead of raw data in formulating the regression equation in order to obtain more significant results in terms of
coefficient of determination (R-sq) and the corresponding probability (p-
value).
A.H.M. Rahmatullah Imon & Mushfique Ahmed
6 Malaysian Journal of Mathematical Sciences
The slope or inclination of the regression equation would indicate the trend of depth to water level: a positive value would mean an increasing
trend while a negative would suggest a decreasing trend. The larger the
magnitude of the slope, the higher the increase or decrease is. A zero magnitude slope stands for no change.
Trend maps of water level of the Barind for both maximum and
minimum depths were constructed. Combining these two, a composite trend map of the area was also prepared in order to delineate distinct zones with
regard to their groundwater potentiality.
4. RESULTS AND DISCUSSION
The regression analyses of data from all 50 PHS show that the slope of the maximum and minimum equations vary from -0.14 to 0.71 and -0.16
to 0.4 respectively. That means, on a yearly basis, the maximum depth to
water level varies from 0.14m decrease to 0.71m increase while the minimum level from 0.16m decrease to 0.4m increase. The slopes of
regression line together with p-value and R-sq of both maximum and
minimum depth to water level equations are listed in Table-1. The results
are generally significant in terms of coefficient of determination and p-value of the slope of the moving average regression. As we have already
mentioned that Jahan et al. (2004) and Hassan (2005) reported that almost
every least squares regression is insignificant for this data but the moving average regression as given in Table 1 show some stunning results. For the
maximum depth of water level 36 out of 50 PHS’s (72% of the stations)
show significant trend at the 5% level and at the 10% level this number is 38. For the minimum depth of water level 27 out of 50 PHS’s show
significant trend at the 5% level while this number is 29 at the 10% level.
These results clearly show the advantage of using the moving average
regression over the least squares for this type of data.
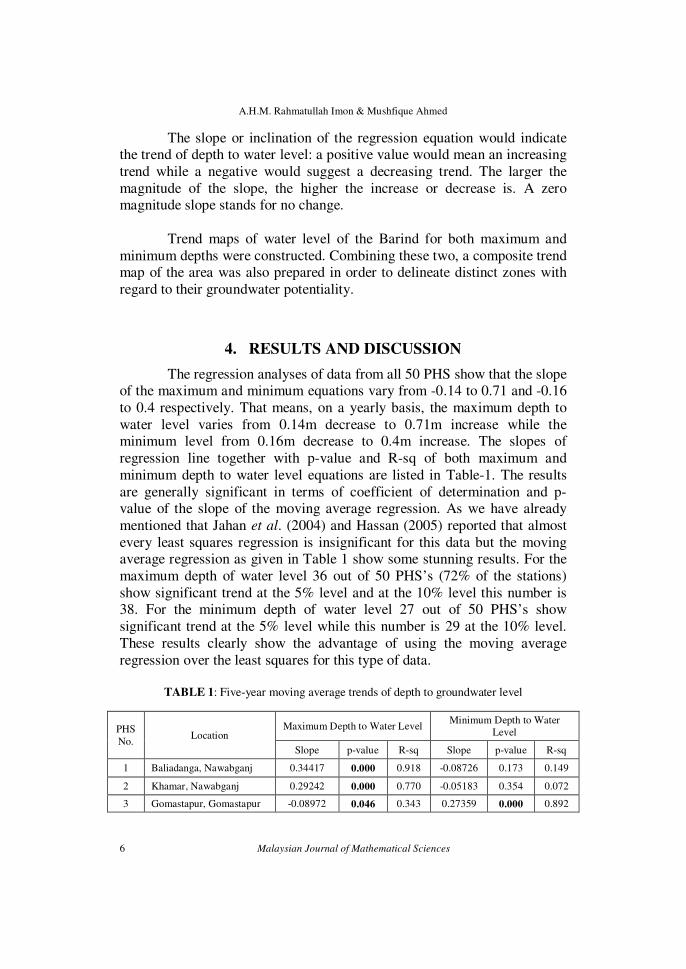
TABLE 1: Five-year moving average trends of depth to groundwater level
PHS
No. Location
Maximum Depth to Water Level Minimum Depth to Water
Level
Slope p-value R-sq Slope p-value R-sq
1 Baliadanga, Nawabganj 0.34417 0.000 0.918 -0.08726 0.173 0.149
2 Khamar, Nawabganj 0.29242 0.000 0.770 -0.05183 0.354 0.072
3 Gomastapur, Gomastapur -0.08972 0.046 0.343 0.27359 0.000 0.892
Water Level Trend in the Barind Area
Malaysian Journal of Mathematical Sciences 7
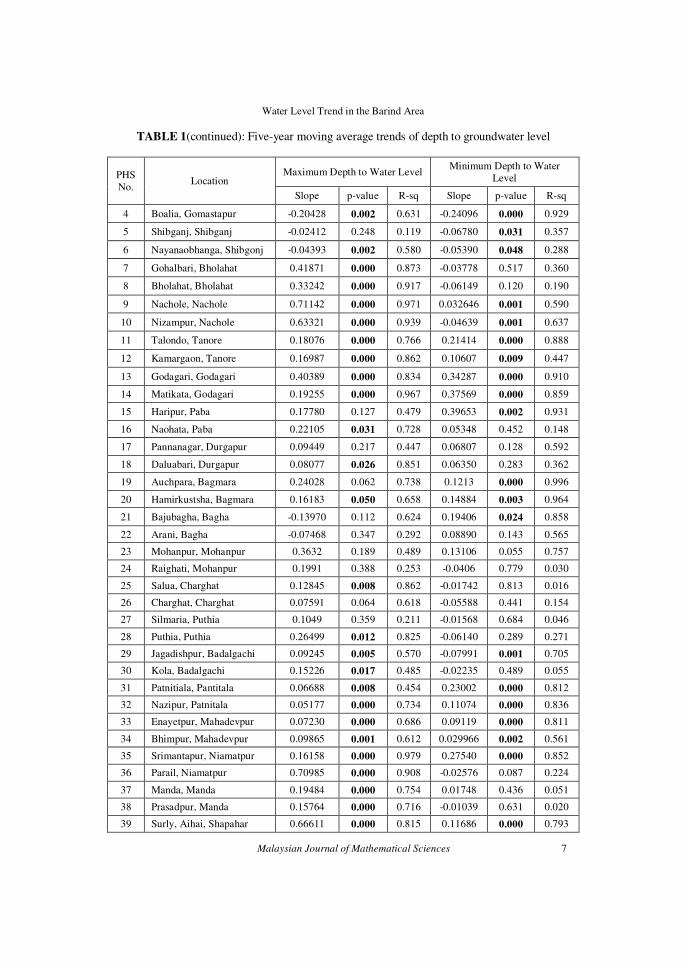
TABLE 1(continued): Five-year moving average trends of depth to groundwater level
PHS
No. Location
Maximum Depth to Water Level Minimum Depth to Water
Level
Slope p-value R-sq Slope p-value R-sq
4 Boalia, Gomastapur -0.20428 0.002 0.631 -0.24096 0.000 0.929
5 Shibganj, Shibganj -0.02412 0.248 0.119 -0.06780 0.031 0.357
6 Nayanaobhanga, Shibgonj -0.04393 0.002 0.580 -0.05390 0.048 0.288
7 Gohalbari, Bholahat 0.41871 0.000 0.873 -0.03778 0.517 0.360
8 Bholahat, Bholahat 0.33242 0.000 0.917 -0.06149 0.120 0.190
9 Nachole, Nachole 0.71142 0.000 0.971 0.032646 0.001 0.590
10 Nizampur, Nachole 0.63321 0.000 0.939 -0.04639 0.001 0.637
11 Talondo, Tanore 0.18076 0.000 0.766 0.21414 0.000 0.888
12 Kamargaon, Tanore 0.16987 0.000 0.862 0.10607 0.009 0.447
13 Godagari, Godagari 0.40389 0.000 0.834 0.34287 0.000 0.910
14 Matikata, Godagari 0.19255 0.000 0.967 0.37569 0.000 0.859
15 Haripur, Paba 0.17780 0.127 0.479 0.39653 0.002 0.931
16 Naohata, Paba 0.22105 0.031 0.728 0.05348 0.452 0.148
17 Pannanagar, Durgapur 0.09449 0.217 0.447 0.06807 0.128 0.592
18 Daluabari, Durgapur 0.08077 0.026 0.851 0.06350 0.283 0.362
19 Auchpara, Bagmara 0.24028 0.062 0.738 0.1213 0.000 0.996
20 Hamirkustsha, Bagmara 0.16183 0.050 0.658 0.14884 0.003 0.964
21 Bajubagha, Bagha -0.13970 0.112 0.624 0.19406 0.024 0.858
22 Arani, Bagha -0.07468 0.347 0.292 0.08890 0.143 0.565
23 Mohanpur, Mohanpur 0.3632 0.189 0.489 0.13106 0.055 0.757
24 Raighati, Mohanpur 0.1991 0.388 0.253 -0.0406 0.779 0.030
25 Salua, Charghat 0.12845 0.008 0.862 -0.01742 0.813 0.016
26 Charghat, Charghat 0.07591 0.064 0.618 -0.05588 0.441 0.154
27 Silmaria, Puthia 0.1049 0.359 0.211 -0.01568 0.684 0.046
28 Puthia, Puthia 0.26499 0.012 0.825 -0.06140 0.289 0.271
29 Jagadishpur, Badalgachi 0.09245 0.005 0.570 -0.07991 0.001 0.705
30 Kola, Badalgachi 0.15226 0.017 0.485 -0.02235 0.489 0.055
31 Patnitiala, Pantitala 0.06688 0.008 0.454 0.23002 0.000 0.812
32 Nazipur, Patnitala 0.05177 0.000 0.734 0.11074 0.000 0.836
33 Enayetpur, Mahadevpur 0.07230 0.000 0.686 0.09119 0.000 0.811
34 Bhimpur, Mahadevpur 0.09865 0.001 0.612 0.029966 0.002 0.561
35 Srimantapur, Niamatpur 0.16158 0.000 0.979 0.27540 0.000 0.852
36 Parail, Niamatpur 0.70985 0.000 0.908 -0.02576 0.087 0.224
37 Manda, Manda 0.19484 0.000 0.754 0.01748 0.436 0.051
38 Prasadpur, Manda 0.15764 0.000 0.716 -0.01039 0.631 0.020
39 Surly, Aihai, Shapahar 0.66611 0.000 0.815 0.11686 0.000 0.793
A.H.M. Rahmatullah Imon & Mushfique Ahmed
8 Malaysian Journal of Mathematical Sciences
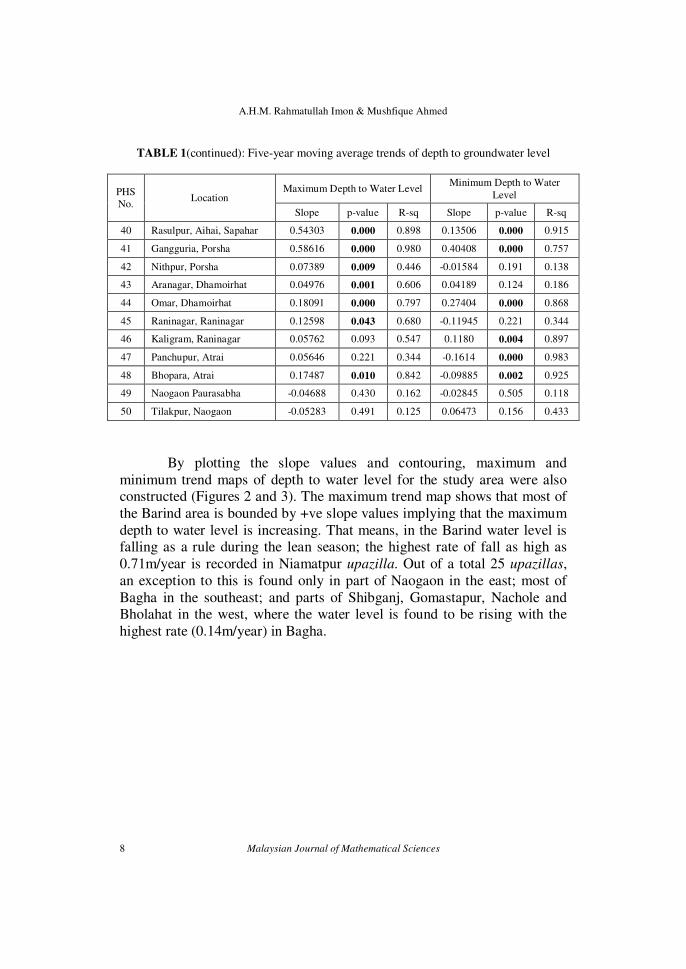
TABLE 1(continued): Five-year moving average trends of depth to groundwater level
PHS
No. Location
Maximum Depth to Water Level Minimum Depth to Water
Level
Slope p-value R-sq Slope p-value R-sq
40 Rasulpur, Aihai, Sapahar 0.54303 0.000 0.898 0.13506 0.000 0.915
41 Gangguria, Porsha 0.58616 0.000 0.980 0.40408 0.000 0.757
42 Nithpur, Porsha 0.07389 0.009 0.446 -0.01584 0.191 0.138
43 Aranagar, Dhamoirhat 0.04976 0.001 0.606 0.04189 0.124 0.186
44 Omar, Dhamoirhat 0.18091 0.000 0.797 0.27404 0.000 0.868
45 Raninagar, Raninagar 0.12598 0.043 0.680 -0.11945 0.221 0.344
46 Kaligram, Raninagar 0.05762 0.093 0.547 0.1180 0.004 0.897
47 Panchupur, Atrai 0.05646 0.221 0.344 -0.1614 0.000 0.983
48 Bhopara, Atrai 0.17487 0.010 0.842 -0.09885 0.002 0.925
49 Naogaon Paurasabha -0.04688 0.430 0.162 -0.02845 0.505 0.118
50 Tilakpur, Naogaon -0.05283 0.491 0.125 0.06473 0.156 0.433
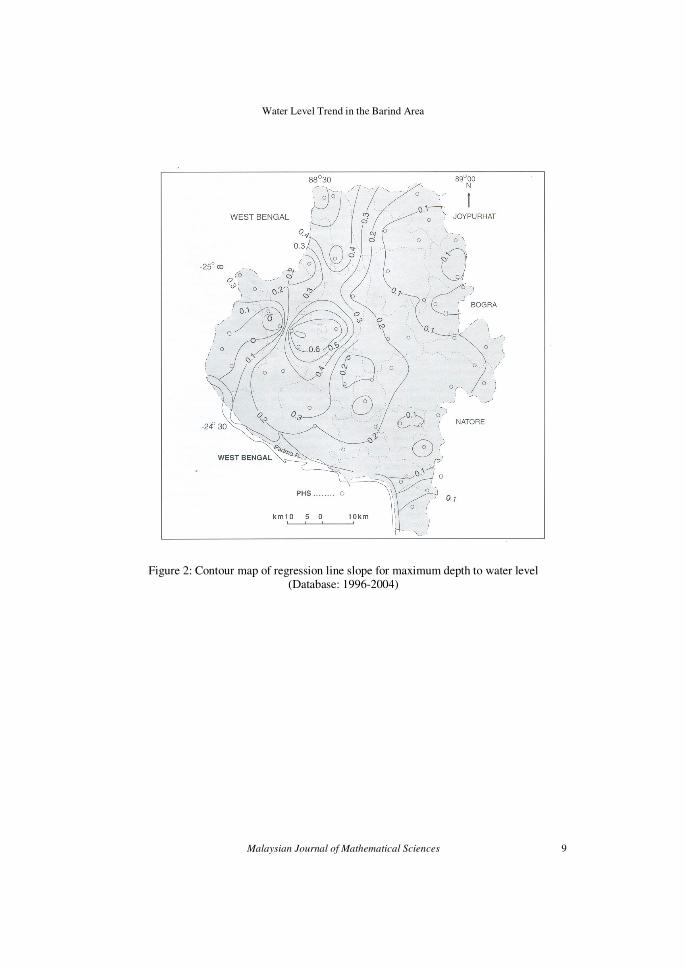
By plotting the slope values and contouring, maximum and
minimum trend maps of depth to water level for the study area were also constructed (Figures 2 and 3). The maximum trend map shows that most of
the Barind area is bounded by +ve slope values implying that the maximum
depth to water level is increasing. That means, in the Barind water level is falling as a rule during the lean season; the highest rate of fall as high as
0.71m/year is recorded in Niamatpur upazilla. Out of a total 25 upazillas,
an exception to this is found only in part of Naogaon in the east; most of
Bagha in the southeast; and parts of Shibganj, Gomastapur, Nachole and Bholahat in the west, where the water level is found to be rising with the
highest rate (0.14m/year) in Bagha.
Water Level Trend in the Barind Area
Malaysian Journal of Mathematical Sciences 9
Figure 2: Contour map of regression line slope for maximum depth to water level (Database: 1996-2004)
A.H.M. Rahmatullah Imon & Mushfique Ahmed
10 Malaysian Journal of Mathematical Sciences
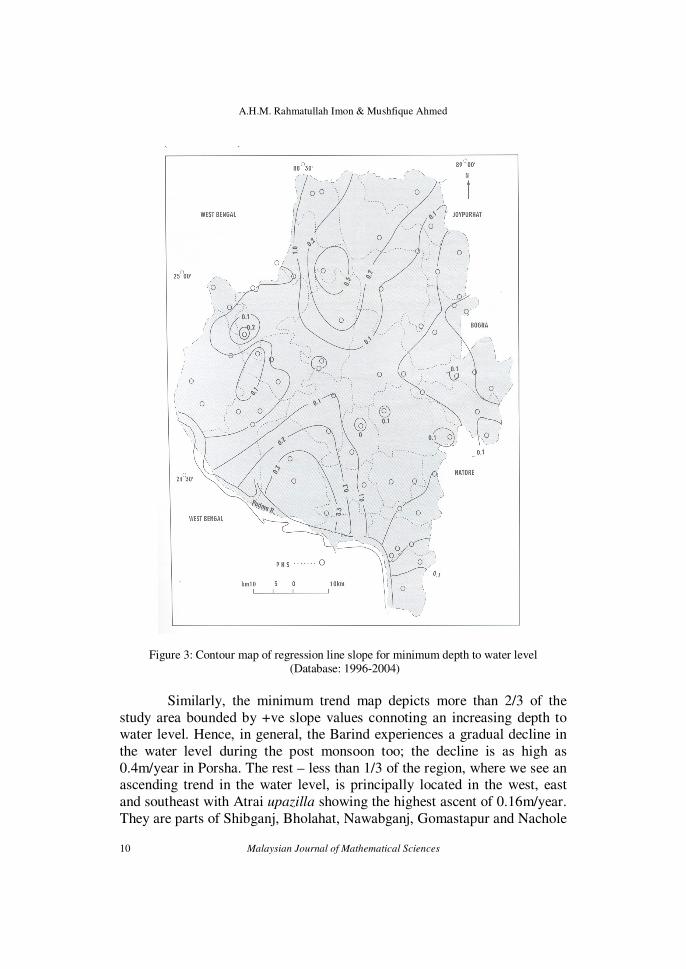
Figure 3: Contour map of regression line slope for minimum depth to water level (Database: 1996-2004)
Similarly, the minimum trend map depicts more than 2/3 of the
study area bounded by +ve slope values connoting an increasing depth to water level. Hence, in general, the Barind experiences a gradual decline in
the water level during the post monsoon too; the decline is as high as
0.4m/year in Porsha. The rest – less than 1/3 of the region, where we see an ascending trend in the water level, is principally located in the west, east
and southeast with Atrai upazilla showing the highest ascent of 0.16m/year.
They are parts of Shibganj, Bholahat, Nawabganj, Gomastapur and Nachole
Water Level Trend in the Barind Area
Malaysian Journal of Mathematical Sciences 11
in the west; parts of Atrai, Naogaon, Raninagar, Manda, Badalgachi and Dhamoirhat in the east; and parts of Puthia and Charghat in the southeast.
Additionally, there are a couple of tiny pockets of rising water level in
Mohanpur and Niamatpur in the central Barind during this period.
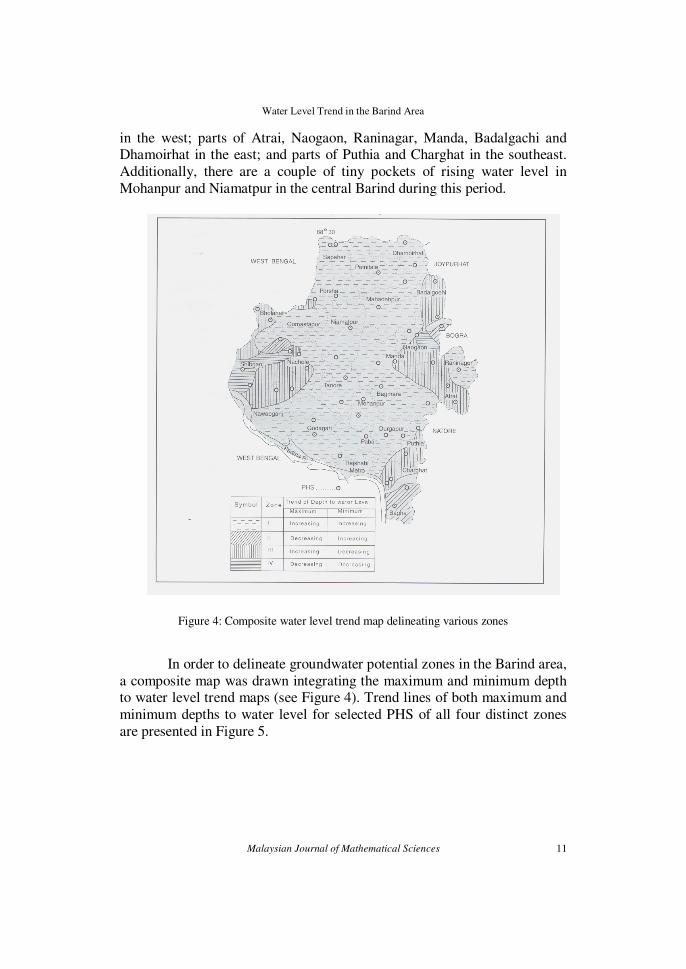
Figure 4: Composite water level trend map delineating various zones
In order to delineate groundwater potential zones in the Barind area,
a composite map was drawn integrating the maximum and minimum depth to water level trend maps (see Figure 4). Trend lines of both maximum and
minimum depths to water level for selected PHS of all four distinct zones
are presented in Figure 5.
A.H.M. Rahmatullah Imon & Mushfique Ahmed
12 Malaysian Journal of Mathematical Sciences
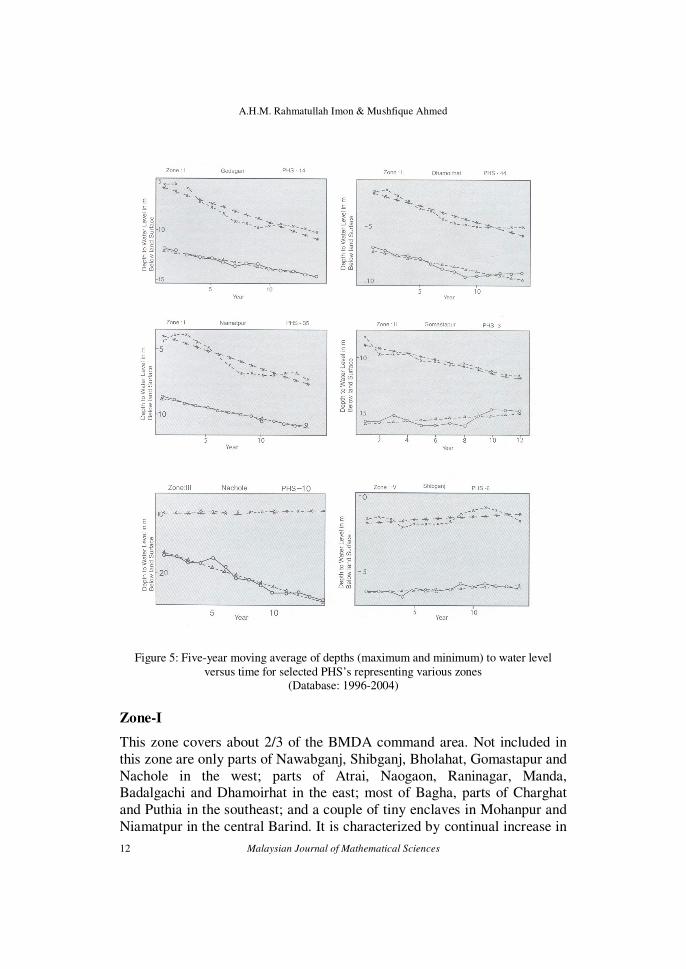
Figure 5: Five-year moving average of depths (maximum and minimum) to water level
versus time for selected PHS’s representing various zones (Database: 1996-2004)
Zone-I
This zone covers about 2/3 of the BMDA command area. Not included in
this zone are only parts of Nawabganj, Shibganj, Bholahat, Gomastapur and
Nachole in the west; parts of Atrai, Naogaon, Raninagar, Manda, Badalgachi and Dhamoirhat in the east; most of Bagha, parts of Charghat
and Puthia in the southeast; and a couple of tiny enclaves in Mohanpur and
Niamatpur in the central Barind. It is characterized by continual increase in
Water Level Trend in the Barind Area
Malaysian Journal of Mathematical Sciences 13
both maximum and minimum depths to water level. In the dry season the water level is gradually deepening to meet the growing withdrawal demand.
At the same time, the rate of replenishment through recharge during the wet
season is also lagging behind. This may give rise to a subsurface situation where sagging of inter-granular voids within the aquifer that remained
dewatered takes place. This, in turn, may decrease the total effective void
space of the aquifer affecting its yield. This zone may already have started
losing its potential. Consequently, the prospect for groundwater development of this zone is negative.
Zone-II
This small zone shows gradual increase in minimum depth to water level
even though the maximum depth is actually decreasing a little. During the
lean period, possibly as a result of lessening of withdrawal volume, one sees
corresponding rise in the water level. However, the wet season recharge is failing to reach its mark; and the water level is gradually falling. Lack of
replenishment through recharge in the post monsoon time may have been
adversely affecting the aquifer. The situation is similar, even though not as grave, to that of Zone-I. Likewise, the prospect for groundwater
development is not positive. This zone comprises a small portion of the
Barind covering most of Bagha in the southeast; part of Naogaon in the east; and parts of Shibganj, Gomastapur and Bholahat in the west.
Zone-III
This zone, which is less than 1/4 of the Barind, includes parts of Nawabganj, Shibganj, Bholahat, Gomastapur and Nachole in the west; parts
of Atrai, Naogaon, Raninagar, Manda, Badalgachi and Dhamoirhat in the
east; and parts of Puthia and Charghat in the southest. It has also got a couple of tiny enclaves in Mohanpur and Niamatpur in the central Barind.
The zone is characterized by gradual increase in maximum depth to water
level but slight decrease in minimum depth. The gradual decline of the water level in the dry period is indicative of inflating withdrawal demand of
this zone. Here, the replenishment of aquifer through recharge is still in
excess of the abstraction, which has resulted in a slight rise in the water
level during wet season. Although, presently the recharge is quite able to make up for the drafted groundwater, the aquifer situation is essentially
unstable as increasing amount of groundwater is being continually pumped
out from the storage that may before long go out of control permanently damaging the aquifer potential.
A.H.M. Rahmatullah Imon & Mushfique Ahmed
14 Malaysian Journal of Mathematical Sciences
Zone-IV
This zone covers only a small portion of the Barind area: just part of
Naogaon in the east and parts of Shibganj, Gomastapur and Nachole in the
west. It depicts decreasing trends for both maximum and minimum depth to water level. Here, the rise of water level in both lean and wet seasons point
to the zone’s potential to support more groundwater abstraction.
The present findings as to the overall increasing depth to water level trends of the Barind area is generally in consonance with that of other
researchers (e.g. Hassan (2005)). However, Jahan et al. (2004) found quite
different results using almost the same data. Interestingly, in their study they have had somewhat dissimilar methodology. Instead of using
maximum depth to water level, they opted for an “average of March
through May” from monthly database. Similarly, they used an “average of
October and November’ in lieu of minimum depth to water level. Moreover, they employed the raw data for their regression analyses that
would generally yield very low R-sq and corresponding insignificant
regression coefficients. Our study clearly shows the advantage of employing moving average regression for the data. We observe from Table
1 that the majority of the permanent hydrographic stations show significant
regression individually and Figure 5 shows regressions are significant for all four zones constructed by contour map.
5. CONCLUSION
Moving average regression analyses of the monthly depths to water
level data reveal increasing trends for both maximum and minimum in Zone I which is about 2/3 of the Barind area. Future groundwater development of
this part of the Barind, showing a gradual fall of the water level in both dry
and wet seasons, is not advisable. In addition, most of the remaining area,
located in the west, east and southeast, that we call Zone II and Zone III experience decline in the water level either in the post monsoon period or
during the lean season rendering further development prospects for
groundwater nil or slim. Only a small portion of the BMDA command area, Zone IV, located in Shibganj and Gomastapur in the west and Naogaon in
the east, still enjoys potential for further groundwater development.
Water Level Trend in the Barind Area
Malaysian Journal of Mathematical Sciences 15
REFERENCES
BWDB. 1989. Report on Groundwater Field Investigations of the Barind
Integrated Area Development Project. Bangladesh Water
Development Board Rajshahi. Vol. 1, Main Report.
BWDB. 1992. Impact on Shallow Tubewell due to Lowering of
Groundwater in Porsha, Sapahar, Pantitala, Niamatpur,
Gomastapur, Nachole, Tanore and Godagari Upazillas and
Evaluation of Groundwater Resource Potential. Bangladesh Water
Development Board Water Supply Paper-520, GWC-II, Dhaka.
BMDA. 2001. Project Proforma (Rebound) for Barind Integrated Area
Development Project. Phase-II (4th
Revision). Barind Multipurpose
Development Authority, Rajshahi.
BMDA. 2002. Progress Report for the Month of August 2002. Office of the
Executive Director, Barind Multipurpose Development Authority,
Rajshahi.
Chatterjee, S. and Hadi, A. S. 2006. Regression analysis by examples, 4
th ed. New York: Wiley.
Hassan, M. M. 2005. Personal Communication. Associate Specialist,
Irrigation Management Division, Institute of Water Modelling
(IWM), Dhaka, Bangladesh.
Jahan, C. S. 1997. Origin and Occurrence of Groundwater in Barind Area
(Bangladesh) and Prospects of its Utilization. Unpublished Thesis,
Moscow State Geological Prospecting Academy, Moscow.
Jahan, C. S. and Ahmed, M. 1997. Flow of Groundwater in Barind Area,
Bangladesh: Implication of Structural Framework. Journal
Geological Society of India. 50: 743-752.
Jahan, C. S., Mazumder, Q. H. and Asaduzzaman, M. 2004. Long Term Water Level in Barind Area of Bangladesh: A Statistical Analysis
for Groundwater Potentiality Study. Bangladesh Journal of
Geology. 23: 55-69.
Montgomery, D. C., Peck, E.A. and Vining, G. G. 2008. Introduction to
linear regression analysis, 4th ed. New York: Wiley.
Ryan, T.P. 1997. Modern regression methods. New York: Wiley.