Embed Size (px)
Citation preview

Water masses in the Gulf of Aden
M. A. Al Saafani*
Department of Earth Science and Environment, Faculty of science, Sana'a University, Sana'a, Yemen
Email: [email protected]
S.S.C. Shenoi
National Institute of Oceanography, Goa - 403 004, India.
* Presently at National Institute of Oceanography, Goa - 403 004, India.
Citation: Journal of Oceanography, vol.63(1), 1-14p.

Abstract
Hydrographic data collected from Gulf of Aden since 1920 have been compiled to identify
and refine the definitions of water masses in the Gulf of Aden (GA) and to describe their
spatio-temporal variability. Four water masses have been identified based on their -S
characteristics. The Red Sea Water (RSW) that flows from the Red Sea is the most prominent
water in the GA; this occupies about 37% of the total volume of Gulf of Aden. The Gulf of
Aden Surface Water (~ 3%) forms as a mixture of local water and the water from western
Arabian Sea during winter and Red Sea surface water during summer. The intermediate water,
identified as Gulf of Aden Intermediate Water (GAIW), occupies about 9% of the total
volume of GA; a characteristic salinity minimum is associated with it at = 26.50 kg m-3.
The northward spread of sub-tropical subsurface water from the south appears to be the major
source of GAIW. The bottom water, named Gulf of Aden Bottom Water, showed the least
variability. It was formed due to the mixing of Red Sea Water and water of southern origin.
Mixing triangles have been used to analyze the composition of water in the GA.
1. Introduction
The Gulf of Aden (GA), a narrow strip of water that connects the Red Sea with the Indian
Ocean, extends east-northeastward from the narrow Strait of Bab-el-Mandab to a line
connecting Ras Baghashwa (east of Mukalla, Yemen) and Ras Asir (northern corner of the
Somali Peninsula). The 900 km long GA spreads over an area of about 220 x 103 km2. The
average depth is about 1800 m. A hot dry climate prevails over the landmasses surrounding
the GA, though the prevailing winds have a pronounced seasonal cycle. Strong westerly
winds blow during the summer monsoon (June-August) and weak northeasterly winds blow
during the winter monsoon (November-February). During intermediate periods (April-May
and October), winds are weak and unstable in their directions.

From an oceanographic perspective, the GA is important because it provides the passage for
Red Sea Water (RSW), one of the most saline water masses in the world oceans, into the
Indian Ocean. It is also significant commercially, because it is an important highway for
international trade between the east and the west. In spite of its importance, very little
information is available on its hydrography and biological productivity. A few studies have
used the available hydrographic data to describe the water masses in the GA. Rochford (1964)
identified two water masses in the eastern GA, namely, high salinity Arabian Sea Water
(ASW at t levels 23.5-24.0) and RSW (at t levels 27.0-27.4). Khimitsa (1968) identified
four layers of water in the GA based on their physical and chemical properties. A top layer
(50-100 m) of high salinity (36.0-36.5 psu) and high oxygen content, an intermediate layer,
between 100-500 m, of lower salinity (~ 35.3 psu) and low oxygen content, another
intermediate layer, between 500-1000, of high salinity RSW (~ 36.5-38.0 psu), and a layer
near the bottom containing the bottom water of low salinity (~ 34.9-35.5 psu) and
temperature. He suggested that the water in the upper intermediate level enters the Gulf from
the south as a strong jet between Cape Gvardafui and Socotra at depths ~ 150 to 200 m. He
noted that the Southern Ocean is the origin of the bottom water. Piechura and Sobaih (1986)
described three water masses in the upper 1000 m of GA. They named them Surface Water,
Subsurface Water, and RSW. They suggested that local heating and evaporation are the
causative factors for the formation of surface water, which is deeper in winter (200-300 m)
and shallower in summer (70-80 m). For the subsurface water the highest temperature and
salinity were found in winter. They suggested a subtropical front as the origin of Subsurface
Water. Nasser (1992) also identified three water masses in the upper 1000 m of the northern
Gulf of Aden, namely: Surface High Salinity water, Subsurface Low Salinity water and RSW.
He concluded that the Subsurface Low Salinity Water is transported in the GA from the

Somali basin during the summer monsoon. More recently, Mohamed et al. (1996) and
Mohammed (1997) identified four salinity maxima in the GA. They identified the first
maximum between the t levels 24.0 and 25.0, the second between 25.0 and 26.0, the third
between 26.0 and 27.0 and the fourth between 27.0 and 28.0. They identified the third
maximum as a mixture of waters originating from the Persian Gulf, Timor Sea and
Subtropical Subsurface and the fourth maximum as a mixture of Red Sea water, Antarctic
Intermediate water and Timor Sea water. Most of the other studies of the GA (Maillard and
Soliman, 1986; Fedorov and Meshchanov, 1988; Bower et al., 2000) dealt only with the
outflow and spreading of RSW. Ozgokman et al. (2003), Peter and Johns (2005) and Peter et
al. (2005) described the structure and dynamics of Red Sea outflow plume in the western GA.
All these studies were either localized in space or time or focused on Red Sea outflow. None
of them provide a comprehensive picture of the structure of water masses in the GA as they
evolve round the year nor provide a quantitative estimate. Furthermore, the temperature-
salinity-range of the water masses defined by various authors often varied drastically
depending on the limited data they had used for their studies. In this study, temperature-
salinity climatology has been used to define the -S- range of water masses rather than the
limited data used in previous studies. For this purpose, we used a new temperature-salinity
climatology created using all available temperature-salinity profiles from this region. Based
on well demarcated boundaries of the water masses, we have also calculated the volumes
occupied by the water masses and their changes throughout the year. Data and methodology
are described in section 2. Section 3 describes the results based on vertical and horizontal
structure of water masses and section 4 presents discussions and conclusions.

2. Data and methodology:
A new hydrographic dataset was assembled using temperature-salinity profiles from (i) the
archives of National Oceanographic Data Center (NODC); (ii) Japan Oceanographic Data
Center (JODC); (iii) the CTD profiles collected during the Bab-el-Mandab Experiment
(Murray and Johns, 1997; Al Saafani and Shenoi, 2004); (iv) the CTD profiles available from
the Netherlands Indian Ocean Programme (Baars, 1994); and (v) the data collected during
1984-85 by Marine Science and Resources Research Center, Yemen (Stirn et al., 1985). A
total of 23144 temperature and 6514 salinity profiles were obtained from these sources.
Before proceeding further, 2102 duplicate profiles were identified and isolated. The
temperature-salinity values in the west are very different from those in the east. Hence, to
assess the quality of the profiles, the monthly means and standard deviations were computed
at each depth level separately in 20 longitude x 20 latitude bins. Values (temperature or
salinity) exceeding more than three standard deviations were then removed. The profiles that
passed this check were then examined for large inversions in temperature and stability
following Boyer and Levitus (1994). Of 4412 temperature-salinity profiles, 4088 profiles met
the stated quality criteria. Among them, 2541 profiles also contained data on oxygen. The
distribution of stations (Figure 1) is uneven, but not alarming. The number of temperature-
salinity profiles is always higher near the coast of Yemen. The earlier climatology included
only 13229 temperature profiles (Boyer et al., 2002) and 1917 salinity profiles (Stephens et
al., 2002) for this region bounded between 43.5° E and 55.0° E. Hence, we expect
improvements in the robustness of the new climatology.
A typical -S curve for the GA (Figure 2) clearly shows four distinct water masses similar to
those reported by Khimitsa (1968). The upper three water masses also show similarities to
those reported by Piechura and Sobaih (1986) and Nasser (1992). Mohamed et al. (1996)
reported five water masses in the GA, but the temperature-salinity-density ranges they used

to define the water masses varied drastically from ours. The -S curve in Figure 2 shows high
saline surface water followed with low saline water in the intermediate levels and high
saline water below that. The bottom water is comparatively fresher than that in the upper
water column. Such -S curves constructed individually and collectively were then used for
further analysis.
To compute the volume of each water mass, we have adopted the method proposed by
Montgomery (1958). Due to the paucity of data, the volume computations were done for
seasons rather than for months. Similarly, due to the paucity of data in some of the 1° × 1°
grids, the volume computations were carried out over a 1° longitude band. A mean -S
curve for 1° longitude band was computed first and then sliced in to 0.5 °C temperature ×
0.1 psu salinity grids (see figure 7). The volume of each grid was then estimated by
multiplying their respective thicknesses by the surface area of a 1° longitude band. The
volumes of 0.5 °C temperature × 0.1 psu salinity grids falling within the pre-defined bounds
of the water masses (based on -S-ranges) were then added together to determine the
total volume of water mass.
3. Results
3.1 T-S Characteristics
Figure 3 shows the -S diagrams constructed using temperature-salinity profiles available
from the GA west of 51° E. The number of profiles available during a month varied from 146
in December to 313 in January. About 40% of the profiles extended only up to 400 m. Since
GA receives high saline Red Sea water in the west and moderately saline Arabian Sea water
in the east, we have divided the region in to three sub-regions, namely: the western region
(between 43.5° E and 45.0° E), the central region (between 45.0° E and 49.0° E), and the
eastern region (between 49.0° E and 51.0° E).
Four water masses are identifiable from the -S diagrams in Figure 3. They are: (i) a salinity
maxima near the surface between the levels 22.20 kg m-3 and 24.80 kg m-3; we call this
water Gulf of Aden Surface Water (GASW); Khimitsa (1968) called it Surface Aden Water.
(ii) A salinity minimum between the levels 26.20 and 26.90 kg m-3; we call this water Gulf
of Aden Intermediate Water (GAIW); Khimitsa (1968) called it Low Salinity Layer or
subsurface salinity minimum. (iii) A salinity maximum between the levels 26.90 and
27.50, which is easily identifiable as Red Sea Water (RSW). Finally, (iv) a distinct water
between the levels 27.50 and 27.80; we call this Gulf of Aden Bottom Water (GABW);
Khimitsa (1968) called this Bottom Water. Among the four water masses, the -S relationship
is tightest for the bottom water mass, but the potential temperature and salinity varies over a
wider rage (3 to 9° C and 34.70 to 35.60 psu). The ranges of potential temperature and salinity
for the four water masses are given in Table 1. The histograms (Figure 4) show the
distribution of potential temperature and salinity within the four water masses. Histograms are
useful for the identification of core potential temperature and salinity. For example, the
potential temperature and salinity of the GASW core is 25.5 °C and 36.0 psu. Similarly, the
potential temperature and salinity of the RSW core is 12.5 °C and 35.8 psu respectively.
Gulf of Aden Surface Water : The spatio-temporal variability of the salinity of the GASW that
occupies the surface layer is not more than 1.00 psu (Figure 3), but the potential temperature
ranges between 21.0 °C and 32.0 °C during summer and 22.0 °C and 26.0 °C during winter.
The cooler surface temperature during winter is due to the cool dry northeasterlies that blow
over the northern Arabian Sea and adjoining areas (Piechura and Sobaih, 1986). Accordingly,
the lower limit of its range also undergoes wide variations from 23.50 kg m-3 in January-
February to 22.20 kg m-3 in June-July. GASW is seen in all three regions of the gulf: western,
central and eastern. The profile-to-profile variation in salinity is at a maximum in the western
region and a minimum in the central one. Few profiles in the western region showed salinities
as high as 37.00 psu during August-September due to high saline surface water outflow from
the Red Sea during summer. Similarly, a few profiles in the eastern region showed lower
salinities (35.5 psu) than expected (Figure 3). Since the profiles observed over several years
are included for this analysis, inter-annual variability is also a reason for the large variations.
Gulf of Aden Intermediate Water : This water, identifiable by a salinity minimum, showed
very little variability from month to month compared to GASW (Figure 3). Its core, situated at
level 26.50, is well defined throughout the year. On average, the spatio-temporal
variability in the range of salinity and potential temperature is less than 0.75 psu and 3.0 °C.
The salinity in the eastern region is comparatively lower than that in the central one. The
salinity profiles in the western region showed large variations (> 2 psu). Some of them must
have occurred due to the high salinity water that outflows from Bab-el-Mandab into the GA
(Maillard and Soliman, 1986; Murray and Johns, 1997; Al Saafani and Shenoi, 2004).
Red Sea Water : This is the most prominent water mass in the GA and there is no ambiguity
about its origin. It outflows into the GA from the Red Sea through Bab-el-Mandab strait; its
core exists at level 27.20. 68% of the observations showed salinities in the range 35.30 to
36.00 psu and 32% of them showed salinity greater than 36.00 psu. The profiles from the
western region show salinities as high as 38.00 psu (see Figure 3 for January and May-July).
In the central region, both potential temperature and salinity showed large variability,
especially during the summer months (May-September). The outflow of RSW from the Red
Sea undergoes a seasonal cycle in response to the monsoon winds (Murray and Johns, 1997);

the outflow is minimum at the end of the summer monsoon season and maximum during the
peak of winter. Hence, in addition to the inter-annual variability, the seasonal variability in the
-S could well be associated with the variability in the outflow of RSW from the Red Sea.
Gulf of Aden Bottom Water : The GABW is easily identifiable in the range 27.50 to 27.80.
Though this water mass has a narrow rage, its potential temperature and salinity has wider
ranges; the potential temperature ranges between 3.0 and 9.0 °C and salinity between 34.70
and 35.60 psu (Figure 4). Being bottom water, the temporal variability of the -S structure is
very low.
3.2 Horizontal distribution
The spatial distribution of -S profiles alone is insufficient to describe the variations in the
horizontal distribution of the water masses. Hence, maps of horizontal distribution of water
masses were prepared for two major seasons: the summer (August-September) and the winter
(January-February). Here we chose the last two months of the seasons because the circulation
effects on the water mass are best seen towards the end of the season. The salinity at the core
of the water mass is used as a tracer to describe the horizontal distribution (Figure 5). The
core is defined using the maximum/minimum salinities. For example, for RSW we pick the
maximum salinity between the levels 26.90 and 27.50 and for GAIW we pick the
minimum salinity between the levels 26.20 and 26.90. As expected, the salinity of the core
of RSW is higher in the west due to the discharge from the Red Sea. The core of RSW flows
within the depth range 600 - 650 m except in few pockets where it deepens to 700-800 m.
This is consistent with the description of Bower et al. (2000) and Bower et al. (2005). On
average, the core of RSW shallows during summer, in the east, by about 50 - 100 m. The
lowest salinity in the core is seen near the Somali coast at around 49.0° E in both seasons.
Low salinities are also seen near the coast of Yemen in summer.
The salinity in the core of GAIW water increases towards the west. The salinity in the core is
considerably higher in the west due to mixing with high saline outflow from the Red Sea
(Khimitsa, 1968; Piechura and Sobaih, 1986). The core shallows by at least 50 m during
summer from its winter position. From the pattern of salinity contours it appears that the
GAIW spreads from east to west. The salinity distribution in the core of GASW is very
different from that for RSW and GAIW. The core salinities are highest in the central region
and lowest in the eastern region. In summer, a large patch of high salinity, exceeding 36.10
psu, occupies the central region between 45° E and 48° E. The large patch of high salinity is
due to the anticyclonic eddy that forms in the GA in summer (Piechura and Sobaih, 1986).
The structure of these water masses is also clearly seen in the vertical section running through
the middle of the gulf (Figure 6). The GAIW and the GABW spread from the east while the
RSW spreads from the west.
3.3 Volumetric analysis
The volumes occupied by the water masses, estimated following Montgomery (1958), for an
average -S profile in the GA, are shown in Figure 7. For this purpose, the average depth of
GA was assumed as 2000 m. As per the estimate, the volume of RSW in the GA is about
1769.0×1011 m3 while the volumes of GAIW and GABW are about 418.7×10¹¹ m3 and
1851.3×1011 m3 respectively. The volume of GASW is only about 138.0×10¹¹ m3. In terms of
percentages, the RSW occupies ~ 37% of the total volume of GA while GAIW and GABW
occupy ~9% and 38% respectively.
While the estimates based on the mean -S profile for the GA provided the approximate
volumes of water masses, they are inadequate to describe the temporal and spatial variability.
Estimates based on monthly mean -S profiles within 1o grids spread over the GA would have

been ideal to describe the spatial and temporal variability. The data sparseness, however,
prevents such estimates. Hence, mean -S profiles were constructed for two seasons (summer
and winter) for 1o spatial grids. Since the mean -S profiles in several grids do not extend
beyond 1200 m, it will not be possible to estimate the volume of GABW. The volumes thus
estimated for 1200 m deep water column along the east-west axis of GA are shown in Figure
8. During winter, the volume of RSW is 100 × 1011 m3 in the western grid and it is 72 × 1011
m3 in the eastern grid. In the center it is ~ 88 × 1011 m3; the sharp decrease (~72 × 1011 m3 )
occurs only in the grids east of 49° E. During summer, though the volume of RSW remains
more or less the same (~ 100 × 1011 m3) in the west, it decreases gradually towards the east
(Figure 8b).
GAIW is present more in the east (25×1011 m3) than that in the west (~ 12×1011 m3) during
winter. In summer, however, both the east-west variation and the volume are low (~ 18 -
20×1011 m3). The volume of GASW is about 10×1011 m3 in winter and about 6×10¹¹ m3 in
summer. The east-west variability in the volume of GASW during both seasons is negligible.
All three water masses, the RSW, the GAIW and the GASW, had higher volumes during
winter than in summer. The increase in volumes results in increased sea level during winter.
The seasonal cycle of sea level recorded by satellite altimeter as well as the tide gauge at
Aden show an increase of ~ 35 cm during winter (figure not shown).
3.4 Percentage composition of GA water
The percentage composition of water masses in a water sample in the GA was estimated
following Tomczak (1981a and b). The method is an extension of the mixing triangle theory.
Conserving the mass, the relative contribution of any water mass to the water sample at a
location can be determined from the linear system of equations given as

AX = B
where A is an n×n matrix of the parameter values for the n water masses, B is a vector of n
elements which contains n-1 observations, and X is a vector of n elements which gives the
relative contributions of the water masses. Since four water masses are to be considered to
describe the composition of water samples in the GA, three parameters were considered,
namely: potential temperature, salinity and O2. Consideration of O2 as one of the parameters
might introduce an element of uncertainty in the estimate because it is not a conservative
tracer, especially in the shallow depths (depths < 200 - 300 m). Nevertheless, we have used
O2 as one of the parameters in the absence of other suitable ones. Matrix A was defined using
the thermohaline indices of the water masses before they entered and mixed in the GA (Table
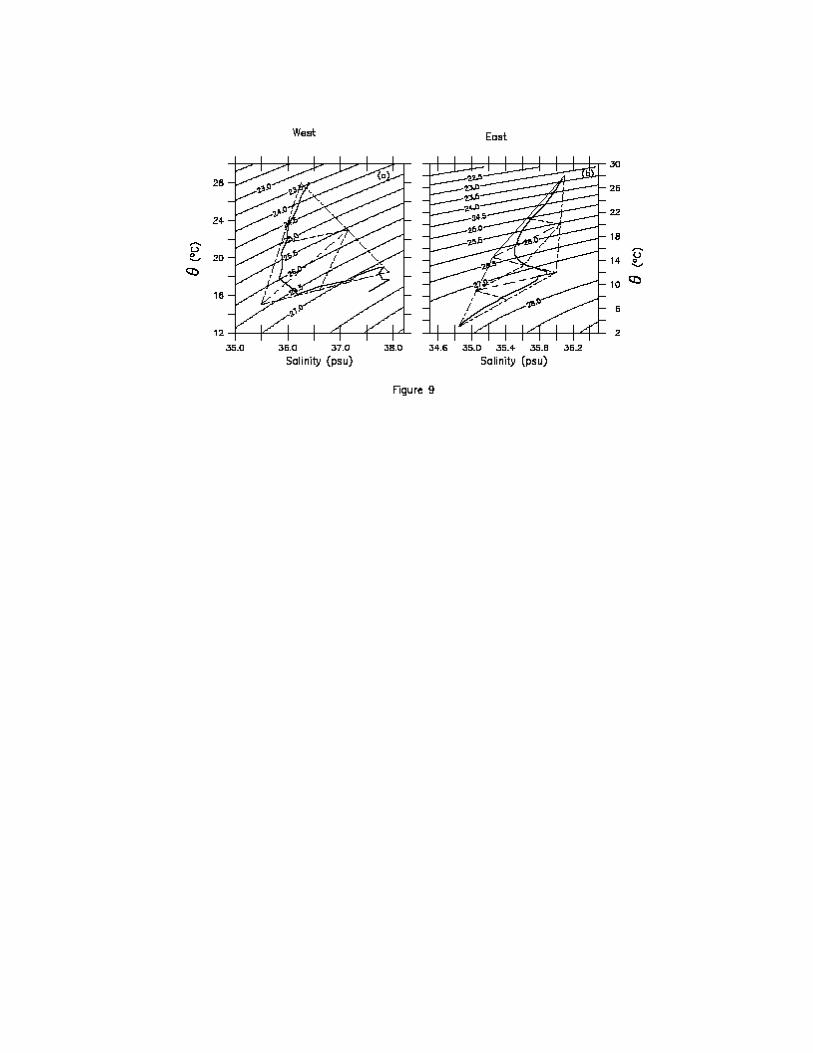
2); ie., the -S of the water mass when it was outside the GA. Mixing triangles were used to
determine the thermohaline indices (see for example Figure 9). GAIW and GABW enter the
GA from the east, hence the profiles from the eastern region were used to determine their
thermohaline indices. Similarly, the profiles from the western region were used to determine
the thermohaline index for RSW before it entered the GA. A similar definition of
thermohaline index for GASW could be ambiguous because that does not have a definite
source region. Part of the GASW forms within the GA due to air-sea fluxes and part is
advected into the GA either from the western Arabian Sea and/or from the Red Sea. The
surface flow in the GA inferred from the climatology of sea level height anomalies estimated
from the satellite altimetry is towards the west during the winter and towards the east during
the summer (Al Saafani and Shenoi, 2006). Hence, the profiles from eastern (western) GA
were used to determine the thermohaline index during winter (summer).
The percentage composition of water in the GA along the east-west axis (see Figure 1) is
shown in Figure 10. As expected, the percentage of water of Red Sea origin reduces from
90% in the west (near Bab-el-Mandab) to less than 40% in the east (Figure 10 e and f). The

water in the bottom (deeper than 1100 m) as well as the surface and intermediate (less than
400 m) levels also contains about 10-20% water of Red Sea origin. Similarly, the water that is
responsible for the GAIW is at a maximum in the intermediate levels; it also contributes to the
water that is found in the deeper layers (deeper than 1200 m) and surface levels (less than 100
m). The presence of more of this water in the east than in the west suggests that the water
responsible for GAIW enters the Gulf from the east. The water that is responsible for the
GASW does not contribute much to the water below 150 m. It is at a maximum (> 90%) in the
surface layers (< 40 m), decreasing rapidly towards the deeper layers. Most of this water also
appears to enter the GA from the east. The water that is responsible for the formation of
GABW shows highest concentrations (~ 90%) in the bottom layers and dilutes rapidly towards
the upper layers (< 1200 m).
4. Discussion and conclusions
Previous reports (Khimitsa, 1968; Piechura and Sobaih, 1986; Nasser, 1992; and Mohamed et
al., 1996) used limited data sets to describe the water mass in the GA. Though they succeeded
in identifying the water masses, they failed to give an integrated picture of the presence of
distinct water masses in the GA. Moreover, the definitions and nomenclature of the water
masses varied, except for the RSW. In this paper, while refining the earlier work, we also
present quantitative estimates.
Similar to earlier studies (for example Khimitsa, 1968), four water masses are identified using
a newly compiled hydrographic data set. Among them, the origin of RSW is well known.
Hence, we will focus on identifying the origins of other the three water masses, the GASW,
GAIW and GABW.
Being surface water, both seasonal and monthly variability was highest for the GASW.
Though the core density is ~ 1024.10 kg m-3, the lower limit of density varied from 1023.50

kg m-3 in winter to 1022.20 kg m-3 in summer due to the increase in temperature. The salinity
of the core increased towards the west (Figures 5 and 6). The -S- structure of this water
mass (core -S 26.0 °C - 36.0 psu and 24.1) is similar to the salinity maximum D of
Rochford (1964) and ASHSW described in Shenoi et al. (1993). The salinity maximum D of
ASHSW forms in the surface of Arabian Sea and spreads along the level 23.8 (-S range
24.0-26.5 °C and 35.1-36.5 psu). The -S range of GASW is 21.0-32.0 °C and 35.4-36.8 psu
and core is ~ 24.1 kg m-3. However, in summer the temperature of this surface water
increases to 31.5 °C, while in winter it decreases to 26.0 °C. The -S profiles (Antonov et al.,
1998 and Boyer et al., 1998) from the western Arabian Sea (west of 60° E) show similar
characteristics (figure not shown). The surface current is towards the west during winter and
towards the east during summer (Khimitsa, 1968; Piechura and Sobaih, 1986; Al Saafani and
Shenoi, 2006). Hence, during winter, a sizable amount of ASHSW will enter the GA from the
east. Similarly, during summer, a sizable amount of surface water from the Red Sea will enter
the GA from the west. In addition, during both seasons, some water will form locally due to
precipitation and evaporation. Hence, it is possible that during winter the GASW forms as a
mixture of locally formed water and ASHSW, while during summer it is a mixture of locally
formed water and Red Sea surface water.
In the intermediate layers (200-300 m), the GAIW, appears as a minimum in the -S diagram
at level 26.5. Usually, a minimum occurs between two maxima and it is unnecessary to
trace its origin or determine the processes that actively depress the salinity. However, this
particular minimum does not appear to be the typical minimum found between two maxima
because (i) in the -S structure it appears as a distinct water mass (Figure 3) and (ii) it is seen
only at a particular level and not spread over the entire water column between the two
maxima. Hence it is necessary to identify the source of this minimum. Khimitsa (1968)

suggested that the water in the intermediate level (150-200 m) enters the gulf as a strong jet
between Cape Gvardafui and Socotra. Mohamed et al. (1996) identified the water between
levels 26.0 and 27.0 as a mixture of PGW, Arabian Sea Water and Timor Sea water.
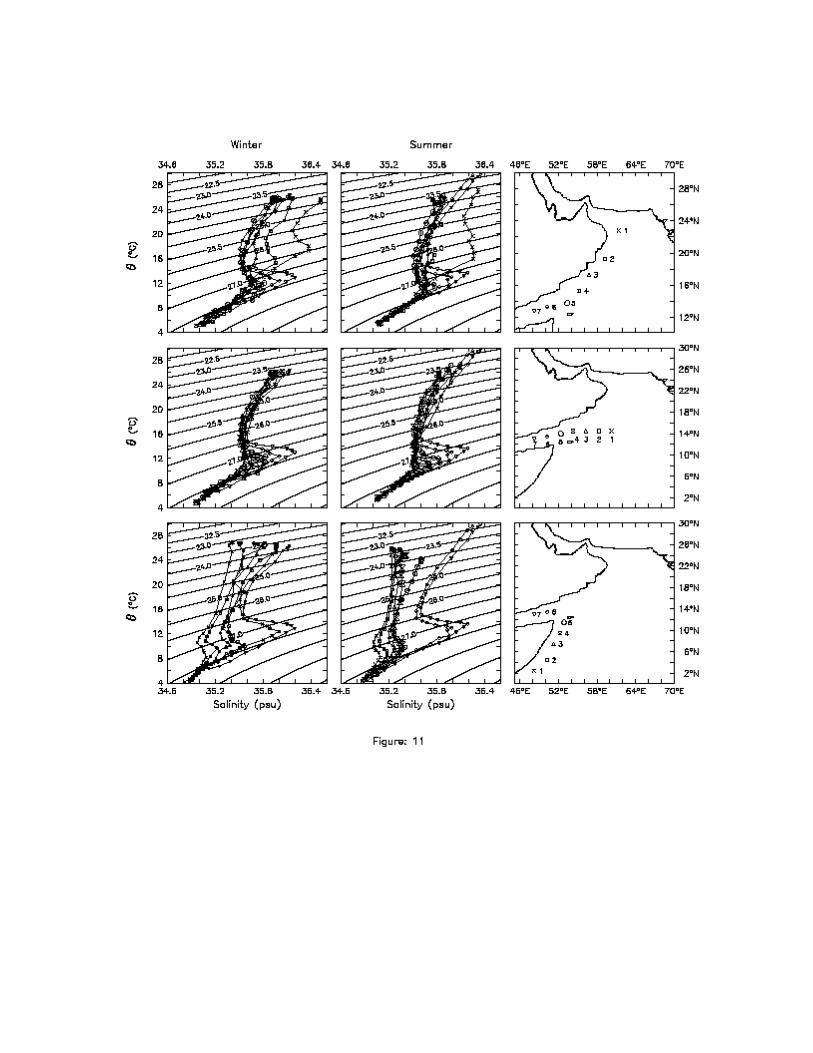
To identify the pathways of GAIW, a series of -S diagrams were constructed using data from
Antonov et al. (1998) and Boyer et al. (1998) for selected locations along three paths: (i) from
Gulf of Oman to GA (Figure 11a); (ii) from the western Arabian Sea to GA (Figure 11b); and
(iii) from equator to GA (Figure 11c). The -S profiles constructed along the path from Gulf
of Oman to GA show maxima at = 26.5, corresponding to Persian Gulf Water (PGW), to
station 3, which is situated outside the GA. From station 4 onwards, the station situated just
outside the GA, the maximum is replaced by a minimum at = 26.5 and its salinity
decreases further at station 5, the entrance to GA (Figure 11a). The minimum is well marked
at stations 6 and 7, inside the gulf. Thus, PGW cannot be the source of GAIW. The sections
made normal to the coast of Oman (Morrison, 1997) also suggest very little flow of PGW
towards south along the coast of Oman. Most of the PGW flows towards the east and later
spreads towards south following the eastern boundary of the Arabian Sea basin (Shenoi et al.,
1993).
The -S curves at locations along the paths from the western Arabian Sea (west of 60° E) to
GA as well as that along the path from the equator to GA show the presence of salinity
minima at around = 26.5 (Figure 11 b and c). Hence, it is likely that the GAIW enters the
Gulf either from the south or the east. During summer, a well developed northward flow
(Somali current) penetrates far deeper with velocities above 50 cm s-1 at 300 m depth; it
transports about 37±5 Sv of water off the coast of Somalia (Beal and Chereskin, 2003). Part of
the Somali current system enters GA through the passage between Socotra and the Horn of
Africa (Schott and McCreary, 2001). Fischer et al. (1996) estimated the total transport, west

of Socotra, into the GA during summer as 13-14 Sv. Figures 5, 6 and 10 also indicate the east-
to-west spread of GAIW. If the GAIW, which has a characteristic salinity minimum, enters
the Gulf from the western Arabian Sea, especially through the Socotra passage, then what is
the source of low salinity water in the western Arabian Sea?
Three sources have been identified for the low salinity water in the western Arabian Sea, the
Somali basin. First, the low salinity water brought into the Somali basin by the northern
branch of the South Equatorial Current (SEC) (Swallow et al., 1983); this brings the water
from the eastern equatorial Indian Ocean. Warren et al. (1966) recognized the Bay of Bengal
as a likely source of fresh water for the Somali basin. Morrison (1997) reported the presence
of low saline Indian Central Water in the western Arabian Sea at = 26.6. However, Wyrtki
(1971) suggested that the water of SEC in the lower thermocline (18.0-19.0 °C) originates
near the Indonesian archipelago and not from the Bay of Bengal. This water flows at the
density surface = 25.0.
The second possibility is the low salinity Subtropical Subsurface Water (SSW), which
originates at the Subtropical Convergence in the southern hemisphere near 40° S (Quadfasel
and Schott, 1982). Warren et al. (1966) and Wyrtki (1971) showed that this water penetrates
as far as 10° N off East Africa and is partially responsible for the low salinity in the
intermediate layer of the northern Somali basin. In the Somali basin, in the density range from
= 26.5 to 27.0, its core layer lies between 300 and 400 m. The temperature varies between
8.0 and 15.0 °C and salinity between 34.8 and 35.5 psu (Quadfasel and Schott, 1982). This
description of SSW matches well with the salinity minimum associated with GAIW. The
salinity minimum that lies on the level 26.5 in the GA has a potential temperature range
between 11.0 and 18.0 °C and salinity between 35.0 and 36.4 psu; its core layer lies between

200 and 300 m. The corresponding thermohaline index (Table 2) was = 14.5 °C and S =
35.25 psu.
The third possibility is the Antarctic Intermediate Water (AIW), which forms at the Antarctic
Convergence Zone at around 40-50° S, sinks and flows north. This water is characterized by
low salinity (< 34.3 psu) and high oxygen content (> 5.0 ml L-1); at its source the core layer
is 27.4. Wyrtki (1971) reported its existence at 5° S and Quadfasel and Schott (1982) at 4°
S at the depth rage 700-800 m. Tchernia (1980) suggested that AIW could extend to the
extreme northwest Indian Ocean at the Gulf of Aden and Gulf of Oman, where it rises up to
depths as shallow as 200-300 m in order to override the relatively saline water spreading
southwestward from the Arabian Sea. Hence, it is possible that both SSW and AIW contribute
to the existence of the salinity minimum in the GA at intermediate levels.
The Socotra passage seems to be the main connection between GA and Somali Basin. The
passage also acts as the pathway for the southward migration of RSW. A southward under-
current below the northward Somali current in the latitude band 8 – 120 N (Quadfasel and
Schott, 1983; Schott and Fischer, 2000) transports the RSW southward at depths ~ 600 – 1000
m.
The GABW identifiable in the range 27.5 to 27.8 occupies about 35% of the total volume
of GA. Khimitsa (1968) identified this water with the water originating from the Southern
Ocean. Since there is no production of bottom water in the Arabian basin (Quadfasel et al.,
1997) it is necessary to transport the bottom water from elsewhere. Johnson et al. (1998)
showed that approximately 1-1.7 Sv of Circumpolar Deep Water (CDW) enters the Somali
basin through Aminrante Passage at 8° S. The potential density of this water is much higher
(> 28.5) than the GABW, and its representative -S characteristic is 1.0-1.1 °C and 34.72-

34.75 psu. Hence it is not possible to identify the GABW with CDW. Another possibility is
the water of southern origin, as noted in the -S and -O2 curves of Johnson et al. (1998). This
water having ~3 °C has low salinity (34.70-34.72) and higher oxygen content (see figure 3
of Johnson et al., 1998). Although Johnson et al. (1998) do not specify the southern source of
this water it is possible that the AIW could be one among them because that also is
characterized by low salinity and high oxygen content. From Figures 11 and 12 it appears that
this water of southern origin spreads further north into the GA (between the levels 27.5 and
27.8). The -S (Figure 11) and the -O2 curves (Figure 12) show lower salinity and higher
oxygen for this water (~ 2.0 ml L-1 near the equator). The water of southern origin that enters
the GA from the south, through the Somali Basin, ultimately mixes with the high saline RSW
to produce the GABW with salinity more than 34.80 psu. The mixing of warm RSW with
cooler water from the south leaves a wide range of potential temperature (2-11 °C). The
percentage compositions estimated based on the mixing theory of water masses (Figure 10)
suggest the presence of ~ 10-20% RSW in the GABW. Fedorov and Meshchanov (1988) and
Mecking and Warner (1999) have shown that some RSW remains relatively undiluted (at >
27.5) as it flows out of the Red Sea and descends in the western GA. Hence, the bottom water
in the western most GA could be the RSW itself.
Acknowledgments
Hydrographic data from NODC and JODC were downloaded from
http://www.nodc.noaa.gov/OC5/WOD01/data2001.html, http://www.jodc.go.ip/service.htm,
the CTD profiles of the Netherlands Indian Ocean Programme were downloaded from the
NIOP website. The authors would like to acknowledge the help of J. Piechura for providing
the data collected during 1984-1985 by Marine Science Resource and Research Center
(MSRRC), Yemen. Suggestions from D. Shankar and V.S.N. Murty were very useful. Al
Saafani thanks Sana'a University, Government of Yemen for sponsoring the Ph. D. research

and the Director, NIO for support and computational facilities. The figures in this manuscript
were prepared using FERRET and GMT softwares. We also thank the two anonymous
reviewers for useful suggestions. This is NIO contribution 4165.

References
Al Saafani, M. A. and S. S. C. Shenoi (2006): Seasonal and Interannual Variability of eddy
field and surface circulation in the Gulf of Aden. Presented at “15 yeays of Progress in
Radar Altimetry Symposium” 13-18 March 2006, Venice, Italy.
Al Saafani, M. A. and S. S. C. Shenoi (2004): Seasonal cycle of hydrography in the Bab el
Mandab region, Southern Red Sea. Proceedings Earth and Planetary Sciences. Vol 113,3, pp
269 - 280.
Antonov, J.I., S. Levitus, T. P. Boyer, M. E. Conkright, T. O'Brien, C. Stephens and B.
Trotsenko (1998): World Ocean Atlas 1998 Vol. 3. Temperature of the Indian Ocean. NOAA
Atlas NESDIS 29, U.S. Government Printing Office, Washington, D.C.
Baars, M. A. (1994): Monsoons and pelagic systems, Cruise Reports Netherlands Indian
Ocean Programme, Vol. 1 (National Museum of Natural History, Leiden) 1994, pp. 143.
Beal, L. M. and T. K. Chereskin (2003): The volume transport of the Somali Current during
the 1995 southwest monsoon. Deep-Sea Res. II, 50, 2077-2090.
Bower, A. S., W. E. Johns, D. M. Fratantoni, and H. Peters (2005): Equilibration and
circulation of Red Sea Outflow Water in the western Gulf of Aden, J. Phys. Oceanogr., in
press.
Bower, A.S., D. H. Hunt, J. F. Price (2000): Character and dynamics of the Red Sea and
Persian Gulf outflows. J. Geophys. Res. 105, C3, 6387-6414.
Boyer, T. P., and S. Levitus (1994): Quality control and processing of historical temperature,
salinity and oxygen data. NOAA Technical Report NESDIS 81, 65 pp.
Boyer, T.P., C. Stephens, J.I. Antonov, M.E. Conkright, R. A. Locarnini, T. D. O'Brien, and
H. E. Garcia, (2002) : World Ocean Atlas 2001 Vol. 2. Salinity, S. Levitus, Ed. NOAA Atlas
NESDIS 50, U.S. Government Printing Office, Washington, D.C., 176 pp.

Boyer, T.P., S. Levitus, J.I. Antonov, M.E. Conkright, T. O'Brien, C. Stephens, and B.
Trotsenko (1998): World Ocean Atlas 1998 Vol. 6. Salinity of the Indian Ocean. NOAA Atlas
NESDIS 32, U.S. Government Printing Office, Washington, D.C.
Fedorov, K. N. and S. L. Meshchanov (1988): Structure and Propagation of Red Sea Waters in
The Gulf of Aden. Oceanology, Vol. 28, 3, pp 279 - 284.
Fischer, J., F. Schott, and L. Stramma (1996): Currents and transports of the Great Whirl-
Socotra Gyre system during the summer monsoon, August 1993, J. Geophys. Res., 101, 3573-
3587.
Johnson,G. C., D. L. Musgrave, B. A. Warren, A. Ffield, and D. B. Olson (1998): Flow of
Bottom and Deep Water in the Amirante Passage and Mascarene Basin. J. Geophys. Res.,
Vol. 103, No C13, pp 30973 - 30984.
Khimitsa, V. A. (1968): The hydrological structure of the waters of the Gulf of Aden.
Oceanology, Vol. 8, pp 318 - 322.
Mecking, S. and M. J. Warner (1999): Ventilation of Red Sea water with respect to Chloro
norocarbons. J. Geophys. Res., 104, 11087-11097.
Millard, C., and G. Soliman (1986): Hydrography of the Red Sea and exchanges with the
Indian Ocean in summer, Oceanol. Acta., 9, 249-269.
Mohamed, E. E. E., S. H. Sharaf El-Din, and A. A. H. El- Gindy (1996): Dynamic and
Hydrographic Structure in the Red Sea and Gulf of Aden. In: Present and Future of
Oceanographic Programs in Developing Countries,Vienna and Honolulu. Durvasula,-S.V.,
Visakhapatnam-India Andhra-University 1996 no. 3 pp. 78-101.
Mohammed, Ebtessam E. E. (1997): On the Variability, Potential Energy, Potential
temperature, Salinity and Currents in NW Indian Ocean and Gulf of Aden. JKAU. Mar.
Sci., Vol. 8, pp 47-65.

Montgomery, R. B. (1958): Water characteristics of Atlantic Ocean and of world. Deep-Sea-
Res., vol. 5,pp 134 to 148.
Morrison, J. M. (1997): Inter-monsoonal Changes in the T-S Properties of the Near-Surface
Waters of the Northern Arabian Sea, Geophys. Res. Lett., 24(21), 2553 - 2556.
Murray, S. P. and W. Johns (1997): Direct observations of seasonal exchange through the
Bab el Mandab Strait, Geophys. Res. Lett., 24, 2557-2560
Nasser, G. A. (1992): Seasonal changes in the water characteristics of upper 1000 m in the
northern Gulf of Aden. In Scientific investigation of the Gulf of Aden. Vol. II. Mar. Sci. and
Resources Res. Center, Aden, Yemen.
Ozgokman, T. M., W. E. Johns, H. Peters, and S. Matt (2003): Turbulent Mixing in the Red
Sea Outflow Plume from a High-Resolution Nonhydrostatic Model. J. Phys. Oceanogr., 33,
1846 - 1869.
Peter, H., and W. E. Johns (2005): Mixing and Entrainment in the Red Sea Outflow Plume.
II. Turbulence Characteristics. J. Phys. Oceanogr., Vol 35, 5,pp 584-600.
Peter, H., W. E. Johns, E. S. Bower, and D. M. Fratantoni (2005): Mixing and Entrainment
in the Red Sea Outflow Plume. I. Plume Structure. J. Phys. Oceanogr., Vol 35, 5,pp 569-
583.
Piechura, J. and O. A. G. Sobaih (1986): Oceanographic Conditions of the Gulf of Aden.
Sci. Invest. Gulf Aden, Series A: Oceanography, No. 2.

Quadfasel, D., and F. Schott (1982): Water-Mass Distribution at Intermediate Layers off the
Somali Coast during the Onset of the Southwest Monsoon 1979. J. Phys. Oceanogr., 12,
1358-1372.
Quadfasel, D., J. Fischer, F. Schott, and L. Stramma (1997): Deep water exchange through
the Owen Fracture Zone in the Arabian Sea, Geophys. Res. Lett., 24, 2805 - 2808.
Rochford, D. J. (1964): Salinity maxima in the upper 1000 meters of the north Indian
Ocean. Aust. J. Mar. Freshw. Res., 15, 1-24.
Schott, F. A., and J. P. McCreary (2001): The monsoon circulation of the Indian Ocean.
Progress in Oceanography, 51, pp 1-123.
Shenoi, S. S. C., R. Shetye, A. D. Gouveia, and G. S. Micheal (1993): Salinity extrema in
the Arabian Sea, in Monsoon Biogeochemistry edited by V. Ittickkot and R. R. Nair, pp. 37
- 49, Mitt Geol. Palaont. Inst. Univ. Hamburg, Humburg, Germany.
Stephens, C ., J.I. Antonov, T. P. Boyer, M.E. Conkright, R. A. Locarnini, T. D. O'Brien,
and H. E. Garcia, (2002) : World Ocean Atlas 2001 Vol. 1. Temperature, S. Levitus, Ed.
NOAA Atlas NESDIS 49, U.S. Government Printing Office, Washington, D.C., 176 pp.
Stirn, J., R. Edwards, J. Pichura, M. Savich, M. Ghaddaf, M. Fadel, F. Mutlag, O. A. G.
Sobaif, A. Al-Sayed, A. Shaer, and Z. Zubairi (1985): Oceanographic conditions, pelagic
productivity and living resources in the Gulf of Aden. IOC/UNESCO Workshop on
Regional Co-operation in Marine Science in the Central Indian Ocean and Adjacent Seas
and Gulfs, Colombo, Report No. 37, 225 pp.

Swallow,J. C., R. L. Molinari, J. G. Bruce, O. B. Brown, and R. H. Evans (1983):
Development of near-surface flow pattern and water mass distribution in the Somali Basin
in response to the southwest monsoon of 1979, J. Phys. Oceanogr., 13, 1398-1415.
Tchernia, P. (1980): Descriptive regional oceanography., (Pergamon Marine Series, 3);
Pergamon, Oxford, UK.; XVIII + 253pp.
Tomczak, M. JR. (1981a): Non-isopycnal mixing in the frontal zone of South and North
Atlantic Central Water off North-West Africa. Progress in Oceanography, Vol. 10, 3, pp
173-192.
Tomczak, M. JR. (1981b): A multi-parameter extension of temperature/salinity diagram
techniques for the analysis of non-isopycnal mixing. Progress in Oceanography, Vol. 10, 3,
pp 173-192.
Warren, B. A., H. Stommel, and J. C. Swallow (1966): Water masses and pattern of flow in
the Somali Basin during the southwest monsoon of 1964, Deep Sea Res., 5: 108 - 109.
Wyrtki, k. (1971): Oceanographic Atlas of the International Indian Ocean Expedition, 521 +
xi pp., Super. Of Doc., U.S. Gov. Print. Off., Washington, D. C. (1971)
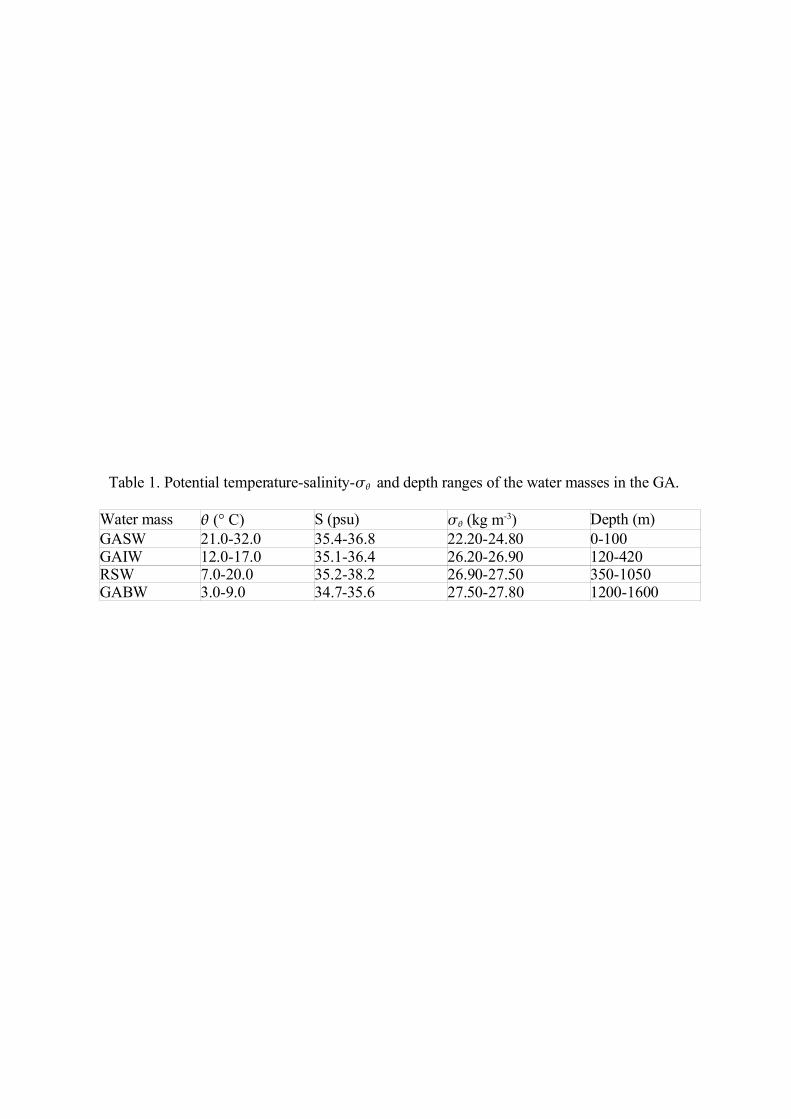
Table 1. Potential temperature-salinity- and depth ranges of the water masses in the GA.
Water mass (° C) S (psu) (kg m-3) Depth (m)GASW 21.0-32.0 35.4-36.8 22.20-24.80 0-100GAIW 12.0-17.0 35.1-36.4 26.20-26.90 120-420RSW 7.0-20.0 35.2-38.2 26.90-27.50 350-1050GABW 3.0-9.0 34.7-35.6 27.50-27.80 1200-1600

Table 2. Thermohaline indices for the four water masses in the GA.
Water mass (°C) Salinity (psu) Oxygen (ml L-1)GASW 27.00 36.10 5.00GAIW 14.50 35.25 0.70RSW 18.50 37.90 0.50GABW 3.10 34.80 2.00

List of figures
Figure 1: Area map of Gulf of Aden and distribution of the location of temperature-salinity
profiles used to identify the water masses. 4088 T-S profiles were used; among them 2641
also contained oxygen data. The distribution of data is shown separately for (a) summer (1705
-S profiles) and (b) winter (2383 -S profiles). The line along the axis of the Gulf represents
the east-west axis of GA (approximately). Sections shown in figure 6 and 10 pertain to this
line.
Figure 2: Typical -S curve for GA. Four water masses are identified from the profiles.
Figure 3: -S diagram for GA for all months. All available profiles from the GA (west of 51o
E) are included. Profiles from the region west of 45o E are in red (western region), those in the
region between 45-49o E are in black (central region) and those from the region between 49o E
and 51o E are in blue (eastern region). Number of -S profiles available during each month is
also indicated.
Figure 4: Histograms of potential density, potential temperature and salinity for GASW,
GAIW, RSW and GABW. The histograms were constructed by counting the data values
constrained within the -S- ranges given in Table 1.
Figure 5: Horizontal distribution of the water masses during summer (August - September)
and winter (January - February). The salinity (psu) in the core layer of the water mass is used
to trace the spread of the water mass. The contours represent depth of core layer.
Figure 6: Vertical section of salinity (psu) along the east-west axis of GA (see Figure 1) (a)
for winter (January - February) and (b) for summer (August - September.). contours are
also shown.
Figure 7: -S-V diagram constructed for an annual mean profile from the Gulf of Aden. The
volumes (x1011 m3) occupied by GASW, GAIW, RSW and GABW are marked in different
shades. Thin lines represent the 0.5 oC x 0.1 psu -S grid. The -S grids used to estimate
volumes of water masses are shown in different shades. The lines are also shown.
Assuming an average depth of 2000 m, the total volume of GA is ~ 4840×1011 m3.
Figure 8: East-west variations in the volumes of water masses in the GA (x1011 m3).
Meridonally (1o wide longitude bands) averaged -S profiles were used to estimate the
volumes following the -S-V diagrams.
Figure 9: Typical mixing triangles for the western and eastern GA. They were used to
identify the thermohaline indices of water masses (see Table 2).
Figure 10: Percentage composition of GA water. The water in the GA is presumed to be
constituted due to the four water masses, namely, GASW, GAIW, RSW, and GABW.
Figure 11: -S curves at selected locations in the western Arabia Sea (see the corresponding
map on the right side for the location of profiles) during winter and summer. Climatologies of
Antonov et al. (1998) and Boyer et al. (1998) are used. The location of -S profiles were
selected along three probable pathways of the water that might contribute to the GAIW. (a)
from Persian Gulf to GA, (b) from the western Arabian sea to GA and (c) from the western
equatorial Indian Ocean to GA.
Figure 12: As Figure 11, except that curves are for O2 vs . This figure is also used to trace
the pathway of GABW.