Embed Size (px)
Citation preview
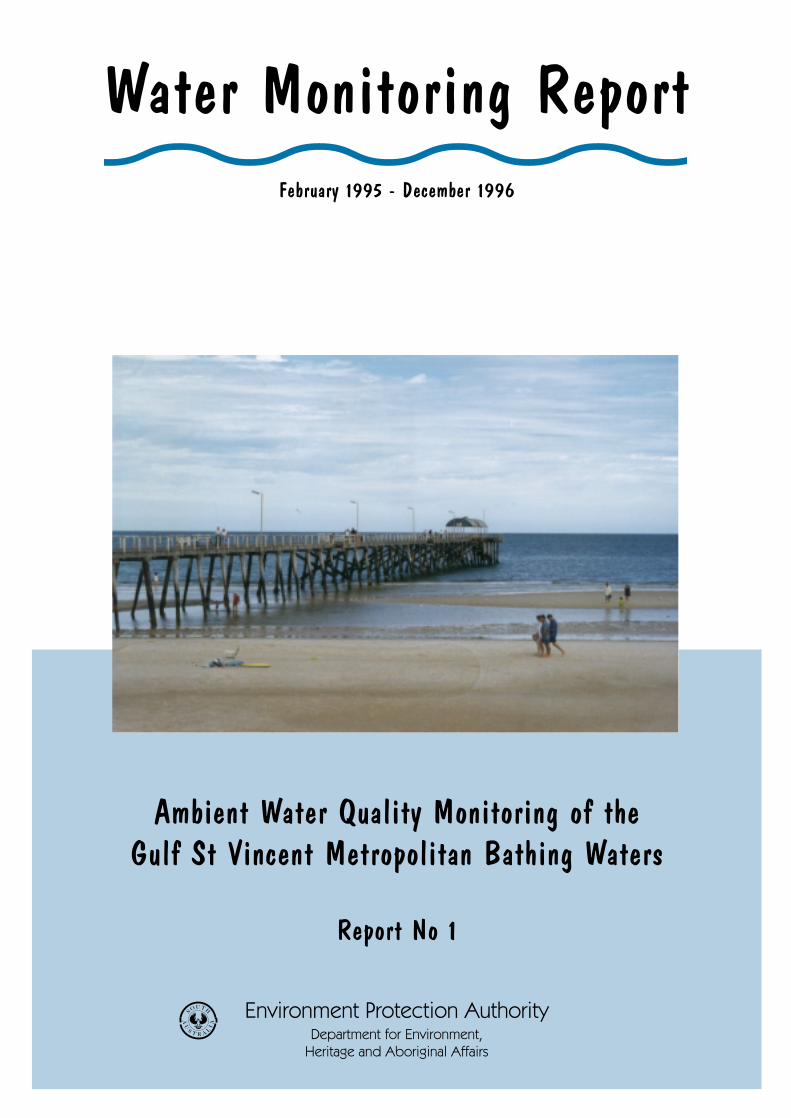
Water Monitoring ReportFebruary 1995 - December 1996
Report No 1
Environment Protection Authority Department for Environment,
Heritage and Aboriginal Affairs
Ambient Water Quality Monitoring of the Gulf St Vincent Metropolitan Bathing Waters
Cover Photograph: Henley Beach Jetty, a site for ambient water quality monitoring
November 1997
Document Production Environment Protection AuthorityDepartment for Environment, Heritage and Aboriginal AffairsGPO Box 2607ADELAIDE SA 5001
Telephone: 08 8204 2004Fax: 08 8204 2050Free Call: 1800 623 445
ISSN 1328-9926
© Copyright Environment Protection Authority
Printed on Recycled Paper
SUMMARY
This report summerises the water quality of the Adelaide metropolitan bathing waters between February 1995 and December 1996.
Monthly samples are collected off each of the metropolitan jetties and at Port Hughes (York Peninsula) and analysed for nutrients (ammonia, oxidised nitrogen, total Kjeldahl nitrogen (TKN) and phosphate), heavy metals (lead, zinc, copper, aluminium, chromium and nickel), water clarity or turbidity, chlorophyll (indicative of algae) and microbiological indicators of faecal contamination (faecal coliforms, faecal streptococci and Enterococci). The Port Hughes site is included in the program as a reference site for comparison purposes.
The report sets criteria for each characteristic such that water quality can be described broadly as good, moderate or poor.
Based on the preliminary findings of the ambient water quality monitoring programme water quality of the metropolitan bathing waters can be described as moderate for the following reasons:
1. Nutrients (ammonia) concentrations are elevated at all sites.
2. Water clarity as determined by turbidity measurements is moderate at many of the sites monitored.
3. Chlorophyll concentrations are moderate to high at all sites.
4. Heavy metal (copper, lead and zinc) concentrations are moderate at some sites.
5. Microbiological quality is moderate at a number of sites. In addition samples from some sites occasionally exceed the maximum number of indicator microorganisms in a sample (ANZECC Australian Water Quality Guidelines for Fresh and Marine Waters for primary contact) and have been classified as poor at times. Nevertheless, taken over the whole period, all sites meet the NHMRC Australian Guidelines for Recreational Use of Water.
The Port Hughes reference site has good water quality for all the characteristics measured. Concentrations of nutrients, turbidity, heavy metals and numbers of microbiological indicator organisms are considered to be representative of background levels at unimpacted sites.
A number of initiatives should improve bathing water quality over time. These include nutrient reduction and effluent reuse programmes for the sewage treatment works, environment improvement programmes being established by industry, catchment management plans to deal with pollution at source, and the development of extensive wetlands to treat stormwater. These initiatives should reduce nutrient concentrations over time and, as a result, also improve water clarity and chlorophyll levels. They should also help to reduce heavy metal concentrations.
Updates of these results will be published annually.
CONTENTS 1 INTRODUCTION.....................................................................................................................1
1.1 AMBIENT WATER QUALITY............................................................................................11.2 THE METROPOLITAN BATHING WATERS........................................................................11.3 WHAT IS MONITORED......................................................................................................2
2 ASSESSMENT METHODS.......................................................................................................3
2.1 STATISTICAL METHODS..................................................................................................32.2 WATER QUALITY CLASSIFICATION.................................................................................32.3 DIFFERENCES BETWEEN SITES........................................................................................4
3 ASSESSMENT OF THE DATA.................................................................................................5
3.1 NUTRIENTS.......................................................................................................................53.2 WATER CLARITY..............................................................................................................73.3 ALGAE...............................................................................................................................83.4 HEAVY METALS................................................................................................................93.5 MICROBIOLOGICAL..........................................................................................................14
4 CONCLUDING REMARKS......................................................................................................19
5 FURTHER READING..............................................................................................................20
1 INTRODUCTION The Environment Protection Authority is undertaking an ambient water quality monitoring programme designed to provide a long term assessment of water quality in Gulf St Vincent metropolitan bathing waters. The programme began in February 1995 and each month samples are taken from eight sites and analysed. The sites chosen are used for primary and secondary contact uses including swimming and fishing. The characteristics monitored were determined on the basis of protecting human health and the marine ecosystem. This report summarises the preliminary results of the programme.
The objectives of the ambient water quality monitoring programme are to:
• provide a qualitative and quantitative assessment of the water quality of metropolitan bathing waters
• determine statistically significant changes or trends in the key variables of water quality
• provide data to assess the long term ecologically sustainable development of metropolitan bathing waters.
1.1 AMBIENT WATER QUALITY Ambient water quality refers to the overall quality of waterbodies and indicates the quality of water when all the effects that may impact upon quality are considered rather than just the effects of particular discharges. The results in this report are indicative of water quality over the period from February 1995 to December 1996.
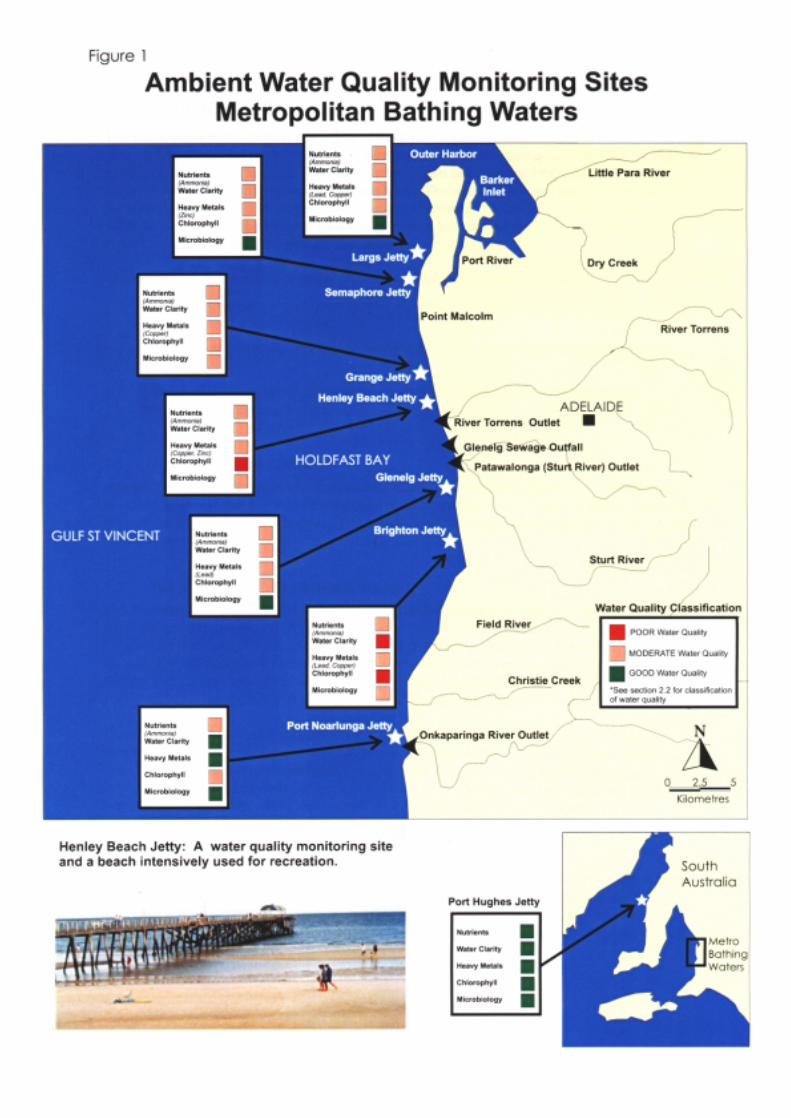
1.2 THE METROPOLITAN BATHING WATERS The metropolitan bathing water sites used in the monitoring programme are located along the metropolitan coast of Gulf St Vincent from Port Noarlunga to Semaphore and at Port Hughes on the Yorke Peninsula (figure 1). All these areas are subject to recreational uses including swimming and fishing, and to a number of environmental impacts including stormwater drains, sewage treatment plant outfalls, and stormwater discharge from the Torrens, Patawalonga, Onkaparinga, Sturt and Port Adelaide rivers.
These impacts have contributed to a number of environmental problems including a substantial reduction in the extent and density of seagrass beds along the metropolitan coastline. The loss has been attributed to epiphytic growths caused by high nutrients contained in effluent discharges from Adelaide’s metropolitan sewage treatment works, storm water drains and other discharges. Port Hughes was chosen as a reference site because it has an intact and healthy seagrass community and is located on the eastern side of Spencer Gulf at a similar latitude to Adelaide.
Other impacts include reductions in water clarity from stormwater discharge containing suspended sediment which limits the availability of light essential for plant growth. Suspended sediment also deposits on marine features, such as reef habitats and can smother sessile organisms. Excess nutrients from discharges have increased the growth of nuisance algae, such as Ulva (Sea Cabbage).
1
The environmental values for the metropolitan coastal waters are therefore protection of water quality:
• to support the aquatic ecosystem
• for recreation and aesthetic uses including swimming, boating and fishing.
1.3 WHAT IS MONITORED Characteristics monitored in the programme are:
• nutrients (total Kjeldahl nitrogen (TKN), phosphate, ammonia, oxidised nitrogen)
• chlorophyll a which indicates the presence of algae
• heavy metals (lead, zinc, copper, aluminium, chromium and nickel)
• indicators of faecal contamination (faecal coliforms, faecal streptococci and Enterococci)
• water clarity (turbidity).
The characteristics measured are based on the water quality requirements to support the designated environmental values in the Australian Guidelines for Fresh and Marine Waters (ANZECC 1992).
2
2 ASSESSMENT METHODS
2.1 STATISTICAL METHODS The purpose of a monitoring programme is to assess the continuing water quality of the whole system by taking occasional, small and representative samples. It is clearly an uncertain process and if the data are to represent the true situation, the degree of uncertainty must be quantified. Some relatively simple statistical procedures can be used to assist in this understanding, including the use of confidence intervals (a known degree of confidence that the interval covers the true value) and control charts.
Tables of values listed in this report quote the mean, the 95% confidence intervals for the mean and the standard deviation. Other statistical parameters used are the median, and the 90th and 10th percentiles. The percentiles are used in lieu of a maximum and minimum to indicate the range, whereas the standard deviation indicates the spread of the data from the mean. The 90th percentile and the median (the 50th percentile) are used to determine broad water quality classifications.
For microbiological data with pronounced skewed data sets (the mean and the median are substantially different) logarithmic transformations were used to derive the geometric mean. The 95% upper and lower confidence limits for the geometric mean is given in ranges GML – GMU.
2.2 WATER QUALITY CLASSIFICATION It is useful to broadly classify the water quality at each site as good, moderate or poor. As there are no accepted national criteria that can be used for such classifications the following criteria have been developed based on the percentage of time that the water quality conditions exceed the ANZECC Australian Water Quality Guidelines for Fresh and Marine Waters and other criteria. It is recognised that the classifications used are somewhat arbitrary but they do provide a useful and relatively simple means of broadly classifying the water quality.
A. Heavy metals
• GOOD: 90th percentile is less than or equal to the ANZECC Australian Guidelines for Fresh and Marine Waters - protection of aquatic marine ecosystems. Water quality is good provided the ANZECC guidelines are not exceeded, or are only exceeded on the odd occasion.
• MODERATE: 90th percentile is greater than the ANZECC guideline but the median is less than the ANZECC guideline.
• POOR: Median is greater than or equal to the ANZECC guideline OR any single measurement is more than 10 times the ANZECC guideline. The water quality is poor if concentrations exceed the ANZECC guideline more than 50% of the time or a single measurement is at the concentration where acute toxic effects may be observed in some organisms.
3
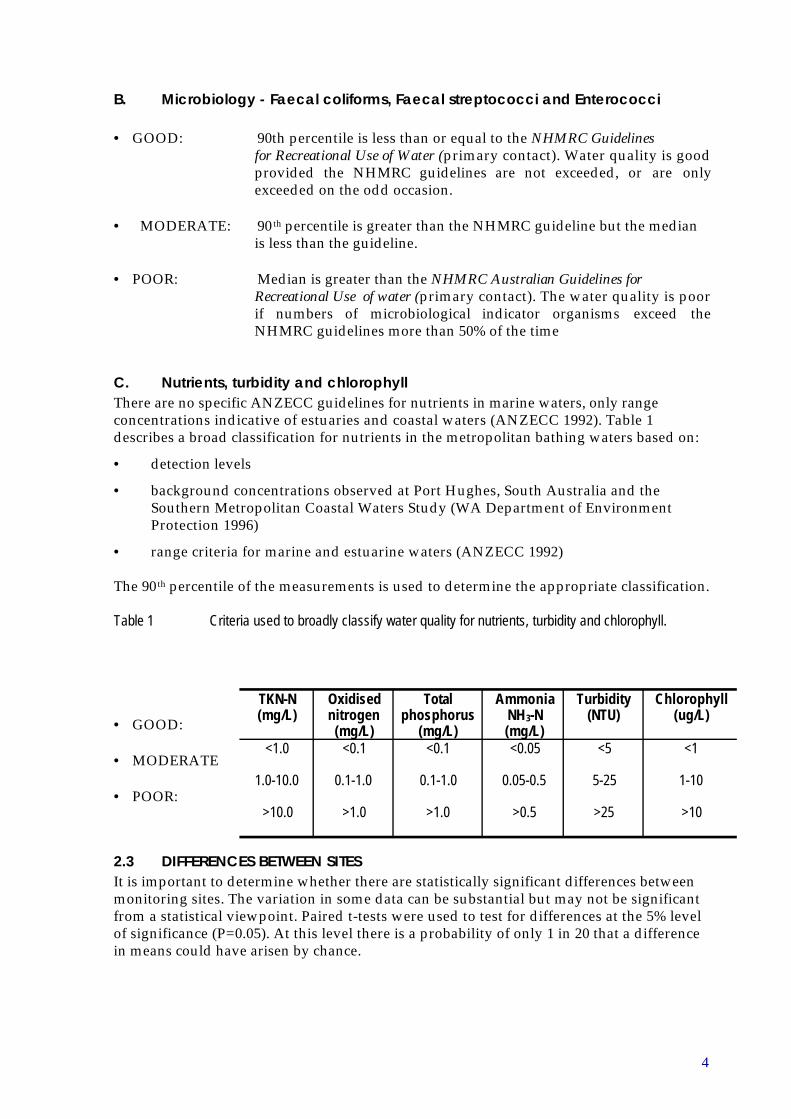
B. Microbiology - Faecal coliforms, Faecal streptococci and Enterococci
• GOOD: 90th percentile is less than or equal to the NHMRC Guidelines for Recreational Use of Water (primary contact). Water quality is good provided the NHMRC guidelines are not exceeded, or are only exceeded on the odd occasion.
• MODERATE: 90th percentile is greater than the NHMRC guideline but the median is less than the guideline.
• POOR: Median is greater than the NHMRC Australian Guidelines for Recreational Use of water (primary contact). The water quality is poor if numbers of microbiological indicator organisms exceed the NHMRC guidelines more than 50% of the time
C. Nutrients, turbidity and chlorophyll There are no specific ANZECC guidelines for nutrients in marine waters, only range concentrations indicative of estuaries and coastal waters (ANZECC 1992). Table 1 describes a broad classification for nutrients in the metropolitan bathing waters based on:
• detection levels
• background concentrations observed at Port Hughes, South Australia and the Southern Metropolitan Coastal Waters Study (WA Department of Environment Protection 1996)
• range criteria for marine and estuarine waters (ANZECC 1992)
The 90th percentile of the measurements is used to determine the appropriate classification.
Table 1 Criteria used to broadly classify water quality for nutrients, turbidity and chlorophyll.
• GOOD:
• MODERATE
• POOR:
TKN-N Oxidised Total Ammonia Turbidity Chlorophyll (mg/L) nitrogen phosphorus NH 3-N (NTU) (ug/L)
(mg/L) (mg/L) (mg/L) <1.0 <0.1 <0.1 <0.05 <5 <1
1.0-10.0 0.1-1.0 0.1-1.0 0.05-0.5 5-25 1-10
>10.0 >1.0 >1.0 >0.5 >25 >10
2.3 DIFFERENCES BETWEEN SITES It is important to determine whether there are statistically significant differences between monitoring sites. The variation in some data can be substantial but may not be significant from a statistical viewpoint. Paired t-tests were used to test for differences at the 5% level of significance (P=0.05). At this level there is a probability of only 1 in 20 that a difference in means could have arisen by chance.
4
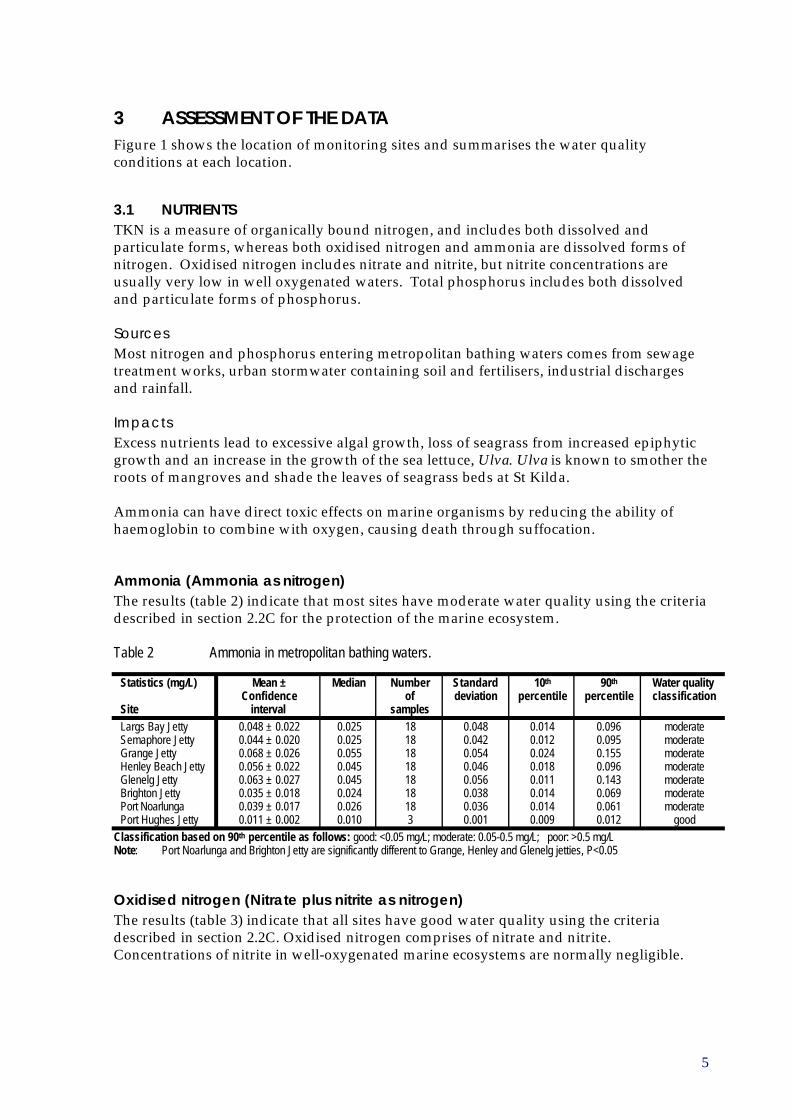
3 ASSESSMENT OF THE DATA Figure 1 shows the location of monitoring sites and summarises the water quality conditions at each location.
3.1 NUTRIENTS TKN is a measure of organically bound nitrogen, and includes both dissolved and particulate forms, whereas both oxidised nitrogen and ammonia are dissolved forms of nitrogen. Oxidised nitrogen includes nitrate and nitrite, but nitrite concentrations are usually very low in well oxygenated waters. Total phosphorus includes both dissolved and particulate forms of phosphorus.
Sources Most nitrogen and phosphorus entering metropolitan bathing waters comes from sewage treatment works, urban stormwater containing soil and fertilisers, industrial discharges and rainfall.
Impacts Excess nutrients lead to excessive algal growth, loss of seagrass from increased epiphytic growth and an increase in the growth of the sea lettuce, Ulva. Ulva is known to smother the roots of mangroves and shade the leaves of seagrass beds at St Kilda.
Ammonia can have direct toxic effects on marine organisms by reducing the ability of haemoglobin to combine with oxygen, causing death through suffocation.
Ammonia (Ammonia as nitrogen) The results (table 2) indicate that most sites have moderate water quality using the criteria described in section 2.2C for the protection of the marine ecosystem.
Table 2 Ammonia in metropolitan bathing waters.
Statistics (mg/L) Mean ± Median Number Standard 10th 90th Water quality Confidence of deviation percentile percentile classification
Site interval samples
Largs Bay Jetty 0.048 ± 0.022 0.025 18 0.048 0.014 0.096 moderate Semaphore Jetty 0.044 ± 0.020 0.025 18 0.042 0.012 0.095 moderate Grange Jetty 0.068 ± 0.026 0.055 18 0.054 0.024 0.155 moderate Henley Beach Jetty 0.056 ± 0.022 0.045 18 0.046 0.018 0.096 moderate Glenelg Jetty 0.063 ± 0.027 0.045 18 0.056 0.011 0.143 moderate Brighton Jetty 0.035 ± 0.018 0.024 18 0.038 0.014 0.069 moderate Port Noarlunga 0.039 ± 0.017 0.026 18 0.036 0.014 0.061 moderate Port Hughes Jetty 0.011 ± 0.002 0.010 3 0.001 0.009 0.012 good
Classification based on 90th percentile as follows: good: <0.05 mg/L; moderate: 0.05-0.5 mg/L; poor: >0.5 mg/L Note: Port Noarlunga and Brighton Jetty are significantly different to Grange, Henley and Glenelg jetties, P<0.05
Oxidised nitrogen (Nitrate plus nitrite as nitrogen) The results (table 3) indicate that all sites have good water quality using the criteria described in section 2.2C. Oxidised nitrogen comprises of nitrate and nitrite. Concentrations of nitrite in well-oxygenated marine ecosystems are normally negligible.
5
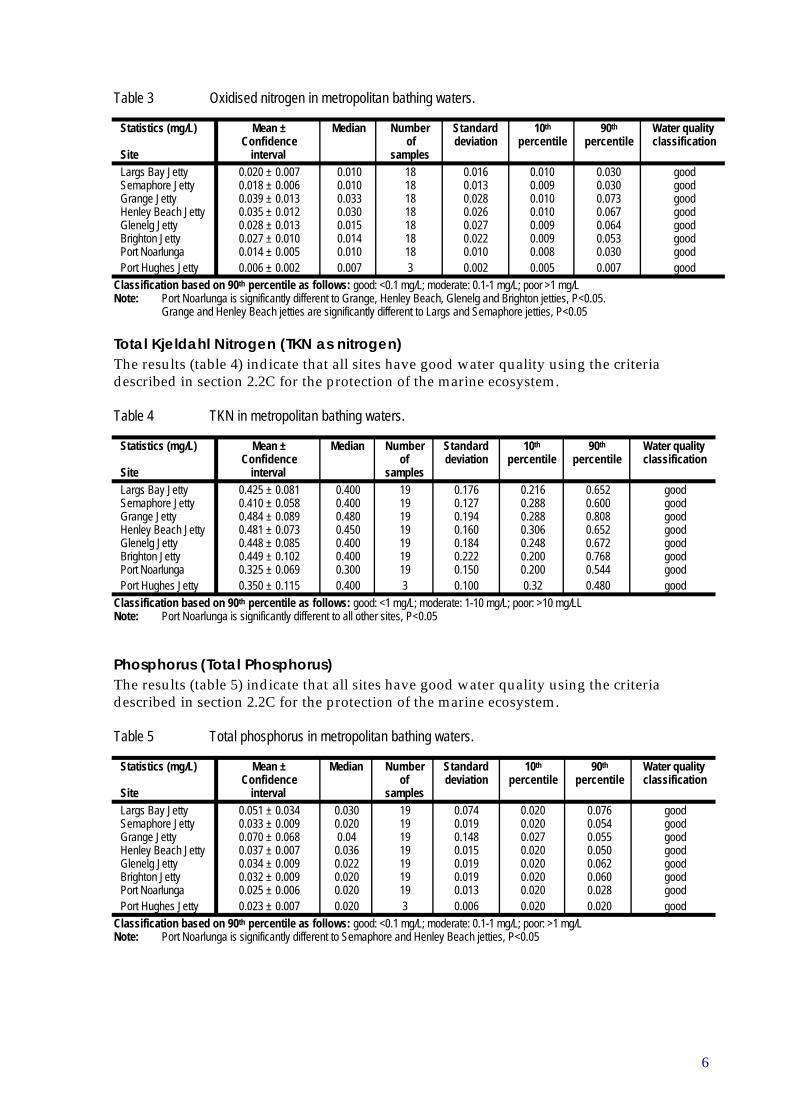
Table 3 Oxidised nitrogen in metropolitan bathing waters.
Statistics (mg/L) Mean ± Median Number Standard 10th 90th Water quality Confidence of deviation percentile percentile classification
Site interval samples
Largs Bay Jetty 0.020 ± 0.007 0.010 18 0.016 0.010 0.030 good Semaphore Jetty 0.018 ± 0.006 0.010 18 0.013 0.009 0.030 good Grange Jetty 0.039 ± 0.013 0.033 18 0.028 0.010 0.073 good Henley Beach Jetty 0.035 ± 0.012 0.030 18 0.026 0.010 0.067 good Glenelg Jetty 0.028 ± 0.013 0.015 18 0.027 0.009 0.064 good Brighton Jetty 0.027 ± 0.010 0.014 18 0.022 0.009 0.053 good Port Noarlunga 0.014 ± 0.005 0.010 18 0.010 0.008 0.030 good Port Hughes Jetty 0.006 ± 0.002 0.007 3 0.002 0.005 0.007 good
Classification based on 90th percentile as follows: good: <0.1 mg/L; moderate: 0.1-1 mg/L; poor >1 mg/L Note: Port Noarlunga is significantly different to Grange, Henley Beach, Glenelg and Brighton jetties, P<0.05.
Grange and Henley Beach jetties are significantly different to Largs and Semaphore jetties, P<0.05
Total Kjeldahl Nitrogen (TKN as nitrogen) The results (table 4) indicate that all sites have good water quality using the criteria described in section 2.2C for the protection of the marine ecosystem.
Table 4 TKN in metropolitan bathing waters.
Statistics (mg/L) Mean ± Median Number Standard 10th 90th Water quality Confidence of deviation percentile percentile classification
Site interval samples
Largs Bay Jetty 0.425 ± 0.081 0.400 19 0.176 0.216 0.652 good Semaphore Jetty 0.410 ± 0.058 0.400 19 0.127 0.288 0.600 good Grange Jetty 0.484 ± 0.089 0.480 19 0.194 0.288 0.808 good Henley Beach Jetty 0.481 ± 0.073 0.450 19 0.160 0.306 0.652 good Glenelg Jetty 0.448 ± 0.085 0.400 19 0.184 0.248 0.672 good Brighton Jetty 0.449 ± 0.102 0.400 19 0.222 0.200 0.768 good Port Noarlunga 0.325 ± 0.069 0.300 19 0.150 0.200 0.544 good Port Hughes Jetty 0.350 ± 0.115 0.400 3 0.100 0.32 0.480 good
Classification based on 90th percentile as follows: good: <1 mg/L; moderate: 1-10 mg/L; poor: >10 mg/LL Note: Port Noarlunga is significantly different to all other sites, P<0.05
Phosphorus (Total Phosphorus) The results (table 5) indicate that all sites have good water quality using the criteria described in section 2.2C for the protection of the marine ecosystem.
Table 5 Total phosphorus in metropolitan bathing waters.
Statistics (mg/L) Mean ± Median Number Standard 10th 90th Water quality Confidence of deviation percentile percentile classification
Site interval samples
Largs Bay Jetty 0.051 ± 0.034 0.030 19 0.074 0.020 0.076 good Semaphore Jetty 0.033 ± 0.009 0.020 19 0.019 0.020 0.054 good Grange Jetty 0.070 ± 0.068 0.04 19 0.148 0.027 0.055 good Henley Beach Jetty 0.037 ± 0.007 0.036 19 0.015 0.020 0.050 good Glenelg Jetty 0.034 ± 0.009 0.022 19 0.019 0.020 0.062 good Brighton Jetty 0.032 ± 0.009 0.020 19 0.019 0.020 0.060 good Port Noarlunga 0.025 ± 0.006 0.020 19 0.013 0.020 0.028 good Port Hughes Jetty 0.023 ± 0.007 0.020 3 0.006 0.020 0.020 good
Classification based on 90th percentile as follows: good: <0.1 mg/L; moderate: 0.1-1 mg/L; poor: >1 mg/L Note: Port Noarlunga is significantly different to Semaphore and Henley Beach jetties, P<0.05
6
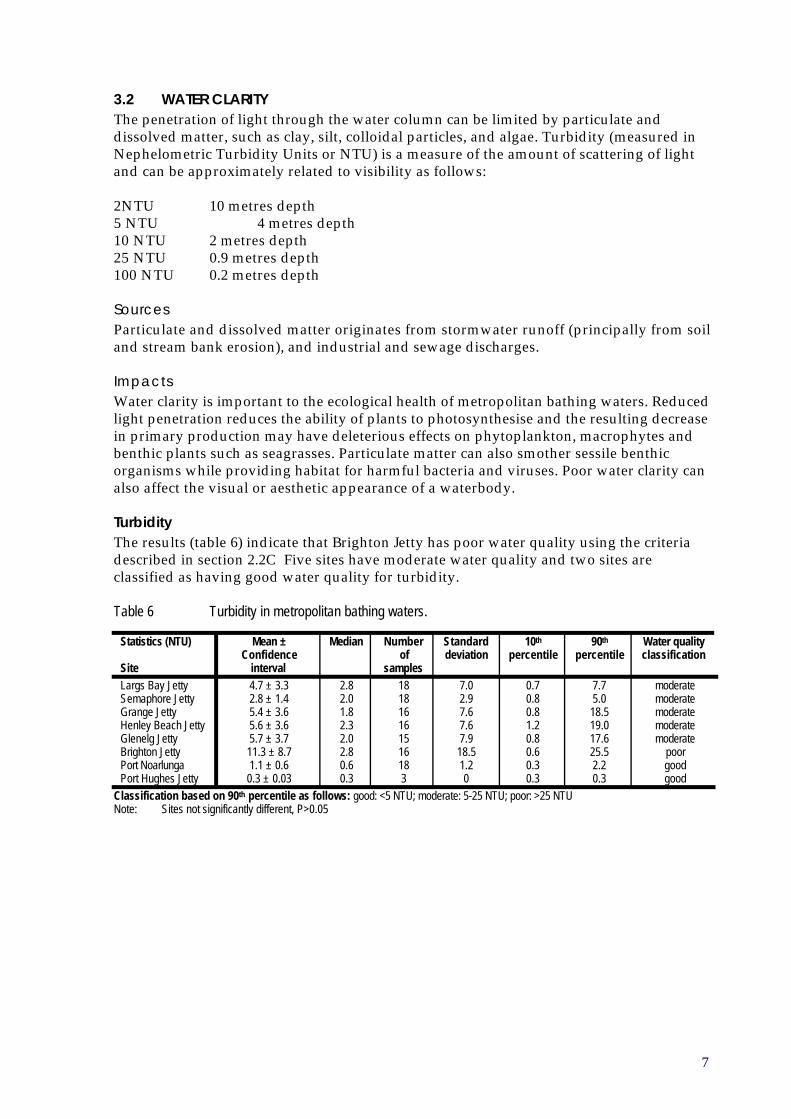
3.2 WATER CLARITY The penetration of light through the water column can be limited by particulate and dissolved matter, such as clay, silt, colloidal particles, and algae. Turbidity (measured in Nephelometric Turbidity Units or NTU) is a measure of the amount of scattering of light and can be approximately related to visibility as follows:
2NTU 10 metres depth 5 NTU 4 metres depth 10 NTU 2 metres depth 25 NTU 0.9 metres depth 100 NTU 0.2 metres depth
Sources Particulate and dissolved matter originates from stormwater runoff (principally from soil and stream bank erosion), and industrial and sewage discharges.
Impacts Water clarity is important to the ecological health of metropolitan bathing waters. Reduced light penetration reduces the ability of plants to photosynthesise and the resulting decrease in primary production may have deleterious effects on phytoplankton, macrophytes and benthic plants such as seagrasses. Particulate matter can also smother sessile benthic organisms while providing habitat for harmful bacteria and viruses. Poor water clarity can also affect the visual or aesthetic appearance of a waterbody.
Turbidity The results (table 6) indicate that Brighton Jetty has poor water quality using the criteria described in section 2.2C Five sites have moderate water quality and two sites are classified as having good water quality for turbidity.
Table 6 Turbidity in metropolitan bathing waters.
Statistics (NTU) Mean ± Median Number Standard 10th 90th Water quality Confidence of deviation percentile percentile classification
Site interval samples
Largs Bay Jetty 4.7 ± 3.3 2.8 18 7.0 0.7 7.7 moderate Semaphore Jetty 2.8 ± 1.4 2.0 18 2.9 0.8 5.0 moderate Grange Jetty 5.4 ± 3.6 1.8 16 7.6 0.8 18.5 moderate Henley Beach Jetty 5.6 ± 3.6 2.3 16 7.6 1.2 19.0 moderate Glenelg Jetty 5.7 ± 3.7 2.0 15 7.9 0.8 17.6 moderate Brighton Jetty 11.3 ± 8.7 2.8 16 18.5 0.6 25.5 poor Port Noarlunga 1.1 ± 0.6 0.6 18 1.2 0.3 2.2 good Port Hughes Jetty 0.3 ± 0.03 0.3 3 0 0.3 0.3 good
Classification based on 90th percentile as follows: good: <5 NTU; moderate: 5-25 NTU; poor: >25 NTU Note: Sites not significantly different, P>0.05
7
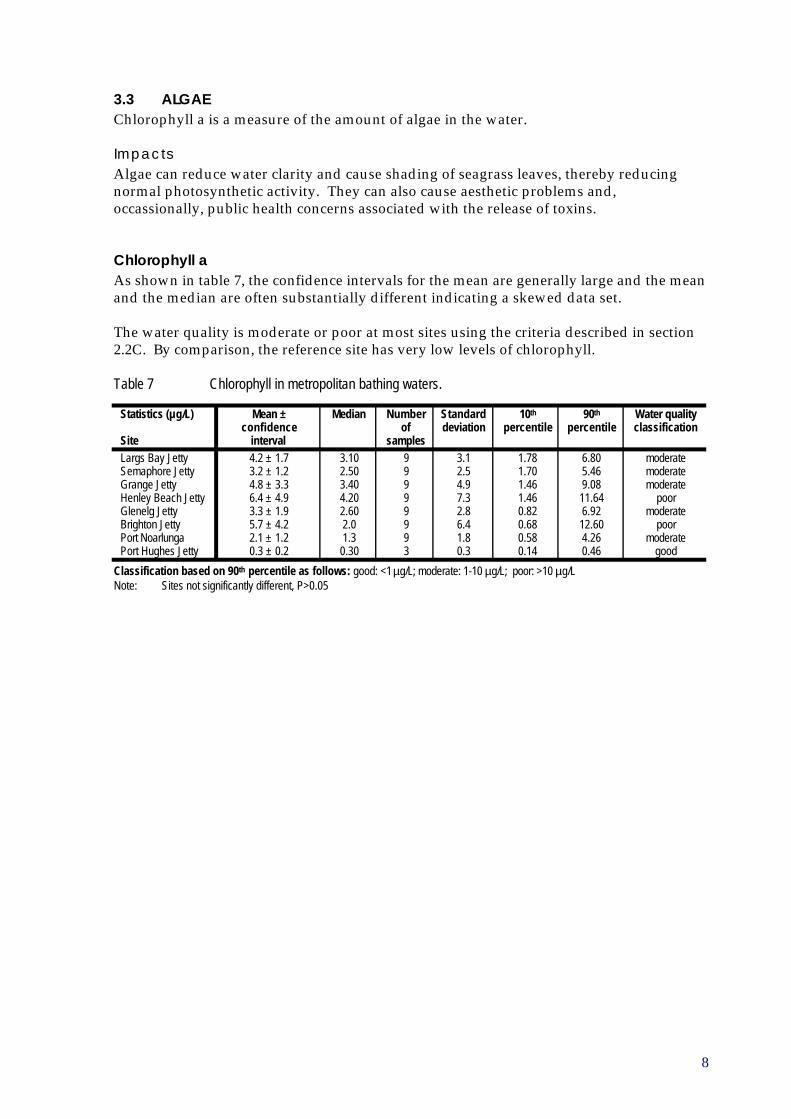
3.3 ALGAE Chlorophyll a is a measure of the amount of algae in the water.
Impacts Algae can reduce water clarity and cause shading of seagrass leaves, thereby reducing normal photosynthetic activity. They can also cause aesthetic problems and, occassionally, public health concerns associated with the release of toxins.
Chlorophyll a As shown in table 7, the confidence intervals for the mean are generally large and the mean and the median are often substantially different indicating a skewed data set.
The water quality is moderate or poor at most sites using the criteria described in section 2.2C. By comparison, the reference site has very low levels of chlorophyll.
Table 7 Chlorophyll in metropolitan bathing waters.
Statistics (µg/L) Mean ± Median Number Standard 10th 90th Water quality confidence of deviation percentile percentile classification
Site interval samples
Largs Bay Jetty 4.2 ± 1.7 3.10 9 3.1 1.78 6.80 moderate Semaphore Jetty 3.2 ± 1.2 2.50 9 2.5 1.70 5.46 moderate Grange Jetty 4.8 ± 3.3 3.40 9 4.9 1.46 9.08 moderate Henley Beach Jetty 6.4 ± 4.9 4.20 9 7.3 1.46 11.64 poor Glenelg Jetty 3.3 ± 1.9 2.60 9 2.8 0.82 6.92 moderate Brighton Jetty 5.7 ± 4.2 2.0 9 6.4 0.68 12.60 poor Port Noarlunga 2.1 ± 1.2 1.3 9 1.8 0.58 4.26 moderate Port Hughes Jetty 0.3 ± 0.2 0.30 3 0.3 0.14 0.46 good
Classification based on 90th percentile as follows: good: <1 µg/L; moderate: 1-10 µg/L; poor: >10 µg/L Note: Sites not significantly different, P>0.05
8
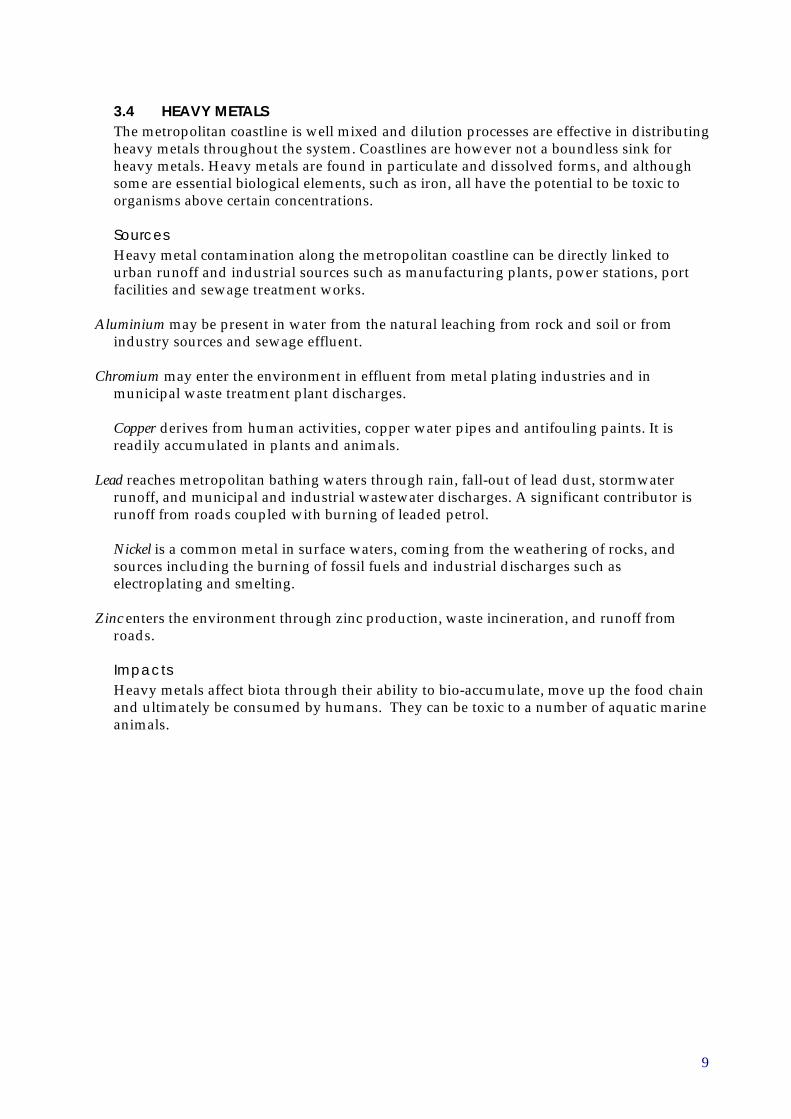
3.4 HEAVY METALS The metropolitan coastline is well mixed and dilution processes are effective in distributing heavy metals throughout the system. Coastlines are however not a boundless sink for heavy metals. Heavy metals are found in particulate and dissolved forms, and although some are essential biological elements, such as iron, all have the potential to be toxic to organisms above certain concentrations.
Sources Heavy metal contamination along the metropolitan coastline can be directly linked to urban runoff and industrial sources such as manufacturing plants, power stations, port facilities and sewage treatment works.
Aluminium may be present in water from the natural leaching from rock and soil or from industry sources and sewage effluent.
Chromium may enter the environment in effluent from metal plating industries and in municipal waste treatment plant discharges.
Copper derives from human activities, copper water pipes and antifouling paints. It is readily accumulated in plants and animals.
Lead reaches metropolitan bathing waters through rain, fall-out of lead dust, stormwater runoff, and municipal and industrial wastewater discharges. A significant contributor is runoff from roads coupled with burning of leaded petrol.
Nickel is a common metal in surface waters, coming from the weathering of rocks, and sources including the burning of fossil fuels and industrial discharges such as electroplating and smelting.
Zinc enters the environment through zinc production, waste incineration, and runoff from roads.
Impacts Heavy metals affect biota through their ability to bio-accumulate, move up the food chain and ultimately be consumed by humans. They can be toxic to a number of aquatic marine animals.
9
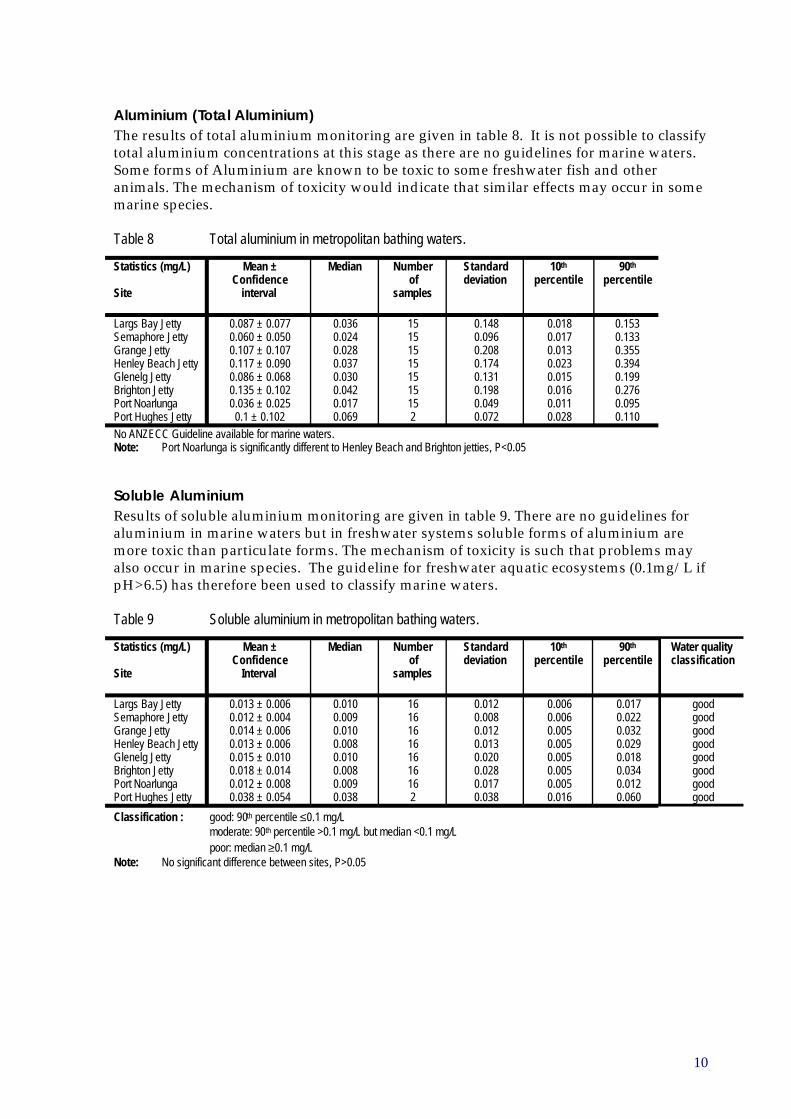
Aluminium (Total Aluminium) The results of total aluminium monitoring are given in table 8. It is not possible to classify total aluminium concentrations at this stage as there are no guidelines for marine waters. Some forms of Aluminium are known to be toxic to some freshwater fish and other animals. The mechanism of toxicity would indicate that similar effects may occur in some marine species.
Table 8 Total aluminium in metropolitan bathing waters.
Statistics (mg/L) Mean ± Median Number Standard 10th 90th
Confidence of deviation percentile percentile Site interval samples
Largs Bay Jetty 0.087 ± 0.077 0.036 15 0.148 0.018 0.153 Semaphore Jetty 0.060 ± 0.050 0.024 15 0.096 0.017 0.133 Grange Jetty 0.107 ± 0.107 0.028 15 0.208 0.013 0.355 Henley Beach Jetty 0.117 ± 0.090 0.037 15 0.174 0.023 0.394 Glenelg Jetty 0.086 ± 0.068 0.030 15 0.131 0.015 0.199 Brighton Jetty 0.135 ± 0.102 0.042 15 0.198 0.016 0.276 Port Noarlunga 0.036 ± 0.025 0.017 15 0.049 0.011 0.095 Port Hughes Jetty 0.1 ± 0.102 0.069 2 0.072 0.028 0.110
No ANZECC Guideline available for marine waters.Note: Port Noarlunga is significantly different to Henley Beach and Brighton jetties, P<0.05
Soluble Aluminium Results of soluble aluminium monitoring are given in table 9. There are no guidelines for aluminium in marine waters but in freshwater systems soluble forms of aluminium are more toxic than particulate forms. The mechanism of toxicity is such that problems may also occur in marine species. The guideline for freshwater aquatic ecosystems (0.1mg/L if pH>6.5) has therefore been used to classify marine waters.
Table 9 Soluble aluminium in metropolitan bathing waters.
Statistics (mg/L) Mean ± Median Number Standard 10th 90th Water quality Confidence of deviation percentile percentile classification
Site Interval samples
Largs Bay Jetty 0.013 ± 0.006 0.010 16 0.012 0.006 0.017 good Semaphore Jetty 0.012 ± 0.004 0.009 16 0.008 0.006 0.022 good Grange Jetty 0.014 ± 0.006 0.010 16 0.012 0.005 0.032 good Henley Beach Jetty 0.013 ± 0.006 0.008 16 0.013 0.005 0.029 good Glenelg Jetty 0.015 ± 0.010 0.010 16 0.020 0.005 0.018 good Brighton Jetty 0.018 ± 0.014 0.008 16 0.028 0.005 0.034 good Port Noarlunga 0.012 ± 0.008 0.009 16 0.017 0.005 0.012 good Port Hughes Jetty 0.038 ± 0.054 0.038 2 0.038 0.016 0.060 good
Classification : good: 90th percentile ≤0.1 mg/L moderate: 90th percentile >0.1 mg/L but median <0.1 mg/L poor: median ≥0.1 mg/L
Note: No significant difference between sites, P>0.05
10
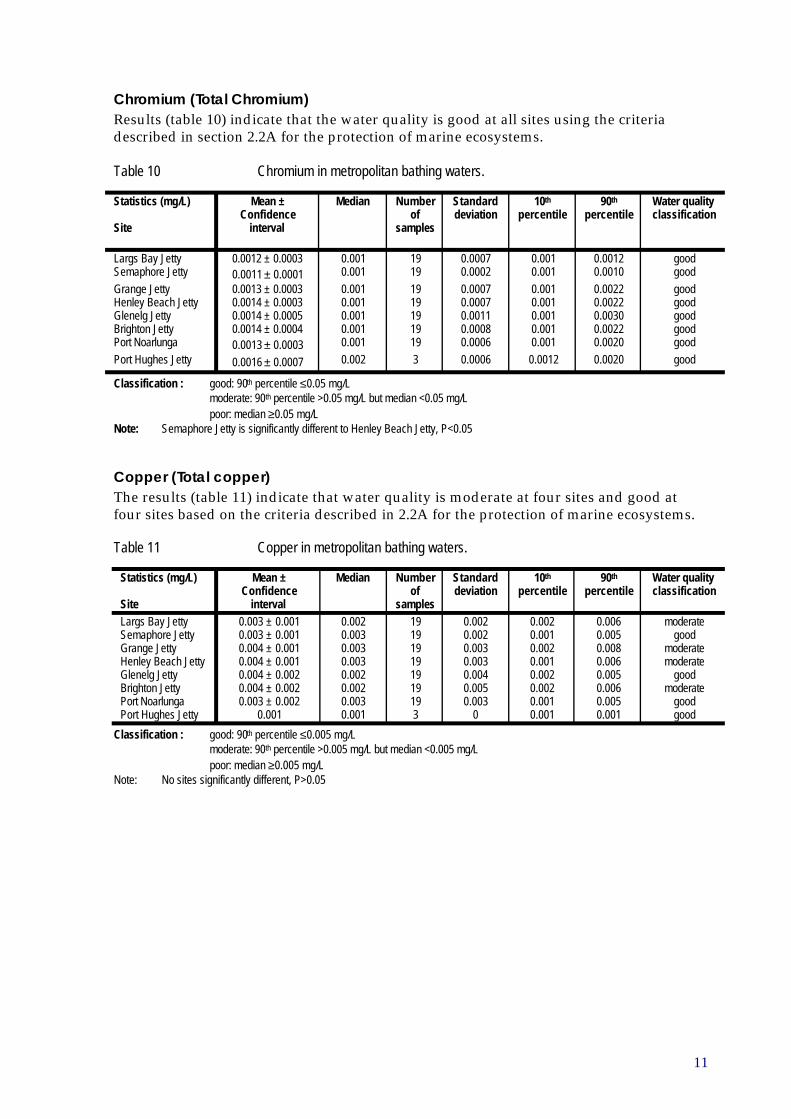
Chromium (Total Chromium) Results (table 10) indicate that the water quality is good at all sites using the criteria described in section 2.2A for the protection of marine ecosystems.
Table 10 Chromium in metropolitan bathing waters.
Statistics (mg/L) Mean ± Median Number Standard 10th 90th Water quality Confidence of deviation percentile percentile classification
Site interval samples
Largs Bay Jetty 0.0012 ± 0.0003 0.001 19 0.0007 0.001 0.0012 good Semaphore Jetty 0.0011 ± 0.0001 0.001 19 0.0002 0.001 0.0010 good
Grange Jetty 0.0013 ± 0.0003 0.001 19 0.0007 0.001 0.0022 good Henley Beach Jetty 0.0014 ± 0.0003 0.001 19 0.0007 0.001 0.0022 good Glenelg Jetty 0.0014 ± 0.0005 0.001 19 0.0011 0.001 0.0030 good Brighton Jetty 0.0014 ± 0.0004 0.001 19 0.0008 0.001 0.0022 good Port Noarlunga 0.0013 ± 0.0003 0.001 19 0.0006 0.001 0.0020 good
Port Hughes Jetty 0.0016 ± 0.0007 0.002 3 0.0006 0.0012 0.0020 good
Classification : good: 90th percentile ≤0.05 mg/L moderate: 90th percentile >0.05 mg/L but median <0.05 mg/L poor: median ≥0.05 mg/L
Note: Semaphore Jetty is significantly different to Henley Beach Jetty, P<0.05
Copper (Total copper) The results (table 11) indicate that water quality is moderate at four sites and good at four sites based on the criteria described in 2.2A for the protection of marine ecosystems.
Table 11 Copper in metropolitan bathing waters.
Statistics (mg/L) Mean ± Median Number Standard 10th 90th Water quality Confidence of deviation percentile percentile classification
Site interval samples
Largs Bay Jetty 0.003 ± 0.001 0.002 19 0.002 0.002 0.006 moderate Semaphore Jetty 0.003 ± 0.001 0.003 19 0.002 0.001 0.005 good Grange Jetty 0.004 ± 0.001 0.003 19 0.003 0.002 0.008 moderate Henley Beach Jetty 0.004 ± 0.001 0.003 19 0.003 0.001 0.006 moderate Glenelg Jetty 0.004 ± 0.002 0.002 19 0.004 0.002 0.005 good Brighton Jetty 0.004 ± 0.002 0.002 19 0.005 0.002 0.006 moderate Port Noarlunga 0.003 ± 0.002 0.003 19 0.003 0.001 0.005 good Port Hughes Jetty 0.001 0.001 3 0 0.001 0.001 good
Classification : good: 90th percentile ≤0.005 mg/L moderate: 90th percentile >0.005 mg/L but median <0.005 mg/L poor: median ≥0.005 mg/L
Note: No sites significantly different, P>0.05
11
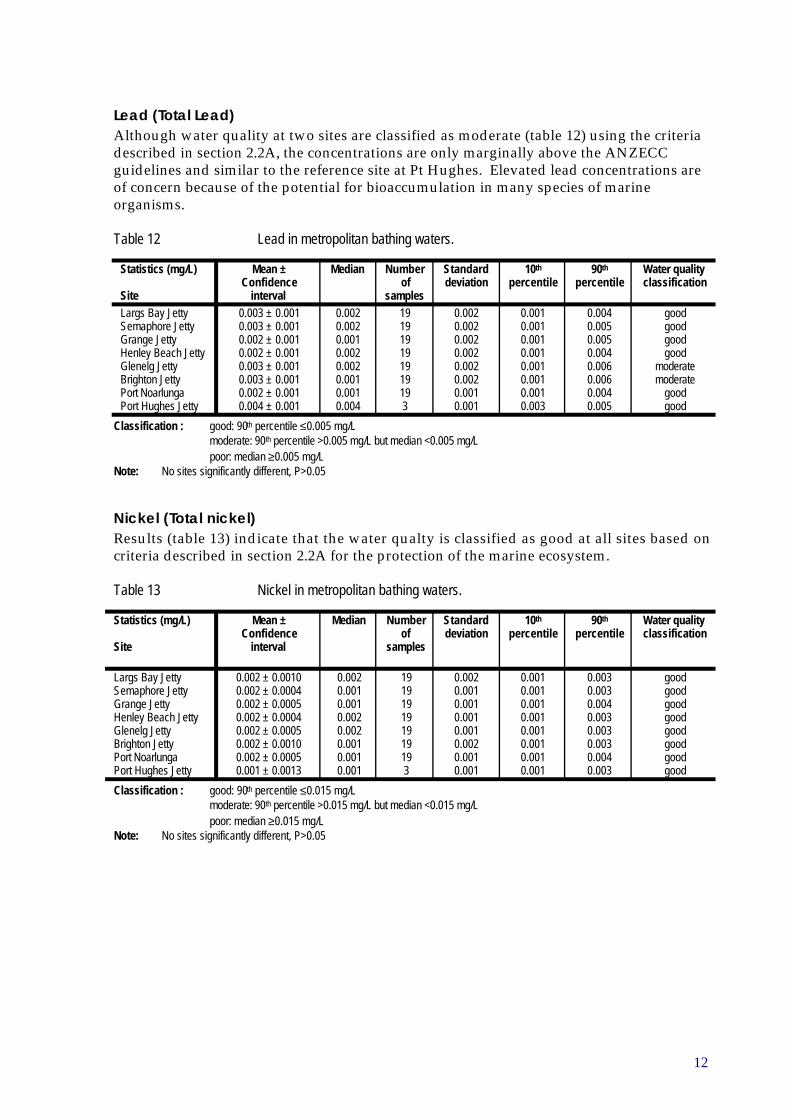
Lead (Total Lead) Although water quality at two sites are classified as moderate (table 12) using the criteria described in section 2.2A, the concentrations are only marginally above the ANZECC guidelines and similar to the reference site at Pt Hughes. Elevated lead concentrations are of concern because of the potential for bioaccumulation in many species of marine organisms.
Table 12 Lead in metropolitan bathing waters.
Statistics (mg/L) Mean ± Median Number Standard 10th 90th Water quality Confidence of deviation percentile percentile classification
Site interval samples
Largs Bay Jetty 0.003 ± 0.001 0.002 19 0.002 0.001 0.004 good Semaphore Jetty 0.003 ± 0.001 0.002 19 0.002 0.001 0.005 good Grange Jetty 0.002 ± 0.001 0.001 19 0.002 0.001 0.005 good Henley Beach Jetty 0.002 ± 0.001 0.002 19 0.002 0.001 0.004 good Glenelg Jetty 0.003 ± 0.001 0.002 19 0.002 0.001 0.006 moderate Brighton Jetty 0.003 ± 0.001 0.001 19 0.002 0.001 0.006 moderate Port Noarlunga 0.002 ± 0.001 0.001 19 0.001 0.001 0.004 good Port Hughes Jetty 0.004 ± 0.001 0.004 3 0.001 0.003 0.005 good
Classification : good: 90th percentile ≤0.005 mg/L moderate: 90th percentile >0.005 mg/L but median <0.005 mg/L poor: median ≥0.005 mg/L
Note: No sites significantly different, P>0.05
Nickel (Total nickel) Results (table 13) indicate that the water qualty is classified as good at all sites based on criteria described in section 2.2A for the protection of the marine ecosystem.
Table 13 Nickel in metropolitan bathing waters.
Statistics (mg/L) Mean ± Median Number Standard 10th 90th Water quality Confidence of deviation percentile percentile classification
Site interval samples
Largs Bay Jetty 0.002 ± 0.0010 0.002 19 0.002 0.001 0.003 good Semaphore Jetty 0.002 ± 0.0004 0.001 19 0.001 0.001 0.003 good Grange Jetty 0.002 ± 0.0005 0.001 19 0.001 0.001 0.004 good Henley Beach Jetty 0.002 ± 0.0004 0.002 19 0.001 0.001 0.003 good Glenelg Jetty 0.002 ± 0.0005 0.002 19 0.001 0.001 0.003 good Brighton Jetty 0.002 ± 0.0010 0.001 19 0.002 0.001 0.003 good Port Noarlunga 0.002 ± 0.0005 0.001 19 0.001 0.001 0.004 good Port Hughes Jetty 0.001 ± 0.0013 0.001 3 0.001 0.001 0.003 good
Classification : good: 90th percentile ≤0.015 mg/L moderate: 90th percentile >0.015 mg/L but median <0.015 mg/L poor: median ≥0.015 mg/L
Note: No sites significantly different, P>0.05
12
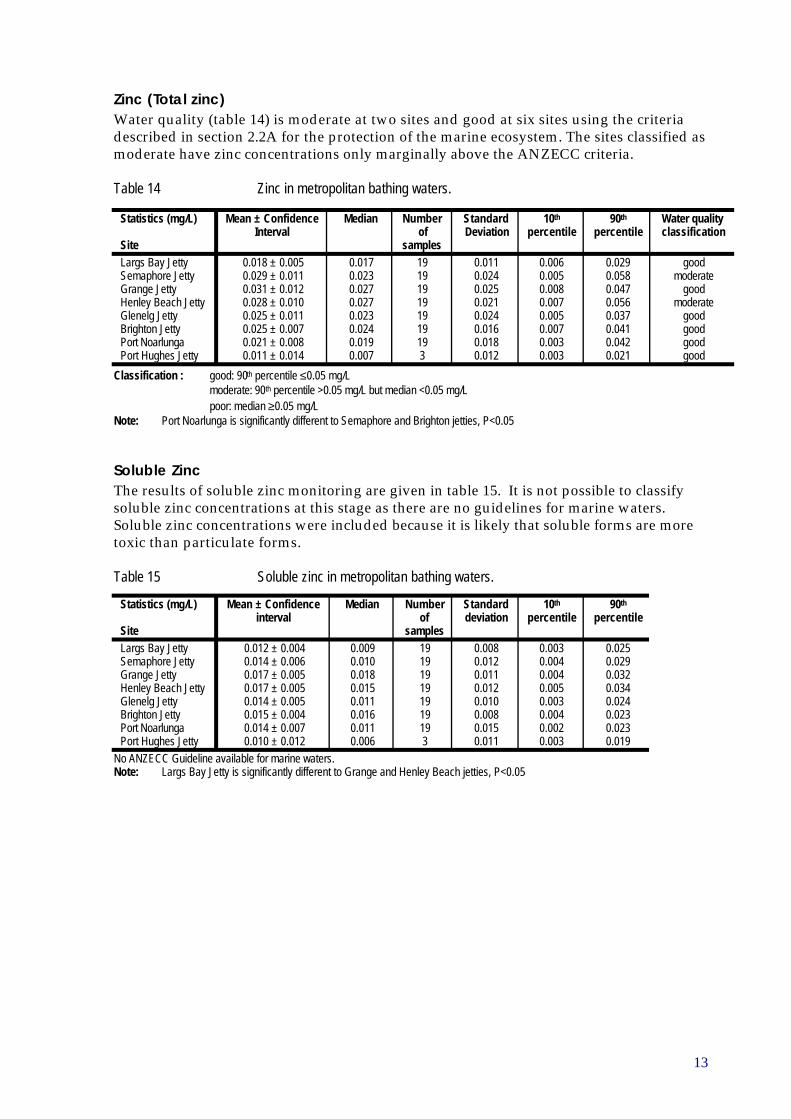
Zinc (Total zinc) Water quality (table 14) is moderate at two sites and good at six sites using the criteria described in section 2.2A for the protection of the marine ecosystem. The sites classified as moderate have zinc concentrations only marginally above the ANZECC criteria.
Table 14 Zinc in metropolitan bathing waters.
Statistics (mg/L) Mean ± Confidence Median Number Standard 10th 90th Water quality Interval of Deviation percentile percentile classification
Site samples
Largs Bay Jetty 0.018 ± 0.005 0.017 19 0.011 0.006 0.029 good Semaphore Jetty 0.029 ± 0.011 0.023 19 0.024 0.005 0.058 moderate Grange Jetty 0.031 ± 0.012 0.027 19 0.025 0.008 0.047 good Henley Beach Jetty 0.028 ± 0.010 0.027 19 0.021 0.007 0.056 moderate Glenelg Jetty 0.025 ± 0.011 0.023 19 0.024 0.005 0.037 good Brighton Jetty 0.025 ± 0.007 0.024 19 0.016 0.007 0.041 good Port Noarlunga 0.021 ± 0.008 0.019 19 0.018 0.003 0.042 good Port Hughes Jetty 0.011 ± 0.014 0.007 3 0.012 0.003 0.021 good
Classification : good: 90th percentile ≤0.05 mg/L moderate: 90th percentile >0.05 mg/L but median <0.05 mg/L poor: median ≥0.05 mg/L
Note: Port Noarlunga is significantly different to Semaphore and Brighton jetties, P<0.05
Soluble Zinc The results of soluble zinc monitoring are given in table 15. It is not possible to classify soluble zinc concentrations at this stage as there are no guidelines for marine waters. Soluble zinc concentrations were included because it is likely that soluble forms are more toxic than particulate forms.
Table 15 Soluble zinc in metropolitan bathing waters.
Statistics (mg/L) Mean ± Confidence Median Number Standard 10th 90th
interval of deviation percentile percentile Site samples
Largs Bay Jetty 0.012 ± 0.004 0.009 19 0.008 0.003 0.025 Semaphore Jetty 0.014 ± 0.006 0.010 19 0.012 0.004 0.029 Grange Jetty 0.017 ± 0.005 0.018 19 0.011 0.004 0.032 Henley Beach Jetty 0.017 ± 0.005 0.015 19 0.012 0.005 0.034 Glenelg Jetty 0.014 ± 0.005 0.011 19 0.010 0.003 0.024 Brighton Jetty 0.015 ± 0.004 0.016 19 0.008 0.004 0.023 Port Noarlunga 0.014 ± 0.007 0.011 19 0.015 0.002 0.023 Port Hughes Jetty 0.010 ± 0.012 0.006 3 0.011 0.003 0.019
No ANZECC Guideline available for marine waters.Note: Largs Bay Jetty is significantly different to Grange and Henley Beach jetties, P<0.05
13
3.5 MICROBIOLOGICAL The presence of micro-organisms in water is important primarily from a human health perspective. There are two significant microbial groups in marine waters: micro-organisms from animal and human wastes, and environmental micro-organisms. Faecal coliforms and faecal streptococci are used as indicators of faecal contamination.
Microbiological contamination around the Christies Beach treated sewage outfall is also included in the analysis due to the importance of the area as a site for primary contact recreation activities.
Source Pathogens from faecal material find their way into the metropolitan bathing waters from sewage treatment works outfalls, boats, jetties and stormwater runoff from the rivers and drains. They may enter the environment freely suspended but are highly associated with particulate matter.
Impact The route of pathogen uptake is through ingestion, inhalation or breaks of the skin. Water used for primary contact activities (such as swimming) and for secondary contact (such as boating or fishing) should meet the requirements for recreational use of waters.
In tables 16, 17 and 18 for microbiological characteristics, the confidence intervals for the mean are generally large, and the mean and the median are substantially different indicating a skewed data set. The geometric mean is considered a better statistical parameter than the arithmetic mean to compare trends over time and differences between sites.
14
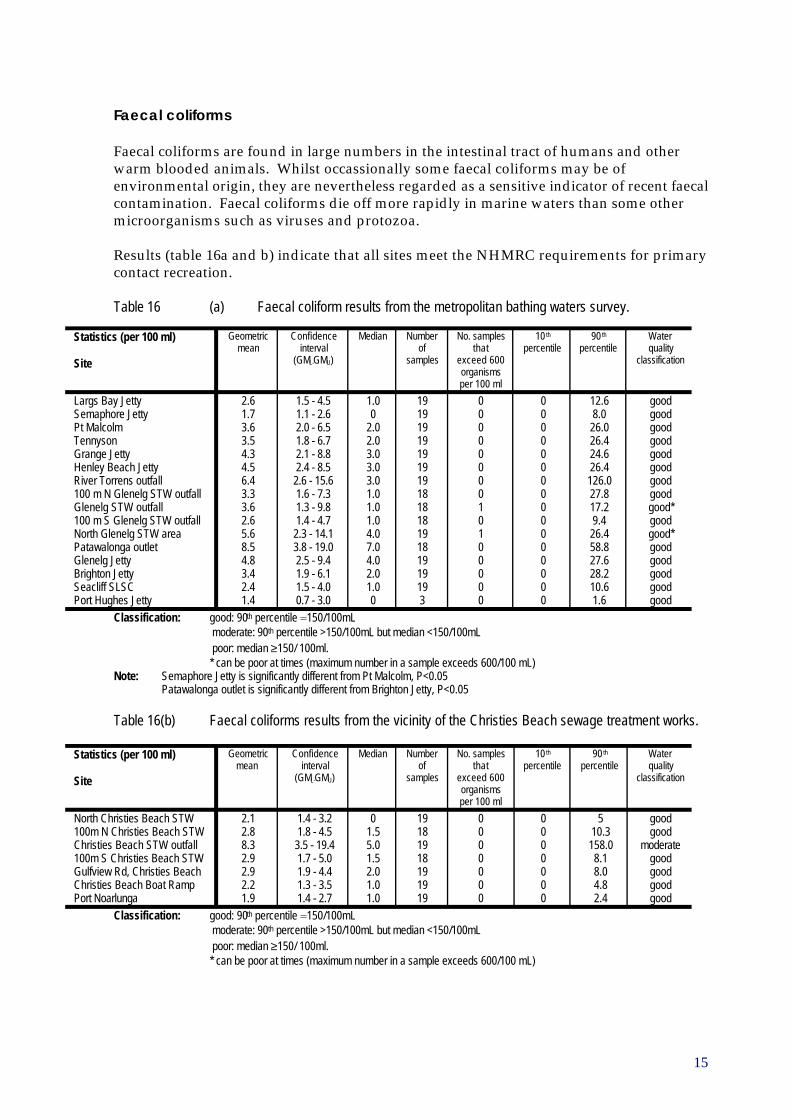
Faecal coliforms
Faecal coliforms are found in large numbers in the intestinal tract of humans and other warm blooded animals. Whilst occassionally some faecal coliforms may be of environmental origin, they are nevertheless regarded as a sensitive indicator of recent faecal contamination. Faecal coliforms die off more rapidly in marine waters than some other microorganisms such as viruses and protozoa.
Results (table 16a and b) indicate that all sites meet the NHMRC requirements for primary contact recreation.
Table 16 (a) Faecal coliform results from the metropolitan bathing waters survey.
Statistics (per 100 ml) Geometric mean
Confidence interval
Median Number of
No. samples that
10 th
percentile 90 th
percentile Water quality
Site (GML-GMU) samples exceed 600 organisms
classification
per 100 ml
Largs Bay Jetty 2.6 1.5 - 4.5 1.0 19 0 0 12.6 good Semaphore Jetty 1.7 1.1 - 2.6 0 19 0 0 8.0 good Pt Malcolm 3.6 2.0 - 6.5 2.0 19 0 0 26.0 good Tennyson 3.5 1.8 - 6.7 2.0 19 0 0 26.4 good Grange Jetty 4.3 2.1 - 8.8 3.0 19 0 0 24.6 good Henley Beach Jetty 4.5 2.4 - 8.5 3.0 19 0 0 26.4 good River Torrens outfall 6.4 2.6 - 15.6 3.0 19 0 0 126.0 good 100 m N Glenelg STW outfall 3.3 1.6 - 7.3 1.0 18 0 0 27.8 good Glenelg STW outfall 3.6 1.3 - 9.8 1.0 18 1 0 17.2 good* 100 m S Glenelg STW outfall 2.6 1.4 - 4.7 1.0 18 0 0 9.4 good North Glenelg STW area 5.6 2.3 - 14.1 4.0 19 1 0 26.4 good* Patawalonga outlet 8.5 3.8 - 19.0 7.0 18 0 0 58.8 good Glenelg Jetty 4.8 2.5 - 9.4 4.0 19 0 0 27.6 good Brighton Jetty 3.4 1.9 - 6.1 2.0 19 0 0 28.2 good Seacliff SLSC 2.4 1.5 - 4.0 1.0 19 0 0 10.6 good Port Hughes Jetty 1.4 0.7 - 3.0 0 3 0 0 1.6 good
Classification: good: 90th percentile =150/100mL moderate: 90th percentile >150/100mL but median <150/100mL poor: median ≥150/ 100ml. * can be poor at times (maximum number in a sample exceeds 600/100 mL)
Note: Semaphore Jetty is significantly different from Pt Malcolm, P<0.05 Patawalonga outlet is significantly different from Brighton Jetty, P<0.05
Table 16(b) Faecal coliforms results from the vicinity of the Christies Beach sewage treatment works.
Statistics (per 100 ml) Geometric Confidence Median Number No. samples 10 th 90 th Water mean interval of that percentile percentile quality
Site (GML-GMU) samples exceed 600 organisms
classification
per 100 ml
North Christies Beach STW 2.1 1.4 - 3.2 0 19 0 0 5 good 100m N Christies Beach STW 2.8 1.8 - 4.5 1.5 18 0 0 10.3 good Christies Beach STW outfall 8.3 3.5 - 19.4 5.0 19 0 0 158.0 moderate 100m S Christies Beach STW 2.9 1.7 - 5.0 1.5 18 0 0 8.1 good Gulfview Rd, Christies Beach 2.9 1.9 - 4.4 2.0 19 0 0 8.0 good Christies Beach Boat Ramp 2.2 1.3 - 3.5 1.0 19 0 0 4.8 good Port Noarlunga 1.9 1.4 - 2.7 1.0 19 0 0 2.4 good
Classification: good: 90th percentile =150/100mL moderate: 90th percentile >150/100mL but median <150/100mL poor: median ≥150/ 100ml. * can be poor at times (maximum number in a sample exceeds 600/100 mL)
15
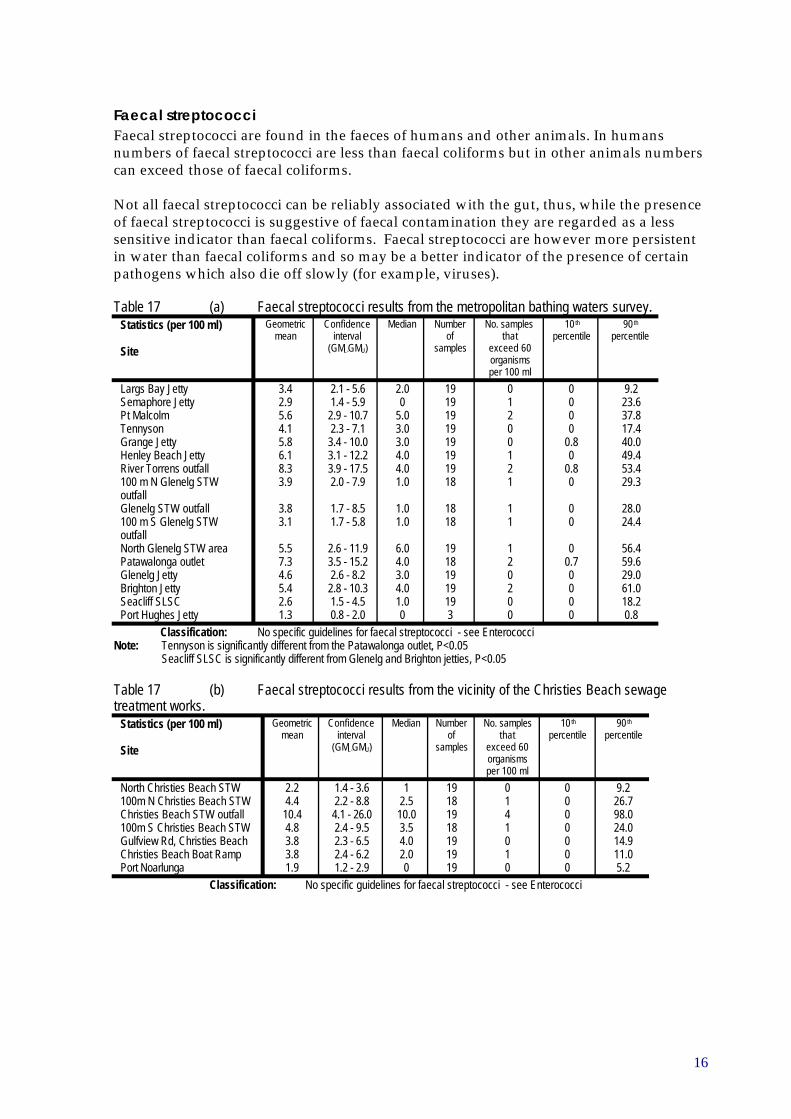
Faecal streptococci Faecal streptococci are found in the faeces of humans and other animals. In humans numbers of faecal streptococci are less than faecal coliforms but in other animals numbers can exceed those of faecal coliforms.
Not all faecal streptococci can be reliably associated with the gut, thus, while the presence of faecal streptococci is suggestive of faecal contamination they are regarded as a less sensitive indicator than faecal coliforms. Faecal streptococci are however more persistent in water than faecal coliforms and so may be a better indicator of the presence of certain pathogens which also die off slowly (for example, viruses).
Table 17 (a) Faecal streptococci results from the metropolitan bathing waters survey. Statistics (per 100 ml) Geometric
mean Confidence
interval Median Number
of No. samples
that 10 th
percentile 90 th
percentile
Site (GML-GMU) samples exceed 60 organisms per 100 ml
Largs Bay Jetty 3.4 2.1 - 5.6 2.0 19 0 0 9.2 Semaphore Jetty 2.9 1.4 - 5.9 0 19 1 0 23.6 Pt Malcolm 5.6 2.9 - 10.7 5.0 19 2 0 37.8 Tennyson 4.1 2.3 - 7.1 3.0 19 0 0 17.4 Grange Jetty 5.8 3.4 - 10.0 3.0 19 0 0.8 40.0 Henley Beach Jetty 6.1 3.1 - 12.2 4.0 19 1 0 49.4 River Torrens outfall 8.3 3.9 - 17.5 4.0 19 2 0.8 53.4 100 m N Glenelg STW 3.9 2.0 - 7.9 1.0 18 1 0 29.3 outfall Glenelg STW outfall 3.8 1.7 - 8.5 1.0 18 1 0 28.0 100 m S Glenelg STW 3.1 1.7 - 5.8 1.0 18 1 0 24.4 outfall North Glenelg STW area 5.5 2.6 - 11.9 6.0 19 1 0 56.4 Patawalonga outlet 7.3 3.5 - 15.2 4.0 18 2 0.7 59.6 Glenelg Jetty 4.6 2.6 - 8.2 3.0 19 0 0 29.0 Brighton Jetty 5.4 2.8 - 10.3 4.0 19 2 0 61.0 Seacliff SLSC 2.6 1.5 - 4.5 1.0 19 0 0 18.2 Port Hughes Jetty 1.3 0.8 - 2.0 0 3 0 0 0.8
Classification: No specific guidelines for faecal streptococci - see Enterococci Note: Tennyson is significantly different from the Patawalonga outlet, P<0.05
Seacliff SLSC is significantly different from Glenelg and Brighton jetties, P<0.05
Table 17 (b) Faecal streptococci results from the vicinity of the Christies Beach sewage treatment works.
Statistics (per 100 ml) Geometric mean
Confidence interval
Median Number of
No. samples that
10 th
percentile 90 th
percentile
Site (GML-GMU) samples exceed 60 organisms per 100 ml
North Christies Beach STW 2.2 1.4 - 3.6 1 19 0 0 9.2 100m N Christies Beach STW 4.4 2.2 - 8.8 2.5 18 1 0 26.7 Christies Beach STW outfall 10.4 4.1 - 26.0 10.0 19 4 0 98.0 100m S Christies Beach STW 4.8 2.4 - 9.5 3.5 18 1 0 24.0 Gulfview Rd, Christies Beach 3.8 2.3 - 6.5 4.0 19 0 0 14.9 Christies Beach Boat Ramp 3.8 2.4 - 6.2 2.0 19 1 0 11.0 Port Noarlunga 1.9 1.2 - 2.9 0 19 0 0 5.2
Classification: No specific guidelines for faecal streptococci - see Enterococci
16
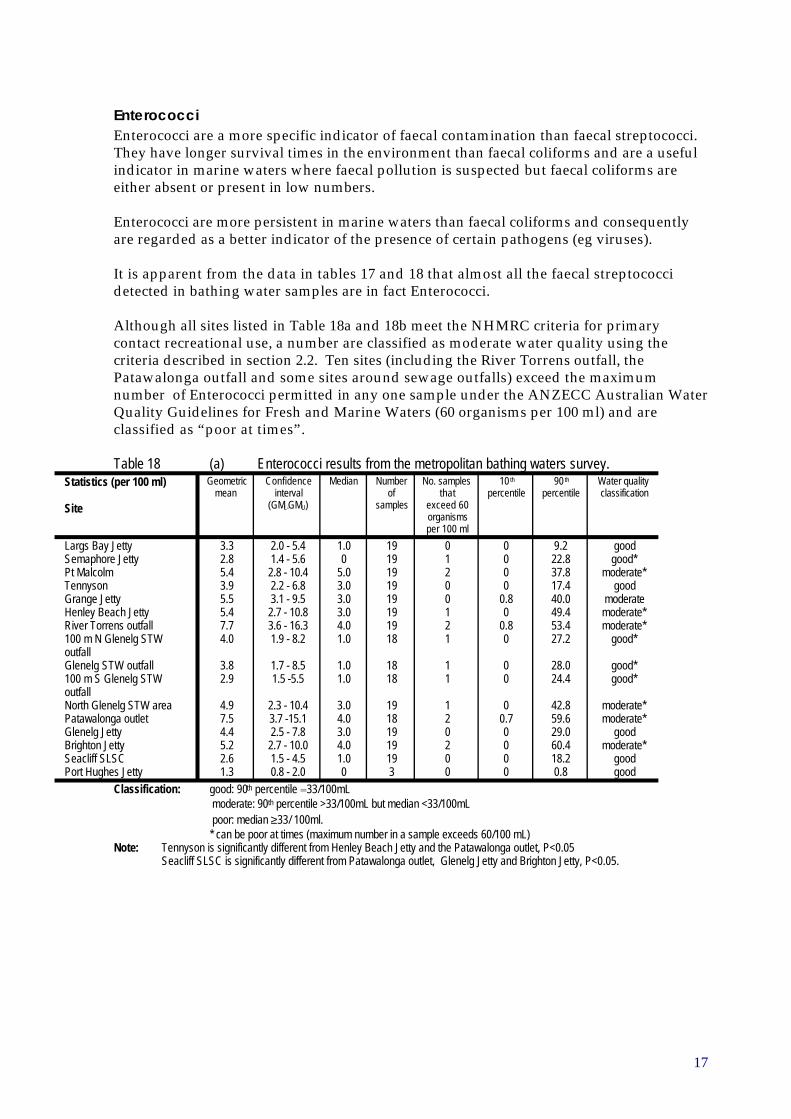
Enterococci Enterococci are a more specific indicator of faecal contamination than faecal streptococci. They have longer survival times in the environment than faecal coliforms and are a useful indicator in marine waters where faecal pollution is suspected but faecal coliforms are either absent or present in low numbers.
Enterococci are more persistent in marine waters than faecal coliforms and consequently are regarded as a better indicator of the presence of certain pathogens (eg viruses).
It is apparent from the data in tables 17 and 18 that almost all the faecal streptococci detected in bathing water samples are in fact Enterococci.
Although all sites listed in Table 18a and 18b meet the NHMRC criteria for primary contact recreational use, a number are classified as moderate water quality using the criteria described in section 2.2. Ten sites (including the River Torrens outfall, the Patawalonga outfall and some sites around sewage outfalls) exceed the maximum number of Enterococci permitted in any one sample under the ANZECC Australian Water Quality Guidelines for Fresh and Marine Waters (60 organisms per 100 ml) and are classified as “poor at times”.
Table 18 (a) Enterococci results from the metropolitan bathing waters survey. Statistics (per 100 ml) Geometric Confidence Median Number No. samples 10 th 90 th Water quality
mean interval of that percentile percentile classification
Site (GML-GMU) samples exceed 60 organisms per 100 ml
Largs Bay Jetty 3.3 2.0 - 5.4 1.0 19 0 0 9.2 good Semaphore Jetty 2.8 1.4 - 5.6 0 19 1 0 22.8 good* Pt Malcolm 5.4 2.8 - 10.4 5.0 19 2 0 37.8 moderate* Tennyson 3.9 2.2 - 6.8 3.0 19 0 0 17.4 good Grange Jetty 5.5 3.1 - 9.5 3.0 19 0 0.8 40.0 moderate Henley Beach Jetty 5.4 2.7 - 10.8 3.0 19 1 0 49.4 moderate* River Torrens outfall 7.7 3.6 - 16.3 4.0 19 2 0.8 53.4 moderate* 100 m N Glenelg STW 4.0 1.9 - 8.2 1.0 18 1 0 27.2 good* outfall Glenelg STW outfall 3.8 1.7 - 8.5 1.0 18 1 0 28.0 good* 100 m S Glenelg STW 2.9 1.5 -5.5 1.0 18 1 0 24.4 good* outfall North Glenelg STW area 4.9 2.3 - 10.4 3.0 19 1 0 42.8 moderate* Patawalonga outlet 7.5 3.7 -15.1 4.0 18 2 0.7 59.6 moderate* Glenelg Jetty 4.4 2.5 - 7.8 3.0 19 0 0 29.0 good Brighton Jetty 5.2 2.7 - 10.0 4.0 19 2 0 60.4 moderate* Seacliff SLSC 2.6 1.5 - 4.5 1.0 19 0 0 18.2 good Port Hughes Jetty 1.3 0.8 - 2.0 0 3 0 0 0.8 good
Classification: good: 90th percentile =33/100mL moderate: 90th percentile >33/100mL but median <33/100mL poor: median ≥33/ 100ml. * can be poor at times (maximum number in a sample exceeds 60/100 mL)
Note: Tennyson is significantly different from Henley Beach Jetty and the Patawalonga outlet, P<0.05 Seacliff SLSC is significantly different from Patawalonga outlet, Glenelg Jetty and Brighton Jetty, P<0.05.
17
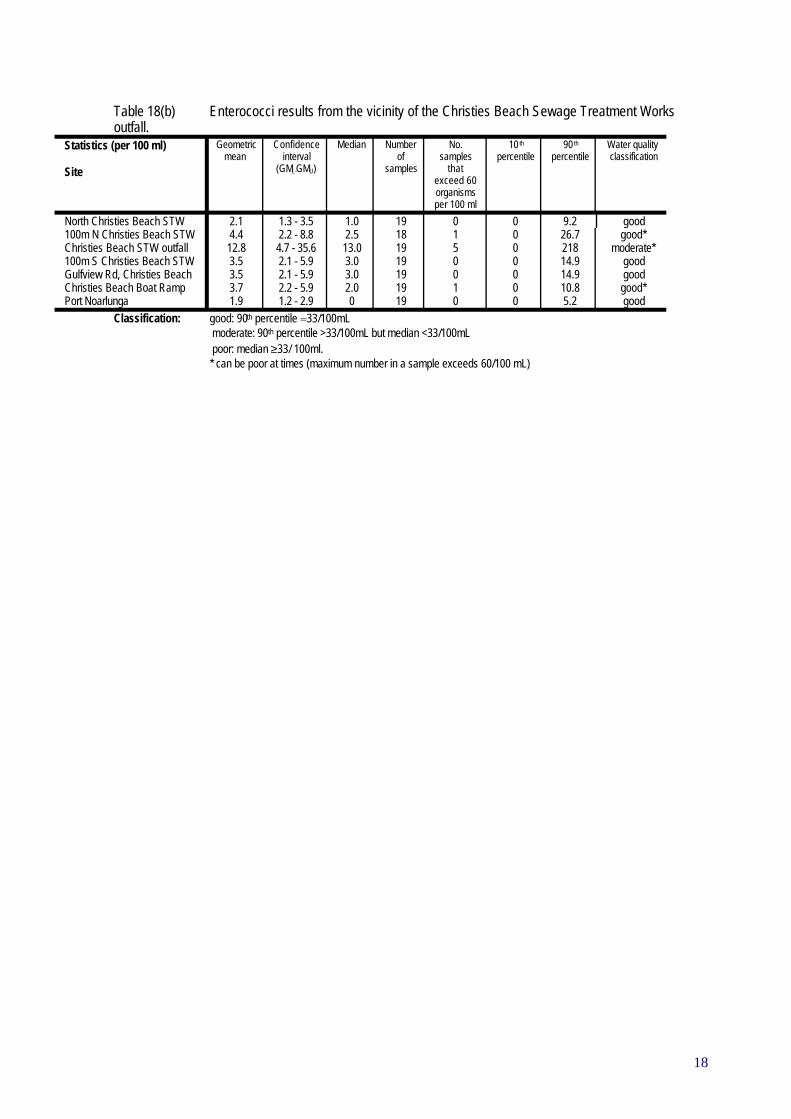
Table 18(b) Enterococci results from the vicinity of the Christies Beach Sewage Treatment Works outfall.
Statistics (per 100 ml) Geometric mean
Confidence interval
Median Number of
No. samples
10 th
percentile 90 th
percentile Water quality classification
Site (GML-GMU) samples that exceed 60 organisms per 100 ml
North Christies Beach STW 2.1 1.3 - 3.5 1.0 19 0 0 9.2 good 100m N Christies Beach STW 4.4 2.2 - 8.8 2.5 18 1 0 26.7 good* Christies Beach STW outfall 12.8 4.7 - 35.6 13.0 19 5 0 218 moderate* 100m S Christies Beach STW 3.5 2.1 - 5.9 3.0 19 0 0 14.9 good Gulfview Rd, Christies Beach 3.5 2.1 - 5.9 3.0 19 0 0 14.9 good Christies Beach Boat Ramp 3.7 2.2 - 5.9 2.0 19 1 0 10.8 good* Port Noarlunga 1.9 1.2 - 2.9 0 19 0 0 5.2 good
Classification: good: 90th percentile =33/100mL moderate: 90th percentile >33/100mL but median <33/100mL poor: median ≥33/ 100ml. * can be poor at times (maximum number in a sample exceeds 60/100 mL)
18
4 CONCLUDING REMARKS Based on the preliminary findings of the ambient water quality monitoring programme water quality of the metropolitan bathing waters can be described as moderate for the following reasons:
1. Ammonia concentrations are elevated at all sites.
2. Water clarity as determined by turbidity measurements is moderate at many of the sites monitored.
3. Chlorophyll concentrations are moderate to high at all sites.
4. Copper, lead and zinc concentrations are moderate at some sites.
5. Microbiological quality is moderate at a number of sites. In addition samples from some sites occasionally exceed the maximum number of indicator microorganisms in a sample (ANZECC Australian Water Quality Guidelines for Fresh and Marine Waters for primary contact) and have been classified as poor at times. Nevertheless, taken over the whole period, all sites meet the NHMRC Australian Guidelines for Recreational Use of Water.
The Port Hughes site has good water quality for all the characteristics measured. Concentrations of nutrients, turbidity, heavy metals and numbers of microbiological indicator organisms are considered to be representative of background levels at unimpacted sites.
A number of initiatives should improve bathing water quality over time. These include nutrient reduction and effluent reuse programmes for the sewage treatment works, environment improvement programmes being established by industry, catchment management plans to deal with pollution at source, and the development of extensive wetlands to treat stormwater. These initiatives should reduce nutrient concentrations over time and, as a result, also improve water clarity and chlorophyll levels. They should also help to reduce heavy metal concentrations.
19
5 FURTHER READING ANZECC. 1992. National Water Quality Management Strategy Guidelines for Fresh and
Marine Waters. Australian and New Zealand Environment and Conservation Council.
Ashbolt, NJ. 1995. Human health risk from microorganisms in the Australian marine environment. In Zann and Sutton (eds). State of the marine environment report for Australia: Technical annex: 2—Pollution, pp. 31–40.
Batley, GE. 1995. Heavy metals and tributyltin in Australian coastal and estuarine waters. In Zann and Sutton (eds). State of the marine environment report for Australia: Technical annex: 2—Pollution, pp. 63–72.
Brodie, J. 1985. The problems of nutrients and eutrophication in the marine environment. In Zann and Sutton (eds). State of the marine environment report for Australia: Technical annex: 2—Pollution, pp. 1–29.
Cabelli, VJ, Dufour, AP, McCabe, LJ and Levin, MA. 1983. A marine recreational water quality criterion consistent with indicator concepts and risk analysis. Journal WPCF. 55(10): 1306 - 1314.
Cugley, J. 1994. Ambient water quality monitoring for SA—Issues and requirements. EPA Draft Report.
Department of Environment Protection. 1996. Southern Metropolitan Coastal Waters Study (1991–1994): Report 17. Perth, Western Australia.
Favero, MS. 1985. Microbiologic indicators of health risks associated with swimming. American Journal of Public Health. 75(9): 1051 - 1054.
Fleisher, JM. 1992. US federal bacteriological water quality standards: A re-analysis. In: Kay, D (ed). 1992. Recreational water quality management. Volume 1: Coastal waters. Ellis Horwood. Chapter 9, pp: 113 - 127.
Seyfried, PL, Tobin, RS, Brown, NE and Ness, PF. 1985a. A prospective study of swimming-related illness. 1. Swimming associated health risk. American Journal of Public Health. 75(9): 1068 - 1070.
Seyfried, PL, Tobin, RS, Brown, NE and Ness, PF. 1985b. A prospective study of swimming-related illness. 2. Morbidity and the microbiological quality of water. American Journal of Public Health. 75(9): 1071 - 1075.
Taylor, JK. 1987. Quality assurance of chemical measurements. Lewis Publishers, pp. 129–146.
Ward, JT, Warren, LJ and Swaine, DJ. 1982. Effects of heavy metals on aquatic life. CSIRO.
Zann, LP and Sutton, D. (eds). 1995. State of the marine environment report for Australia: Technical annex: 2—Pollution. Great Barrier Reef Marine Park Authority, for the Department of the Environment, Sport and Territories, Ocean Rescue 2000 Program: Townsville.
20