Embed Size (px)
Citation preview
MIKE 2017
Water Quality
MIKE ECO Lab WQ Templates
Scientific Description

mike_eco_lab_wq.docx/PSR/MPO/2017-09-13 - © DHI
DHI headquarters
Agern Allé 5
DK-2970 Hørsholm
Denmark
+45 4516 9200 Telephone
+45 4516 9333 Support
+45 4516 9292 Telefax
www.mikepoweredbydhi.com

i
CONTENTS
Water Quality MIKE ECO Lab WQ Templates Scientific Description
1 Introduction ....................................................................................................................... 1
2 Applications ...................................................................................................................... 3
3 Mathematical Formulations .............................................................................................. 5 3.1 Oxygen ................................................................................................................................................. 5 3.1.1 Oxygen balance ................................................................................................................................... 5 3.1.2 Oxygen processes ............................................................................................................................... 6 3.1.3 Additional expressions ......................................................................................................................... 7 3.1.4 Explanation to oxygen expressions ..................................................................................................... 8 3.2 Biological Oxygen Demand .................................................................................................................. 9 3.2.1 Biological oxygen demand balance ..................................................................................................... 9 3.2.2 Biological oxygen demand processes ................................................................................................ 10 3.2.3 Explanation to BOD expressions ....................................................................................................... 10 3.3 Ammonium ......................................................................................................................................... 11 3.3.1 Ammonium balance ........................................................................................................................... 11 3.3.2 Ammonium processes ........................................................................................................................ 11 3.3.3 Explanation to ammonium processes ................................................................................................ 13 3.4 Nitrite .................................................................................................................................................. 13 3.4.1 Nitrite balance .................................................................................................................................... 13 3.4.2 Nitrite processes ................................................................................................................................ 13 3.4.3 Explanation to nitrate processes ........................................................................................................ 13 3.5 Nitrate ................................................................................................................................................. 14 3.5.1 Nitrate balance ................................................................................................................................... 14 3.5.2 Nitrate processes ............................................................................................................................... 14 3.5.3 Explanation to nitrate expressions ..................................................................................................... 14 3.6 Phosphorus ........................................................................................................................................ 14 3.6.1 Phosphorus balance .......................................................................................................................... 14 3.6.2 Phosphorus processes....................................................................................................................... 15 3.6.3 Explanation to phosphorus processes ............................................................................................... 16 3.7 Chlorophyll-a ...................................................................................................................................... 16 3.7.1 Chlorophyll-a balance ........................................................................................................................ 16 3.8 Temperature processes ..................................................................................................................... 16 3.9 Bacterial processes ............................................................................................................................ 17
4 Data Requirements ......................................................................................................... 19
5 List of Literature ............................................................................................................. 21

Water Quality
ii MIKE ECO Lab WQ Templates - © DHI
Introduction
1
1 Introduction
MIKE ECO Lab is a numerical lab for Ecological Modelling. It is a generic and open tool
for customising aquatic ecosystem models to describe for instance water quality and
eutrophication. DHI’s expertise and know how concerning ecological modelling has been
collected in predefined ecosystem descriptions (MIKE ECO Lab templates) to be loaded
and used in MIKE ECO Lab. So the MIKE ECO Lab templates describe physical,
chemical and biological processes related to environmental problems and water pollution.
The following is a common description of the DHI supported WQ (water quality)
templates:
1. WQSimpleTandSCOLI.ecolab
2. WQSimpleTandS.ecolab
3. WQSimpleCOLI.ecolab
4. WQSimple.ecolab
5. WQNutrients.ecolab
The templates describes the resulting concentrations a number of variables such as
bacteria, which threatens bathing water quality, oxygen depletion due to the release of
BOD, excess concentrations of nutrients, chlorophyll-nutrient interactions and degradation
of chemical substances.
The MIKE ECO Lab is integrated with the advection-dispersion module, which describes
the physical transport processes at each grid-point covering the area of interest. Other
data required are concentrations at model boundaries, flow and concentrations from
pollution sources, water temperature, etc.
The MIKE ECO Lab system solves the process equations using a rational extrapolation
method in an integrated two-step procedure with the advection-dispersion module. Only
the water quality processes are included in the description and equations explained
below.

Water Quality
2 MIKE ECO Lab WQ Templates - © DHI

Applications
3
2 Applications
The water quality templates are used for a range of environmental investigations:
• Studies of hygienic problems related to bacteria from sewage outfalls and other
sources.
• Survival of bacteria related to different environmental conditions.
• Oxygen conditions affected by BOD, ammonia and other oxygen consuming
substances.
• Spreading, degradation and interaction between the inorganic nutrient: ammonia,
nitrite, nitrate and phosphate.
• Evaluation of potential for eutrophication problems related to nutrient levels (nitrogen
and phosphorus) and chlorophyll-a.
• Decay of chemical substances and effect evaluation based on resulting
concentration levels.

Water Quality
4 MIKE ECO Lab WQ Templates - © DHI

Mathematical Formulations
5
3 Mathematical Formulations
The MIKE 21/3 ECO Lab solves the system of differential equations describing the
physical, chemical and biological interactions involved in the survival of bacteria,
degradation of organic matter, resulting oxygen conditions and excess levels of nutrients
in coastal areas.
The following variables can be modelled using DHI supported WQ templates:
Dissolved BOD BODd
Suspended BOD BODs
Sedimentated BOD BODb
Ammonia (NH4+-N) NH3
Nitrite (NO2-- N) NO2
Nitrate (NO3--N) NO3
Dissolved oxygen DO
Phosphorus PO4
Faecal coliforms CF
Total coliforms CT
One or more user defined pollutants (UDP1…)
The processes and concentrations of the parameters are influences by external factors
such as incident solar radiation (coliform bacteria decay) and discharges.
Several combinations of the listed variables are implemented as “model levels” securing
maximum flexibility. At the most simple level only BOD and DO are modelled and the
most complex level includes all the variables.
3.1 Oxygen
3.1.1 Oxygen balance
The oxygen balance depend on the chosen complexity level. There are 4 levels of
complexity for the description of DO mass balance:
Level 1, Oxygen, simple description
dt
dDO
reaeration (only at water surface)
decay BOD-
esisphotosynth
n respiratio -
demandoxygen sediment - (only at water bed)
Level 2, Oxygen, extended description
dt
dDO
reaeration (only at water surface)

Water Quality
6 MIKE ECO Lab WQ Templates - © DHI
decay BOD- (1 or 3 fractions)
esisphotosynth
n respiratio -
demandoxygen sediment - (only at water bed)
Level 3, Oxygen with nutrients
dt
dDO
reaeration (only at water surface)
ionnitrificat Y- 1 (Y1: yield factor for oxygen)
decay BOD- (1 or 3 fractions)
esisphotosynth
n respiratio -
demandoxygen sediment - (only at water bed)
Level 4, Oxygen with nutrients and chlorophyll
dt
dDO
reaeration (only at water suface)
ionnitrificat Y- 1 (Y1: yield factor for oxygen)
decay BOD- (1 or 3 fractions)
PN,Fesisphotosynth (Potential nutrient limitation)
n respiratio -
demandoxygen sediment - (only at water bed)
3.1.2 Oxygen processes
Reaeration is the process describing the interchange of oxygen between the dissolved
oxygen in the water and the atmosphere. The expression includes a saturation level for
oxygen in water Cs that depends on the salinity and temperature.
Nitrification is another process influencing the oxygen balance as oxygen is consumed in
the nitrification process when transforming ammonia into nitrite.
The oxygen producing photosynthesis process is described relative to a given maximum
production at noon and varies with the time of the day and the relative day length.
Respiration from autotroph and heterotrophs is consuming oxygen and described as
dependent of the temperature.
The degradation of organic matter is another oxygen consuming process. It is dependent
of the temperature, the oxygen concentration and the concentration of organic material.
The sediment oxygen demand from the degradation of organic material not originating
from pollution sources is described separately. The sediment oxygen demand (SOD) is
assumed to depend only of the oxygen concentration and the temperature. A Michaelis-
Menten expression is used to simulate the processes at low oxygen conditions.

Mathematical Formulations
7
Reaeration
)( DOCKreaeration s 2
Nitrification
nitrHSDO
DONHKionnitrificat T
_
)(
20
434
Photosynthesis and respiration
downup
downup
T
ttif
ttifaHFPesisphotosynth
,,
,,)/(cosmax
0
220
11
)()( 20
22
20
111
TT RHFRnrespiratio (level 1-3)
)()(, 20
22
20
111
TT RPNFHFRnrespiratio (level 4)
BOD decay (one fraction of BOD)
BODHSDO
DOBODKBOD decay T
_
)(
20
33
BOD decay (three fractions of BOD)
BODd decayBODHSDO
DOBODK T
ddd_
)(
20
33
BODS decayBODHSDO
DOBODK T
sss_
)(
20
33
BODb decayBODHSDO
DOBODK T
bbb_
)(
20
33
Sediment oxygen demand
20
3
T
DOSODHS
DOmand oxygen desed
_.
3.1.3 Additional expressions
The potential nutrient limitation on photosynthesis is described by a nutrient limitation
function:
KSPPO
PO
KSNIN
INPNF
4
4
2),(
The saturation level for oxygen in water varies with salinity and temperature and is
descdribed by the following empiric expression:
)..
.(....
TS
TSTSCs
000077774000003740
00799104102200025600841065214
The rate for the reaeration process K2 depends of the wind speed Wv, the flow velocity V
and the water depth H:

Water Quality
8 MIKE ECO Lab WQ Templates - © DHI
K2 = 3.93 · V0.5/H1.5 + W/H (1/s)
W = 0.728·Wv0.5 –0.371·Wv+0.0372·Wv
2 (m/s)
The photosynthetic oxygen production and the autotrophic respiration vary with the water
depth due to the light dependency of the autotrophs. The depth variation is in MIKE 3
modelled using the Lambert Beer Law, which requires a light extinction coefficient for the
water to describe the dampening of the light irradiation through the water column.
Lambert Beer Law or the light dampening function:
F1(H) = Hke
Figure 3.1 shows the principle of the light dampening curve versus the water depth.
Figure 3.1 The dampening function for light in the water column
3.1.4 Explanation to oxygen expressions
IN = sum of inorganic nitrogen (mg N/l)
KSN = halfsaturation concentration for nitrogen, limitation for
photosynthesis by plants and algae (mg N/l)
KSP = halfsaturation concentration for phosphorus, limitation for
photosynthesis by plants and algae (mg P/l)
S= salinity (ppt)
T= temperature (°C)
Wv= wind speed (m/s)
H= water depth (m)
V= depth averaged flow velocity (m/s)
NH3= concentration of ammonia (mg/l)
K4= nitrification rate at 20°C (1/day)
4= temperature coefficient for nitrification
HS_nitr= halfsaturation concentration for nitrification (mg O2/l)
Y1 = yield factor for oxygen
photosynthesis = actual production (g O2/m2/day)
Pmax= maximum production at noon (g O2/m2/day)
= actual time of the day related to noon
= actual relative day length
tup,down= time for sunrise and sunset
respiration = actual respiration rate of plants, bacteria and (g O2/m2/day),
R1= photosynthetic (autotrophic) respiration rate at 20C (g O2/m2/day)
1= temperature coefficient for photosynthetic respiration/production
Wa
ter
Dep
th H
[m
]
Dampening function F1(H)

Mathematical Formulations
9
R2= respiration rate of animals and bacteria (heterotrophic) (g
O2/m2/day)
2= temperature coefficient for heterotrophic respiration
F1(H) = light dampening function
k = light extinction coefficient [m-1]
H= Water depth [m]
BOD = actual concentration of BOD (mg O2/l)
K3= degradation constant for organic matter at 20C (l/day)
3= Arrhenius temperature coefficient
DO = Actual oxygen concentration (mg O2/l)
HS_BOD = Half-saturation oxygen concentration for BOD (mg O2/l)
BODd= actual concentration of suspended organic matter (mg O2/l)
BODs= actual concentration of suspended organic matter (mg O2/l)
BODb= actual amount of sedimentated organic matter at the bottom (mg
O2/l)
Kd3 = degradation constant for dissolved organic matter at 20C (l/day).
Normally suspended BODs will have a slower degradation rate than
dissolved BODd.
d3= Arrhenius temperature coefficient (dissolved BOD)
Ks3= degradation constant for suspended organic matter at 20 °C
(1/day). Normally suspended BODs will have a slower degradation
rate than dissolved BODd.
s3= Arrhenius temperature coefficient (suspended BOD)
Kb3 = degradation constant for sedimentated organic matter (l/day)
b3= Arrhenius temperature coefficient (sedimentated BOD)
HS_SOD= half-saturation oxygen concentration for SOD (mg O2/l)
3 = Arrhenius temperature coefficient (SOD)
3.2 Biological Oxygen Demand
The mass balance for organic matter can be described with three equations or one
equation depending on the number of fractions chosen for BOD.
3.2.1 Biological oxygen demand balance
One fraction of BOD
The mass balance for organic matter if only one fraction is chosen can be described as
dt
dBOD-BOD decay
Three fractions of BOD
If fractions for dissolved, suspended and sedimentated BOD are selected the balances
are:
The balance describing the dissolved BOD concentration is:
dt
dBODd -BODd decay

Water Quality
10 MIKE ECO Lab WQ Templates - © DHI
The balance describing the suspended BOD concentration is
dt
dBODs
- BODs decay
+ resuspension
- sedimentation
The balance describing the sedimentated BOD concentration is
dt
dBODb
- BODb decay
- resuspension
+ sedimentation
3.2.2 Biological oxygen demand processes
BODHSDO
DOBODKBOD deca
T
_y
)20(33
BODHSDO
DOBODK decayBOD T
dddd_
)(
20
33
BODHSDO
DOBODK decayBOD T
ssss_
)(
20
33
BODHSDO
DOBODK decayBOD T
bbbb_
)(
20
33
Resuspension, S1, is assumed where the flow velocity (V) exceeds the critical value (V1).
The resuspension is assumed to be constant in time. At flow velocities smaller than the
critical value, sedimentation will occur.
HBODSonresuspensi b / 1
Sedimentation of BODs is assumed if the flow velocity (V) is below a critical value (V1). It
is described as a first order process.
sedimentation = HBODK ss /
3.2.3 Explanation to BOD expressions
T= temperature (°C)
K3= degradation constant for organic matter at 20C (l/day)
3= Arrhenius temperature coefficient
DO = Actual oxygen concentration (mg O2/l)
HS_BOD = Half-saturation oxygen concentration for BOD
(mg O2/l)
BOD= actual concentration of organic matter (mg O2/l)

Mathematical Formulations
11
BODd= actual concentration of suspended organic matter
mg O2/l)
BODs= actual concentration of suspended organic matter
(mg O2/l)
BODb= actual amount of sedimentated organic matter at the bottom (mg
O2/l)
Kd3 = degradation constant for dissolved organic matter at 20C (l/day).
Normally suspended BODs will have a slower degradation rate than
dissolved BODd.
d3= Arrhenius temperature coefficient (dissolved BOD)
Ks3= degradation constant for suspended organic matter at 20 °C
(1/day). Normally suspended BODs will have a slower degradation
rate than dissolved BODd.
s3= Arrhenius temperature coefficient (suspended BOD)
Kb3 = degradation constant for sedimentated organic matter (l/day)
b3= Arrhenius temperature coefficient (sedimentated BOD)
S1= resuspension rate for BODb (m/day)
Ks= sedimentation rate for BODs (m/day)
H= water depth (m)
The processes involved in the mass balances for organic matter is derived from the
descriptions of the processes in the oxygen balance except for the description of
resuspension and sedimentation of BOD, that is described in 3.2.3.
3.3 Ammonium
3.3.1 Ammonium balance
The balance describing the ammonium/ammonia mass balance:
dt
dNH3
BODield from ammonium y decay
nitratemonium to tion of amtransforma
lantsptake by pammonium u
acteria ptake by bammonium u
ionh respiratheterotrop
3.3.2 Ammonium processes
BOD decay
One fraction of BOD
ammonium yield from BOD decay =
BODHSDO
DOBODKY T
BOD_
)(
20
33

Water Quality
12 MIKE ECO Lab WQ Templates - © DHI
Three fractions of BOD
ammonium yield from BOD decay =
BODHSDO
DOBODKY
BODHSDO
DOBODKY
BODHSDO
DOBODKY
T
SSs
s
T
dddd
T
bbbb
_
_
_
)(
)(
)(
20
33
20
33
20
33
Nitrification
The transformation of ammonium to nitrate is described by the following expression:
transformation of ammonium to nitrate =
)( 20
434
TNHK
Uptake by plants
ammonium uptake by plants =
)( )( 20
11
T
p RPUN (level 1-3)
ammonium uptake by plants =
),()( )( PNFRPUN T
p 20
11 (level 4)
Uptake of ammonium by bacteria
One fraction of BOD
ammonium uptake by bacteria =
33
320
33NHHSNH
NHBODKUN T
b_
)(
Three fractions of BOD
ammonium uptake by bacteria =
33
320
33
33
320
33
33
320
33
NHHSNH
NHBODKUN
NHHSNH
NHBODKUN
NHHSNH
NHBODKUN
T
sssb
T
dddb
T
bbbb
_
_
_
)(
)(
)(
Heterotroph respiration
heterotroph respiration =

Mathematical Formulations
13
)( 20
22
T
p RUN
3.3.3 Explanation to ammonium processes
UNp= ammonia uptake by plants (mg N/mg O2)
UNb= ammonia uptake by bacteria (mg N/mg BOD)
Yb= nitrogen content in sedimented organic matter (mg NH3-N/mg
BOD)
Yd= nitrogen content in dissolved organic matter (mg NH3-N/mg BOD)
Ys= nitrogen content in suspended organic matter (mg NH3-N/mg BOD)
F(N,P)= nutrient limitation on the photosynthesis
HS_NH3= halfsaturation concentration for N uptake by bacteria (mg N/l)
The BOD decay term equals the BOD decay term in the oxygen and BOD balances,
except for the yield factor Y. Y is the amount of ammonium which is released at BOD
decay. K4 is the nitrification rate. During the night time the ammonium uptake by plants is
assumed to be constant. See also explanation to oxygen processes.
3.4 Nitrite
3.4.1 Nitrite balance
Only relevant when nutrients with or without chlorophyll is selected:
The reactions influencing the nitrite mass balance are given by:
dt
dNO2 + transformation of ammonia to nitrite
- transformation of nitrite to nitrate
3.4.2 Nitrite processes
transformation of ammonia to nitrite = nitrHSDO
DONHK T
_
)(
20
434
transformation of nitrite to nitrate =
)( 20
525
TNOK
3.4.3 Explanation to nitrate processes
NH3= concentration of ammonia (mg/l)
K4= nitrification rate at 20°C (1/day)
4= temperature coefficient for nitrification
HS_nitr= halfsaturation concentration for nitrification (mg O2/l)
NO2= concentration of nitrite (mg/l)
K5= specific rate for conversion of nitrite to nitrate at 20°C (1/day)
5 = temperature coefficient for conversion of nitrite to nitrate
Water Quality
14 MIKE ECO Lab WQ Templates - © DHI
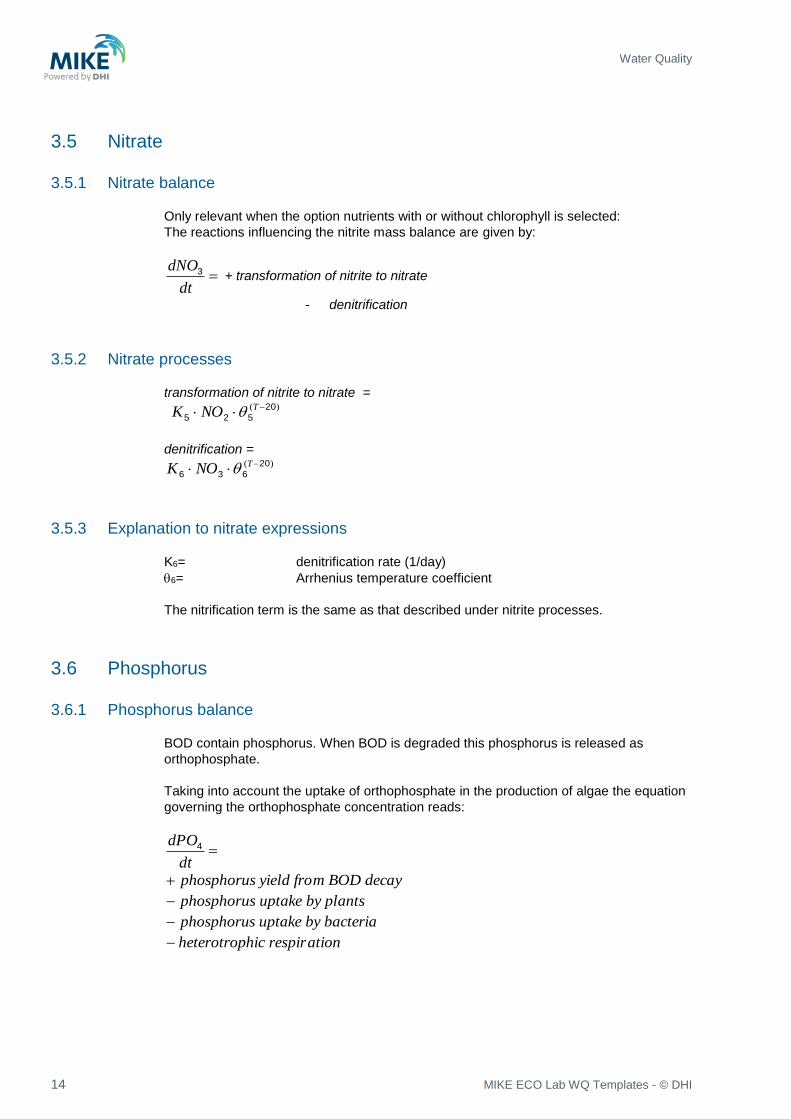
3.5 Nitrate
3.5.1 Nitrate balance
Only relevant when the option nutrients with or without chlorophyll is selected:
The reactions influencing the nitrite mass balance are given by:
dt
dNO3 + transformation of nitrite to nitrate
- denitrification
3.5.2 Nitrate processes
transformation of nitrite to nitrate = )( 20
525
TNOK
denitrification = )( 20
636
TNOK
3.5.3 Explanation to nitrate expressions
K6= denitrification rate (1/day)
6= Arrhenius temperature coefficient
The nitrification term is the same as that described under nitrite processes.
3.6 Phosphorus
3.6.1 Phosphorus balance
BOD contain phosphorus. When BOD is degraded this phosphorus is released as
orthophosphate.
Taking into account the uptake of orthophosphate in the production of algae the equation
governing the orthophosphate concentration reads:
dt
dPO4
ym BOD deca yield frophosphorus
plants uptake byphosphorus
bacteria uptake byphosphorus
ationhic respirheterotrop

Mathematical Formulations
15
3.6.2 Phosphorus processes
Phosphorus yield from BOD decay
One fraction of BOD
Phosphorus yield from BOD decay =
44
420
323POHSPO
POYBODK T
_
Three fractions of BOD
Phosphorus yield from BOD decay =
44
420
323POHSPO
POYBODK T
bbbb_
(degradation of BODb)
44
420
323POHSPO
POYBODK T
dddd_
(degradation of BODd)
44
420
323POHSPO
POYBODK T
ssss_
(degradation of BODs)
Uptake by plants
phosphorus uptake by plants =
),()( )( PNFRPUP T
p 20
11
Uptake by bacteria
One fraction of BOD
phosphorus uptake by bacteria =
44
420
33POHSPO
POBODKUP T
b_
)(
Three fractions of BOD
phosphorus uptake by bacteria =
44
420
33
44
420
33
44
420
33
POHSPO
POBODKUP
POHSPO
POBODKUP
POHSPO
POBODKUP
T
sssb
T
dddb
T
bbbb
_
_
_
)(
)(
)(
Heterotrophic respiration
Heterotrophic respiration =
)( 20
22
T
p RUP

Water Quality
16 MIKE ECO Lab WQ Templates - © DHI
3.6.3 Explanation to phosphorus processes
UPp= phosphorus uptake by plants (mg P/mg O2)
UPb= phosphorus uptake by bacteria (mg P/mg BOD)
Yb2= phosphorus content in sedimented organic matter (mg P/mg O2)
Yd2= phosphorus content in dissolved organic matter (mg P/mg O2)
Ys2= phosphorus content in suspended organic matter (mg P/mg O2)
F(N,P)= nutrient limitation on the photosynthesis
HS_PO4= halfsaturation concentration for phosphorus uptake by bacteria (mg
P/l)
3.7 Chlorophyll-a
3.7.1 Chlorophyll-a balance
The production of chlorophyll-a is assumed proportional to the carbon production and
hereby also to the oxygen production.
A constant chlorophyll-a to carbon ratio is assumed. Furthermore, death and
sedimentation of chlorophyll are included.
dt
dCHL
+ netto production of chlorophyll
- death of chlorophyll
- sedimentation of chlorophyll
dt
dCHL
1011
20
11 KPNFKRP T ),()( )(
CHLK 8
CHLHK /9
where
CHL= the chlorophyll-a concentration (mg/l)
K10= chlorophyll-a to carbon ratio (mg CHL/mg carbon)
K8= death rate of chlorophyll-a (1/day)
K9= settling rate of chlorophyll-a (m/day)
K11= carbon to oxygen ratio at primary production (mg carbon/mg
oxygen)
3.8 Temperature processes
Details about the temperature model for MIKE 3 can be seen in the Scientific
Documentation of the Advection-Dispersion Module.

Mathematical Formulations
17
The temperature model in MIKE 21 incorporates an exchange rate to account for the net
surface heat transfer at the interface with the air.:
)/())((/ HSTCATEdtdT
where
E= surface heat exchange coefficient (Watts/m2 K)
T= water temperature (C)
A= ambient air temperature (C)
STC= specific thermal capacity of sea water (Mega-joules/ m3 K)
H= water depth (m)
The user defines the ambient air and water temperature for the simulation. The water
depth is input from the HD-module.
3.9 Bacterial processes
The WQ templates can describe the spreading and fate of total coliforms and faecal
coliforms.
The die-off of bacteria is described by:
FdFF CK
dt
Cd
where
CF= concentration of faecal coliforms (1/100 ml)
KdF= decay coefficient for faecal coliforms (1/day)
The decay coefficient is dependent on the light conditions as well as the salinity and water
temperature.
Light conditions in the water column is the most important factor affecting the decay
coefficient and is described using Beer’s law:
z
oz eff

Water Quality
18 MIKE ECO Lab WQ Templates - © DHI

Data Requirements
19
4 Data Requirements
• Basic Model Parameters
- Model Grid size and extent
- Time step and length of simulation
- Type of output required and its frequency
• Bathymetry and Hydrodynamic Input
• Combined Advection-Dispersion Model
- Dispersion coefficients
• Initial Conditions
- Concentration of parameters
• Boundary Conditions
- Concentration of parameters
• Pollution Sources
- Discharge magnitudes and concentration of parameters
• Process rates
- Size of coefficients governing the process rates. Only some of these coefficients
can be determined by calibration. Others will be based on literature values or
found from actual measurements and laboratory tests.

Water Quality
20 MIKE ECO Lab WQ Templates - © DHI
List of Literature
21
5 List of Literature
Flonery, W.H., B.P. Tenholsky, S.A. & Vitterling, W.T. Numerical Recipes. Cambridge
University Press (1986).
Banks, R.B., F.F. Herrera. Effect of wind and rain on surface reaeration.
J.Env.Eng.Div., ASCE 103, June 1977, pp. 489-504.
Evison, L.M. Comparative studies on the survival of indicator organisms and
pathogens in fresh and sea water. Wat.Sci.Tech., Vol. 20, 1986, pp. 1051-1054.
Gameson, A.L.H. Investigations of sewage discharges to some British coastal
waters. TR 239. Water Research Centre, Brecks, UK, 1986.
Malmgren-Hansen, A., P. Mortensen, B. Moller. Modelling of oxygen depletion in
coastal waters. Wat.Sci.Tech., Vol. 17, 1984, pp. 967-978.
Henriksen, K. et al. Rates of nitrification, distribution of nitrifying bacteria and nitrate
fluxes in different types of sediments from Danish Waters. Mar.Biol. 61, pp. 299-304,
1981.
Kasper, H.F. Denitrification in marine sediments: measurement of capacity and
estimate of in situ rate. Appl.Environ.Microbiol., Vol. 43, No. 3, 1982, pp. 522-527.

Water Quality
22 MIKE ECO Lab WQ Templates - © DHI