Embed Size (px)
Citation preview
Kll lumer I( NQidoo JG !Mron J lroodrytt [j WATER RESEARCH COMMISSION'
nmns

INVESTIGATION INTO THE COST AND OPERATION OF SOUTHERN AFRICAN
DESALINATION AND WATER REUSE PLANTS
Volume II: Current Status of Desalination and Water Reuse in Southern Africa
Report to the Water Research Commission
by
KN Turner, K Naidoo, JG Theron, J Broodryk Royal HaskoningDHV
WRC Report No TT 637/15
September 2015
Obtainable from Water Research Commission Private Bag X03 Gezina, 0031 [email protected] or download from www.wrc.org.za The publication of this report emanates from the Water Research Commission project entitled Investigation into the cost and operation of Southern African desalination and water reuse plants (WRC Project No. K5/2121), The report forms part of a series of three reports. The other reports in the series are: Volume I: Overview of Desalination and Water Reuse (WRC Report no. TT 636/15) Volume III: Best Practices on Cost and Operational Aspects of Desalination and Water Reuse Plants (WRC Report no. TT 638/15).
DISCLAIMER
This report has been reviewed by the Water Research Commission (WRC) and approved for publication. Approval does not signify that the contents necessarily reflect the views and policies of the WRC, nor does
mention of trade names or commercial products constitute endorsement or recommendation for use.
ISBN 978-1-4312-0699-5 Printed in the Republic of South Africa © Water Research Commission
Investigation into the Cost and Operation of Southern African Desalination and Water Re-use Plants Volume II
i
EXECUTIVE SUMMARY
The aim of this research project was to capture real operational and maintenance data, and associated costs, of selected desalination and water reuse plants, and to establish a first-order knowledge base for these types of projects in the augmentation of water supply in a Southern African context. The selected plants are:
No. Plant Type of Plant
1 Mossel Bay 15 Mℓ/d SWRO plant Desalination – direct potable
2 Sedgefield 1.5 Mℓ/d SWRO plant Desalination – direct potable
3 Albany Coast 1.8 Mℓ/d SWRO plant Desalination – direct potable
4 Beaufort West 2.1 Mℓ/d reclamation plant Reuse – direct potable
5 Windhoek 21 Mℓ/d Goreangab reclamation plant Reuse – direct potable
6 George 10 Mℓ/d UF plant (full capacity tested as 8.5 Mℓ) Reuse – indirect potable
7 Mossel Bay 5 Mℓ/d UF/RO plant Reuse – direct industrial
Volume I of this report provides background and insight into desalination and water re-use, including a literature review.
This report (Volume II) describes the current status of desalination and water reuse in Southern Africa and presents lists of the current projects either implemented, under construction or in the planning stage. The funding mechanisms employed to implement these types of projects are described in this volume, as well as the life cycle costing approach to include all of the capital and operational costs.
Volume III presents descriptions of the selected plants and their main processes, as well as summaries of the capital costs and O&M costs. The report then provides unit costs and comparisons with the other plants, and finally presents summaries of lessons learnt and best practices in desalination and water reuse.
Investigation into the Cost and Operation of Southern African Desalination and Water Re-use Plants Volume II
ii
ACKNOWLEDGEMENTS
The project team wishes to thank the following people for their contributions to the project.
Reference Group Affiliation
Dr Nonhlanhla Kalebaila Water Research Commission (Chairperson)
Dr Jo Burgess Water Research Commission (former Chairperson)
Ms Charmaine Khanyile Water Research Commission
Mr Jürgen D Menge Windhoek Municipality (Retired)
Prof Chris Buckley University of KwaZulu-Natal
Mr Rob Dyer eThekwini Municipality
Prof Andre J Burger Stellenbosch University
Mr Peter Thompson Umgeni Water
Others
Mr Chris Nair Amatola Water
Mr André Dyer Amatola Water
Mr Sukenene George Amatola Water
Mr Chris Wright Beaufort West Municipality
Mr Louw Smith Beaufort West Municipality
Mr Pierre Marais Water & Wastewater Engineering
Mr Chris D Swartz Chris Swartz Water Utilisation Engineers
Mr Nelius Coomans Chris Swartz Water Utilisation Engineers
Mr David Sauls George Municipality
Dr Gerhard Offringa GO Water Management
Mr Calvin Japhta Knysna Municipality (Sedgefield SWRO)
Mr Hendrik F Schoeman Mossel Bay Municipality
Mr Pierre Hayward VWS (Veolia)
Mr Cobus Olivier VWS (Veolia)
Mr David Brown VWS (Veolia) The financing of the project by the Water Research Commission and the contribution of the members of the Reference Group is acknowledged gratefully. The project was only possible with the cooperation of a number of individuals and institutions. The authors therefore wish to record their sincere thanks to all those, including those mentioned above, that contributed time and effort to assist the team.
Investigation into the Cost and Operation of Southern African Desalination and Water Re-use Plants Volume II
iii
TABLE OF CONTENTS
EXECUTIVE SUMMARY ..................................................................................................................................... i
ACKNOWLEDGEMENTS .................................................................................................................................. ii
TABLE OF CONTENTS .................................................................................................................................... iii
LIST OF FIGURES ............................................................................................................................................. v
LIST OF TABLES ............................................................................................................................................... v
ACRONYMS & ABBREVIATIONS ................................................................................................................... vi
CHAPTER 1: BACKGROUND .......................................................................................................................... 1
DESALINATION AND WATER REUSE INDUSTRIAL APPLICATIONS ............................................... 1 1.1 DESALINATION AND WATER REUSE MUNICIPAL APPLICATIONS ................................................. 1 1.2
CHAPTER 2: FUNDING AND INSTITUTIONAL ARRANGEMENTS ............................................................... 2
INTRODUCTION .................................................................................................................................... 2 2.1 INSTITUTIONAL ARRANGEMENTS AND WATER SECTOR REGULATIONS .................................... 2 2.2 FINANCING WATER INFRASTRUCTURE IN SOUTH AFRICA ........................................................... 4 2.3
Public Funding (Department of Water and Sanitation and other departments) ........................ 6 2.3.1 Project/Infrastructure Financing Utility ...................................................................................... 7 2.3.2 Independent Water Utility .......................................................................................................... 8 2.3.3 Public Private Partnerships (PPP) ............................................................................................ 8 2.3.4 Concession ............................................................................................................................... 8 2.3.5
FUNDING CONSIDERATIONS SPECIFIC TO WATER REUSE AND DESALINATION ...................... 9 2.4
CHAPTER 3: DESALINATION IN SOUTH AFRICA ....................................................................................... 10
INTRODUCTION .................................................................................................................................. 10 3.1 RECENT AND PLANNED DESALINATION PROJECTS IN SOUTH AFRICA .................................... 10 3.2
Trekkopje – 63 Mℓ/day Seawater Desalination Plant (2008/10) ............................................. 11 3.2.1 Sedgefield – 1.5 Mℓ/day Seawater Desalination Plant (2009) ................................................ 11 3.2.2 Knysna – 2 Mℓ/day Seawater Desalination Plant (2010): ....................................................... 11 3.2.3 Plettenberg Bay – 2 Mℓ/day Seawater Desalination Plant (2010): ......................................... 12 3.2.4 Mossel Bay – 15 Mℓ/day Seawater Desalination Plant (2010/11): ......................................... 12 3.2.5 De Kelders – 1.6 Mℓ/day Desalination Plant (2011): ............................................................... 12 3.2.6 Lamberts Bay – 1.7 Mℓ/day Seawater Desalination Plant (2012): .......................................... 12 3.2.7 Saldanha Bay – 8.5 Mℓ/day Seawater Desalination Plant: ..................................................... 13 3.2.8 Umgeni Water – 150 Mℓ/day Seawater Desalination Plant (Feasibility): ................................ 13 3.2.9
City of Cape Town – 100 to 150 Mℓ/day Seawater Desalination Plant: .................................. 13 3.2.10
CHAPTER 4: WATER REUSE IN SOUTH AFRICA ....................................................................................... 14
INTRODUCTION .................................................................................................................................. 14 4.1 RECENT AND PLANNED WATER REUSE PROJECTS IN SOUTH AFRICA .................................... 14 4.2
Mossel Bay – 5 Mℓ/day Direct Industrial Reuse Plant (2009/10) ............................................ 15 4.2.1 Beaufort West – 2.3 Mℓ/day Direct Potable Reuse Plant (2010) ............................................ 15 4.2.2 Bellville (City of Cape Town) – 20 Mℓ/day Membrane Bio Reactor (MBR) Potential Reuse .. 16 4.2.3

Investigation into the Cost and Operation of Southern African Desalination and Water Re-use Plants Volume II
iv
George – 10 Mℓ/day Indirect Potable Reuse Plant (2009/10) ................................................. 16 4.2.4 Port Elizabeth (NMBM) – 45 Mℓ/day Membrane Bio Reactor (MBR) Industrial Reuse .......... 17 4.2.5 Hermanus – 5 Mℓ/day Direct Potable Reuse Plant (Feasibility Phase) .................................. 17 4.2.6 Zandvliet (City of Cape Town) – 18 Mℓ/day Membrane Bio Reactor (MBR) (Potential Reuse)17 4.2.7 Potsdam (City of Cape Town) – 30 Mℓ/day Membrane Bio Reactor (MBR) (Potential Reuse)17 4.2.8
CHAPTER 5: LIFE CYCLE COSTS & OPERATIONAL ASPECTS ............................................................... 18
INTRODUCTION .................................................................................................................................. 18 5.1 ASSUMPTIONS .................................................................................................................................... 18 5.2
Key date assumptions ............................................................................................................. 18 5.2.1 Economic assumptions ........................................................................................................... 18 5.2.2 Product Water Tariffs .............................................................................................................. 19 5.2.3
FEEDWATER SUPPLY, INSTALLED CAPACITY AND DEMAND ...................................................... 19 5.3 CAPITAL AND MAINTENANCE EXPENDITURE ................................................................................ 19 5.4 FUNDING STRUCTURES .................................................................................................................... 21 5.5 OUTPUTS ............................................................................................................................................. 21 5.6
Gearing and Scenarios ........................................................................................................... 21 5.6.1 Financial results ...................................................................................................................... 24 5.6.2
OPERATION AND MAINTENANCE ASPECTS ................................................................................... 24 5.7 Electricity ................................................................................................................................. 25 5.7.1 Maintenance Aspects .............................................................................................................. 27 5.7.2 Consumables .......................................................................................................................... 27 5.7.3 Laboratory Analyses ............................................................................................................... 28 5.7.4 Zero production mode costs ................................................................................................... 28 5.7.5
CHAPTER 6: FUTURE OF DESALINATION & WATER REUSE IN SOUTH AFRICA .................................. 29
REFERENCES ................................................................................................................................................. 30
APPENDIX A: PUBLIC PRIVATE PARTNERSHIPS ..................................................................................... 31

Investigation into the Cost and Operation of Southern African Desalination and Water Re-use Plants Volume II
v
LIST OF FIGURES
Figure 2.1: Diagram showing institutional support across the water value chain ........................................... 3
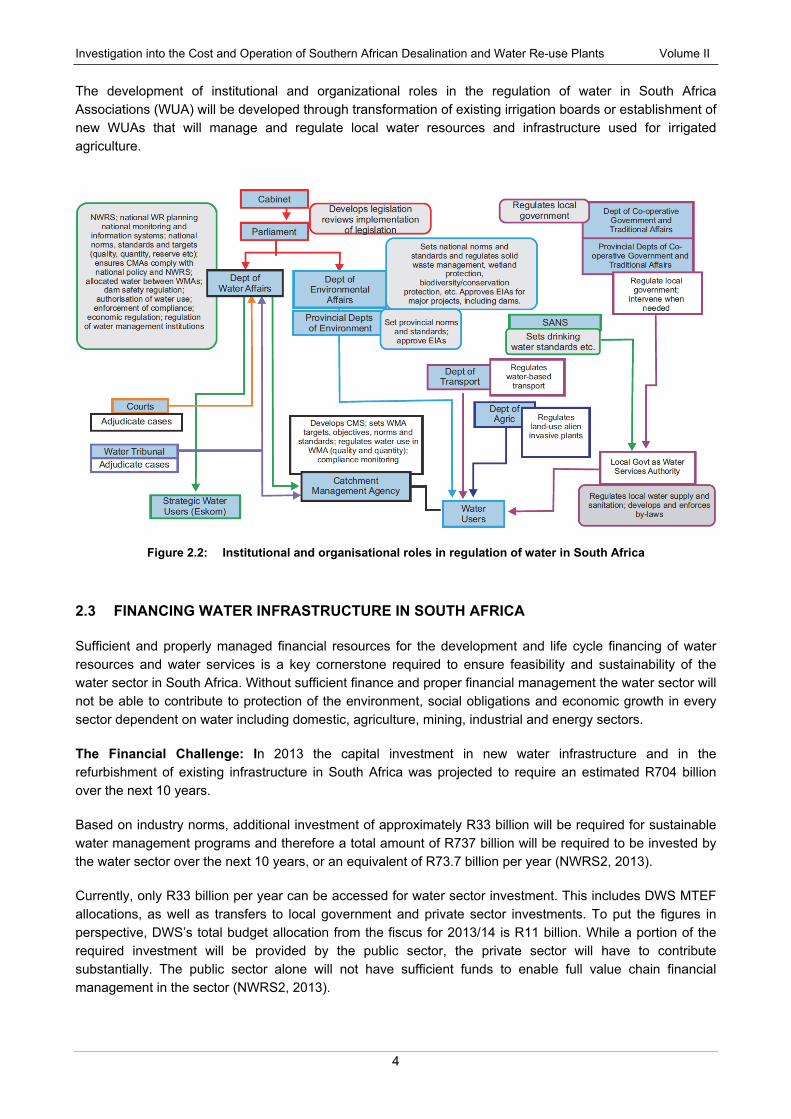
Figure 2.2: Institutional and organisational roles in regulation of water in South Africa ................................. 4
Figure 5.1: Example of equity returns ........................................................................................................... 22
Figure 5.2: 50-year project lifecycle .............................................................................................................. 23
Figure 5.3: Distribution of the total O&M costs related to SWRO plants operating in South Africa .............. 25
Figure 5.4: Distribution of electrical cost per unit process for SWRO plants operating in South Africa ........ 26
Figure 5.5: Eskom’s time of use tariff structure ............................................................................................. 26
LIST OF TABLES
Table 3.1: Recent and planned desalination projects in the municipal context ........................................... 10
Table 4.1: Recent and planned water reuse projects in the municipal context............................................ 14
Table 4.2: Product Water Specifications for Wolwedans Dam (VWS, 2010) ............................................... 15
Table 4.3: Product Water Specifications for the Garden Route Dam (VWS, 2010) .................................... 16
Table 5.1: Activity Schedule ......................................................................................................................... 18
Table 5.2: Escalation Assumptions .............................................................................................................. 19
Table 5.3: WWTW Outflows ......................................................................................................................... 19
Table 5.4: Off-take Assumptions .................................................................................................................. 19
Table 5.5: Capital Expenditure – Phase 1 ................................................................................................... 20
Table 5.6: Capital Expenditure – Phase 2 ................................................................................................... 20
Table 5.7: Maintenance Expenditure ........................................................................................................... 20
Table 5.8: O&M Costs .................................................................................................................................. 20
Table 5.9: Payment Period ........................................................................................................................... 21
Table 5.10: Funding Parameters .................................................................................................................... 21
Table 5.11: Scenario Planning ....................................................................................................................... 22
Table 5.12: Lifecycle Planning ....................................................................................................................... 23

Investigation into the Cost and Operation of Southern African Desalination and Water Re-use Plants Volume II
vi
ACRONYMS & ABBREVIATIONS
ACIP Accelerated Community Infrastructure Programme ACWB Albany Coast Water Board AOP Advanced Oxidation Processes BAC Biological Activated Carbon BEE Black Economic Empowerment CAPEX Capital Expenditure CEB Chemical Enhanced Backwash CEC Contaminant of emerging concern CIP Cleaning in Place CMA Catchment Management Agencies CoGTA Ministry for Cooperative Governance and Traditional Affairs CPI Consumer Price Inflation DAF Dissolved Air Flotation DOC Dissolved Organic Carbon DWA Department of Water Affairs DWS Department of Water and Sanitation (formerly DWA) ED Electrodialysis EDC Endocrine Disrupting Compounds EDR Electrodialysis Reversal EIA Environmental Impact Assessment ERD Energy Recovery Device GAC Granular Activated Carbon GDP Gross Domestic Product GWWTP Gammams Wastewater Treatment Plant HACCP Hazard Analysis and Critical Control Points HDD Horizontal Directional Drilling IPS Institute of Polymer Science (University of Stellenbosch) IRR Internal Rate of Return MED Multi-effect distillation MFMA Municipal Finance Management Act MIG Municipal Infrastructure Grant MISA Municipal Infrastructure Support Agent MOD Manipulated Osmosis Desalination MSA Municipal Systems Act MSF Multi-stage-flash MWIG Municipal Water Infrastructure Grant NACQ Nominal Annual Compounded Quarterly NF Nanofiltration NGO Non-Governmental Organization NGWRP New Goreangab Water Reclamation Plant NMBM Nelson Mandela Bay Municipality O&M Operation and Maintenance OEM Original Equipment Manufacturer OHS Occupational Health and Safety OPEX Operating Expenditure PAC Powdered Activated Carbon PFMA Public Finance Management Act PPP Public Private Partnerships PSA Pressurised Swing Adsorption

Investigation into the Cost and Operation of Southern African Desalination and Water Re-use Plants Volume II
vii
PST Primary Settling Tank RBIG Regional Bulk Infrastructure Grant REUSECOST WRC Water Reuse Costing Model RHIG Rural Households Infrastructure Grant RO Reverse osmosis RWU Regional Water Utilities SCADA Supervisory Control and Data Acquisition SHEQ Safety, Health, Environmental and Quality SLA Service Level Agreement SST Secondary Settling Tank SWRO Seawater Reverse osmosis TBMs Tunnel Boring Machines TCTA Trans-Caledon Tunnel Authority TDS Total Dissolved Solids TMP Transmembrane pressure TOC Total Organic Carbon TOU Time of Use TRO Tubular Reverse Osmosis TSS Total Suspended Solids UAE United Arab Emirates UF Ultrafiltration USA United States of America USDG Urban Settlements Development Grant UV Ultra-violet VCD Vacuum Compression Distillation VFD Vacuum Freeze Distillation WABAG Proprietary technology from VA TECH WABAG Ltd WHO World Health Organisation WINGOC Windhoek Goreangab Operating Company Ltd WRC Water Research Commission of South Africa WRP Water Reclamation Plant WSA Water Services Authority WSOS Water Services Operating Subsidy WSP Water Service Provider / Water Safety Plan WWTP Wastewater Treatment Plant WWTW Wastewater Treatment Works
UNITS OF MEASURE
µm micrometre µS/cm microsiemens per centimetre bar(g) bar gauge pressure kPa(g) kiloPascal gauge pressure kVA kilovolt ampere kWh kiloWatt hour m³/h cubic meter per hour mg/ℓ milligram per litre mS/m millisiemens/meter NTU Nephelometric Turbidity Units ppm parts per million
Investigation into the Cost and Operation of Southern African Desalination and Water Re-use Plants Volume II
viii
CHEMICAL FORMULAS
CaCl₂ Calcium Chloride
CaCO₃ Calcium Carbonate (Lime)
Cl₂ Chlorine gas
CO₂ Carbon Dioxide
FeCl₃ Ferric Chloride
H₂O₂ Hydrogen Peroxide
H₂SO₄ Hydrogen Sulphate (Sulphuric acid)
KMnO₄ Potassium Permanganate
N₂ Nitrogen gas NaClO Sodium Hypochlorite (bleach)
Na₂CO₃ Sodium Carbonate (Soda Ash) NaOH Sodium Hydroxide (Caustic Soda)
Na₂S₂O₅ Sodium Metabisulphite (also referred to SMBS)
O₃ Ozone
Investigation into the Cost and Operation of Southern African Desalination and Water Re-use Plants Volume II
1
CHAPTER 1: BACKGROUND
Membrane technology and desalination has been commercially applied in South Africa since the mid-1980s, preceded by the development of locally manufactured tubular reverse osmosis membranes at the Institute of Polymer Science (IPS), University of Stellenbosch under the auspices of the Water Research Commission (WRC). This development led to the large-scale industrial implementation of an 8.5 Mℓ/day tubular reverse osmosis (TRO) plant at Eskom’s Lethabo power station for the desalination and reuse of cooling tower blow down (Schutte et al., 1987). This culminated in the implementation of two large TRO installations at Sasol’s complex in Secunda to recover respective 6 Mℓ/day (1995) and 9.3 Mℓ/day (2001) of process water from clear ash effluent (EN, 2002).
The establishment of locally developed TRO technology may be seen as the precursor for pressure driven membrane technology based on other configurations (e.g. spiral-wound, capillary, etc.) to have gained acceptance and widespread use in Southern Africa.
DESALINATION AND WATER REUSE INDUSTRIAL APPLICATIONS 1.1
It is apparent that the majority of desalination and reuse installations to date, in particular where membrane technology is concerned relate to industrial applications in the South African context, namely Lipsett (2012), Marais and Von Dürckheim (2012) and Aveng (2012).
Prime examples of these may be found in the power generation, steel producing, pulp and paper, mining and petrochemical sectors. This may be attributed to the fact that the discharge of untreated industrial waste streams at the source is becoming more problematic and costly, apart from environmental concerns. In conjunction, such waste streams generally offer the potential for the recovery of valuables or reclamation of water for process purposes.
The primary focus of this project is on municipal desalination and reuse applications. Hence purely industrial installations are not elaborated upon.
DESALINATION AND WATER REUSE MUNICIPAL APPLICATIONS 1.2
Although municipal desalination and reuse installations have traditionally been lagging their industrial counterparts, there has been a significant increase in activity in recent years. This is mainly the result of adverse climatic conditions, existing water sources being essentially fully exploited and increasing cost of providing good quality potable water.
Increasing demands for water by the industrial and agricultural sectors also play a role. To this end, considering municipal applications where the end-use is for potable purposes only would be simplistic. Nevertheless, applications where a water swop approach is used are also considered, i.e. desalinated or reclaimed water used for industrial purposes and thereby making water from conventional sources available for potable consumption. Similarly, membrane bioreactor (MBR) extensions at existing wastewater treatment works have also been mentioned since they offer the potential for future reuse, although this may not be the main consideration for their implementation.

Investigation into the Cost and Operation of Southern African Desalination and Water Re-use Plants Volume II
2
CHAPTER 2: FUNDING AND INSTITUTIONAL ARRANGEMENTS
INTRODUCTION 2.1
It is the vision of the Department of Water and Sanitation (DWS) to ensure robust and sustainable water sector institutions that will ensure that national goals and objectives for the Water Sector in South Africa are achieved.
Regulation of the water sector and of the use of water is a critical element of effective, equitable and sustainable water management of water resources and the delivery of sustainable and appropriate water services. Regulation aims to change the behaviour of water users and water institutions to ensure the sustainable and equitable use, protection, conservation and development of the nation’s water resources.
The Minister of DWS, as a shareholder in a number of water sector institutions, plays a role in providing strategic guidance and oversight to these organizations, which is different from the regulatory role of various organs of state.
The following figure indicates the various institutions and organizations and their roles in regulation of water in South Africa.
DWS Infrastructure Branch & Water Trading Entity: These bodies within DWS are responsible for management of the nation water resources infrastructure functions at a national level including the development, operation and maintenance of infrastructure involving water resources. The institutional model will be empowered to contract Regional Water Utilities or other competent institutions to implement, operate and maintain infrastructure on their behalf.
Trans-Caledon Tunnel Authority (TCTA): The TCTA is responsible for functions of financing and project management required for the construction of water resources infrastructure that is funded off-budget (outside of government budgets). Once the institutional model for national water resources is functioning in a stable manner, the TCTA may be fully incorporated into the model.
Regional Water Utilities: The twelve existing water boards in South Africa will be consolidated into nine viable regional water utilities (RWU) with their function to strengthen the development, financing, management, operation and maintenance of regional bulk water and wastewater infrastructure. The RWUs will furthermore support Water Services Authorities where appropriate and support Catchment Management Agencies (CMA) to undertake water resources management activities.
Catchment Management Agencies: Nine CMAs will be established with the primary role to take responsibility of water resources management at a regional or catchment level.
INSTITUTIONAL ARRANGEMENTS AND WATER SECTOR REGULATIONS 2.2
The National Water Act (Act 36 of 1998) provides for the establishment and transformation of institutions to assist DWS in giving effect to its core mandate – the development, protection, conservation and allocation of water resources, and regulation of water services and water use. Currently DWS is in the process of institutional reform and re-alignment in order to effectively contribute to the national government’s development objectives.
At present, DWS manages most of the national water resources infrastructure through its Water Trading Entity while the Trans-Caledon Tunnel Authority (TCTA) finances and project manages the implementation
Investigation into the Cost and Operation of Southern African Desalination and Water Re-use Plants Volume II
3
of economically viable water projects, as directed by the Minister. TCTA projects are financed off-budget and the investment costs are repaid through user charges.
It is recognized that the Water Trading Entity is not the most appropriate or efficient institutional arrangement for managing national water infrastructure. Thus, the intention is to establish an alternative and appropriate National Water Resources Infrastructure institutional model for developing, financing and managing national water infrastructure.
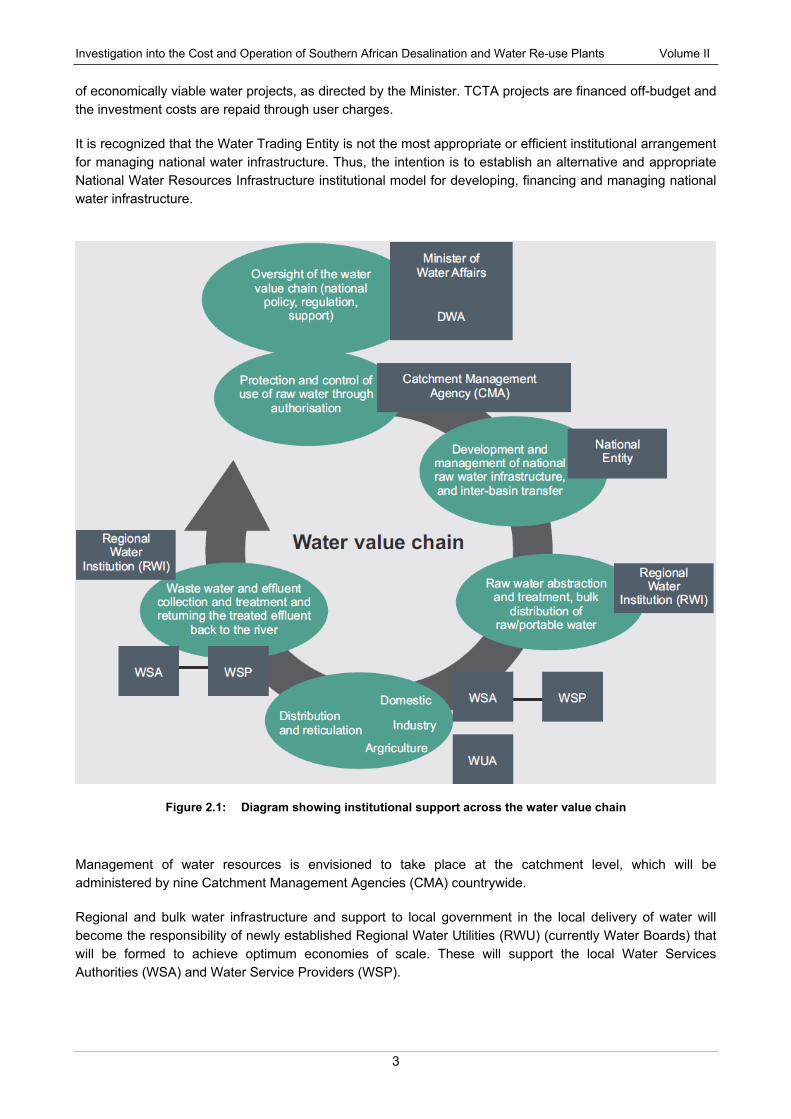
Figure 2.1: Diagram showing institutional support across the water value chain
Management of water resources is envisioned to take place at the catchment level, which will be administered by nine Catchment Management Agencies (CMA) countrywide.
Regional and bulk water infrastructure and support to local government in the local delivery of water will become the responsibility of newly established Regional Water Utilities (RWU) (currently Water Boards) that will be formed to achieve optimum economies of scale. These will support the local Water Services Authorities (WSA) and Water Service Providers (WSP).
Investigation into the Cost and Operation of Southern African Desalination and Water Re-use Plants Volume II
4
The development of institutional and organizational roles in the regulation of water in South Africa Associations (WUA) will be developed through transformation of existing irrigation boards or establishment of new WUAs that will manage and regulate local water resources and infrastructure used for irrigated agriculture.
Figure 2.2: Institutional and organisational roles in regulation of water in South Africa
FINANCING WATER INFRASTRUCTURE IN SOUTH AFRICA 2.3
Sufficient and properly managed financial resources for the development and life cycle financing of water resources and water services is a key cornerstone required to ensure feasibility and sustainability of the water sector in South Africa. Without sufficient finance and proper financial management the water sector will not be able to contribute to protection of the environment, social obligations and economic growth in every sector dependent on water including domestic, agriculture, mining, industrial and energy sectors.
The Financial Challenge: In 2013 the capital investment in new water infrastructure and in the refurbishment of existing infrastructure in South Africa was projected to require an estimated R704 billion over the next 10 years.
Based on industry norms, additional investment of approximately R33 billion will be required for sustainable water management programs and therefore a total amount of R737 billion will be required to be invested by the water sector over the next 10 years, or an equivalent of R73.7 billion per year (NWRS2, 2013).
Currently, only R33 billion per year can be accessed for water sector investment. This includes DWS MTEF allocations, as well as transfers to local government and private sector investments. To put the figures in perspective, DWS’s total budget allocation from the fiscus for 2013/14 is R11 billion. While a portion of the required investment will be provided by the public sector, the private sector will have to contribute substantially. The public sector alone will not have sufficient funds to enable full value chain financial management in the sector (NWRS2, 2013).
Investigation into the Cost and Operation of Southern African Desalination and Water Re-use Plants Volume II
5
The National Water Investment Framework: DWS has initiated the development of a comprehensive water sector investment framework that will inform budgeting and integrated planning of water sector projects using a sustainable life-cycle approach that will include the programmed costing and financing of all aspects of sustainable water resources and services development and management.
The investment framework will include the whole water sector value chain, from source to tap to waste and back to source. The investment requirements of DWS, CMAs, water boards, and WSAs and WSPs will be included. The investment framework will also include investments that benefit the municipal, agricultural, energy, industrial and other water-use sectors.
As part of the investment framework, a financing model is being developed that optimizes the use of both on- and off-budget funding to source sufficient funds to meet the required investment targets. Water resources infrastructure will usually be funded by a combination of government and private sector funding because water resource development and bulk infrastructure will always be targeted at a mix of both social and economic uses. The funding mix will be such that government transfers and grants will be used to finance the portion of the infrastructure investment required for supplying water to meet social development objectives, such as that portion used to supply new resources to poor farmers or to provide the basic level of water services for domestic use.
The private sector will be mobilized to finance the economically viable portion of water resource development; that is water supplies to users who can afford to repay loan finance, such as industries, mines and power generation and domestic users receiving high levels of water services. The private sector will be encouraged to contribute towards the social component of infrastructure investment where they use water from the same infrastructure. To date, private sector funding of water resource development has mainly been channelled through TCTA in the form of loans or bonds. Water boards (Regional Water Utilities) also borrow funds from the private sector within their prescribed borrowing authorities. In addition, PPPs have recently mobilized capital contributions from mines and other large users to unlock water projects.
In line with the water sector infrastructure required, the sources of finance and existing institutional arrangements, there are five preferred institutional options to finance/fund and implement water sector projects.
Public Funding – Department of Water and Sanitation (or public water institution as agent) develop, operate and maintain water infrastructure funded with capital allocated from the fiscus as part of the departmental budget from National Treasury. This is the most common approach, where public water institutions like Rand Water and Umgeni Water, or municipalities, make use of capital from public funds through the DWS to implement the water infrastructure, and then they operate and maintain it going forward. Many water treatment plants in South Africa have been implemented in this way.
Project/Infrastructure Financing Utility raises commercial finance on a project basis (similar to the TCTA), but with operation by DWS or a public water institution.
Independent Water Utility that finances, develops and operates water infrastructure from its balance sheet and the income it can generate from it.
Public Private Partnerships (PPPs) for development of water infrastructure on a project basis, where private investors have equity in the scheme which is also operated by the PPP.
Concession to private sector financiers to finance, develop and operate a scheme for a specific timeframe through equity or debt financing.

Investigation into the Cost and Operation of Southern African Desalination and Water Re-use Plants Volume II
6
Public Funding (Department of Water and Sanitation and other departments) 2.3.1
Most public funding of water infrastructure in South Africa are typically channelled via the DWS departmental budget with various types of grant funding allocated to municipalities and other water institutions. Most water infrastructure projects are funded by a combination of grant funding and equitable share funding allocated by DWS on an annual basis.
The DWS grant funding programmes used to develop water infrastructure including desalination and water reuse schemes include the following.
Equitable share funding
The Equitable Share funding is an annual operating grant allocated to municipalities aimed at supporting the affordability of municipal services to be provided to the indigent portion of consumers within each region. The Equitable Share grant allocation is typically based on the level of service available to municipal consumers including access to potable water, sanitation, solid waste removal and electricity.
Municipal Infrastructure Grant
The Municipal Infrastructure Grant (MIG) funding are allocated to municipal infrastructure projects approved by DWS and provides municipalities with grant funding in support of their capital expenditure budgets to improve service delivery typically within urban municipal areas. MIG allocations to municipalities are based on water and sanitation backlogs.
Regional Bulk Infrastructure Grant
The Regional Bulk Infrastructure Grant (RBIG) funding is allocated to municipalities or other water institutions to develop regional bulk water supply projects the service urban and rural areas. This funding is allocated on a project basis with approval by DWS and municipalities or water boards typically acting as implementing agents who will ultimately take ownership of infrastructure and be responsible for management, operation and maintenance thereof.
Municipal Water Infrastructure Grant
The Municipal Water Infrastructure Grant (MWIG) funding is aimed at accelerating the delivery of water infrastructure to households that do not have access to clean water. This is aimed specifically at eradication of service delivery backlogs in poor communities (rural and urban).
Urban Settlements Development Grant
The Urban Settlements Development Grant (USDG) funds informal settlement upgrading, this includes provision of an integrated set of services including water and sanitation
Rural Households Infrastructure Grant
The Rural Households Infrastructure Grant (RHIG) has been rescheduled as a direct transfer to municipalities. This will create better alignment between the construction and maintenance of infrastructure, as well as strengthen community consultation. This change should improve the performance of the grant.
The grant is intended to provide on-site water and sanitation but is currently focused on providing VIP toilets.
Investigation into the Cost and Operation of Southern African Desalination and Water Re-use Plants Volume II
7
Water Services Operating Subsidy
The Water Services Operating Subsidy (WSOS) funds water service authorities currently or previously managed directly by the Department of Water and Sanitation.
Accelerated Community Infrastructure Programme
The Accelerated Community Infrastructure Programme (ACIP) funding is aimed at acceleration of the universal achievement of providing access to basic water and sanitation services at community level. This funding is allocated to water conservation and demand management projects, community infrastructure and wastewater infrastructure refurbishment.
Municipal Infrastructure Support Agent
The Municipal Infrastructure Support Agent (MISA) is a Government Component within the Ministry for Cooperative Governance and Traditional Affairs (CoGTA), established in terms of Presidential Proclamation No. 29 of 2012. It is a Schedule 3 entity regulated in terms of the Public Service Act (1994), as amended. Its principal mandate is to provide technical support to and assist municipalities to strengthen their internal capacity for delivery and maintenance of basic service infrastructure.
This initiative is an integral part of the Department of Cooperative Governance’s programme towards improving municipal infrastructure provisioning and maintenance for accelerated and sustainable service delivery, in line with the objectives of Local Government Turnaround Strategy
Disaster funding
Most of the desalination and water reuse schemes developed in the Southern Cape region and Beaufort West were built in reaction to severe drought conditions. In these cases, a regional disaster was proclaimed and special disaster funding applications were submitted to National Treasury to assist in the funding of capital expenditure required for the rapid development of water reuse and desalination infrastructure since surface and ground water resources were no longer reliable.
Project/Infrastructure Financing Utility 2.3.2
A project/infrastructure financing utility consist of an implementing agent or government utility that raises commercial finance and possibly public funding in order to implement a specific project which will be operated by DWS or a water institution. In this instance it is critical that the project is ring fenced, financially feasible and capable of servicing the commercial financing commitments or loans through revenue generated by the infrastructure.
In the case of water reuse and desalination plants it could be fairly easy to ring fence a project depending on its interface with existing water supply infrastructure.
This financial model is most suitable where a single point of delivery of product water is applicable such as a water reuse plant supplying industrial water to an industry or defined industrial area.
Investigation into the Cost and Operation of Southern African Desalination and Water Re-use Plants Volume II
8
Independent Water Utility 2.3.3
Financing of water infrastructure by an Independent Infrastructure Utility is not a common practice in South Africa with most water infrastructure being owned and operated by local or provincial government. However, with DWS’s drive to create regional water utilities (currently water boards), this could become more common.
In this instance the water infrastructure utility will raise commercial finance against its balance sheet and income it can generate from existing and planned infrastructure. This type of project funding is not project based and therefore more resilient to changes in demand, etc. which may offer a lower risk profile than project based financing.
Public Private Partnerships (PPP) 2.3.4
The majority of the water opportunities for the private sector in South Africa require partnership with national, provincial or local government institutions. South Africa has established a firm regulatory framework that enables municipal, provincial and national government institutions to enter into public private partnership (PPP) agreements.
The definition of a (PPP) is consistent across all three spheres of government. A PPP is defined as commercial transaction between a government institution and a private party in terms of which the private party:
• performs a government institutional function on behalf of the institution; and/or
• acquires the use of state property for its own commercial purposes; and
• assumes substantial financial, technical and operational risks in the transaction; and
• receives a benefit for performing the government institutional function or from utilizing the state property, either by way of:
− being paid by the revenues from government institution; or
− charges or fees to be collected by the private party from users or customers of a service provided to them; or
− A combination of the revenues and such charges or fees.
The PPP Regulations provide precise and detailed instructions for PPPs. These regulations define the elements of a PPP, and set out the stages and approvals it will have to go through.
The PPP project cycle enables the three regulatory tests of affordability, value for money and risk transfer to be applied at every stage of preparing for, procuring and managing a PPP agreement. More detail on PPP’s and the associated legal and regulatory framework is provided in Appendix B.
Concession 2.3.5
Concessions are fairly uncommon in the South African public water sector and are more applicable to the private sector, particularly the industrial and mining sectors. Concession funding of water sector projects involves private sector companies financing, implementing and operating water infrastructure for a set period of time.
Typical project finance is done through equity, debt financing or a combination thereof.

Investigation into the Cost and Operation of Southern African Desalination and Water Re-use Plants Volume II
9
FUNDING CONSIDERATIONS SPECIFIC TO WATER REUSE AND DESALINATION 2.4
Developing and operating sustainable water reuse and/or desalination water supply infrastructure requires the use of sound business case engineering decision making that is closely tied to the project’s strategic planning process. The following funding consideration and key elements are fundamental to successful project implementation and operation.
• The most critical element of developing water reuse and desalination projects is that it needs to be ‘fit-for-purpose’. It is therefore critical that these projects are developed as part of an integrated water resource portfolio with an in-depth analysis of water demand and water quality requirements from the specific plants. This is in most cases the determining factor in the financial and technical feasibility and overall success of these types of projects.
• For water reuse and desalination plants there is a direct correlation between the quality of water and cost to produce water. It is therefore critical to do sufficient sampling and testing of raw water (whether wastewater, sea water or from other sources) during the feasibility phase and an in-depth analysis of product water quality requirements.
• Accurate capital and operational expenditure estimates and detailed life cycle costing are required and should include adequate risk factors that allow for unexpected changes in demand, escalation and changes in rates and availability of consumables (especially electricity), etc.
• Clear and concrete take-off agreements (and other associated operational, maintenance and other agreements) are required for successful implementation and operation.
• Revenues from water rates should be adequate to annual operating, maintenance and repair costs, replacement and improvement costs, adequate working capital and servicing of debt finance (if applicable) as well as some reserves.
• Accounting practices should adhere to generally accepted accounting principles and regulatory requirements and should be aligned to the project’s specific funding mechanism and development model.
• Budgeting of the operational phase should include sufficient allowances for asset management, preventative maintenance and future infrastructure replacement and/or re-investment.
• Quality of material and skills required to cost effectively operate and maintain water reuse and desalination facilities should be adequately planned and incorporated into its financial and implementation models.
• Equitable distribution of rates when implementing a water reuse or desalination plant into a water resource portfolio should be clearly detailed and communicated to end consumers.
Investigation into the Cost and Operation of Southern African Desalination and Water Re-use Plants Volume II
10
CHAPTER 3: DESALINATION IN SOUTH AFRICA
INTRODUCTION 3.1
Reverse osmosis (RO) is the preferred membrane process for many desalination applications in Southern Africa, including the desalination of seawater, due to its lower energy requirements when compared to distillation processes. It is, furthermore, less complex and more suitable for the capacities envisaged in the Southern African context. Seawater along the coast of South Africa has a total dissolved solids or TDS (salt) concentration of approximately 36 000 mg/ℓ. This does, however, vary and areas are affected by inflows from rivers, high evaporation and currents. Similarly, the pre-treatment requirements for the removal of suspended solids, organics, algae, etc. will depend on the method of seawater abstraction, e.g. open intake or beach wells. Due to technology advancements in the past fifteen years the state of today’s RO process means that seawater can be desalinated in a single pass to meet the latest South African SANS 241 standards for drinking water.
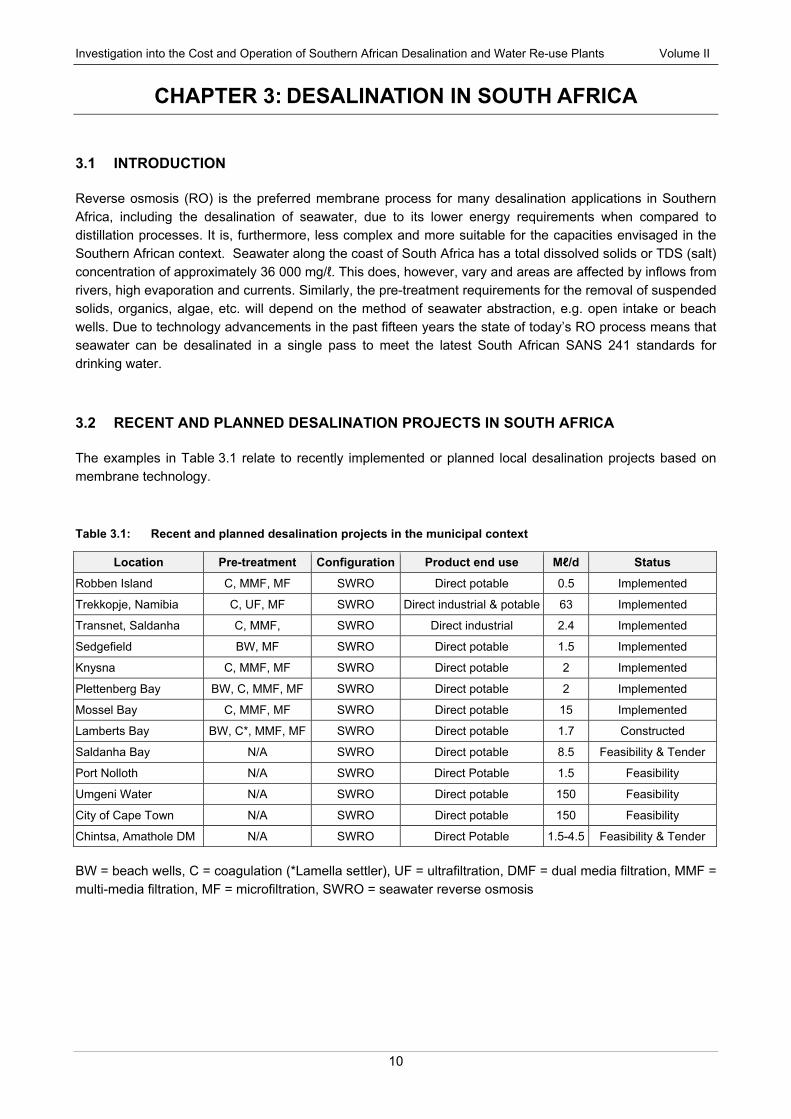
RECENT AND PLANNED DESALINATION PROJECTS IN SOUTH AFRICA 3.2
The examples in Table 3.1 relate to recently implemented or planned local desalination projects based on membrane technology.
Table 3.1: Recent and planned desalination projects in the municipal context
Location Pre-treatment Configuration Product end use Mℓ/d Status
Robben Island C, MMF, MF SWRO Direct potable 0.5 Implemented
Trekkopje, Namibia C, UF, MF SWRO Direct industrial & potable 63 Implemented
Transnet, Saldanha C, MMF, SWRO Direct industrial 2.4 Implemented
Sedgefield BW, MF SWRO Direct potable 1.5 Implemented
Knysna C, MMF, MF SWRO Direct potable 2 Implemented
Plettenberg Bay BW, C, MMF, MF SWRO Direct potable 2 Implemented
Mossel Bay C, MMF, MF SWRO Direct potable 15 Implemented
Lamberts Bay BW, C*, MMF, MF SWRO Direct potable 1.7 Constructed
Saldanha Bay N/A SWRO Direct potable 8.5 Feasibility & Tender
Port Nolloth N/A SWRO Direct Potable 1.5 Feasibility
Umgeni Water N/A SWRO Direct potable 150 Feasibility
City of Cape Town N/A SWRO Direct potable 150 Feasibility
Chintsa, Amathole DM N/A SWRO Direct Potable 1.5-4.5 Feasibility & Tender
BW = beach wells, C = coagulation (*Lamella settler), UF = ultrafiltration, DMF = dual media filtration, MMF = multi-media filtration, MF = microfiltration, SWRO = seawater reverse osmosis
Investigation into the Cost and Operation of Southern African Desalination and Water Re-use Plants Volume II
11
Trekkopje – 63 Mℓ/day Seawater Desalination Plant (2008/10) 3.2.1
• Status: Implemented
• Context: Areva Resources Namibia’s Trekkopje mine required potable quality water for their uranium extraction process. Situated in the dry Erongo region of Namibia the only feasible option to supply sufficient water to meet the mine’s demand was the desalination of seawater since existing sources were allocated for potable use. The desalination plant has a design capacity of 63 Mℓ/day configured in nine trains each able to produce 7 Mℓ/day. The scheme includes an 800 mm overland pipeline (49 km) with one base and two booster pump stations (3 Mℓ/h transfer capacity) from the desalination site at Wlotzkasbaken to the mine site which is inland. Swakopmund is subject to an infrequent phenomenon called “red tides” and upwelling of low oxygenated water, together with hydrogen sulphide from decaying organic material which raises seabed sediments. When these events occur, the desalination plant is managed accordingly to ensure that effective water treatment can be achieved.
• Process Configuration: Open sea intake and brine outfall, chemical conditioning and fine screening, ultrafiltration, single pass seawater reverse osmosis with pressure exchanger energy recovery system, remineralisation by limestone filtration and soda ash addition.
• Product water quality: SANS 241:2006 Class 1 (as per original design)
Sedgefield – 1.5 Mℓ/day Seawater Desalination Plant (2009) 3.2.2
• Status: Implemented
• Context: The town of Sedgefield was hit hard particularly by drought and physically ran out of water in 2009, resulting in the Knysna Municipality having to truck in supplies from nearby George. The town relies on supplies from the Karatara and Hoogekraal Rivers, supplemented by boreholes. These resources were optimised and supplemented by a 1.5 Mℓ/day containerised seawater desalination plant at Myoli beach.
• Process Configuration: Feedwater beach wells and brine wells, cartridge filtration, single pass seawater reverse osmosis with pressure exchanger energy recovery system, partial remineralisation by soda ash addition, disinfection by chlorination, and blending with town water supply.
• Product water quality: SANS 241:2006 Class 1 (as per original design)
Knysna – 2 Mℓ/day Seawater Desalination Plant (2010): 3.2.3
• Status: Implemented 2010
• Context: Knysna Municipality opted for the construction of a 2 Mℓ/day seawater desalination plant for Knysna, together with supply from boreholes, to provide a base flow of potable water to sustain the town in drought conditions. The desalination plant was constructed next to the existing wastewater treatment plant. A borehole field, situated next to the lagoon, provides saline water as feedwater to the plant. The return brine effluent is mixed with the final effluent of the wastewater treatment plant. The final effluent has a raised salinity level, which has a positive impact on the lagoon.
• Process Configuration: Intake wells adjacent to Knysna lagoon and brine co-disposal via wastewater treatment plant outfall, chemical conditioning, multi-media filtration, single pass seawater reverse osmosis with Pelton wheel turbine energy recovery system, partial remineralisation by soda ash addition, and disinfection by chlorination.
• Product water quality: SANS 241:2006 Class 1 (as per original design)
Investigation into the Cost and Operation of Southern African Desalination and Water Re-use Plants Volume II
12
Plettenberg Bay – 2 Mℓ/day Seawater Desalination Plant (2010): 3.2.4
• Status: Implemented
• Context: Bitou Municipality ordered the construction of a 2 Mℓ/day seawater desalination plant in Plettenberg Bay to augment the current ground water and surface water schemes from an alternative source. The new portfolio of water services reduces the risk of supply failure and will be a primary source during drought conditions.
• Process Configuration: Intake wells in river estuary and open sea brine outfall via diffuser, chemical conditioning, multi-media filtration, and single pass seawater reverse osmosis with pressure exchanger energy recovery system, remineralisation by limestone filter, disinfection by chlorination.
• Product water quality: SANS 241:2006 Class 1 (as per original design)
Mossel Bay – 15 Mℓ/day Seawater Desalination Plant (2010/11): 3.2.5
• Status: Implemented
• Context: In order to prevent possible failure to the water supply to the town of Mossel Bay and to PetroSA, the largest industrial user of water in the area, Mossel Bay Municipality decided to construct a 15 Mℓ/day seawater desalination plant at Voorbaai. A total of 10 Mℓ/day of remineralised product water is delivered to Mossel Bay Municipality, while 5 Mℓ/day of reverse osmosis permeate is pumped to PetroSA.
• Process Configuration: Open sea intake and brine outfall via diffuser, raw water screens, chemical conditioning, multi-media filtration, single pass seawater RO with turbo charger energy recovery system, remineralisation by soda ash and calcium chloride addition and disinfection by chlorination.
• Product water quality: SANS 241:2006 Class 1 (as per original design)
De Kelders – 1.6 Mℓ/day Desalination Plant (2011): 3.2.6
• Status: Implemented
• Context: Hard water from two boreholes, Klipgat and lower quality Grotte, was fed to Gansbaai and De Kelders reservoirs respectively. The water was directly used for residential use which led to complaints and high maintenance on the reticulation system. An initiative was taken to build a complete new water treatment plant. The two sources are blended in a feed tank. The new water treatment works transfer water to De Kelders reservoir for residential use and when this reservoir reaches satisfying levels water is transferred to Gansbaai reservoir.
• Process Configuration: Blended water from two borehole sources, iron oxidation by aeration, ultrafiltration, two-stage brackish water reverse osmosis, partial blending of RO permeate with UF filtrate.
• Product water quality: SANS 241:2006 Class 1 (as per original design)
Lamberts Bay – 1.7 Mℓ/day Seawater Desalination Plant (2012): 3.2.7
• Status: Under construction
• Context: Lamberts Bay relies on groundwater for its water supply and has experienced a steady increase in water consumption by the town and farming community. This has resulted in a drop in the groundwater level, which has prompted the municipality to initiate the construction of a seawater desalination plant to augment the potable water supply to the Lamberts Bay area. A total of 1.7 Mℓ/day of product water is required to satisfy immediate needs with an anticipated future demand of up to 5 Mℓ/day.
• Process Configuration: Beach well intake and sea brine outfall, raw water screens, chemical conditioning, media filtration, single pass seawater reverse osmosis with energy recovery system, remineralisation.
• Product water quality: SANS 241:2006 Class 1 (as per original design)
Investigation into the Cost and Operation of Southern African Desalination and Water Re-use Plants Volume II
13
Saldanha Bay – 8.5 Mℓ/day Seawater Desalination Plant: 3.2.8
• Status: Feasibility and Tender
• Context: Saldanha Bay relies on the Berg River Saldanha scheme for its water supply and has experienced water stress in the area. This is compounded by the proposed development of the Saldanha Industrial Development Zone (IDZ) and expected resulting increase in population. To this end, the West Coast District Municipality has initiated the construction of a seawater desalination plant to augment the potable water supply to the Saldanha Bay area. A total of 8.5 Mℓ/day of product water is required to satisfy immediate needs with an anticipated future demand of up to 25.5 Mℓ/day.
• Process Configuration: to be confirmed, but based on reverse osmosis
• Product water quality: SANS 241:2006 Class 1 (as per original design)
Umgeni Water – 150 Mℓ/day Seawater Desalination Plant (Feasibility): 3.2.9
• Status: Passed detailed feasibility phase.
• Context: Umgeni water has initiated a feasibility study into establishing two 150 Mℓ/day seawater desalination plants at separate sites along the Kwa-Zulu Natal coast. The desalination plants are intended to augment the water supply of the Mgeni System and are considered to be a potential cost effective alternative to the Mkomazi Water Project.
• Process Configuration: to be confirmed, but based on reverse osmosis
• Product water quality: SANS 241:2006 Class 1 (as per original design)
City of Cape Town – 100 to 150 Mℓ/day Seawater Desalination Plant: 3.2.10
• Status: Feasibility
• Context: The City of Cape Town has initiated a feasibility study into establishing a 100 to 150 Mℓ/day seawater desalination plant along Cape Town’s north western coastline. The desalination scheme is part of a suite of potential schemes and interventions, including water conservation and demand management, surface and ground water schemes, as well as water reuse to fit the demand growth scenarios predicted in the 2010 update of the Western Cape Water Supply System Reconciliation Strategy
• Process Configuration: to be confirmed, but based on reverse osmosis
• Product water quality: SANS 241:2006 Class 1 (as per original design)

Investigation into the Cost and Operation of Southern African Desalination and Water Re-use Plants Volume II
14
CHAPTER 4: WATER REUSE IN SOUTH AFRICA
INTRODUCTION 4.1
Surface water is currently the predominant water source in the country. However, in the long-term DWS expects surface water to contribute proportionately less with proportionately significant increases in return flows through the treatment of urban (domestic and industrial) wastewater, mining effluent and desalination (DWA, 2011).
In South Africa, water reuse accounts for approximately 14% of total water use and return flows account for a large part of water available for use from some of the important river systems. This constitutes unplanned indirect potable reuse. South Africa has limited fresh water resources and has been defined as water stressed by International standards. A number of reconciliation strategy studies have been conducted in major centres in South Africa, and the reuse of water has been identified as an important consideration in avoiding water shortages, particularly in coastal areas. Reuse of water is also becoming increasingly cost competitive in South Africa, but does have the negative characteristic of being relatively energy intensive, although considerably less energy intensive than seawater desalination.
Where water reuse is more cost-effective compared to other alternatives (such as reducing water requirements, securing a fresh water supply or desalinating sea water), then water reuse becomes an attractive choice provided that the quality of water can meet the necessary requirements and there are not any important cultural or social objections to the use of this water.
RECENT AND PLANNED WATER REUSE PROJECTS IN SOUTH AFRICA 4.2
Table 4.1 relates to recently implemented or planned reuse projects based on membrane technology. More extensive descriptions of some of the above projects are presented in the subsequent sections.
Table 4.1: Recent and planned water reuse projects in the municipal context
Location Pre-treatment Configuration Mℓ/d Product end use Status
Mossel Bay Disc Filter UF, BWRO 5 Direct industrial Implemented
Beaufort West Rapid gravity sand filtration UF, RO, AOP 2.3 Direct potable Implemented
George Screens, Strainer UF 10 Indirect potable Implemented
Bellville (CoCT) Screens MBR 20 Potential reuse Under construction
Port Elizabeth (NMBM) Screens MBR 45 Industrial reuse Feasibility & Tender
Hermanus (Overberg) Dual media filtration UF, AC, RO, AOP 5 Direct potable Feasibility & Tender
Zandvliet (CoCT) Screens MBR 18 Potential reuse Inception
Potsdam (CoCT) Screens MBR 30 Potential reuse Inception
C = coagulation, UF = ultrafiltration, MMF = multi-media filtration, DMF = dual media filtration, MF = microfiltration, RO = seawater reverse osmosis, AOP = advanced oxidation processes

Investigation into the Cost and Operation of Southern African Desalination and Water Re-use Plants Volume II
15
Mossel Bay – 5 Mℓ/day Direct Industrial Reuse Plant (2009/10) 4.2.1
• Status: Implemented
• Context: In this project the Mossel Bay municipality exchanges water from the Wolwedans Dam with upgraded final effluent from the Hartenbos wastewater treatment works for industrial reuse by PetroSA’s Mossgas refinery. The product from the reuse plant has a quality equivalent to, or better than (after blending), that of the Wolwedans Dam, thus making valuable drinking water available from the dam for residential use without affecting the quality of raw water used by the refinery. The first phase of the project delivers 5 Mℓ/day with a planned future extension up to 15 Mℓ/day.
• Process Configuration: Final effluent from WWTW, disc filter, chemical conditioning, ultrafiltration (UF), desalination by two-stage brackish water reverse osmosis (RO), partial blending of RO permeate with UF filtrate.
• Product water quality: Equivalent or better than Wolwedans Dam (Table 4.2) to replace dam water.
Table 4.2: Product Water Specifications for Wolwedans Dam (VWS, 2010)
Parameter Wolwedans Dam Water (Typical) Treated water after blending
COD (mg/ℓ) 52 2
TSS (mg/ℓ) 5.8 1
Nitrates (mg N/ℓ) 5 0.8
Ortho Phosphate (mg P/ℓ) 0.025 <0.5
Total Phosphorus (mg P/ℓ) 0.04 <0.5
Conductivity (mS/m) 23.6 21.4
TDS (mg/ℓ) 177 167
M Alkalinity (mg/ℓ) CaCO₃ 20.1 20
pH 7.52 6.5-7.0
Aluminium (mg/ℓ) 2.270 < 0.1
Iron (mg/ℓ) 2.460 < 0.1
Beaufort West – 2.3 Mℓ/day Direct Potable Reuse Plant (2010) 4.2.2
• Status: Implemented
• Context: The town of Beaufort West shows a significant population growth due to increasing economic activities. The local municipality initiated a project to supply additional Class I potable water as a result of a shortage of drinking water. The proposed solution for this problem was to build a plant for the reclamation of treated sewage to deliver Class I potable water. The reclamation plant is maintained and operated by Water and Wastewater Engineering in a 20 year agreement.
• Process Configuration: Final effluent from WWTW, sand filtration, ultrafiltration (UF), two-stage reverse osmosis (RO), permeate treated by UV light.
• Product water quality: Better than SANS 241:2006 Class 1 (as per original design)
Investigation into the Cost and Operation of Southern African Desalination and Water Re-use Plants Volume II
16
Bellville (City of Cape Town) – 20 Mℓ/day Membrane Bio Reactor (MBR) Potential Reuse 4.2.3
• Status: Under construction
• Context: The City of Cape Town is in the process of upgrading the existing Bellville South WWTW to extend capacity by adding a 20 Mℓ/day MBR module. The objective is to extend the current design capacity of 50 Mℓ/day in three consecutive 20 Mℓ/day phases to an ultimate capacity of 110 Mℓ/day on the available site. MBR technology was chosen for the first 20 Mℓ/day extension phase due to spatial constraints and the potential reuse of high quality treated effluent by nearby industrial users.
• Process Configuration: Inlet works with coarse and fine screens, degritters, rotary sieves (protection of membranes), activated sludge reactor (modified UCT process), separate membrane tank with capillary UF (submerged membranes), sludge dewatering.
George – 10 Mℓ/day Indirect Potable Reuse Plant (2009/10) 4.2.4
• Status: Implemented
• Context: As the largest town on the Garden Route, George also faced water shortages and had decided on an indirect water reuse strategy where final effluent from its Outeniqua WWTW is treated to a very high quality through ultrafiltration and disinfection prior to being returned to the main storage facility, the Garden Route Dam, where it is combined with current raw water supplies. This initiative supplements the existing supply by an additional 10 Mℓ/day, which contributes approximately one third towards the drinking water demand.
• Process Configuration: Final effluent from WWTW, drum screen, ultrafiltration (UF), disinfection by chlorination, transfer to Garden Route Dam. Provision has been made for powdered activated carbon (PAC) addition at George WTW, if required as an additional operational barrier.
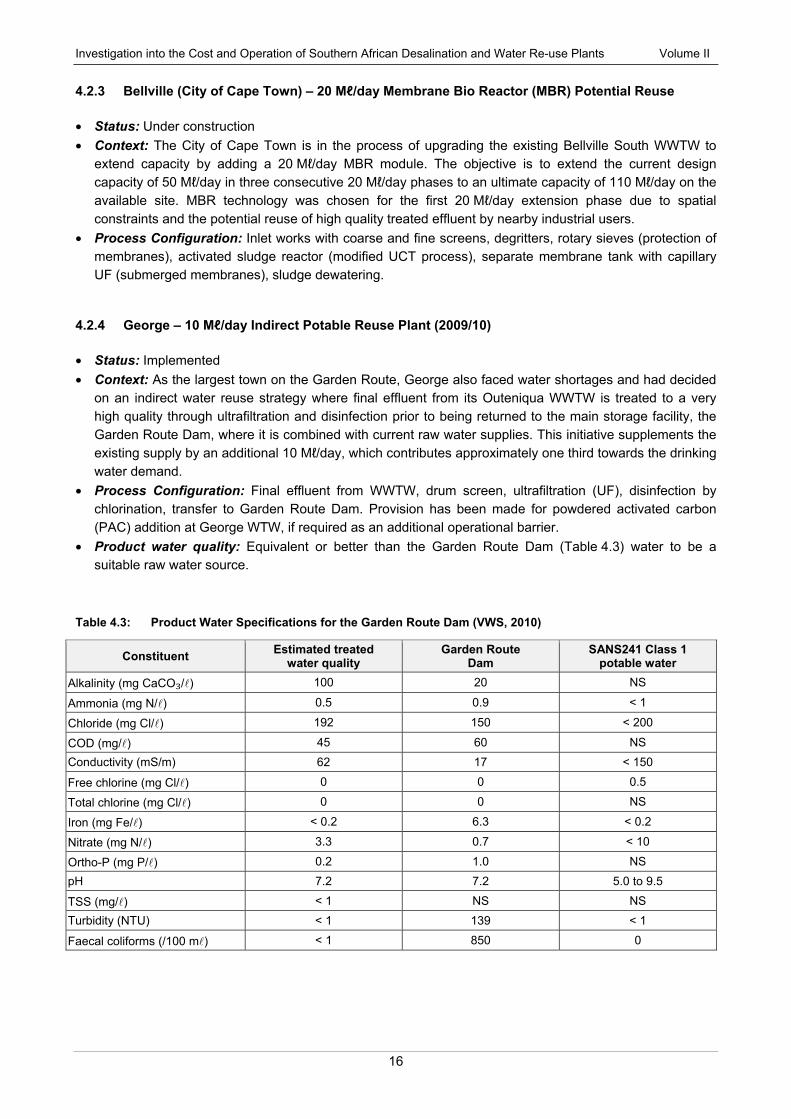
• Product water quality: Equivalent or better than the Garden Route Dam (Table 4.3) water to be a suitable raw water source.
Table 4.3: Product Water Specifications for the Garden Route Dam (VWS, 2010)
Constituent Estimated treated
water quality Garden Route
Dam SANS241 Class 1
potable water
Alkalinity (mg CaCO₃/) 100 20 NS
Ammonia (mg N/) 0.5 0.9 < 1
Chloride (mg Cl/) 192 150 < 200
COD (mg/) 45 60 NS
Conductivity (mS/m) 62 17 < 150
Free chlorine (mg Cl/) 0 0 0.5
Total chlorine (mg Cl/) 0 0 NS
Iron (mg Fe/) < 0.2 6.3 < 0.2
Nitrate (mg N/) 3.3 0.7 < 10
Ortho-P (mg P/) 0.2 1.0 NS
pH 7.2 7.2 5.0 to 9.5
TSS (mg/) < 1 NS NS
Turbidity (NTU) < 1 139 < 1
Faecal coliforms (/100 m) < 1 850 0

Investigation into the Cost and Operation of Southern African Desalination and Water Re-use Plants Volume II
17
Port Elizabeth (NMBM) – 45 Mℓ/day Membrane Bio Reactor (MBR) Industrial Reuse 4.2.5
• Status: Feasibility and Tender
• Context: The NMBM is a major growth point in South Africa, in particular the Coega Industrial Development Zone (IDZ). The growth of industries and subsequent population growth within the municipality creates an increased demand for treated water. NMBM is also currently affected by severe drought conditions, which place tremendous stress on existing surface water resources. NMBM and Royal HaskoningDHV (formerly SSI Engineers and Environmental Consultants) are in the process of upgrading the existing Fishwater Flats Wastewater Treatment Works (WWTW) to a 170 Mℓ/day treatment capacity.
• Planning and design are underway to provide advanced treatment in the form of membrane bioreactors (MBR’s) and reverse osmosis desalination plants to supplement the existing water resources and provide the Coega IDZ and NMBM with sustainable industrial and potable water through indirect effluent reuse. The first phase of the water reuse scheme will produce water at 45 Mℓ/day, which will be suitable for industrial and/or indirect potable reuse with a second phase of similar capacity to follow.
Hermanus – 5 Mℓ/day Direct Potable Reuse Plant (Feasibility Phase) 4.2.6
• Status: Feasibility and Tender
• Context: The Overstrand Municipality is experiencing drought conditions, resulting in a shortage of drinking water to the town of Hermanus. Reclamation of effluent for direct potable reuse was selected to augment the existing surface water supply. The first phase of the project entails the construction of Monitoring and Evaluation (M&E) works to reuse 2.5 Mℓ/day of effluent with civil works for a future increase in capacity to 5 Mℓ/day.
• Process Configuration: Multi-barrier approach, including ultrafiltration pre-treatment, reverse osmosis desalination, as well as advanced oxidation and carbon filtration. The product from the reuse plant will be fed directly into the drinking water reticulation system.
• Product water quality: Better than SANS 241:2006 Class 1 water requirements (as per original design)
Zandvliet (City of Cape Town) – 18 Mℓ/day Membrane Bio Reactor (MBR) (Potential Reuse) 4.2.7
• Status: Inception
• Context: The City of Cape Town is planning the upgrading the existing Zandvliet Wastewater Treatment Works (WWTW) to extend capacity by adding a second 18 Mℓ/day MBR module. The current WWTW configuration comprises the original activated sludge plant (ASP) with a design capacity of 54 Mℓ/day and an existing membrane bioreactor (MBR) module of 18 Mℓ/day design capacity. MBR technology was chosen due to spatial constraints and the possibility of potential reuse of high quality treated effluent.
Potsdam (City of Cape Town) – 30 Mℓ/day Membrane Bio Reactor (MBR) (Potential Reuse) 4.2.8
• Status: Inception
• Context: The City of Cape Town is planning the upgrading of the existing Potsdam Wastewater Treatment Works (WWTW) by means of a proposed extension from the present capacity of 47 Mℓ/day to the ultimate capacity of 100 Mℓ/day in two phases. The initial phase involves the addition of a 30 Mℓ/day MBR module, followed by a future 23 Mℓ/day module. MBR technology was chosen due to spatial constraints and the possibility of potential reuse of high quality treated effluent.
Investigation into the Cost and Operation of Southern African Desalination and Water Re-use Plants Volume II
18
CHAPTER 5: LIFE CYCLE COSTS & OPERATIONAL ASPECTS
INTRODUCTION 5.1
In this chapter, a generic example of an approach to life cycle costing is presented. A detailed analysis of life cycle costs per plant does not form part of the scope of this report.
The assumptions, inputs, model configurations and outputs are detailed further in the sections that follow. These may be applied generally and modified to suit the funding and institutional arrangements surrounding the individual plant.
ASSUMPTIONS 5.2
The following assumptions have been used as a basis for the life cycle model:
Key date assumptions 5.2.1
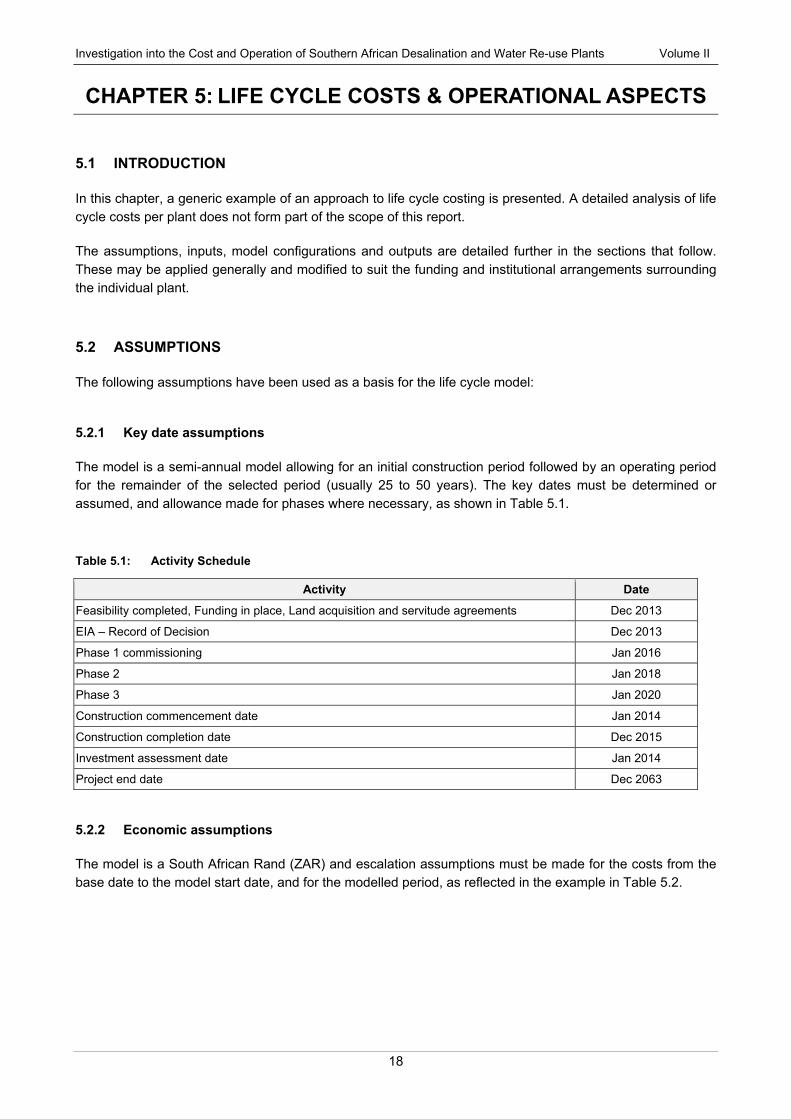
The model is a semi-annual model allowing for an initial construction period followed by an operating period for the remainder of the selected period (usually 25 to 50 years). The key dates must be determined or assumed, and allowance made for phases where necessary, as shown in Table 5.1.
Table 5.1: Activity Schedule
Activity Date
Feasibility completed, Funding in place, Land acquisition and servitude agreements Dec 2013
EIA – Record of Decision Dec 2013
Phase 1 commissioning Jan 2016
Phase 2 Jan 2018
Phase 3 Jan 2020
Construction commencement date Jan 2014
Construction completion date Dec 2015
Investment assessment date Jan 2014
Project end date Dec 2063
Economic assumptions 5.2.2
The model is a South African Rand (ZAR) and escalation assumptions must be made for the costs from the base date to the model start date, and for the modelled period, as reflected in the example in Table 5.2.

Investigation into the Cost and Operation of Southern African Desalination and Water Re-use Plants Volume II
19
Table 5.2: Escalation Assumptions
Input base date Escalation base date – model start date Annual Escalation %
Consumer price inflation (CPI) Dec 2013 5.5% 5.5%
Escalation factors:
Water Tariff Dec 2013 10.0% 5.5%
Salaries Dec 2013 6.5% 6.5%
Electricity Dec 2013 10.0% 6.5%
OPEX Dec 2013 5.5% 5.5%
CAPEX Dec 2013 6.0% 5.5%
Product Water Tariffs 5.2.3
The selling rate of the product must be agreed or assumed as at the base date, as well as actual base costs of construction and operation & maintenance at the time of implementation. Grant funding availability, and the involvement of private equity or debt in the project, may also be included in determining rates for a sustainable and affordable project.
FEEDWATER SUPPLY, INSTALLED CAPACITY AND DEMAND 5.3
The cost of feedwater can vary according to source, quality and on agreements with other parties. If required, agreements with other parties to deliver the required volume of feedwater at the specified quality must be concluded (mainly in the case of water reuse). A schedule of the capacity installed and off-take quantities respectively must be in place or assumed, as shown in Table 5.3 and Table 5.4.
Table 5.3: WWTW Outflows
Feedwater Supply (e.g. WWTW) Incremental Capacity (Mℓ/d) Cumulative Capacity (Mℓ/d) Completion date
WWTW outflows 5.0 5.0 Existing
WWTW outflows 5.0 10.0 01-Jan-18
Table 5.4: Off-take Assumptions
Off take Assumptions Commencement date Incremental Off-take (Mℓ/d) Cumulative Off-take (Mℓ/d)
Phase 1 01-Jan-16 2.5 2.5
Phase 2 01-Jan-18 2.5 5.0
Phase 3 01-Jan-20 2.5 7.5
CAPITAL AND MAINTENANCE EXPENDITURE 5.4
The capital expenditure for desalination and water reuse projects must cover the entire scheme from the actual plant to the point of distribution. The funding and financial model must therefore cover the full construction cost and O&M cost for the scheme, and the contributions of the participating parties must be agreed or assumed (contributions can be in the form infrastructure, operating staff, or materials, etc.).
The capital expenditure and major maintenance assumptions, as at the input base date, are escalated in the model to the time of being incurred. Similarly the operating and routine maintenance cost is taken at the
Investigation into the Cost and Operation of Southern African Desalination and Water Re-use Plants Volume II
20
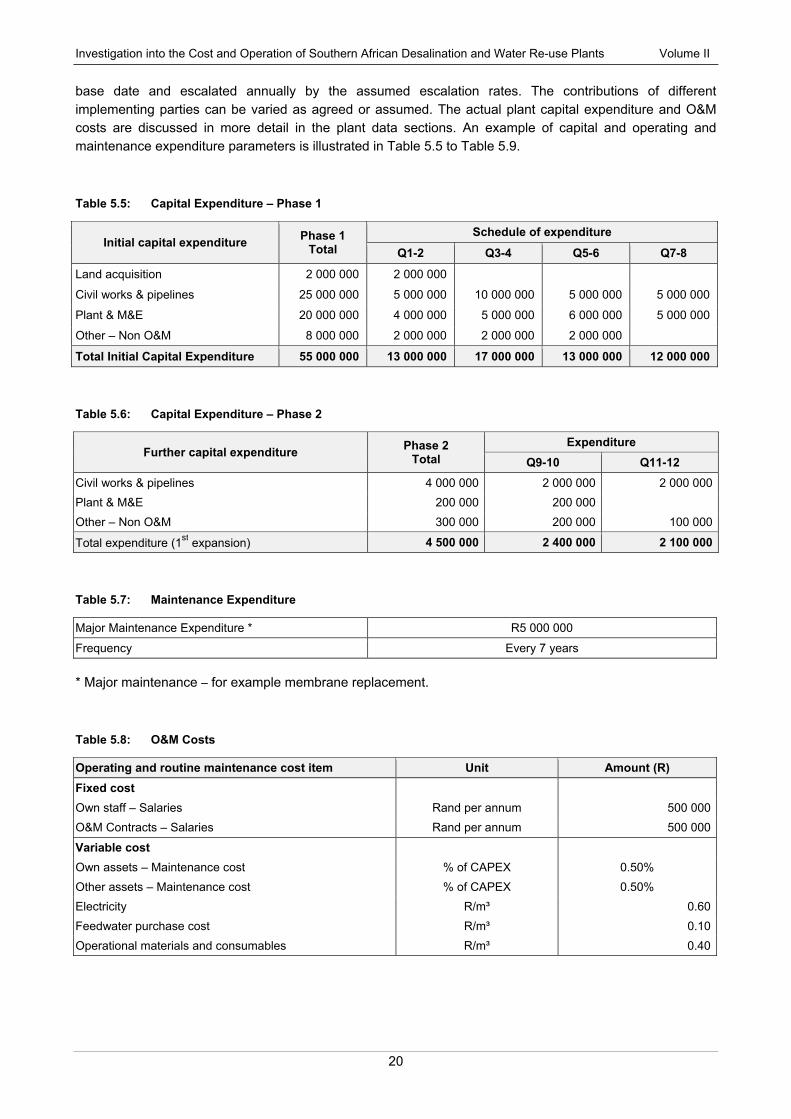
base date and escalated annually by the assumed escalation rates. The contributions of different implementing parties can be varied as agreed or assumed. The actual plant capital expenditure and O&M costs are discussed in more detail in the plant data sections. An example of capital and operating and maintenance expenditure parameters is illustrated in Table 5.5 to Table 5.9.
Table 5.5: Capital Expenditure – Phase 1
Initial capital expenditure Phase 1
Total
Schedule of expenditure
Q1-2 Q3-4 Q5-6 Q7-8
Land acquisition 2 000 000 2 000 000
Civil works & pipelines 25 000 000 5 000 000 10 000 000 5 000 000 5 000 000
Plant & M&E 20 000 000 4 000 000 5 000 000 6 000 000 5 000 000
Other – Non O&M 8 000 000 2 000 000 2 000 000 2 000 000
Total Initial Capital Expenditure 55 000 000 13 000 000 17 000 000 13 000 000 12 000 000
Table 5.6: Capital Expenditure – Phase 2
Further capital expenditure Phase 2
Total
Expenditure
Q9-10 Q11-12
Civil works & pipelines 4 000 000 2 000 000 2 000 000
Plant & M&E 200 000 200 000
Other – Non O&M 300 000 200 000 100 000
Total expenditure (1st expansion) 4 500 000 2 400 000 2 100 000
Table 5.7: Maintenance Expenditure
Major Maintenance Expenditure * R5 000 000
Frequency Every 7 years
* Major maintenance – for example membrane replacement.
Table 5.8: O&M Costs
Operating and routine maintenance cost item Unit Amount (R)
Fixed cost
Own staff – Salaries Rand per annum 500 000
O&M Contracts – Salaries Rand per annum 500 000
Variable cost
Own assets – Maintenance cost % of CAPEX 0.50%
Other assets – Maintenance cost % of CAPEX 0.50%
Electricity R/m³ 0.60
Feedwater purchase cost R/m³ 0.10
Operational materials and consumables R/m³ 0.40
Investigation into the Cost and Operation of Southern African Desalination and Water Re-use Plants Volume II
21
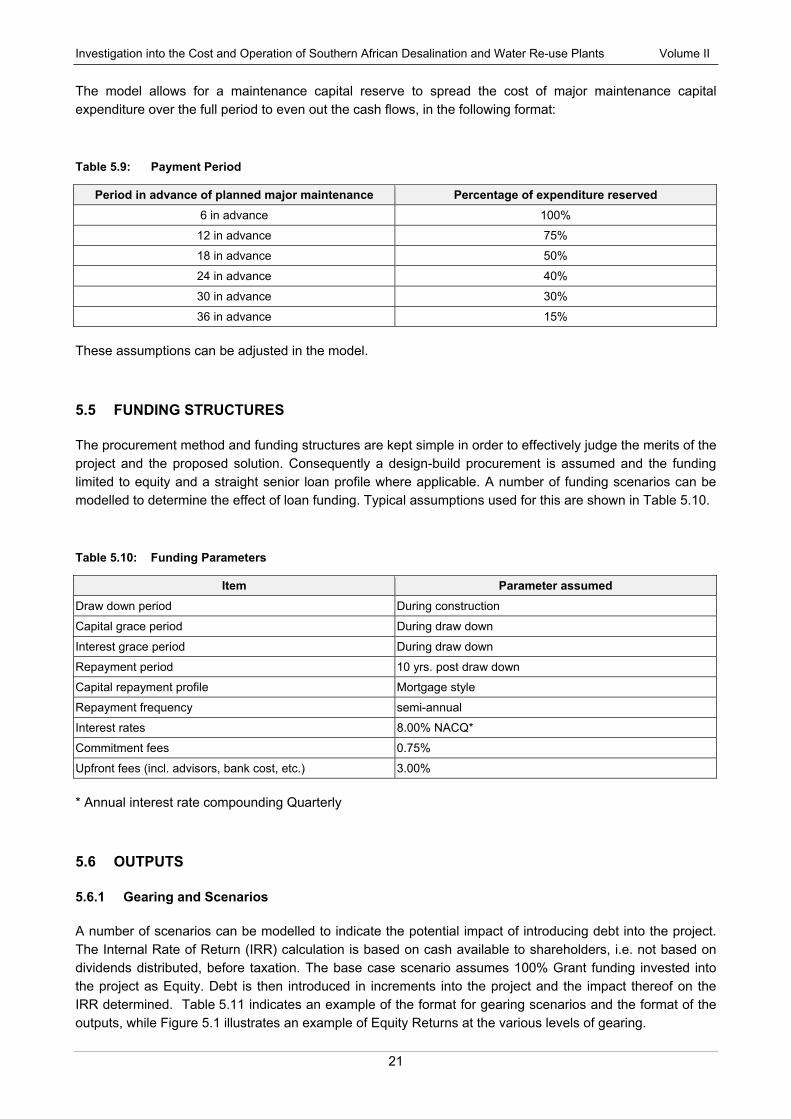
The model allows for a maintenance capital reserve to spread the cost of major maintenance capital expenditure over the full period to even out the cash flows, in the following format:
Table 5.9: Payment Period
Period in advance of planned major maintenance Percentage of expenditure reserved
6 in advance 100%
12 in advance 75%
18 in advance 50%
24 in advance 40%
30 in advance 30%
36 in advance 15%
These assumptions can be adjusted in the model.
FUNDING STRUCTURES 5.5
The procurement method and funding structures are kept simple in order to effectively judge the merits of the project and the proposed solution. Consequently a design-build procurement is assumed and the funding limited to equity and a straight senior loan profile where applicable. A number of funding scenarios can be modelled to determine the effect of loan funding. Typical assumptions used for this are shown in Table 5.10.
Table 5.10: Funding Parameters
Item Parameter assumed
Draw down period During construction
Capital grace period During draw down
Interest grace period During draw down
Repayment period 10 yrs. post draw down
Capital repayment profile Mortgage style
Repayment frequency semi-annual
Interest rates 8.00% NACQ*
Commitment fees 0.75%
Upfront fees (incl. advisors, bank cost, etc.) 3.00%
* Annual interest rate compounding Quarterly
OUTPUTS 5.6
Gearing and Scenarios 5.6.1
A number of scenarios can be modelled to indicate the potential impact of introducing debt into the project. The Internal Rate of Return (IRR) calculation is based on cash available to shareholders, i.e. not based on dividends distributed, before taxation. The base case scenario assumes 100% Grant funding invested into the project as Equity. Debt is then introduced in increments into the project and the impact thereof on the IRR determined. Table 5.11 indicates an example of the format for gearing scenarios and the format of the outputs, while Figure 5.1 illustrates an example of Equity Returns at the various levels of gearing.

Investigation into the Cost and Operation of Southern African Desalination and Water Re-use Plants Volume II
22
Table 5.11: Scenario Planning
Scenario 100% Equity
90%Equity
80%Equity
70%Equity
60% Equity
50% Equity
40.0%Equity
Equity Example format: No Data
Debt
Total funding
Equity %
Debt %
Equity return
Nominal
Real
NPV
Minimum cash balance
First semester positive cash balance
Operating cash > Interest at all times?
Application of funds (Nominal)
Construction cost
Land ownership cost
Interest capitalised
Other funding cost capitalised
Total project cost
Figure 5.1: Example of equity returns
This can be used to evaluate the project viability by checking that the cash flows can cover the interest payable in every period. The Net Present Value (NPV) is used illustrate how the cash generated to the benefit of the equity providers, changes in current day terms due to the time value of money.
The net cash generated by a project can be significant and at high levels of equity/grant funding, substantial cash benefit can be generated and utilized.

Investigation into the Cost and Operation of Southern African Desalination and Water Re-use Plants Volume II
23
An example of net cash available during, say, a 50-year life cycle of a project is indicated in Figure 5.2 (with the deductions being due to equipment replacement and operation and maintenance capital expenditure events required during the project life).
Figure 5.2: 50-year project lifecycle
The impact of delays in the availability of feedwater, or in the demand for product water, can be modelled, as well as the effect of phasing the capital expenditure to suit these factors. Results at certain gearings can be compared for different scenarios.
Table 5.12: Lifecycle Planning
Scenario A (Phase 2 delayed by 2 years) 100% Equity 50% Equity
Equity Example format: No Data
Debt
Total funding
Equity %
Debt %
Equity return
Nominal
Real
NPV
Minimum cash balance
First semester positive cash balance
Operating cash > Interest
Application of funds (Nominal)
Construction cost
Land ownership cost
Interest capitalised
Other funding cost capitalised
Total project cost

Investigation into the Cost and Operation of Southern African Desalination and Water Re-use Plants Volume II
24
Financial results 5.6.2
The sensitivity of critical factors to the success of the project can be determined, and these factors require careful consideration and agreements between parties to limit financial risk:
• Feedwater availability schedule (reuse) and cost
• Product water tariff (selling rate)
• Demand for product water
• O&M costs (including the price of electricity)
The financial effects of these factors and the various funding and implementation scenarios can be compared using the model. Furthermore, the effect of moth-balling or running plants at reduced capacities (to meet short term peaks in demand or supplementing supplies during drought periods) can also be modelled.
OPERATION AND MAINTENANCE ASPECTS 5.7
This section, which follows, provides summaries of the operational and maintenance data gathered from the desalination plants under investigation. This includes relevant discussion on the cost and operational aspects associated with the respective seawater desalination and water reuse plants selected in this study. The raw data for each plant can be found in Appendix C as part of the database and its outputs.
Factors influencing the operation and maintenance costs associated with desalination and water reuse plants include but not limited to:
• Electricity costs;
• Staffing costs (including operational, maintenance, admin support staff);
• Maintenance costs (including equipment spares, shut-downs, etc.);
• Consumables (such as chemicals, filter media, membranes);
• Laboratory analysis (including third party laboratory analyses);
• Reporting and compliance (including plant audits, site monitoring, environmental, OHS compliance);
• Capital redemption (dealt with under financial costs);
The factors above are greatly influenced by the type of unit processes employed in the treatment process. The selection of the pre-treatment processes and distribution works has a significant impact on the associated capital and operating costs. Figure 5.3 provides a typical distribution of plant operating and maintenance costs of seawater desalination plants in Southern Africa (Els, 2013). As can be seen, electrical energy costs account for the major portion (more than 50%) of the total O&M costs.

Investigation into the Cost and Operation of Southern African Desalination and Water Re-use Plants Volume II
25
Figure 5.3: Distribution of the total O&M costs related to SWRO plants operating in South Africa
Energy consumption is the major contributor in the process selection of treatment plants. Typically, seawater RO plants consume in the region 3.5 to 4.5 kWh/m³ of treated water. In comparison, conventional physical-chemical processes associated with reuse plants, like NGWRP, use less than 1 kWh/m³ of treated water, and reuse plants relying more on membrane processes (e.g. UF and RO) use from 1 to 2 kWh/m³ of treated water.
Electricity 5.7.1
In seawater desalination particularly, electricity is the major component of the operational cost (typically in excess of 50% of the total O&M costs). Therefore it is prudent to examine the cost of electricity and the prevailing tariff structure of the bulk electricity supplier.
The electrical energy requirement can be further broken down into the various unit processes, namely: intake, pre-treatment, RO and post treatment unit operations, as shown in Figure 5.4 (Els, 2013). It can be seen that approximately 65% of the electrical energy requirement is for the high pressure RO pumps.
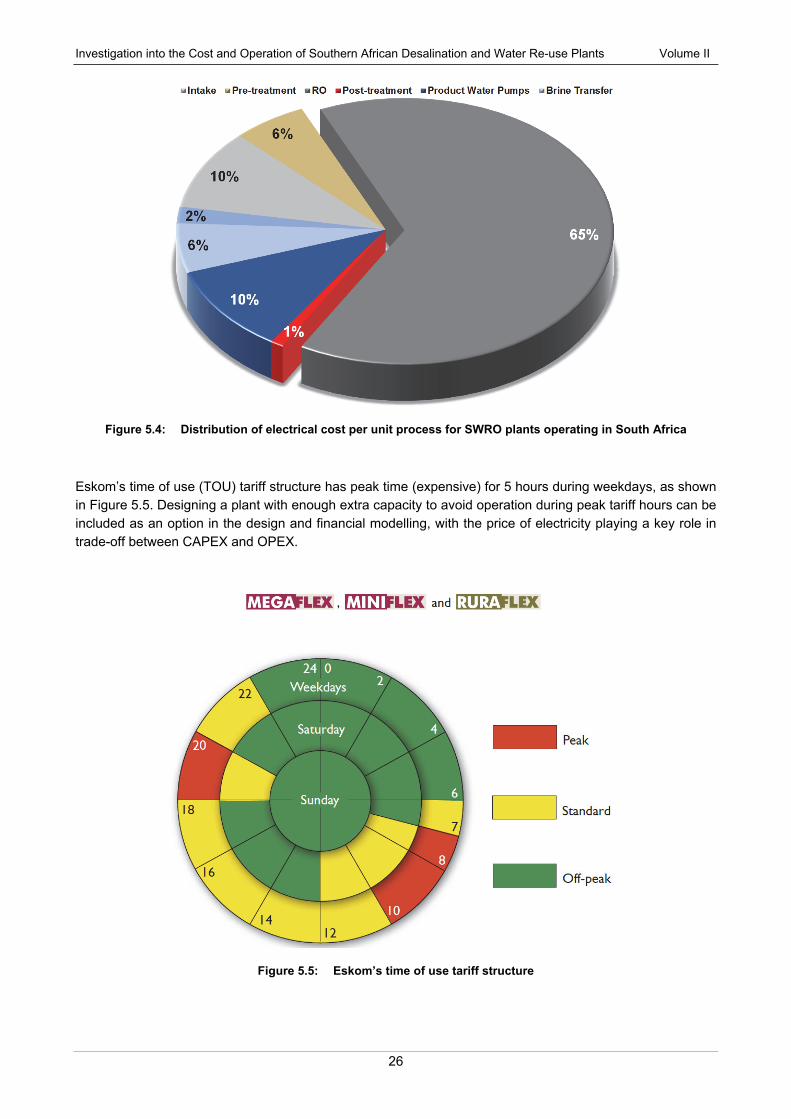
Investigation into the Cost and Operation of Southern African Desalination and Water Re-use Plants Volume II
26
Figure 5.4: Distribution of electrical cost per unit process for SWRO plants operating in South Africa
Eskom’s time of use (TOU) tariff structure has peak time (expensive) for 5 hours during weekdays, as shown in Figure 5.5. Designing a plant with enough extra capacity to avoid operation during peak tariff hours can be included as an option in the design and financial modelling, with the price of electricity playing a key role in trade-off between CAPEX and OPEX.
Figure 5.5: Eskom’s time of use tariff structure
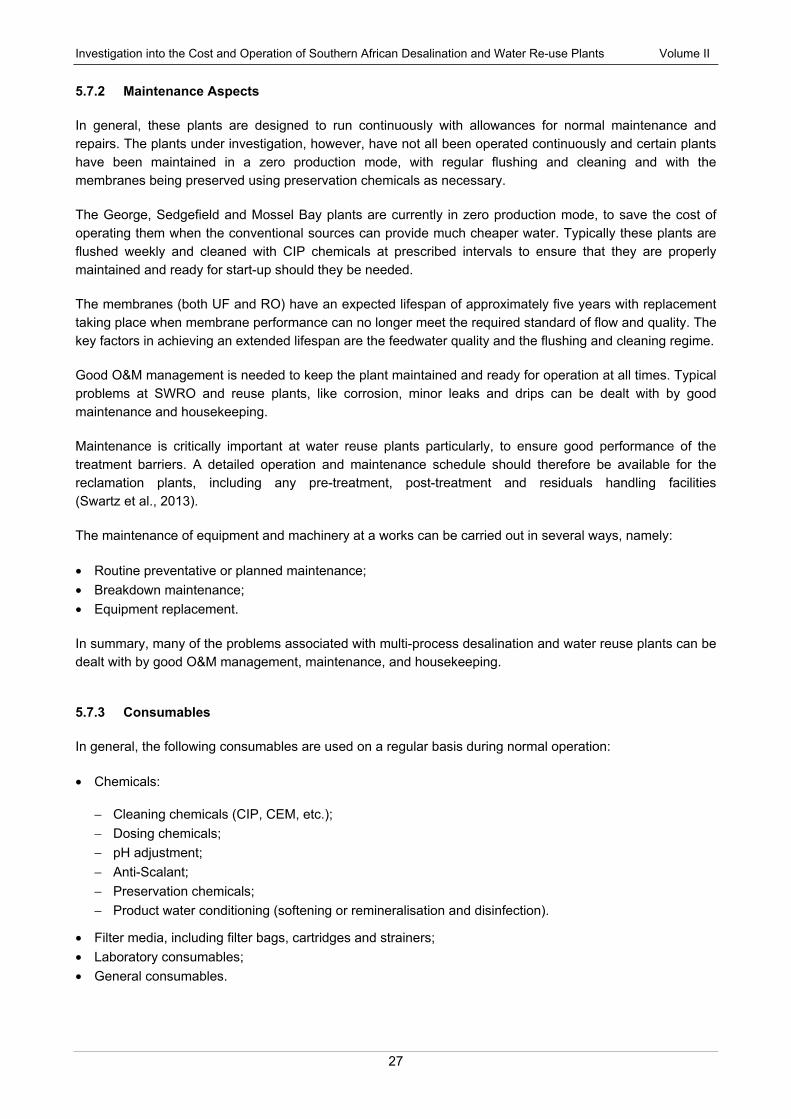
Investigation into the Cost and Operation of Southern African Desalination and Water Re-use Plants Volume II
27
Maintenance Aspects 5.7.2
In general, these plants are designed to run continuously with allowances for normal maintenance and repairs. The plants under investigation, however, have not all been operated continuously and certain plants have been maintained in a zero production mode, with regular flushing and cleaning and with the membranes being preserved using preservation chemicals as necessary.
The George, Sedgefield and Mossel Bay plants are currently in zero production mode, to save the cost of operating them when the conventional sources can provide much cheaper water. Typically these plants are flushed weekly and cleaned with CIP chemicals at prescribed intervals to ensure that they are properly maintained and ready for start-up should they be needed.
The membranes (both UF and RO) have an expected lifespan of approximately five years with replacement taking place when membrane performance can no longer meet the required standard of flow and quality. The key factors in achieving an extended lifespan are the feedwater quality and the flushing and cleaning regime.
Good O&M management is needed to keep the plant maintained and ready for operation at all times. Typical problems at SWRO and reuse plants, like corrosion, minor leaks and drips can be dealt with by good maintenance and housekeeping.
Maintenance is critically important at water reuse plants particularly, to ensure good performance of the treatment barriers. A detailed operation and maintenance schedule should therefore be available for the reclamation plants, including any pre-treatment, post-treatment and residuals handling facilities (Swartz et al., 2013).
The maintenance of equipment and machinery at a works can be carried out in several ways, namely:
• Routine preventative or planned maintenance;
• Breakdown maintenance;
• Equipment replacement.
In summary, many of the problems associated with multi-process desalination and water reuse plants can be dealt with by good O&M management, maintenance, and housekeeping.
Consumables 5.7.3
In general, the following consumables are used on a regular basis during normal operation:
• Chemicals:
− Cleaning chemicals (CIP, CEM, etc.);
− Dosing chemicals;
− pH adjustment;
− Anti-Scalant;
− Preservation chemicals;
− Product water conditioning (softening or remineralisation and disinfection).
• Filter media, including filter bags, cartridges and strainers;
• Laboratory consumables;
• General consumables.

Investigation into the Cost and Operation of Southern African Desalination and Water Re-use Plants Volume II
28
Laboratory Analyses 5.7.4
The general trend among the plants is to use inline measurements, confirmed by on-site lab analysis. Samples are also sent to external 3rd party for confirmation of results. Monitoring of water quality is critical to verify the correct and safe operation of desalination and water reuse plants.
Zero production mode costs 5.7.5
Even when the plant is not operational, there are associated costs with maintaining these plants. Typically the zero production mode costs include:
• Staff/labour costs;
• Electricity (minimum required for cleaning and flushing, lighting, maintenance, etc.);
• Chemicals: cleaning and flushing, preservation, etc.,
• Consumables;
• Maintenance;
• SHEQ (Safety, Health, Environmental and Quality).
Investigation into the Cost and Operation of Southern African Desalination and Water Re-use Plants Volume II
29
CHAPTER 6: FUTURE OF DESALINATION & WATER REUSE IN SOUTH AFRICA
The preliminary overview and illustrative examples of projects outlined above indicate that membrane separation technology has a substantial track record in South Africa. Similarly the application of membrane technology in the fields of desalination and reuse has become more widespread.
Comments made by major local water treatment companies in a recent panel discussion indicate that the membrane separation market has seen dramatic growth with UF and RO having the largest growth potential (Lipsett, 2012). The desalination of seawater in coastal areas and water reuse in general are perceived as the main application areas due to increasing demands being placed on water supplies as a result of population growth and industrialisation.
The real value of water is often underestimated and only apparent when there is a risk of running out of supply or a demonstrated commercial benefit. This is illustrated by projects such as the seawater desalination plant in Mossel Bay (W&S, 2011) and water reuse initiative of Durban Water Recycling (Besseling, 2011).
Investigation into the Cost and Operation of Southern African Desalination and Water Re-use Plants Volume II
30
REFERENCES
AVENG WATER (2012) Leaders in Water Treatment. Water and Sanitation Africa, Volume 7 No. 1, p 16-17.
BESSELING (2011) Celebrating a decade of achievement. Water & Sanitation Africa Volume 6 No. 6, p 4-5.
DEPARTMENT OF WATER AFFAIRS, Directorate National Water Resource Planning (2011) National Desalination Strategy, Final.
DEPARTMENT OF WATER AFFAIRS (2013) National Water Resource Strategy, 2nd Edition
ELS T (2013) How energy hungry are reuse and desalination plants in Southern Africa? Veolia Water paper presented at the International Water Association water reuse conference, Windhoek.
ENGINEERING NEWS (2002) Plant to Recover Millions of Litres of Water. Edited by Marius Roodt.
ESKOM (2014) Tariffs and Charges. (www.eskom.co.za)
LIPSETT C (2012) Membrane Technology Advancements. Water and Sanitation Africa, Volume 7 No. 1, p 31-39.
MARAIS P and VON DÜRCKHEIM F (2012) Beaufort West Water Reclamation Plant. Water and Sanitation Africa, Volume 7 No. 1, p 20-25.
SCHUTTE CF, SPENCER T, ASPDEN, JD and HANEKOM D (1987) Desalination and reuse of power plant effluent: From pilot plant to full scale operation. Desalination Volume 67, p 255-269.
SWARTZ CD, GENTHE B, MENGE J, COOMANS CJ AND OFFRINGA G (2013) Guidelines for monitoring, management and communication of water quality in the direct reclamation of municipal wastewater for drinking purposes. WRC Project No. K5/2212

Investigation into the Cost and Operation of Southern African Desalination and Water Re-use Plants Volume II
31
APPENDIX A: PUBLIC PRIVATE PARTNERSHIPS
The majority of the water opportunities for the private sector in South Africa require partnership with national, provincial or local government institutions. As such, the legislation and regulations applicable when transacting with such institutions must be taken into account when evaluating investment opportunities. South Africa has established a firm regulatory framework that enables municipal, provincial and national government institutions to enter into PPP agreements. For municipal institutions these are governed by the Municipal Systems Act (2000) and the Municipal Finance Management Act (2003), while the central legislation governing PPPs for provincial and national institutions is Regulation 16, issued in terms of the Public Finance Management Act (1999). The definition of a PPP is consistent across all three spheres of government. A PPP is defined as commercial transaction between a government institution and a private party in terms of which the private party (Municipal Finance Management Act 2003, Municipal Public Private Partnership Regulations, Schedule 1 and Public Finance Management Act (1999), Treasury Regulations for departments, trading entities, constitutional institutions and public entities, Part 6, Regulation 16.1):
• performs a government institutional function on behalf of the institution; and / or
• acquires the use of state property for its own commercial purposes; and
• assumes substantial financial, technical and operational risks in the transaction; and
• receives a benefit for performing the government institutional function or from utilizing the state property, either by way of: - being paid by the revenues from government institution; or - charges or fees to be collected by the private party from users or customers of a service provided; or - A combination of the revenues and such charges or fees.
An institution is defined as a department, constitutional institution, or a public entity listed in Schedule 3 of the PFMA which includes all the regional water utilities and authorities. In terms of the Constitution, the following aspects of water and sanitation services are a municipal service:
• Potable water supply systems – the procurement of raw water (from surface and underground resources), water treatment and purification to potable standards, the purchase of potable water, distribution, storage, reticulation and delivery to the supply point for both domestic and non-domestic use.
• Domestic sewage treatment and disposal systems – the collection of sewage from domestic users, the delivery of the sewage to treatment facilities and the treatment of such sewage to acceptable standards for disposal into natural water courses. (The same system may deal with commercially or industrially generated sewage, subject to certain controls on the standard of the effluent).
Examples of the municipal support activities of a WSA in terms of water and sanitation services include:
• Supply systems for industrial (non-potable) water
• Industrial wastewater and disposal systems
• Disposal of sludge from sewage treatment facilities
• Scientific services
• Meter reading, billing and revenue management.
The legislation relevant to PPPs refers to the provision of the service which may involve the use of consultants, contractors and specialist suppliers for the planning, design, finance, construction and maintenance of facilities. PPP legislation would not apply to a service where the WSA retains management and financial control of the work, and where a significant level of risk remains with the WSA. All PPP activities must be undertaken within the context of an adopted supply chain management policy and, if the envisaged PPP involves a multi-year agreement, the provisions of section 33 of the MFMA apply for local government.

Investigation into the Cost and Operation of Southern African Desalination and Water Re-use Plants Volume II
32
The way a PPP is defined in the regulations makes it clear that a PPP is not a simple outsourcing of functions where substantial financial, technical and operational risk is retained by the government institution. A PPP is also neither the privatization or divestiture of municipal assets and/or liabilities nor the commercialization of a municipal function by the creation of a municipal entity.
The PPP Regulations are not prescriptive about the financing structure of a PPP. It is assumed that these will vary widely from project to project and sector to sector, and will be closely linked to the funding sources that can be secured for each deal. However, in most PPPs the private party raises both debt and equity to capitalize the project. In smaller municipal PPPs, the private sector often obtains any required funding through corporate financing.
The PPP Regulations provide precise and detailed instructions for PPPs. The regulations define the elements of a PPP, and set out the stages and approvals it will have to go through. The PPP project cycle illustrates the various phases of the regulations and applicable portions of the legislation in Table A1. The various phases and regulations and legislation are applicable to the provision of particular water service functions.
Table A1: PPP Project Cycle (RHDHV and E&Y, 2012)
Reflecting the Municipal Financing Management Act (Act 56 of 2003 Municipal Public Private Partnership Regulations), Public Finance Management Act (Act 1 of 1999, amended by Act 29 of 1999) and Municipal Systems Act (Act 32 of 2000)
Pro
ject
Pre
par
ati
on
Per
iod
INCEPTION (Section 2, MFMA PPP Regulations and Regulation 16.3 PFMA) • Identify project • Notify government (National Treasury, DPLG) and determine scope of feasibility study and applicable process • Appoint project officer • Appoint advisor
FEASIBILITY STUDY (Section 120(4) MFMA and Regulation 16.4 PFMA) • Notify/consult stakeholders • Needs analysis • Technical options analysis • Service delivery analysis • Delivery mechanism summary and interim internal/external recommendation • Project due diligence • Value assessment • Procurement plan • Give public, Treasury, DPLG 30 days to comment
• Decision whether to procure external option
PROCUREMENT (Section 4, MFMA PPP Regulations and Regulation 16.5-16.6 PFMA) • Prepare bid documents including draft PPP agreement as per MFMA Chapter 11
• Pre-quality parties • Issue request for proposal with draft PPP agreement • Receive bids • Compare bids with feasibility study and each other • Select preferred bidder • Prepare value assessment report
• Negotiate with the preferred bidder • Finalise PPP contract management plan • Prior to signing of contract, give public, Treasury, DPLG 30 days to comment
• Authorisation for execution of PPP contract • Accounting officer signs PPP agreement
Pro
ject
T
erm
PPP CONTRACT MANAGEMENT (Regulation 16.7 PFMA) • Accounting officer responsible for PPP contract Management • Measure outputs, monitor and regulate performance, liaise effectively, and settle disputes
Source: Municipal Service Delivery and PPP Guidelines
Treasury Approval I
Treasury Approval IIA
Treasury Approval IIB
Treasury Approval III

Investigation into the Cost and Operation of Southern African Desalination and Water Re-use Plants Volume II
33
The PPP project cycle enables the three regulatory tests of affordability, value for money and risk transfer to be applied at every stage of preparing for, procuring and managing a PPP agreement. The regulations require that the government institutions apply these tests throughout, and they solicit the views and recommendations of the National Treasury and the relevant provincial treasury before they publicly invite bids and prior to the execution of any PPP agreement. Both the MFMA and the Municipal PPP Regulations require the solicitation of views and recommendations of the community and other government entities prior to the execution of any PPP agreement.
Project Inception 1
Section 76 of the MSA states that a municipality may provide a municipal service through an internal or external mechanism.
An external mechanism includes a municipal entity, another municipality, an organ of state, a community-based organization or other non-governmental organization (NGO), or “any other institution, entity or person legally competent to operate a business activity”, which includes a PPP. It goes on to describe the point at which a municipality must review and decide on a mechanism to provide a municipal service in section 77. These occasions include when an existing municipal service is to be significantly upgraded, extended or improved; when the municipality is restructured or reorganized in terms of the Municipal Structures Act (1998); when review is required by a provincial or national intervention; when a new activity is to be undertaken; when requested by the local community; when a review of the integrated development plan requires a review of the delivery mechanism; or when a performance evaluation requires a review of the mechanism.
The municipality must first assess the provision of that activity through an internal mechanism, after which it may decide to explore the delivery of that activity by an external mechanism. If the municipality decides to explore service provision by an external mechanism, it must then conduct a feasibility study.
When considering water and sanitation services, it is necessary that the relevant water institution first decide if the full water services are under consideration or only certain elements. This means assessing whether the investigation is going to:
• Cover both potable water and wastewater treatment
• Deal only with selected aspects, such as extending water services to a specific geographic area or assessing the development of a new potable or wastewater treatment plant only
• Deal with discrete parts of the overall function such as cost recovery, unaccounted for water or the provision of water services laboratory services.
As soon as a government institution begins a project that may be a PPP, the accounting officer must appoint a project officer, a person with appropriate skills and experience, either from within or outside the institution. In terms of section 120(4) of the MFMA and Regulation 16.3 the accounting officer must register the PPP with the relevant treasury together with information on the expertise within the government institution to comply with that section of the act and regulations. If requested to do so by the National Treasury or the relevant provincial treasury, the accounting office may be required to appoint a person with appropriate skills and experience, either from within or outside the municipality, as a transaction adviser to assist and advise the municipality on the preparation and procurement of the PPP agreement.
Investigation into the Cost and Operation of Southern African Desalination and Water Re-use Plants Volume II
34
Feasibility Study 2
If a government institution decides to explore service provision by an external mechanism, such as a PPP, it must conduct a feasibility study to determine whether it is in the best interests of the institution.
The feasibility study undertaken must
• Explain the strategic and operational benefits of the proposed PPP for the institution in terms of its strategic objectives and government policy;
• Describe in specific terms:
• In the case of a PPP involving the performance of an institutional function, the nature of the institutional function concerned and the extent to which this institutional function, both legally and by nature, may be performed by a private party; and
• In the case of a PPP involving the use of state property, a description of the state property concerned, the uses, if any, to which such state property has been subject prior to the registration of the proposed PPP and a description of the types of use that a private party may legally subject such state property to;
• Demonstrate the affordability of the PPP for the institution in relation to a PPP if it will be required to incur any financial commitments,;
• Set out the proposed allocation of financial, technical and operational risks between the institution and the private party;
• Demonstrate the anticipated value for money to be achieved by the PPP; and
• Explain the capacity of the institution to procure, implement, manage, enforce, monitor and report on the PPP.
[Municipal Finance Management Act 2003, Section 120(4) and Public Finance Management Act (1999), Treasury Regulations for departments, trading entities, constitutional institutions and public entities, Part 6, Regulation 16.4]:
• When the feasibility study is completed the institution must get prior written approval from the relevant treasury in order to proceed to the procurement phase, this is known as Treasury Approval I. Section 120 (6)(iii) of the MFMA requires the institution to also solicit the views of the DWS if the PPP involves the provision of water and sanitation services.
Procurement 3
Prior to the issuing of any procurement documentation for a PPP to any prospective bidders, the institution must obtain approval from the relevant treasury for the procurement documentation, including the draft PPP agreement which is referred to as Treasury Approval IIA.
Once Treasury Approval IIA has been received the procurement of a PPP must be undertaken. This must be in terms of a supply chain management policy that is fair, equitable, transparent, competitive and cost-effective (e.g. Section 4 of the Municipal PPP regulations and 16.5 of the PFMA Regulations). The procurement of the PPP must also be in line with broader government black economic empowerment (BEE) policy and must therefore include a preference for the protection or advancement of persons, or categories of persons, disadvantaged by unfair discrimination in compliance with relevant legislation at all stages of PPPs.
Where the value of the proposed PPP agreement exceeds R200 000 or the proposed agreement is for greater than one year, competitive bidding is required. After the evaluation of the competitive bids, but prior to appointing the preferred bidder, the institution must submit a report for approval by the relevant treasury. The regulations require the report to demonstrate how the criteria of affordability, value for money and
Investigation into the Cost and Operation of Southern African Desalination and Water Re-use Plants Volume II
35
substantial technical, operational and financial risk transfer were applied in the evaluation of the bids and how these criteria were satisfied in the preferred bid. This treasury approval is referred to as Treasury Approval IIB in the regulations.
Contracting PPP agreements 4
After the procurement procedure has been concluded but before the government institution concludes a PPP agreement further approval from the relevant treasury is required to ensure that the PPP agreement meets the requirements of affordability, value for money and substantial technical, operational and financial risk transfer as approved in terms of the regulations. Approval is also required of the preferred bidder’s capacity to comply with the obligations of the agreement as well as the government institution’s plan for the effective management of the agreement after its conclusion. This is referred to as Treasury Approval III in the regulations.
Management of PPP agreements 5
Under the various regulations the accounting officer of the government institution that is party to a PPP agreement is responsible for ensuring that the PPP agreement is properly implemented, managed, enforced, monitored and reported on, and must maintain such mechanisms and procedures as approved in Treasury Approval III. The accounting officer is thus made responsible for monitoring the implementation and performance of the PPP agreement.
Whatever the PPP type, structure, payment mechanism, or sources of funding, all PPPs governed by the various municipal, provincial and national government Regulations are subjected to three strict tests:
• Can the government institution afford the deal?
• Is it a value-for-money solution?
• Is substantial technical, operational and financial risk transferred to the private party?
All the Treasury approvals are required in terms of the regulations in order for the PPP agreements to be binding on the state. The National Treasury or relevant treasury may, on good grounds, approve a departure from a Treasury Regulation or from any condition imposed in terms of the acts.
The PPP Regulations do not mention unsolicited bids. Section 113 of the MFMA, provides that a municipality is not obliged to consider an unsolicited bid received outside its normal bidding process. If, however, a municipality decides to consider an unsolicited bid, it may do so only within a prescribed framework. This framework must strictly regulate and limit the power of municipalities to approve unsolicited bids. The Municipal Supply Chain Management Regulations sets out a detailed set of requirements for a municipal unsolicited bid consideration framework.


![X03[1].StrategicManagement.capstone.group6 v1](https://img.pdfslide.net/doc/110x75/577d2f5d1a28ab4e1eb181ab/x031strategicmanagementcapstonegroup6-v1.jpg)