Embed Size (px)
Citation preview
RESULTS OF A TEST WELL IN THE
NANAFALIA FORMATION NEAR MELVIN,
CHOCTAW COUNTY, ALABAMA
By M. E. Davis, A. K. Sparkes, and B. S. Peacock
U.S. GEOLOGICAL SURVEY
Water-Resources Investigations Report 82-4108
1983
UNITED STATES DEPARTMENT OF THE INTERIOR
JAMES G. WATT, Secretary
GEOLOGICAL SURVEY
Dallas L. Peck, Director
For additional information write to:
District Chief U.S. Geological Survey 520 19th Avenue Tuscaloosa, Alabama 35401
Copies of this report can be purchased from:
Open-file Services Section Western Distribution Branch U.S. Geological Survey Box 25425, Federal Center Denver, Colorado 80225 (Telephone: (303) 234-5888)
CONTENTS
Page
Abstract .............................................................. 1Introduction .......................................................... 1
Purpose and scope ................................................. 3Acknowledgments ................................................... 3
Well construction ..................................................... 3Drilling and casing procedures .................................... 3Wel1 development .................................................. 4
Hydrogeologic data .................................................... 4Drill cuttings .................................................... 4Geophysical logs .................................................. 13Aquifer test ...................................................... 13Chemical analyses of water ........................................ 13
Selected references ................................................... 17
ILLUSTRATIONS
Figure 1. Map showing location of well CHO-1 and potentiometriesurface of water in the Nanafalia Formation ............... 2
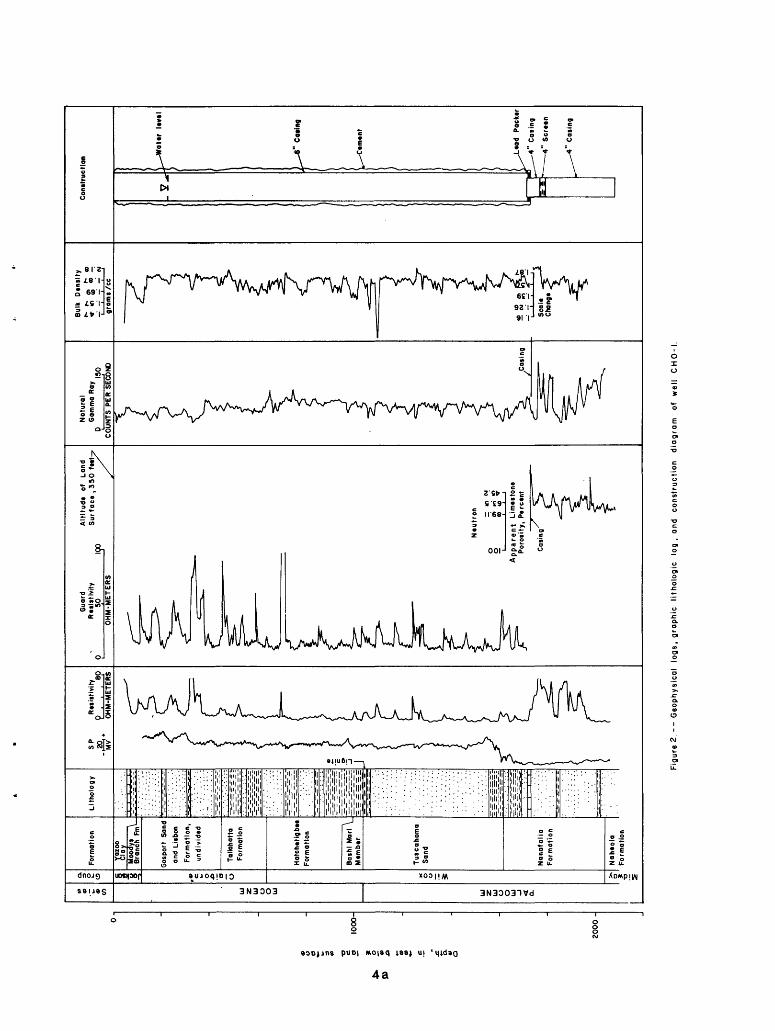
2. Geophysical logs, graphic lithologic log, and constructiondiagram of well CHO-1 ..................................... 4a
3. Compution of transmissivity of a selected sand bed in theNanafalia Formation ....................................... 14
TABLES
Table 1. Sample description log of well CHO-1 ........................ 52. Chemical analyses of water from well CHO-1 .................. 15
111
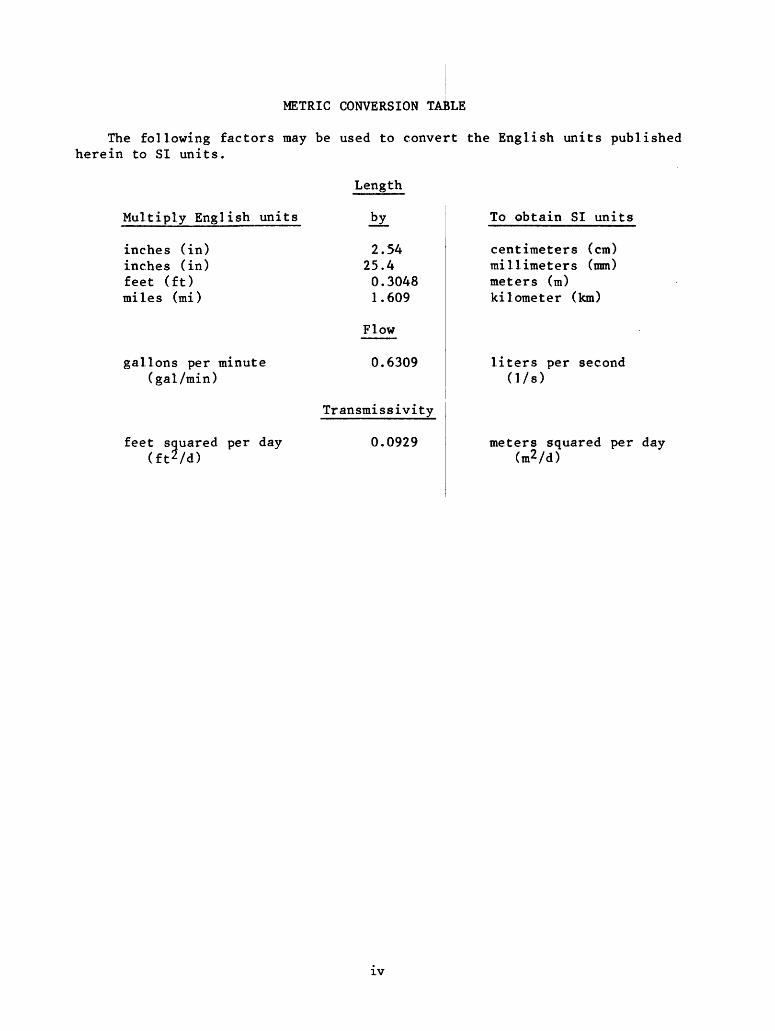
METRIC CONVERSION TABLE
The following factors may be used to convert the English units published herein to SI units.
Multiply English units
inches (in) inches (in) feet (ft) miles (mi)
gallons per minute (gal/min)
feet squared per day
Length
by_
2.5425.40.30481.609
Flow
0.6309
Transmissivity
0.0929
To obtain SI units
centimeters (cm) millimeters (mm) meters (m) kilometer (km)
liters per second (1/s)
meters squared per day (m2 /d)
IV
RESULTS OF A TEST WELL IN THE NANAFALIA FORMATION
NEAR MELVIN, CHOCTAW COUNTY, ALABAMA
By M. E. Davis, A. K. Sparkes, and B. S. Peacock
ABSTRACT
A test well was drilled by the U.S. Geological Survey near Melvin, Alabama, to investigate the water-bearing characteristics of the Nanafalia Formation of Tertiary (Pal eocene) age and to determine the chemical quality of the water. The well was drilled to a depth of 2,070 feet, cased to a depth of 1,760 feet, and completed with a screen from 1,760 to 1,780 feet. A calculated transraissivity value of about 4,000 feet squared per day for a selected sand bed in the Nanafalia was determined from a 24-hour aquifer recovery test. A chemical analysis indicates that the water is of the sodium bicarbonate type, is soft, basic, and low both in iron and chloride content. The static water level on January 17, 1981, was 109.15 feet below land surface.
INTRODUCTION
Sands of the Nanafalia Formation of Tertiary (Paleocene) age form a major aquifer in Choctaw County in southwestern Alabama. The Nanafalia is the principal source of ground water for public water supplies at Butler, Lisman, and Pennington in northern Choctaw County where the sands are tapped at depths of 700 feet or less and may yield as much as 500 gal/min. Because the formation dips southwestward from the outcrop area in the northeast part of the county, it becomes progressively deeper to the south and west. The cost of obtaining water from the greater depths in these areas has limited development and utilization of water from the Nanafalia. However, recent drought conditions and associated declining water levels in wells tapping shallower, overlying aquifers have resulted in an interest in the quantity and quality of water available from the deeper aquifer.
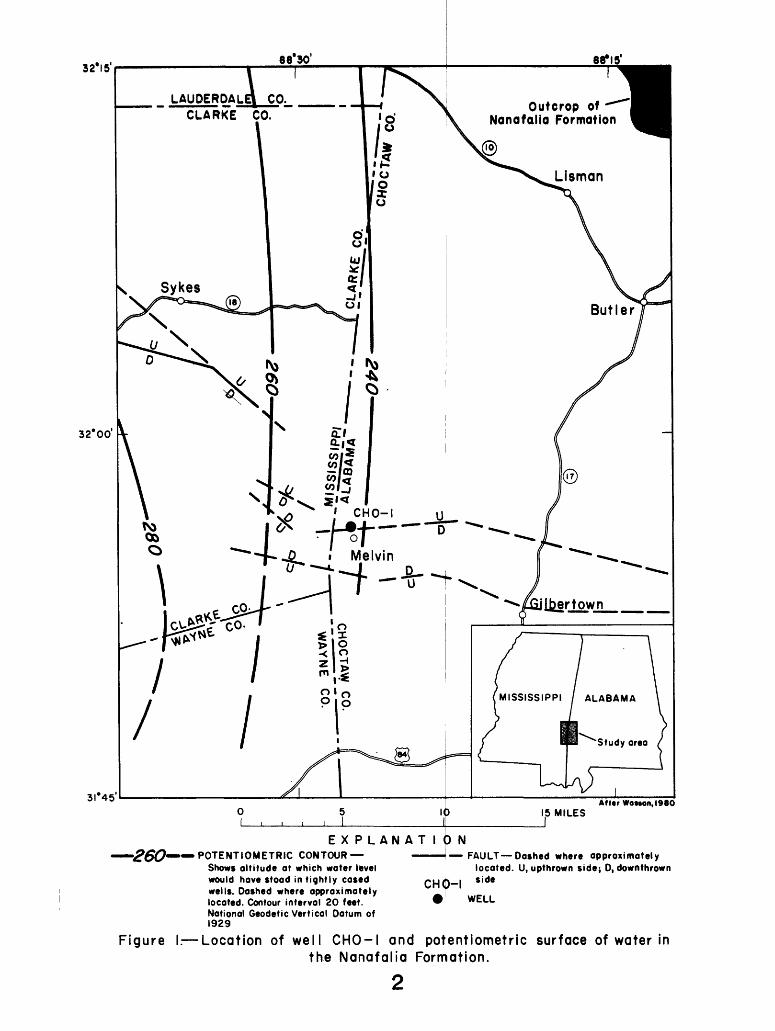
As part of the Southeastern Coastal Plain Regional Aquifer Systems Analysis investigation, a test well was drilled in the NWl/4 SWl/4 SEl/4 sec. 11, T. 11 N., R. 5 W., near Melvin, Choctaw County, during January 1981 (fig. 1). The well is located sufficiently downdip that the test results could be used to interpolate and estimate water-bearing characteristics of the aquifer in other parts of the county. Interpretation of electric logs of oil-test wells in % the area indicated that the sand beds of the Nanafalia were at least 100 feet in thickness, fairly homogeneous, and contained good-quality water.
32*15'
32*00'
3I°45
Outcrop of * " Ncmafalia Formation
MISSISSIPPI ALABAMA
EXPLANATIONPOTENTIOMETRIC CONTOUR
Shows altitude at which water level would have stood in tightly cased wells. Dashed where approximately located. Contour interval 20 feet. National Geodetic Vertical Datum of 1929
FAULT Dashed where approximately located. U, upthrown side; 0, downthrown
CHf) I
WELL
Figure I. Location of well CHO-I and potentiometric surface of water inthe Nanafalia Formation.
The well site is believed to be directly north and on the upthrown side of an eastward trending fault. The measured displacement of the fault, about 0.8 mile east of Melvin, is about 25 feet (Turner and Newton, 1971, p. 2). The base of the Oligocene Series at this location is at an altitude similar to that of the base of the underlying Jackson Group. Major faulting is known to be present in the underlying Cretaceous formations in this area (Moore, 1970, pi. 1). Sand beds in the Cretaceous formations contain saline water having greater than 3,000 mg/L (milligrams per liter) dissolved solids,
Drilling of the test well began January 6, 1981, and was completed on January 14, 1981. The test well was drilled to a depth of 2,070 feet through the Nanafalia Formation and into the Naheola Formation. The well was completed by setting a screen opposite a selected sand bed from 1,760 to 1,780 feet in the Nanafalia. Following completion of the well, a 24-hour aquifer test was conducted and a water sample collected for analysis. The well has been equipped with a water-level recorder and added to the Alabama observation well network as local well number CHO-1 and Federal site identification number 315553088273001.
Purpose and Scope
The purpose of this report is to assemble and present hydrologic and geologic data collected by the U.S. Geological Survey during the drilling and testing of the test well. Hydrogeologic data collected are presented in tables, graphs, and diagrams. These data include lithologic, geophysical, and sample logs, and the results of aquifer tests and chemical analyses of ground water.
Acknowledgments
Appreciation is extended to Mr. Ernest Land for permission to locate the test well on his property in Melvin and for granting access to the well periodically to maintain the water-level recorder.
WELL CONSTRUCTION
Drilling and Casing Procedures
The test well was drilled with a hydraulic-rotary drilling rig. Bentonite-base mud mixed with freshwater was used as the circulating fluid only prior to logging operations to build up a mud cake on the walls of the test hole. Natural clay beds encountered during drilling of the test hole generally kept the drilling fluid sufficiently thick to coat the walls and circulate the formation cuttings to the surface.
The test well was drilled to a depth of 1,720 feet using an 8 3/4-inch soft-formation bit. All depths in this report are referenced to land surface as the zero datum. Surface altitude at the test well is 350 feet as determined from the 7 1/2-minute topographic map for Melvin, Ala. A 6-inch ID (inside diameter) casing was set to a depth of 1,720 feet to facilitate further drilling and testing of the underlying sand beds in the Nanafalia
Formation. The casing was pressure-grouted witih cement from 1,720 feet back to the land surface. All casing joints were bxjtt-welded. A 5 1/2-inch diameter hole was drilled from the bottom of tlie 6-inch casing to a depth of 2,070 feet, completely penetrating the Nanafalia Formation and 30 feet of the top of the Naheola Formation. The well was completed by setting a 20-foot section of 4-inch Johnson!/ wire-wrapped stainless steel screen opposite a selected sand bed from 1,760 to 1,780 feet in the Nanafalia Formation. A sieve analysis of the average size of sand in this section indicated a screen opening size of 0.015 inch (No. 15).
To stabilize the screen at this interval, casing was installed in the lower part of the 4-inch screen, which was followed by 50 feet of: 4-inch casing extended 10 feet into the bottom sealed by packing a lead seal in the annulus casings. A construction diagram of the well is
90 feet of 4-inch blank hole, followed by 20 feet of
4-inch blank casing. The of the 6-inch casing and was
between the 4- and 6-inch shown in figure 2.
Well Development
The test well was developed, after completion, by pump-ing with compressed air. Compressed air was injected through the crill-rod string and out ahorizontal-jetting tool positioned opposite the jetting and pumping continued for 20 hours unti contained only a slight amount of suspended sec
screen. Simultaneous 1 the water from the well iment. Development removed
the drilling mud as well as fine sand, silt, ard clay from the water-bearing formation in the screened interval and forced the fine materials to pass through the screen openings into the well where they were pumped to the surface.
HYDROGEOLOGIC DAT/.
Hydrogeologic data collected during the construction lithologic logs, aquifer test results, and water in tables 1 and 2 and figures 2 and 3. Geophysical logic log, and a construction diagram are presented
of the well include analyses that are presented
logs, a graphic litho- in figure 2.
Drill Cuttings
Drill cuttings were collected from every 1CThe cuttings were collected from a sample discharge trough leading from thedrill hole to the mud-settling pit. The trough following each 10-foot sample collection so thswould represent cuttings from the following 10-foot section of the well.
A sample description log with formation Geological Survey of Alabama is presented in
-foot interval during drilling,
was cleaned of cuttings t the next sample collected
determinations made by the ts.ble 1.
JL/Use of the brand name in this report is for identification purposes only and does not constitute endorsement by the U.S. Geological Survey.
Depth, in feet below land surface
2- t?
89.11 63.5
L45.2
^
l
_= s« -o 5 8
K
^

BLANK PAGE
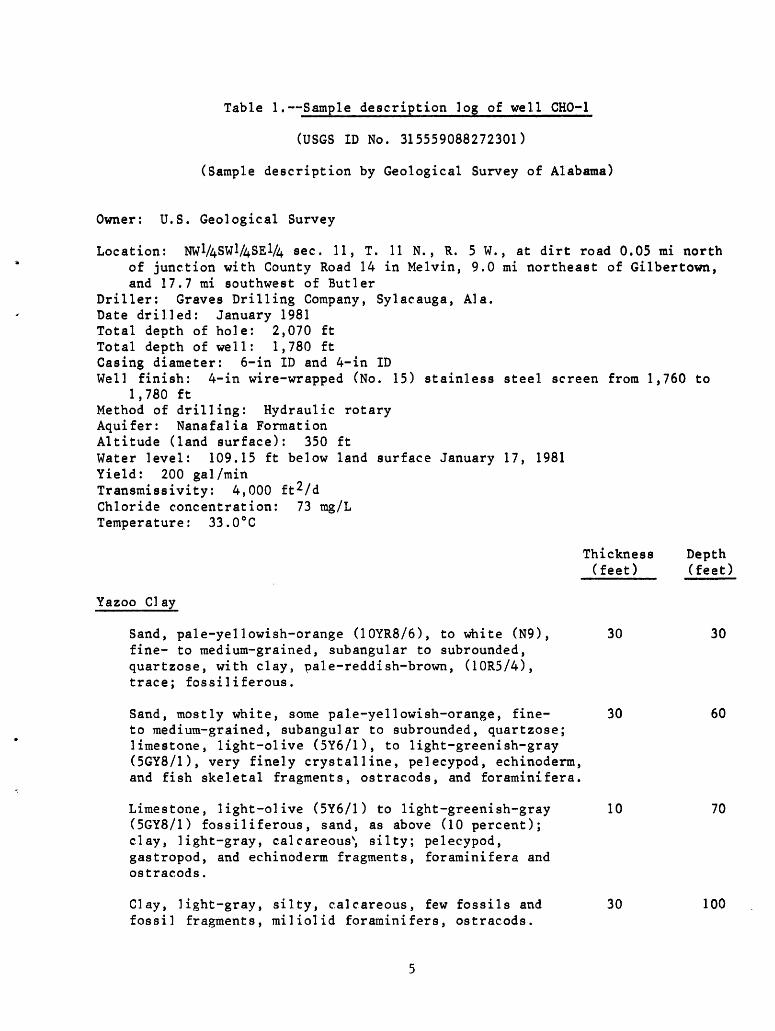
Table 1, Sample description log of well CHO-1
(USGS ID No. 315559088272301)
(Sample description by Geological Survey of Alabama)
Owner: U.S. Geological Survey
Location: NW1/4SW1/48El/4 sec. 11, T. 11 N. , R. 5 W., at dirt road 0.05 mi north of junction with County Road 14 in Melvin, 9.0 mi northeast of Gilbertown, and 17.7 mi southwest of Butler
Driller: Graves Drilling Company, Sylacauga, Ala.Date drilled: January 1981Total depth of hole: 2,070 ftTotal depth of well: 1,780 ftCasing diameter: 6-in ID and 4-in IDWell finish: 4-in wire-wrapped (No. 15) stainless steel screen from 1,760 to
1,780 ftMethod of drilling: Hydraulic rotaryAquifer: Nanafalia FormationAltitude (land surface): 350 ftWater level: 109.15 ft below land surface January 17, 1981Yield: 200 gal/minTransmissivity: 4,000 ft 2 /dChloride concentration: 73 mg/LTemperature: 33.0°C
Thickness Depth (feet) (feet)
Yazoo Clay
Sand, pale-yellowish-orange (10YR8/6), to white (N9), 30 30 fine- to medium-grained, subangular to subrounded, quartzose, with clay, pale-reddish-brown, (10R5/4), trace; fossiliferous.
Sand, mostly white, some pale-yellowish-orange, fine- 30 60 to medium-grained, subangular to subrounded, quartzose; limestone, light-olive (5Y6/1), to light-greenish-gray (5GY8/1), very finely crystalline, pelecypod, echinoderm, and fish skeletal fragments, ostracods, and foraminifera.
Limestone, light-olive (5Y6/1) to light-greenish-gray 10 70(5GY8/1) fossiliferous, sand, as above (10 percent);clay, light-gray, calcareous^, silty; pelecypod,gastropod, and echinoderm fragments, foraminifera andostracods.
Clay, light-gray, silty, calcareous, few fossils and 30 100 fossil fragments, miliolid foraminifers, ostracods.
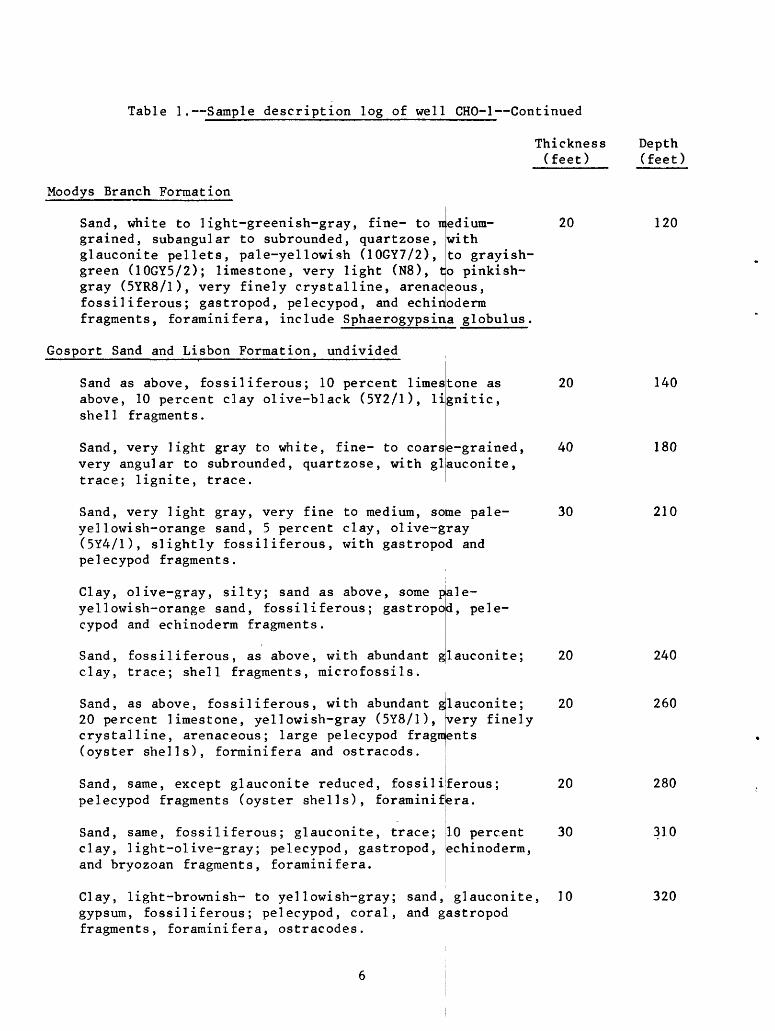
Table 1. Sample description log of well CHO-1 Continued
Thickness (feet)
Moodys Branch Formation
Sand, white to light-greenish-gray, fine- to raedium- grained, subangular to subrounded, quartzose, with glauconite pellets, pale-yellowish (10GY7/2), to grayish- green (10GY5/2); limestone, very light (N8), to pinkish- gray (5YR8/1), very finely crystalline, arenaceous, fossiliferous; gastropod, pelecypod, and echinoderm fragments, foraminifera, include Sphaerogypsina globulus.
Gosport Sand and Lisbon Formation, undivided
Sand as above, fossiliferous; 10 percent limestone as above, 10 percent clay olive-black (5Y2/1), lignitic, shell fragments.
Sand, very light gray to white, fine- to coarse-grained, very angular to subrounded, quartzose, with glauconite, trace; lignite, trace.
Sand, very light gray, very fine to medium, some pale- yellowish-orange sand, 5 percent clay, olive-gray (5Y4/1), slightly fossiliferous, with gastropod and pe1ecypod fragments.
Clay, olive-gray, silty; sand as above, some pale- yellowish-orange sand, fossiliferous; gastropod, pele cypod and echinoderm fragments.
Sand, fossiliferous, as above, with abundant glauconite; clay, trace; shell fragments, microfossils.
Sand, as above, fossiliferous, with abundant glauconite;20 percent limestone, yellowish-gray (5Y8/1), very finelycrystalline, arenaceous; large pelecypod fragments (oyster shells), forminifera and ostracods.
Sand, same, except glauconite reduced, fossiliferous; pelecypod fragments (oyster shells), foraminifera.
Sand, same, fossiliferous; glauconite, trace; clay, light-olive-gray; pelecypod, gastropod, and bryozoan fragments, foraminifera.
10 percent echinoderm,
Clay, light-brownish- to yellowish-gray; sand, glauconite, gypsum, fossiliferous; pelecypod, coral, and gastropod fragments, foraminifera, ostracodes.
20
Depth (feet)
120
20
40
30
140
180
210
20
20
240
260
20
30
10
280
310
320
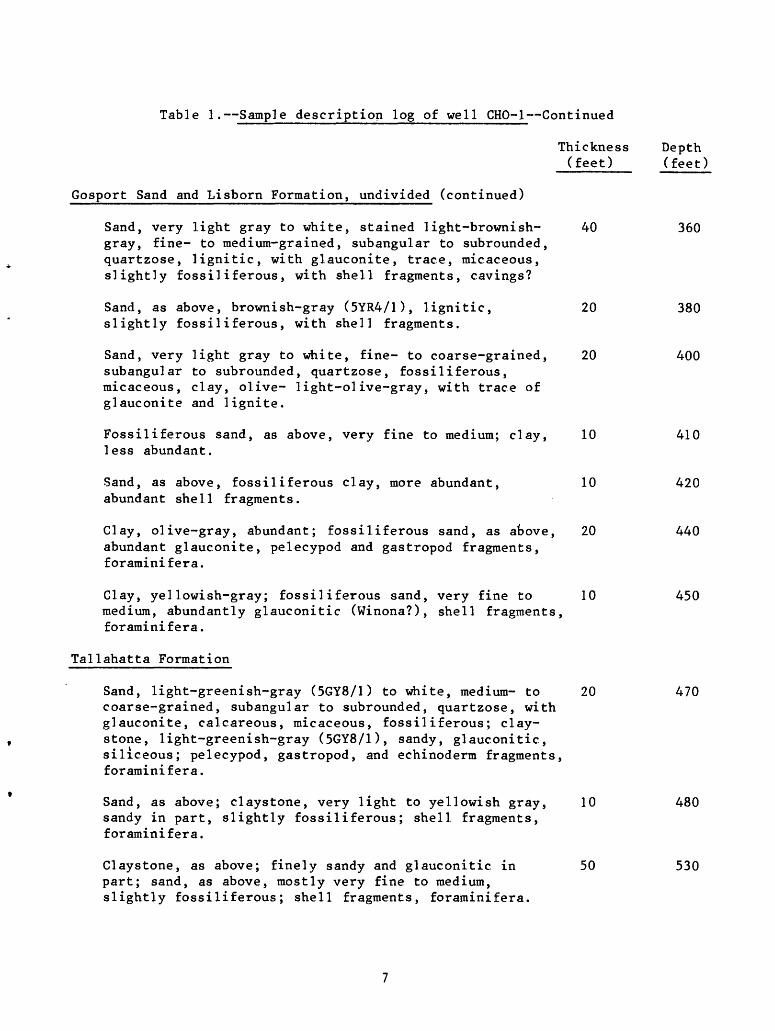
Table 1. Sample description log of well CHO-1 Continued
Thickness Depth (feet) (feet)
Gosport Sand and Lisborn Formation, undivided (continued)
Sand, very light gray to white, stained light-brownish- 40 360 gray, fine- to medium-grained, subangular to subrounded, quartzose, lignitic, with glauconite, trace, micaceous, slightly fossiliferous, with shell fragments, cavings?
Sand, as above, brownish-gray (5YR4/1), lignitic, 20 380 slightly fossiliferous, with shell fragments.
Sand, very light gray to white, fine- to coarse-grained, 20 400subangular to subrounded, quartzose, fossiliferous,micaceous, clay, olive- light-olive-gray, with trace ofglauconite and lignite.
Fossiliferous sand, as above, very fine to medium; clay, 10 410 less abundant.
Sand, as above, fossiliferous clay, more abundant, 10 420 abundant shell fragments.
Clay, olive-gray, abundant; fossiliferous sand, as above, 20 440abundant glauconite, pelecypod and gastropod fragments,foraminifera.
Clay, yellowish-gray; fossiliferous sand, very fine to 10 450medium, abundantly glauconitic (Winona?), shell fragments,foraminifera.
Tallahatta Formation
Sand, light-greenish-gray (5GY8/1) to white, medium- to 20 470 coarse-grained, subangular to subrounded, quartzose, with glauconite, calcareous, micaceous, fossiliferous; clay- stone, light-greenish-gray (5GY8/1), sandy, glauconitic, siliceous; pelecypod, gastropod, and echinoderm fragments, foraminifera.
Sand, as above; claystone, very light to yellowish gray, 10 480sandy in part, slightly fossiliferous; shell fragments,foraminifera.
Claystone, as above; finely sandy and glauconitic. in 50 530 part; sand, as above, mostly very fine to medium, slightly fossiliferous; shell fragments, foraminifera.
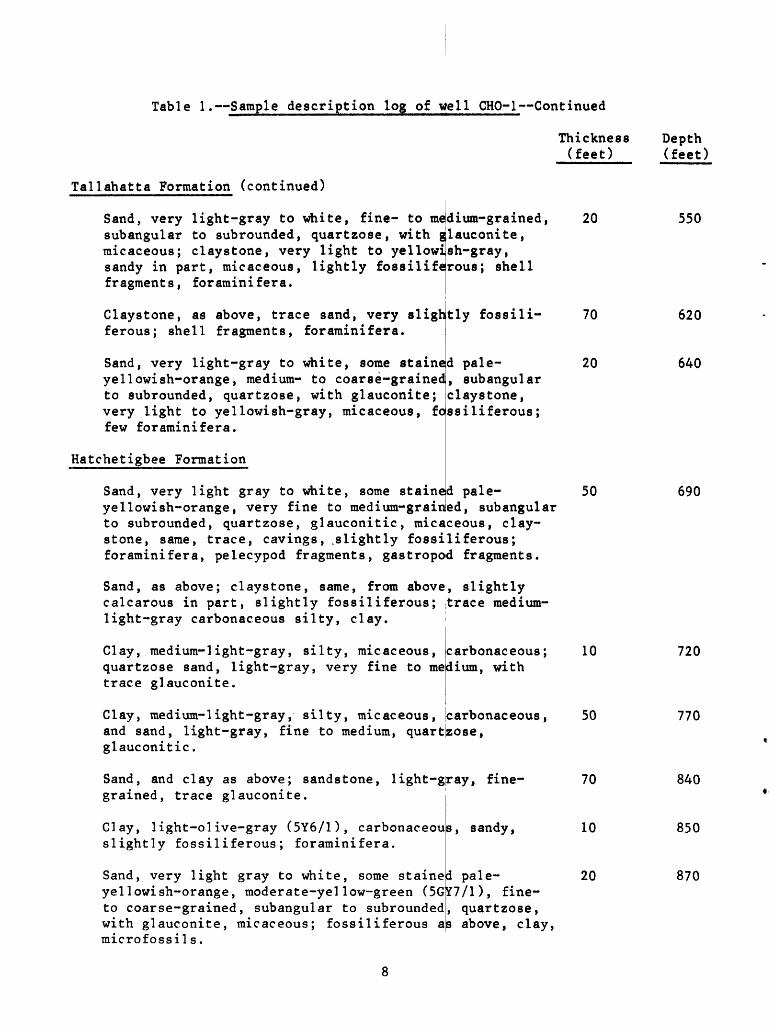
Table 1. Sample description log of well CHO-1 Continued
Tallahatta Formation (continued)
Sand, very light-gray to white, fine- to medium subangular to subrounded, quartzose, with micaceous; claystone, very light to vello sandy in part, micaceous, lightly f fragments, foraminifera.
i-grained, glauconite,
yellowish-gray, fossiliferous; shell
Thickness (feet)
20
Claystone, as above, trace sand, very slightly fossili ferous; shell fragments, foraminifera.
Sand, very light-gray to white, some stained pale- yellowish-orange, medium- to coarse-grained, subangularto subrounded, quartzose, with glauconite; claystone,very light to yellowish-gray, micaceous, fossiliferous; few foraminifera.
Hatchetigbee Formation
Sand, very light gray to white, some stained pale- yellowish-orange, very fine to medium-grained, subangular to subrounded, quartzose, glauconitic, micaceous, clay- stone, same, trace, cavings, .slightly fossiliferous; foraminifera, pelecypod fragments, gastropod fragments.
Sand, as above; claystone, same, from above, slightly calcarous in part, slightly fossiliferous; [trace medium- light-gray carbonaceous silty, clay.
Clay, medium-Hght-gray, silty, micaceous, quartzose sand, light-gray, very fine to medium trace glauconite.
carbonaceous; , with
i
Clay, medium-light-gray, silty, micaceous, icarbonaceous, and sand, light-gray, fine to medium, quartzose, glauconitic.
Sand, and clay as above; sandstone, light-gray, fine grained, trace glauconite.
Clay, light-olive-gray (5Y6/1), carbonaceous, sandy, slightly fossiliferous; foraminifera.
Sand, very light gray to white, some stained pale- yellowish-orange, moderate-yellow-green (5GY7/1), fine- to coarse-grained, subangular to subrounded, quartzose, with glauconite, micaceous; fossiliferous as above, clay, microfossils.
Depth (feet)
550
70
20
620
640
50 690
10
50
70
10
20
720
770
840
850
870
8
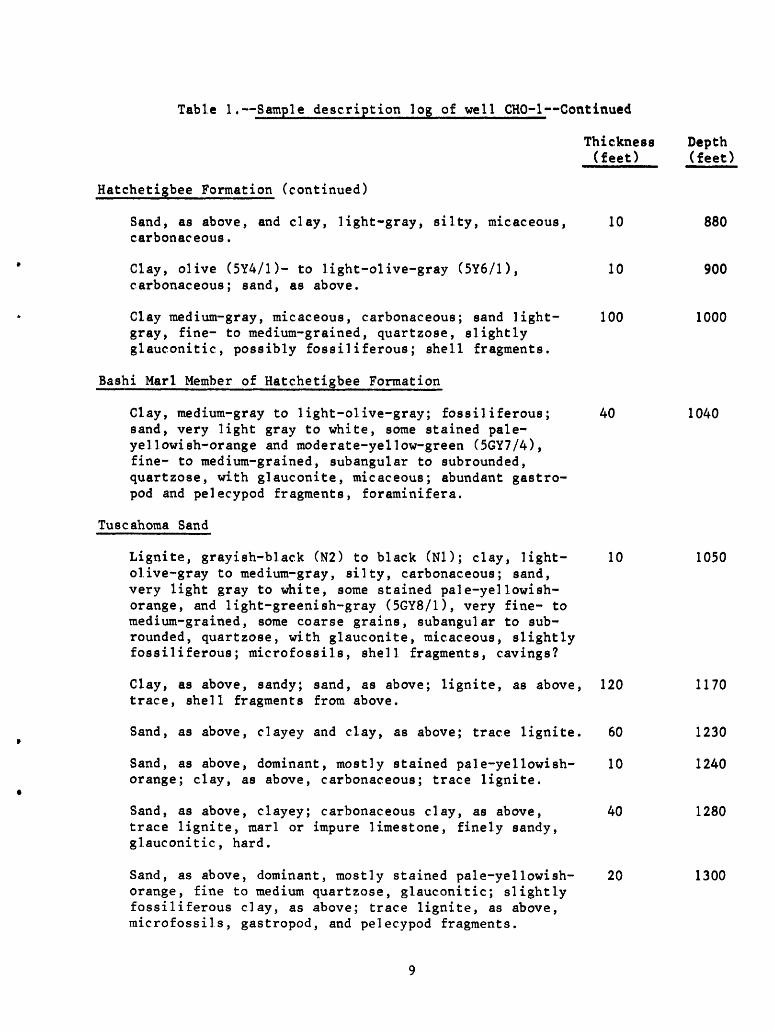
Table 1. Sample description log of well CHO-1 Continued
Thickness Depth (feet) (feet)
Hatchetigbee Formation (continued)
Sand, as above, and clay, light-gray, silty, micaceous, 10 880 carbonaceous.
Clay, olive (5Y4/D- to light-olive-gray (5Y6/1), 10 900 carbonaceous; sand, as above.
Clay medium-gray, micaceous, carbonaceous; sand light- 100 1000 gray, fine- to medium-grained, quartzose, slightly glauconitic, possibly fossiliferous; shell fragments.
Bashi Marl Member of Hatchetigbee Formation
Clay, medium-gray to light-olive-gray; fossiliferous; 40 1040 sand, very light gray to white, some stained pale- yellowish-orange and moderate-yellow-green (5GY7/4), fine- to medium-grained, subangular to subrounded, quartzose, with glauconite, micaceous; abundant gastro pod and pelecypod fragments, foraminifera.
Tuscahoma Sand
Lignite, grayish-black (N2) to black (Nl); clay, light- 10 1050 olive-gray to medium-gray, silty, carbonaceous; sand, very light gray to white, some stained pale-yellowish- orange, and light-greenish-gray (5GY8/1), very fine- to medium-grained, some coarse grains, subangular to sub- rounded, quartzose, with glauconite, micaceous, slightly fossiliferous; microfossils, shell fragments, cavings?
Clay, as above, sandy; sand, as above; lignite, as above, 120 1170 trace, shell fragments from above.
Sand, as above, clayey and clay, as above; trace lignite. 60 1230
Sand, as above, dominant, mostly stained pale-yellowish- 10 1240 orange; clay, as above, carbonaceous; trace lignite.
Sand, as above, clayey; carbonaceous clay, as above, 40 1280 trace lignite, marl or impure limestone, finely sandy, glauconitic, hard.
Sand, as above, dominant, mostly stained pale-yellowish- 20 1300 orange, fine to medium quartzose, glauconitic; slightly fossiliferous clay, as above; trace lignite, as above, microfossils, gastropod, and pelecypod fragments.
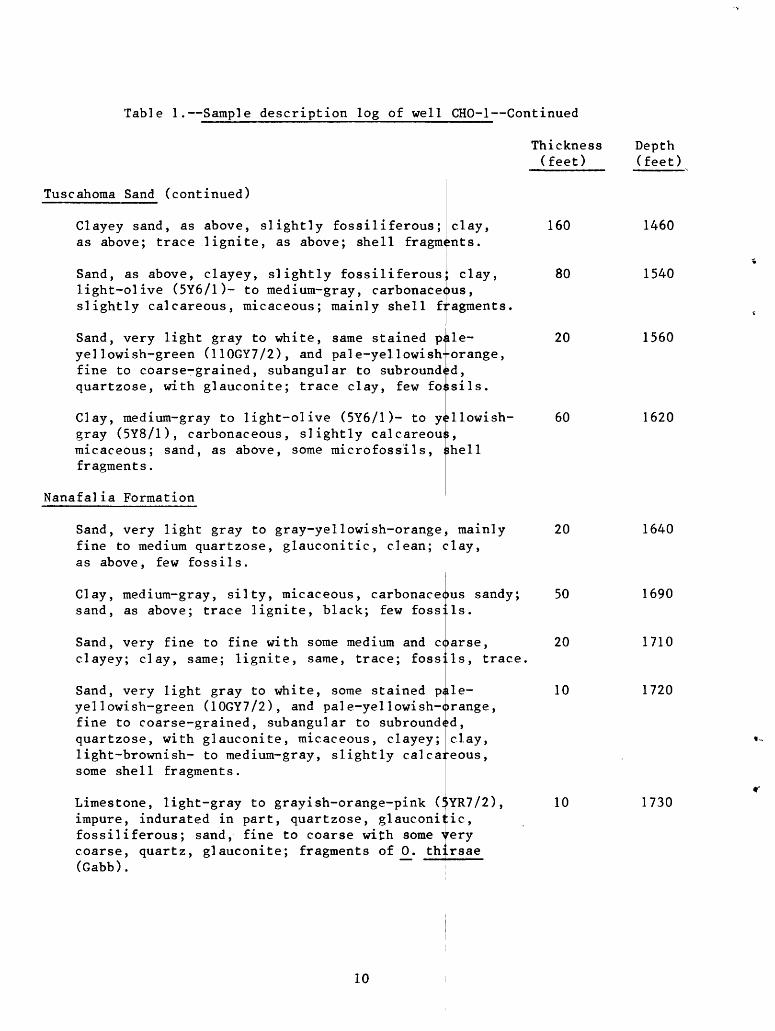
Table 1. Sample description log of well CHO-1 Continued
Tuscahoma Sand (continued)
Clayey sand, as above, slightly fossiliferous; as above; trace lignite, as above; shell fragment
Sand, as above, clayey, slightly fossiliferous light-olive (5Y6/1)- to medium-gray, slightly calcareous, micaceous; mainly shell
carbonaceousfragments
pal e-
orangeSand, very light gray to white, same stained yellowish-green (110GY7/2), and pale-yellowish fine to coarse-grained, subangular to subrounded quartzose, with glauconite; trace clay, few fossils.
Clay, medium-gray to light-olive (5Y6/1)- to yollowish- gray (5Y8/1), carbonaceous, slightly calcareous micaceous; sand, as above, some microfossils, sshell fragments.
Nanafalia Formation
Sand, very light gray to gray-yellowish-orange, mainly fine to medium quartzose, glauconitic, clean; clay, as above, few fossils.
clay, s.
clay,
carbonaceous sandy; foss:.ls.
Clay, medium-gray, silty, micaceous, carb< sand, as above; trace lignite, black; few
Sand, very fine to fine with some medium andclayey; clay, same; lignite, same, trace; fossils, trace
coarse
Sand, very light gray to white, some stained pale yellowish-green (10GY7/2), and pale-yellowish-orange fine to coarse-grained, subangular to subrounded quartzose, with glauconite, micaceous, clayey; clay, light-brownish- to medium-gray, slightly cal some shell fragments.
Limestone, light-gray to grayish-orange-pink (!>YR7/2), 10 impure, indurated in part, quartzose, glauconil:ic, fossiliferous; sand, fine to coarse with some very coarse, quartz, glauconite; fragments of 0_. th:.rsae (Gabb). ~~
Thickness (feet)
160
80
20
60
20
50
20
10
Depth (feet)
1460
1540
1560
1620
1640
1690
1710
1720
1730
10
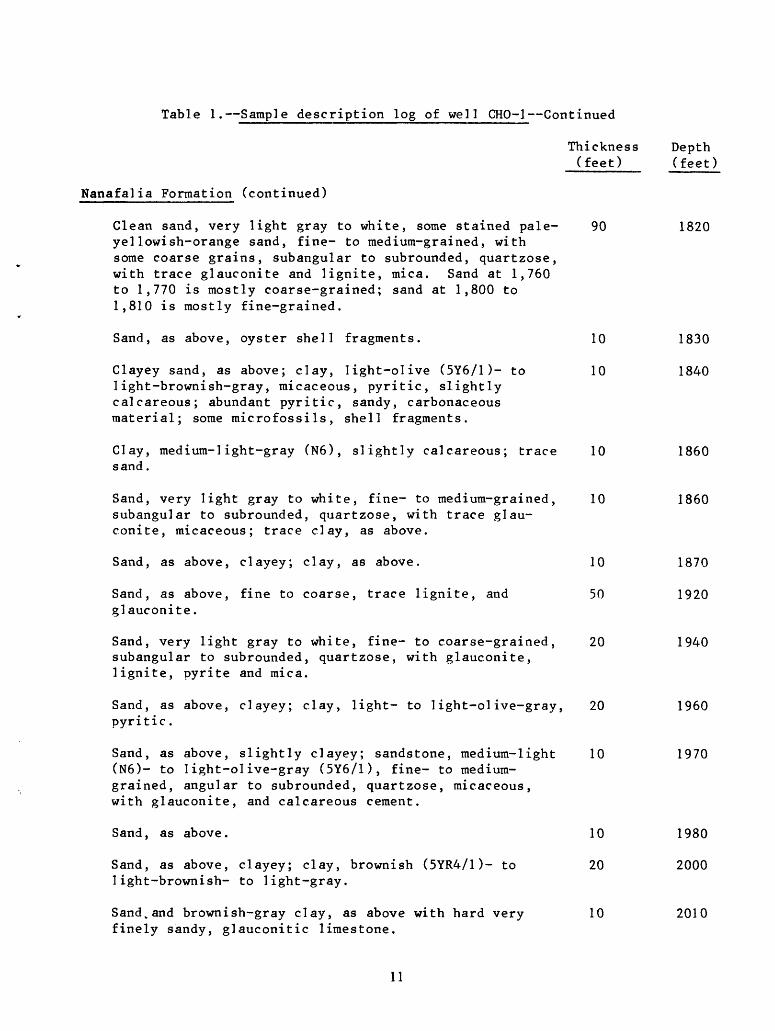
Table 1. Sample description log of well CHO-1 Continued
Thickness (feet)
Nanafalia Formation (continued)
Clean sand, very light gray to white, some stained pale- 90 yellowish-orange sand, fine- to medium-grained, with some coarse grains, subangular to subrounded, quartzose, with trace glauconite and lignite, mica. Sand at 1,760 to 1,770 is mostly coarse-grained; sand at 1,800 to 1,810 is mostly fine-grained.
Sand, as above, oyster shell fragments. 10
Clayey sand, as above; clay, light-olive (5Y6/1)- to 10 light-brownish-gray, micaceous, pyritic, slightly calcareous; abundant pyritic, sandy, carbonaceous material; some microfossils, shell fragments.
Clay, medium-light-gray (N6), slightly calcareous; trace 10 sand.
Sand, very light gray to white, fine- to medium-grained, 10 subangular to subrounded, quartzose, with trace glau conite, micaceous; trace clay, as above.
Sand, as above, clayey; clay, as above. 10
Sand, as above, fine to coarse, trace lignite, and 50 glauconite.
Sand, very light gray to white, fine- to coarse-grained, 20 subangular to subrounded, quartzose, with glauconite, lignite, pyrite and mica.
Sand, as above, clayey; clay, light- to light-olive-gray, 20 pyritic.
Sand, as above, slightly clayey; sandstone, medium-light 10 (N6)- to light-olive-gray (5Y6/1), fine- to medium- grained, angular to subrounded, quartzose, micaceous, with glauconite, and calcareous cement.
Sand, as above. 10
Sand, as above, clayey; clay, brownish (5YR4/1)- to 20 light-brownish- to light-gray.
Sand^and brownish-gray clay, as above with hard very 10 finely sandy, glauconitic limestone.
Depth (feet)
1820
1830
1840
1860
1860
1870
1920
1940
1960
1970
1980
2000
2010
11
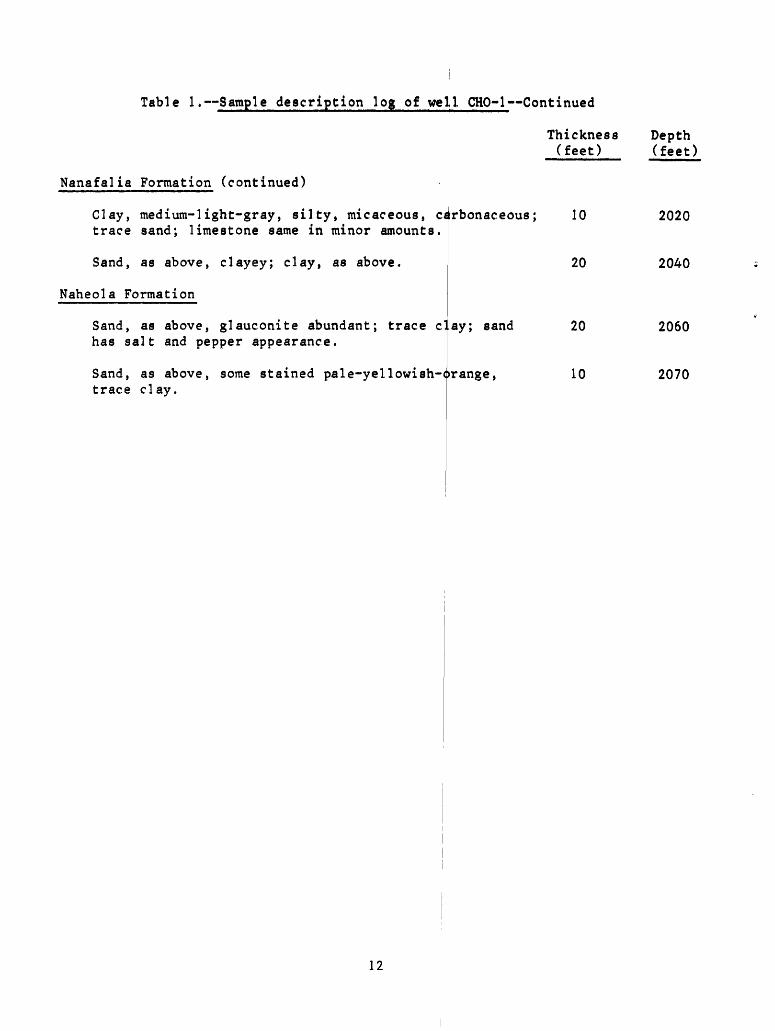
Table 1, Sample description log of well CHO-1 Continued
Nanafalia Formation (continued)
Clay, medium-1ight-gray, silty, micaceous, carbonaceous; trace sand; limestone same in minor amounts.
Sand, as above, clayey; clay, as above.
Naheola Formation
Sand, as above, glauconite abundant; trace clay; sand has salt and pepper appearance.
Sand, as above, some stained pale-yellowish-orange, trace clay.
Thickness (feet)
10
20
20
10
Depth (feet)
2020
2040
2060
2070
12
Geophysical Logs
Caliper, spontaneous-potential, electrical-resistivity, gamma ray, neutron, density, gamma gamma, and guard logs were made of the mud filled open-hole section of the well to 1,720 feet prior to setting the 6-inch casing. Following installation of the 6-inch casing, the well was drilled to a total depth of 2,070 feet and the open-hole section (1,720 to 2,070 feet) was logged with the same suite of logs as the upper section of the hole. Figure 2 shows the geophysical logs (upper and lower logged sections joined at 1,720 feet), graphic lithologic log, and construction diagram of the completed well.
Aquifer Test
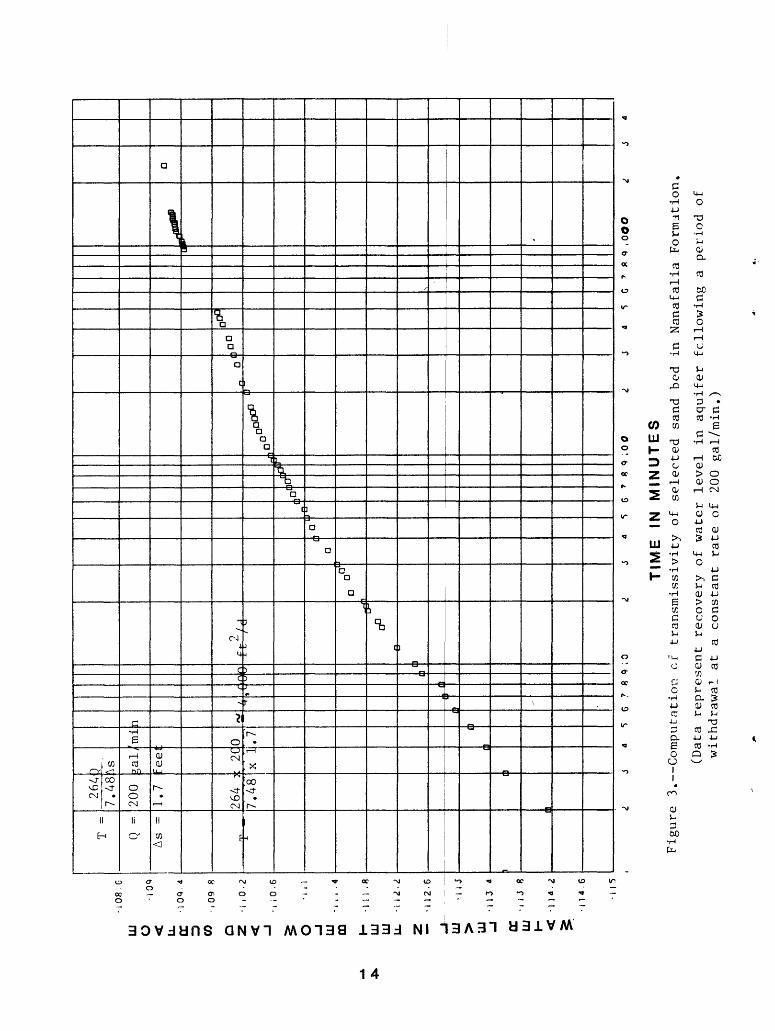
An aquifer test was made in the well to determine the transmissivity of the sand bed in the Nanafal.ia Formation where the well was screened. The well was pumped continuously at 200 gal/min for 24 hours and water-level measurements were made of both the drawdown and recovery. Discharge was measured using a 3-inch orifice on a 4-inch discharge line. The beginning water level was 109.15 feet below top of casing; maximum drawdown after 24 hours was 40.15 feet and the water level recorded to 109.18 feet, only 0.03 foot from the static level at the start of the test. The water levels after about 18 hours of the discharge test appeared to have stablized. A transrais- sivity pf about 4,000 ft^/d was obtained from the early part of the recovery limb of the water-level data (fig. 3). That part of the data are believed to reflect conditions primarily in the screened zone. The response of the aquifer during this test and in preliminary step drawdown tests indicate that the well probably was not fully developed and that some of the initial drawdown and recovery measured was in response to well loss.
Figure 1 shows the potentioraetric surface of the Nanafalia Formation in the Melvin area which was prepared by adding this water-level control point to the potentioraetric surface map of the Nanafalia Formation in adjoining Mississippi (Wasson, 1980). Although faulting is known to be present in the Cretaceous sediments (Moore, 1970, pi. 1) below the Nanafalia Formation and also in the overlying Tertiary sediments (Newton and McCain, 1972), there is no discernible affect of the faulting reflected by the potentioraetric surface of the Nanafalia.
Chemical Analyses of Water
A water sample was collected from well CHO-1, during the aquifer test, after pumping at a rate of 200 gal/min for 20 hours. The sample was analyzed for major and minor chemical constituents by the U.S. Geological Survey Central Laboratory in Doraville, Ga. The analysis of the water is listed in table 2.
The chemical analysis indicates that water from the tested sand in the Nanafalia Formation at Melviti is of the sodium bicarbonate type. According to the U.S. Environmental Protection Agency drinking water standards, it is soft, basic, and low both in iron and chloride content. Based on the results of this analysis, the water is suitable for most purposes except irrigation
13
HI O
<
LL
DC
D
CO Q Z HI
CD HI
HI
LL Hl >
HI _l DC
HI
108-
0
-109
109-4
,09
8
i .0
-2
i i 0
. 6
ill
I ,
. .4
111.8
i i i
2
i 12
-6
-i 1
3
1134
i 1 J
8
114.2
i U.
G
i I
S
T =
Q =
As
=
1£
__
__
1
1
264<
7
.48
200
1.7
264
27.4
8
i
i
3_.
"\s gal
/re
el
: 2C
x 1 i
i
mi
0 .7
i i
n *j 1
1
/ «
1 -
H l-te i i9 i i
ft2/d
c*J
0°
a
i
D°°'
t
t a
)
°l
ir«
-,°')U
^^,0
°'
I
,DO
0°°
UX
*1
o
G 7
« 9 ,OOO
TIM
E
IN
MIN
UT
ES
Figure 3. Computation cf transmissivity of selected sand bed in Nanafalia Formation.
(Data represent recovery of water level in aquifer fallowing a
period of
withdrawal at a
constant rate of 200 gal/min.)
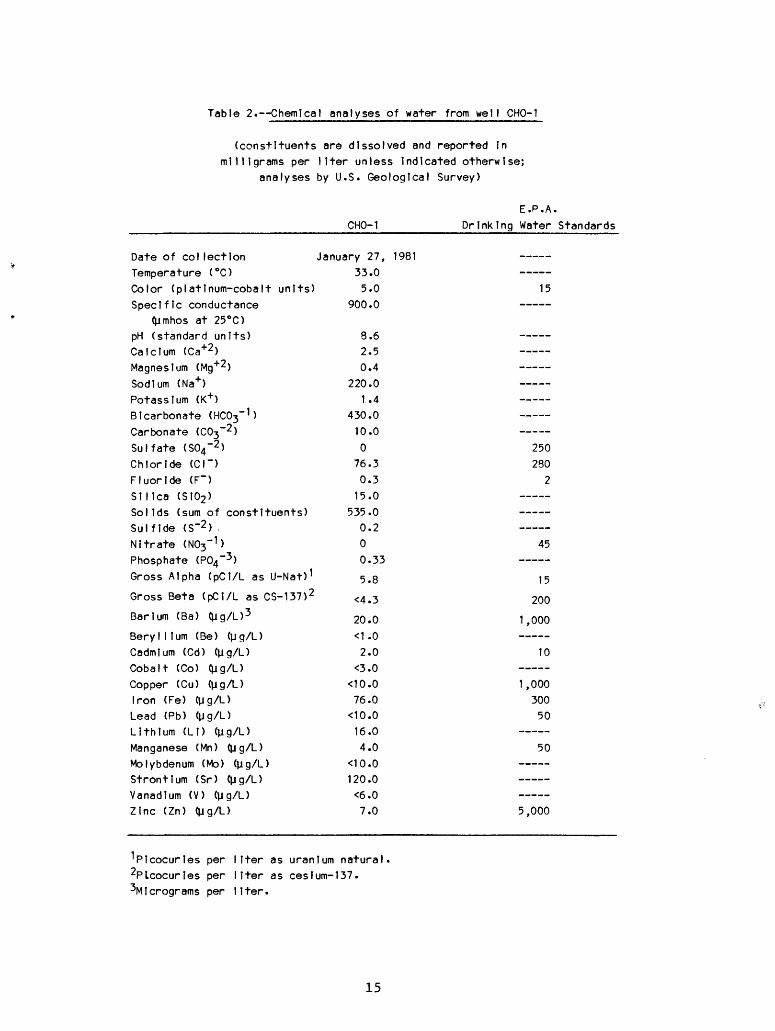
Table 2. Chemical analyses of water from well CHO-1
(constituents are dissolved and reported Inmilligrams per liter unless Indicated otherwise;
analyses by U.S. Geological Survey)
E.P.A. _________________________CHO-1_________Drinking Water Standards
Date of col lection January 27, 1981 Temperature (°C) 33.0 Color (platinum-cobalt units) 5.0 15Specific conductance 900.0
(M mhos at 25°C)pH (standard units) 8.6 Calcium (Ca+2 ) 2.5 Magnesium (Mg+2 ) 0.4 Sodium (Na+ ) 220.0 Potassium (K+ ) 1.4 Bicarbonate (HC03~ 1 ) 430.0 Carbonate (C03~2 ) 10.0 Sulfate (S04 ~2 ) 0 250Chloride (CD 76.3 280Fluorlde (F~) 0.3 2Silica (SI02 ) 15.0 Solids (sum of constituents) 535.0 Sulflde (S~2 ) - 0.2 Nitrate (N03~ 1 ) 0 45Phosphate (P04 ~3 ) 0.33 Gross Alpha (pCI/L as U-Nat) 1 5.3 15
Gross Beta (pCI/L as CS-137) 2 <4.3 200
Barium (Ba) (yg/L) 3 20.0 1,000
Beryllium (Be) (yg/L) <1.0 Cadmium (Cd) (yg/L) 2.0 10Cobalt (Co) (yg/L) <3.0 Copper (Cu) (yg/L) <10.0 1,000Iron (Fe) (yg/L) 76.0 300Lead (Pb) (yg/L) <10.0 50Lithium (LI) (yg/L) 16.0 Manganese (Mn) (yg/L) 4.0 50Molybdenum (Mo) (yg/L) <10.0 Strontium (Sr) (yg/L) 120.0 Vanadium (V) (yg/L) <6.0 Zinc (Zn) (yg/L) 7.0 5,000
^Plcocurles per liter as uranium natural.2PtcocurIes per liter as cesfum-137.3MIcrograms per liter.
15
or boiler supply. Except for the normal increase of dissolved-solids concentration with depth and distance from the recharge area, the water is similar in quality to that from wells tapping the Nanafalia Formation at Butler (Newton and McCain, 1972), ,
There is no chemical evidence of upward leakage of saline water along the fault zone from the underlying Cretaceous formations.
16
SELECTED REFERENCES
Boswell, E. H., 1976, The Lower Wilcox in Mississippi: U.S. Geological Survey Water-Resources Investigations 75-60, 3 sheets.
Davis, M. E., 1980, Ground-water levels in Alabama, for observation wells measured periodically August 1952 through July 1977: Alabama Geological Survey Circular 105, 74 p.
Ferris, J. G., Knowles, D. B., Brown, R. H., and Stallman, R. W., 1962, Theory of aquifer tests: U.S. Geological Survey Water-Supply Paper 1536-E, p. 69-174.
MacNeil, F. S., 1946, Geologic map of the Tertiary formations of Alabama: U.S. Geological Survey Oil and Gas Investigations OM-45, scale 1:500,000.
Moore, D. B., 1970, Subsurface geology of southwest Alabama: Alabama Geological Survey Bulletin 99, 80 p.
Newton, J. G., and McCain, J. F., 1972, Water availability of Choctaw County, Alabama: Alabama Geological Survey Map 125, 23 p.
Turner, J. D., and Newton, J. G., 1971, Geology of Choctaw County, Alabama: Alabama Geological Survey Map 102, 15 p.
U.S. Environmental Protection Agency, 1976a, National, interim primary drinking water regulations: EPA-570/9-76-003, 159 p.
____1976b, Quality criteria for water: EPA, 256 p.
____1977, National secondary drinking water regulations: Federal Register, v. 42, no. 62, Thursday, March 31, 1977, Part I, p. 17143-17147.
U.S. Geological Survey, 1982, Water-resources data for Alabama - Water Year 1981: U.S. Geological Survey Water-Data Report AL-81-1, 540 p.
Wasson, B. E., 1980, Potentiometric map of the Lower Wilcox aquifer in Mississippi, Fall 1979: U.S. Geological Survey Water-Resources Investigations Open-File Report 80-597.
17