Embed Size (px)
Citation preview
1
River Basin OrganizationsRBO
by Dr. Jerome Delli PriscoliInstitute for Water ResourcesUS Army Corps of EngineersEditor in Chief Water Policy
Water Resources - IWRM In the United States
•History•Theory – Concepts•Examples – Tools-Institutions
Some Water Basics in the US• US supplies 500,000 gals per person per year• 19 cents /gal average
– Municipalities $1 / 1,000 gals– Industry and Agriculture less then 10 cents/1000 gals– Bottled water $4,000 per 1,000 gals
• US divided in middle 100th meridian– Most East rain fed and Arid West irrigation
• Two main legal Traditions of water rights Riparian in East and Prior Appropriation in West
• Federal System - States have primary control of water
• Federal Interests based on Interstate Commerce, National Economics benefits, Environmental and Public Health, managing transboundary conflicts
• Most people served by public water supplies
Water Investments• By early 1990’s over $400 billion for capital
investment• 25,000 miles of inland waterways• 83,000 reservoirs and dams• 88,000 megawatts of hydro power capacity (= to
nuclear)• 52,000 public utilities supply 24 billion gals per
day to domestic users• 60 million acres of land irrigated• 15,000 municipal sewage treatment plants• 60,000 water pollution control permits• BUT 60% of original inland wetlands converted to
other uses• BUT 50% of 1.5 million miles of streams and
k t f d t i ifi tl
Water as an Industry in the US
• No one Federal Policy: collection of incremental policies
• Annual expenditures is third - behind electric power and petro chemicals
• Most capital intensive• Most highly regulated• 90,000 people in Federal Government• Parts of 10 Cabinet Departments• 2 major Independent Agencies• 34 Smaller Water Agencies• State and Local over 300,000 people• Private sector and consultants over 50,000
Federal Infrastructure Expenditures
54.30%
12%11.30%1.10%
8.50%12.80%
0.00%10.00%20.00%30.00%40.00%50.00%60.00%
1
Roads/BridgesAirports/AirwaysMass TransprtRailsWastewaterWater Resources
2
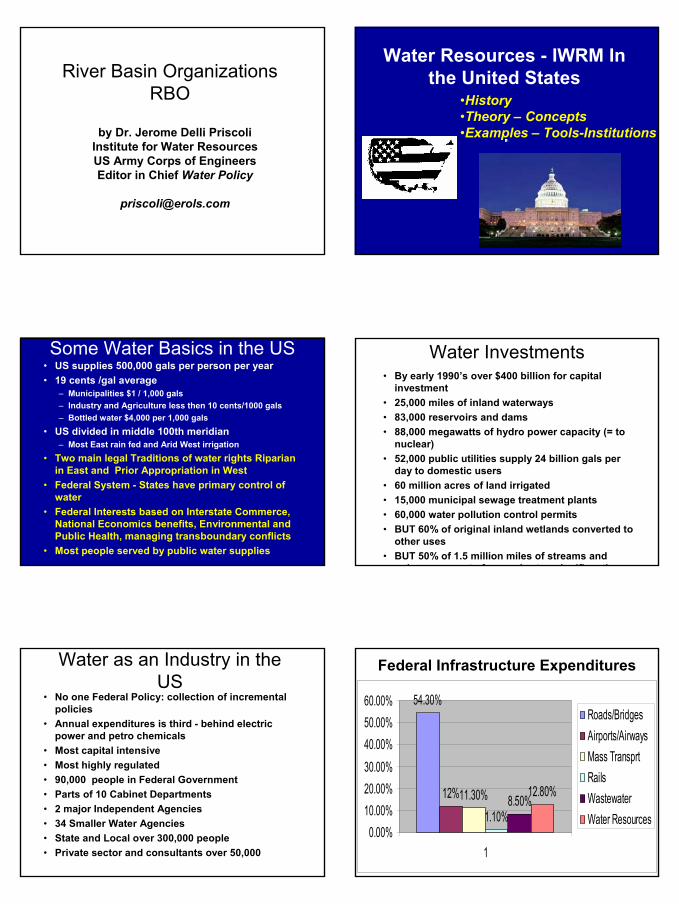
Federal Expenditures for Water (1960-1992) Water Use in the US
Water Use in the US Historic Projections of Use vs. Actual Use
Increase 1950-1980: Decrease 1980-1995:Why?
• 1950-1980 expansion of irrigation and energy development– Irrigation use of center pivot systems and – Inexpensive groundwater
• Reduced demand starts in 1970’s:– Higher energy prices – Increased cost of irrigation water ground water,– improved irrigation techniques, – down turn in farm economy
• Transition from water- supply to water - demand management and more efficient use
• New technologies in industrial sector, more recycling, regulations -reduce discharge of pollutants E h d f th l bli
History• 1800’s Westward Expansion - Nation building• 1850 - 1900s - Evolution of Federal Roles
navigation, flood control, others, areas pubic municipal water supply progressive era and conservation (wise use utilitarian Pinchotview)– Failure of private water supply – public
health concerns
3
History (con.)•1920’s Private reaction to public roles by private power
•Single purpose power dam licensing leads to congressional mandate for 308 basin reports on all rivers in US by Corps
•Search for political constituencies and financing for large projects leads to multipurpose larger public +federal role
•Reductions of private role on rivers•Reduction of single purpose•Pinchot view vs. Muir view of resources
(Utilitarian vs. Preservationist)
History (con.)•1930 -1940s Depression and New Deal
•Massive Public Infrastructure investments ( e.g. TVA..)
•Use of Multipurpose projects as basis for Economic development – Regional Development poverty reduction
•1950 – 1970s Post War •Struggling with coordination and national policy, planning, commissions continued supply focus•Emergence of Multi Objective (MOP) along with
Multi Purpose•Tittle II – RBOs – Principle & standards (P&S)•Increase focus on public planning and river basin
focus
History (con.)•1970 -1980s - EPA Clean Water Act (Muir preservation view dominates )
-Grants for treatment-Increase in Public Regulation for EQ-Reduction of public planning – P&S criteria-Reduction of basin focus – increase in project focus-Separation of Public Health and Environment Quality-Demand management, pricing-Waste treatment, reuse regulation-Increase in institutional Fragmentation
History (con.)
1980 -1990s EPA dominate force in water
•Regulation dominate mode•Focus on watersheds consensus-
bottom up with top-down regulation•Project focus •Increased coordination problems
2000 ++ Trends (conflicting)•Reduced p/capita consumption•Increased awareness of ecological values•Large scale supply issues and reallocation to meet
new demographic needs and new demands•Belief in Private sector•Ethic of participation – consensus•Need for holistic view of water•Inefficiency of regulation as framework for
large scale allocation – trade-offs•Major re licensing of dams due •Debate on taking out dams•Realization watershed consensus does not necessarily equal good holistic use of water•Aging water infrastructure• Likely renewed interest in River Basin – large scale view of water resources – basin organizations
Recurrent Themes in US Water policy• Economic development
– Regional vs. national– distribution of benefits
• Coordination – Legislative (Congress) vs. the President
(Executive Branch)– Federal, State, Local: Decentralized vs.
Centralized• Conservation and environment
– Wise use (Utilitarian) vs. Preservationist (absolutist)
– Planning vs. regulation vs. markets in allocating
– Land vs. water
4
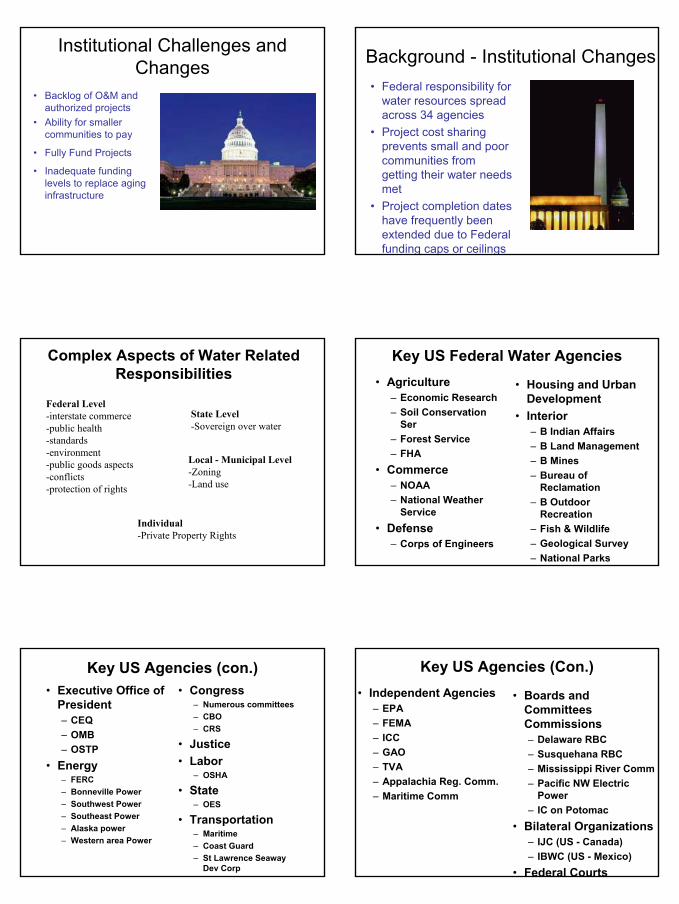
Institutional Challenges and Changes
• Backlog of O&M and authorized projects
• Ability for smaller communities to pay
• Fully Fund Projects
• Inadequate funding levels to replace aging infrastructure
Background - Institutional Changes• Federal responsibility for
water resources spread across 34 agencies
• Project cost sharing prevents small and poor communities from getting their water needs met
• Project completion dates have frequently been extended due to Federal funding caps or ceilings
Complex Aspects of Water Related Responsibilities
Federal Level-interstate commerce-public health-standards-environment-public goods aspects-conflicts-protection of rights
State Level-Sovereign over water
Local - Municipal Level-Zoning -Land use
Individual-Private Property Rights
Key US Federal Water Agencies• Agriculture
– Economic Research – Soil Conservation
Ser– Forest Service– FHA
• Commerce– NOAA– National Weather
Service• Defense
– Corps of Engineers
• Housing and Urban Development
• Interior– B Indian Affairs– B Land Management– B Mines– Bureau of
Reclamation– B Outdoor
Recreation– Fish & Wildlife– Geological Survey– National Parks
Key US Agencies (con.)• Executive Office of
President– CEQ– OMB– OSTP
• Energy– FERC– Bonneville Power– Southwest Power– Southeast Power– Alaska power– Western area Power
• Congress– Numerous committees– CBO– CRS
• Justice• Labor
– OSHA
• State– OES
• Transportation– Maritime– Coast Guard– St Lawrence Seaway
Dev Corp
Key US Agencies (Con.)• Independent Agencies
– EPA– FEMA– ICC– GAO– TVA– Appalachia Reg. Comm.– Maritime Comm
• Boards and Committees Commissions– Delaware RBC– Susquehana RBC– Mississippi River Comm– Pacific NW Electric
Power – IC on Potomac
• Bilateral Organizations– IJC (US - Canada)– IBWC (US - Mexico)
• Federal Courts
5
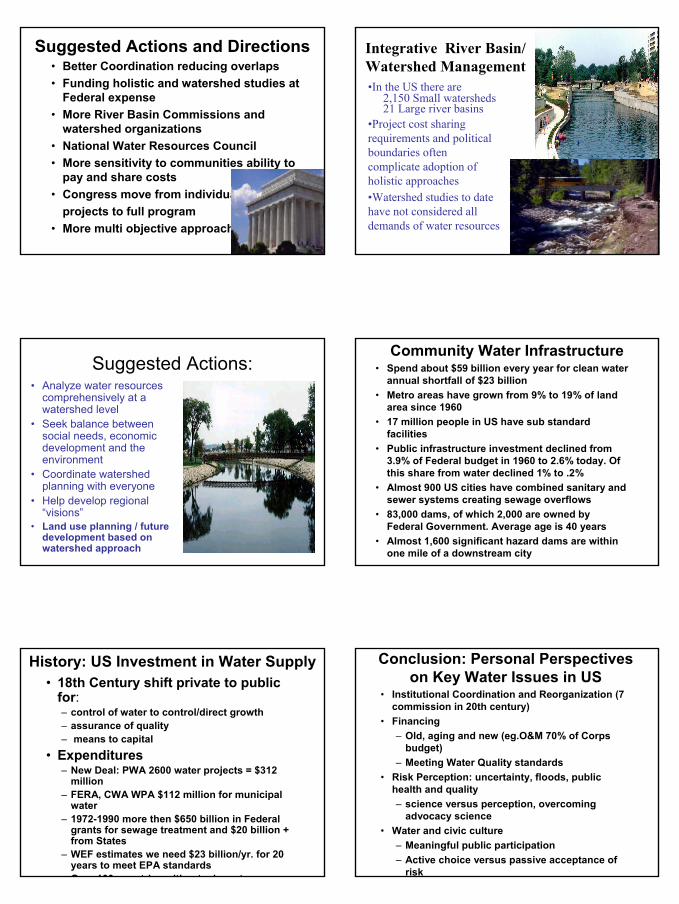
Suggested Actions and Directions• Better Coordination reducing overlaps• Funding holistic and watershed studies at
Federal expense• More River Basin Commissions and
watershed organizations• National Water Resources Council• More sensitivity to communities ability to
pay and share costs• Congress move from individual
projects to full program• More multi objective approaches
d:•In the US there are 2,150 Small watersheds21 Large river basins
•Project cost sharing requirements and political boundaries often complicate adoption of holistic approaches•Watershed studies to date have not considered all demands of water resources
Integrative River Basin/ Watershed Management
Suggested Actions:• Analyze water resources
comprehensively at a watershed level
• Seek balance between social needs, economic development and the environment
• Coordinate watershed planning with everyone
• Help develop regional “visions”
• Land use planning / future development based on watershed approach
Community Water Infrastructure• Spend about $59 billion every year for clean water
annual shortfall of $23 billion• Metro areas have grown from 9% to 19% of land
area since 1960• 17 million people in US have sub standard
facilities• Public infrastructure investment declined from
3.9% of Federal budget in 1960 to 2.6% today. Of this share from water declined 1% to .2%
• Almost 900 US cities have combined sanitary and sewer systems creating sewage overflows
• 83,000 dams, of which 2,000 are owned by Federal Government. Average age is 40 years
• Almost 1,600 significant hazard dams are within one mile of a downstream city
History: US Investment in Water Supply• 18th Century shift private to public
for:– control of water to control/direct growth– assurance of quality– means to capital
• Expenditures– New Deal: PWA 2600 water projects = $312
million– FERA, CWA WPA $112 million for municipal
water– 1972-1990 more then $650 billion in Federal
grants for sewage treatment and $20 billion + from States
– WEF estimates we need $23 billion/yr. for 20 years to meet EPA standardsOver 100 countries without adequate
Conclusion: Personal Perspectives on Key Water Issues in US
• Institutional Coordination and Reorganization (7 commission in 20th century)
• Financing – Old, aging and new (eg.O&M 70% of Corps
budget) – Meeting Water Quality standards
• Risk Perception: uncertainty, floods, public health and quality– science versus perception, overcoming
advocacy science• Water and civic culture
– Meaningful public participation– Active choice versus passive acceptance of
risk
6
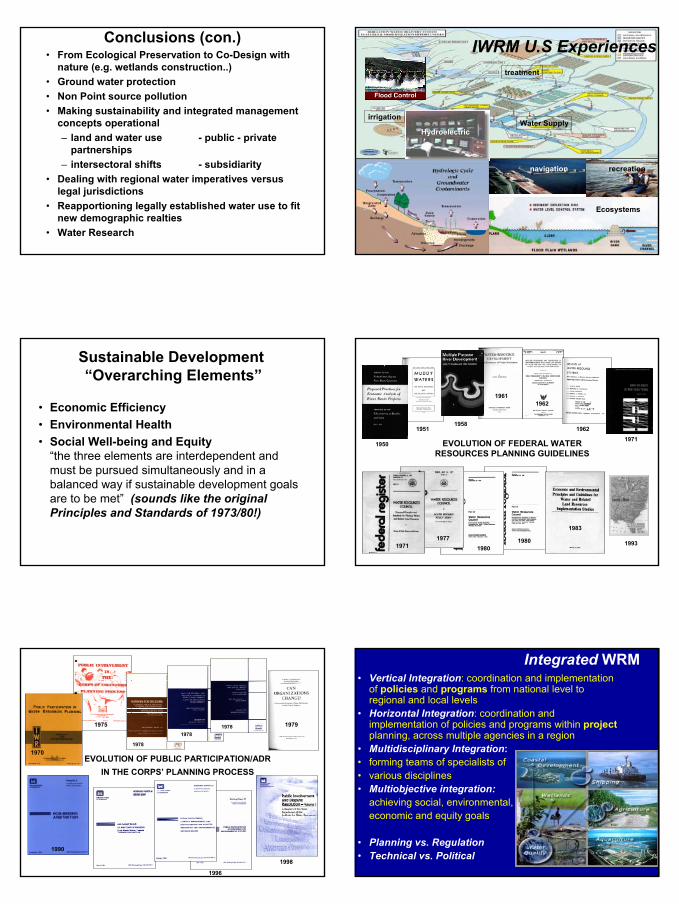
Conclusions (con.)• From Ecological Preservation to Co-Design with
nature (e.g. wetlands construction..)• Ground water protection• Non Point source pollution• Making sustainability and integrated management
concepts operational– land and water use - public - private
partnerships– intersectoral shifts - subsidiarity
• Dealing with regional water imperatives versus legal jurisdictions
• Reapportioning legally established water use to fit new demographic realties
• Water Research
IWRM EXPERIENCES IN USHydroelectric
Ecosystems
recreationnavigation
Water Supplyirrigation
treatment
IWRM U.S Experiences
Sustainable Development“Overarching Elements”
• Economic Efficiency• Environmental Health• Social Well-being and Equity
“the three elements are interdependent and must be pursued simultaneously and in a balanced way if sustainable development goals are to be met” (sounds like the original Principles and Standards of 1973/80!)
EVOLUTION OF FEDERAL WATER RESOURCES PLANNING GUIDELINES
1950
19511958
1961
1971
1962
1962
19711977
19801980
1983
1993
EVOLUTION OF PUBLIC PARTICIPATION/ADRIN THE CORPS’ PLANNING PROCESS
1970
1975
1978
1979
1990
1996
1998
19781978
Integrated WRM• Vertical Integration: coordination and implementation
of policies and programs from national level to regional and local levels
• Horizontal Integration: coordination and implementation of policies and programs within projectplanning, across multiple agencies in a region
• Multidisciplinary Integration:• forming teams of specialists of • various disciplines• Multiobjective integration:
achieving social, environmental, economic and equity goals
• Planning vs. Regulation• Technical vs. Political
7
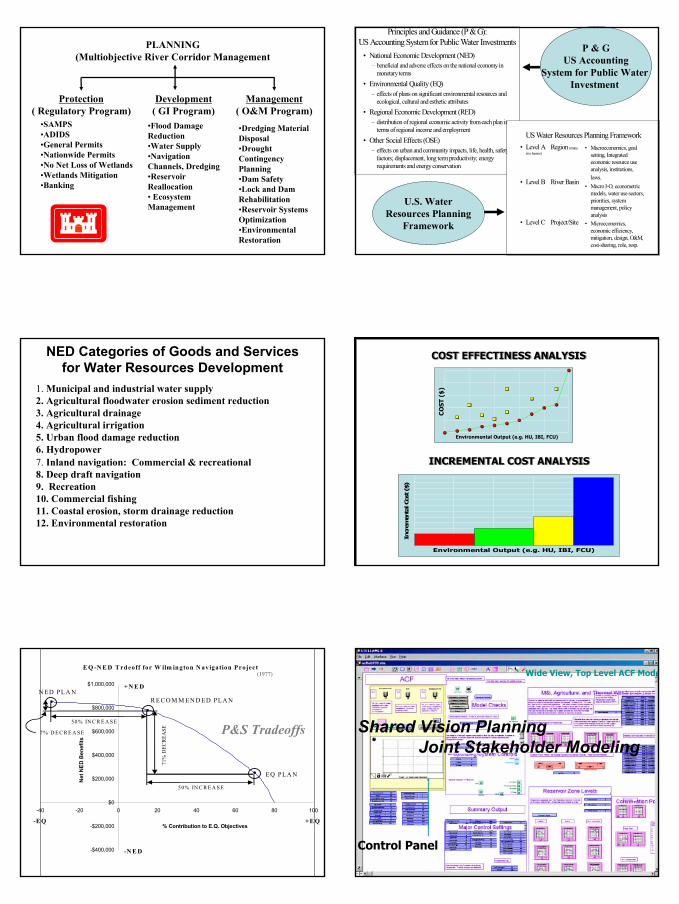
PLANNING(Multiobjective River Corridor Management
Protection( Regulatory Program)
Development( GI Program)
Management( O&M Program)
•SAMPS•ADIDS•General Permits•Nationwide Permits•No Net Loss of Wetlands•Wetlands Mitigation •Banking
•Flood Damage Reduction•Water Supply•Navigation Channels, Dredging•Reservoir Reallocation• Ecosystem Management
•Dredging Material Disposal•Drought Contingency Planning•Dam Safety•Lock and Dam Rehabilitation•Reservoir Systems Optimization•Environmental Restoration
Principles and Guidance (P & G): US Accounting System for Public Water Investments
• National Economic Development (NED)– beneficial and adverse effects on the national economy in
monetary terms
• Environmental Quality (EQ)– effects of plans on significant environmental resources and
ecological, cultural and esthetic attributes
• Regional Economic Development (RED)– distribution of regional economic activity from each plan in
terms of regional income and employment
• Other Social Effects (OSE)– effects on urban and community impacts, life, health, safety
factors; displacement, long term productivity; energy requirements and energy conservation
US Water Resources Planning Framework• Level A Region (many
rive basins)
• Level B River Basin
• Level C Project/Site
• Macroeconomics, goal setting, Integrated economic resource use analysis, institutions, laws.
• Macro I-O, econometric models, water use sectors, priorities, system management, policy analysis
• Microeconomics, economic efficiency, mitigation, design, O&M, cost-sharing, role, resp.
P & GUS Accounting
System for Public Water Investment
U.S. WaterResources Planning
Framework
NED Categories of Goods and Services for Water Resources Development
1. Municipal and industrial water supply2. Agricultural floodwater erosion sediment reduction3. Agricultural drainage4. Agricultural irrigation5. Urban flood damage reduction6. Hydropower7. Inland navigation: Commercial & recreational8. Deep draft navigation9. Recreation10. Commercial fishing11. Coastal erosion, storm drainage reduction12. Environmental restoration
Environmental Output (e.g. HU, IBI, FCU)C
OST
($
)
Environmental Output (e.g. HU, IBI, FCU)
Incr
emen
tal C
ost ($
)
COST EFFECTINESS ANALYSISCOST EFFECTINESS ANALYSISCOST EFFECTINESS ANALYSIS
INCREMENTAL COST ANALYSISINCREMENTAL COST ANALYSISINCREMENTAL COST ANALYSIS
EQ-NED Tradeoff for Wilmington Harbor Navigation Project (1977)
-$400,000
-$200,000
$0
$200,000
$400,000
$600,000
$800,000
$1,000,000
-40 -20 0 20 40 60 80 100
% Contribution to E.Q. Objectives
Net
NED
Ben
efits
50% IN C R E A SE
50% IN C R E A SE
71%
DEC
REA
SE7% D E C R E A SE
R EC O M M EN D ED PLA N
EQ PLA N
N ED PLA N
-N E D
+ N E D
-E Q + E Q
E Q -N E D T rdeoff for W ilm ington N avigation Project
P&S Tradeoffs
(1977) Wide View, Top Level ACF Mode
Control Panel
Shared Vision Planning Joint Stakeholder Modeling
8
Corps Water Management System (CWMS)
New system for managing the regulation of 700+ Corps Reservoir Projects.
Integrated suite of real-time forecasting, modeling, operations and impact analysis models
• HEC - HMS• HEC - RAS• HEC - ResSim• HEC - FDA
CWMS V1.0 deployed to all Corps water management offices
CWMS Processes Real-Time Data for Water Management Decisions
Data ProcessingData Storage
ModelingObserved Data
Water Control Management Decisions
Instructions
SERVERS
Public and CooperatorsField Office
WeatherForecast
ProblemIdentification
Formulation of Alternatives
ImpactAssess.
Evaluation Phase 1Develop Plan of Study
Problem Identification
Formulation ofAlternatives
Impact Assess
Evaluation
Problem Identification
Formulation Alternatives
Impact Assess
Evaluation
Phase IIDevelop Intermediate Plans
Phase IIIDevelop Detailed Plans
Planning Process:Phases PLANNING IS ITERATIVE
Inventory &Forecast
FormulateAlternatives
EvaluatePlans
ComparePlans
Select Plan
FormulateAlternatives
ProblemID
FormulateAlternatives
FormulateAlternatives
FormulateAlternativesFormulate
Alternatives
EvaluatePlans
EvaluatePlans
ProblemID
EvaluatePlans
EvaluatePlans
EvaluatePlans
ComparePlans
ComparePlans
ComparePlans
ProblemID
ComparePlans
ComparePlans
Select Plan Select Plan Select Plan Select Plan
ProblemID
Select Plan
ProblemID
Inventory &Forecast
Inventory &Forecast
Inventory &Forecast
Inventory &Forecast
Inventory &Forecast
ProblemID
Time
Public InformationPublic HearingsConferences
Task Forces/Advisory Groups
Facilitation/InteractiveWorkshops
Collaboration/Mediation
Assisted Negotiations
Conciliation/Mediation
Joint Decision making
Being HeardBefore Decisions
Knowledge AboutDecisions
Having an Influenceon Decisions
Forming/Agreeingto Decisions
Low
High
Lev
el o
f Par
ticip
atio
n
Te c
hni q
ues
Levels - Techniques of Participation
9
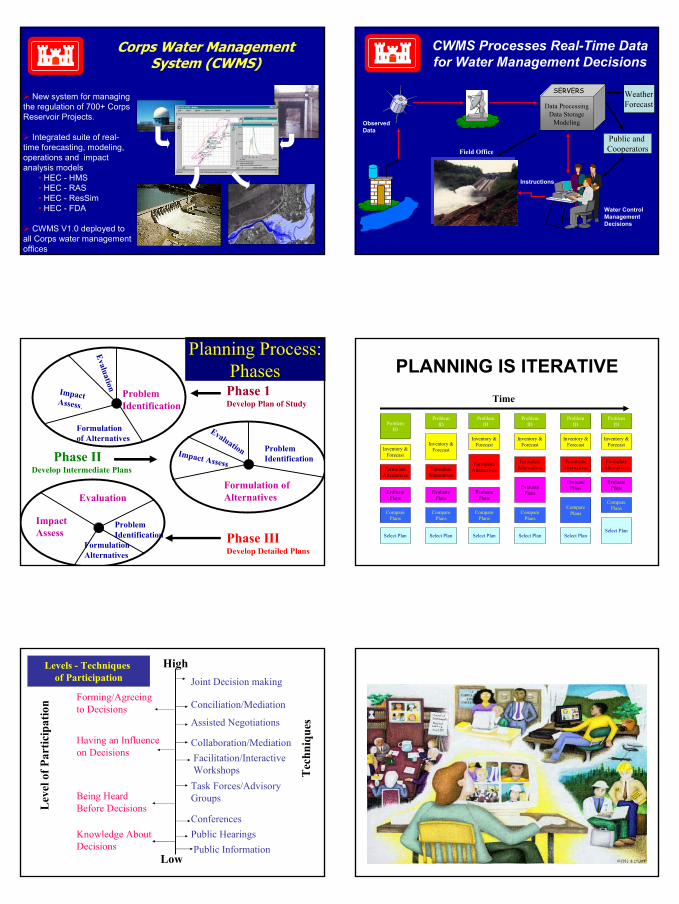
U.S. and North AmericanExperiences with RBOs From Kenney and Lord -Review of US Coordination
Mechanisms, 1994One of the most common themes permeating the
literature reviewing coordination mechanisms for US interstate water resources is the track record of these
institutional innovation is generally poor. This should not discourage further innovation, however. Addressing the
factors that fragment regional water institution is an extremely difficult task and a task normally attempted with a new coordination mechanism only after more established approaches have failed. And in those basins where a coordination mechanism has not successfully resolved the major water resources
problems, the mechanisms have generally
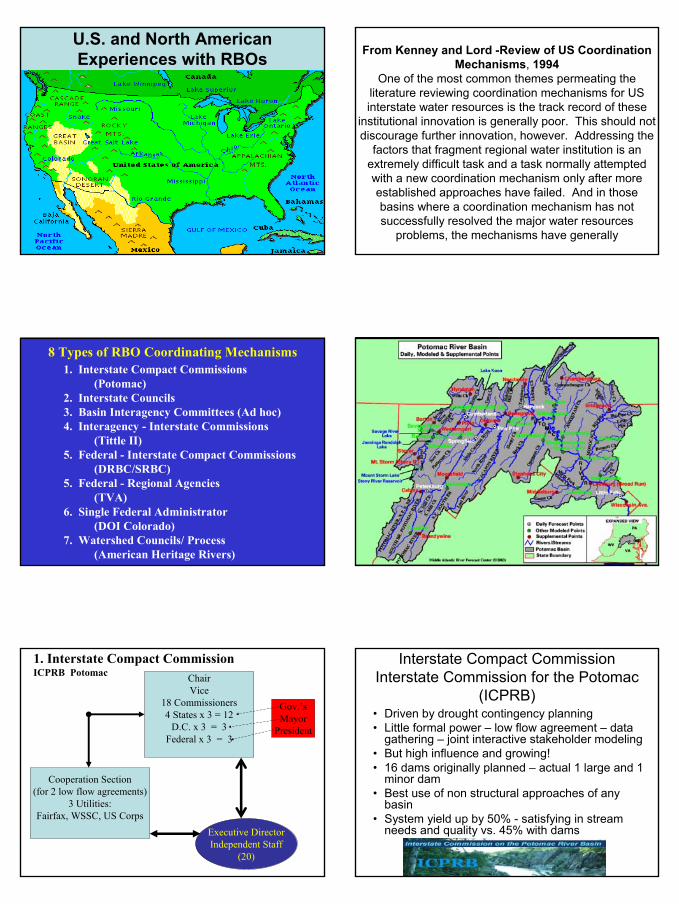
8 Types of RBO Coordinating Mechanisms1. Interstate Compact Commissions
(Potomac)2. Interstate Councils3. Basin Interagency Committees (Ad hoc)4. Interagency - Interstate Commissions
(Tittle II)5. Federal - Interstate Compact Commissions
(DRBC/SRBC)5. Federal - Regional Agencies
(TVA)6. Single Federal Administrator
(DOI Colorado)7. Watershed Councils/ Process
(American Heritage Rivers)
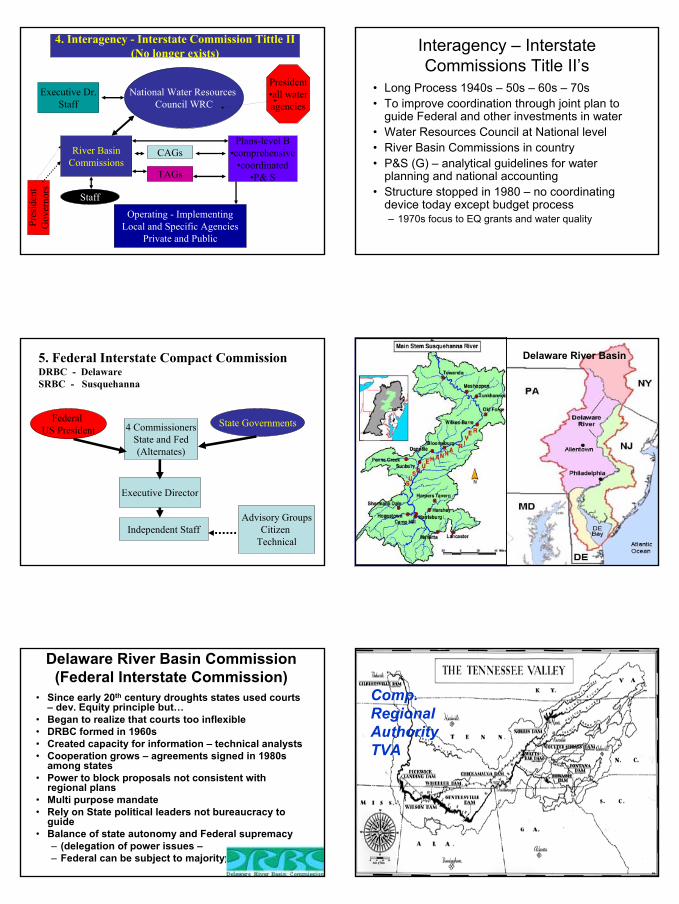
1. Interstate Compact CommissionICPRB Potomac Chair
Vice18 Commissioners4 States x 3 = 12
D.C. x 3 = 3Federal x 3 = 3
Cooperation Section(for 2 low flow agreements)
3 Utilities:Fairfax, WSSC, US Corps
Executive DirectorIndependent Staff
(20)
Gov.’sMayor
President
Interstate Compact Commission Interstate Commission for the Potomac
(ICPRB)• Driven by drought contingency planning• Little formal power – low flow agreement – data
gathering – joint interactive stakeholder modeling• But high influence and growing!• 16 dams originally planned – actual 1 large and 1
minor dam• Best use of non structural approaches of any
basin• System yield up by 50% - satisfying in stream
needs and quality vs. 45% with dams
10
4. Interagency - Interstate Commission Tittle II(No longer exists)
Executive Dr.Staff
National Water Resources Council WRC
River BasinCommissions
CAGs
TAGs
Plans-level B•comprehensive
•coordinated•P& S
Operating - ImplementingLocal and Specific Agencies
Private and Public
Staff
President•all wateragencies
Pres
ide n
tG
over
n ors
Interagency – Interstate Commissions Title II’s
• Long Process 1940s – 50s – 60s – 70s• To improve coordination through joint plan to
guide Federal and other investments in water • Water Resources Council at National level• River Basin Commissions in country• P&S (G) – analytical guidelines for water
planning and national accounting• Structure stopped in 1980 – no coordinating
device today except budget process– 1970s focus to EQ grants and water quality
5. Federal Interstate Compact CommissionDRBC - DelawareSRBC - Susquehanna
State GovernmentsFederal US President 4 Commissioners
State and Fed(Alternates)
Executive Director
Independent StaffAdvisory Groups
Citizen Technical
Delaware River Basin
Delaware River Basin Commission (Federal Interstate Commission)
• Since early 20th century droughts states used courts – dev. Equity principle but…
• Began to realize that courts too inflexible• DRBC formed in 1960s• Created capacity for information – technical analysts• Cooperation grows – agreements signed in 1980s
among states• Power to block proposals not consistent with
regional plans• Multi purpose mandate• Rely on State political leaders not bureaucracy to
guide• Balance of state autonomy and Federal supremacy
– (delegation of power issues –– Federal can be subject to majority)
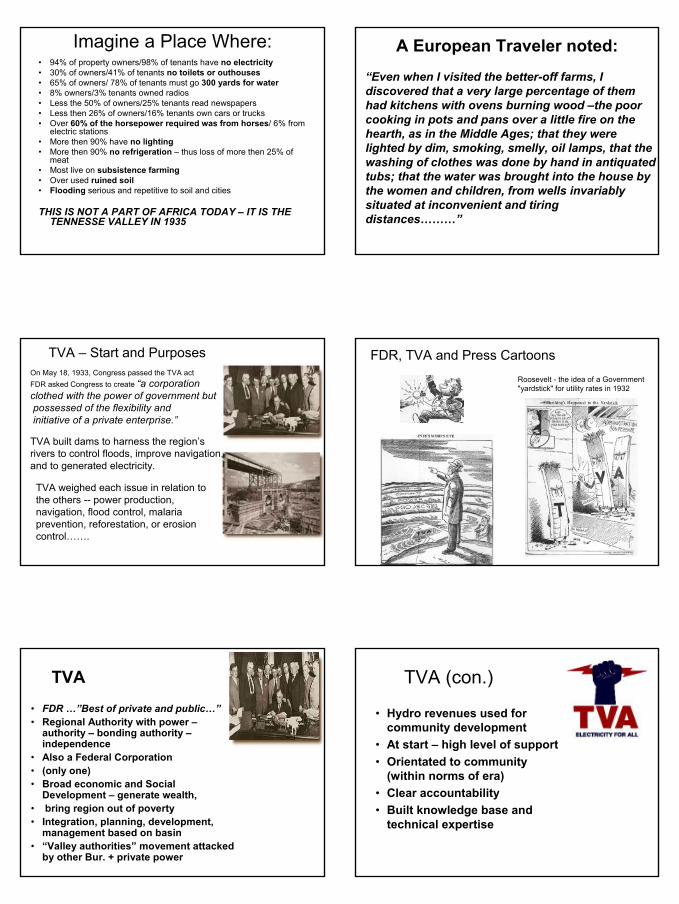
Comp. Regional AuthorityTVA
11
Imagine a Place Where:• 94% of property owners/98% of tenants have no electricity• 30% of owners/41% of tenants no toilets or outhouses• 65% of owners/ 78% of tenants must go 300 yards for water• 8% owners/3% tenants owned radios• Less the 50% of owners/25% tenants read newspapers• Less then 26% of owners/16% tenants own cars or trucks• Over 60% of the horsepower required was from horses/ 6% from
electric stations• More then 90% have no lighting• More then 90% no refrigeration – thus loss of more then 25% of
meat• Most live on subsistence farming• Over used ruined soil• Flooding serious and repetitive to soil and cities
THIS IS NOT A PART OF AFRICA TODAY – IT IS THE TENNESSE VALLEY IN 1935
A European Traveler noted:“Even when I visited the better-off farms, I discovered that a very large percentage of them had kitchens with ovens burning wood –the poor cooking in pots and pans over a little fire on the hearth, as in the Middle Ages; that they were lighted by dim, smoking, smelly, oil lamps, that the washing of clothes was done by hand in antiquated tubs; that the water was brought into the house by the women and children, from wells invariably situated at inconvenient and tiring distances………”
On May 18, 1933, Congress passed the TVA act FDR asked Congress to create “a corporation clothed with the power of government butpossessed of the flexibility andinitiative of a private enterprise.”
TVA built dams to harness the region’s rivers to control floods, improve navigation, and to generated electricity.
TVA weighed each issue in relation to the others -- power production, navigation, flood control, malaria prevention, reforestation, or erosion control…….
TVA – Start and Purposes
Roosevelt - the idea of a Government "yardstick" for utility rates in 1932
FDR, TVA and Press Cartoons
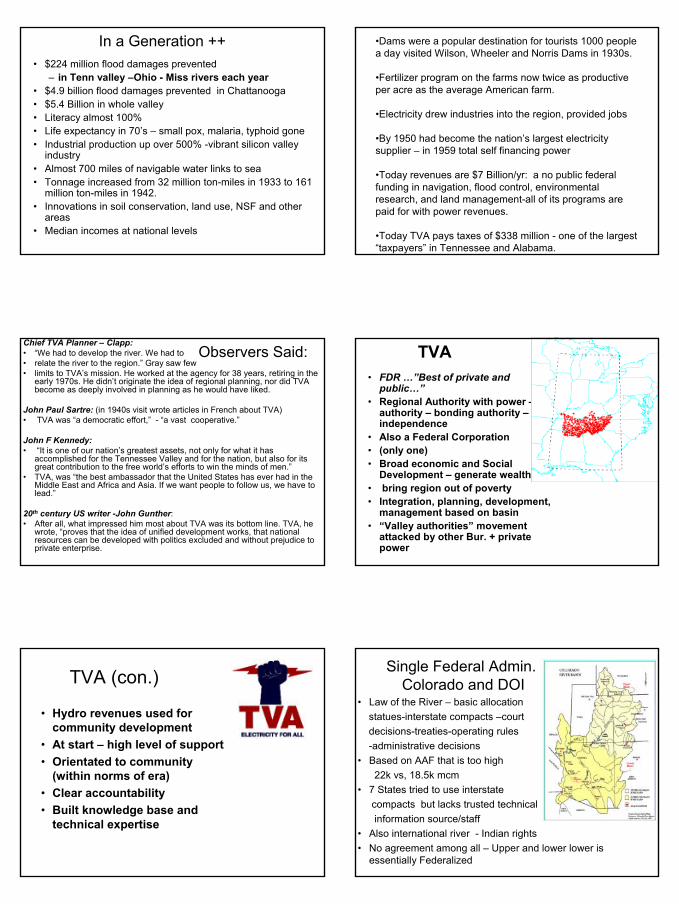
TVA• FDR …”Best of private and public…”• Regional Authority with power –
authority – bonding authority –independence
• Also a Federal Corporation • (only one)• Broad economic and Social
Development – generate wealth,• bring region out of poverty• Integration, planning, development,
management based on basin• “Valley authorities” movement attacked
by other Bur. + private power
TVA (con.)
• Hydro revenues used for community development
• At start – high level of support• Orientated to community
(within norms of era)• Clear accountability• Built knowledge base and
technical expertise
12
In a Generation ++• $224 million flood damages prevented
– in Tenn valley –Ohio - Miss rivers each year• $4.9 billion flood damages prevented in Chattanooga • $5.4 Billion in whole valley• Literacy almost 100%• Life expectancy in 70’s – small pox, malaria, typhoid gone• Industrial production up over 500% -vibrant silicon valley
industry• Almost 700 miles of navigable water links to sea• Tonnage increased from 32 million ton-miles in 1933 to 161
million ton-miles in 1942. • Innovations in soil conservation, land use, NSF and other
areas• Median incomes at national levels
•Dams were a popular destination for tourists 1000 people a day visited Wilson, Wheeler and Norris Dams in 1930s.
•Fertilizer program on the farms now twice as productive per acre as the average American farm.
•Electricity drew industries into the region, provided jobs
•By 1950 had become the nation’s largest electricity supplier – in 1959 total self financing power
•Today revenues are $7 Billion/yr: a no public federal funding in navigation, flood control, environmental research, and land management-all of its programs are paid for with power revenues.
•Today TVA pays taxes of $338 million - one of the largest “taxpayers” in Tennessee and Alabama.
Observers Said:Chief TVA Planner – Clapp:• “We had to develop the river. We had to • relate the river to the region.” Gray saw few • limits to TVA’s mission. He worked at the agency for 38 years, retiring in the
early 1970s. He didn’t originate the idea of regional planning, nor did TVA become as deeply involved in planning as he would have liked.
John Paul Sartre: (in 1940s visit wrote articles in French about TVA)• TVA was “a democratic effort,” - “a vast cooperative.”
John F Kennedy:• “It is one of our nation’s greatest assets, not only for what it has
accomplished for the Tennessee Valley and for the nation, but also for its great contribution to the free world’s efforts to win the minds of men.”
• TVA, was “the best ambassador that the United States has ever had in the Middle East and Africa and Asia. If we want people to follow us, we have to lead.”
20th century US writer -John Gunther:• After all, what impressed him most about TVA was its bottom line. TVA, he
wrote, “proves that the idea of unified development works, that nationalresources can be developed with politics excluded and without prejudice to private enterprise.
TVA• FDR …”Best of private and
public…”• Regional Authority with power –
authority – bonding authority –independence
• Also a Federal Corporation • (only one)• Broad economic and Social
Development – generate wealth,• bring region out of poverty• Integration, planning, development,
management based on basin• “Valley authorities” movement
attacked by other Bur. + private power
TVA (con.)
• Hydro revenues used for community development
• At start – high level of support• Orientated to community
(within norms of era)• Clear accountability• Built knowledge base and
technical expertise
Single Federal Admin.Colorado and DOI
• Law of the River – basic allocationstatues-interstate compacts –court decisions-treaties-operating rules-administrative decisions
• Based on AAF that is too high 22k vs, 18.5k mcm
• 7 States tried to use interstate compacts but lacks trusted technical information source/staff
• Also international river - Indian rights• No agreement among all – Upper and lower lower is
essentially Federalized
13
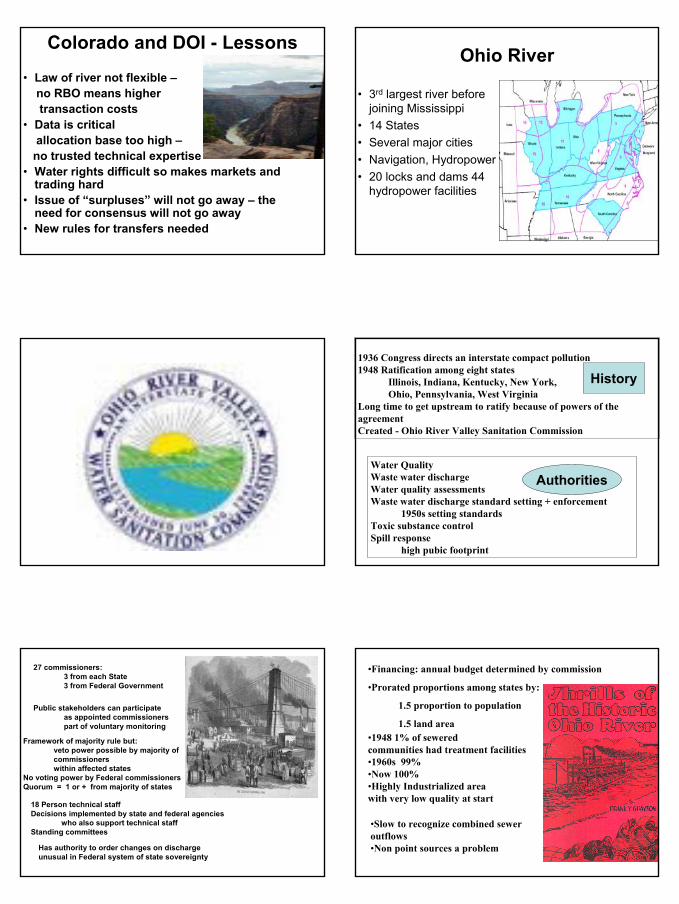
Colorado and DOI - Lessons
• Law of river not flexible –no RBO means higher transaction costs
• Data is critical allocation base too high –no trusted technical expertise
• Water rights difficult so makes markets and trading hard
• Issue of “surpluses” will not go away – the need for consensus will not go away
• New rules for transfers needed
Ohio River
• 3rd largest river before joining Mississippi
• 14 States • Several major cities • Navigation, Hydropower• 20 locks and dams 44
hydropower facilities
1936 Congress directs an interstate compact pollution1948 Ratification among eight states
Illinois, Indiana, Kentucky, New York, Ohio, Pennsylvania, West Virginia
Long time to get upstream to ratify because of powers of the agreementCreated - Ohio River Valley Sanitation Commission
Water QualityWaste water dischargeWater quality assessmentsWaste water discharge standard setting + enforcement
1950s setting standardsToxic substance controlSpill response
high pubic footprint
Authorities
History
27 commissioners:3 from each State3 from Federal Government
Public stakeholders can participateas appointed commissionerspart of voluntary monitoring
Framework of majority rule but:veto power possible by majority of commissioners within affected states
No voting power by Federal commissionersQuorum = 1 or + from majority of states
18 Person technical staffDecisions implemented by state and federal agencies
who also support technical staffStanding committees
Has authority to order changes on discharge unusual in Federal system of state sovereignty
•1948 1% of seweredcommunities had treatment facilities•1960s 99% •Now 100%•Highly Industrialized area with very low quality at start
•Slow to recognize combined sewer outflows•Non point sources a problem
•Financing: annual budget determined by commission
•Prorated proportions among states by:
1.5 proportion to population
1.5 land area
14
Watershed vs. RBO
Geographic Scope:
Level of Authority:
Participants:
Legal basis:
Issues/services addressed:
Catalyst events:
R.B. is a watershedNot all watersheds are R.B’s
less more
Broader mixpublic + non public
More focused on formal public
Informal Formal
Multi-issuemore local
Multi- issuemore regional
•Droughts, floods,•Fragmentation
•Demographic mismatching
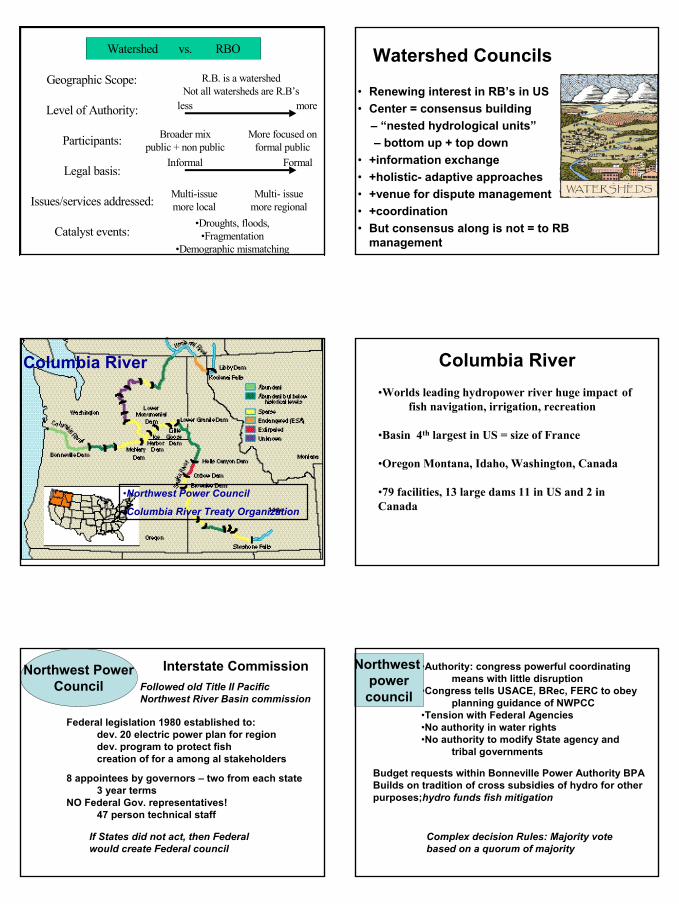
Watershed Councils
• Renewing interest in RB’s in US• Center = consensus building
– “nested hydrological units”– bottom up + top down
• +information exchange• +holistic- adaptive approaches• +venue for dispute management• +coordination• But consensus along is not = to RB
management
Columbia River
•Northwest Power Council
•Columbia River Treaty Organization
Columbia River•Worlds leading hydropower river huge impact of
fish navigation, irrigation, recreation
•Basin 4th largest in US = size of France
•Oregon Montana, Idaho, Washington, Canada
•79 facilities, 13 large dams 11 in US and 2 in Canada
Interstate CommissionFollowed old Title II Pacific Northwest River Basin commission
Federal legislation 1980 established to:dev. 20 electric power plan for regiondev. program to protect fish creation of for a among al stakeholders
8 appointees by governors – two from each state3 year terms
NO Federal Gov. representatives!47 person technical staff
If States did not act, then Federal would create Federal council
Northwest PowerCouncil
•Authority: congress powerful coordinating means with little disruption
•Congress tells USACE, BRec, FERC to obey planning guidance of NWPCC
•Tension with Federal Agencies•No authority in water rights•No authority to modify State agency and
tribal governments
Budget requests within Bonneville Power Authority BPABuilds on tradition of cross subsidies of hydro for other purposes;hydro funds fish mitigation
Complex decision Rules: Majority vote based on a quorum of majority
Northwest powercouncil
15
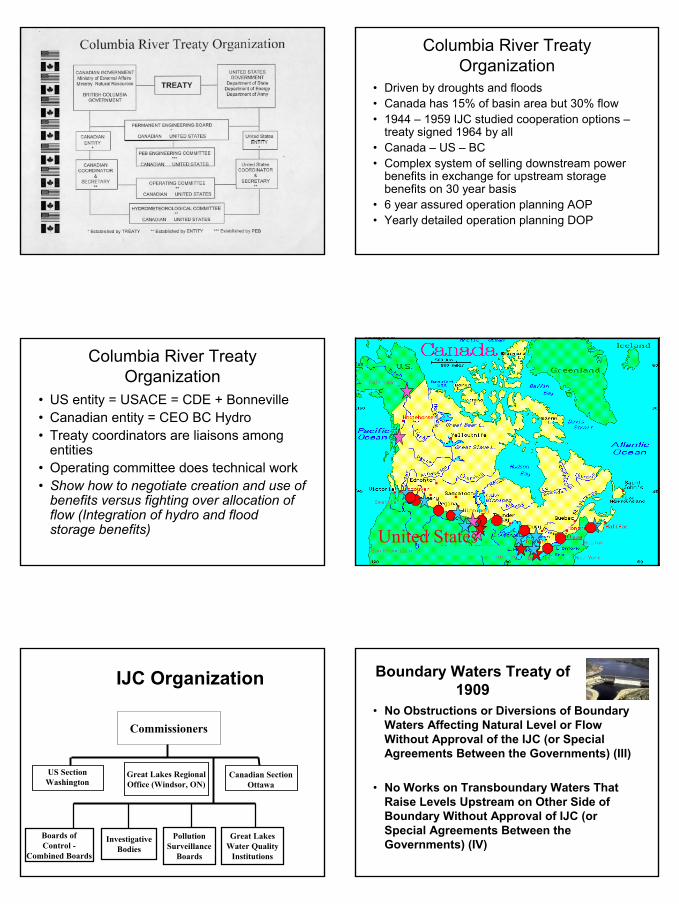
Columbia River Treaty Organization
• Driven by droughts and floods• Canada has 15% of basin area but 30% flow• 1944 – 1959 IJC studied cooperation options –
treaty signed 1964 by all• Canada – US – BC• Complex system of selling downstream power
benefits in exchange for upstream storage benefits on 30 year basis
• 6 year assured operation planning AOP• Yearly detailed operation planning DOP
Columbia River Treaty Organization
• US entity = USACE = CDE + Bonneville• Canadian entity = CEO BC Hydro• Treaty coordinators are liaisons among
entities• Operating committee does technical work• Show how to negotiate creation and use of
benefits versus fighting over allocation of flow (Integration of hydro and flood storage benefits) United States
IJC Organization
Commissioners
US SectionWashington
Canadian SectionOttawa
Great Lakes RegionalOffice (Windsor, ON)
Boards ofControl -
Combined Boards
InvestigativeBodies
PollutionSurveillance
Boards
Great LakesWater Quality
Institutions
Boundary Waters Treaty of 1909
• No Obstructions or Diversions of Boundary Waters Affecting Natural Level or Flow Without Approval of the IJC (or Special Agreements Between the Governments) (III)
• No Works on Transboundary Waters That Raise Levels Upstream on Other Side of Boundary Without Approval of IJC (or Special Agreements Between the Governments) (IV)
16
• IJC is obligated to Protect Interests on One side of the Boundary from Actions on the Other Side
• IJC Will Observe Precedence of Uses:– Domestic and Sanitary– Navigation– Power and Irrigation (VIII)
Boundary Waters Treatyof 1909
IBWC International Boundary Waters Commission
• Two commissioners –licensed engineers
• Neutrality + expertise• Pressure to more
activist• More on environmental• Broader public access
to its deliberations
Canada – Prairie Water Board (PWB)• Monitors flows, provides oversight on water quality, advises on
disputes, uses fact-finding and technical committees. • Built on a master agreement among the Canadian Prairie
provinces of Alberta, Saskatchewan and Manitoba. • Within master allocation agreement, provinces reach bilateral
agreements. Requirements defined at the borders of jurisdictions.
• Each jurisdiction manages their own water in inside their jurisdiction.
• The PWB monitors flow at the borders.• Operates by consensus. It maintains strong technically credible
support. • Flexible - rules can be redefined as it grows. • Dispute resolution mechanisms are defined. • Facilitates information exchange. • Many of these lessons are echoed in other basin initiatives.
Indeed, a similar process is underway on the Mackenzie River.
Restoring the Environment
e heard:
• Ecosystems continue to be destroyed
• Lack of environmental data
• Coordination between agencies
• Treat environmental benefits the same as economic benefits
From Preservation to Design
Restoring the Environment• Over 53% of wetlands have
been lost as a result of human actions
• About 35% of all endangered species live in or depend on wetlands
• Watershed approach is required to understand cumulative impacts
• Wetlands provide annual benefits of $14.8 billion
Suggested Actions• Watershed approach• Funding for assessing and
monitoring– Environmental health– Testing mitigation techniques– Develop environmental
friendly technologies• Educate public on env. issues• Collaborate with other agencies
- consistency in environmental regulations
• Make environment a co-equal with economic benefits
17
Suggested Actions• Incorporation of sustainability principles• Reducing time lags and delivering
projects faster• Full stakeholder participation in
Decision making and early participation• Beyond “impact fixation” Include
consideration of economic and social and environmental benefits during project formulation
• More consistent interpretation of NED benefits
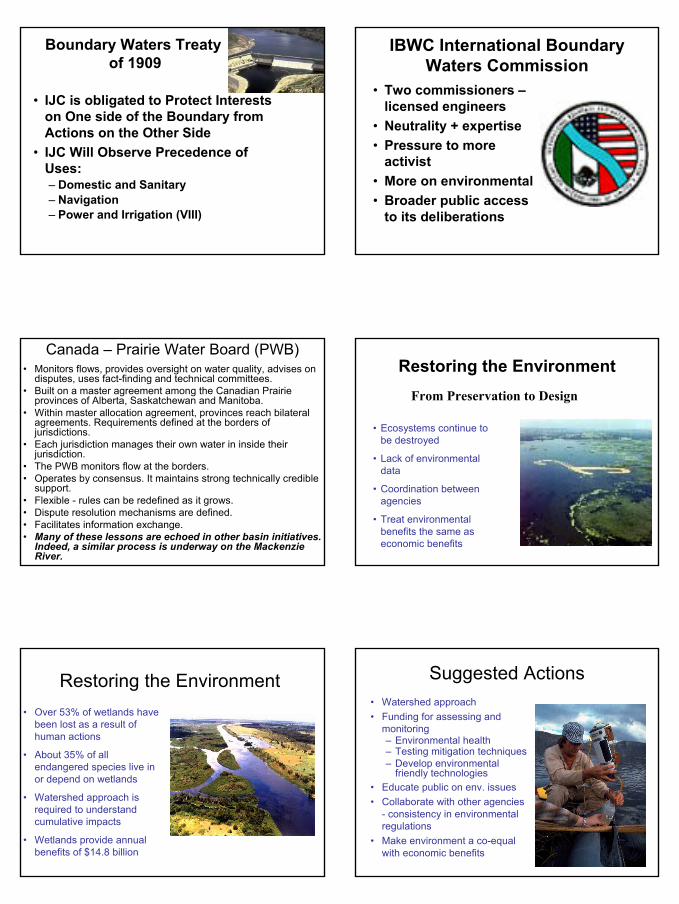
ComprehensiveEverglades Restoration Plan
ComprehensiveComprehensiveEverglades Restoration PlanEverglades Restoration Plan
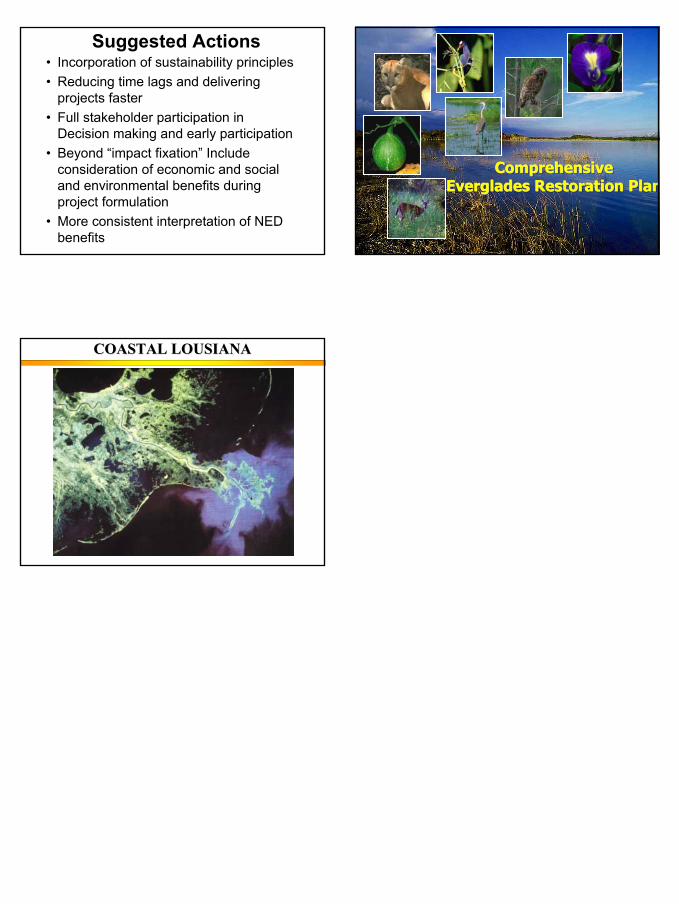
COASTAL LOUSIANACOASTAL LOUSIANA