Embed Size (px)
Citation preview
Water resources planning and management in Africa in the context of climate change
Challenges, initiatives and management tools
___________________________________Abou AMANI, ing, Ph.D
Natural Science programme Specialist
UNESCO Accra office (Sierra Leone, Liberia, Cote d’ivoire, Ghana, Togo and Benin)
GHANA
E-mail: [email protected]
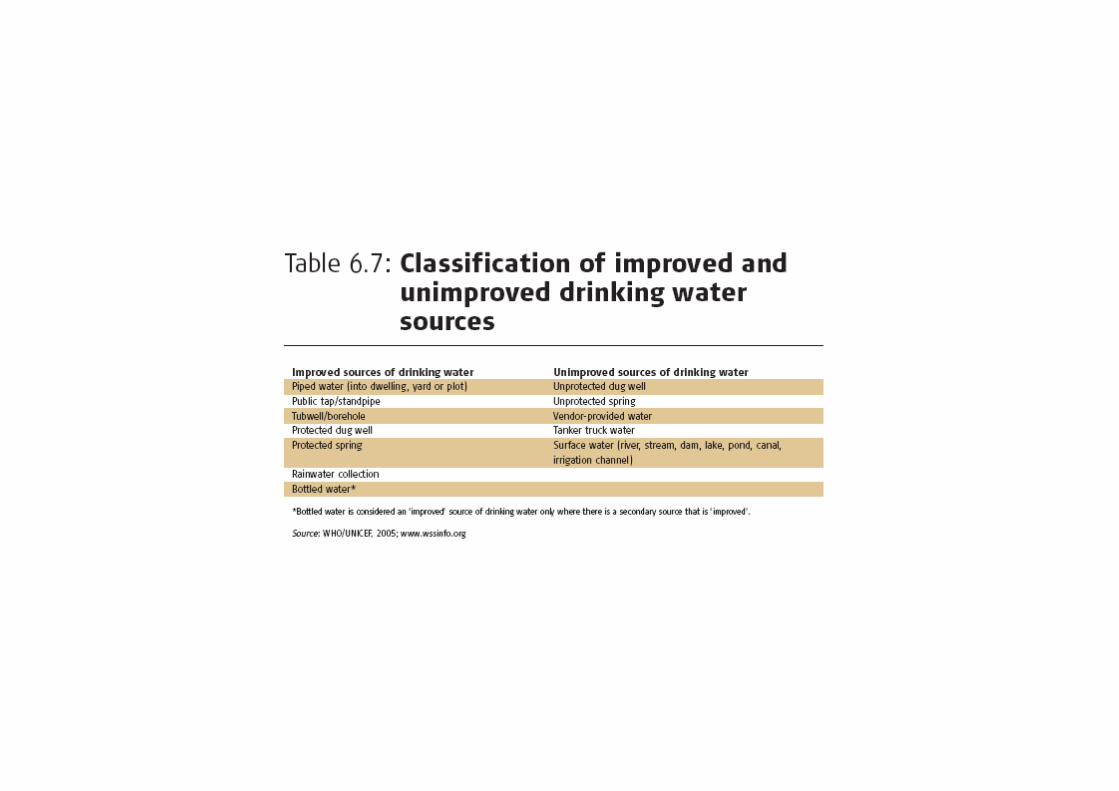
Some realities• Around 40% of the population in WA have not
access to clean water (around 100 million inhabitants)
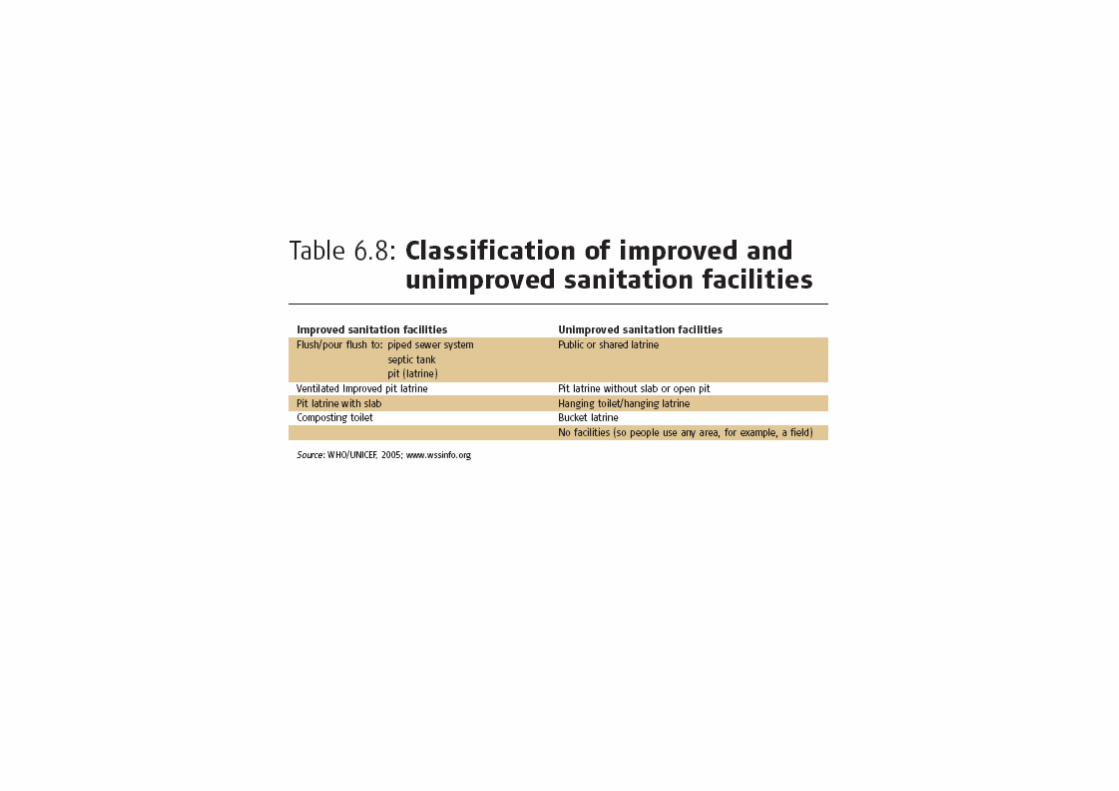
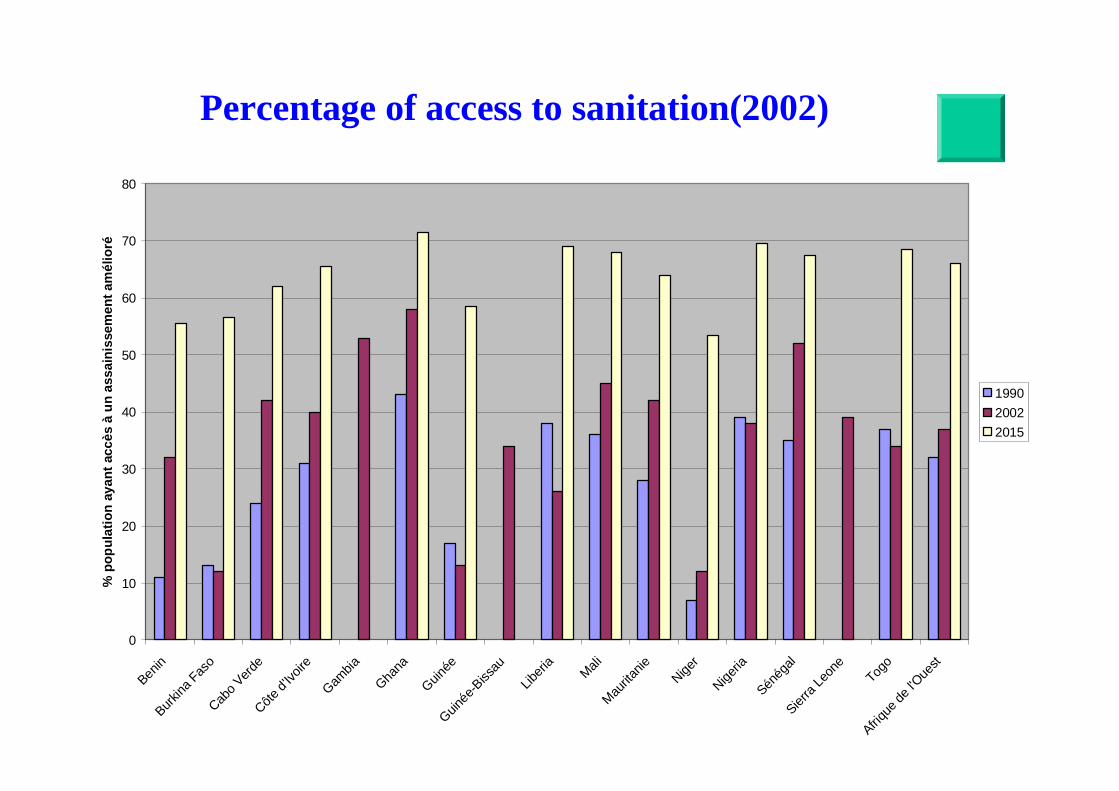
• 60% for sanitation• More than 80% of deseases are water related
diseases (Malaria, cholera, Guinea Worm,..;);• Many countries are still struggling to cope to food
insecurity;
• Less than 4% of renewable WR are mobilized in WA;
• Only around 10% of irriguable lands are irriguatedin WA;
• Only 16% of hydro-power potential are mobilized.Ecowas water policy (2007)
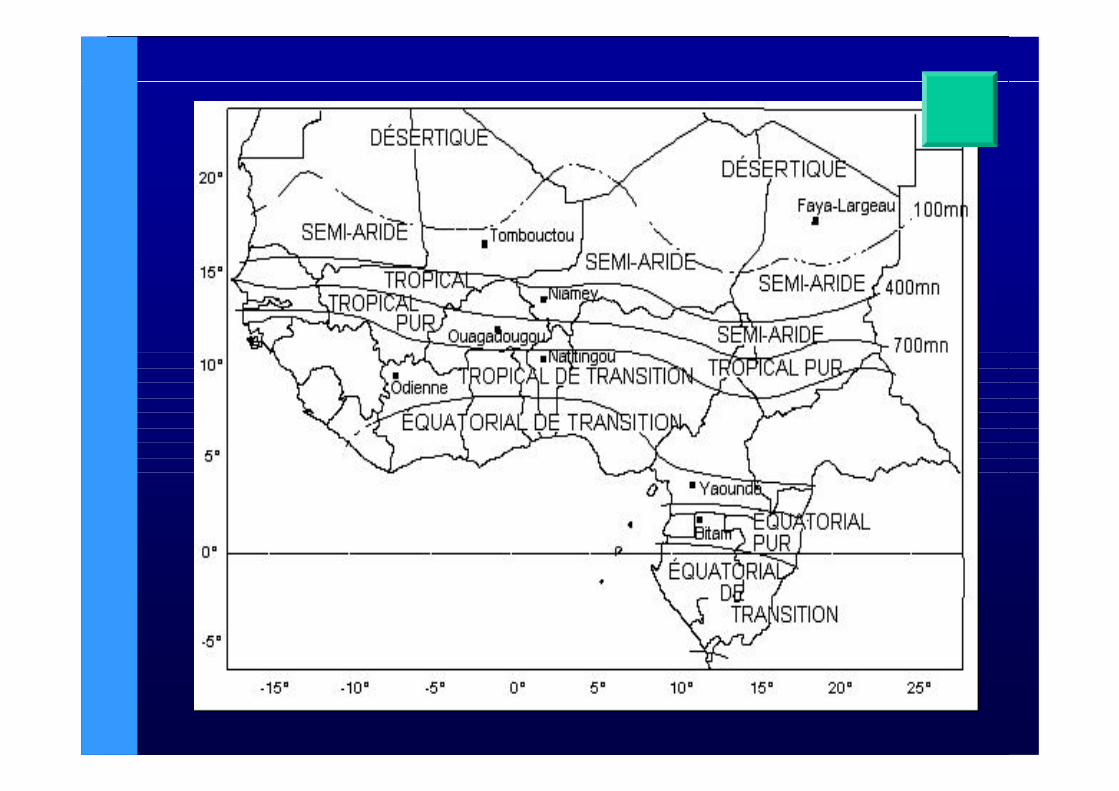
Importance of climate in WAAround 70% of the population in WA are rural
population with agriculture and livestock as main activities;
Agriculture in WA is essentially rainfed and istherefore highly vulnerable with climatefluctuations;
Livestock is greatly sensitive to the availability of Biomass and water resources;
The primary Sector contributes to around 35% of the GDP of many countries in WA and is an important factor of economic growth.
Rainy season is an important factor in the region
IPCC(2001, 2007) have qualified Africa as the most vulnerable continent to climate change
Plan of the presentation• Characteristics of WR in WA• Climate Variability and its impacts • Climate change / Global change and its
impacts• Africa Water Vision 2025• Research priorities• Institutionnal interventions• Operational and Scientific interventions• Management Tools
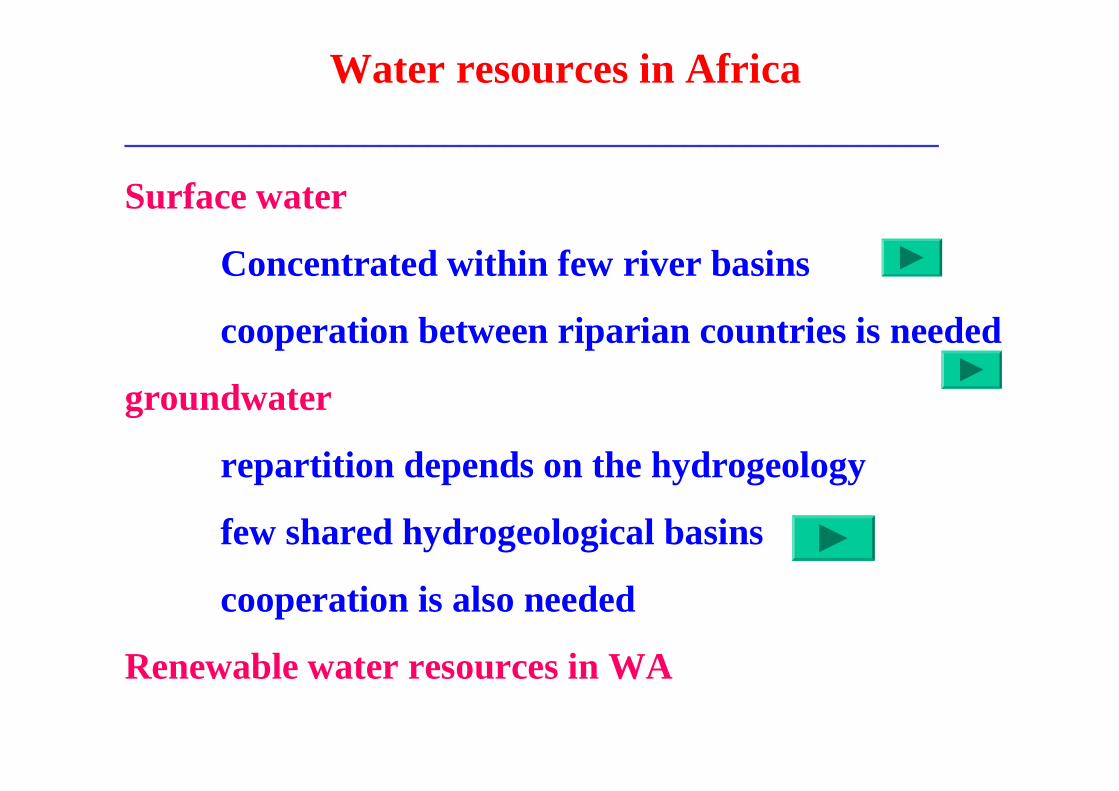
Water resources in Africa___________________________________________________
Surface water
Concentrated within few river basins
cooperation between riparian countries is needed
groundwater
repartition depends on the hydrogeology
few shared hydrogeological basins
cooperation is also needed
Renewable water resources in WA
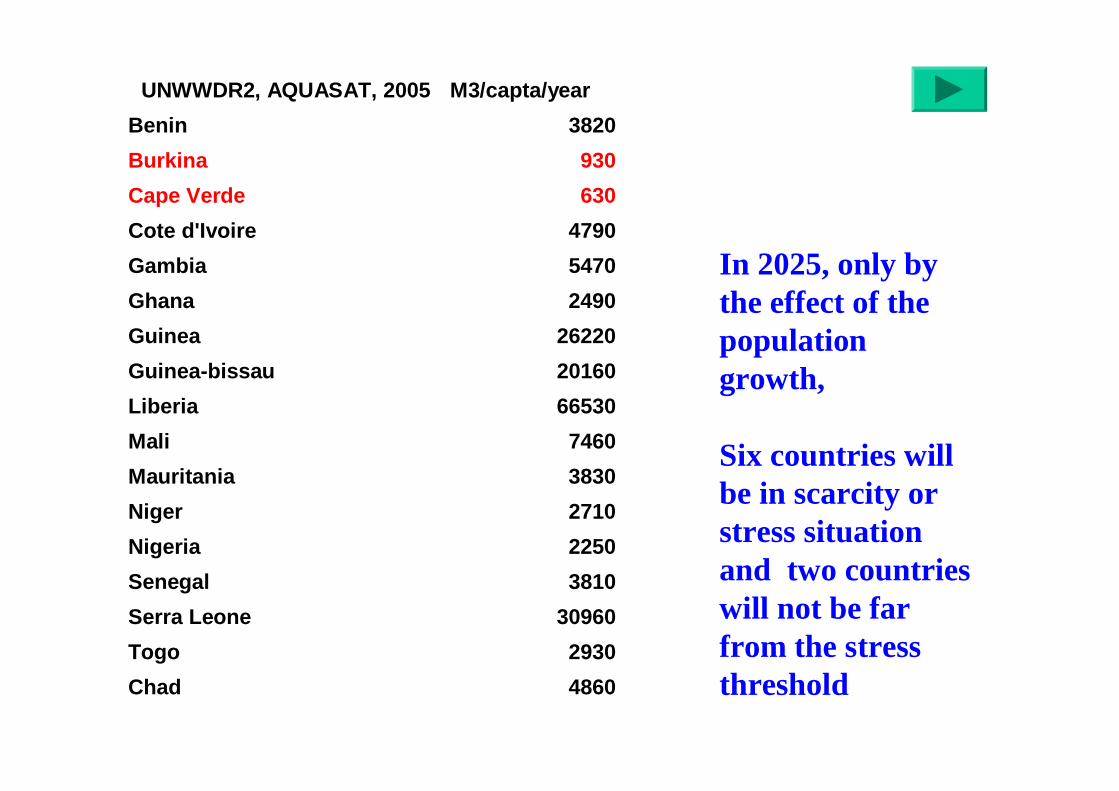
UNWWDR2, AQUASAT, 2005 M3/capta/yearBenin 3820Burkina 930Cape Verde 630Cote d'Ivoire 4790Gambia 5470Ghana 2490Guinea 26220Guinea-bissau 20160Liberia 66530Mali 7460Mauritania 3830Niger 2710Nigeria 2250Senegal 3810Serra Leone 30960Togo 2930Chad 4860
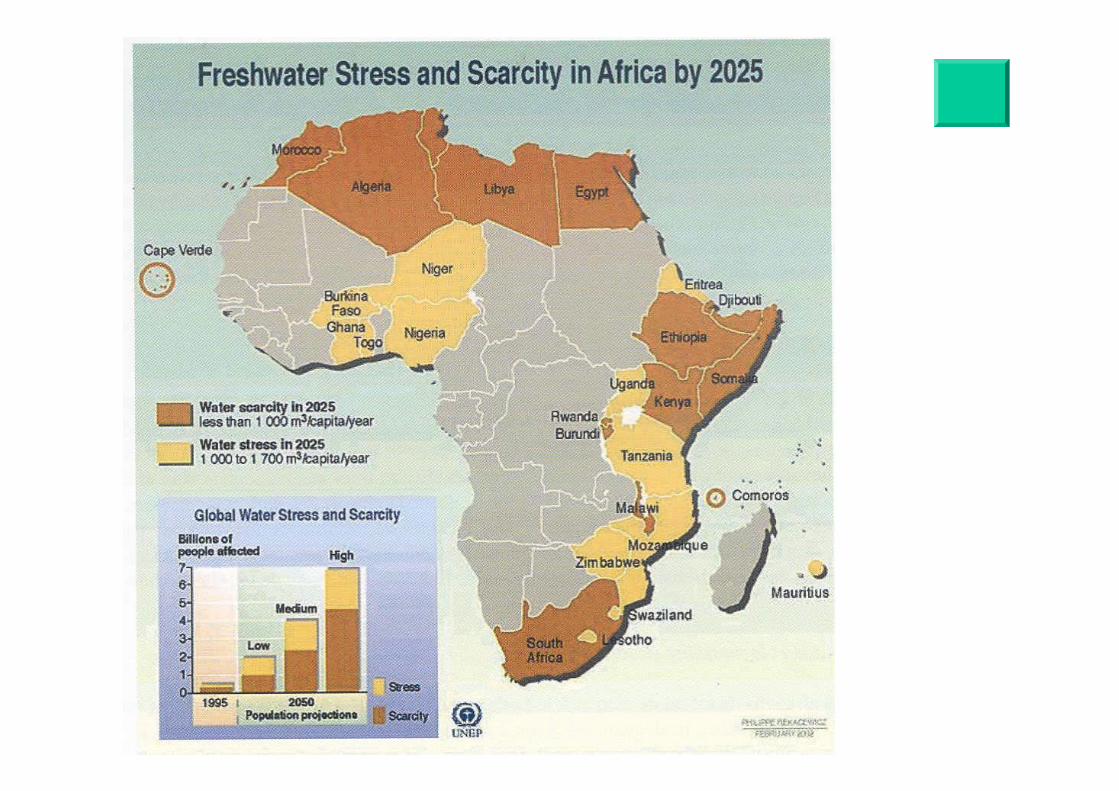
In 2025, only by the effect of the population growth,
Six countries will be in scarcity or stress situation and two countries will not be far from the stress threshold
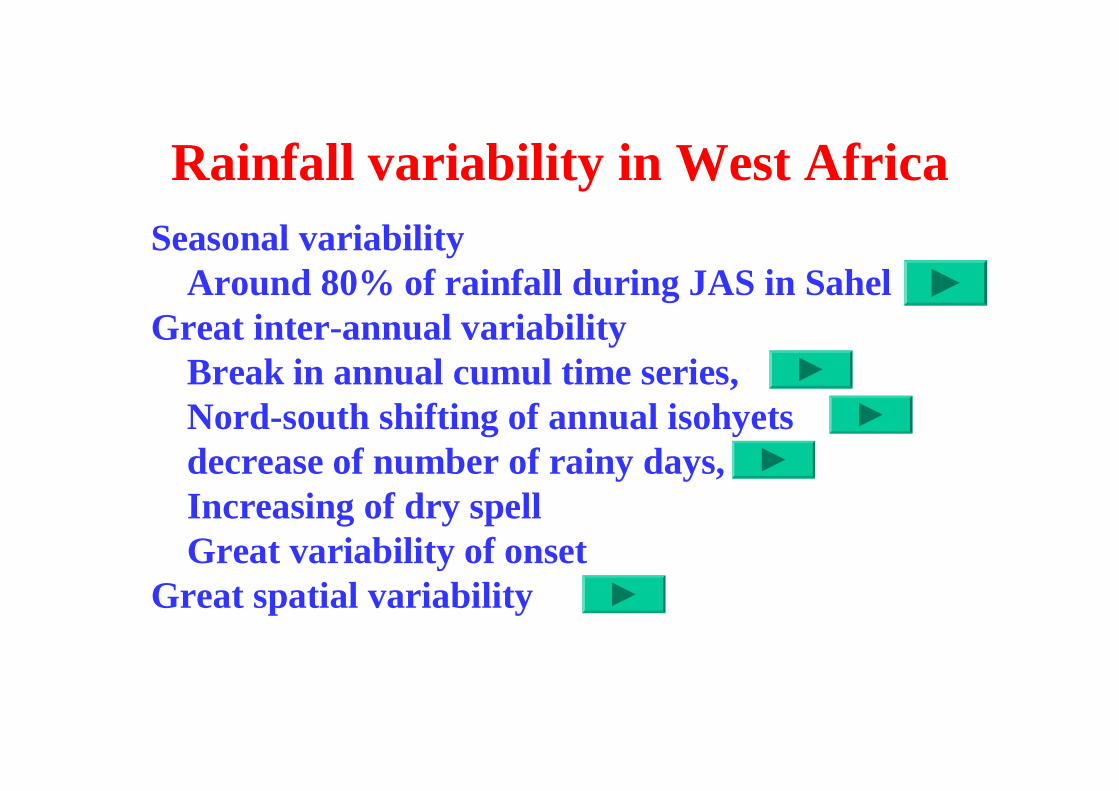
Rainfall variability in West AfricaSeasonal variability
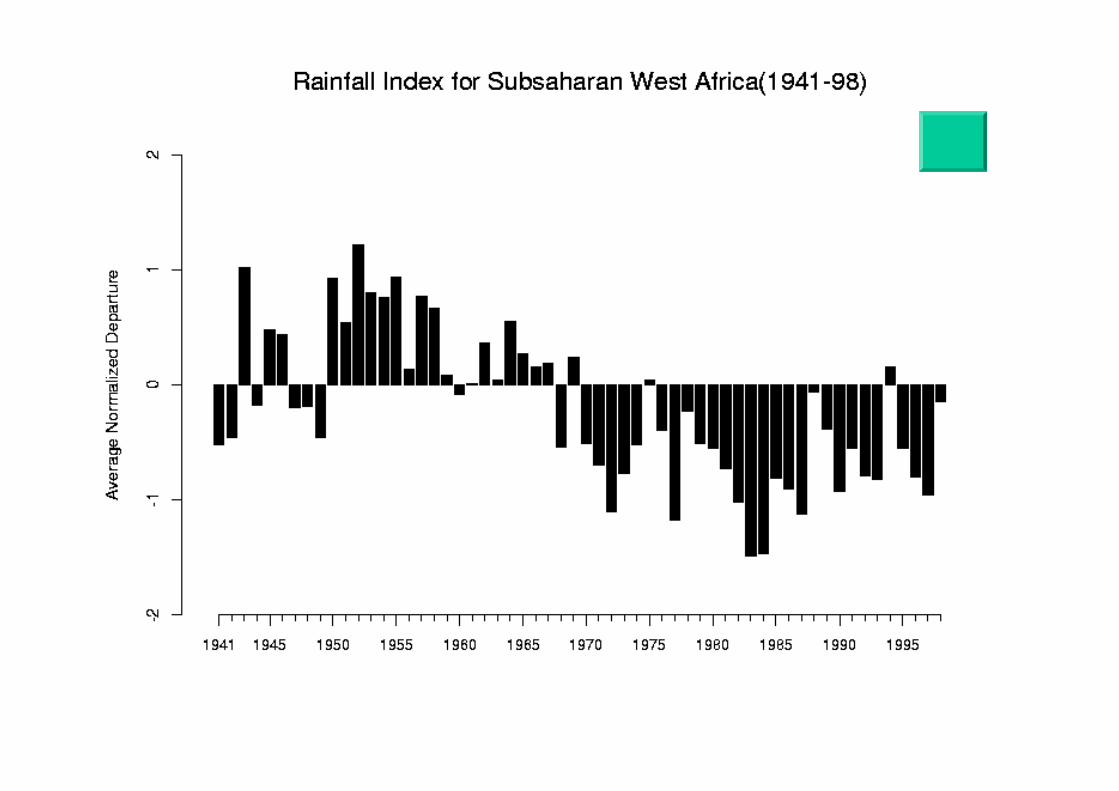
Around 80% of rainfall during JAS in SahelGreat inter-annual variability
Break in annual cumul time series, Nord-south shifting of annual isohyetsdecrease of number of rainy days,Increasing of dry spellGreat variability of onset
Great spatial variability
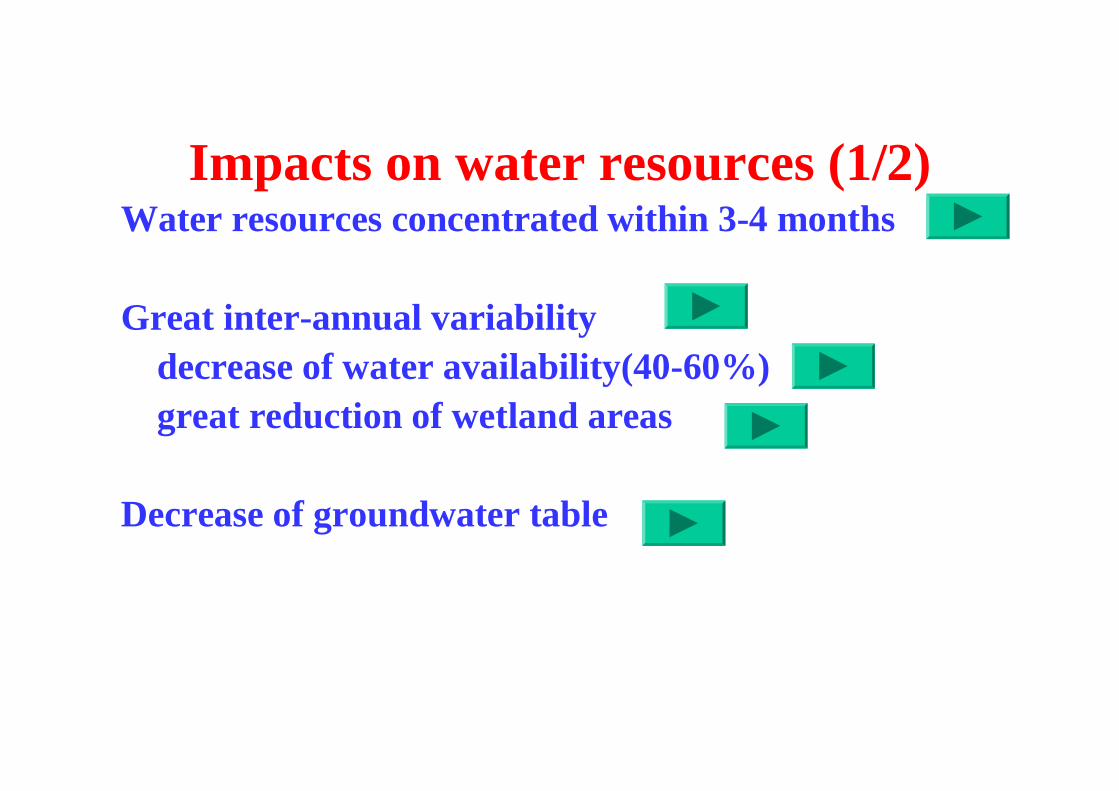
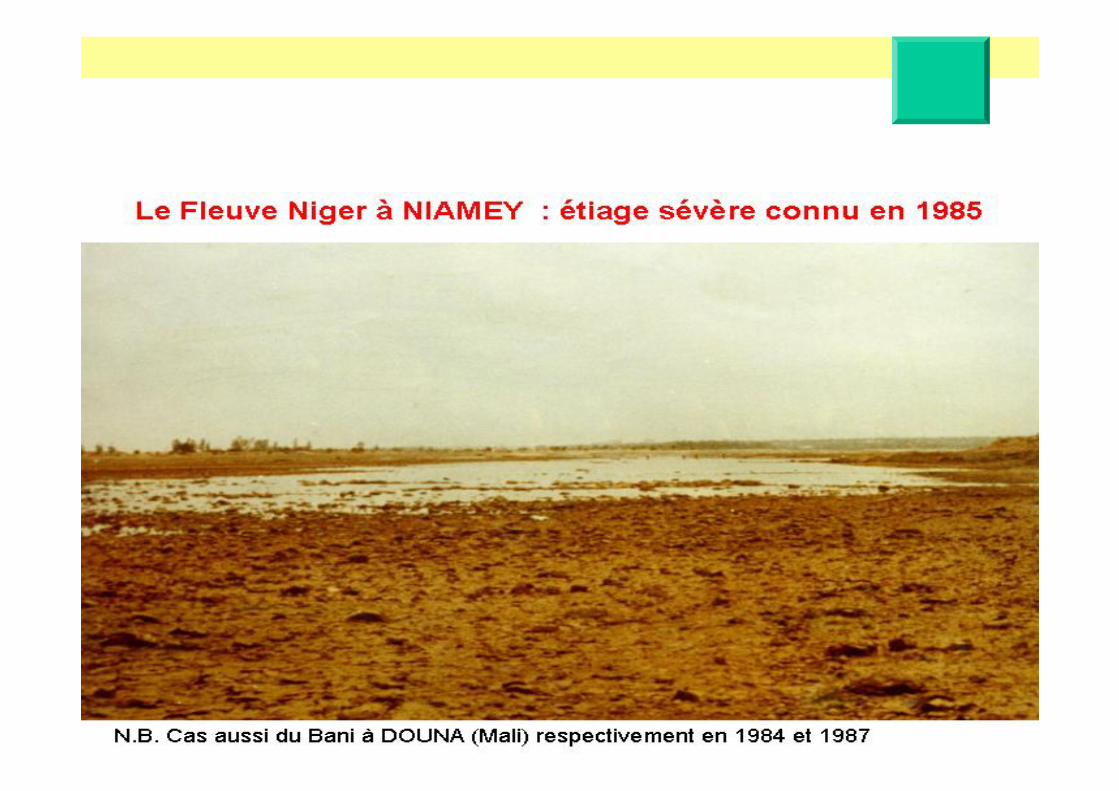
Impacts on water resources (1/2)Water resources concentrated within 3-4 months
Great inter-annual variabilitydecrease of water availability(40-60%)great reduction of wetland areas
Decrease of groundwater table
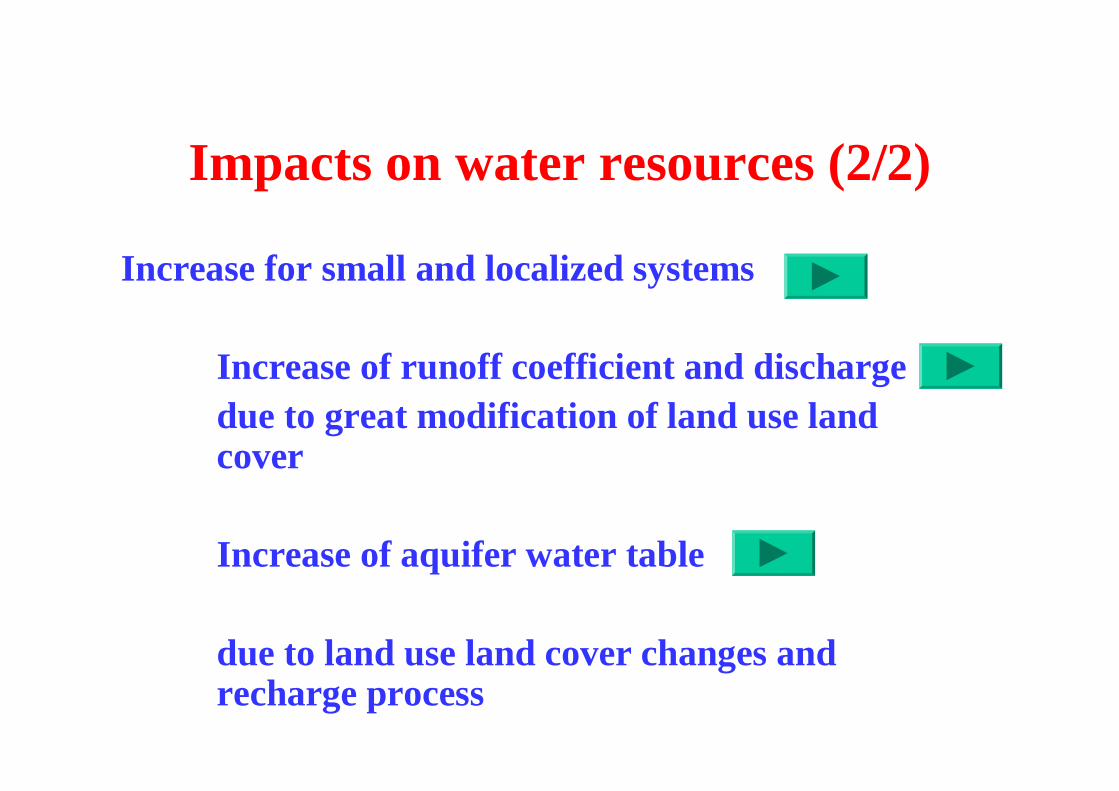
Impacts on water resources (2/2)
Increase for small and localized systems
Increase of runoff coefficient and dischargedue to great modification of land use land cover
Increase of aquifer water table
due to land use land cover changes and recharge process

Future?
What is the future evolution?
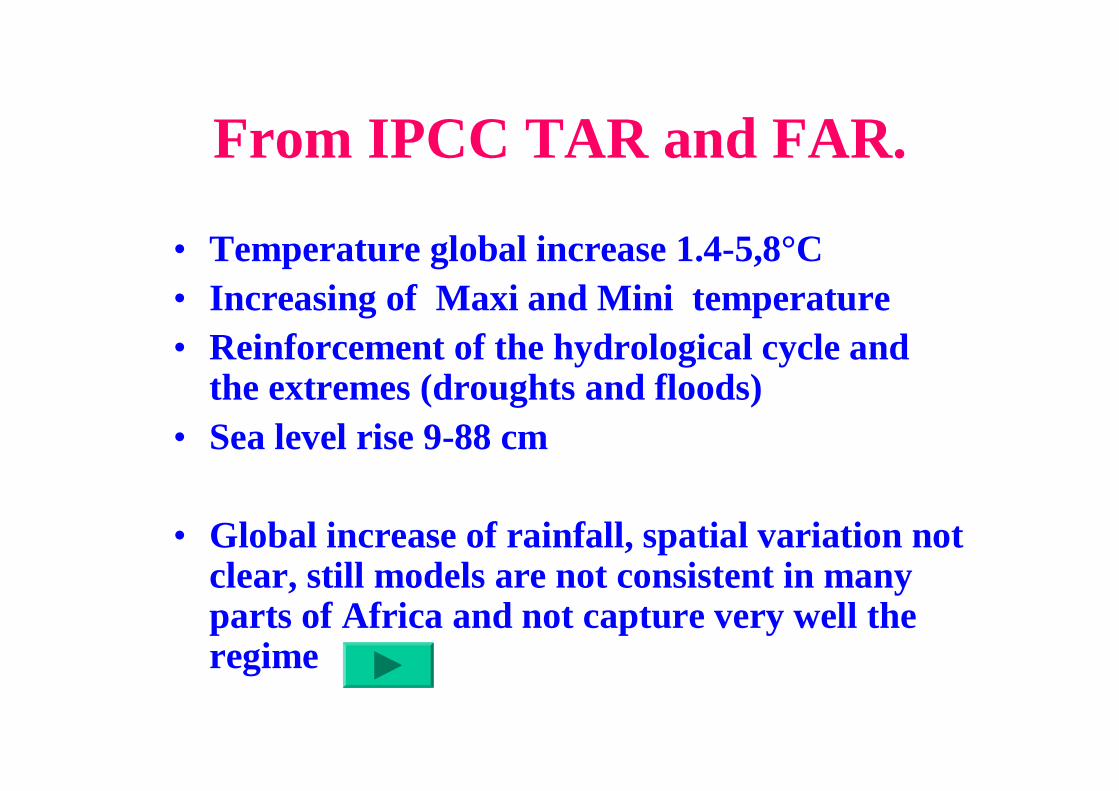
From IPCC TAR and FAR.
• Temperature global increase 1.4-5,8°C • Increasing of Maxi and Mini temperature• Reinforcement of the hydrological cycle and
the extremes (droughts and floods)• Sea level rise 9-88 cm
• Global increase of rainfall, spatial variation not clear, still models are not consistent in manyparts of Africa and not capture very well the regime
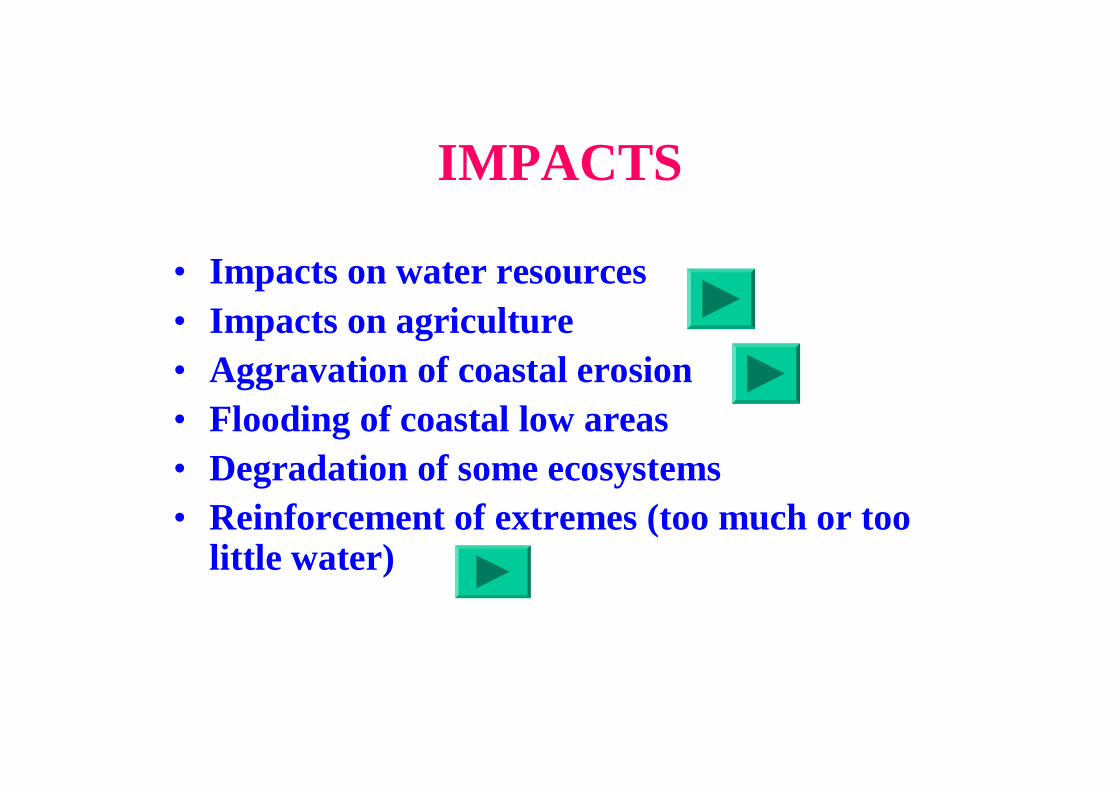
IMPACTS
• Impacts on water resources• Impacts on agriculture• Aggravation of coastal erosion• Flooding of coastal low areas• Degradation of some ecosystems• Reinforcement of extremes (too much or too
little water)
Adaptation: A necessity– Climate change is a reality – Ecosystems continue to be degradated– Great vulnerability of the population vis-à-
vis climate change;– Different water uses and more competion
with the increasing of populuatin needsIntegrated Water resources Management
(IWRM) a systematic process for the sustainable development, allocation and monitoring of water resource use in the context of social, economic and environmental objectives.
Africa Water Vision 2025
AN AFRICA WHERE THERE IS AN EQUITABLE AND SUSTAINABLE USE AND MANAGEMENT OF WATER RESOURCES FOR POVERTY ALLEVIATION, SOCIOECONOMIC DEVELOPMENT, REGIONAL COOPERATION, AND THE ENVIRONMENT.
A vision1. There is sustainable access to a safe and adequate water
supply and sanitation to meet the basic needs of all;2. Water inputs towards food and energy security are
readily available;3. Water for sustaining ecosystems and biodiversity is
adequate in quantity and quality;4. Water-resources institutions have been reformed to
create an enabling environment for effective and integrated management of water in national and trans-boundary water basins, including management at the lowest appropriate level;
5. Water basins serve as a basis for regional cooperation and development, and are treated as natural assets for all within such basins;
A vision6. There is an adequate number of motivated and highly
skilled water professionals;7. There is an effective and financially sustainable system
for data collection, assessment and dissemination for national and trans-boundary water basins;
8. There are effective and sustainable strategies for addressing natural and man-made problems affecting water resources, including climate variability and change;
9. Water is financed and priced to promote equity, efficiency, and sustainability;
10. There is political will, public awareness and commitment among all for sustainable management of water resources, including the mainstreaming of gender issues and youth concerns and the use of participatory approaches.
Research priorities• Improvement of knowledge on climate and its impacts
(Ex: Programme AMMA);• Improvement of knowledge on the water resources and
particularly on groundwater;• Tools for decision making for sustainable management of
water resources;• Promotion of IWRM and ecosystem approach for the
management of water resources and wetlands;• Identification, promotion and diffusion of technologies
and appropriate measures for adaptation to climatechange;
Institutional initiatives• AMCOW (Committee of African Ministers in
charge of Water)• African Water Facility hosted by African
Development Bank• African Commisssion on Groundwater• African water week• Creation of River basin organizations (OMVS,
OMVG, NBA, VBA, LCBC, ..), RAOB • Creation of Water Coordination Unit for ECOWAS
and SADC• UN-Water / Africa• National, sub-regional water partnerships (IWRM)
Operational and research initiatives
• WHYCOS (SADC, IGAD, CONGO, NIGER, VOLTA, LCBC, OMVS);
• FORA on seasonal forecast (PRESAO, PRESAC, South, East, North)
• FRIEND for hydrology and water resources (SADC, AOC, Nile)
• ISARM (SADC, AOC), GRAPHIC, TIGER
• RIPIESCA, ACCA• AMMA: research on African Monsoon
and its impacts
Some Tools
TDA/SAP for IWRM• IDF curves and Flood frequency Analysis Need to take into account climate change
dimension• Early Warning Systems
– Flood– Drought : Africa Drought Monitor – Seasonal forecast : PRESAO
Find more
AMMA (http://www.ird.ne/ammanet)
PRESAO (http://www.acmad.ne; http://www.agrhymet.ne) ;
WWDR (http://www.unesco.org/water) ;
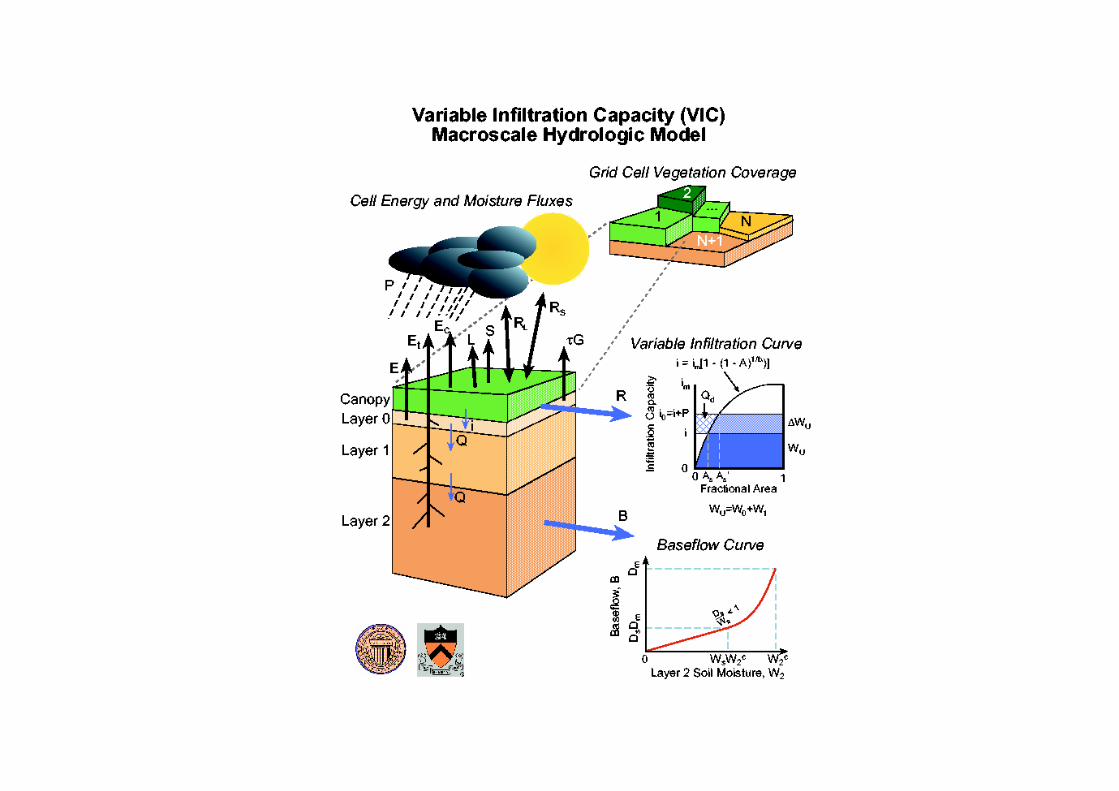
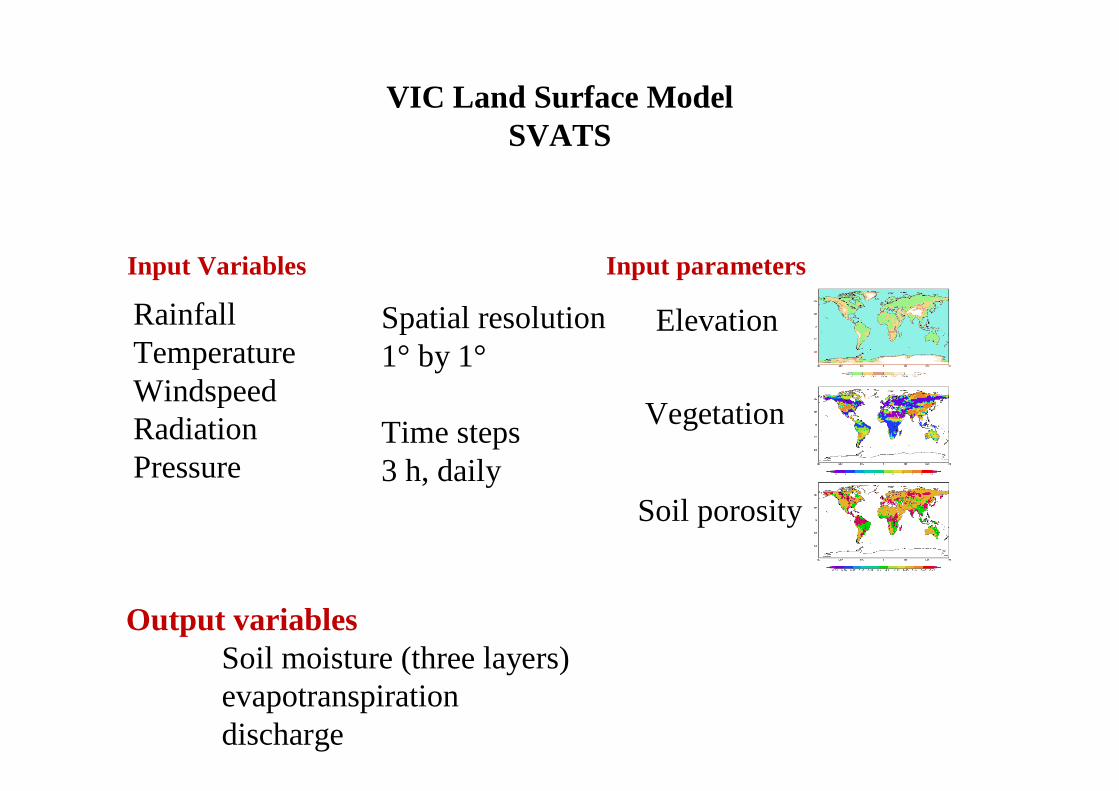
VIC Land Surface ModelSVATS
Input Variables Input parameters
Elevation
Vegetation
Soil porosity
RainfallTemperatureWindspeedRadiationPressure
Output variablesSoil moisture (three layers)evapotranspirationdischarge
Spatial resolution1° by 1°
Time steps3 h, daily
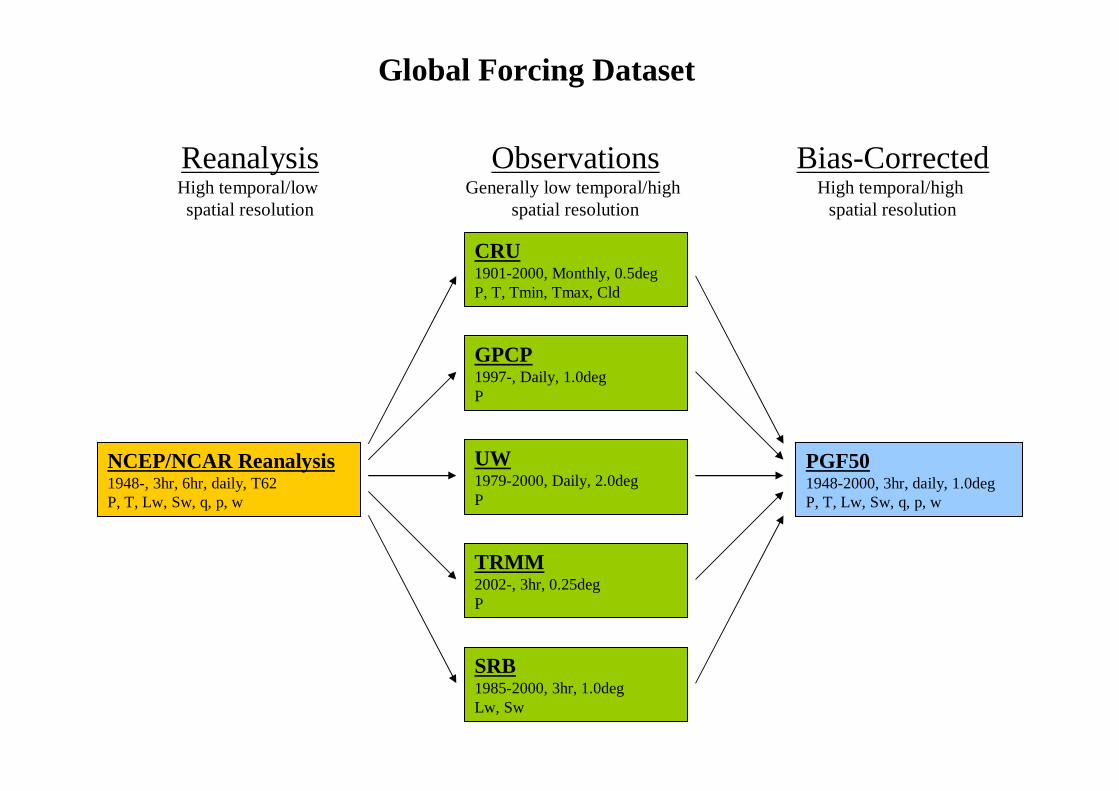
PGF501948-2000, 3hr, daily, 1.0degP, T, Lw, Sw, q, p, w
CRU1901-2000, Monthly, 0.5degP, T, Tmin, Tmax, Cld
GPCP1997-, Daily, 1.0degP
UW1979-2000, Daily, 2.0degP
TRMM2002-, 3hr, 0.25degP
SRB1985-2000, 3hr, 1.0degLw, Sw
NCEP/NCAR Reanalysis1948-, 3hr, 6hr, daily, T62P, T, Lw, Sw, q, p, w
ReanalysisHigh temporal/low spatial resolution
ObservationsGenerally low temporal/high
spatial resolution
Bias-CorrectedHigh temporal/high
spatial resolution
Global Forcing Dataset
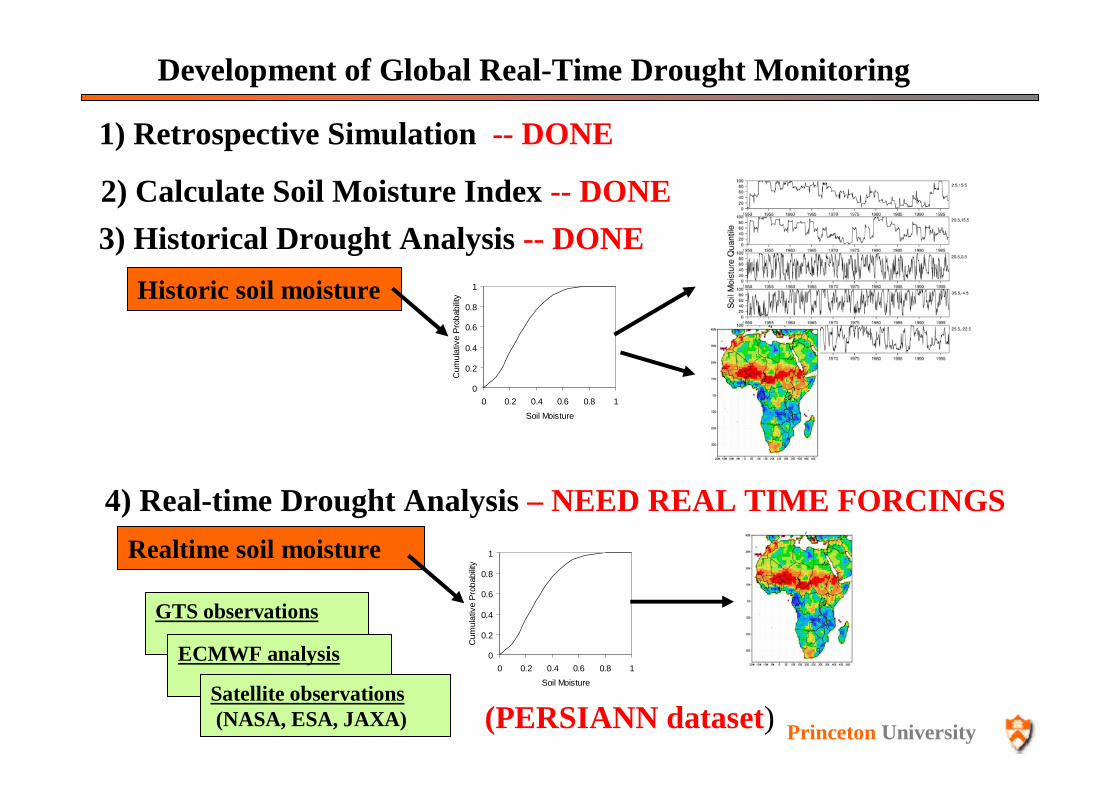
Development of Global Real-Time Drought Monitoring
1) Retrospective Simulation -- DONE
2) Calculate Soil Moisture Index -- DONE 3) Historical Drought Analysis -- DONE
Historic soil moisture
Realtime soil moisture
0
0.2
0.4
0.6
0.8
1
0 0.2 0.4 0.6 0.8 1Soil Moisture
Cum
ulat
ive
Prob
abilit
y
Princeton University
4) Real-time Drought Analysis – NEED REAL TIME FORCINGS
0
0.2
0.4
0.6
0.8
1
0 0.2 0.4 0.6 0.8 1Soil Moisture
Cum
ulat
ive
Prob
abilit
y
GTS observations
ECMWF analysis
Satellite observations(NASA, ESA, JAXA) (PERSIANN dataset)
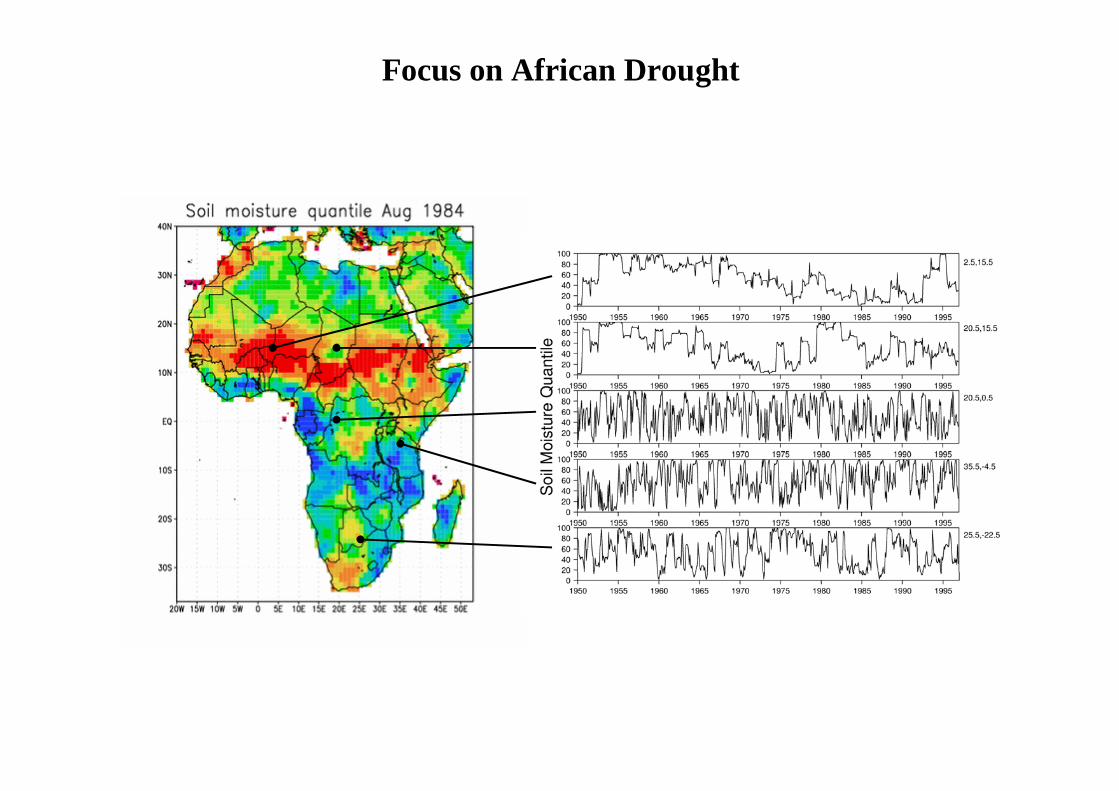
Focus on African Drought
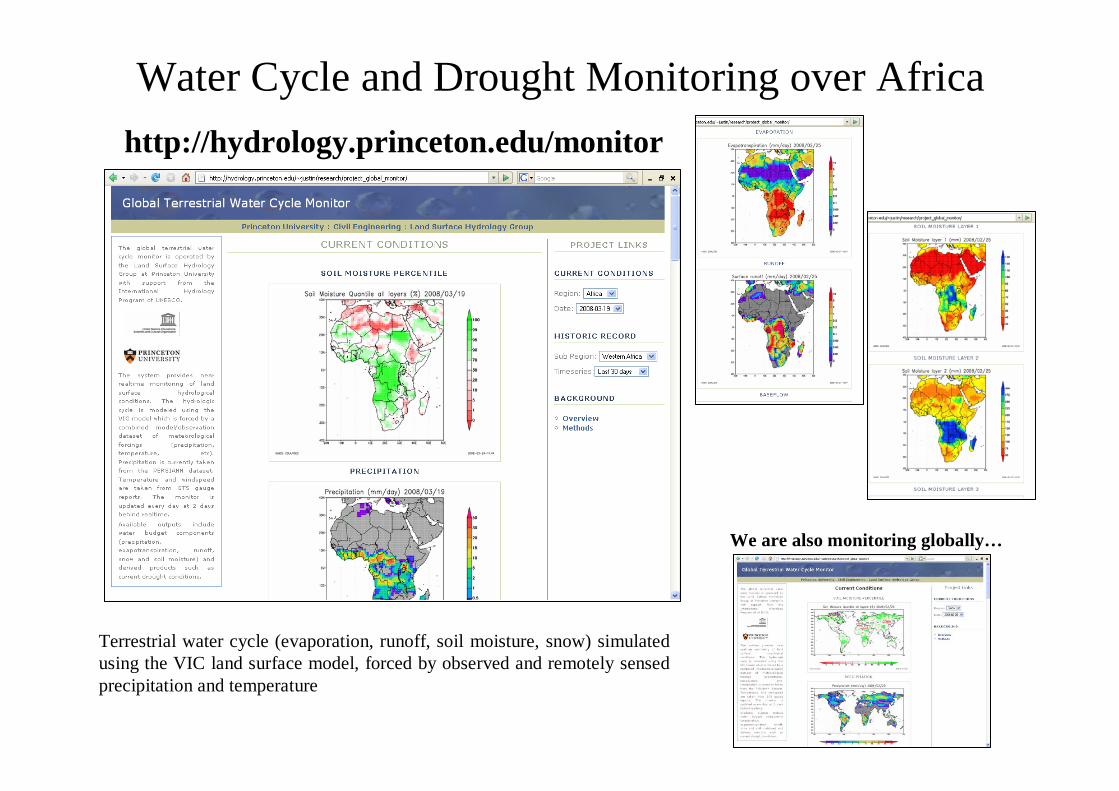
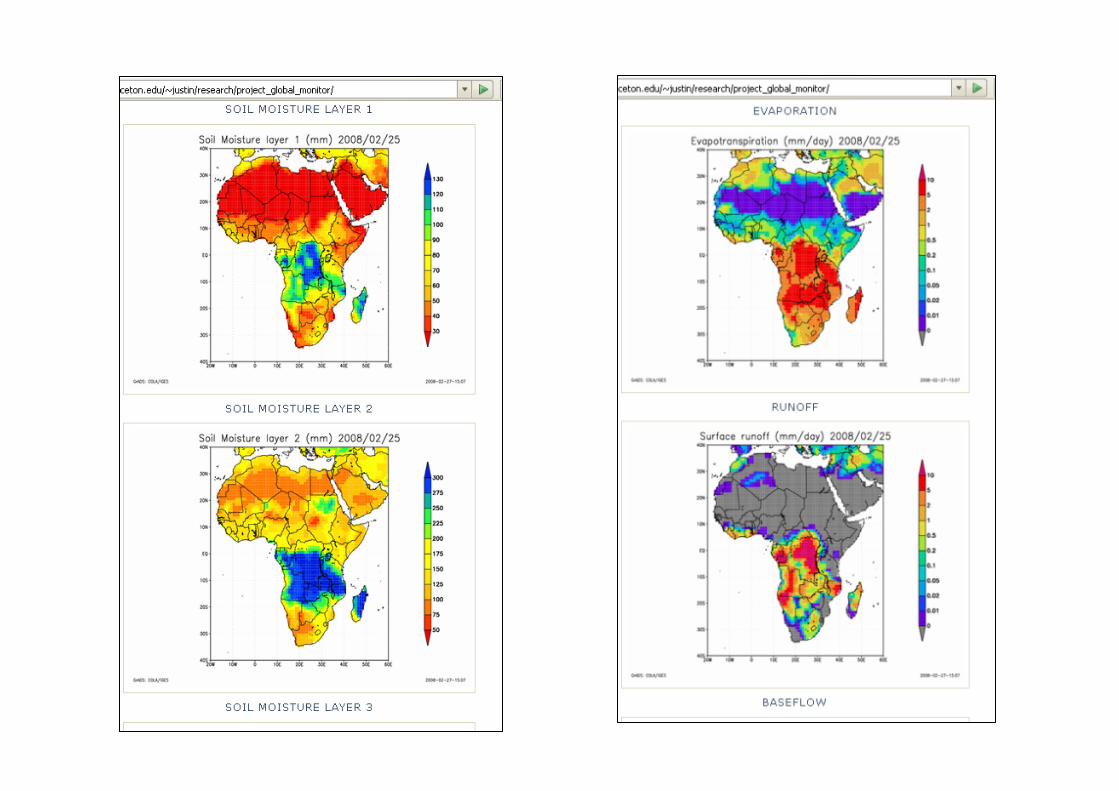
Water Cycle and Drought Monitoring over Africahttp://hydrology.princeton.edu/monitor
Terrestrial water cycle (evaporation, runoff, soil moisture, snow) simulated using the VIC land surface model, forced by observed and remotely sensed precipitation and temperature
We are also monitoring globally…
TESTS AND VALIDATION
UNESCO-IHP and UNIVERSITY OF PRINCETON will work with AGRHYMET and NBA for the test and validation of the different products
- Datasets used in the region compared to the observations (AGRHYMET Network, EPSAT)
- Coherence of soil moisture pattern (comparison with some DHC ouputs)
- Comparison with discharge indexes of main rivers in the sub-region
Could be used as a complementary tool for the monitoring of therainy season by AGRHYMET
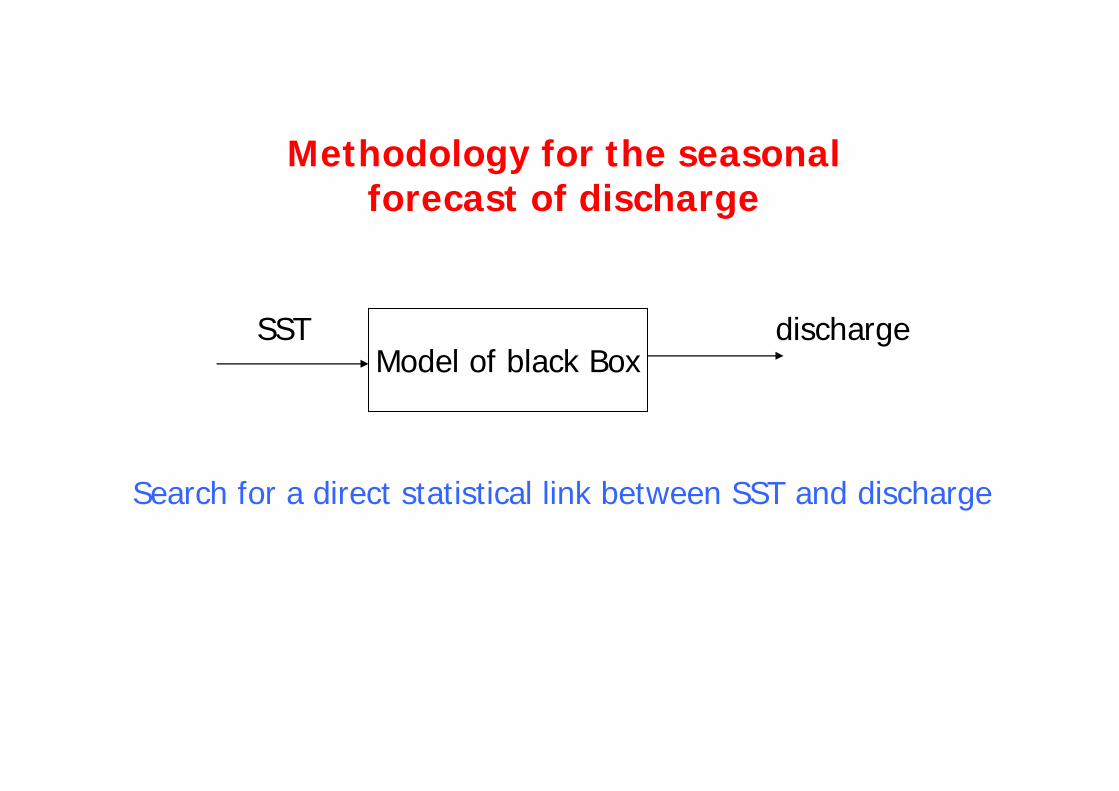
Model of black BoxSST discharge
Methodology for the seasonalforecast of discharge
Search for a direct statistical link between SST and discharge
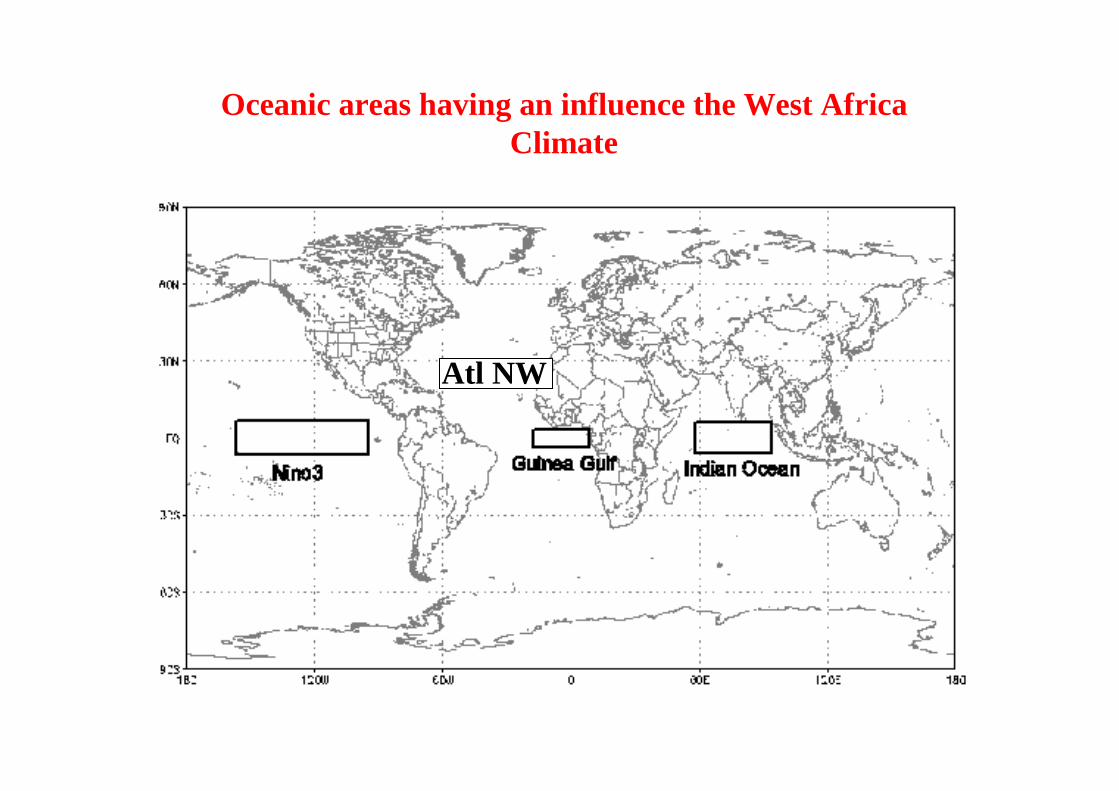
Oceanic areas having an influence the West AfricaClimate
Atl NW
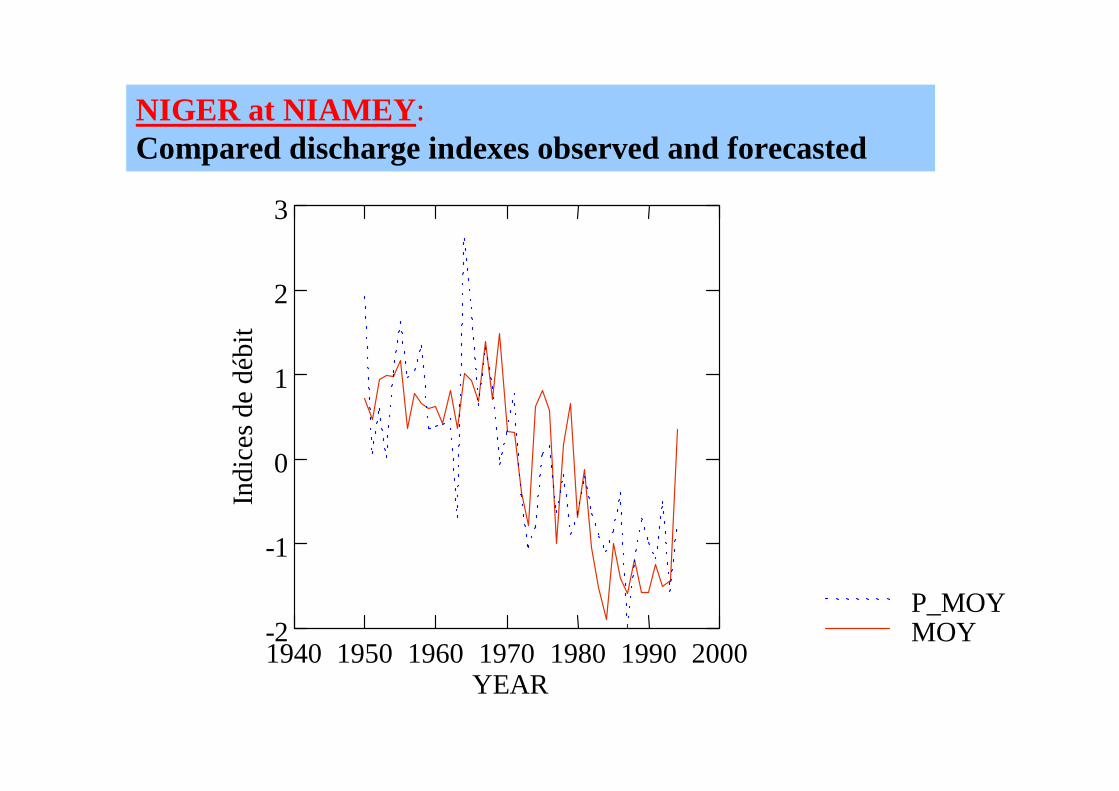
1940 1950 1960 1970 1980 1990 2000YEAR
-2
-1
0
1
2
3In
dice
s de
débi
t
MOYP_MOY
NIGER at NIAMEY:Compared discharge indexes observed and forecasted
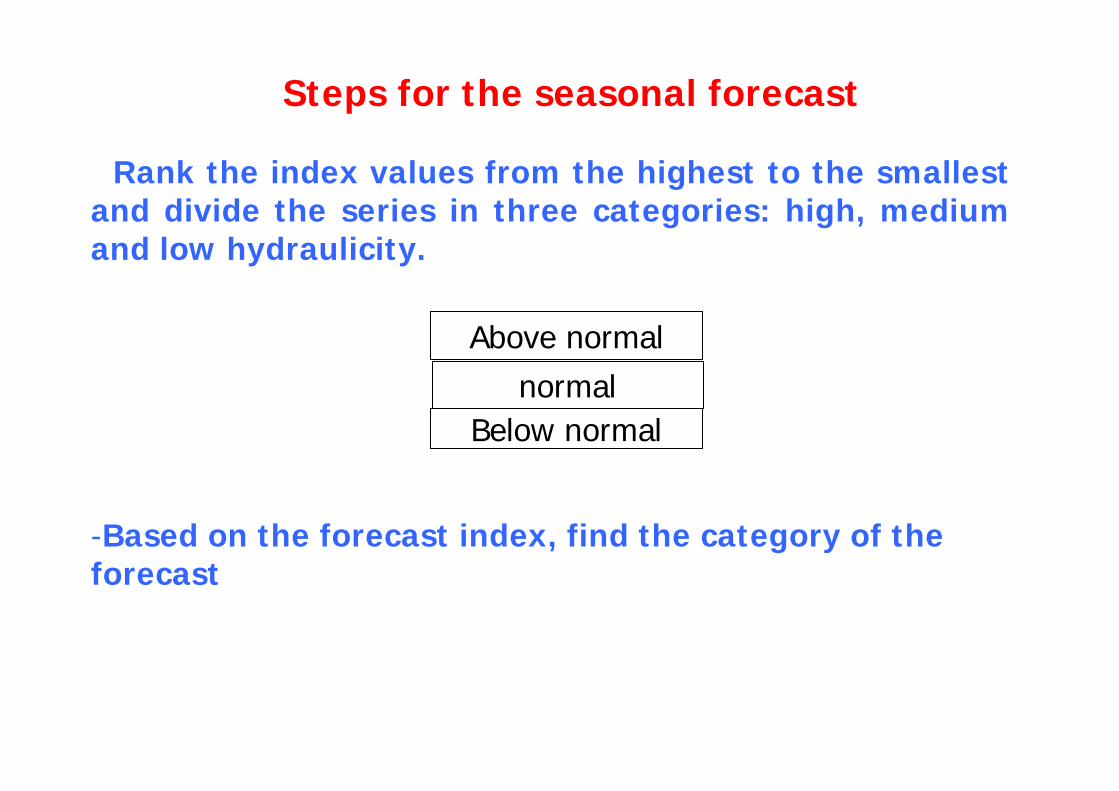
Rank the index values from the highest to the smallestand divide the series in three categories: high, medium and low hydraulicity.
-Based on the forecast index, find the category of the forecast
Steps for the seasonal forecast
Above normalnormal
Below normal
-15 -10 -5 0 5 10 15 20 25
5
10
15
20
25
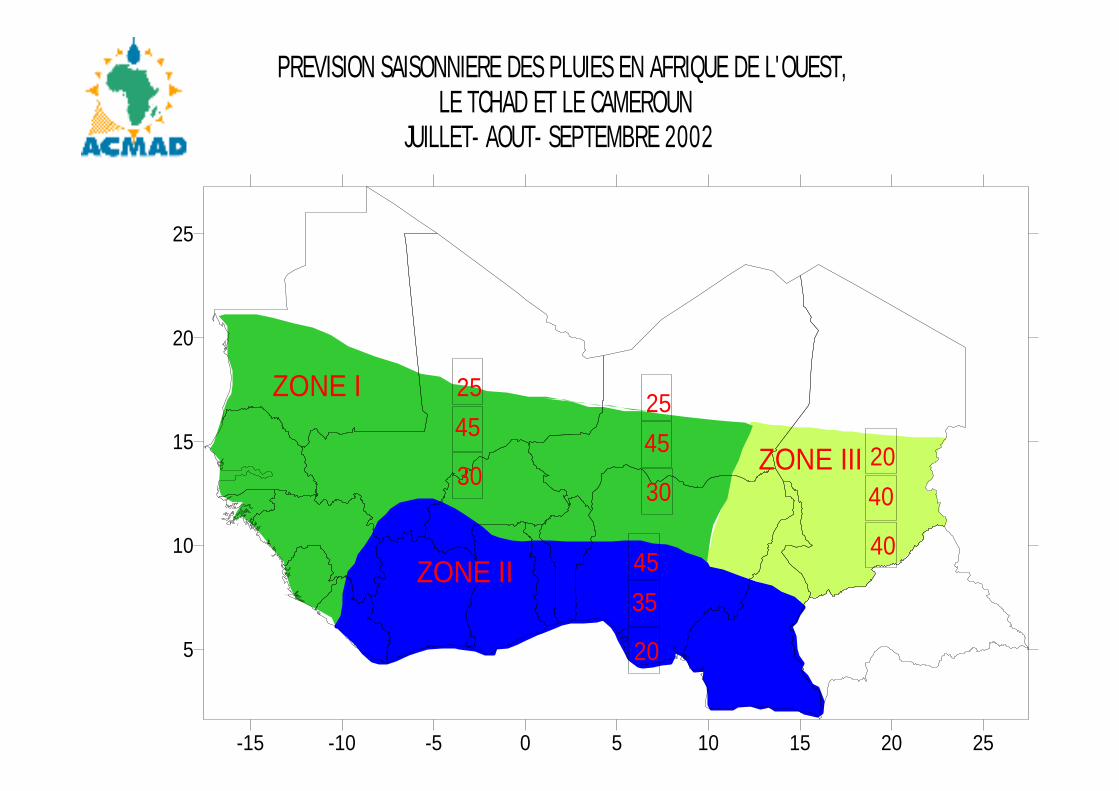
ZONE I
ZONE II
ZONE III4525
304525
30 4020
40
3545
20
PREVISION SAISONNIERE DES PLUIES EN AFRIQUE DE L'OUEST, LE TCHAD ET LE CAMEROUN
JUILLET- AOUT- SEPTEMBRE 2002
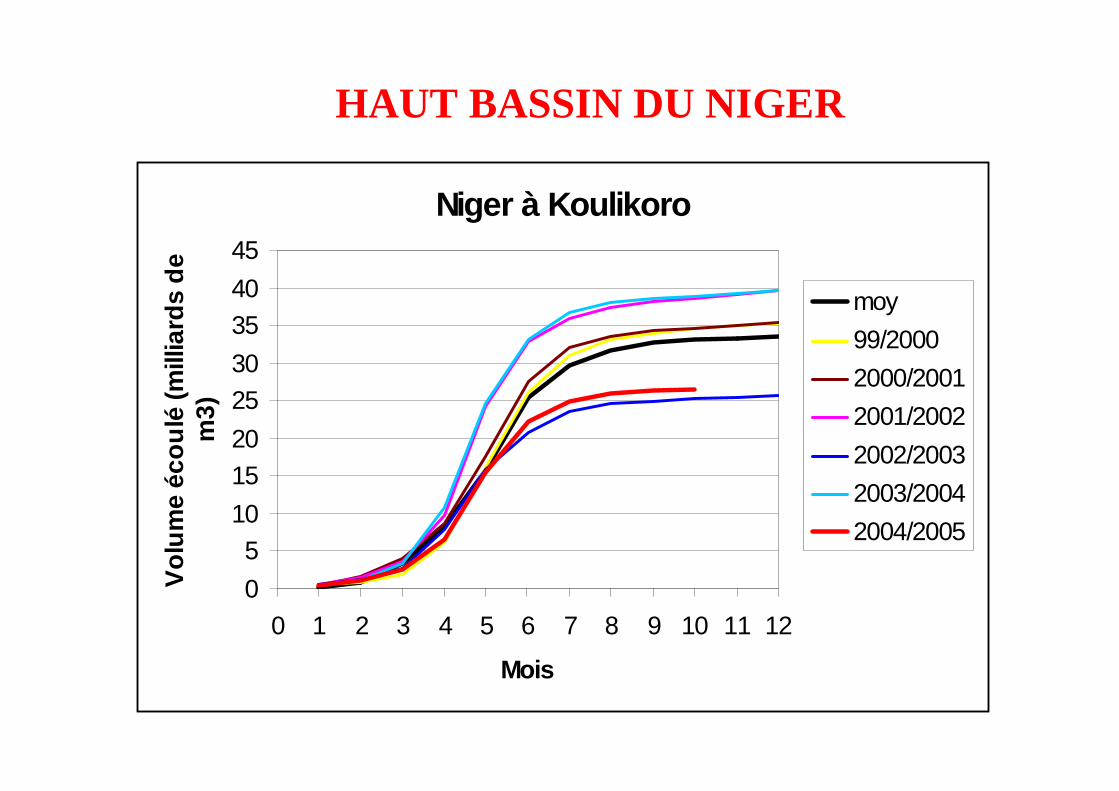
Niger à Koulikoro
05
1015202530354045
0 1 2 3 4 5 6 7 8 9 10 11 12
Mois
Volu
me
écou
lé (m
illia
rds
de
m3)
moy99/20002000/20012001/20022002/20032003/20042004/2005
HAUT BASSIN DU NIGER
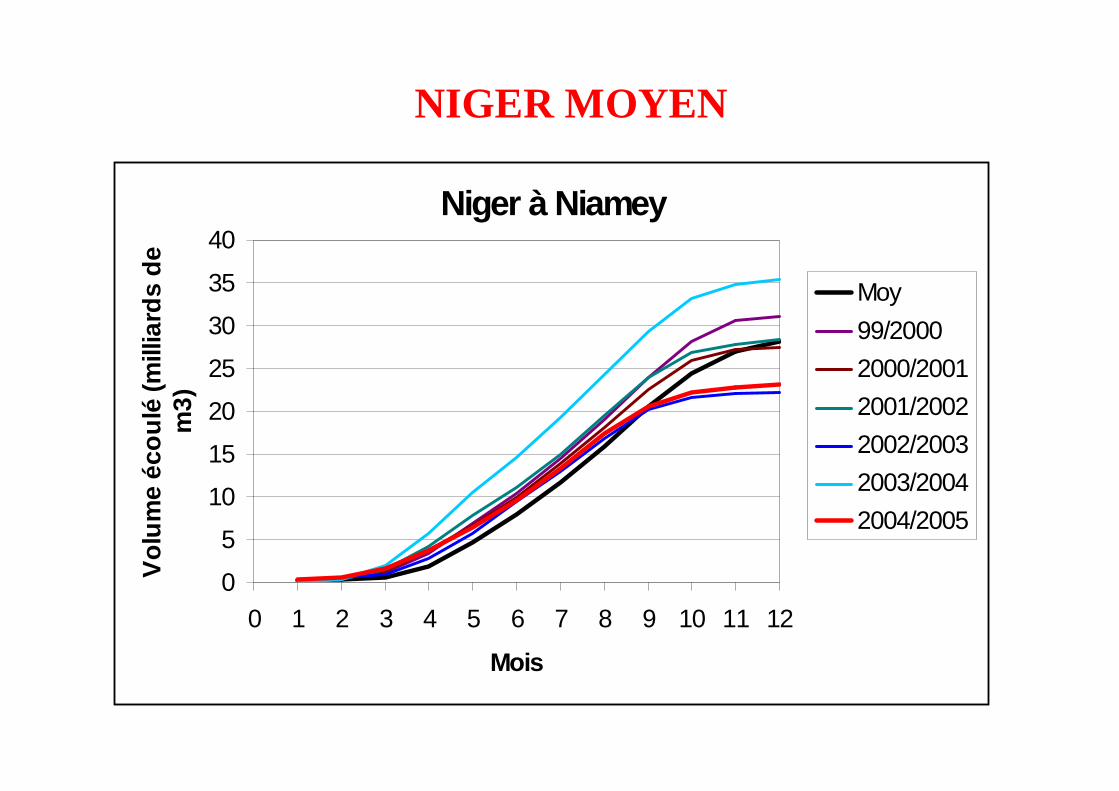
Niger à Niamey
0
5
10
15
20
25
30
35
40
0 1 2 3 4 5 6 7 8 9 10 11 12
Mois
Volu
me
écou
lé (m
illia
rds
de
m3)
Moy99/20002000/20012001/20022002/20032003/20042004/2005
NIGER MOYEN
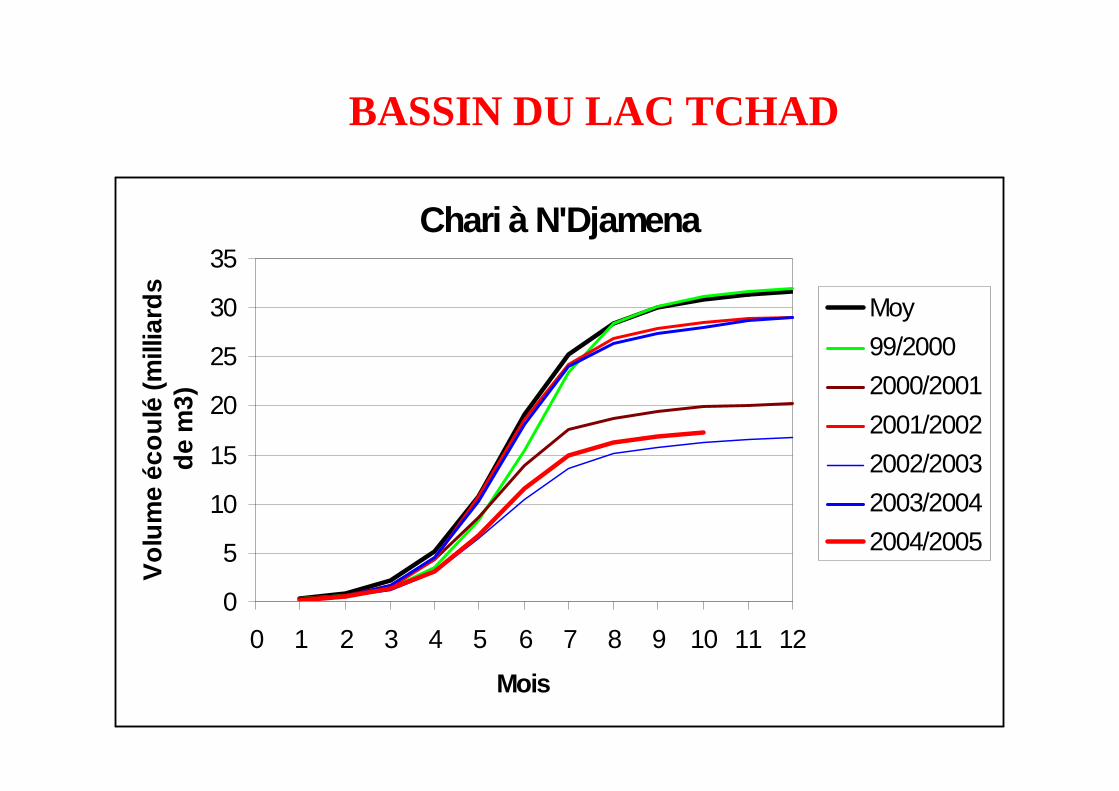
Chari à N'Djamena
0
5
10
15
20
25
30
35
0 1 2 3 4 5 6 7 8 9 10 11 12
Mois
Volu
me
écou
lé (m
illia
rds
de m
3)
Moy99/20002000/20012001/20022002/20032003/20042004/2005
BASSIN DU LAC TCHAD
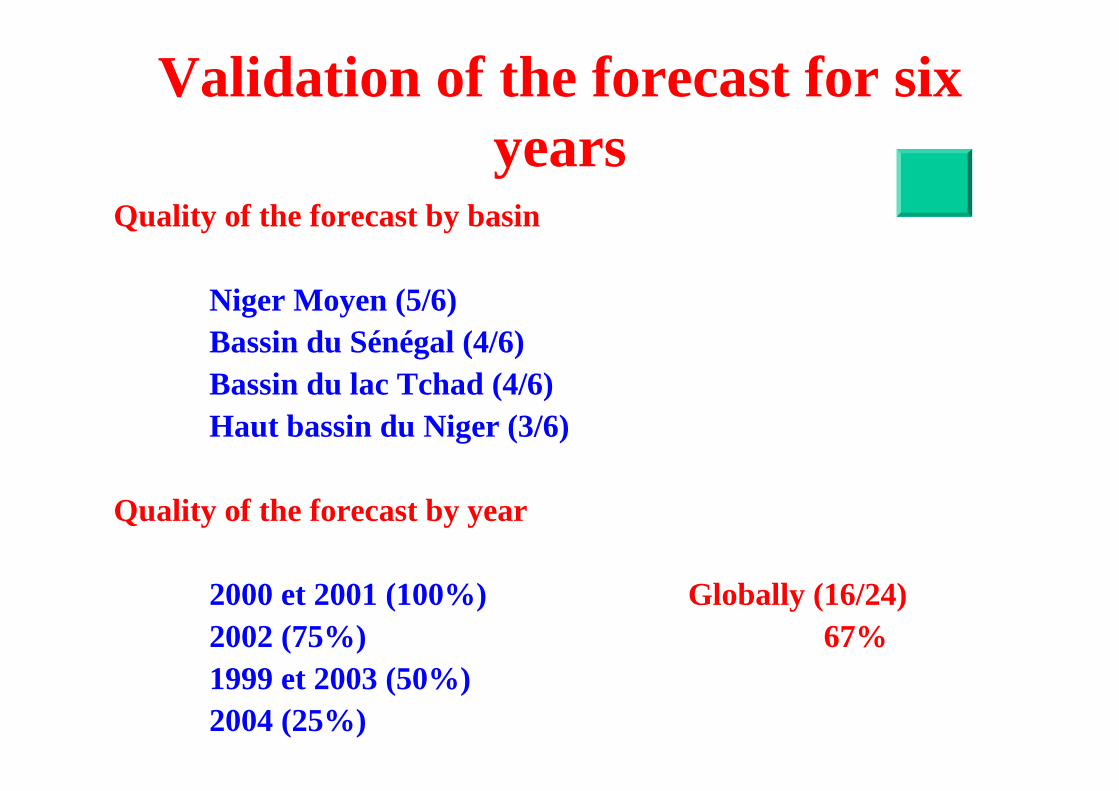
Validation of the forecast for six years
Quality of the forecast by basin
Niger Moyen (5/6)Bassin du Sénégal (4/6)Bassin du lac Tchad (4/6)Haut bassin du Niger (3/6)
Quality of the forecast by year
2000 et 2001 (100%) Globally (16/24)2002 (75%) 67%1999 et 2003 (50%)2004 (25%)
0
10
20
30
40
50
60
70
80
90
100
Benin
Burkina
Faso
Cabo V
erde
Côte d'
Ivoire
Gambia
Ghana
Guinée
Guinée
-Biss
au
Liberi
a
MaliMau
ritanie
Niger
Nigeria
Sénég
alSier
ra Le
one
Togo
Afrique
de l'o
uest
% p
erso
nnes
aya
nt a
ccès
à l'
eau
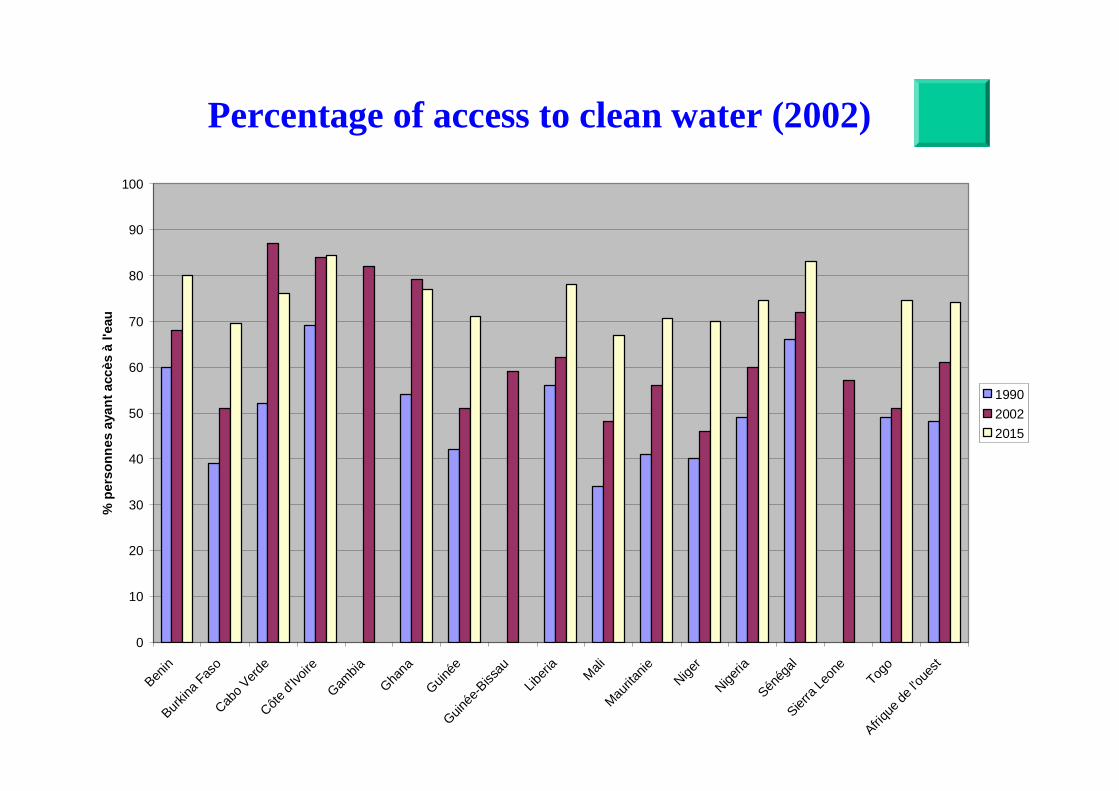
199020022015
Percentage of access to clean water (2002)
0
10
20
30
40
50
60
70
80
Benin
Burkina
Faso
Cabo V
erde
Côte d'
Ivoire
Gambia
Ghana
Guinée
Guinée
-Biss
au
Liberi
a
MaliMau
ritanie
Niger
Nigeria
Sénég
alSier
ra Le
one
Togo
Afrique
de l'O
uest
% p
opul
atio
n ay
ant a
ccès
à u
n as
sain
isse
men
t am
élio
ré
199020022015
Percentage of access to sanitation(2002)
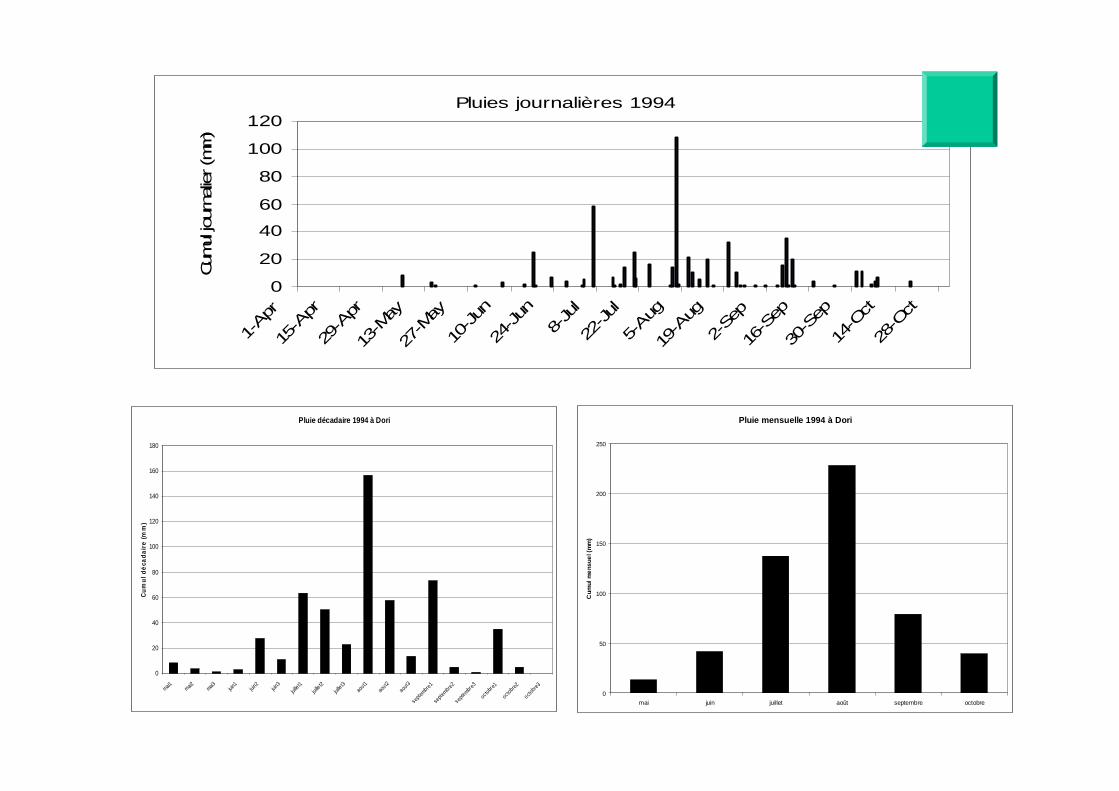
Pluies journalières 1994
0
20
40
60
80
100
120
1-Apr
15-A
pr29
-Apr
13-M
ay27
-May
10-J
un24
-Jun
8-Ju
l22
-Jul
5-Aug
19-A
ug2-
Sep
16-S
ep30
-Sep
14-O
ct28
-Oct
Cumul jo
urna
lier (
mm)
Pluie décadaire 1994 à Dori
0
20
40
60
80
100
120
140
160
180
mai1 mai2 mai3 juin1
juin2
juin3
juillet1
juillet2
juillet3
aout1
aout2
aout3
septem
bre1se
ptembre2
septembre
3oc
tobre1
octob
re2octo
bre3
Cum
ul d
écad
aire
(mm
)
Pluie mensuelle 1994 à Dori
0
50
100
150
200
250
mai juin juillet août septembre octobre
Cum
ul m
ensu
el (m
m)
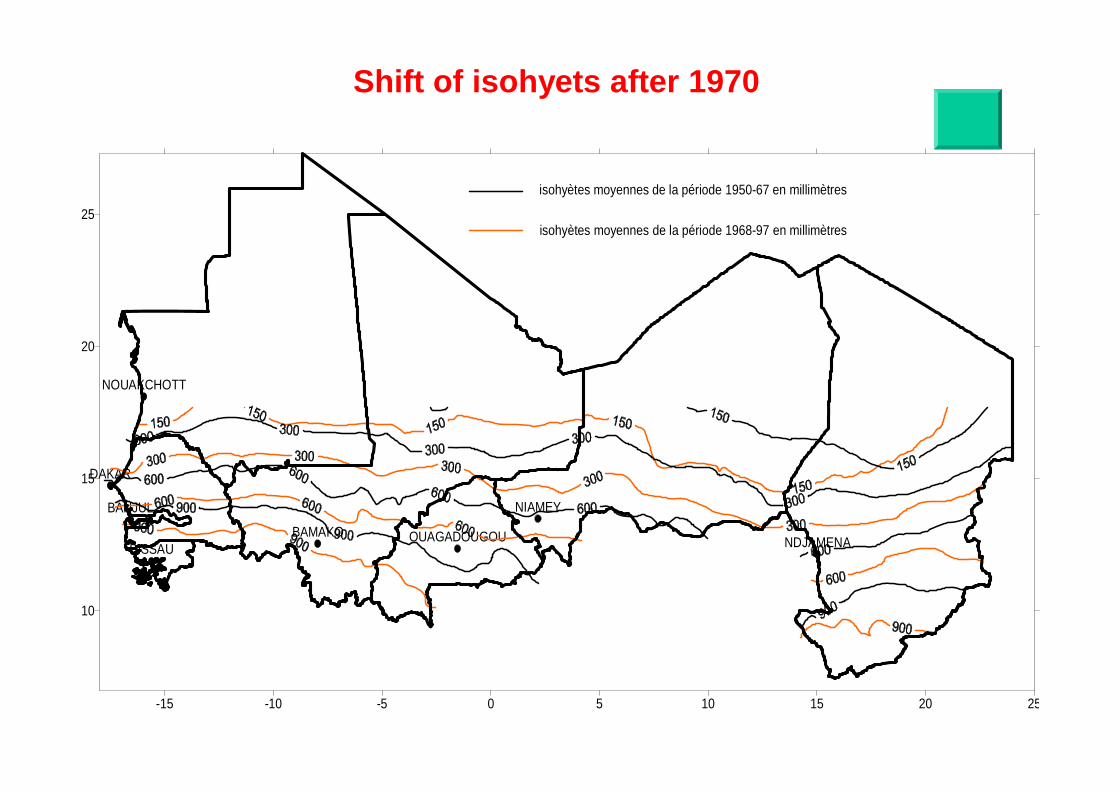
OUAGADOUGOUBISSAU
BAMAKO
NOUAKCHOTT
NIAMEY
DAKAR
NDJAMENA
BANJUL
-15 -10 -5 0 5 10 15 20 25
10
15
20
25isohyètes moyennes de la période 1968-97 en millimètres
isohyètes moyennes de la période 1950-67 en millimètres
Shift of isohyets after 1970
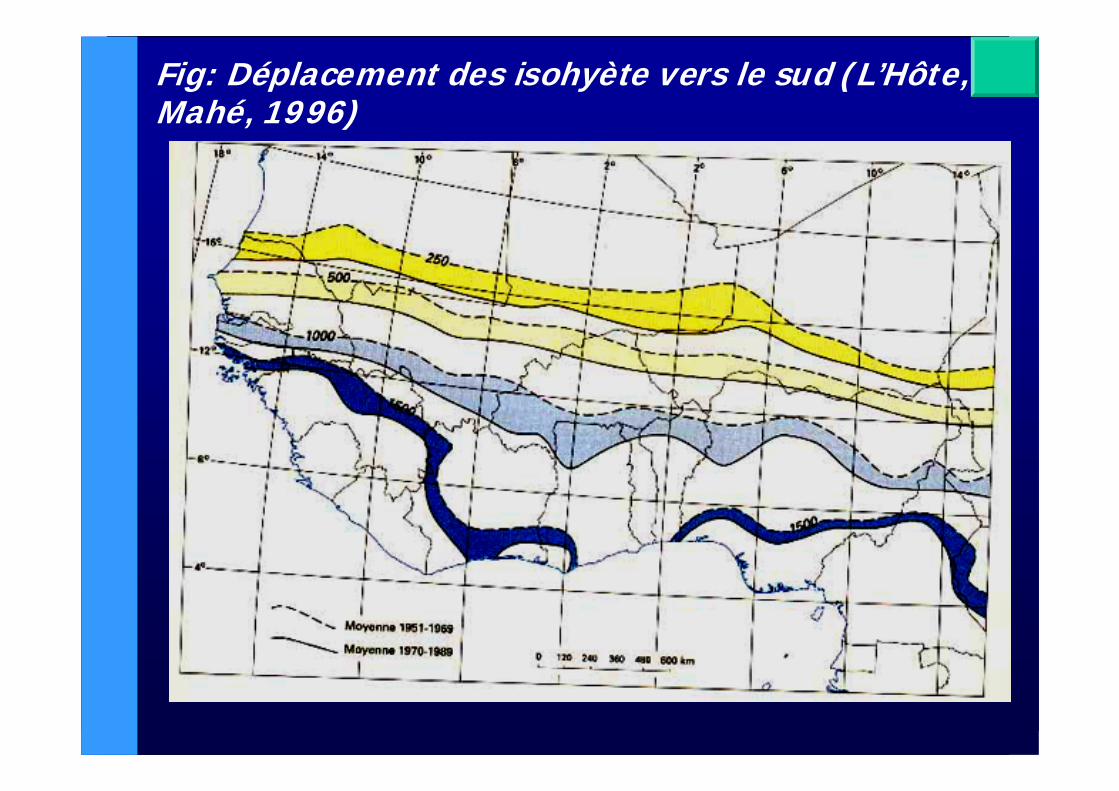
Fig: Déplacement des isohyète vers le sud (L’Hôte,Mahé, 1996)
-10 -5 0
5
10
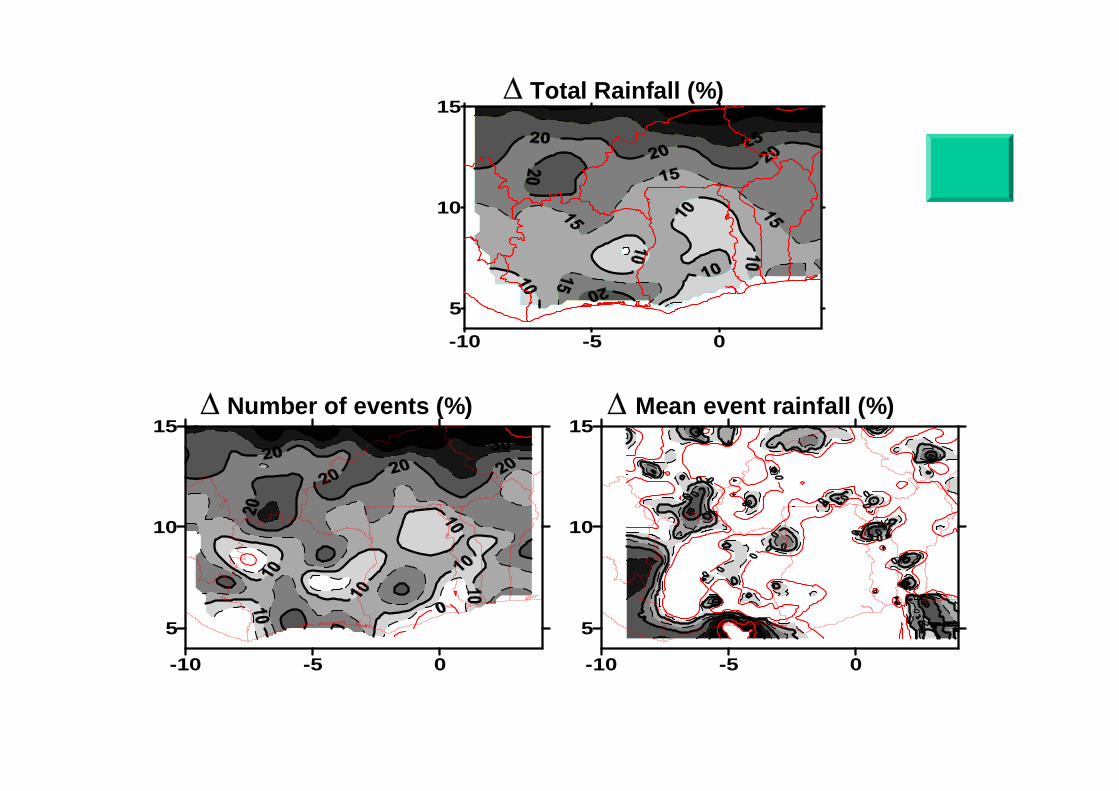
15Δ Total Rainfall (%)
-10 -5 0
5
10
15Δ Number of events (%)
-10 -5 0
5
10
15Δ Mean event rainfall (%)
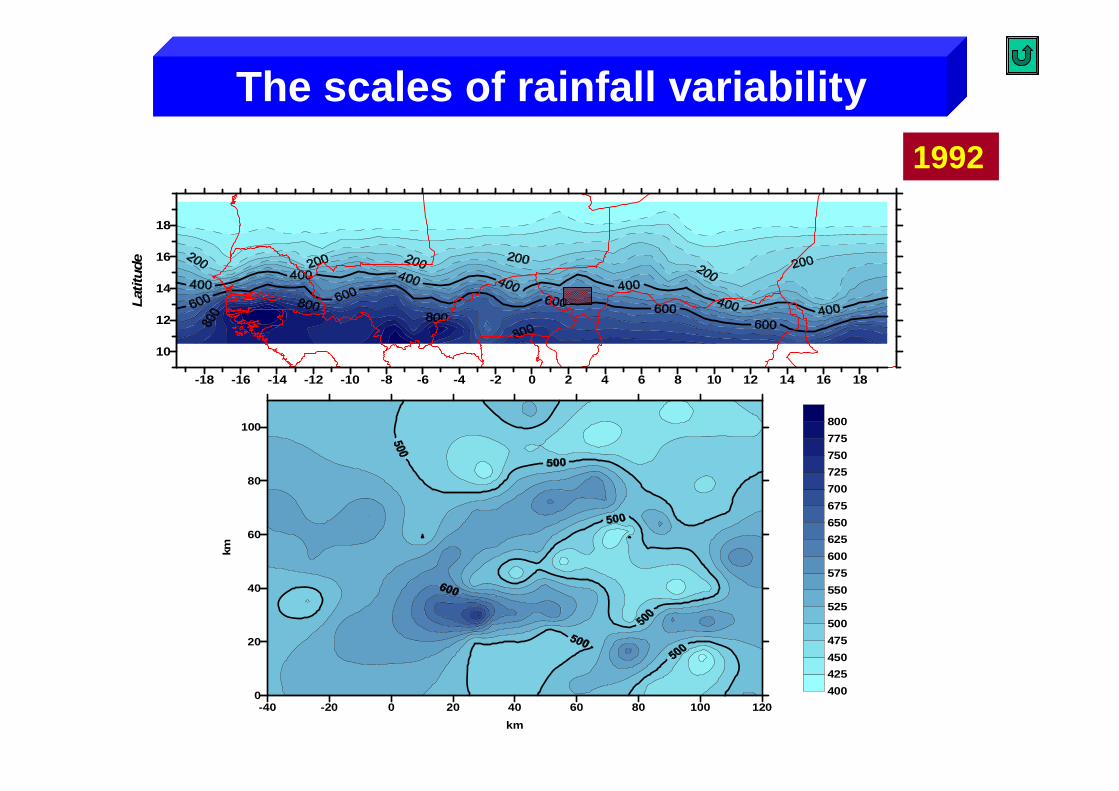
-18 -16 -14 -12 -10 -8 -6 -4 -2 0 2 4 6 8 10 12 14 16 18
10
12
14
16
18
Latit
ude
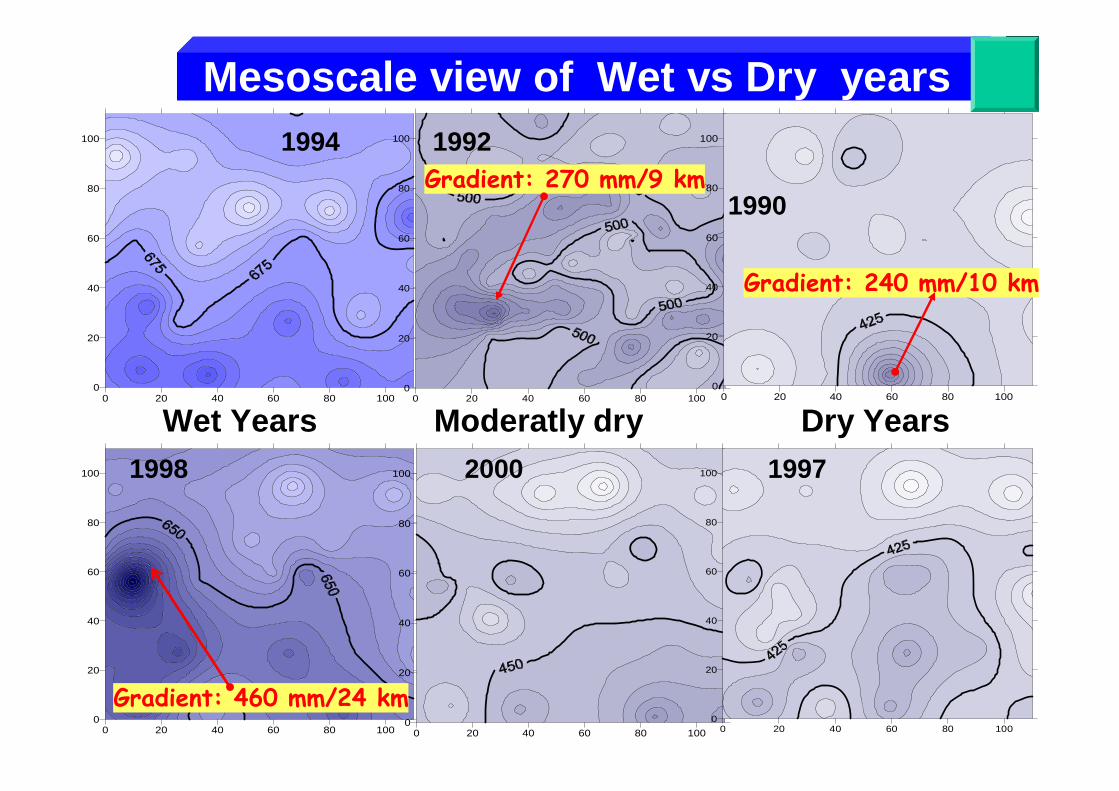
-40 -20 0 20 40 60 80 100 120km
0
20
40
60
80
100
km
400425450475500525550575600625650675700725750775800
1992
The scales of rainfall variability
0 20 40 60 80 1000
20
40
60
80
100
0 20 40 60 80 1000
20
40
60
80
100
Wet Years
1994
1998
0 20 40 60 80 1000
20
40
60
80
100 1992
0 20 40 60 80 1000
20
40
60
80
100 2000
0 20 40 60 80 1000
20
40
60
80
100
1990
0 20 40 60 80 1000
20
40
60
80
100 1997
Dry YearsModeratly dry
Gradient: 460 mm/24 km
Gradient: 270 mm/9 km
Gradient: 240 mm/10 km
Mesoscale view of Wet vs Dry years
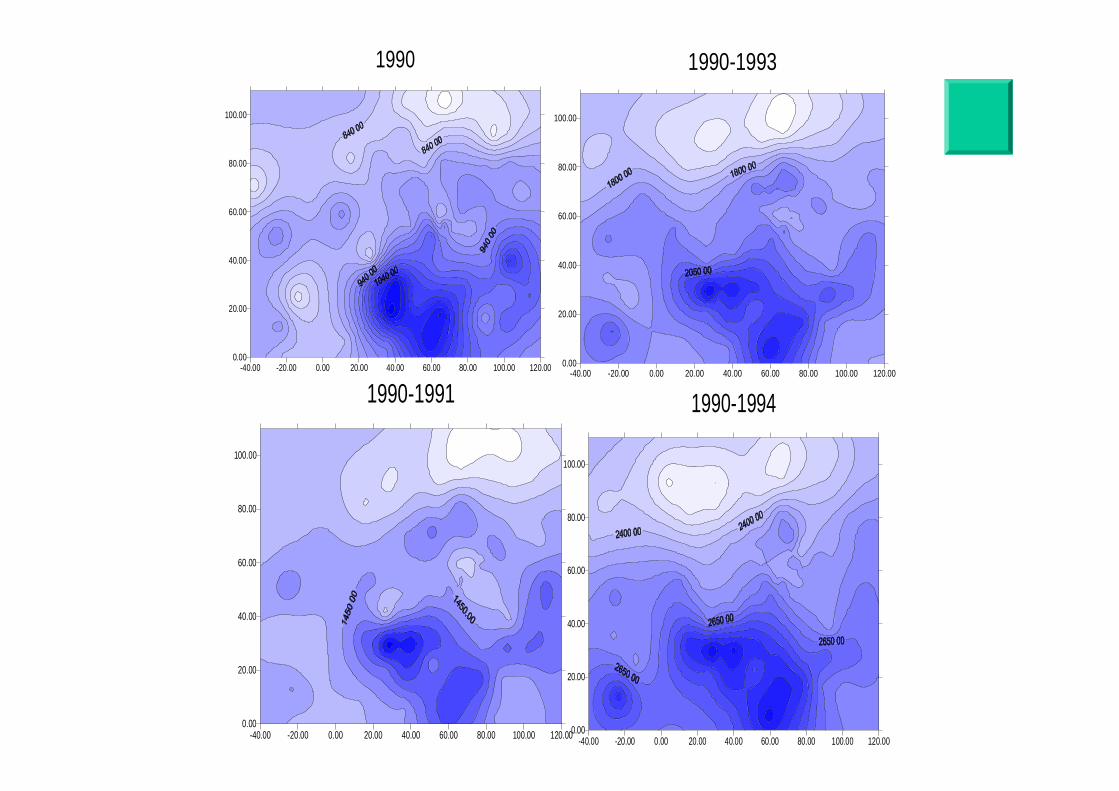
-40.00 -20.00 0.00 20.00 40.00 60.00 80.00 100.00 120.00
1990
0.00
20.00
40.00
60.00
80.00
100.00
-40.00 -20.00 0.00 20.00 40.00 60.00 80.00 100.00 120.00
1990-1991
0.00
20.00
40.00
60.00
80.00
100.00
-40.00 -20.00 0.00 20.00 40.00 60.00 80.00 100.00 120.00
1990-1994
0.00
20.00
40.00
60.00
80.00
100.00
-40.00 -20.00 0.00 20.00 40.00 60.00 80.00 100.00 120.00
1990-1993
0.00
20.00
40.00
60.00
80.00
100.00
#
#
#
##
##
#
# ##
#
##
###
#
#
##
##
#
# #
#
#
#
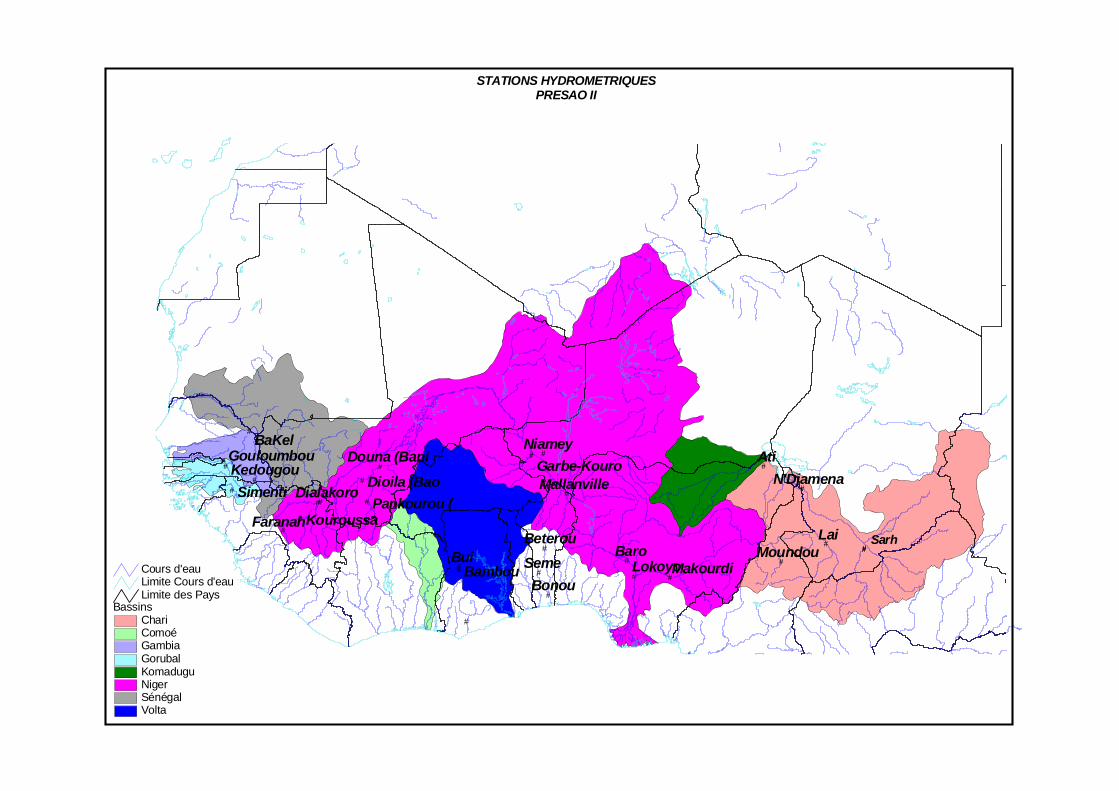
#Bui
Lai
Ati
BaroSeme
BaKel
BonouBambou
Niamey
Lokoyo
Simenti
Moundou
FaranahBeterou
Kedougou
Makourdi
N'Djamena
Kouroussa
Dialakoro
GouloumbouGarbe-KouroDouna (Bani
Dioila (BaoPankourou (
Mallanville
Sarh
STATIONS HYDROMETRIQUESPRESAO II
BassinsChariComoéGambiaGorubalKomaduguNigerSénégalVolta
Limite des PaysLimite Cours d'eauCours d'eau
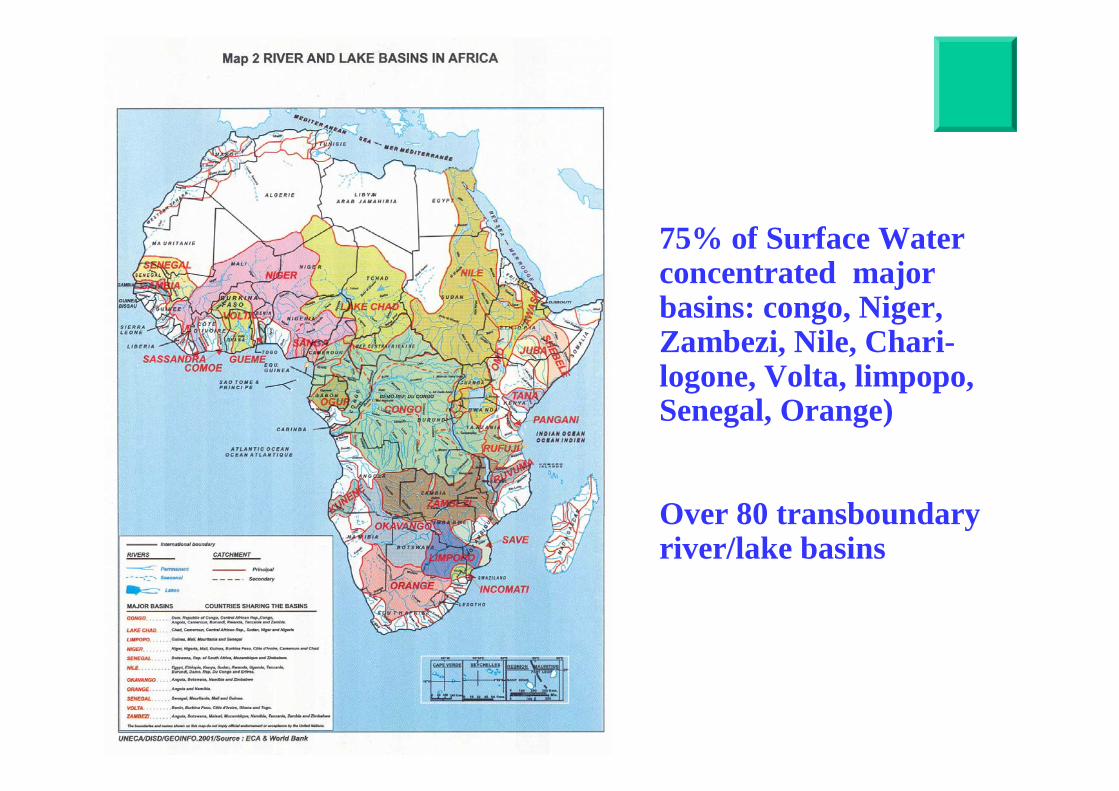
75% of Surface Water concentrated major basins: congo, Niger, Zambezi, Nile, Chari-logone, Volta, limpopo, Senegal, Orange)
Over 80 transboundaryriver/lake basins
0
20
40
60
80
100
120
Benin
Burkina
Cape V
erde
Cote d'
Ivoire
Gambia
Ghana
Guinea
Guinea
-biss
auLib
eria
MaliMau
ritania
Niger
Nigeria
Seneg
alSerr
a Leo
neTog
o
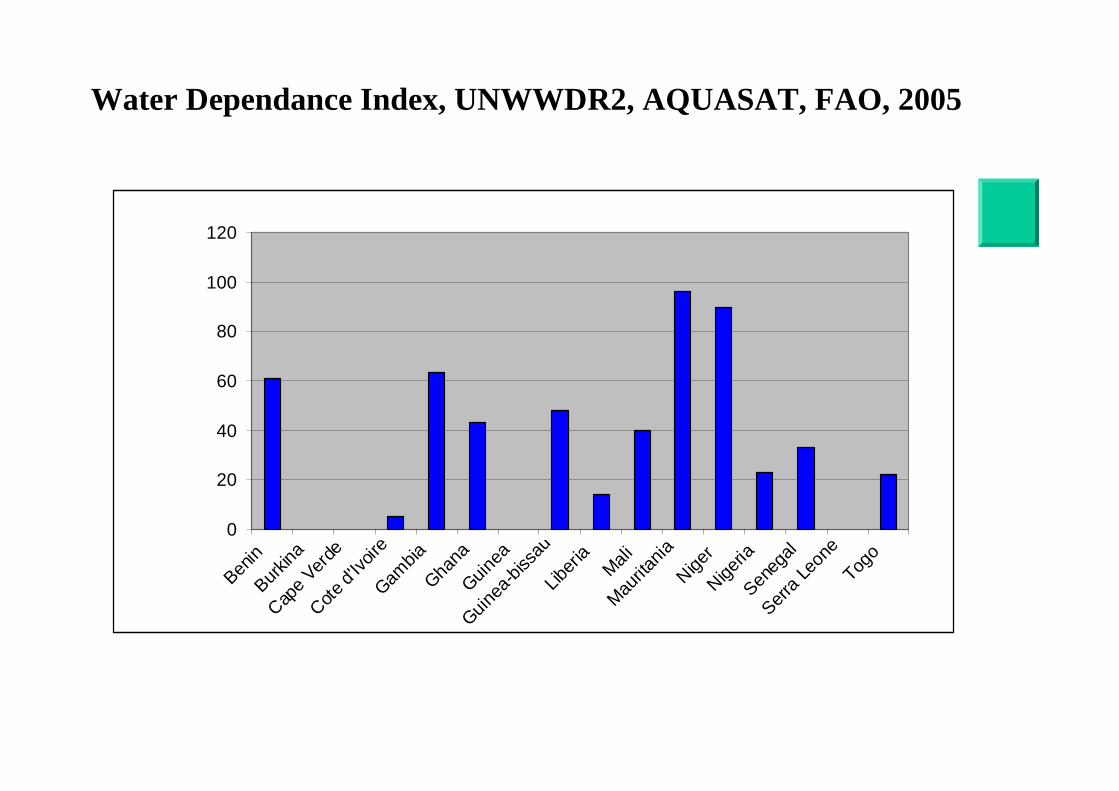
Water Dependance Index, UNWWDR2, AQUASAT, FAO, 2005
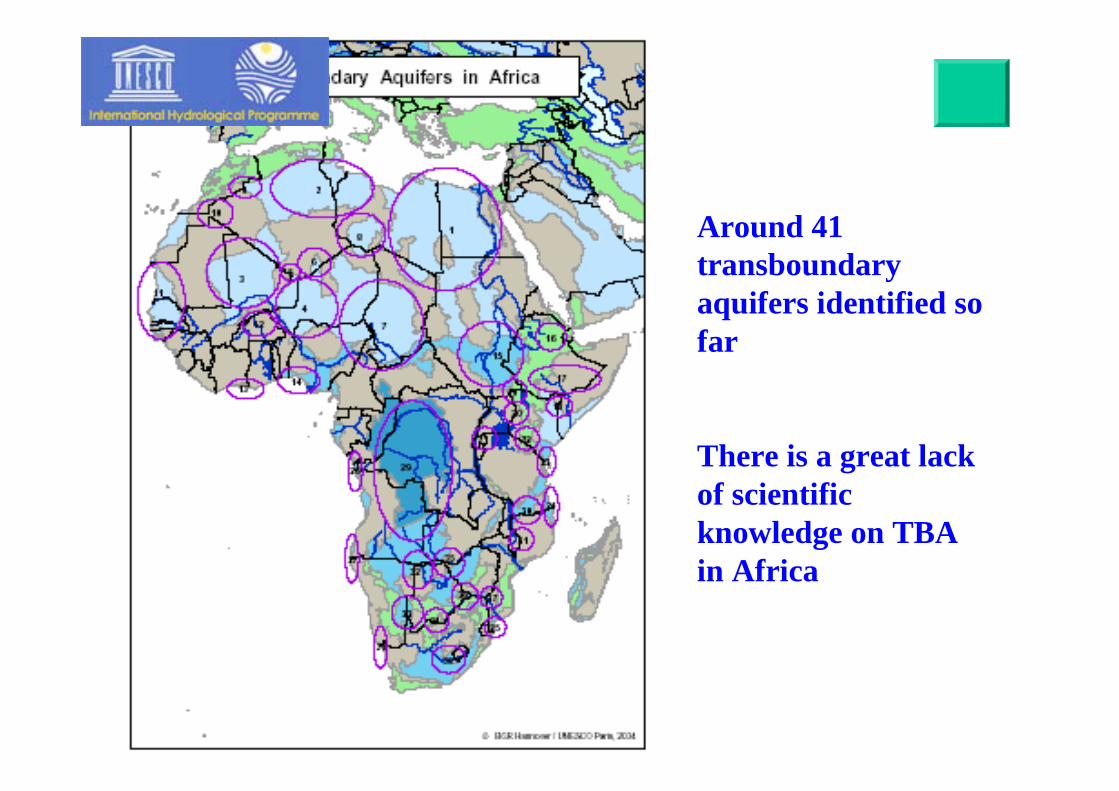
Around 41 transboundaryaquifers identified so far
There is a great lack of scientific knowledge on TBA in Africa
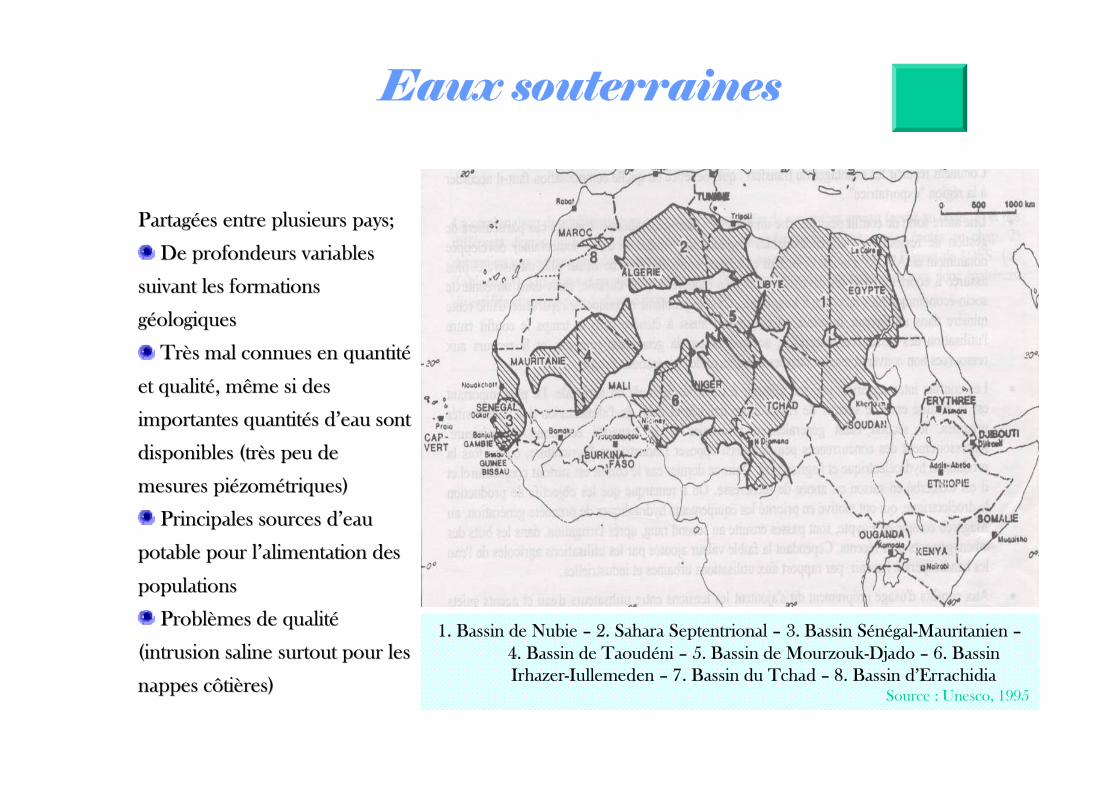
Eaux souterraines
PartagPartagéées entre plusieurs pays;es entre plusieurs pays;
De profondeurs variables De profondeurs variables
suivant les formations suivant les formations
ggééologiquesologiques
TrTrèès mal connues en quantits mal connues en quantitéé
et qualitet qualitéé, même si des , même si des
importantes quantitimportantes quantitéés ds d’’eau sont eau sont
disponibles (trdisponibles (trèès peu de s peu de
mesures pimesures piéézomzoméétriques) triques)
Principales sources dPrincipales sources d’’eau eau
potable pour lpotable pour l’’alimentation des alimentation des
populationspopulations
ProblProblèèmes de qualitmes de qualitéé
(intrusion saline surtout pour les (intrusion saline surtout pour les
nappes côtinappes côtièères)res)
1. Bassin de Nubie – 2. Sahara Septentrional – 3. Bassin Sénégal-Mauritanien –4. Bassin de Taoudéni – 5. Bassin de Mourzouk-Djado – 6. Bassin Irhazer-Iullemeden – 7. Bassin du Tchad – 8. Bassin d’Errachidia
Source : Unesco, 1995
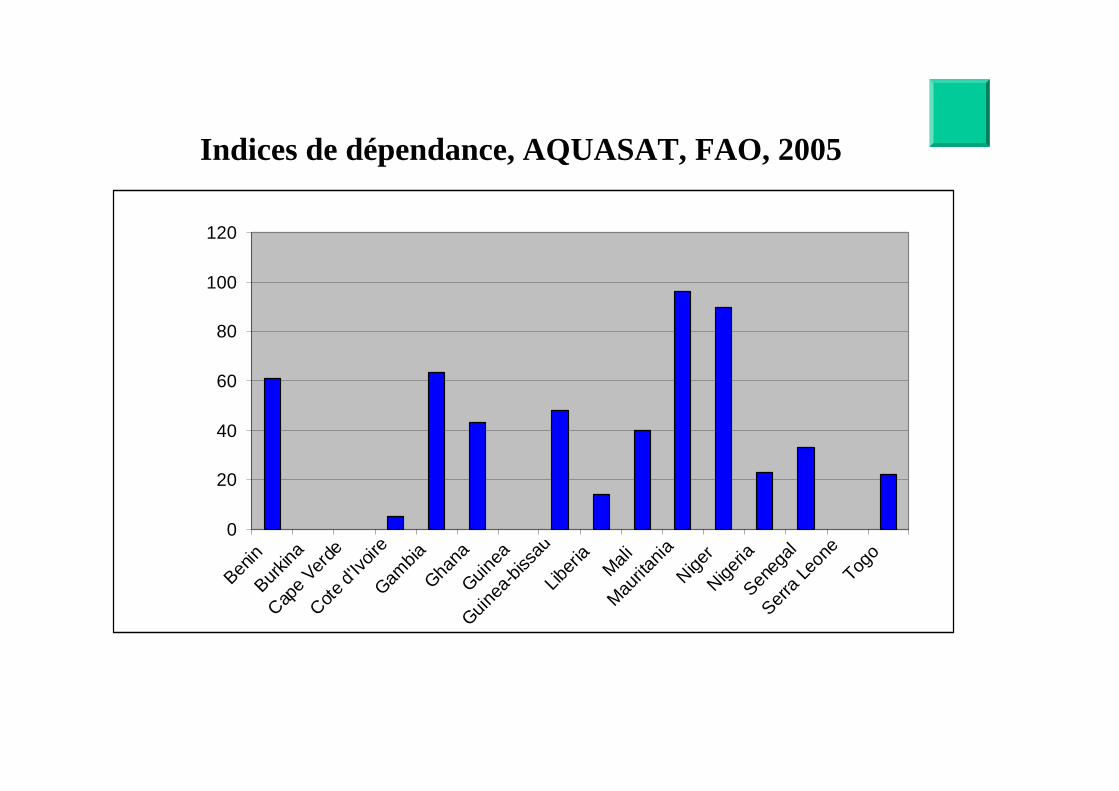
0
20
40
60
80
100
120
Benin
Burkina
Cape V
erde
Cote d'
Ivoire
Gambia
Ghana
Guinea
Guinea
-biss
auLib
eria
MaliMau
ritania
Niger
Nigeria
Seneg
alSerr
a Leo
neTog
o
Indices de dépendance, AQUASAT, FAO, 2005
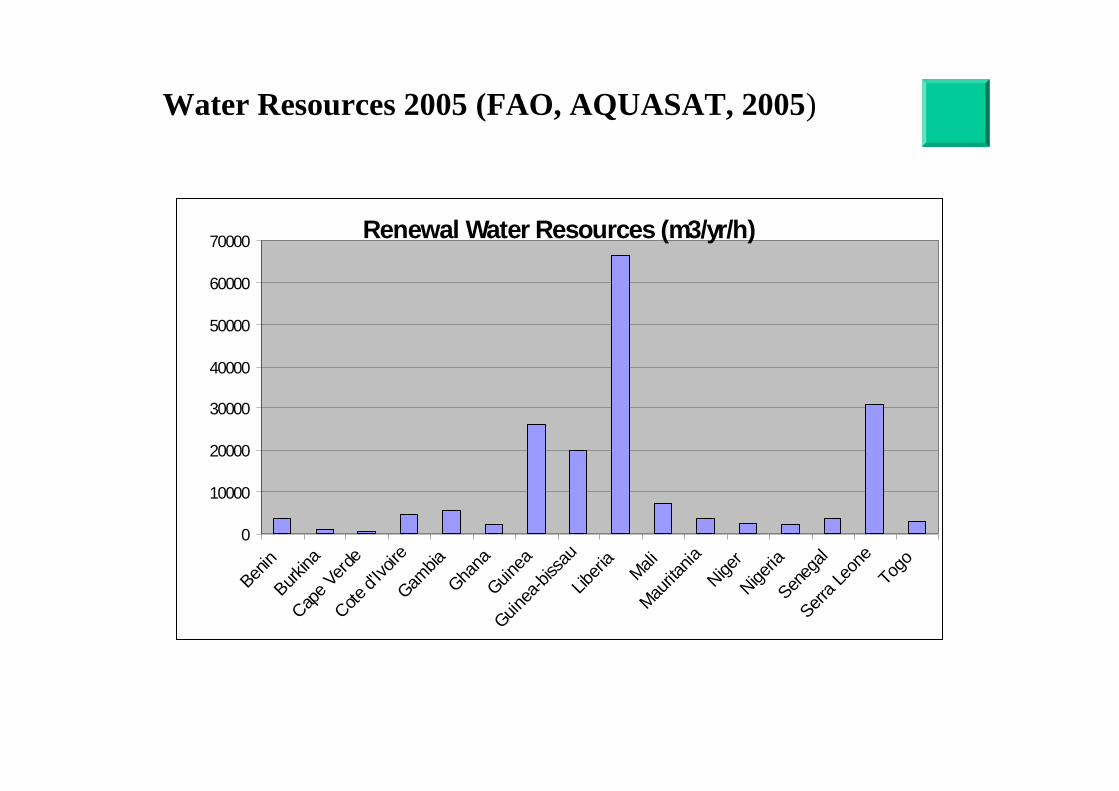
Renewal Water Resources (m3/yr/h)
0
10000
20000
30000
40000
50000
60000
70000
Benin
Burkina
Cape V
erde
Cote d'
Ivoire
Gambia
Ghana
Guinea
Guinea
-biss
auLib
eria
MaliMau
ritania
Niger
Nigeria
Seneg
alSerr
a Leo
neTo
go
Water Resources 2005 (FAO, AQUASAT, 2005)
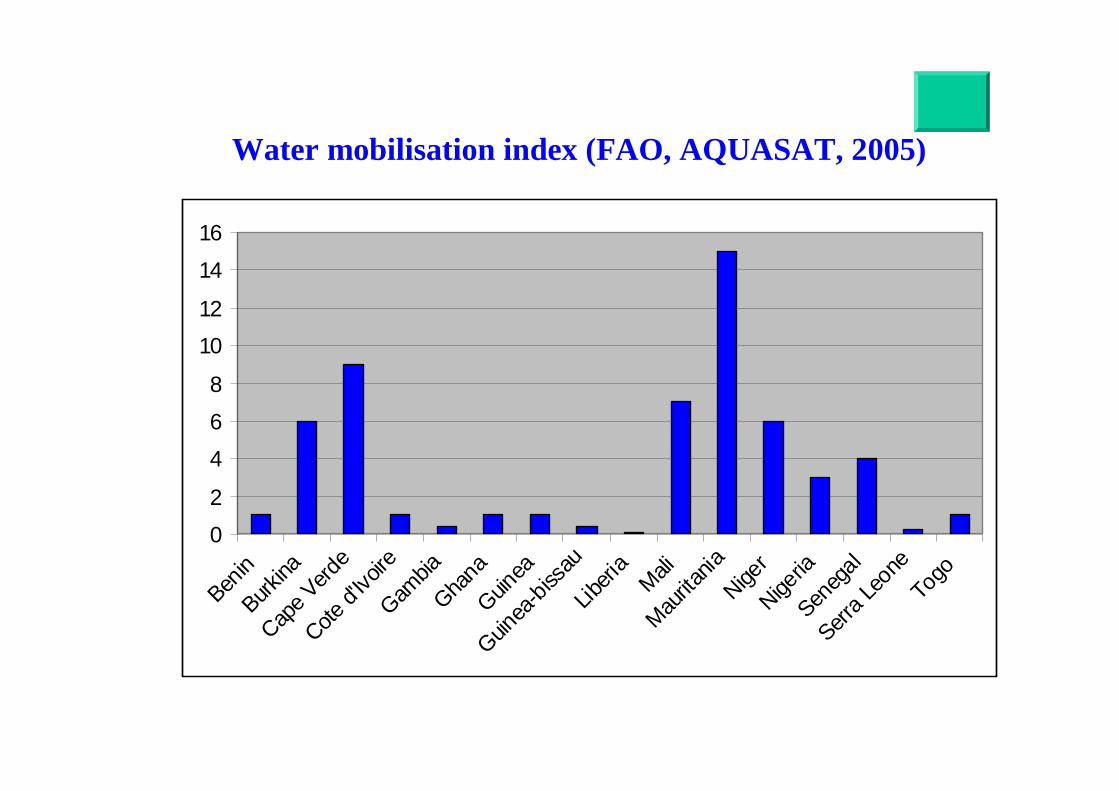
0
2
46
8
1012
14
16
Benin
Burkina
Cape V
erde
Cote d'
Ivoire
Gambia
Ghana
Guinea
Guinea
-biss
auLib
eria
MaliMau
ritania
Niger
Nigeria
Seneg
alSerr
a Leo
neTo
goWater mobilisation index (FAO, AQUASAT, 2005)
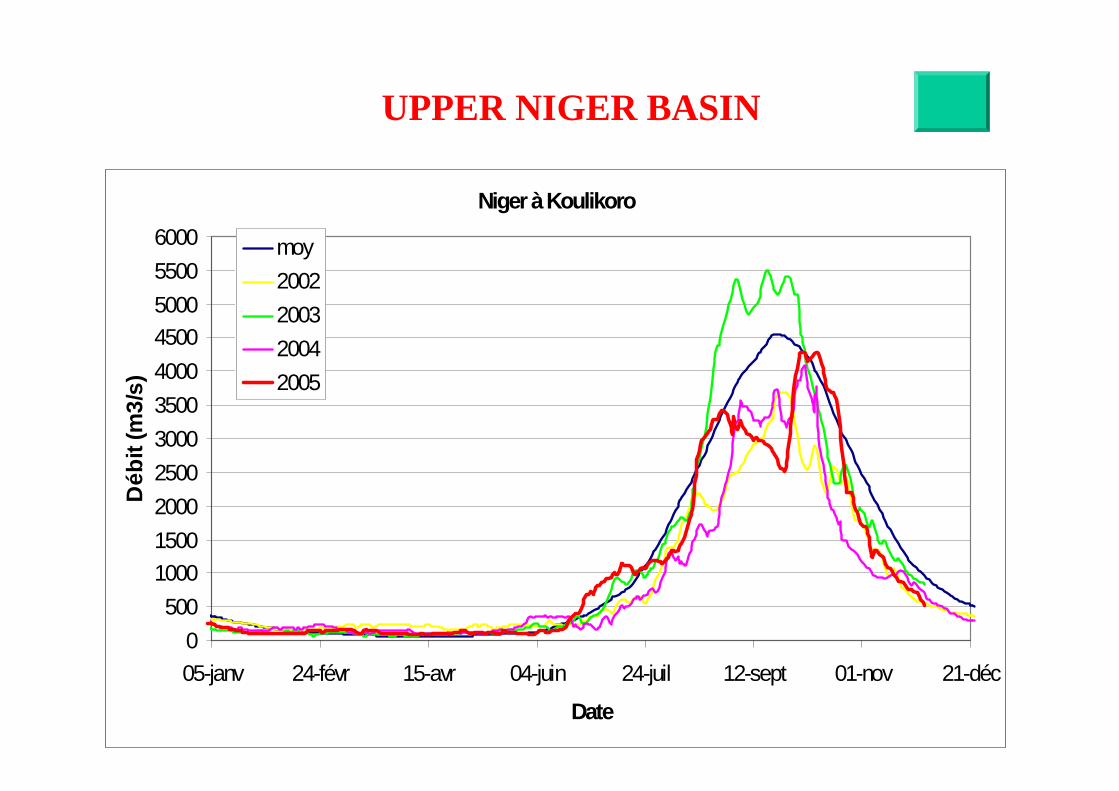
Niger à Koulikoro
0500
10001500200025003000350040004500500055006000
05-janv 24-févr 15-avr 04-juin 24-juil 12-sept 01-nov 21-déc
Date
Déb
it (m
3/s)
moy2002200320042005
UPPER NIGER BASIN
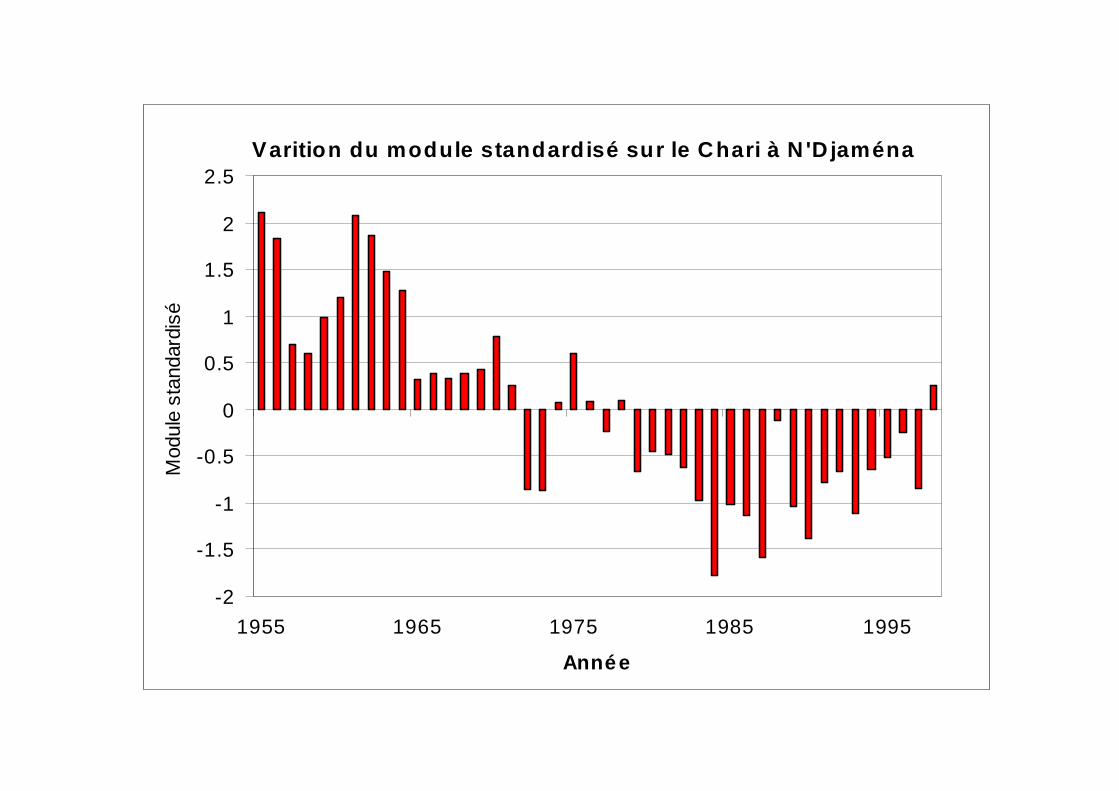
Varition du module standardisé sur le Chari à N 'D jaména
-2
-1.5
-1
-0.5
0
0.5
1
1.5
2
2.5
1955 1965 1975 1985 1995
Année
Mod
ule
stan
dard
isé
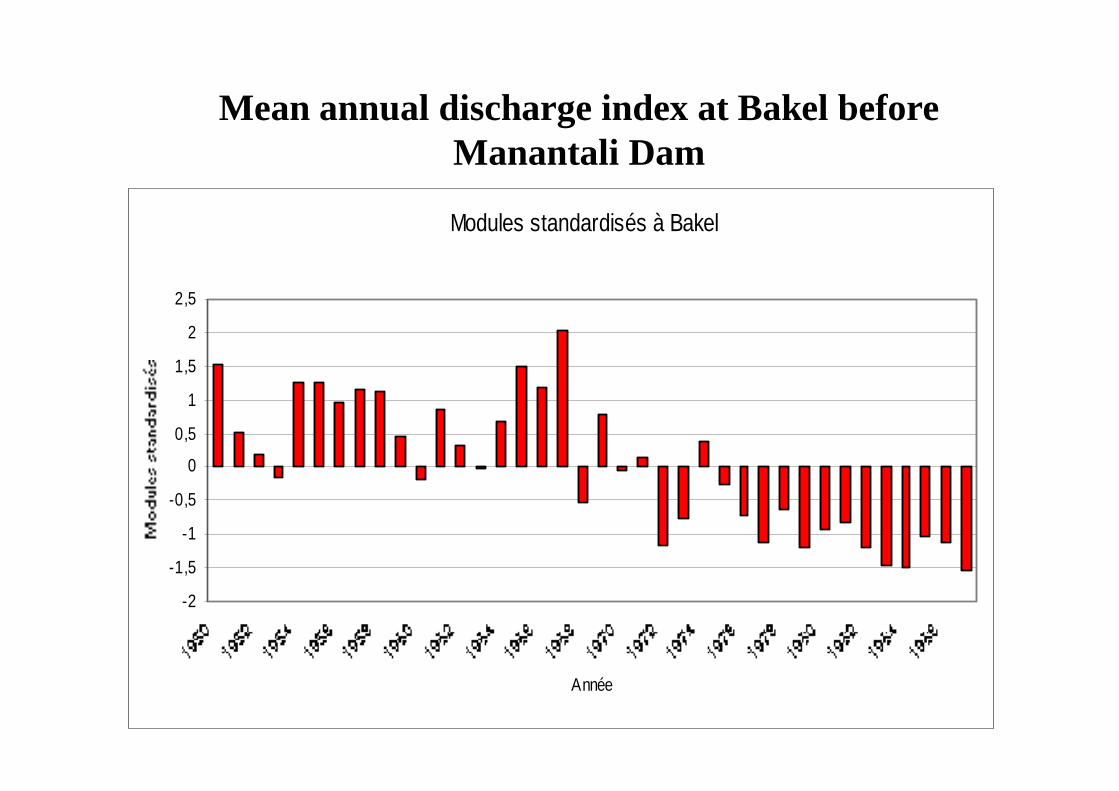
Modules standardisés à Bakel
-2
-1,5
-1
-0,5
0
0,5
1
1,5
2
2,5
Année
Mean annual discharge index at Bakel beforeManantali Dam
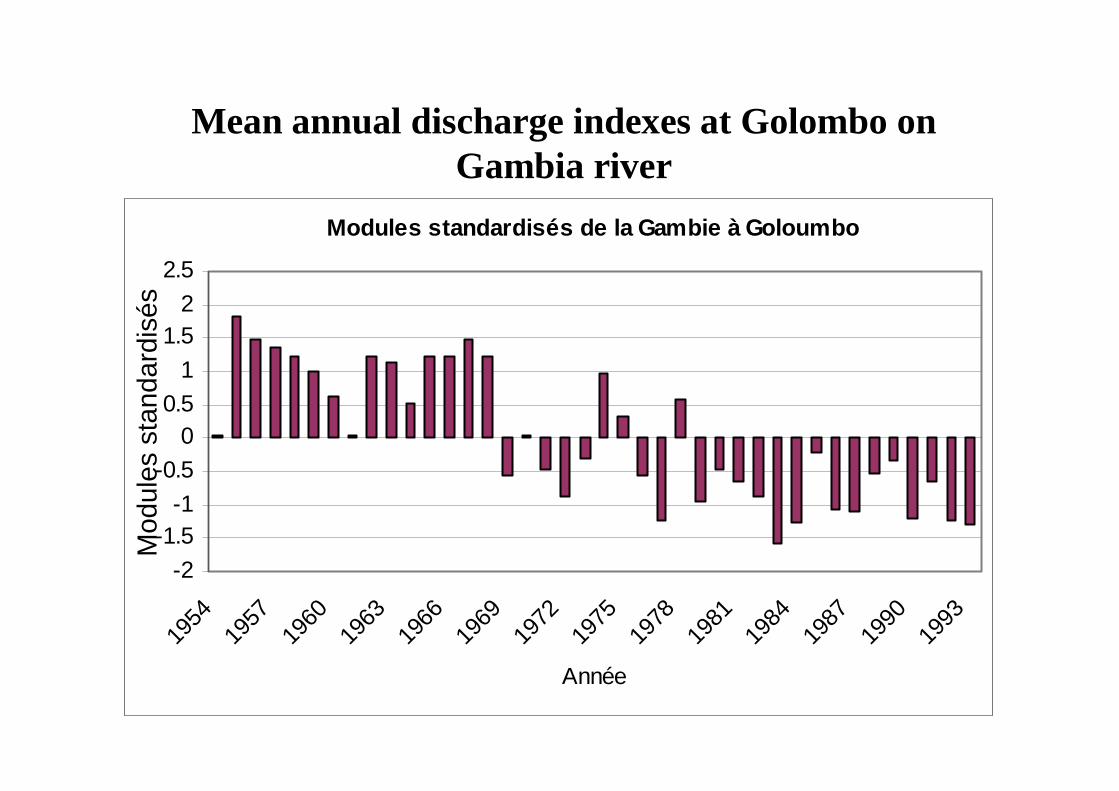
Modules standardisés de la Gambie à Goloumbo
-2-1.5
-1-0.5
00.5
11.5
22.5
1954
1957
1960
1963
1966
1969
1972
1975
1978
1981
1984
1987
1990
1993
Année
Mod
ules
sta
ndar
disé
sMean annual discharge indexes at Golombo on
Gambia river
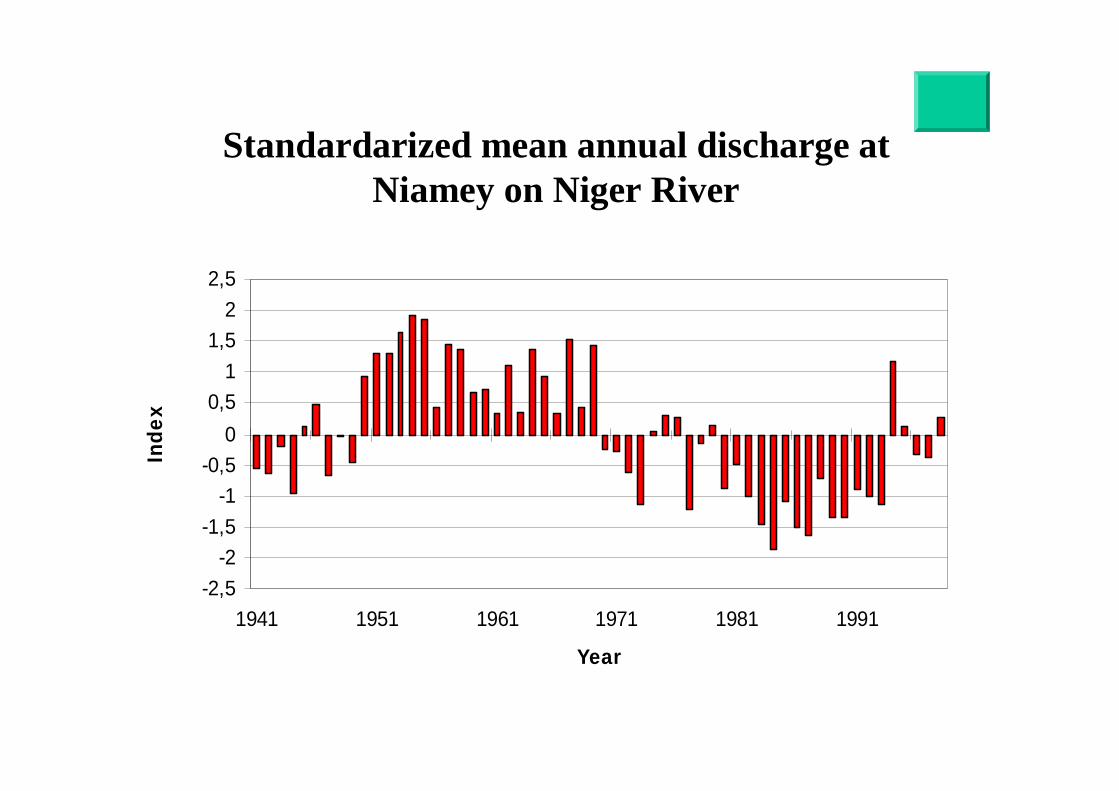
-2,5-2
-1,5-1
-0,50
0,51
1,52
2,5
1941 1951 1961 1971 1981 1991
Year
Inde
xStandardarized mean annual discharge at
Niamey on Niger River
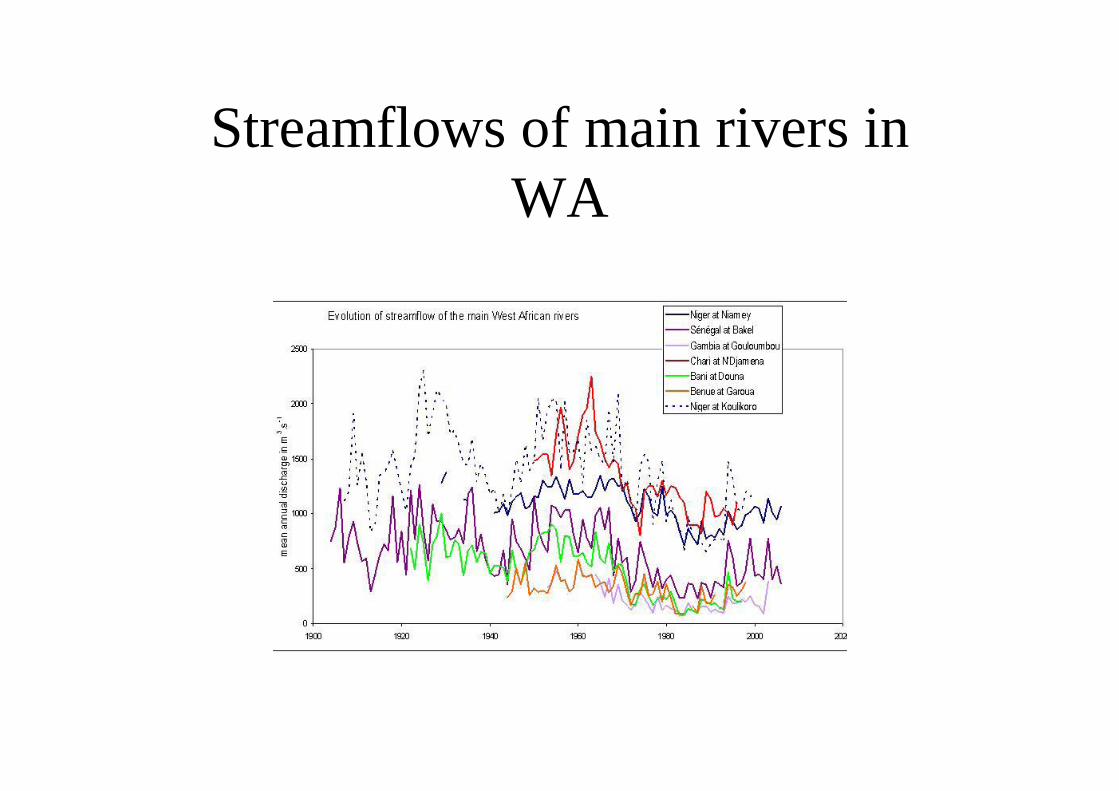
Streamflows of main rivers in WA
0
500
1000
1500
2000
2500
29-juin 18-août 07-oct 26-nov 15-janv 05-mars 24-avr 13-juin
Date
Disc
harg
e (m
3 s-1)
avant 1969
après 1969
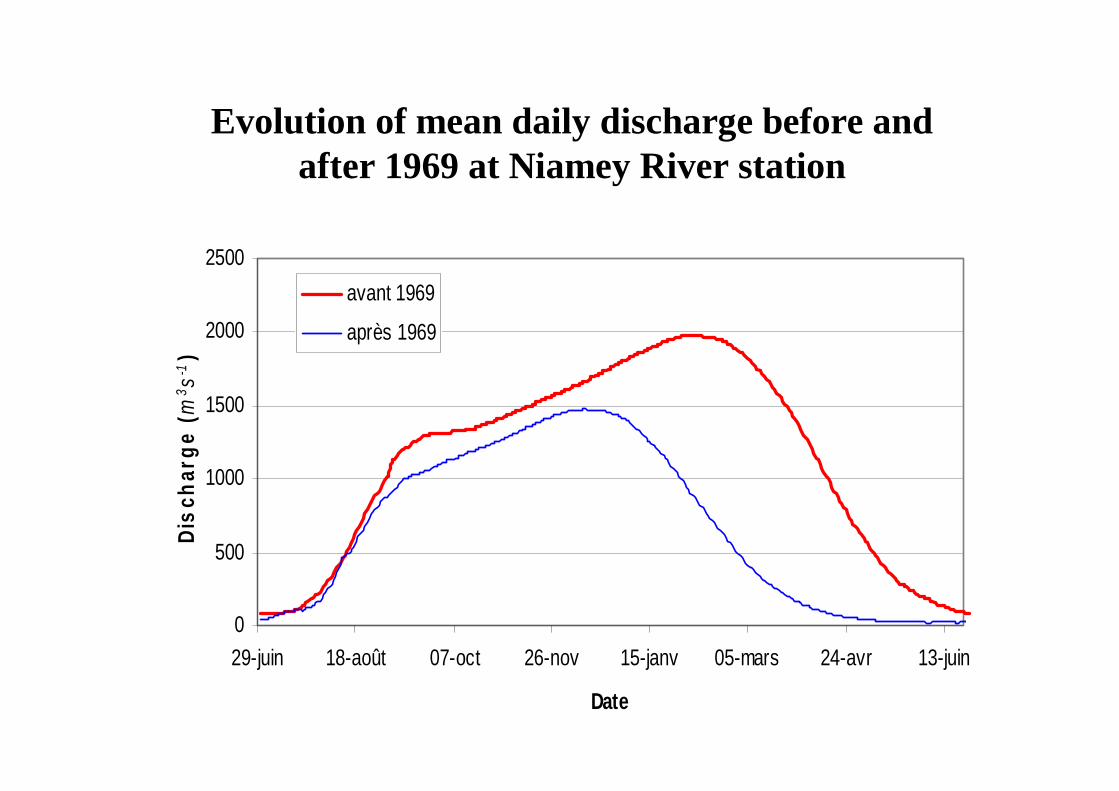
Evolution of mean daily discharge before and after 1969 at Niamey River station
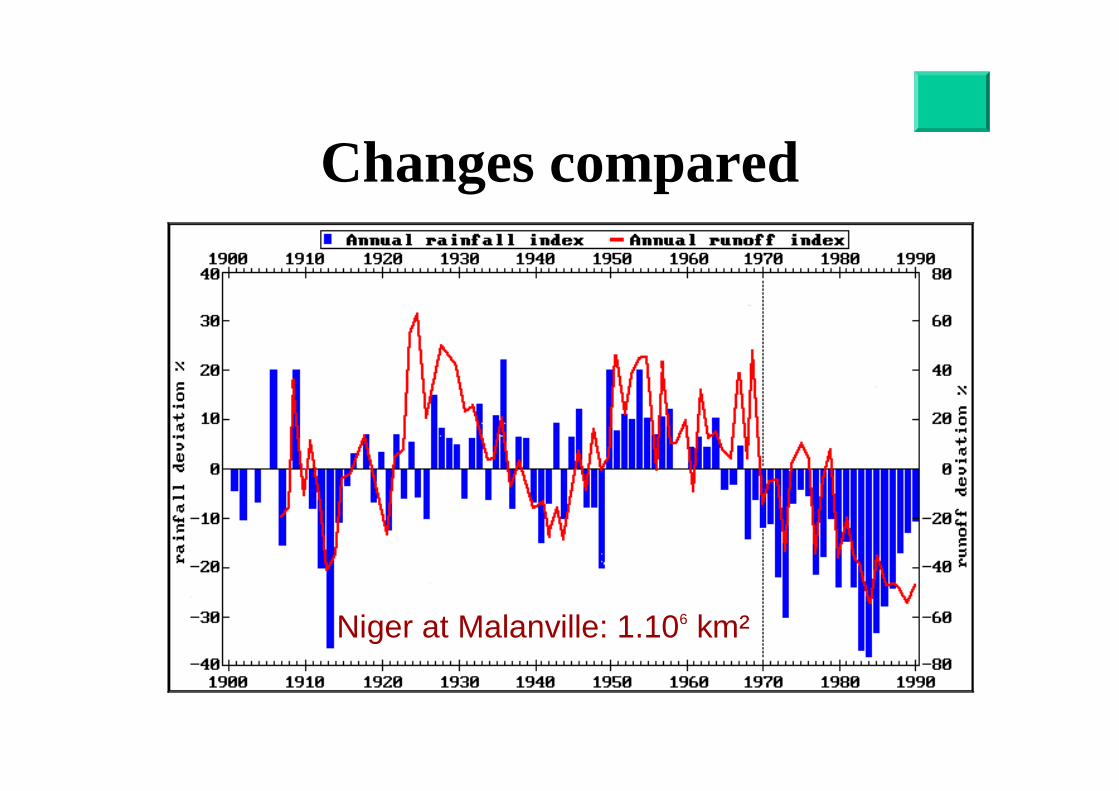
Niger at Malanville: 1.106 km²
Changes compared
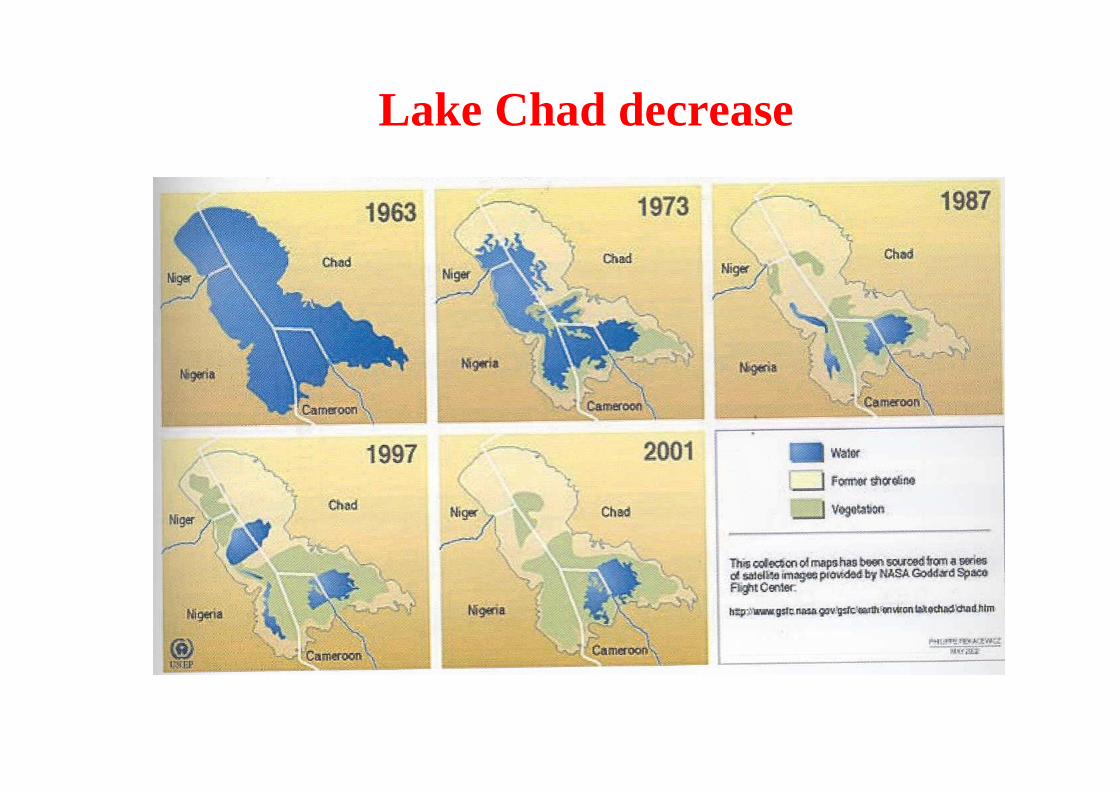
Lake Chad decrease
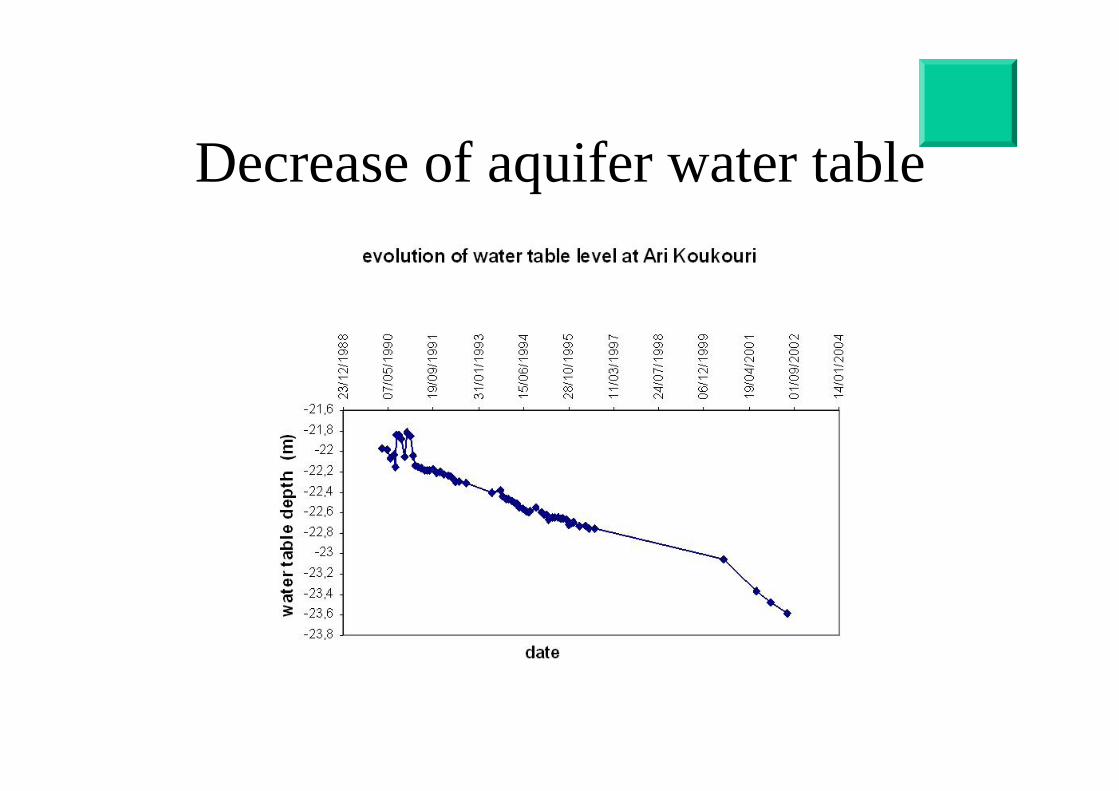
Decrease of aquifer water table
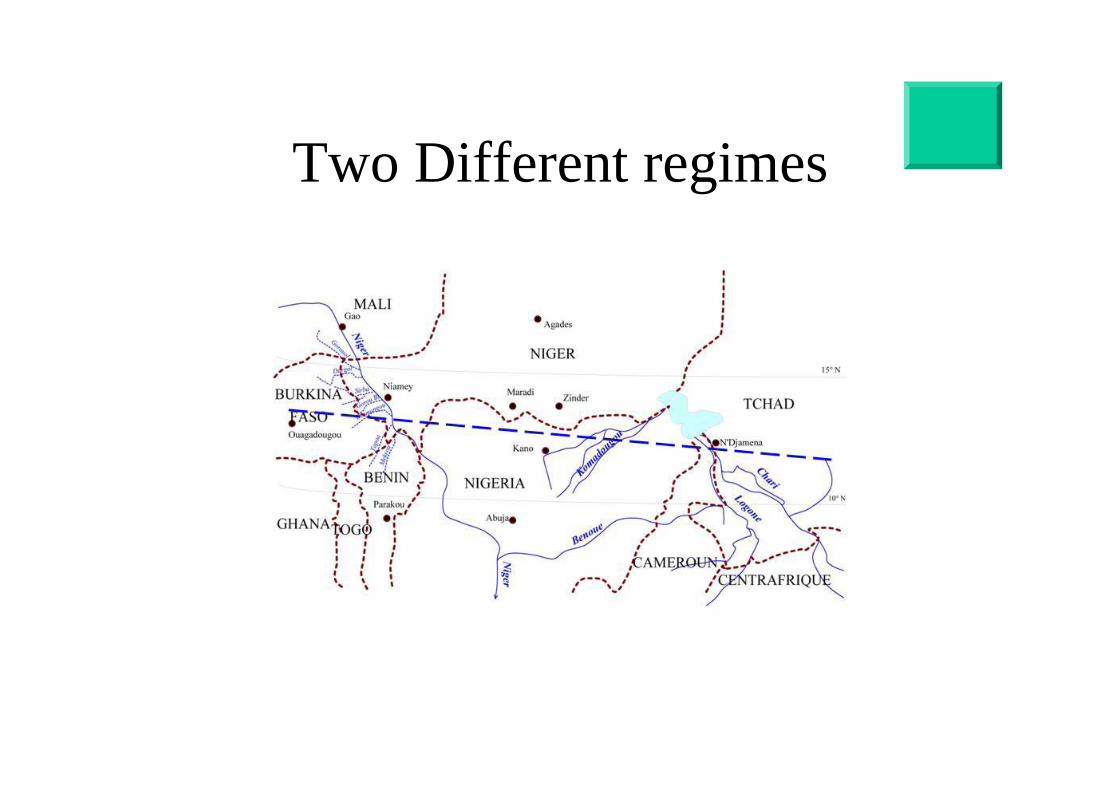
Two Different regimes
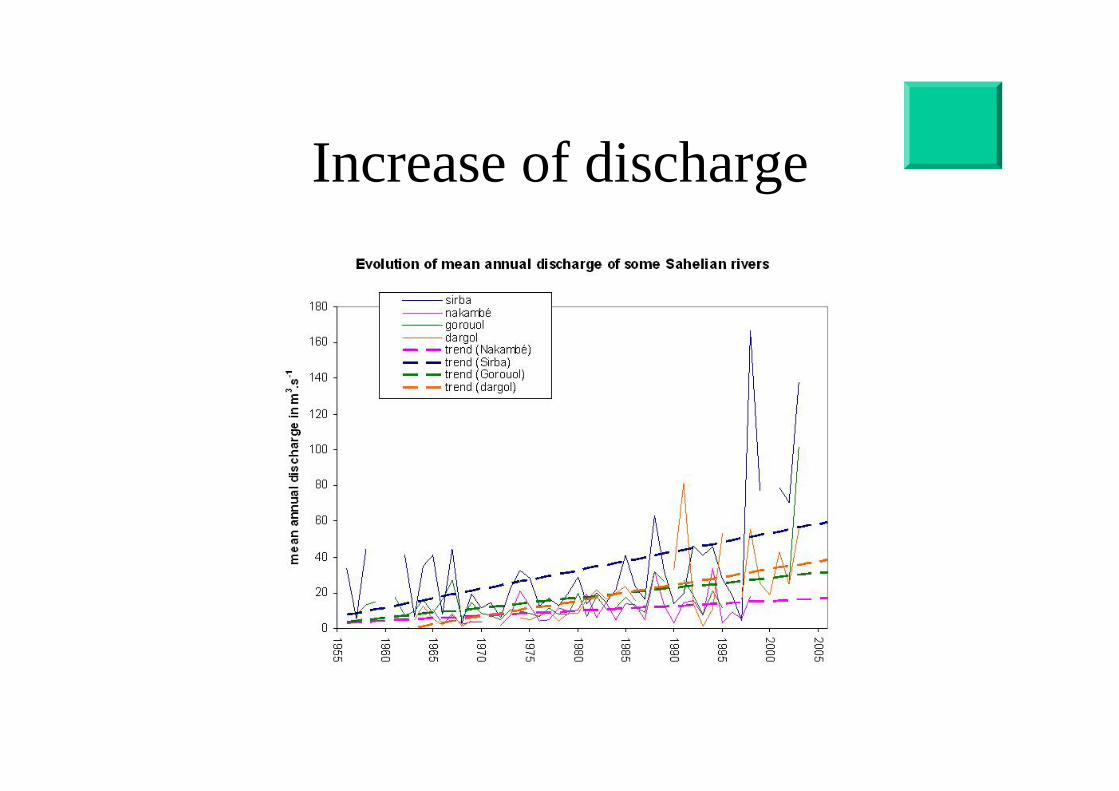
Increase of discharge
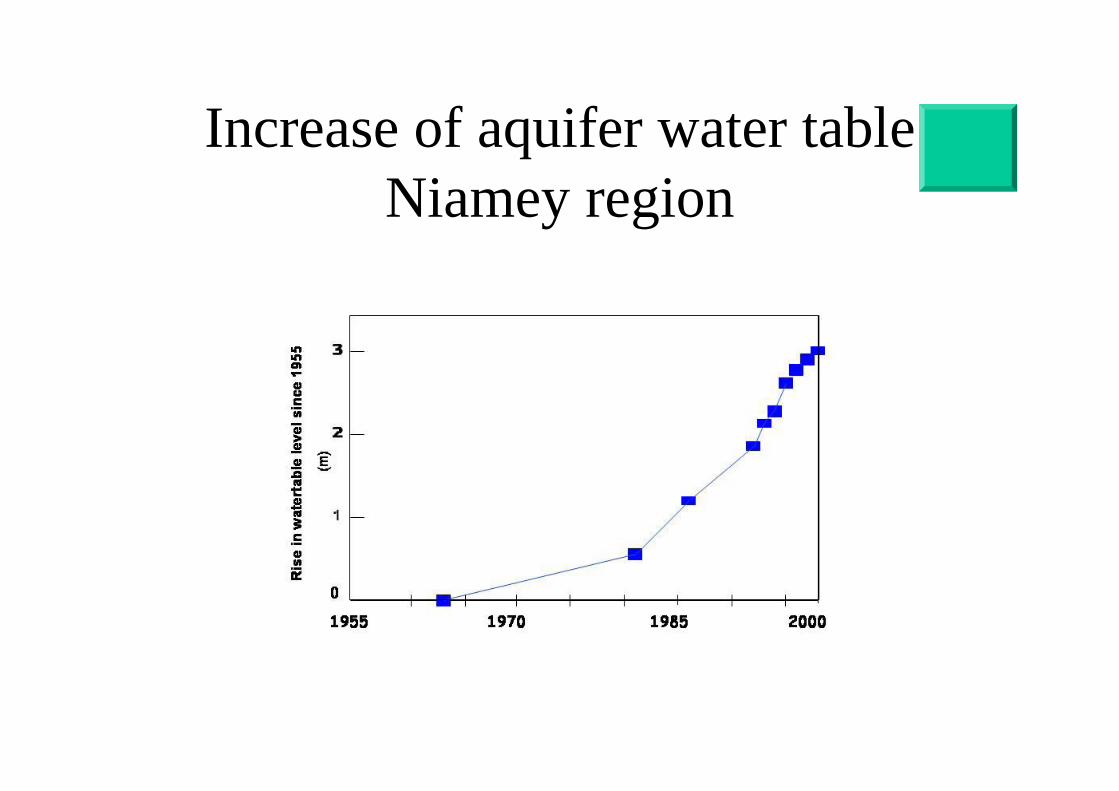
Increase of aquifer water tableNiamey region
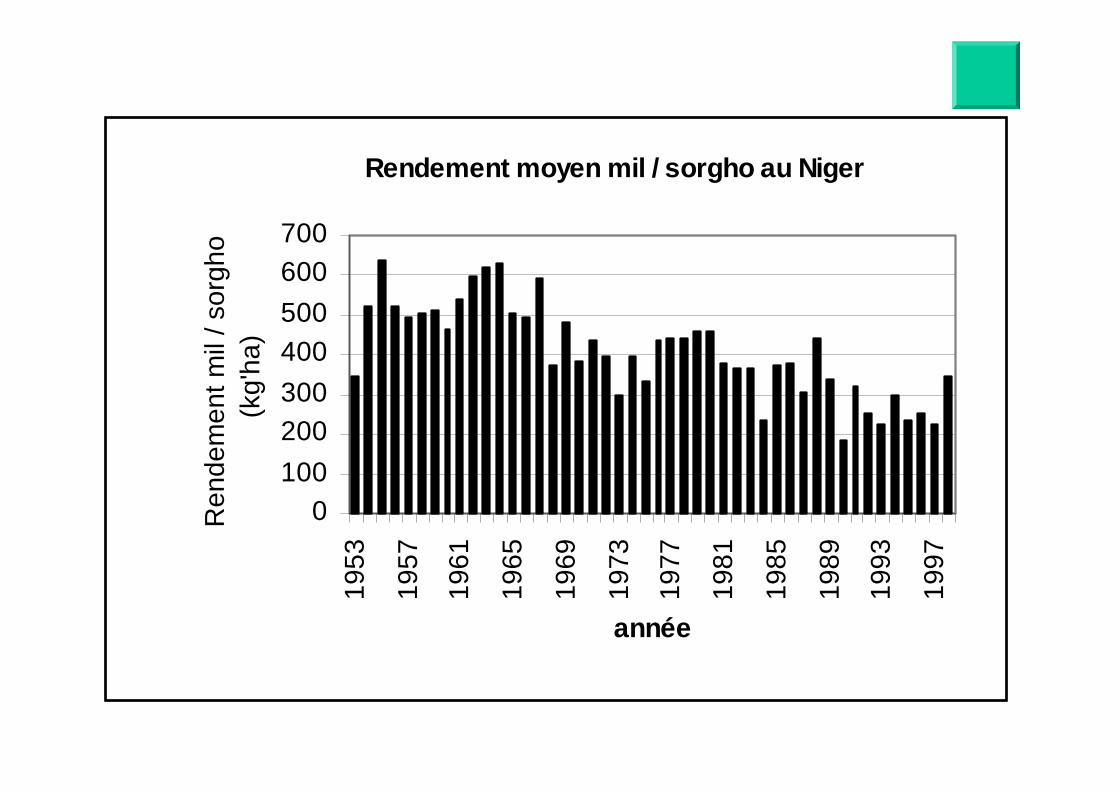
Rendement moyen mil / sorgho au Niger
0100200300400500600700
1953
1957
1961
1965
1969
1973
1977
1981
1985
1989
1993
1997
année
Ren
dem
ent m
il / s
orgh
o (k
g'ha
)
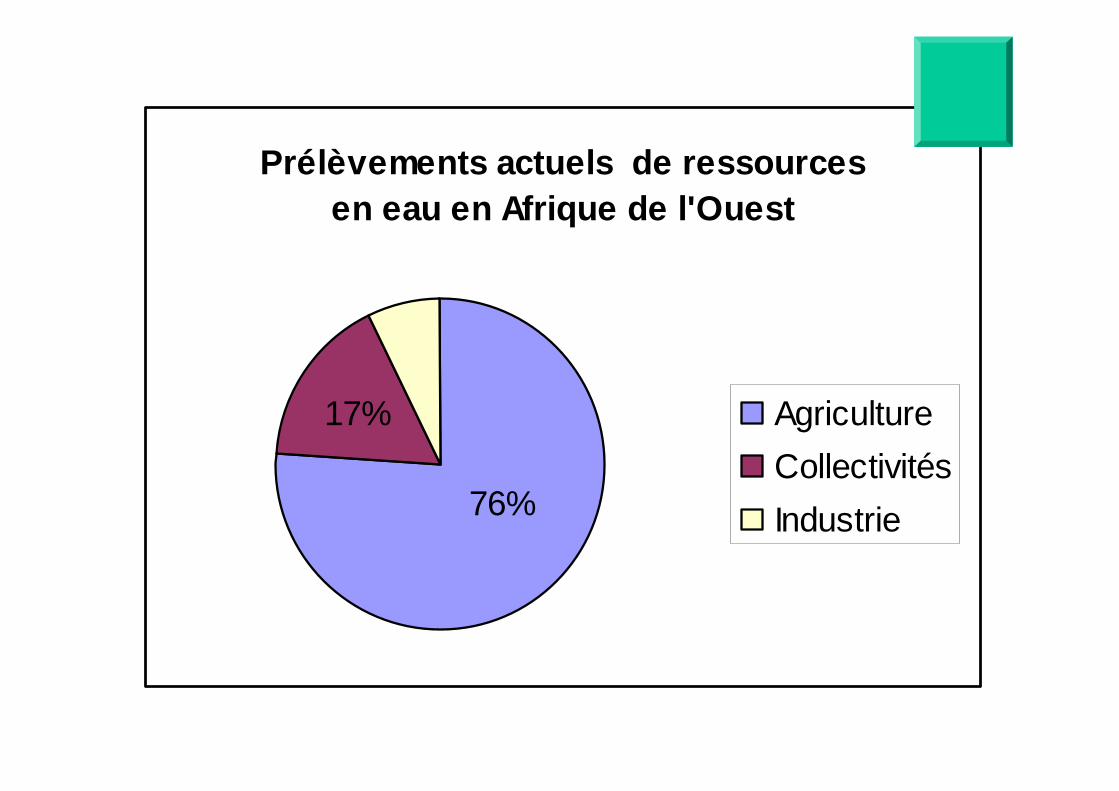
Prélèvements actuels de ressources en eau en Afrique de l'Ouest
AgricultureCollectivitésIndustrie76%
17%
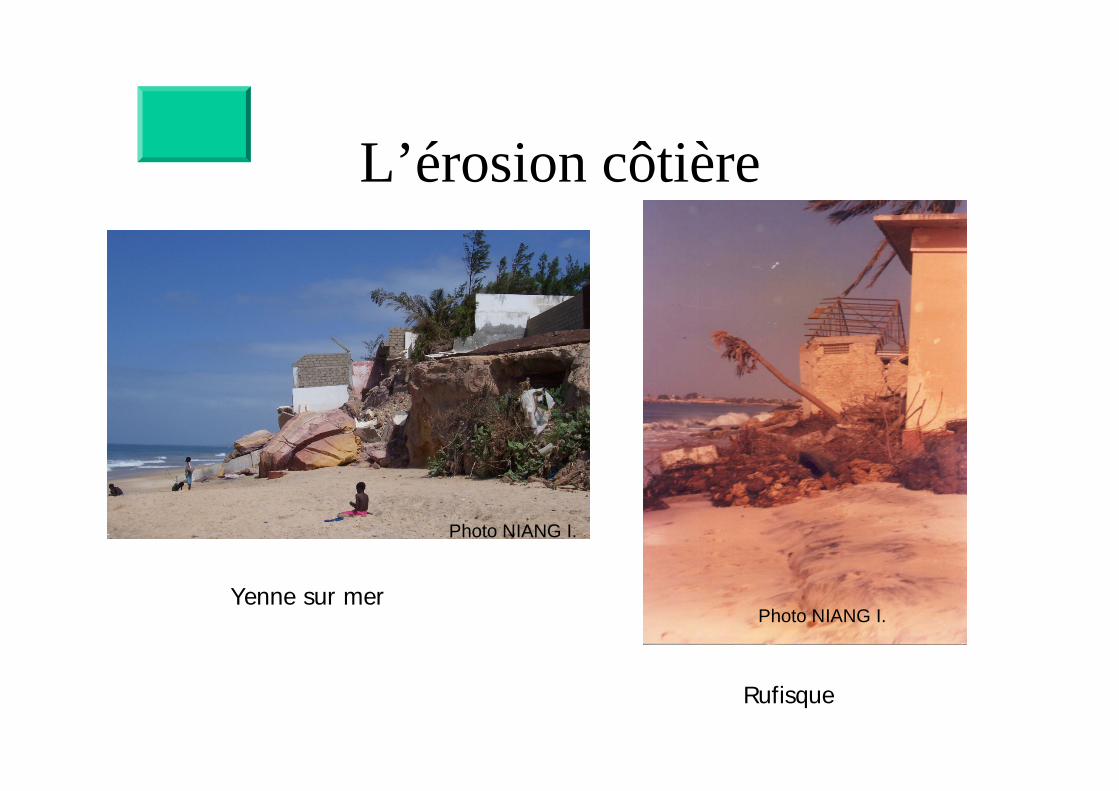
L’érosion côtière
Yenne sur mer
Rufisque
Photo NIANG I.
Photo NIANG I.
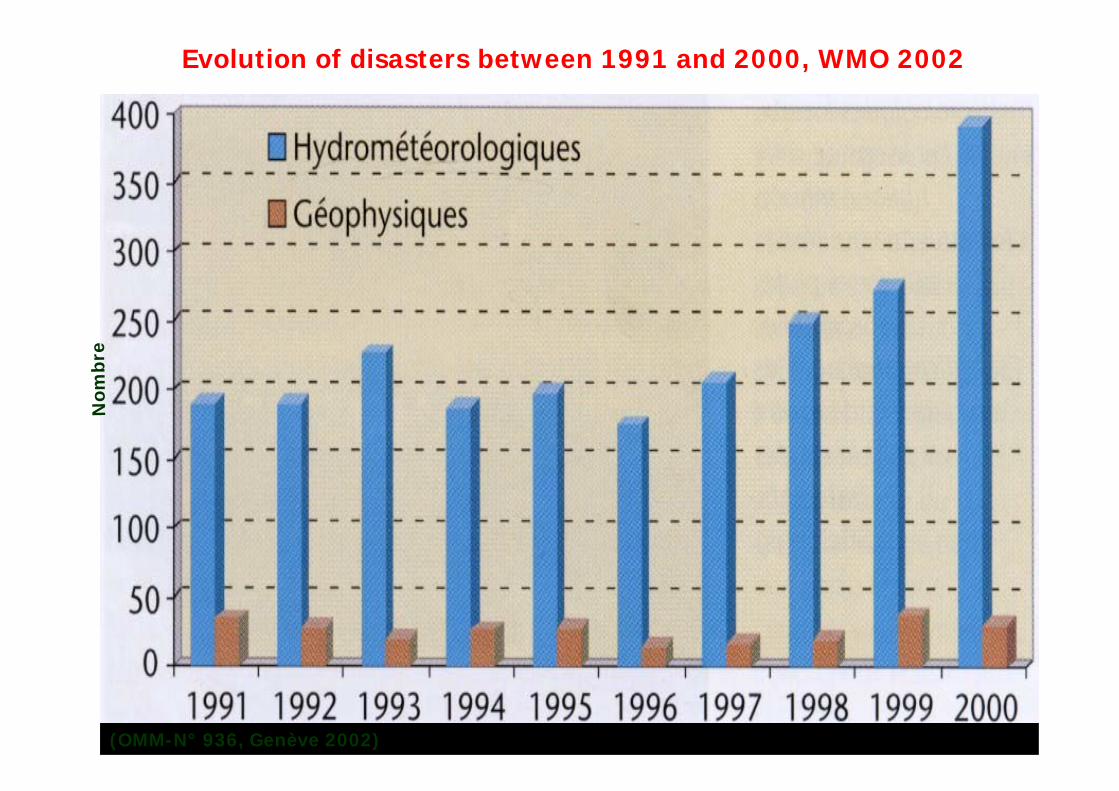
Nom
bre
Evolution of disasters between 1991 and 2000, WMO 2002
(OMM-N° 936, Genève 2002)
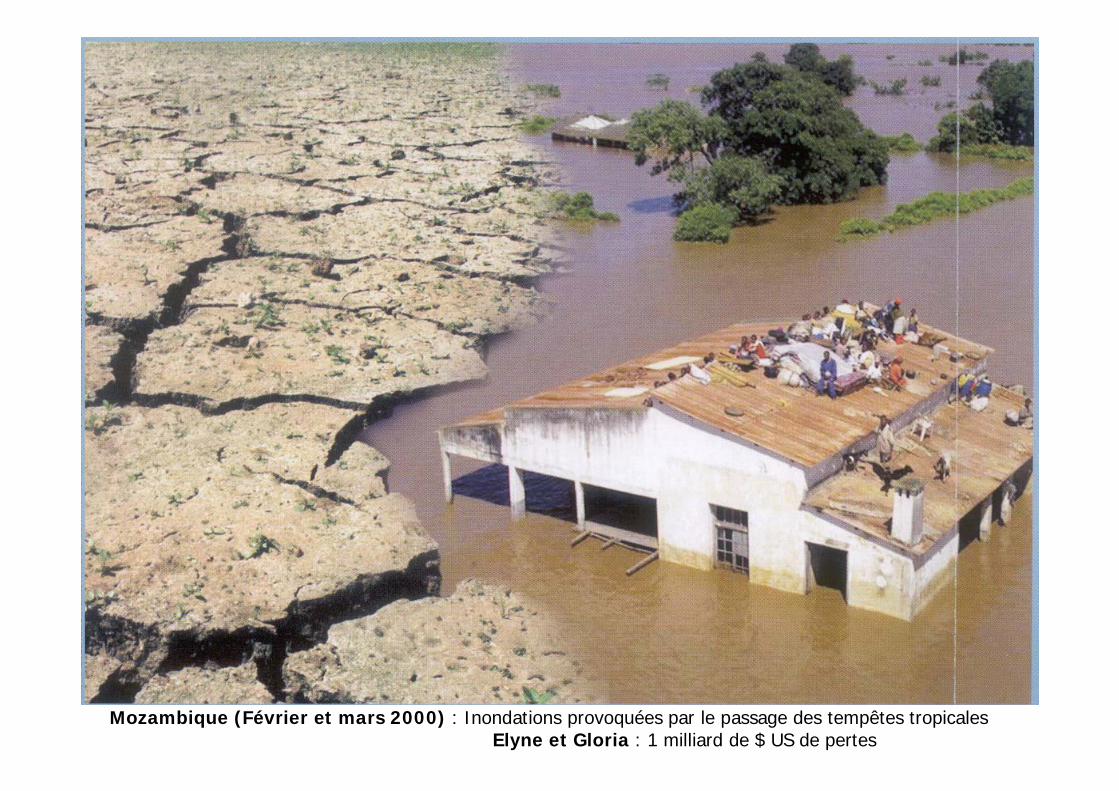
Mozambique (Février et mars 2000) : Inondations provoquées par le passage des tempêtes tropicales Elyne et Gloria : 1 milliard de $ US de pertes
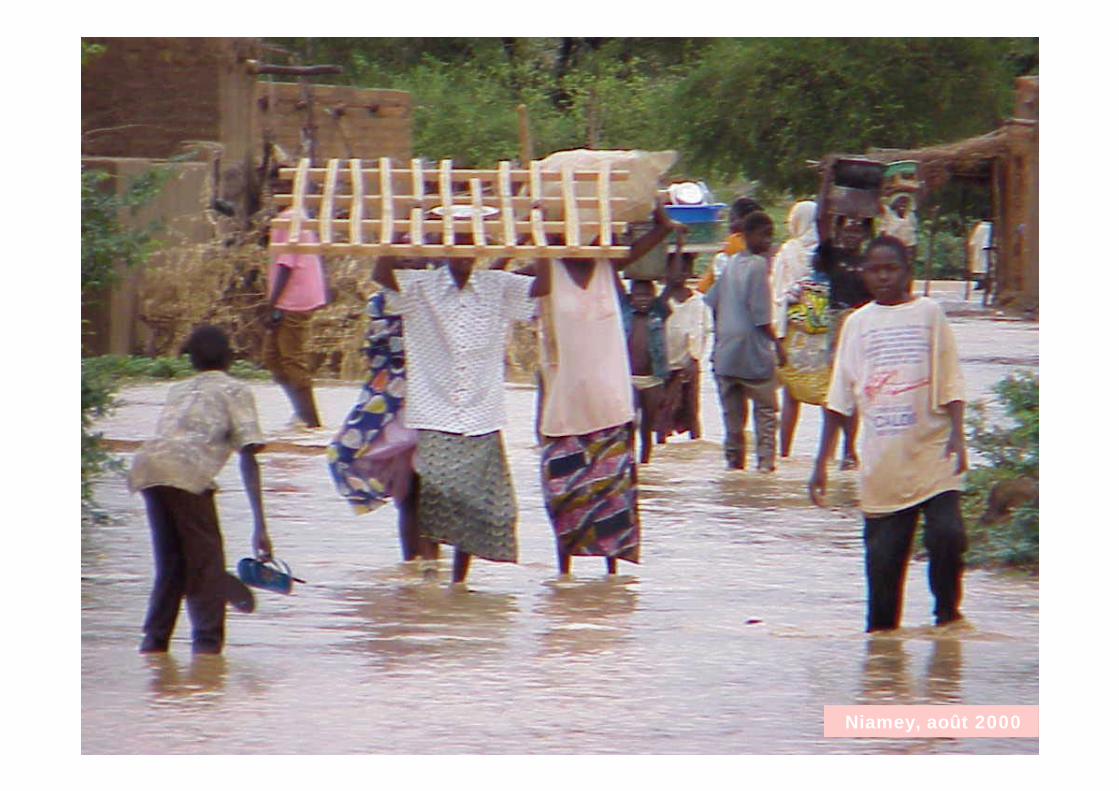
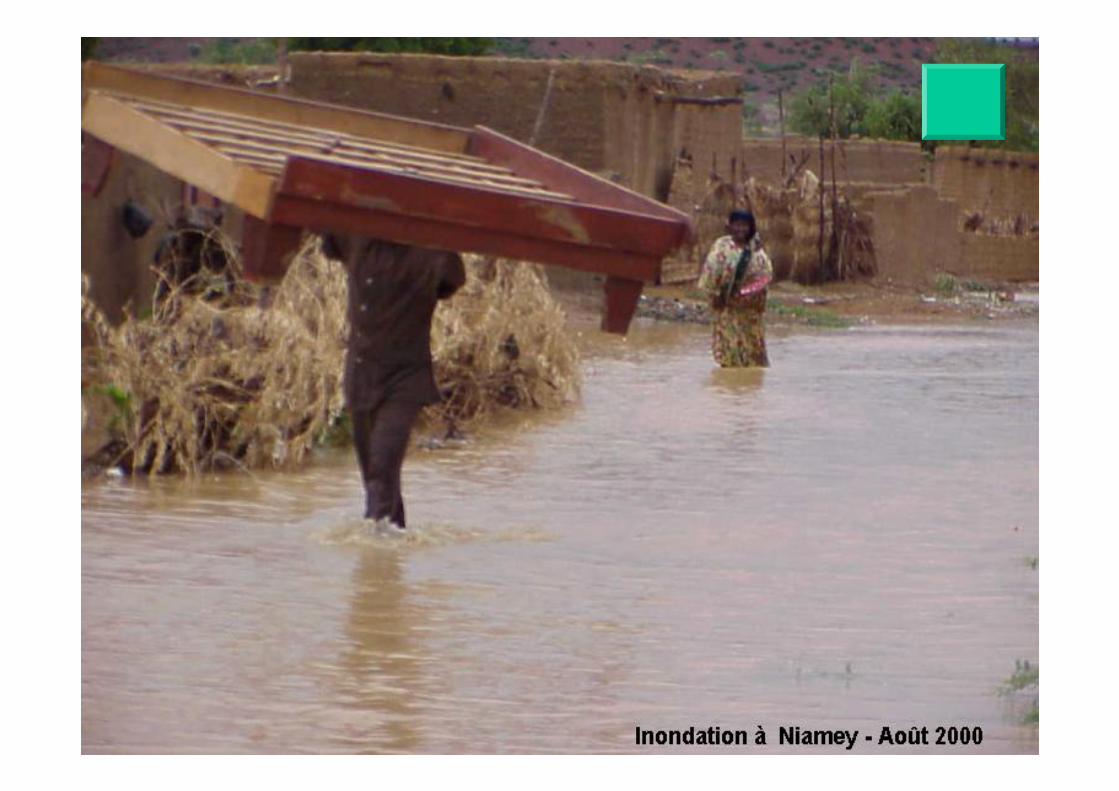
Niamey, août 2000
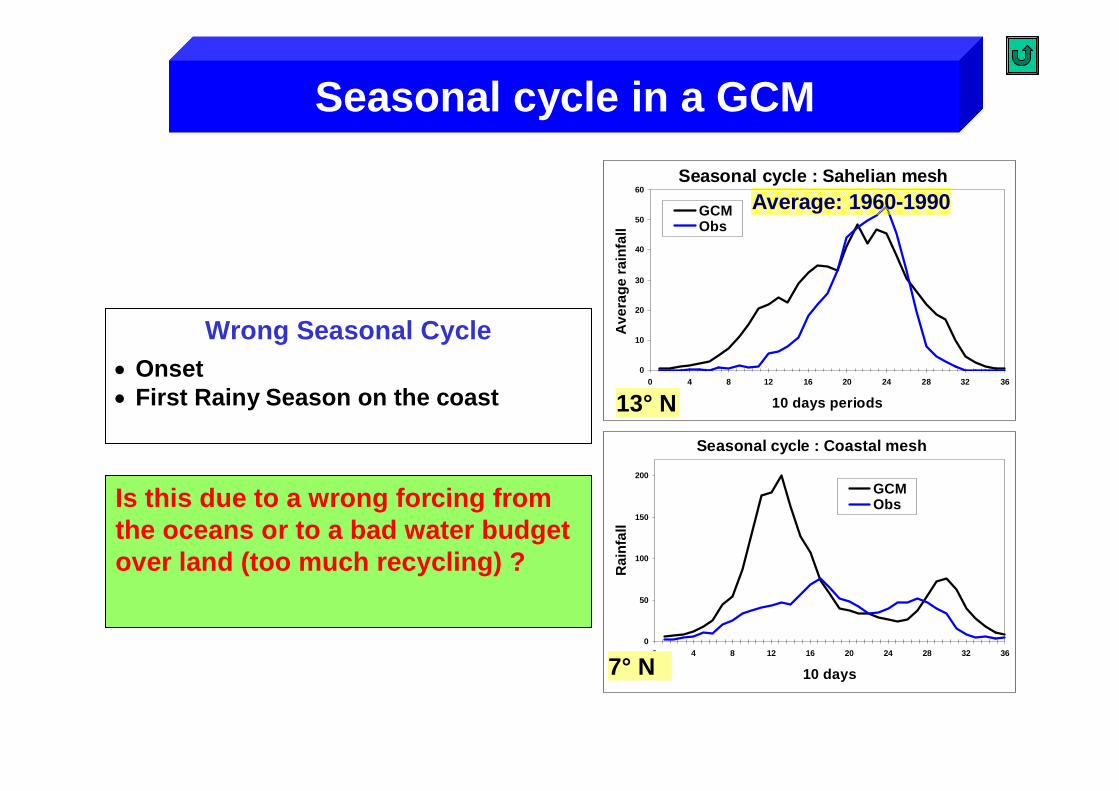
Wrong Seasonal Cycle• Onset• First Rainy Season on the coast
Seasonal cycle : Sahelian mesh
0
10
20
30
40
50
60
0 4 8 12 16 20 24 28 32 36
10 days periods
Ave
rage
rain
fall
GCMObs
13° NSeasonal cycle : Coastal mesh
0
50
100
150
200
0 4 8 12 16 20 24 28 32 36
10 days
Rai
nfal
l
GCMObs
7° N
Average: 1960-1990
Seasonal cycle in a GCM
Is this due to a wrong forcing from the oceans or to a bad water budget over land (too much recycling) ?
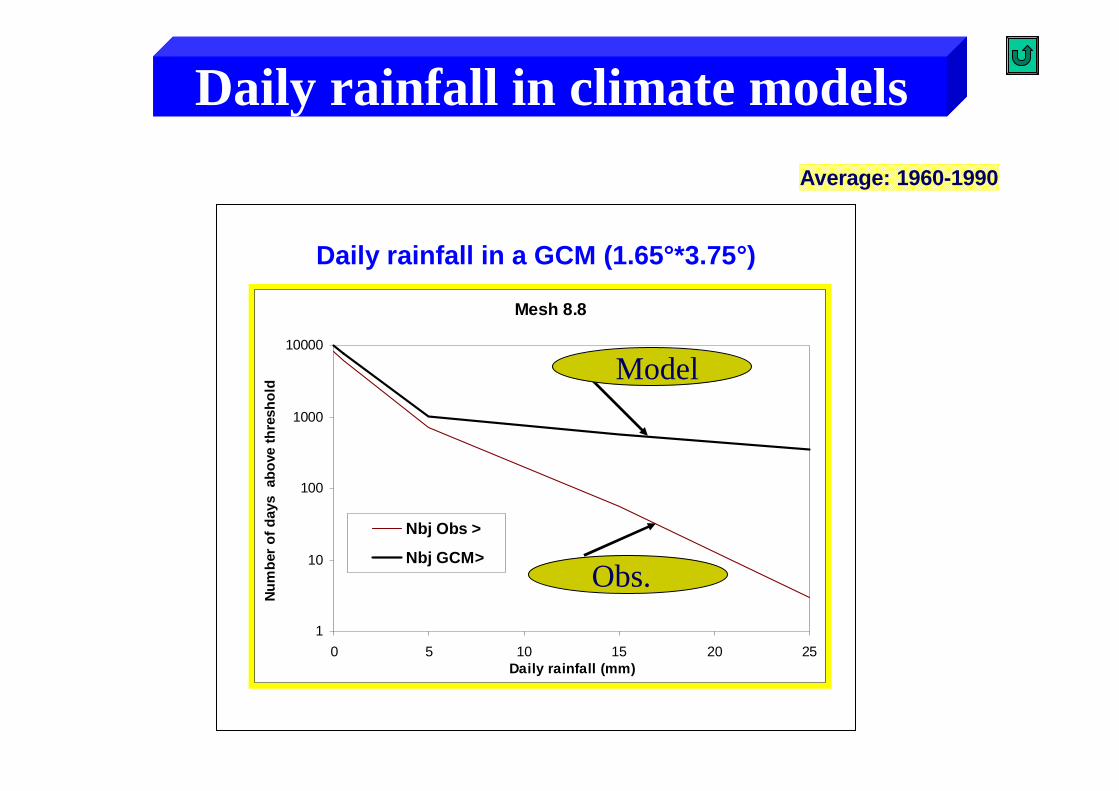
Average: 1960-1990
Daily rainfall in a GCM (1.65°*3.75°)
Mesh 8.8
1
10
100
1000
10000
0 5 10 15 20 25Daily rainfall (mm)
Num
ber o
f day
s a
bove
thre
shol
d
Nbj Obs >
Nbj GCM>
Model
Obs.
Daily rainfall in climate models
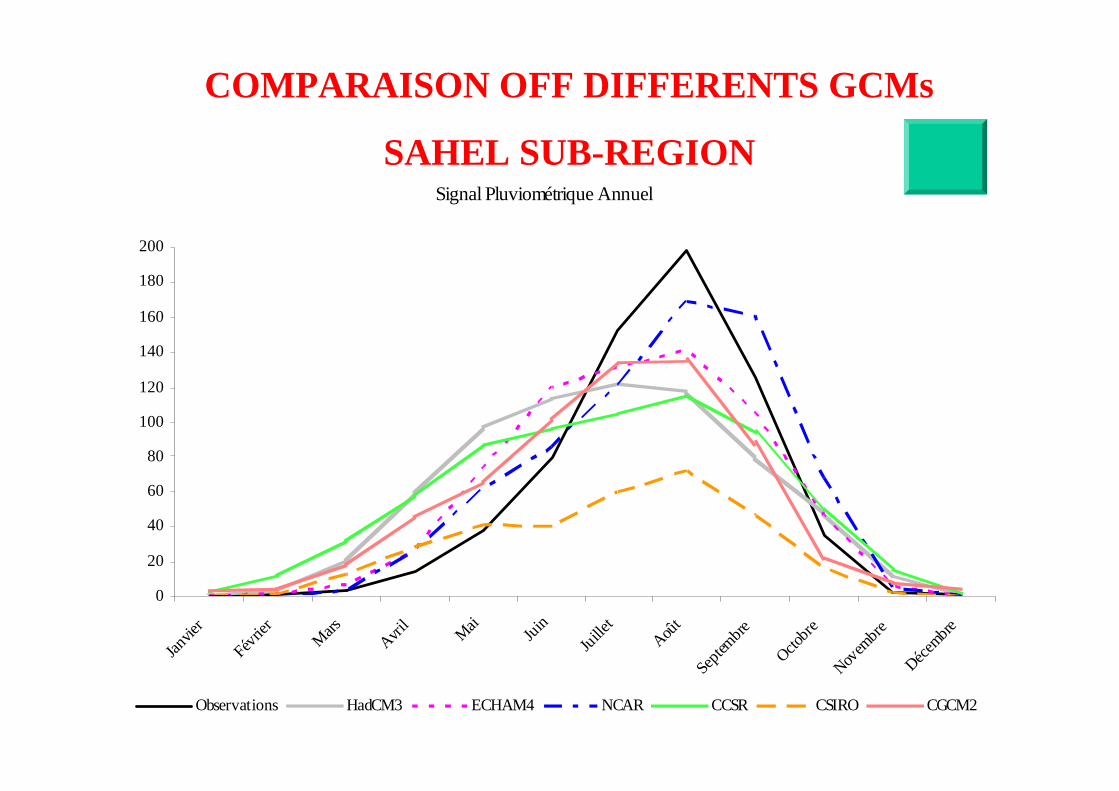
Signal Pluviométrique Annuel
0
20
40
60
80
100
120
140
160
180
200
Janvie
r
Févrie
r
Mars
Avril
Mai Juin
Juille
t
Août
Septe
mbre
Octobre
Novem
bre
Décembre
Observations HadCM3 ECHAM4 NCAR CCSR CSIRO CGCM2
COMPARAISON OFF DIFFERENTS GCMs
SAHEL SUB-REGION
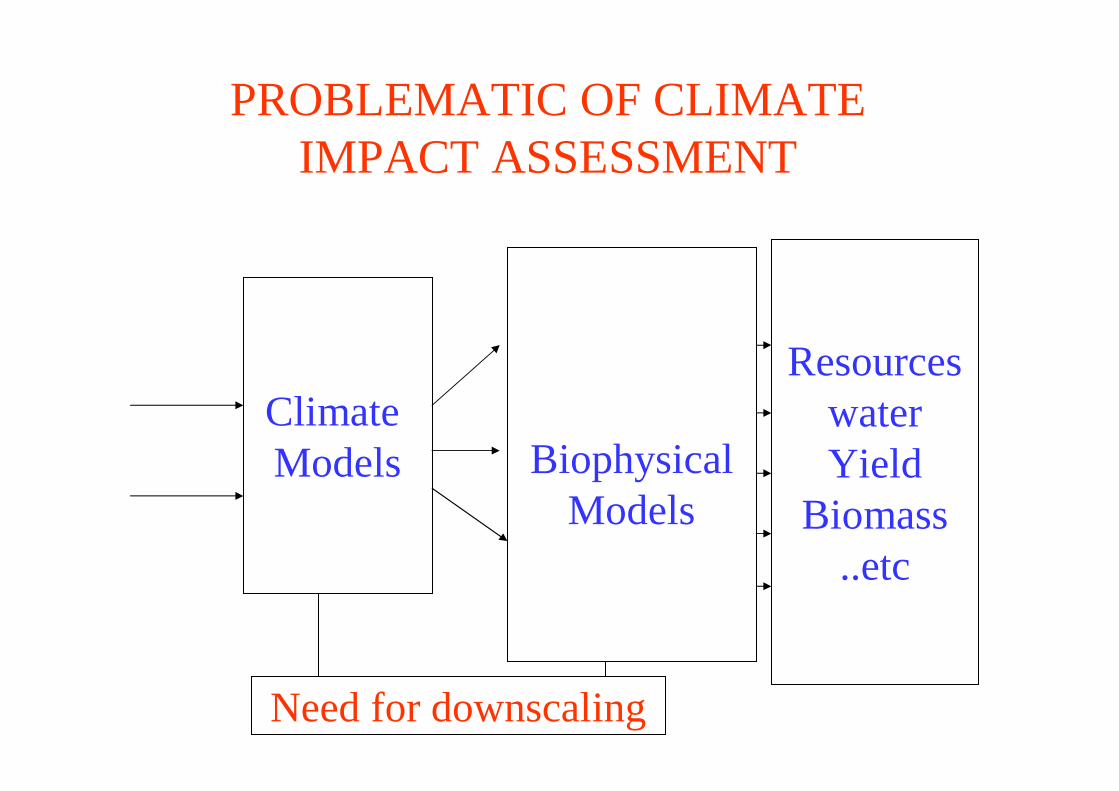
PROBLEMATIC OF CLIMATE IMPACT ASSESSMENT
ClimateModels Biophysical
Models
ResourceswaterYield
Biomass..etc
Need for downscaling
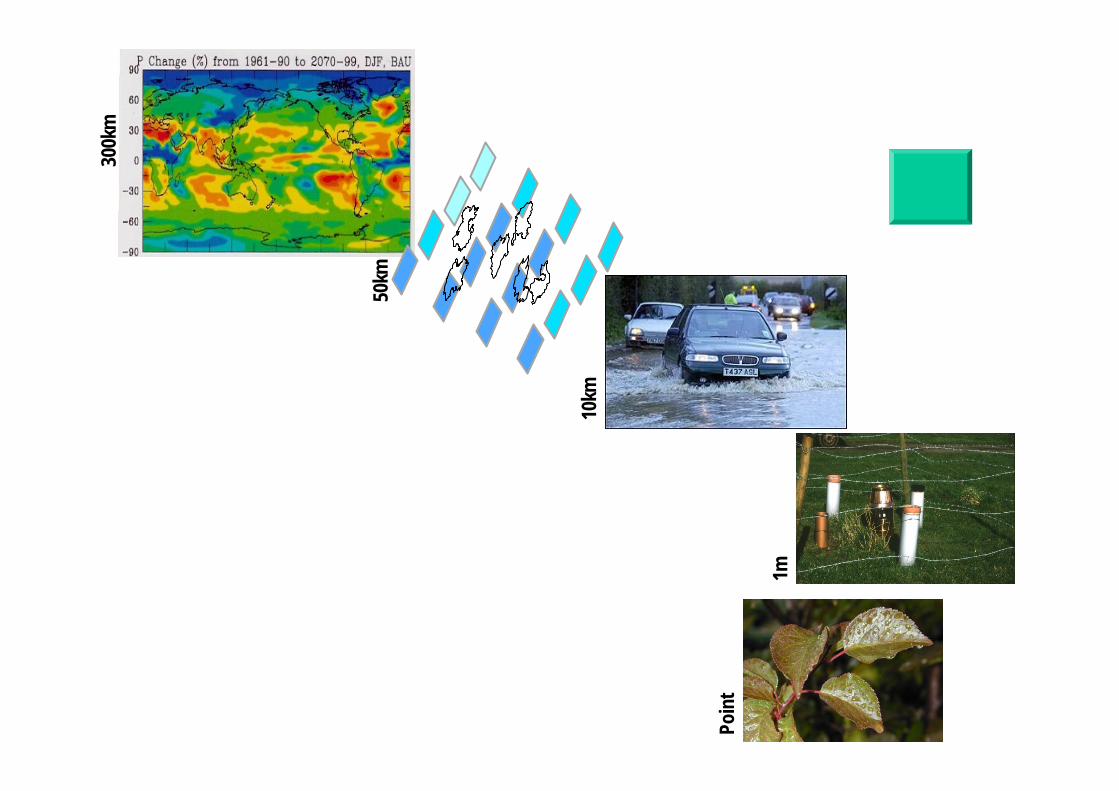
300k
m
50km
10km
1m
Poin
t
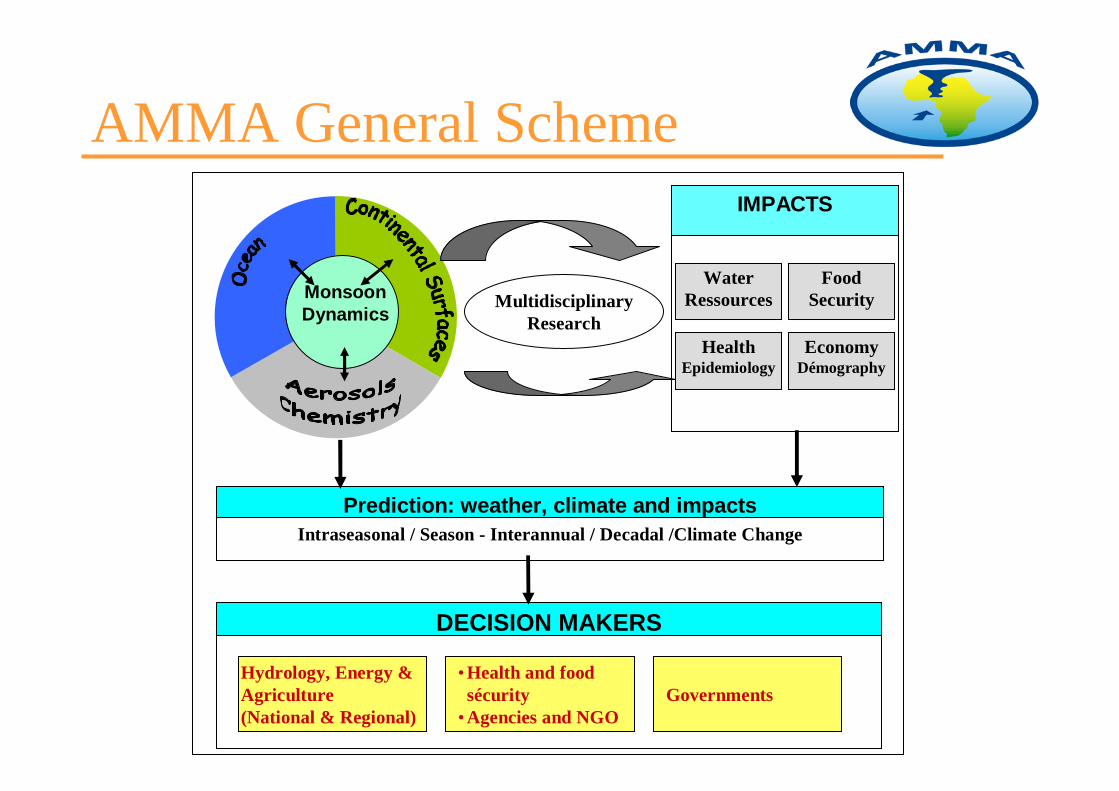
AMMA General Scheme
DECISION MAKERS
Hydrology, Energy & Agriculture (National & Regional)
• Health and foodsécurity
• Agencies and NGOGovernments
Prediction: weather, climate and impactsIntraseasonal / Season - Interannual / Decadal /Climate Change
IMPACTS
Water Ressources
FoodSecurity
HealthEpidemiology
EconomyDémography
MonsoonDynamics
MultidisciplinaryResearch
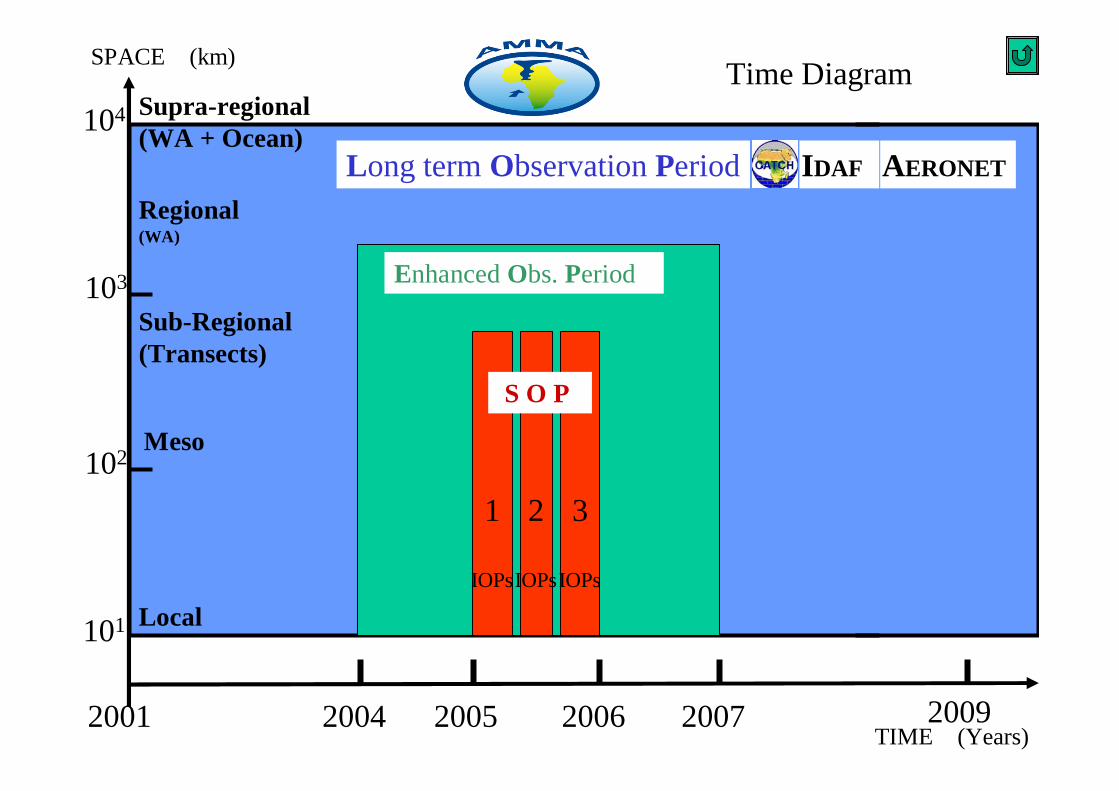
103
Enhanced Obs. Period
Long term Observation Period
2001
Supra-regional(WA + Ocean)
Meso
Regional(WA)
Sub-Regional(Transects)
Local
SPACE (km)
2004 2005 2006 2007
103
101
102
104
1
IOPs
2
IOPs
3
IOPs
S O P
2009TIME (Years)
IDAF AERONET
Time Diagram
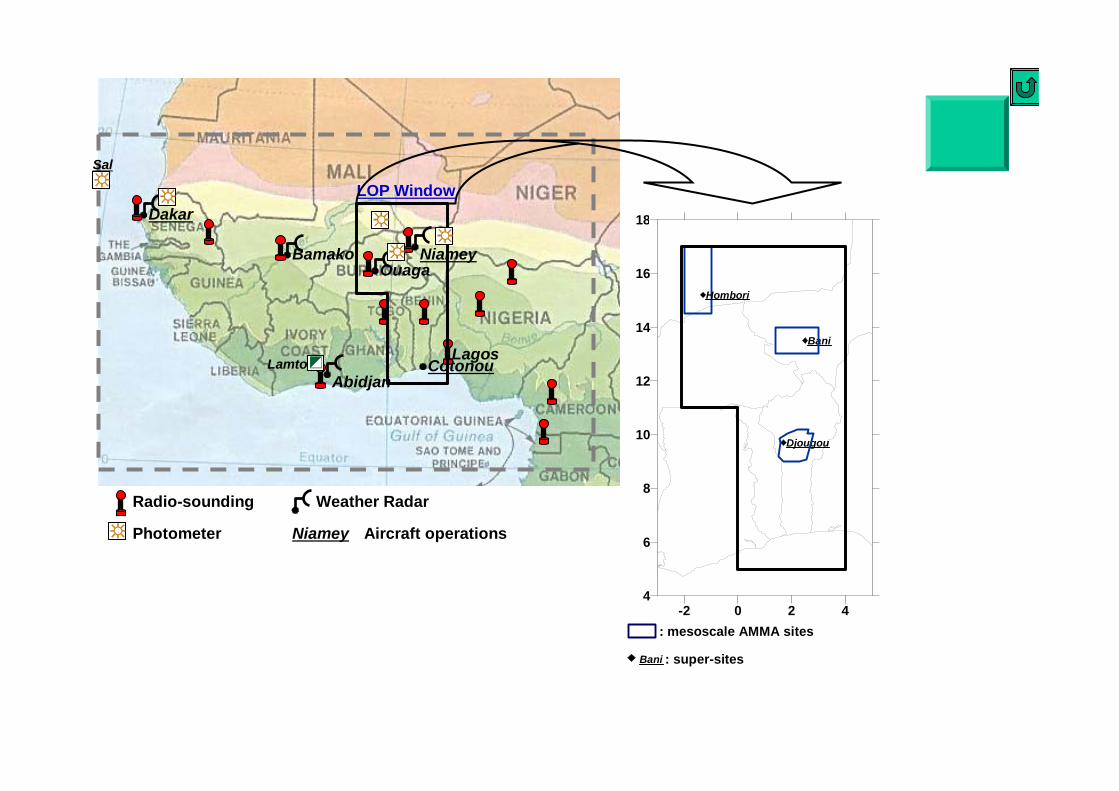
Cotonou
Sal
Dakar
Niamey
Abidjan
OuagaBamako
LagosLamto
Niamey
Weather Radar
Aircraft operations
Radio-sounding
Photometer
LOP Window
-2 0 2 44
6
8
10
12
14
16
18
Hombori
Bani
Djougou
Bani : super-sites
: mesoscale AMMA sites
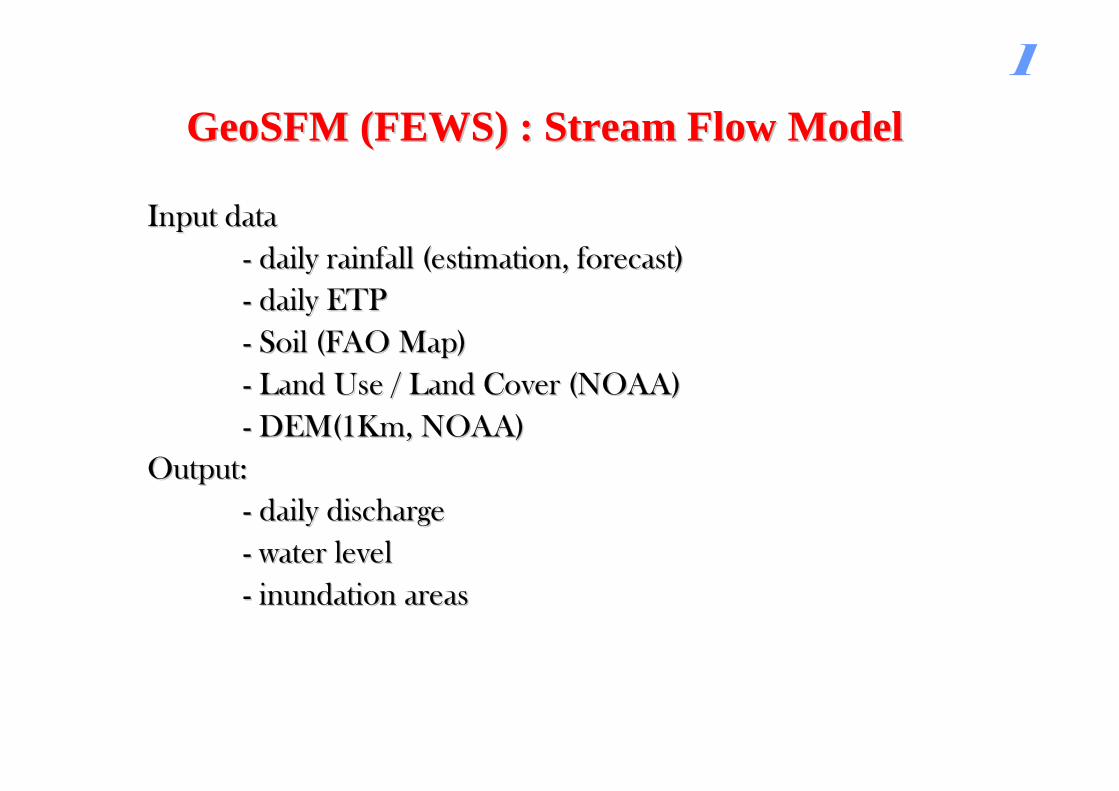
1GeoSFMGeoSFM (FEWS) : Stream Flow Model(FEWS) : Stream Flow Model
Input Input datadata-- dailydaily rainfallrainfall (estimation, (estimation, forecastforecast))-- dailydaily ETPETP-- SoilSoil (FAO (FAO MapMap))-- Land Use / Land Land Use / Land CoverCover (NOAA)(NOAA)-- DEM(1Km, NOAA)DEM(1Km, NOAA)
Output:Output:-- dailydaily dischargedischarge-- water water levellevel-- inundationinundation areasareas
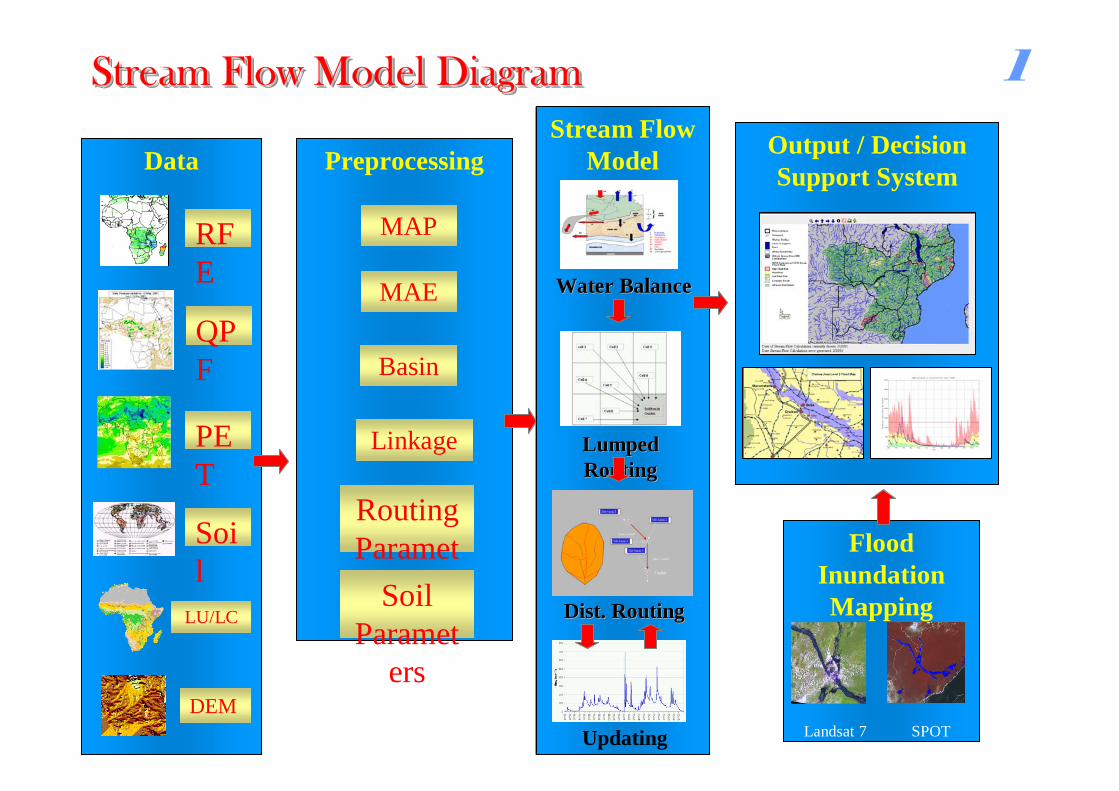
Preprocessing
MAP
MAE
Basin
Linkage
Routing Paramet
ersSoil Paramet
ers
Flood Inundation Mapping
Landsat 7 SPOT
Output / Decision Support SystemData
RFE
PET
Soil
LU/LC
DEM
QPF
Stream Flow Model
Water BalanceWater Balance
Lumped Lumped RoutingRouting
Dist. RoutingDist. Routing
Updating
1 Stream Flow Model DiagramStream Flow Model Stream Flow Model DiagramDiagram
0
500
1000
1500
2000
2500
1 185 369 553 737 921 1105 1289 1473 1657 1841 2025 2209 2393 2577 2761 2945 3129 3313 3497 3681 3865 4049 4233 4417 4601 4785 4969
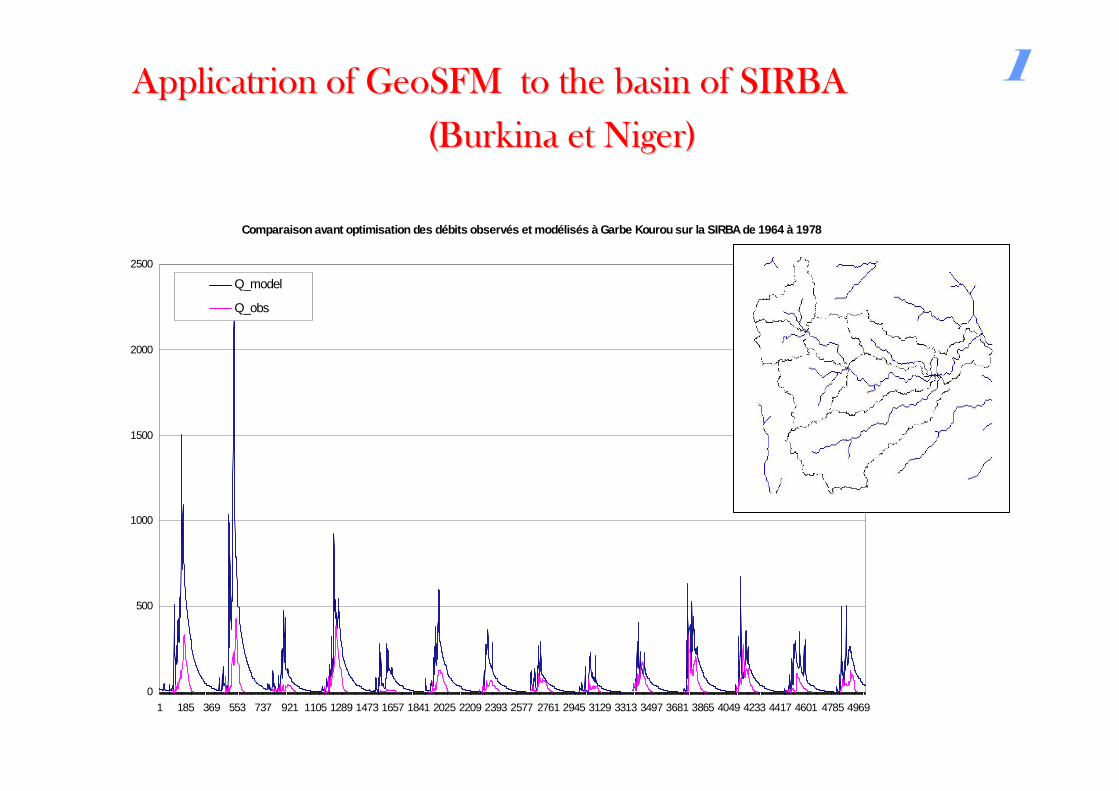
Q_model
Q_obs
Comparaison avant optimisation des débits observés et modélisés à Garbe Kourou sur la SIRBA de 1964 à 1978
ApplicatrionApplicatrion of of GeoSFMGeoSFM to the basin of SIRBA to the basin of SIRBA
(Burkina et Niger)(Burkina et Niger)
1
MODELISATION HYDROLOGIQUE
_______________________________________
IMPORTANCE DE LA PLUIE COMME VARIABLE D’ENTREE SUR LA REPONSE HYDROLOGIQUE
Pluie variable déterminante
Pluie moyenne sur le bassin ou par sous-bassin (global et sémi-distribué)
Pluie sur forme de grille (cas des modèles distribués)
Toute erreur sur la pluie aura un impact important sur le débit en sortie du modèle
Pluie variable déterminante
Réseau de pluviomètres
sont généralement de faible densiténécessité de spatialiser la pluie avec quelle méthode?
Estimation par télédétection
Avec quelle erreur?