Embed Size (px)
Citation preview

(e32 ASAE TECHNICAL PAPER NO. 78-6026
WATER REUSE IN POULTRY PROCESSING
Jack L. Wi therow Sanitary Engineer
U. S. Envi ronmental Protection Agency Industrial Environmental Research Laboratory
Corvallis, Oregon 97330
and
Ahmed tiamza & Samia Saad Ass i s tan t Professors
Higher Ins t i tu te of Pub1 i c Health Alexandria University
A1 exandri a , Egypt For presentation a t the 1978 Summer Meeting AMERICAFI SOCIETY OF AGRICULTURAL ENGINEERS
Utah State Uni versi ty Logan, Utah
June 27-30, 1978 SUMMARY:
A comparison i s made of the quali ty of process water and product with and without water reuse i n a modern poultry processing plant in Egypt. reclamation pr ior t o reuse i s indicated. The technical cI
and regulatory potential fo r water reuse in poultry processing i n the U.S. i s reviewed,
The need f o r water
Papers presented before ASAE meetings are considered to be the property of the Society. In general, the Society reserves the right of:first publication of such papers, in complete form. However, it has no objection to publication, in condensed form, with credit to the Society and the author. Permission to publish a paper in full may be requested from ASAE, P.O. Box410, St. Joseph, Michigan-. The Society is not responsible for statements or opinions advanced in papers or discussions at its meetings. Papers have not been subjected to the review process by ASAE editorial committees; therefore, are not to be considered as refereed.

.
\

r
WATER REUSE IN POULTRY PROCESSING
Jack Witherow*, Ahmed Hamza**, and Samia Saad**
NEED FOR WATER REUSE IN THE U.S.
Water conservation through multiple reuse i n poultry processing will be rewarded by savings i n processing cost and reduced requirements for wastewater treatment. water i s a scarce resource and i s a controlling factor i n the location and s i z e of poultry processing plants.
In parts of both the U.S. and Egypt, where this project is located,
Even where water i s not scarce, economic incentive has resulted i n implemen- ta t ion of water conservation measures. For U.S. poultry processors the combined costs of potable water and wastewater treatment a re about $3 per 1000 g l l o n s . In an EPA funded study ( 1 ) a t the Gold Kist plant a number of water conservation practices over a 27 month period had the dua l e f fec t of reducing water usage by 32% and the pounds o f pollutants discharged by 66%. i n a 53% decrease i n the water and sewer charges from the c i ty . i n water was from 11.5 to 7.8 gallons per b i r d .
These reductions resulted The reduction
However, the practices employed a t Gold Kist were limited to process or operational changes to reduce water requirements. There is a m i n i m u m amount, currently about 5 gallons per b i r d , t h a t can be obtained without water reuse o r large capital costs for equipment replacement. A survey i n 1974 ( 2 ) of 88 chicken processing plants in the U.S. showed the average water use was 9.3 gallons per b i r d w i t h the range i n water used being from 4.2 t o 23 gallons per bird. Getting the water usage down t o 9.3 or even 5 gallons per b i r d level can be accomplished w i t h modification of present equipment. The min imum f igure o f 4.2 gallons per b i r d was a t a plant using a vacuum'withdrawal and transport of evicera. This newly designed equipment i s uncommon and expensive.
Water reuse was not practiced.
3
In the past more emphasis has been p u t on development of equipment w i t h reduced water requirements because the regulation and policies of federal regula- tory agencies eliminate most opportunities fo r reusing water. However, recently developed technology i n reuse of water i s more extensive than most real ize . A brief review of t h i s technology is presented to show the potential for water reuse i n the U.S. and the specif ic opportunities of t h i s project i n Egypt.
on by Rogers ( 3 ) . This EPA funded study evaluated the capabili ty of several treatment processes to maintain water quali ty i n the ch i l l ing t a n k when treated eff luent replaced the potable water requirement in the influent. He concluded, "The recycling system must be provided with the capabili ty of removing solids and control1 i n g the microbial population, Pilot-scale resu l t s showed t h a t DE f i l t r a t i o n was the most feasible option and t ha t i t maintained the bacterial level below t h a t of the non-recycled system."
Water conservation i n the c h i l l e r by recycling the eff luent was reported
* Sanitary Engineer, U.S. Environmental Protection Agency, Corvallis, OR ** Assistant Professor of Sanitary Engineering, Higher Ins t i tu te of Pub1 i c 3 Health, Alexandria University, Egypt

To reduce water i n g ib le t processing Carawan, e t a1 on systems which reuse process water. Carawan evaluated potable water i n selected parts of the g izza rd sp l i t t i ng w i t h a combination o f ch i l l e r overflow water and f inal b work was done a t fu l l scale i n a plant w i t h approval and
, (1 ) has reported
the replacement of and peeling machine r d wash waters. The
. . inspection by the U.S. Department of Agriculture ( U S D A ) personnel. of the d a t a from th i s study indicates tha t the use of ch i l l e r and f inal b i r d wash water for the flushing of poultry g izza rds i n the sp l i t t i ng machines has no detrimental e f fec t on e i ther the wholesomeness of the gizzards or the whole b i r d s . Satisfactory operations d i d ex is t d u r i n g the experiment. Proper design o f a system fo r applying these waters will produce considerable savings and sat isfactory sanitary conditions i n both the equipment and the product. I '
Carawan concluded, "An analysis
Lillard (4) , (5) , ( 6 ) evaluated the reuse of process water for the f lu- Her i n i t i a l characterization study reported on the microbiologi- ming of g ib le t s .
cal quali ty of water and product from four points i n a commercial broi ler plant. The four po in t s were the gizzard s p l i t t e r , f inal b i r d washer, g ib le t flume and g ib le t ch i l l e r . the quali ty of the processing water and the quali ty of the product i n the giblet flumes and ch i l l e r s and tha t water of somewhat less t h a n potable quali ty without bactericidal treatment could be recycled from e i ther the gizzard s p l i t t e r or the c h i l l e r t o the g ib le t flume without adverse e f fec t on the product. evaluations were on fluming operations done on p i lo t equipment which was 1/4 comnercial scale . w i t h those flumed w i t h potable water. coliform leve ls , and shelf l i f e were the same. However, aerobic counts were 1/4 log higher fo r necks flumed w i t h the untreated ch i l l e r water. this difference the b i r d c h i l l e r water was treated w i t h a diatomaceous earth f i l t e r . ceous earth were microbiologically equal i n a l l respects to necks flumed with potable water. demand on poultry processors for potable water and energy and also would reduce the amount of water and organic matter discharged into municipal waste treatment systems . I'
She s ta ted tha t there was no d i r ec t relationship between
Subsequent
Necks flumed w i t h untreated b i r d ch i l l e r water were compared
To eliminate
Salmonella incidence and levels , fecal
She concluded, "necks flumed w i t h c h i l l e r water f i l t e r ed through d i a t o m a - 7
F l u m i n g giblets w i t h f i l t e r e d ch i l l e r water would reduce the
These investigators have recommended water conservation i n specif ic processes t h r o u g h water reuse and have measurements showing the soundness of these recommen- dations.
Turner has described ( 7 ) where USDA's regulations presently permit reuse of water. Water from the ch i l l ing units, condensers, and compressors may be reused i n specif ic conditions and locations and recirculated water from the refuse room i s permitted i n the drains to f l o a t feathers i n the picking room. Water from the ch i l l ing units may be reused: " ( 1 ) To aid i n the movement of heavy sol ids i n the eviscerating trough, b u t not for f l u s h i n g inner surfaces o r s ide panels of the t r o u g h , ( 2 ) a f t e r removal of v i s ib le solids by screening for : flowaway, washing down the f loor i n the picking room, and hardening the wax i n p i n n i n g operations. Water from condensers or compressors may be used in any of the locations s ta ted above provided the system i s closed and there i s a vacuum break i n the l i n e t o prevent backsiphonage." Other water used must be ce r t i f i ed potable by the S ta te health agency. of process water t o about 10 percent of the normal water used i n a poultry
scalding tanks, flushing feathers from the picking machine aprons, feather
These regulations l imit reuse
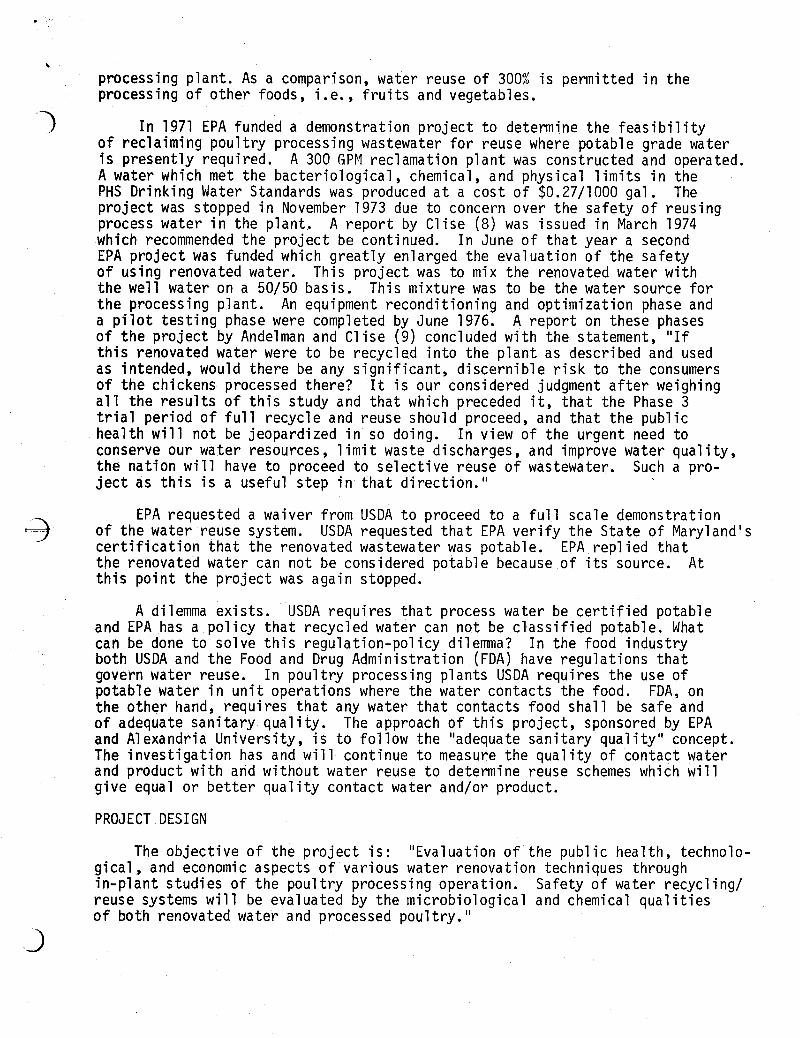
e processing plant. As a comparison, water reuse of 300% i s permitted i n the processing of other foods, i.e. , f r u i t s and vegetables.
o f reclaiming poultry processing wastewater for reuse where potable grade water i s presently required. A water which met the bacteriological , chemical, a n d physical 1 imits i n the PHS Dr ink ing Water Standards was produced a t a cost of $0.27/1000 gal. The project was stopped i n November 1973 due t o concern over the safety of reusing process water i n the plant. A report by Clise (8) was issued i n March 1974 which recommended the project be continued. I n June of t h a t year a second EPA project was funded which greatly enlarged the evaluation of the safety o f using renovated water. This project was t o mix the renovated water w i t h the well water on a 50/50 basis. This mixture was to be the water source for the processing plant. An equipment reconditioning and optimization phase and a p i lo t tes t ing phase were completed by June 1976. o f the project by Andelman and Clise ( 9 ) concluded w i t h the statement, "If this renovated water were to be recycled into the plant as described and used as intended, would there be any s ignif icant , discernible r i sk t o the consumers o f the chickens processed there? I t i s our considered judgment after weighing a l l the resu l t s of this study and t h a t which preceded i t , that the Phase 3 t r i a l period o f f u l l recycle and reuse should proceed, and t h a t the public health will n o t be jeopardized i n so doing. I n view of the urgent need to conserve our water resources, l imit waste discharges, and improve water quali ty, the nation will have t o proceed to select ive reuse of wastewater. ject as this i s a useful s tep i n t h a t direction."
o f the water reuse system. cer t i f ica t ion t h a t the renovated wastewater was potable. the renovated water can not be considered potable because of i t s source. this p o i n t the project was a g a i n stopped.
and EPA has a policy that recycled water can not be classi f ied potable. What can be done to solve this regulation-policy dilemma? I n the food industry both USDA and the Food and Drug Administration (FDA) have regulations tha t govern water reuse. I n poultry processing plants USDA requires the use of potable water i n u n i t operations where the water contacts the food. FDA, on the other hand, requires t h a t any water t h a t contacts food shall be safe and of adequate sanitary quali ty. The approach of this project, sponsored by EPA and Alexandria University, i s to follow the "adequate sanitary quali ty" concept. The investigation has and will continue to measure the quality of contact water and product w i t h and w i t h o u t water reuse t o determine reuse schemes which will give equal or be t te r quali ty contact water and/or product.
In 1971 EPA funded a demonstration project to determine the f eas ib i l i t y 3 A 300 GPM reclamation plant was constructed and operated.
A report on these phases
Such a pro-
EPA requested a waiver from USDA t o proceed to a fu l l scale demonstration 3 USDA requested t h a t EPA verify the State of Maryland's EPA replied t h a t
A t
A dilemma exis ts . USDA requires t h a t process water be cer t i f ied potable
PROJECT DESIGN
The objective of the project i s : " E v a l u a t i o n of the public health, technolo- g ica l , and economic aspects o f various water renovation techniques through in-plant studies of the poultry processing operation. reuse systems will be evaluated by the microbiological and chemical qual i t ies o f bo th renovated water and processed poultry. I'
Safety of water recycling/

The investigative plan i s to: ( 1 ) Characterize product and process water from various operations t o establish baseline quali ty and t o se lec t sui table sources for renovation and/or reuse in the Alexandria poultry processing plant. ( 2 ) Selection of reuse scheme and renovation technology. ( 3 ) Evaluation of product and process water w i t h reuse of non-renovated water. (4 ) Evaluation of product and process water w i t h reuse of renovated water. This paper reports on the f i r s t three items; the fourth item i s presently underway and scheduled for completion i n March 1980.
Fac i l i t i e s and Methods
This water reuse investigation was in i t ia ted i n April 1976 a t the Alexandria Poultry Processing Plant (APPP) located on the outskir ts o f Alexandria, Egypt. The brief descriptions which follow show the water using operations are almost identical t o those i n the U.S.
Killing and Bleeding-- The l ive b i r d s are stunned by low voltage current and slaughtered by
cutt ing the jugular vein and allowing the blood t o drain i n a res t r ic ted area. A sizable waste load is associated w i t h this area due to the placement of blood into the sewer system.
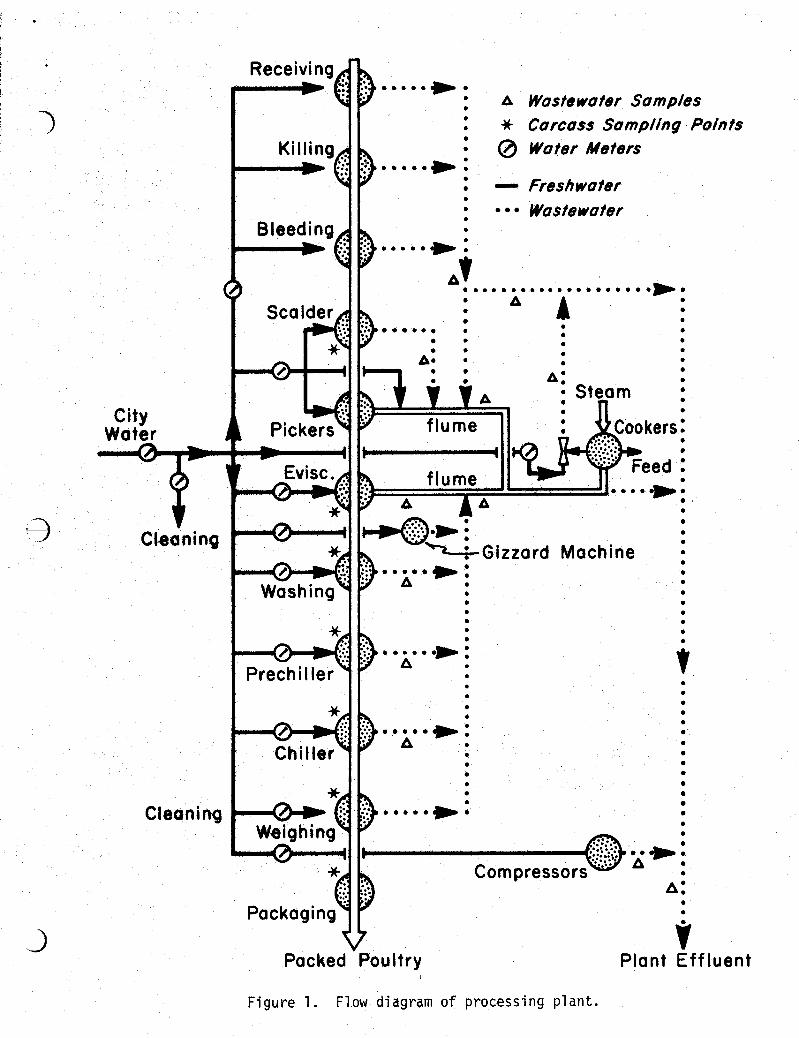
A flow diagram is shown i n Figure 1 .
Saving the blood for rendering i s common i n the U.S.
Scalding and Defeathering--
5 l i t e r s per b i r d ( l / b i r d ) . bacteria, blood, and other residues. three consecutive picking machines. area with 9.2 l /b i rd u s i n g the eff luents from the scalder and pickers i n addition t o fresh water. This i s the largest water usage i n the plant.
Birds a r e subscalded a t 54-60°C while adjusting the daily overflow t o
The scalded b i r d s a r e defeathered i n The scalder eff luent i s highly contaminated w i t h
The feathers a re flumed to the rendering
_j
Ev i scera t i on- - The carcass cavity i s opened for removal of en t r a i l s .
and wrapped for bulk se l l ing . After opening and washing the g izza rds , they a re transferred manually to the wrapping area without fluming to save water and to reduce the volume of wastewater discharged. dropped i n t o a trough which i s flushed by water from the hand washing faucets located along the evisceration 1 ine.
Giblets a r e cleaned
The inedible viscera a re
Washing and Chilling--
immersion tank. .The dai ly water usage averages 2 l / b i r d . i n two consecutive tanks a t a combined daily overflow r a t e of 2 l /bi rd which i s equal to USDA requirements. t o the offal flume.
The eviscerated carcasses a r e washed w i t h fresh water in a horizontal Chilling i s accomplished
Effluents from both operations are discharged
Other Water Uses-- The screened feathers and offal a r e cooked by d i rec t contact steam t o
produce a poultry feed ingredient. Waste steam i s withdrawn from the cooker by j e t e jector and condensed before f ina l discharge to the sewer system. The steam condenser has once through water usage which averages about 95 cu meter of fresh water per day. I n addition, about 50 cu meters of fresh water a r e used daily to cool the ammonia compressors which re f r igera te the storage coolers and produce ice used i n the ch i l l ing tanks.
3
J
City Woter
Cleaning
Cleaning
Receiving 1111111), . . . . . 1111)) ““““d *:: p .*. ..... ).:
. I I .
A Wastewater Samples * Carcass Sampling Points @ Woter Meters
- Freshwater Waste water
I I ................... b.....: A:
A
I- -: : A! . . . . . m
I .
b+~Gizzard Mc .....I, .
. . . . . b i b . . . . . . . . . . . . . . . . . .
Compressor A:
Pot kag i ng . . 3
Packed Poultry Plant Effluent
F i g u r e 1 . Flow diagram o f p r o c e s s i n g p l an t .

Chemical analyses were performed i n accordance w i t h the EPA Methods (10) . were
Samples were taken a t the locations shown Composite samples were collected by automatic samplers, and g z collected by University employees. on Figure 1 . j
Water samples for bacteriological analyses were collected i n 100 ml s t e r i l e glass containers, while carcass samples were k e p t i n specially prepared s t e r i l e polyethylene bags. by shaking f o r 5 minutes. through s t e r i l e no. 1 f i l t e r paper. done by plating on blood-agar and Mac-Conkey agar, respectively, according t o methods by Cruickshank (11).
To each bag 0.2 l i t e r d i s t i l l e d water was poured followed
Total bacterial and coliform counts were The washing was poured on a s t e r i l e funnel and f i l t e r ed
Baseline Measurements
The f i rs t measurements were t o characterize the process wastewater from individual operation i n order to define baseline character is t ics and t o se lec t renovation technology and/or reuse schemes. parameters and 9 heavy metals, ident i f icat ion of 12 bacteria, and enumeration of both total aerobic and coliform bacteria i n the wastewater from these operations have previously been described i n detai l by Hamza, e t a l . ( 1 2 ) . o f the reader a par t ia l summary of t h i s data is shown i n Table 1 .
The chemical concentration data i n Table 1 was developed from 12 se t s o f grab samples. The flow data was developed from 69 se t s of measurements. Each bacterial mean presented was developed from between 14 and 21 measurements. All of these measurements were made between April and August of 1976. The data indicate a l l the process discharges a r e highly contaminated except the compressor cooling water. and can be reused i n any processing operation. The discharge o f washing and ch i l l ing eff luents to the offal flume noticably diluted the concentrations of biochemical oxygen demand exerted i n 5 days ( B O D S ) , chemical oxygen demand ( C O D ) , to ta l residue ( T R ) , to ta l vo la t i l e residue ( T V R ) , and grease in the water from the evisceration process. TR and TVR i n the c h i l l e r a r e less than in the prechi l ler , washer or scalder, which indicates an opportunity for reuse of c h i l l e r water. t ions i n the c h i l l e r , prechi l ler , and washer a r e a l l over 200 mg/l. o f grease i n these three water immersion processes may be necessary i n a reuse scheme.
The concentrations o f 10 wastewater
For the convenience
The cooling water meets the drinking water s tandards _j
T h e mean concentrations of COD, BOD5,
The grease concentra- Removal
The flow data show larger daily variations fo r individual unit operation than for the combined operations. developed and had even larger variation fo r i n d i v i d u a l operations. water use was 19.0 l i t e r s of process water per b i r d and 31.5 l / b i r d based on total water use. the rendering condenser.
the eviscerating eff luent . t o the di lut ion e f f ec t o f the washing and chi l l ing eff luents . Mean bacterial counts in the c h i l l e r , prechi l ler , and washer a re a b o u t the same b u t a r e less than in the scalder. Between 12 and 18 se t s of bacterial measurements were a l so made on the carcasses. Washing decreased the to ta l aerobic counts on
Flow data on a per b i r d basis were also The average
Based on the flow data, water reuse should be developed for
-
Bacterial data on the various effluents show h i g h counts i n The decrease i n counts i n the offal flume i s due

TABLE 1 . WASTEWATER CHARACTERISTICS
(mg/l) m3/day (counts/ml )
Sampl e S t a t i o n
B1 eedi ng X Effl. S.D.
Scal d e r X Effl. S.D.
Feather x Flume S.D.
Eviscer. x Effl. S.D.
Offal X Flume S.D.
Washing x Effl. S.D.
Prechiller x Eff. S.D.
Chiller X Effl. S.D.
Condenser X Effl. S.D.
Compressor X Effl . S.D.
COD
31 65 1571
1330 597
1449 707
21 95 748
1582 802
1303 3 58
1193 471
884 477
1123 197
30 1 3
- BODE;
2341 8 58
978 5 73
937 472
1678 509
1156 525
1061 422
9 56 475
7 58 744
942 2 36
9 6
TR
4288 1882
1556 5 58
1687 61 1
2369 8 54
1784 820
1485 38 5
1411 509
1093 4 54
1297 291
378 273
- @
TV R
31 63 1640
1121 462
1069 420
1806 800
1218 8 28
981 373
98 5 497
644 346
960 307
123 77
- Grease
88 51
68 42
111 63
31 6 202
208 101
229 124
270 21 9
239 82
182 131
<5 <5
F1 ow
9.7 6.6
a
116.7 19.7
31.7 9.1
a
27.7 10.5
16.5 7.2
9.5 2.9
95.5 28.5
50.7 10.6
Others ( g i b l e t processing, c lean up & domestic uses) 54.3
Final X 1581 1306 1974 1368 102 41 2.3 Effl. S.D. 365 323 331 327 76 54.9
Total Aero bi c
--
3 . 3 ~ 1 O7
3 . 5 ~ 1 0 ~
11 6 . 4 ~ 1 0
1 .9x108
1 . oXi o5
4 . 9 ~ 1 O4
4 6 . 9 ~ 1 0
1 . zX1 o4
2 1.1x10
9.9x10⁸
Col iform
--
2 . 9 ~ 1 0 ~
4 . 0 ~ 1 O5
7 . 4 ~ 1 0
2 . 7 ~ 1 0
10
6
2. oX1 o3
3 2.1x10
3 1 . 3 ~ 1 0
1 . 5 ~ 1 O3
--
4 . 3 ~ 1 O6
a Flow p a r t o f another measurement Number of measurements: Chemicals = 12; Flow = 69; Bacter ia = 14 t o 21

the carcasses by 4 orders o f magnitude and a n additional decrease of 2 orders of magnitude was accomplished i n the 2 chi l l ing va ts . Total aerobic counts on the carcasses were increased by eviscerating, weighing, and packaging ( 1 2 ) .
A logical evaluation o f the requirement for potable water i n operations involving d i rec t contact between water and the carcass lead to fur ther baseline measurement of the scalder, washer, prechi l ler , and ch i l l e r . I n these water immersion operations potable quali ty i s lost when the f i r s t carcass enters the tank. The addition of potable water does n d t regain potable quality b u t does improve the quality by d i l u t i o n . Rogers ( 3 ) has shown more improvement can be accomplished by recycling renovated water.
A study o f b u i l d u p of contaminants i n the scalding, washing, and ch i l l ing tanks was undertaken to provide base1 ine information concerning the quali ty o f water which comes i n d i rec t contact w i t h the carcasses d u r i n g processing. Potable water i s used for the i n i t i a l f i l l i n g o f the tanks and the continuous make-up t o maintain the overflow ra tes previously mentioned. The tanks were not drained u n t i l the end of the processing day. Addition o f extra chlorine t o the water, a common practice i n the U.S., was not practiced a t t h i s plant. Water and carcass samples were taken from the tanks after one hour of operation and every hour a f t e r t ha t for seven hours. T h i s study was repeated seven times dur ing November and December 1976,
Figure 2 shows parallel increases i n bacterial counts on the carcasses and i n the water i n the scalder, the washer, and the ch i l l e r . The bacterial data fo r process water a r e counts per ml of tank volume while the data for carcasses a re counts washed from the surface per m l of t e s t media, and thus the magnitudes of the two data s e t s should not be compared. The logarithmic increase i n the ch i l l e r s and washer waters was l ikely caused by the increasing counts on the carcasses entering these tanks (See Figure 2 ) . The bacterial counts on b i r d s entering the scalder was not measured, thus the cause and e f fec t relationship i n this t a n k i s not known. conditions the levels of bacteria i n the water and on the carcasses are direct ly related and tha t the means of improving the product quali ty is through continual improvement o f the qual i ty of the water i n these tanks.
i
What i s known i s t h a t under the t e s t
Water Reuse Plans
After evaluation of the baseline measurements and the studies by Andelman and Clise (9), Rogers ( 3 ) , Lillard (5 ) , and Carawan, e t a l . ( l ) , the following water reuse plan was formulated:
(1)
(2 )
( 3 )
(4)
Counter current flow o f water through the c h i l l e r , prechi l ler , washer, and scalder t o reduce potable water usage and improve product quali ty.
Purchase and instal la t ion of a chlorination system t o increase the chlorine levels i n the water applied to the ch i l l e r s and washer.
Design and construction o f a 1500 gallon tank to s tore compressor cooling water for reuse i n operations involving product contact.
Design and construction of a 500 gallon tank t o serve as a wet well f o r recycling o f feather flume water.

(5) Purchase and ins ta l la t ion o f a diatomaceous earth ( D E ) f i l t e r t o reclaim water from the washer and/or prechi l ler t o enable recycling o f the water to the ch i l l e r . horizontal t a n k f i l t e r w i t h a capacity of 20 ton/day and 30 stain- less s teel f i l t e r leaves.
The f i l t e r selected was a Niagara 3 (6) Selection, purchase, and instal la t ion o f a reclamation system to
use reclaimed water i n the modified rendering condenser.
I n addition t o the water reuse methods, several process modifications t o reduce water requirements have been incorporated to conserve water. consist of the addition of nozzles on the hand washing s ta t ions, increasing the slope on the eviscerating trough, and purchase of a mobile h i g h pressure cleaning system.
These
As of April 1978 the f i r s t 4 items have been completed; however, evaluation of only the f i r s t item has been completed, This paper i s based on t h a t study. During the study, water was reused i n a counter current flow pattern through the c h i l l e r , prechi l ler , washer, and scalder. Counter current flow from the ch i l l e r t o the prechi l ler i s common in the U.S. and accepted by USDA; however, present regulations p r o h i b i t continued reuse of the water i n the washer and scalder. As previously s ta ted , USDA regulations have allowed reuse of ch i l l e r water a f t e r removal of v i s ib le sol ids by screening i n the scalder, so the concept of water reuse i n the scalder i s accepted a f t e r p a r t i a l reclamation by screening,
During the period April t o September 1977, water reuse without reclamation was tes ted for 1 2 days of processing under the supervision of the Alexandria University research team. a t a controlled r a t e from the ch i l l e r t o the prechiller and repumped a t the same ra t e from the prechi l ler t o the washing tank, a counter current flow arrangement. The overflow from the washing tank was diverted t o the scalder as a replacement fo r par t of the fresh water requirement during processing. flow for both the reuse and non-reuse schemes a re shown i n Figure 3.
On these days the water was continuously pumped 3 Schematics of the
The water use$ i n f i l i n g the scalder, washing t a n k , prechi l ler , and ch i l l e r were 6.7 m3, 5.0 m , 2.5 mi, and 2.5 m3, respectively. Dur ing normal (non-water reuse) processing, the consump ion i n the washing and chi l l ing tanks was 10 m3/d
o f make-up water a r e d i f fe ren t i n each process; the order of increasing amounts a re c h i l l e r , prechi l ler , washer and scalder (Figure 3 ) .
fior i n i t i a l f i l l i n g and 43.7 m 5 / d fo r the make-up d u r i n g processing. Amounts
In the water reuse study f ive different amounts of make-up water were'used. The amount of potable water used in the three operations ( c h i l l e r , prechiller and washer) ranged from 37% t o 75% of tha t used d u r i n g non-reuse operations. The introduction of potable make-up water was i n the ch i l le r . water added to the c h i l l e r a f t e r f i l l i n g ranged from 10 t o 30 m3/day. Over the 1 2 days of reuse operations, the average water usage i n the ch i l l e r was 233% of the usage d u r i n g non-reuse operation. The average water usages for the prechiller and washer were 145% and 85%, respectively, b u t t h i s water was not potable. The i n i t i a l f i l l i n g o f a l l tanks was w i t h potable water. Because make-up requirements fo r the scalder were greater t h a n the discharge from the washer, potable water was a l so added to the scalder. The amounts of potable water used i n the scalder ranged from 45 t o 82% of t h a t during non-reuse operations. A summary of the potable water usage is i n Table 2.
The potable
3

L I
a 0' 'a.

L
c Q)
P Q)
9 0
- &
0
0
b a.
a, VI I a, L
cc 0 v) V
M

e
Q b ?
TABLE 2.. POTABLE WATER USED IN REUSE STUDY
Make-up Days % of Non-Reuse Conditions (m3/d) (No,) 3 Operations Chiller Scal der
10 3 37 132 82 15 3 47 184 73 20 2 56 237 64 25 2 65 28 9 55 30 2 75 34 2 45
8
COMPARISON OF WATER QUALITY AND PRODUCT QUALITY
a
Several comparisons were made o f carcass quali ty and process water quality t o determine the effects o f water reuse versus non-reuse. The c r i t e r i a for accepting a water reuse scheme as sat isfactory were an equal or bet ter water quali ty and/or equal o r bet ter carcass quali ty t h a n with the non-reuse scheme. The s i x parameters selected f o r comparison were BOD5, COD, TR, grease, total aerobic counts, and coliform counts.
In the four processes involved in th i s counter current water reuse scheme, the values usually showed an increase in magnitude with time. The bacterial count increases were s imilar t o those shown i n Figure 2. The chemical da t a had a lesser r a t e of increase in concentration with time. Graphical plots of mean values showed a difference between reuse and non-reuse water quali ty and aided in the development of s t a t i s t i c a l evaluations. 7
A t the beginning of processing the water quali ty was considered t o be
This f ac t and the increased concentration w i t h the same because i n b o t h reuse and non-reuse schemes the tanks a re i n i t i a l l y f i l l e d with potable water. time suggested a comparison between the ra tes of increase. For each day an equation (log y = a t b t ) was f i t t e d by regression techniques t o BODS, COD, TR, grease, t o t a l aerobic counts, and coliform counts i n the process water. An analysis of variance was used t o determine the effects of date, treatment, process, and interaction on the slope ( b ) . f i can t e f f ec t o f treatment (reuse vs. non-reuse) on slope, these s t a t i s t i c s were abandoned because subsequent plots of the generated curves did n o t f i t the da ta . A more complicated equation based on counter current flow theory was developed f o r the reuse scheme b u t not used because the da ta base was consi- dered insuff ic ient t o suppor t i t .
The concept of comparing ra te o f increase (slope) was dropped in favor of com- paring two s t a t i s t i c s which were the maximum value and to ta l quantity of pollutants over a common time interval . The maximum value was selected t o compare the worst water quali ty conditions and the safety of the product for consumption. t i t y of pollutants i s related t o the central tendency of concentration and/or the m u n t of pollutant removed from the carcasses by the water. non-reuse schemes da ta was collected between the f i r s t and sixth hour o f operation. The quantity of pollutants removed by the water in each operation was calculated by summjng the quant i t ies discharged over this 5 hour period and adding the c h a w
Though the analyses showed a signi- i
. _-_-
The quan- I .
In both reuse and
1 I _

i n quantities in the tank. t i t i e s of pollutants added by the incoming flow for the prechiller, washer, and scalder.
In the reuse scheme this required subtracting quan-
An analysis of variance was made on these two s ta t is t ics , i .e. , maximum value and quantity, t o determine the effects o f treatment (reuse and non-reuse) and interaction. For the six parameters the null hypothesis, i .e. , there was no significant difference between reuse and non-reuse, was rejected a t p . <0.05. I t was therefore concluded t h a t a significant effect in water quality occured due t o reuse, b u t this i s only part of the answer. effect depends upon the magnitude and direction of change.
Chemical Qua 1 i ty
The importance of t h a t
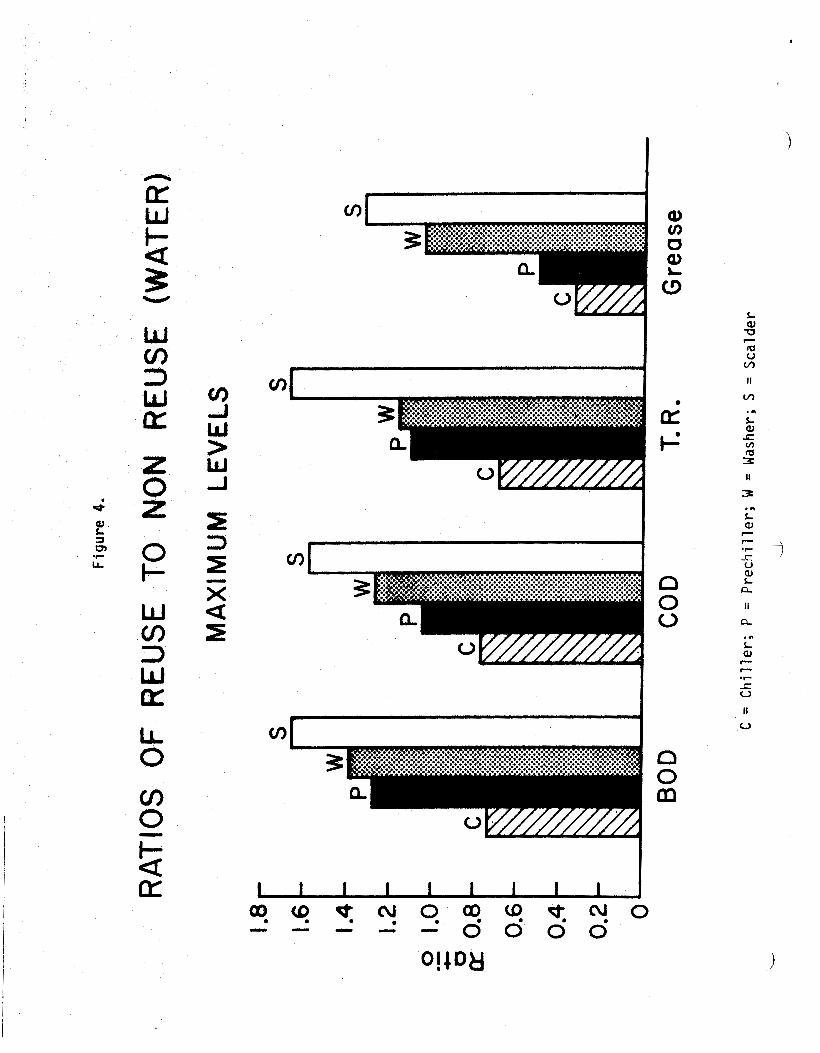
For easy comparison of the 64 statist ics on chemical quality, a series * o f bar ch-arts were prepared. levels and quantities removed) in the form of a ratio between the reuse scheme and non-reuse scheme. A r a t i o i s shown for four parameters on each of the four processes i n Figures 4 and 5. When the ratio i s less than 1.0 there i s a decrease due t o reuse. The ratio o f maximum values was less than 1.0 for the chiller and greater than 1.0 for the other processes for BOD, COD, and TR. These pollutants are mainly soluble in this wastewater. The magnitude o f these ratios increased w i t h each subsequent process. A l t h o u g h a similar increase occured for grease, the values were lower. There are two reasons offered for this: (1 ) Grease tends t o f l o a t and may not have been transferred by the submersible pumps or picked up by the sampling scheme, as the concentration versus time curves for individual study days were often erratic. concentrations may be controlled by seasonal changes, as the non-reuse d a t a showed two groupings of concentration vs. time curves which occurred a t different seasons
These charts are displays of the statist ics (maximum
( 2 ) Grease
Based on the ratio of maximum values for the more soluble pollutants, i t i s concluded t h a t the water quality in the c h i l l e r was improved and t h a t the water quality i n the prechiller, washer, and scalder deteriorated by this water reuse scheme. o f the water was in the chiller.
of po l lu t an t s placed i n the water during processing). This figure shows the quantities of B O D 5 COD, and TR removed by the chiller water were 1 .7 times greater i n the reuse scheme t h a n in the non-reuse scheme. I n the prechiller and washer the incrimental quantities of BOD5, COD, and TR added t o the water were less (0.8 t o 0.5, respectively) with reuse than w i t h non-reuse. The increased uantity of pollutant i n the chiller water during reuse was attributed t o two
%Ctors, i f e . , larger qual t i ties of water of potable qual i ty , and perhaps lower quality of incoming carcasses. t o lower water quality and perhaps lower quality of carcasses. The decrease in the washer was only attributed t o lower water q u a l i t y and quant i ty as measure- ments on carcasses coming t o the washer were not made, was inferred from bacterial measurements.
The results are not contradictory because the f i r s t usage
Figure 5 i s a similar bar chart f o r the ratio o f quantities removed (weight
The decrease in the prechiller was attributed
All carcass quality
The ratio o f 'quantities removed' by the-scalder water is 1.1 for BOD, COD, and TR. The increase w i t h p a r t i a l replacement o f potable water i s unique. The quantity of water used was the same under reuse and non-reuse schemes; however, with reuse the overall water quality added and discharged from the scalder deteriorated. For the 12 reuse study days, an average of 1/3 of the
n IIL id t- a U
-9
>
W U LL 0 cn
OL
1
t I
L3 0 0
I I 1
L 0) U
11
a ..) L a,

,
.
U
W
LL 0
n 0 0
I
L a, U
It .-- a ." L OI P P .- r V a, L n
-c u

potable water was replaced w i t h water from the washer. effluent had a minor effect on the capabi l i ty of the scalder water t o remove soluble pol 1 utants from the carcasses.
reuse i n a11 four processes, Ws pravlsusty dese~tbeid, t h l s 1s e ~ n % i d @ ~ @ d the result of other factors , i .e. , pumping , sampl i ng , and temperature.
The 'quantities removed' statist ics for these four Darameters are not conclusive. The scalder and especially the chiller show improved results w i t h water reuse, b u t the prechiller and washer do not.
This volume of washer .
\ The quantities of grease i n the water were less with reuse t h a n w i t h non-
Bacterial Qual i t y
- - - . ._ _ _ _ The ratios o f reuse'conon-reuse for maximum levels and quantities
removed are shown as logarithms (base e ) i n Fiq'ure 6. On this Fiqure, when the log of the r a t i o i s less than 0.0, a decrease occured due t o reuse. For both of these s ta t is t ics the values were larger under reuse t h a n non-reuse schemes. Thus the effect o f water reuse was different on quantities of bac- teria removed t h a n on quantities of chemical removed. t i on i s the increase i n the maximum bacteria counts i n the chiller w i t h the greater quantities of potable water used i n the reuse scheme. The apparent reason for this is the incoming carcasses had much higher bacterial counts (See-values f o r prechiller, Figure 7 ) . Insufficient cleaning of the tanks Was not-the cause;-during the reuse scheme water samples taken prior t o the f i r s t carcasses entering the tank had low bacterial counts. A comparison of the r a t i o between the four operations shows the increases due t o reuse i n the scalder were less than i n the chil ler, prechiller, o r washer. o f the incoming carcasses was most likely unchanged, the smaller increase i s attributed t o the smaller percentage (33%) of non-potable water added to the scalder. scalder also influenced this result. da t a complimented and verified each other. higher maximum levels and greater quantities o f bacteria i n the water i n each operation between the f i r s t and sixth hours of operation for a counter current reuse scheme than for the non-reuse scheme.
The most unique situa-
Since the qual i ty 3
The type of bacteria t h a t survive the higher temperatures i n the In general the t o t a l aerobic and coliform
The bacteria data i n Figure 6 indicate
The carcasses were only examined for bacterial qua l i ty . T h i s carcass da ta The only difference was t h a t quant i ty
The quantity value was a sum of the area under
Since the number of carcasses processed per u n i t of time was usually
was handled similarly t o the water data . values do no t incorporate flow. the curve (counts/carcass versus time) and , therefore, re1 ated to the central tendency. constant, the area was directly proport ional t o the quant i ty of bacteria on a l l carcasses discharged from the operation between the f i r s t and sixth hours. The quant i ty values were the to t a l number of bacteria on the carcasses leaving the operation w i t h o u t a subtraction of the bacteria on the carcasses entering the operation.
An analysis of variance on these two s ta t is t ics rejects the null hypothesis, i .e. , t h a t the values for reuse a n d non-reuse were equal. of the difference, the ratios of reuse t o non-reuse a re shown as logarithms (base e) i n Figure 7. counts and coliform counts on the carcasses are larger w i t h reuse t h a n w i t h non-reuse i n the chiller and prechiller.
To display the magnitude
The maximum levels and quantities of b o t h the t o t a l aerobic
For the washer the changes i n coliform

Li
Figure 6.
RATIOS OF REUSE TO NON REUSE (WATER)
6
5
0 -- t 4 0 CX - 3 0
0,
3 2
I
0
M A X I M U M LEVELS I QUANTITIES REMOVED I)
P I D
Total Coliform Total Coliform Counts Counts Counts Counts
C = Chiller; P = Prechiller; W = Washer; S = Scalder

Figure 7.
NON REUSE (CARCASSES) RATIOS OF REUSE TO
MAXIMUM LEVELS
r P
P
- I F U L Total Cot iform
Counts Counts
L
I QUANTITIES
1 P
1 U U Total Coliform
Counts Counts
C = Chiller; P = Prechiller; W = Washer; S = Scalder
%
and total aerobic counts a re not consistent. The maximum levels and quantity of coliform fo r the washer a re less w i t h reuse t h a n non-reuse, b u t a re larger fo r total aerobic counts. The e f fec t of par t ia l water reuse in the scalder decreased the maximum and average counts of bo th to ta l aerobic and coliform bacteria on the carcasses over non-reuse conditions. * >
Because total aerobic and coliform counts were made on both carcasses and process water, the direction and magnitude of change between reuse and non-reuse can be compared. can be shown between the water quali ty and carcass quali ty. This i s also the case fo r the washer i n respect to total aerobic counts, b u t does not hold for the coliform data. The increase of total aerobic and coliform counts in the scalder water resulted i n a n unexpected decrease i n these counts on the carcasses.
I n the c h i l l e r and prechiller a d i rec t relationship
Although the carcasses from the scalder were improved, the overall con- clusion i s t h a t the bacterial quali ty of both the water and carcasses deteriorated when the non-reuse scheme was replaced with the counter current water reuse scheme .
As displayed i n Table 2, the amount of potable water added t o the ch i l l e r was purposely varied from 10 m3/day to 30 m3/day in the counter current reuse scheme. The purpose was t o determine the min imum quantity of water needed t o improve or maintain carcass qual i ty , t i ca l evaluations a l l 1 2 days of reuse data were placed i n one g roup and compared w i t h 1 2 days of non-reuse data. difference between reuse and non-reuse and a deterioration of carcass quali ty under reuse conditions, a comparison was made to determine if volume of make- up water had a n e f fec t on carcass quali ty.
In the previously described s t a t i s -
Since th i s evaluation showed a s ignif icant
7
1 The reuse data was s p l i t in to two groups consisting of 6 days under low flow conditions of 10 or 1 5 $/day, and 6 days under high flow conditions of 20, 25 or 30 m3/day. An analysis of variance was made which rejected the null hypothesis t ha t the values were equal fo r h i g h and low flow conditions for 3 of the 4 s t a t i s t i c s . The exception was the quantit ies of coliforms (central tendency) on the carcasses which was accepted as being equal under low and h i g h volumes of make-up water. quantit ies of to ta l aerobic counts and maximum levels of coliform counts) there was a s ignif icant difference between h i g h a n d low volume of make-up water. For these three s t a t i s t i c s the values were smaller under h i g h flow t h a n under low flow which was a t t r ibuted t o greater dilution. An analysis o f variance was n o t made between the high flow reuse scheme and non-reuse scheme, b u t a comparison of the median s t a t i s t i c s show higher maximum and average total aerobic counts on the carcasses w i t h high flow reuse t h a n w i t h non-reuse i n the ch i l l e r , prechi l ler , and washer. T h u s these high flows in the counter current reuse scheme d i d not maintain or improve the quali ty of the carcasses over non-reuse conditions . CONCLUSIONS
For the other s t a t i s t i c s (maximum levels and
Water usage, waste discharges, and processing costs can be reduced in poultry processing by water conservation practices. for potable water eliminate most opportunities for water conservation t h r o u g h reuse.
Present U.S. requirements
Several investigators have recommended water conservation through reuse and have extensive measurements showing the soundness o f these recommendations.
1

i
Uti1 izing the "adequate sanitary qual i ty" concept, a water reuse scheme can be judged successful by an equal or be t te r quali ty process water and/or product .
In the four immersion operations studied (ch i l l ing , prechill i n g , washing, and scalding) the bacterial quali ty of the contact water and the product were d i rec t ly related. I n these processes both bacterial and chemical contaminants increased throughout the processing day. To improve product quali ty continual renovation o f the contact water i s needed.
An a l l potable water make-up system was replaced w i t h counter current flow of water through the c h i l l e r , prechi l ler , washer, a n d scalder. analyses show a s ignif icant e f fec t in water quali ty and product quali ty w i t h the counter current reuse scheme over the nonreuse scheme normally used a t the plant.
S ta t i s t ica l
In terms of chemical parameters (BODS, COD, and TR) with the reuse scheme the c h i l l e r showed improved water quali ty w i t h larger volume of potable make-up water, b u t the water quali ty deteriorated i n the prechiller and washer which received non-potable make-u water. I n terms of bacterial parameters ( to ta l aerobic and coliform counts P a1 1 four operations showed deteriorated water quali ty w i t h the reuse scheme. The bacterial quali ty of the carcasses discharged from the c h i l l e r , prechi l ler , and washer deteriorated w i t h the countercurrent reuse scheme.
The average replacement of 1/3 of the potable make-up water in the scalder had d i f fe ren t e f fec ts . Though the chemical and bacterial quali ty deteriorated, the amount of contaminants added to the water from the carcasses increased and the bacterial quali ty o f the carcasses improved over the a l l potable use. f
In the reuse scheme when larger quant i t ies of potable water were used, - _
the bacterial q g l i t y of the carcasses remained the same or improved. --- - - __ __ _ _ _ _ __ _____ - - - -- - -- - - ___-
Counter current reuse of water without renovation from the chi1 l e r through prechi l ler and washer was unsuccessful a t p i lo t scale; the necessary demonstration a t f u l l scale has been in i t ia ted i n the f inal phase of this project.
Reuse w i t h renovation, has been successful
ACKNOWLEDGMENTS
This research project (3-542-2) is supported by a g r a n t from the U.S. EPA. Grateful acknowledgment is extended to Dr. Larry Male, Howard Mer- c i e r , and Dr. Paul Botts, a l l with EPA's Corvallis Environmental Research Laboratory, f o r their a id i n data processing and analyses.
REFERENCES
1 . Carawan, R. E . , Crosswhite, W . M . , Macon, J . A. and Hawkins, B. K. Water and Waste Management i n Poultry Processing. U.S. Environmental Protect ion Agency, Washington, DC 20460 (1974).
2. U.S. EPA. Development Document for Effluent Limitations Guidelines and Standards of Performance for the Poultry Processing Industry. Environmental Protect ion Agency, Washington, DC 20460 (1 974).
-1 EPA-660/2-74-031.
U.S.
3. Rogers, C. J . EPA 600/2-78-039. U.S. Environmental Protect ion Agency, Cincinnat i , OH 45268 (1978).
Recycling of Water i n Poultry Processing Plan ts .
4 , . Li l lard, H . S . Microbiological Character izat ion of Water f o r Recycling i n Poultry Processing Plan ts . J . Food Sc i . 42:168(1977).
5. L i l l a r d , H , S. Bro i le r Necks Flumed i n Recycled Bird Ch i l l e r Water. Poul t r y Sci . 142( 1 978).
6 , L i l l a r d , H . S. Treatment of Bird Ch i l l e r Water f o r Reuse i n Fluming Broi le r Giblets. Proceedings of the N i n t h National Symposium on Food Processing Wastes. Denver, CO. U.S. Environmental Protect ion Agency. pp. 203-212 (1978).
7. Turner, J . E . Water Supply i n Of f i c i a l Poultry P lan ts . Published i n U.S. EPA, Technology Transfer (1973).
8. C1 ise, James D.
In Process Pol lu t ion Abatement.
EPA-660/2-74-060. U.S. Environmental Protect ion Agency, Washington, DC 20460 (1974).
-3 Poultry Processing Wastewater Treatment and Reuse.
9. Andelman, J . B . and J . D. C l i s e . Water Reuse of Wastewater From a Poul t ry Processing Plant . Proceedings of the E i g h t h National Sympo- sium on Food Processing Wastes. EPA-600/2-77-184. U.S. Environmental Protect ion Agency, Cincinnati , OH (1977).
10. U.S. EPA. Manual o f Methods f o r Chemical Analyses of Water and Waste- water. EPA-625/6-74-003. U.S. Environmental Protect ion Agency, Wash- ington, DC 20460 (1 974).
11. Cruickshank, R. Medical Microbiology. 1 2 t h Ed., Vol. 1 . Longman Inc. , New York, N Y (1973).
12. Hamza, A . , Saad, S. and J . Witherow. Water Reuse i n Poultry Processing: Case Study i n Egypt. Food Processing Wastes. EPA-600/2-77-184. U.S. Environmental Protec- t i on Agency, Cinc inna t i , OH 45268 (1977).
Proceedings of the E i g h t h National Symposium on

4