Embed Size (px)
Citation preview
Water Use for Agriculture in Priority River Basins – Section 4 East Asia and the PacificThe Mekong River Basin and the Yangtze River Basin
1
Water Use for Agriculture in Priority Rivers Basins
Section 1 Executive SummaryIntroductionWater Resources – A Global Perspective
Section 2 Africa:– Niger River Basin– Lake Chad Basin– Zambezi River Basin
Section 3 South Asia:– Indus River Basin
Section 4 East Asia and the Pacific:– Mekong River Basin– Yangtze River Basin
Section 5 Australia:– Murray-Darling Basin
Section 6 Europe and Central Asia:– Great Konya Basin
Section 7 North and Middle America:– Río Grande Basin
Section 8 Main ConclusionsLiterature cited in the study
Water Use for Agriculture in Priority River Basins – Section 4 East Asia and the PacificThe Mekong River Basin and the Yangtze River Basin
2
CONTENTS
1 IWMI projections for South-East Asia and the Pacific ...................................................... 3
2 The Mekong River Basin ....................................................................................................... 42.1 Ecoregions in the Mekong River Basin ......................................................................... 42.2 Lao People’s Democratic Republic ............................................................................... 6
2.2.1 Climate and water resources ............................................................................... 62.2.2 Irrigation and drainage development .................................................................. 72.2.3 Agriculture .......................................................................................................... 9
2.3 Cambodia..................................................................................................................... 132.3.1 Climate and water resources ............................................................................. 132.3.2 Irrigation and drainage development ................................................................ 152.3.3 Agriculture ........................................................................................................ 18
2.4 Vietnam........................................................................................................................ 212.4.1 Climate and water resources ............................................................................. 212.4.2 Irrigation and drainage development ................................................................ 232.4.3 Agriculture ........................................................................................................ 25
2.5 Thailand ....................................................................................................................... 282.5.1 Climate and water resources ............................................................................. 292.5.2 Irrigation and drainage development ................................................................ 322.5.3 Agriculture ........................................................................................................ 34
3 Conclusions for the Mekong River Basin ........................................................................... 393.1 Irrigated agriculture ..................................................................................................... 393.2 Future water demand ................................................................................................... 40
4 The Yangtze River Basin ..................................................................................................... 424.1 Ecoregions in the Yangtze River Basin ....................................................................... 434.2 Climate and water resources ........................................................................................ 444.3 Irrigation and drainage development ........................................................................... 474.4 Agriculture................................................................................................................... 50
5 Conclusions for the Yangtze River Basin ........................................................................... 575.1 Irrigated agriculture ..................................................................................................... 575.2 Future water demand ................................................................................................... 57
Water Use for Agriculture in Priority River Basins – Section 4 East Asia and the PacificThe Mekong River Basin and the Yangtze River Basin
3
1 IWMI PROJECTIONS FOR SOUTH-EAST ASIA AND THEPACIFIC
Table 1.1 IWMI projections for South-East Asia and the Pacific
Factor Units 1995value
2025projection
Annual growth1995-2025
(%)Population million 1,759 2,158 0.7Cereal demand m mt 511 755 1.3
Cereal production- Total m mt 475 752 1.5- Irrigated m mt 308 644 2.5- Rain-fed m mt 168 107 -1.5
Growth in total irrigated area m ha 112 154 1.1
Primary water supply km3 492 692 1.2PWS, % of PUWR % 17 25
Water diversion- Total km3 776 1,242 1.6- Irrigation km3 674 818 0.6- Domestic km3 47 168 4.3- Industrial km3 55 256 5.3
Water-scarcity level Economic water scarcity (Total PWS <60% of PUWR, but total growth inPWS >25%
Source: Molden 2000PUWR = Potential utilizable water resourcem mt = million metric tonnesm ha = million hectares
Major conclusions for the South-East Asia and Pacific region:
• The region is projected to be self-sufficient in cereals, with a production deficit of 0.3 percent of total demand by 2025, compared to a production deficit of 7 per cent of total demandin 1995.
• The region as a whole is economically water-scarce. However, the arid northern parts ofChina, the largest country in the region, are projected to be physically water-scarce.
Issues of importance:
• The major part of EAP, especially the arid region of China, is water-scarce. Other parts fallinto the category of high potential area
• There is some concern about national food security in China because of unsustainableirrigation practices, including groundwater overdraft, in North China
• Competition between sectors will increase• There are opportunities for water-resources development in high potential areas• Groundwater over-development in water scarce areas is a major threat• Deteriorating water quality• Concerns for environment and human health.
Water Use for Agriculture in Priority River Basins – Section 4 East Asia and the PacificThe Mekong River Basin and the Yangtze River Basin
4
2 THE MEKONG RIVER BASIN
The Mekong River is the longest river in south-eastern Asia. From its source in China’s QinghaiProvince near the border with Tibet, the Mekong flows generally south-east to the South ChinaSea, a distance of 4,200km. The Mekong crosses Yunnan Province, in China, and forms theborder between Myanmar (Burma) and Lao People’s Democratic Republic (Lao PDR), and mostof the border between Lao PDR and Thailand. It then flows across Cambodia and southernVietnam into a rich delta before emptying into the South China Sea. The upper course ischaracterized by steep descents and swift rapids, but the river is navigable south ofLouangphrabang in Lao PDR.
The natural resource management issues and priorities differ in each of these countries and thelevel of development and populations vary significantly. In north-east Thailand, with over 20million people, water resources are virtually fully developed and there are emergent problemsassociated with salinization of arable lands as a result of over-clearing of native vegetation andpoor irrigation, soil erosion, and declining water quality in rivers and streams. In Lao PDR, with 5million people and a much lower GDP, water resources are largely undeveloped. Cambodia, with10 million people, is recovering from decades of war, and in the Mekong delta some 20 millionVietnamese live on some of the most highly productive agricultural land in the world.
In short, Thailand wants more water; Lao PDR wants capital and expertise to develophydropower for export to Thailand and Vietnam; Cambodia needs capital and infrastructure andto secure sustainable fishery resources in the Tonle Sap (Great Lake); and Vietnam, while in needof capital for resource management, does not want any upstream development to exacerbate salt-water intrusion into the Mekong delta during the dry season.
The Mekong River, a vital ecosystem and the region’s lifeblood, is under threat. Over the past tenyears, more than 100 large dams have been proposed for the Mekong Basin by institutions suchas the Asian Development Bank (ADB) and the Mekong River Commission (see below). Some ofthese projects have already come to fruition. One of the greatest threats is China’s plans toconstruct eight dams on the Upper Mekong (or Lancang). Two of these dams have already beencompleted, and construction on the third project, Xiaowan, began in January 2002. These damswill have widespread impacts on the livelihoods of Mekong communities and on the naturalecology of the river system.
The Mekong River CommissionInstigated in 1957 as the Mekong River Committee, a new agreement was signed in April 1995between the four riparian countries of the lower Mekong – Cambodia, Lao PDR, Thailand, andVietnam. Although the agreement concerns cooperation for the sustainable development of thelower Mekong River Basin, it does not propose any sharing of water between the ripariancountries. Its main focus is on navigation, irrigation, hydropower, flood control, fisheries, timberfloating, recreation, and tourism.
2.1 Ecoregions in the Mekong River Basin
Five WWF Global 200 Ecoregions have been identified in the Mekong River Basin: AnnamiteRange Moist Forests, Cardamom Mountains Moist Forests, Indochina Dry Forests, the MekongRiver, and Yunnan Lakes and Streams.
Water Use for Agriculture in Priority River Basins – Section 4 East Asia and the PacificThe Mekong River Basin and the Yangtze River Basin
5
Annamite Range Moist ForestsThe forests of the Annamites are among the last relatively intact moist forests in Indochina thatstill harbour large vertebrate fauna, including several newly discovered species. In addition toseveral endemic mammals and birds, the forests also support a number of endangered species.
General threats: Increased commercial logging, large hydropower projects, shifting cultivation,and intensive illegal hunting. Regular burning for agriculture prevents forest regeneration.
Cardamom Mountains Moist ForestsThe relatively pristine forest habitats of this ecoregion support intact assemblages of vertebrates,including important habitat and prey for tigers plus a population of Asian elephants.
General threats: Due to low human population pressure, the forests of the Elephant andCardamom Mountains in Vietnam, especially the rainforests on the western slopes, are relativelyintact. However, the forests in south-eastern Thailand have been greatly reduced and now exist inonly a few protected areas in hilly regions.
Indochina Dry ForestsMonsoon forests are far less abundant in Indochina than rainforests. These forests support variedand abundant wildlife, including a number of threatened species: Douc langurs (Pygathrixnemaeus and P. nigripes), crested gibbon (Hylobates concolor), and the only Javan rhinos(Rhinoceros sondaicus) still living on the Asian continent. The highly endangered wild cattlecalled kouprey (Bos sauveli) are believed still to exist in these forests.
General threats: Much of the original monsoon forest, particularly in Vietnam, has beendegraded through logging, clearance for agriculture, and intensive hunting of wildlife. Some areashave been subjected to burning or conversion to teak plantations.
Mekong RiverThe Mekong is enormously rich in biodiversity, with the most diverse and distinctive large riverfauna of tropical Asia. Fish fauna alone total some 500 species, many of which migrate hundredsof kilometres between the sea and upstream reaches of the river as water levels change with theseasons.
General threats: The Mekong River system suffers from a wide range of serious threats.Deforestation along rivers and in uplands has changed runoff patterns and increasedsedimentation. The hydrologic regime is also heavily modified by flood control schemes, waterdiversions, and a vast array of hydropower projects, big and small. Impoundments are ofparticular concern because they block the movements of the ecoregion’s numerous migratoryfish. Over-fishing is a serious threat, particularly with the increased use of poisons. Urban,industrial, and agricultural pollution are largely untreated and is a growing problem.
Yunnan Lakes and StreamsSeveral large freshwater lakes are situated on the Yunnan Plateau at elevations of 1,800–2,000m.These tend to occupy deep grabens, trenches created by faulting of adjacent mountains, but thelakes themselves are not necessarily deep, as they have filled partially with alluvial sediments.These plateau lakes support some of the most diverse freshwater ecosystems in the entire country.Both Dianchi and Er Hai, for example, contain rich fish faunas. Historically, Dianchi supported25 native fish species, of which 11 were endemic (all but two are apparently extinct), and Er Haisupported 17 native species, of which 9 were endemic. Other endemics in this ecoregion include
Water Use for Agriculture in Priority River Basins – Section 4 East Asia and the PacificThe Mekong River Basin and the Yangtze River Basin
6
aquatic plants, invertebrates, and amphibians. This region’s karst geology has also producednumerous caves, in which at least 14 species of cave fish live.
General threats: China’s lake shores have been deforested for centuries and today are encircledby intensive rice cultivation. Increased inputs of silt and fertilizer from rice fields, and human andindustrial waste from nearby areas, all affect the quality of the water. Moreover, many of thelakes support aquaculture and fisheries that may not be sustainable given the demands of aburgeoning economy. Lake Dianchi, which has lost most of its endemic fish species, is anexample of a lake that is suffering from sewage, industrial pollutants, and introduced species.Continuing deforestation along lakes and streams is causing further soil erosion and destroyinghabitat.
2.2 Lao People’s Democratic Republic
Lao PDR is a land-locked country in the Indochina peninsula with a total area of 236,800km2.The country stretches more than 1,700km along a north-south axis. Some 80 per cent of thecountry consists of hills and mountains. The highest point is Phu Bia at 2,820m above sea level.Administratively, Lao PDR is divided in 17 provinces plus the capital, Vientiane.
The cultivable area is estimated at 2 million ha, consisting of narrow valleys and the flood-proneplain of the Mekong River and its tributaries. The cultivated land area fluctuates between 650,000and 750,000ha (720,000ha in 1994, of which 600,000ha of rice was cultivated during the wetseason). In 1984, about 23 per cent of the cultivated area was managed by cooperatives.However, following the New Economic Mechanism implemented in 1986, the cooperatives weredissolved and all the cultivated area is now privately managed.
The total population was estimated at 5.04 million inhabitants in 1996 (78 per cent rural), with anannual growth rate of 2.6 per cent. Average population density is 2 inhabitants per squarekilometre, which is one of the lowest rates in South-East Asia. Density ranges from 8 inhabitantsper square kilometre in the southern provinces of Attapeu and Sekong near the Vietnameseborder, up to 30 in Savannakhet or Champasack provinces and 150 in Vientiane municipality.
The agriculture sector accounted for 56 per cent of GDP in 1994 and employed nearly 85 per centof the work force. Agriculture’s contribution to export earnings is officially recorded at 40 percent (mainly timber and wood products, and coffee) but rises to 55 per cent if unofficial exportsof livestock and logs are included. Hydroelectricity sold to Thailand represents a large share oftotal export earnings.
Lao PDR is one of four parties to the Mekong River Commission, signed in April 1995 for thesustainable development of the Mekong River.
2.2.1 Climate and water resources
The climate is typically tropical with a rainy season from mid-April to mid-October dominated bythe humid south-west monsoon. Average rainfall is 1,600mm but ranges from 1,300mm in thenorthern valleys to over 3,700mm at high elevations in the south. About 75 per cent of the rainfalloccurs during the rainy season. The water level in the Mekong River may fluctuate by up to 20mbetween the wet and dry seasons.
Water Use for Agriculture in Priority River Basins – Section 4 East Asia and the PacificThe Mekong River Basin and the Yangtze River Basin
7
River basins and international riversThe Mekong River is the main river in Lao PDR. Forming the border with Thailand, in Lao PDRit flows for about 1,860km, of which almost every part is navigable. About 25 per cent of theMekong River Basin covers 90 per cent of the total area of Lao PDR, which contributes 35 percent of the Mekong’s total flow.
Water resourcesA significant part of the water resources of Lao PDR come from neighbouring countries:73.63km3 per year from China and 17.6 km3 from Myanmar, while the outflow from Lao PDR toother countries consists mainly of the Mekong River to Cambodia (324.45km3/year at Paksé) andsmall rivers, the Ca and Ma rivers (9.1km3/year), to Vietnam.
The internal surface water resources have been estimated as the difference between the outflowand the inflow to the country, that is 190.42km3/year, while groundwater resources are estimatedat 38km3/year, most forming the base flow of the rivers. The total renewable water resources aretherefore estimated at 333.5km3/year.
Dams and hydropowerLao PDR has great potential for hydropower development. Considering only the tributaries of theMekong River, recent estimates indicate that 18,000MW could be generated. The largesthydropower plant, Nam Ngun located north of Vientiane, has a total capacity of 150MW and astorage capacity of 7.01km3. Two other dams in the south (Xeset and Selabam) have a totalstorage capacity of 0.3km3 and can generate 50MW. Hydropower accounts for 95 per cent ofelectricity generation in Lao PDR. Two dams (Nam Theun Hinboun in central Lao PDR andHouay Ho in the south), completed in 1998, have an installed capacity of 210 and 143MW and astorage capacity of 0.02 and 0.52km3 respectively. The government has also launched studies for21 other hydropower projects throughout the country. All these projects are located on tributariesof the Mekong River. Projects on the main stream have been planned for many years (for over 40years in the case of Pa Mong dam) but have not yet been implemented. The eventual installedcapacity will greatly exceed local demand and is mainly destined for export to neighbouringcountries.
A forecast for water demand in 2025 for Lao PDR has not yet been calculated by IWMI.
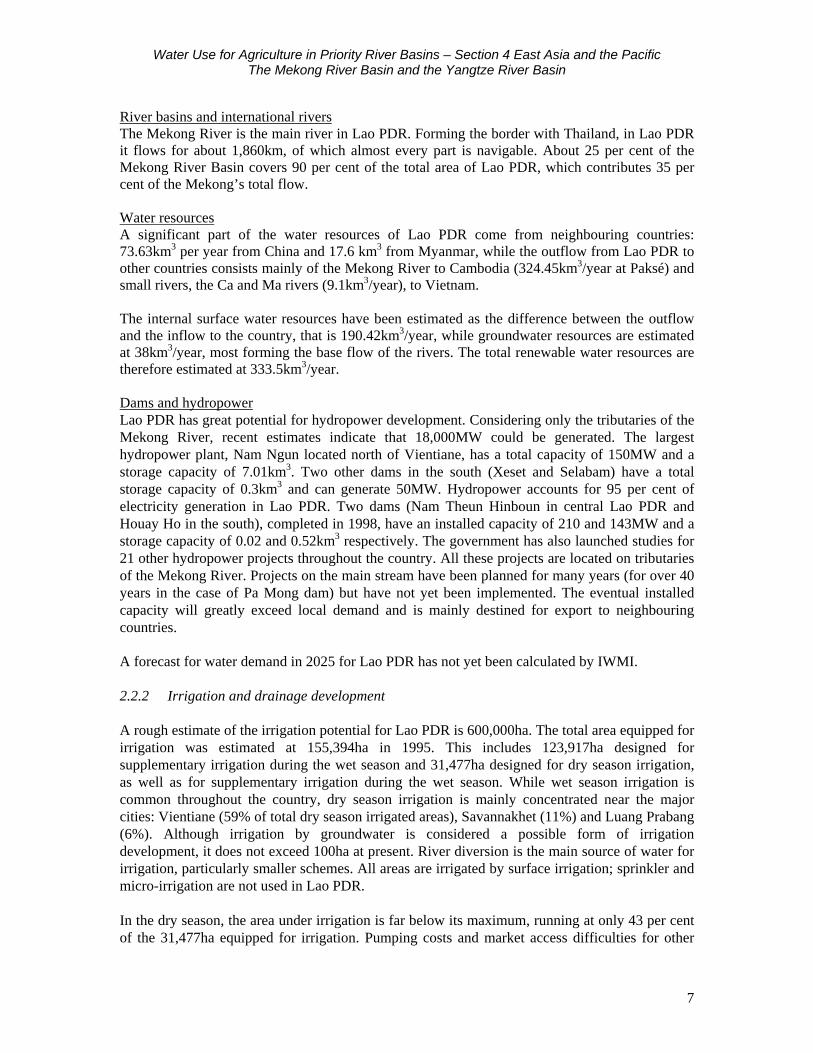
2.2.2 Irrigation and drainage development
A rough estimate of the irrigation potential for Lao PDR is 600,000ha. The total area equipped forirrigation was estimated at 155,394ha in 1995. This includes 123,917ha designed forsupplementary irrigation during the wet season and 31,477ha designed for dry season irrigation,as well as for supplementary irrigation during the wet season. While wet season irrigation iscommon throughout the country, dry season irrigation is mainly concentrated near the majorcities: Vientiane (59% of total dry season irrigated areas), Savannakhet (11%) and Luang Prabang(6%). Although irrigation by groundwater is considered a possible form of irrigationdevelopment, it does not exceed 100ha at present. River diversion is the main source of water forirrigation, particularly smaller schemes. All areas are irrigated by surface irrigation; sprinkler andmicro-irrigation are not used in Lao PDR.
In the dry season, the area under irrigation is far below its maximum, running at only 43 per centof the 31,477ha equipped for irrigation. Pumping costs and market access difficulties for other
Water Use for Agriculture in Priority River Basins – Section 4 East Asia and the PacificThe Mekong River Basin and the Yangtze River Basin
8
cash crops, particularly in the north, do not make paddy cultivation attractive in the dry season.Nevertheless, it has been noted that after poor yields during rainy seasons, the irrigated area in thedry season was higher than the average in order to compensate for the low production of theprevious season. During the wet season, the areas actually irrigated are 149,272ha, 96 per cent ofthe total equipped area.
The large-scale and several medium-scale schemes are generally under-exploited and sufferoperation and maintenance difficulties. Government policy is to transfer managementresponsibilities to users, but farmers in general do not have the necessary management skills forlack of experience and training. Two types of management can be distinguished: some schemesare wholly managed by farmers, while others receive assistance from irrigation departmentservices. Pump schemes belong to the latter, while more than 80 per cent of the gravity-irrigatedschemes are managed by farmers.
Drainage and flood protection measures have generally been taken into consideration in designplans for irrigation schemes, but have often not been developed because of budget restrictions.
Table 2.1 Irrigation data for Lao PDR
Irrigation potential 1995 600,000haIrrigation1 Full or partial control irrigation: equipped area 1995 155,394ha
- surface irrigation 155,394ha- sprinkler irrigation 0ha- micro-irrigation 0ha% of area irrigated from groundwater 0ha% of area irrigated from surface water 100%% of equipped area actually irrigated 96%
2 Spate irrigation 0haTotal Irrigation (1+2) 155,394ha- as % of cultivated area 21.6ha- power irrigated area as % of water managed area 15.1haOther water managed area 231,500haTotal water managed area (1+2+3) 386,894ha
- as % of cultivated area 53.8%- increase over the last 10 years- power irrigated area as % of water managed area 6.1%
Full or partial control schemesLarge schemesMedium schemes Small schemes
Total number of households in irrigation Irrigated cropsTotal irrigated grain production 300,000TAs % of total grain production 17%Harvested crops under irrigation 186,000ha
- rice 1998 150,000ha- vegetables 1998 18,000ha- cotton 1998 6,000ha- citrus 1998 9,000ha- sugarcane 1998 3,000ha
Source: FAO AQUASTAT
The main irrigated crop is rice. About 11,000ha of paddy fields were cultivated during the 1994dry season and 149,272ha irrigated in the 1994 wet season. Other irrigated crops are vegetablesgrown in the dry season near urban markets (Vientiane, Savannakhet, Saravane, and
Water Use for Agriculture in Priority River Basins – Section 4 East Asia and the PacificThe Mekong River Basin and the Yangtze River Basin
9
Champassak). Although no precise data are available, the total figure has been estimated at2,420ha.
Non-irrigated rice was estimated at 450,000ha in 1994, of which 49 per cent was upland rice(shifting cultivation) and 51 per cent was lowland rice grown in the flooded alluvial plains.
Trends in water resources managementIn terms of water supply, the government’s long-term objective is to provide 80 per cent coverageto the population by 2015. Although each province has benefited from an urban water supplyprogramme financed by international aid, rural water supply programmes have not beennumerous.
Considerable investments have already been made in the last 20 years in irrigation development.Despite these efforts, only 13,500ha are irrigated in the dry season.
The government has recognized the problems facing the country, and the strategy in the irrigationsector has been redefined. The new water law is based on:
• improving the planning of new irrigation projects so that they are based on the needs offarmers and are driven and managed by them. Water user associations are being set up andthe new water law should provide a legal framework for these associations. The objectives ofthe Irrigation Department are now: (i) to develop irrigation for all lowland paddy fields inthe wet season, as long as farmers are interested and group themselves in into water userassociations; and (ii) to develop dry season irrigation.
• making the existing schemes economically viable and self-sustaining, by: (i) helping farmersto establish water user associations; (ii) training farmers in irrigation management; (iii)encouraging farmers to introduce operation and maintenance cost recovery systems; and (iv)developing marketing infrastructures.
Under the New Economic Mechanism, policy on irrigated agriculture emphasizes the role ofmarkets and prices as allocation mechanisms and a shift to cost recovery for services andfacilities provided by government to farmers. Electricity and operating costs have been paiddirectly by farmers since 1992, and maintenance of secondary and tertiary irrigation canals arethe responsibility of farmers.
Until 1994, the Irrigation Department was responsible for the operation and maintenance ofweirs, dams, pumps, and primary canals. The intention is to hand these responsibilities over towater user associations. However, in many cases, operation and maintenance activities are stillbeing carried out by the Irrigation Department or its provincial services. During a transitionalperiod in which the associations are established, farmers are being trained in irrigationmanagement, scheduling, and operation and maintenance procedures. It is expected that,eventually, each association will be able to define the water charge needed to sustain theirrigation scheme.
2.2.3 Agriculture
There are two principal agro-economic zones, with differing agricultural economies and potential:the relatively well-developed flatlands, and the sloping uplands, which are dominated bysubsistence agriculture and poor access.
Water Use for Agriculture in Priority River Basins – Section 4 East Asia and the PacificThe Mekong River Basin and the Yangtze River Basin
10
Most land degradation in Lao PDR is associated with shifting agriculture and upland farmers facesignificant problems of lowering soil fertility, weed infestation and rapid loss of soil moisture dueto declining fallow periods. The Lao PDR government intends to stop all shifting agriculture butit is difficult to see how this can be achieved, judging by the large number of shifting cultivatorsand the lack of alternatives.
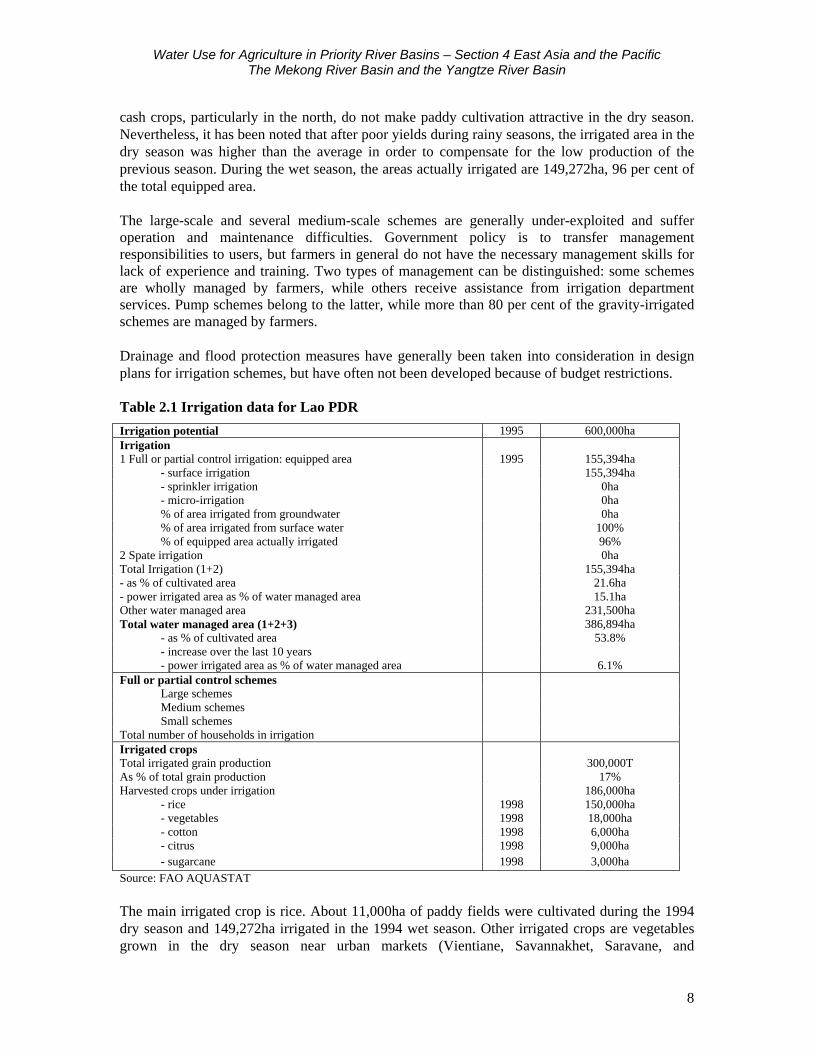
Most farmers in Lao PDR are engaged in subsistence rice farming. The country’s most importantproduction areas are located in the central region and include the provinces of Savannakhet,Vientiane Municipality and province, Khammouane, and Borikhamxay. There are threepredominant systems of rice production: wet season lowland, wet season upland, and dry season.During the wet season various varieties of rice are cultivated, though the proportion of high-yielding varieties has increased phenomenally. It is estimated that in 1990 high-yielding varietiesaccounted for only 5 per cent of wet land area; this has risen to around 60–70 per cent. Irrigateddry season cropping is entirely under high-yielding varieties. The crop sequence of various typesof rice is given below.
Table 2.2 Rice crop sequence in LAO PDR
Season Type of rice J F M A M J J A S O N DShort varietyLand preparationSeedlingTransplantingHarvestingMedium varietyLand preparationSeedlingTransplantingHarvestingLate varietyLand preparationSeedlingTransplanting
Wet seasonlowland
HarvestingDry season riceLand preparationSeedlingTransplanting
Dry seasonrice
HarvestingSource: FAO/WFP 2001a
Water Use for Agriculture in Priority River Basins – Section 4 East Asia and the PacificThe Mekong River Basin and the Yangtze River Basin
11
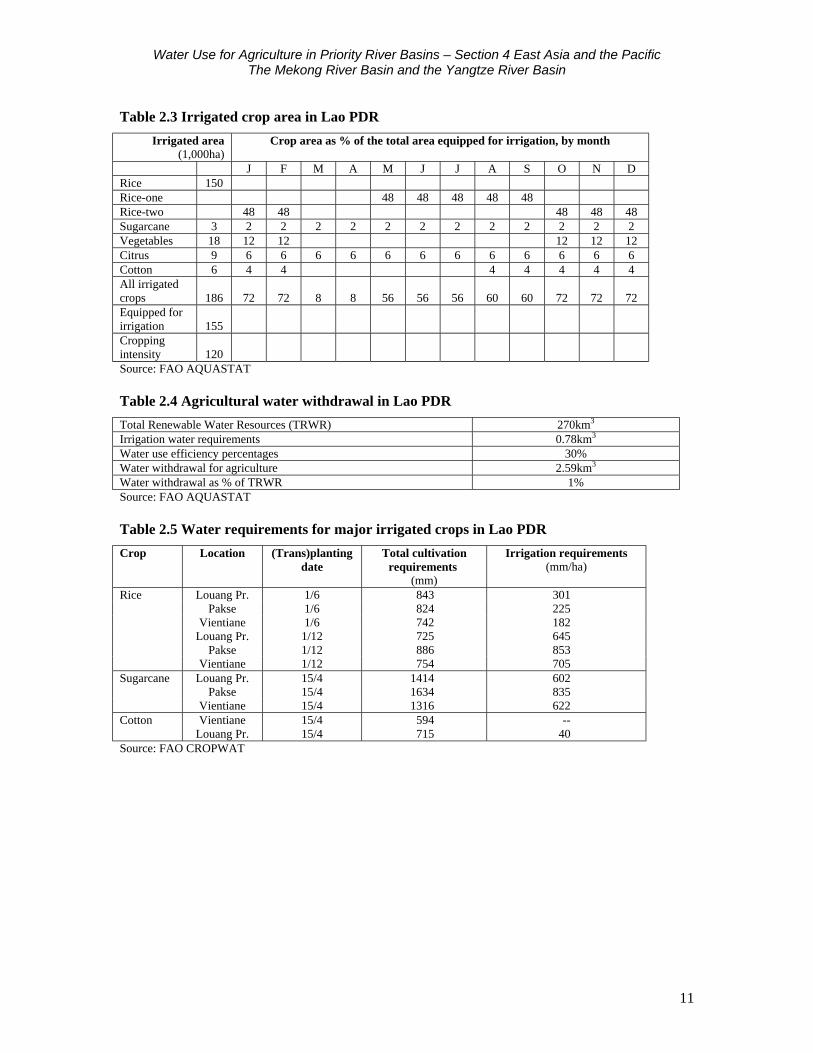
Table 2.3 Irrigated crop area in Lao PDR
Irrigated area(1,000ha)
Crop area as % of the total area equipped for irrigation, by month
J F M A M J J A S O N DRice 150Rice-one 48 48 48 48 48Rice-two 48 48 48 48 48Sugarcane 3 2 2 2 2 2 2 2 2 2 2 2 2Vegetables 18 12 12 12 12 12Citrus 9 6 6 6 6 6 6 6 6 6 6 6 6Cotton 6 4 4 4 4 4 4 4All irrigatedcrops 186 72 72 8 8 56 56 56 60 60 72 72 72Equipped forirrigation 155Croppingintensity 120Source: FAO AQUASTAT
Table 2.4 Agricultural water withdrawal in Lao PDR
Total Renewable Water Resources (TRWR) 270km3
Irrigation water requirements 0.78km3
Water use efficiency percentages 30%Water withdrawal for agriculture 2.59km3
Water withdrawal as % of TRWR 1%Source: FAO AQUASTAT
Table 2.5 Water requirements for major irrigated crops in Lao PDR
Crop Location (Trans)plantingdate
Total cultivationrequirements
(mm)
Irrigation requirements(mm/ha)
Rice Louang Pr. 1/6 843 301Pakse 1/6 824 225
Vientiane 1/6 742 182Louang Pr. 1/12 725 645
Pakse 1/12 886 853Vientiane 1/12 754 705
Sugarcane Louang Pr. 15/4 1414 602Pakse 15/4 1634 835
Vientiane 15/4 1316 622Cotton Vientiane 15/4 594 --
Louang Pr. 15/4 715 40Source: FAO CROPWAT
Water Use for Agriculture in Priority River Basins – Section 4 East Asia and the PacificThe Mekong River Basin and the Yangtze River Basin
12
Table 2.6 Water requirement per crop in Lao PDR
Crop Location Season Area(ha)
CWR(mm/ha)
Efficiency(%)
Total crop(million m3)
rice South Wet 55,000 225 30 412.5Central Wet 20,000 180 30 120.0South Dry 55,000 853 30 1,563.8
Central dry 20,000 705 30 470.0sugarcane South n/a 1,000 835 30 27.8
central n/a 2,000 622 30 41.5Cotton north wet 6,000 40 30 2.7Citrus central n/a 9,000 338 30 101.4Vegetables central dry 18,000 298 30 178.8
Total 2,918.5
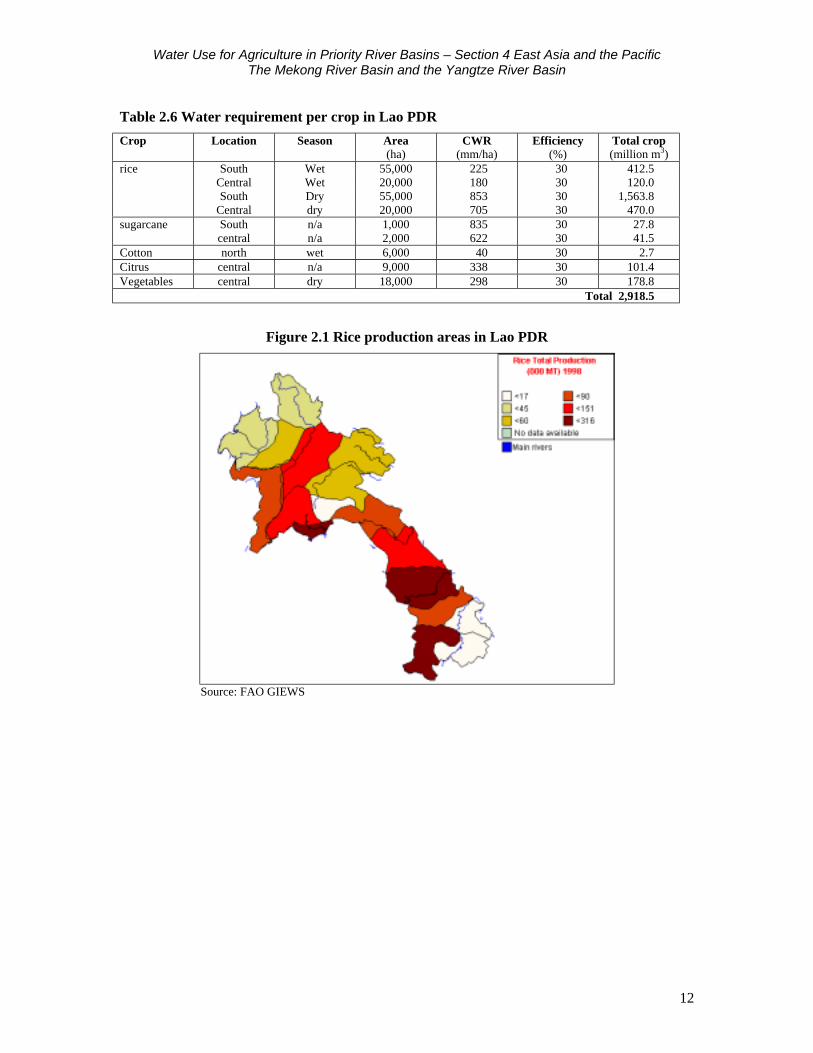
Figure 2.1 Rice production areas in Lao PDR
Source: FAO GIEWS
Water Use for Agriculture in Priority River Basins – Section 4 East Asia and the PacificThe Mekong River Basin and the Yangtze River Basin
13
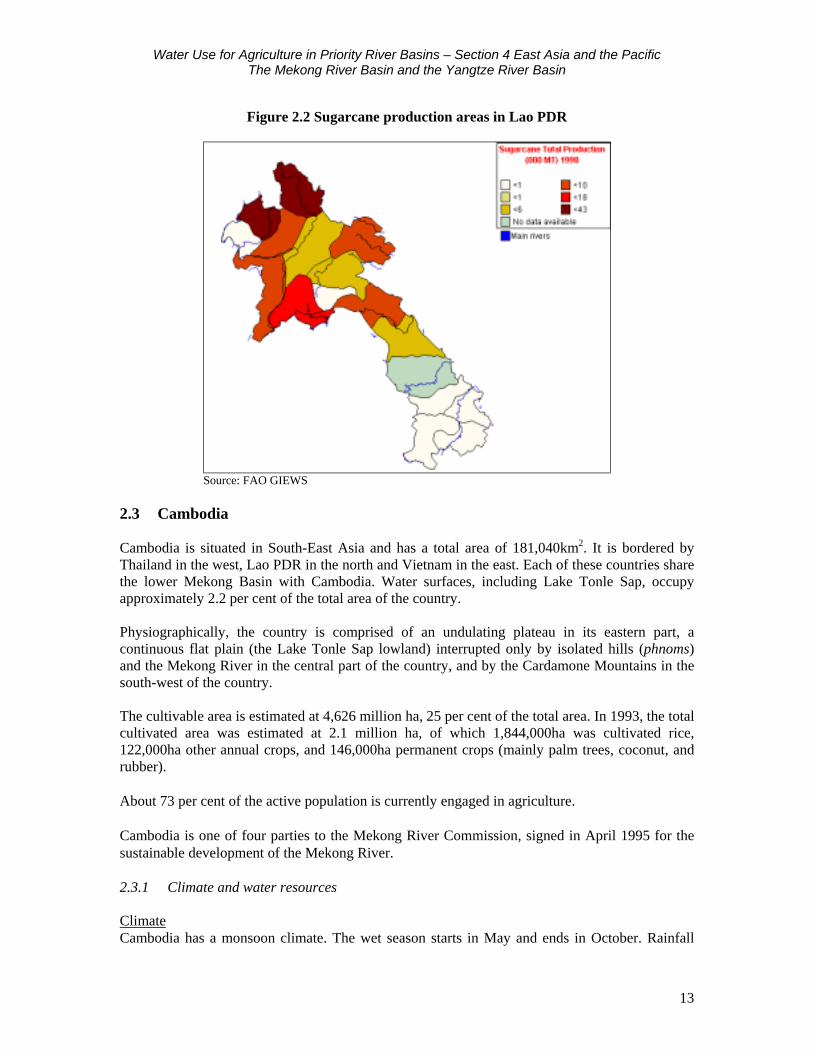
Figure 2.2 Sugarcane production areas in Lao PDR
Source: FAO GIEWS
2.3 Cambodia
Cambodia is situated in South-East Asia and has a total area of 181,040km2. It is bordered byThailand in the west, Lao PDR in the north and Vietnam in the east. Each of these countries sharethe lower Mekong Basin with Cambodia. Water surfaces, including Lake Tonle Sap, occupyapproximately 2.2 per cent of the total area of the country.
Physiographically, the country is comprised of an undulating plateau in its eastern part, acontinuous flat plain (the Lake Tonle Sap lowland) interrupted only by isolated hills (phnoms)and the Mekong River in the central part of the country, and by the Cardamone Mountains in thesouth-west of the country.
The cultivable area is estimated at 4,626 million ha, 25 per cent of the total area. In 1993, the totalcultivated area was estimated at 2.1 million ha, of which 1,844,000ha was cultivated rice,122,000ha other annual crops, and 146,000ha permanent crops (mainly palm trees, coconut, andrubber).
About 73 per cent of the active population is currently engaged in agriculture.
Cambodia is one of four parties to the Mekong River Commission, signed in April 1995 for thesustainable development of the Mekong River.
2.3.1 Climate and water resources
ClimateCambodia has a monsoon climate. The wet season starts in May and ends in October. Rainfall
Water Use for Agriculture in Priority River Basins – Section 4 East Asia and the PacificThe Mekong River Basin and the Yangtze River Basin
14
peaks in June and again in September/October. In August, a short period of drought may damagewet season rice which is not irrigated. In Phnom Penh the monthly rainfall ranges from 5mm inJanuary to 255mm in October. Average annual rainfall is estimated at 1,463mm but varies fromabout 1,000mm in Svay Tchek in the western province of Banteay Meanchay, to nearly 4,700mmin Bokor in the southern province of Kampot. Mean annual evaporation varies from 1,000 to2,300mm. April is the warmest month with a maximum temperature of 36ºC, while January is thecoldest with 21ºC.
The Tonle Sap\Mekong systemCambodia has a unique hydrological system. The Mekong River and Lake Tonle Sap areconnected by the Tonle Sap River, which twice a year reverses its direction of flow. From July tothe end of October, when the level of the Mekong is high, water flows into the Tonle Sap River,which fills Lake Tonle Sap thereby increasing the size of the lake from 2,600km2 to about10,500km2 at its maximum. The storage capacity of Lake Tonle Sap is estimated at 72km3. Inearly November, when the level of the Mekong decreases, the Tonle Sap River reverses its flowand water flows from Lake Tonle Sap to the Mekong River and thence to the Mekong Delta.
About 86 per cent of Cambodia’s territory (156,000km2) is situated in the Mekong River Basin,the remaining 14 per cent draining towards the Gulf of Thailand. The average annual discharge ofthe Mekong River entering Cambodia is estimated to be close to the discharge at Paksé(324.45km3/yr) in Lao PDR, some 120km upstream from the border with Cambodia. Otherinflows to the Mekong-Tonle Sap system from outside the country amount to 29.9km3 fromVietnam and 1.2km3 from Thailand. On average, 471.4km3 per year flow out of the country in theMekong channels and tributaries to Vietnam.
Cambodia’s internal renewable water resources have been computed as the difference betweenoutflow and inflow, that is 115.9km3. This figure does not include the unknown discharge ofsmall rivers to the Gulf of Thailand and is thus probably an underestimate. Groundwaterresources are estimated at 17.6km3, of which an estimated 13km3/yr are drained by the rivers andcannot be considered as additional water resources. The total renewable water resources forCambodia are therefore estimated at 476.11km3/yr.
The quality of groundwater is generally satisfactory, although high iron concentrations andincreased salinity levels have been encountered in some provinces (Svay Rieng, Prey Veng, andTakeo).
Water Use for Agriculture in Priority River Basins – Section 4 East Asia and the PacificThe Mekong River Basin and the Yangtze River Basin
15
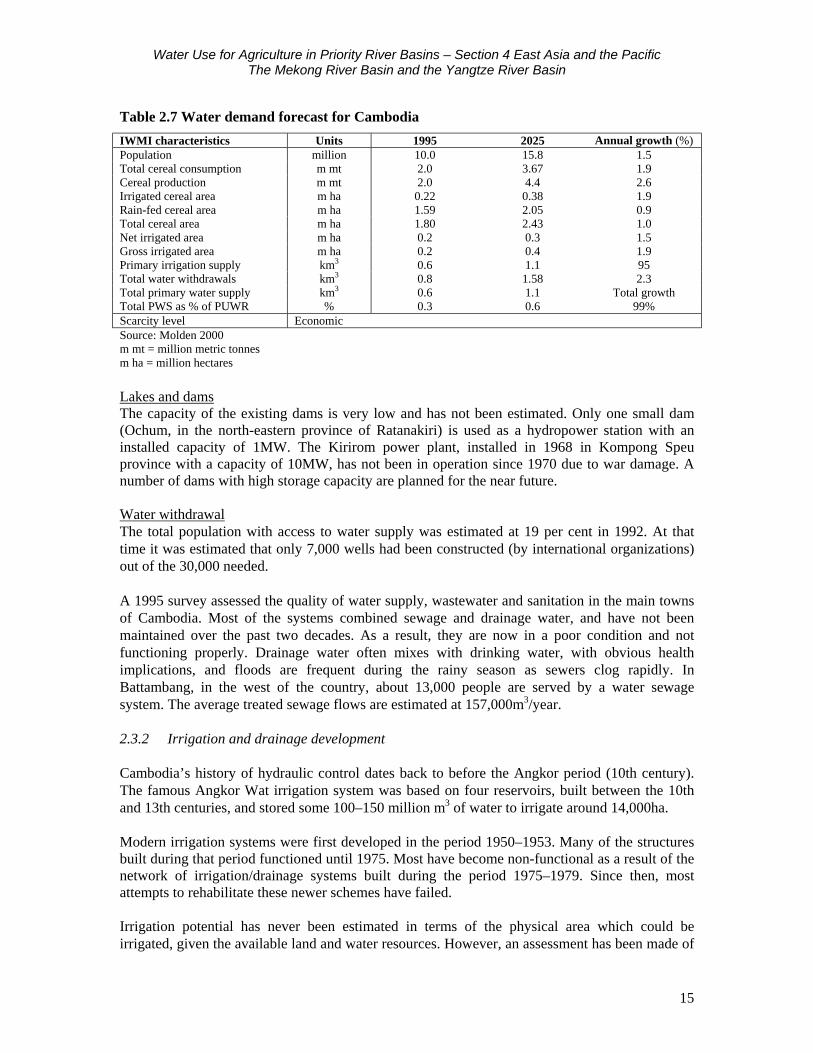
Table 2.7 Water demand forecast for Cambodia
IWMI characteristics Units 1995 2025 Annual growth (%)Population million 10.0 15.8 1.5Total cereal consumption m mt 2.0 3.67 1.9Cereal production m mt 2.0 4.4 2.6Irrigated cereal area m ha 0.22 0.38 1.9Rain-fed cereal area m ha 1.59 2.05 0.9Total cereal area m ha 1.80 2.43 1.0Net irrigated area m ha 0.2 0.3 1.5Gross irrigated area m ha 0.2 0.4 1.9Primary irrigation supply km3 0.6 1.1 95Total water withdrawals km3 0.8 1.58 2.3Total primary water supply km3 0.6 1.1 Total growthTotal PWS as % of PUWR % 0.3 0.6 99%Scarcity level EconomicSource: Molden 2000m mt = million metric tonnesm ha = million hectares
Lakes and damsThe capacity of the existing dams is very low and has not been estimated. Only one small dam(Ochum, in the north-eastern province of Ratanakiri) is used as a hydropower station with aninstalled capacity of 1MW. The Kirirom power plant, installed in 1968 in Kompong Speuprovince with a capacity of 10MW, has not been in operation since 1970 due to war damage. Anumber of dams with high storage capacity are planned for the near future.
Water withdrawalThe total population with access to water supply was estimated at 19 per cent in 1992. At thattime it was estimated that only 7,000 wells had been constructed (by international organizations)out of the 30,000 needed.
A 1995 survey assessed the quality of water supply, wastewater and sanitation in the main townsof Cambodia. Most of the systems combined sewage and drainage water, and have not beenmaintained over the past two decades. As a result, they are now in a poor condition and notfunctioning properly. Drainage water often mixes with drinking water, with obvious healthimplications, and floods are frequent during the rainy season as sewers clog rapidly. InBattambang, in the west of the country, about 13,000 people are served by a water sewagesystem. The average treated sewage flows are estimated at 157,000m3/year.
2.3.2 Irrigation and drainage development
Cambodia’s history of hydraulic control dates back to before the Angkor period (10th century).The famous Angkor Wat irrigation system was based on four reservoirs, built between the 10thand 13th centuries, and stored some 100–150 million m3 of water to irrigate around 14,000ha.
Modern irrigation systems were first developed in the period 1950–1953. Many of the structuresbuilt during that period functioned until 1975. Most have become non-functional as a result of thenetwork of irrigation/drainage systems built during the period 1975–1979. Since then, mostattempts to rehabilitate these newer schemes have failed.
Irrigation potential has never been estimated in terms of the physical area which could beirrigated, given the available land and water resources. However, an assessment has been made of
Water Use for Agriculture in Priority River Basins – Section 4 East Asia and the PacificThe Mekong River Basin and the Yangtze River Basin
16
the total potential cropped area, if existing and past irrigation systems were to be rehabilitated andimproved. This amounts to 419,344ha in the wet season and 187,020ha in the dry season.
Water managed areas were estimated at 390,461ha in 1993, of which 69 per cent were equippedwith full or partial control irrigation, and 31 per cent were flood-recession cropping areas. Theoperational full/partial control irrigation schemes can be divided into four main categories:
• River, lake or stream diversion by gravity. These systems are used for wet seasonsupplementary irrigation as there are no storage facilities. Off-takes are generallyuncontrolled, although in some cases water level control is provided by diversion weirs.
• Water pumped from rivers. Pumping stations have been provided by the government and cansupply water for both the wet and dry seasons.
• Reservoirs storing water from runoff, streams or rivers for wet season supplementaryirrigation. Water is abstracted from reservoirs by gravity feed or mobile pumps provided byfarmers.
• Reservoirs storing flood waters from the Tonle Sap/Bassac/Mekong system and released bygravity feed or mobile pumps for one dry season recession crop only. These areas alsobenefit from natural flooding for land preparation. The crop is transplanted as thefloodwaters recede and irrigated during the growing season with water stored in nearbyreservoirs. This system takes advantage of the large range of water levels in the TonleSap/Bassac/Mekong system, filling the reservoirs during the flood period to a level sufficientto give gravity fed supplies to the paddy fields. Although they are equipped for full/partialcontrol irrigation, these areas are often termed flood-recession areas as they use naturalflooding at the beginning of the season for land preparation and the filling of the reservoirs.
Another classification, used by the Cambodian Department of Hydrology, defines three irrigationsystems:
• Large-scale projects, where water is supplied from a multi-purpose dam (generally irrigationand hydropower). The annual irrigated area for these schemes is estimated at 118,225ha inthe wet season and 63,241ha in the dry season.
• Medium-scale projects, with an irrigated area of 100ha or more, where water is supplied bysingle-purpose dams or ‘colmatage’ canals. The latter system uses dikes and sluices toprovide controlled annual inundation. Intake and drainage are controlled, allowing a fertilelayer of silt to settle on the fields. The annual irrigated area for these schemes is estimated at46,599ha in the wet season and 31,225ha in the dry season.
• Small-scale projects, with an area of less than 100ha. The annual irrigated area for theseschemes is estimated at 7,903ha in the wet season and 9,190ha in the dry season.
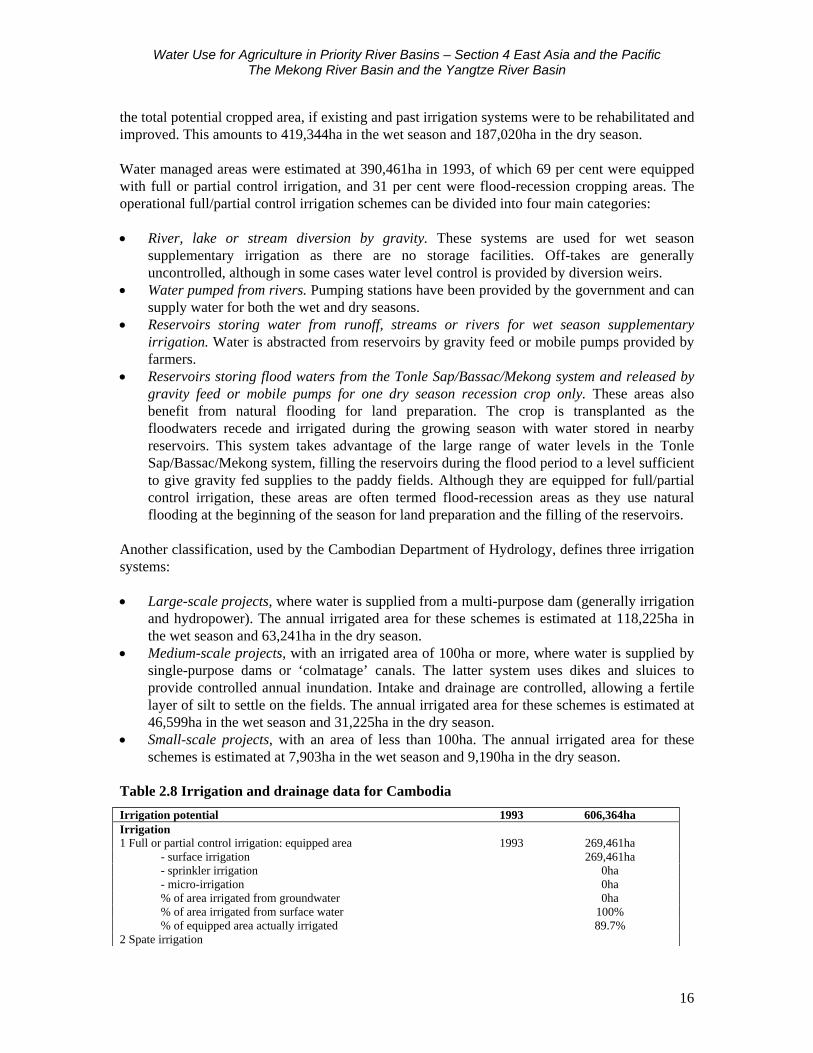
Table 2.8 Irrigation and drainage data for Cambodia
Irrigation potential 1993 606,364haIrrigation1 Full or partial control irrigation: equipped area 1993 269,461ha
- surface irrigation 269,461ha- sprinkler irrigation 0ha- micro-irrigation 0ha% of area irrigated from groundwater 0ha% of area irrigated from surface water 100%% of equipped area actually irrigated 89.7%
2 Spate irrigation
Water Use for Agriculture in Priority River Basins – Section 4 East Asia and the PacificThe Mekong River Basin and the Yangtze River Basin
17
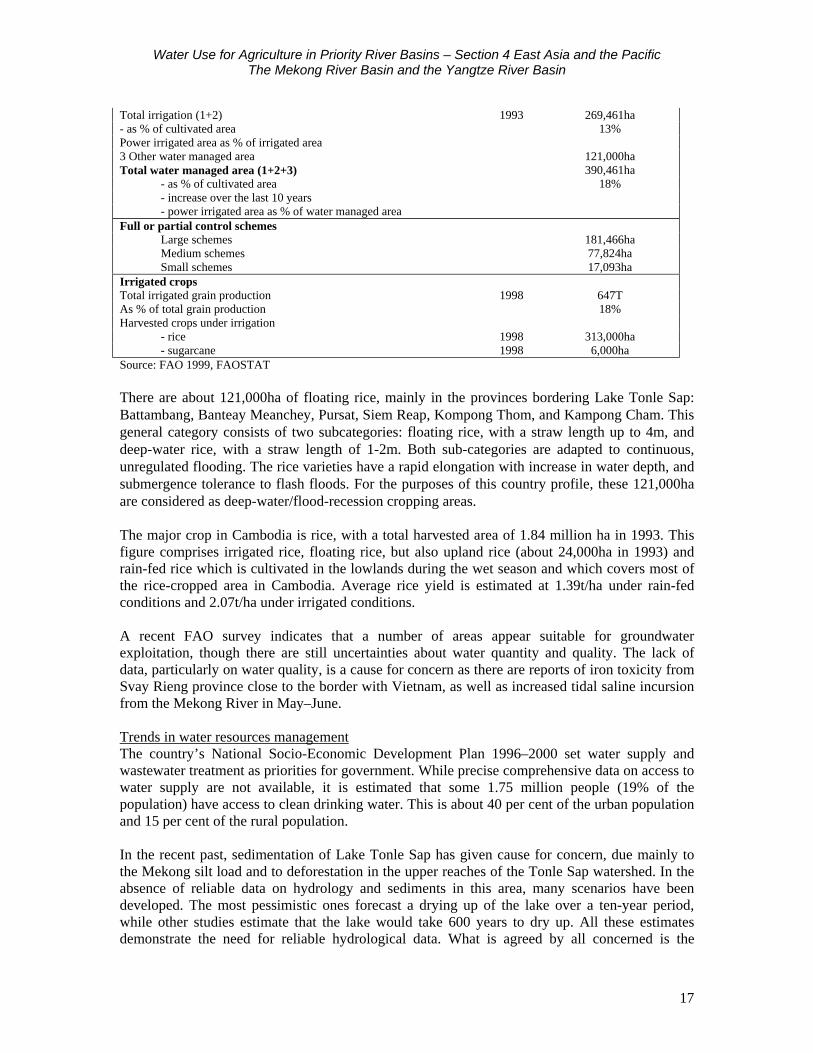
Total irrigation (1+2) 1993 269,461ha- as % of cultivated area 13%Power irrigated area as % of irrigated area 3 Other water managed area 121,000haTotal water managed area (1+2+3) 390,461ha
- as % of cultivated area 18%- increase over the last 10 years- power irrigated area as % of water managed area
Full or partial control schemesLarge schemes 181,466haMedium schemes 77,824haSmall schemes 17,093ha
Irrigated cropsTotal irrigated grain production 1998 647TAs % of total grain production 18%Harvested crops under irrigation
- rice 1998 313,000ha- sugarcane 1998 6,000ha
Source: FAO 1999, FAOSTAT
There are about 121,000ha of floating rice, mainly in the provinces bordering Lake Tonle Sap:Battambang, Banteay Meanchey, Pursat, Siem Reap, Kompong Thom, and Kampong Cham. Thisgeneral category consists of two subcategories: floating rice, with a straw length up to 4m, anddeep-water rice, with a straw length of 1-2m. Both sub-categories are adapted to continuous,unregulated flooding. The rice varieties have a rapid elongation with increase in water depth, andsubmergence tolerance to flash floods. For the purposes of this country profile, these 121,000haare considered as deep-water/flood-recession cropping areas.
The major crop in Cambodia is rice, with a total harvested area of 1.84 million ha in 1993. Thisfigure comprises irrigated rice, floating rice, but also upland rice (about 24,000ha in 1993) andrain-fed rice which is cultivated in the lowlands during the wet season and which covers most ofthe rice-cropped area in Cambodia. Average rice yield is estimated at 1.39t/ha under rain-fedconditions and 2.07t/ha under irrigated conditions.
A recent FAO survey indicates that a number of areas appear suitable for groundwaterexploitation, though there are still uncertainties about water quantity and quality. The lack ofdata, particularly on water quality, is a cause for concern as there are reports of iron toxicity fromSvay Rieng province close to the border with Vietnam, as well as increased tidal saline incursionfrom the Mekong River in May–June.
Trends in water resources managementThe country’s National Socio-Economic Development Plan 1996–2000 set water supply andwastewater treatment as priorities for government. While precise comprehensive data on access towater supply are not available, it is estimated that some 1.75 million people (19% of thepopulation) have access to clean drinking water. This is about 40 per cent of the urban populationand 15 per cent of the rural population.
In the recent past, sedimentation of Lake Tonle Sap has given cause for concern, due mainly tothe Mekong silt load and to deforestation in the upper reaches of the Tonle Sap watershed. In theabsence of reliable data on hydrology and sediments in this area, many scenarios have beendeveloped. The most pessimistic ones forecast a drying up of the lake over a ten-year period,while other studies estimate that the lake would take 600 years to dry up. All these estimatesdemonstrate the need for reliable hydrological data. What is agreed by all concerned is the
Water Use for Agriculture in Priority River Basins – Section 4 East Asia and the PacificThe Mekong River Basin and the Yangtze River Basin
18
negative effect of sedimentation on the environment, particularly on fish.
As new irrigation scheme development has a low economic internal rate of return (1–6%), therehabilitation of existing schemes has been set as a priority by government. Small-scale schemesare the main priority since large-scale schemes have serious operation and maintenance problems.The potential for agricultural production is high for small-scale irrigation schemes with activecommunity participation, particularly when undertaken in combination with moderntechnological approaches such as balanced fertilizer use. Indeed, soil fertility is a major problemin Cambodia and production increases by irrigation alone would remain relatively limited.
In the Mekong delta, the development of groundwater irrigation might be a valid alternative to thepresent systems of water management (in certain areas with sufficient and easily accessiblegroundwater reserves), the efficiency of which depends heavily on the fluctuations in level of theMekong River. Recently, sprinkler- and micro-irrigation have been introduced on very smallareas.
Another priority is the development of well-designed flood control devices, in conjunction withirrigation facilities, to enable drainage in times of flooding and irrigation in the dry season. Afurther priority is the construction of several dams, mainly for hydro-electricity generation.Investigations have been carried out by the Mekong River Commission. Two of these dams(Sambor and Stung Treng), with a total estimated cost of US$11.07 million, would have a powercapacity of 4,208MW. The environmental costs would include the loss of 31,700ha of agriculturalland and 75,300ha of forests, with more than 14,000 people having to be resettled.
The Asian Development Bank is investigating the feasibility of constructing dams on the StungChinit (a tributary of the Tonle Sap River), and on the Se Kong and Se San Rivers, both in theprovince of Ratanakiri in north-east Cambodia.
2.3.3 Agriculture
The majority of farm households are engaged in rice production. The most important ricegrowing areas include the provinces of Battambang, Banteay Meanchay, and Siem Reap in thenorth-west and Kampong Cham, Takeo, and Prey Veng in the south-east. In normal years, theseprovinces together account for some 63 per cent of aggregate production. Most rice cultivation inthe country revolves around the wet season, which extends from July to October. This crop isentirely dependent on rainfall and accounts for around 85 per cent of annual food cropproduction, over 90 per cent of cropped area and almost 70 per cent of energy needs in the diet. Inprinciple, five different rice systems are practised, three in the wet season and two in the dryseason:
• Lowland rain-fed rice• Deep-water and floating rain-fed rice• Rain-fed upland rice• Dry season flood-recession rice with supplementary irrigation• Dry season lowland irrigated rice.
Within the wet season systems, early, medium and late varieties of rice are cultivated, thegrowing period of which extends from 90 to 210 days. Wet season rain-fed rice productionaccounts for around 80 per cent of the total rice crop, the balance coming from both forms of dry
Water Use for Agriculture in Priority River Basins – Section 4 East Asia and the PacificThe Mekong River Basin and the Yangtze River Basin
19
season cropping. While the dry season only accounts for some 10 per cent of planted area in mostyears, output is proportionally higher, in the region of 18–20 per cent, reflecting higher yields. Inany given year, the area and production of dry season rice depends on rainfall during the previouswet season and the floods around the Mekong River system, which determine the level of wateravailability in reservoirs and residual soil moisture content (FAO/WFP 2000).
A small area of agricultural land is used for vegetable production. While not significant in termsof quantities, such crops are of great importance to household nutrition. They include maize,followed by vegetables, mung beans, soybeans, and cassava. Sweet potatoes, sugarcane, sesame,and groundnuts are also cultivated. The crops are grown mainly in areas of high populationdensity, such as the provinces of Kandal, Kompong Cham, and Kompong Speu. These provincesare normally also rice deficit areas and farmers tend to grow crops that are more profitable thanrice.
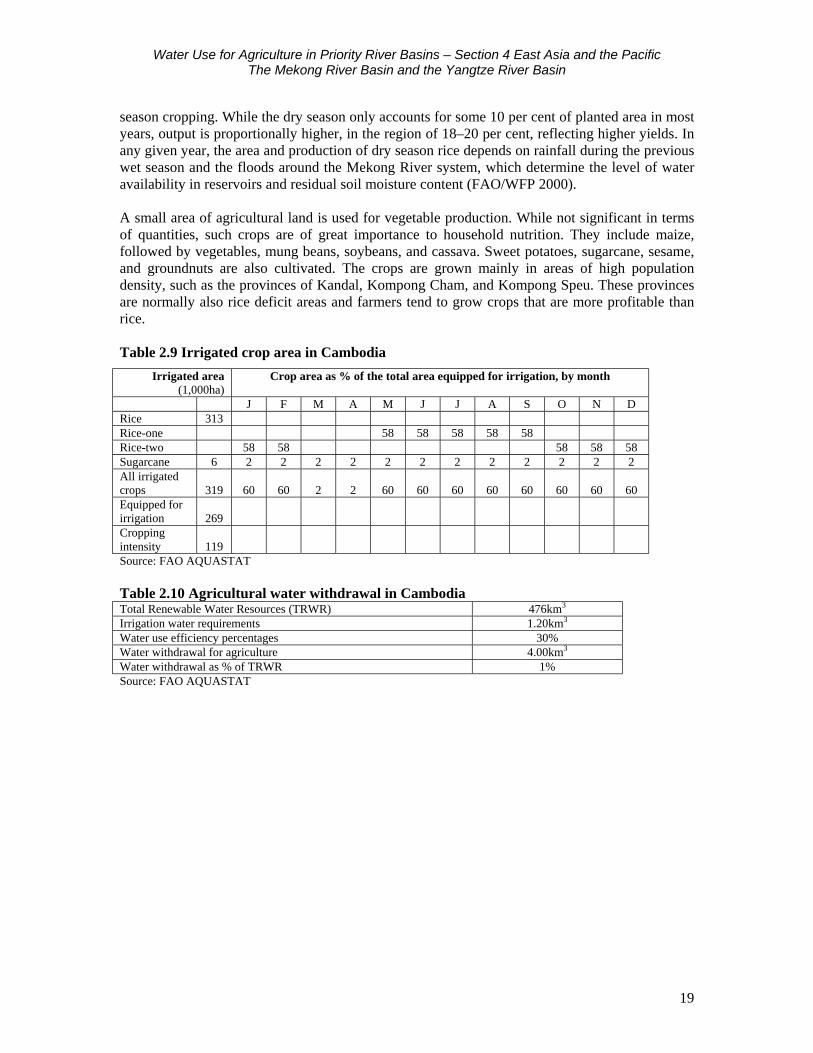
Table 2.9 Irrigated crop area in Cambodia
Irrigated area(1,000ha)
Crop area as % of the total area equipped for irrigation, by month
J F M A M J J A S O N DRice 313Rice-one 58 58 58 58 58Rice-two 58 58 58 58 58Sugarcane 6 2 2 2 2 2 2 2 2 2 2 2 2All irrigatedcrops 319 60 60 2 2 60 60 60 60 60 60 60 60Equipped forirrigation 269Croppingintensity 119Source: FAO AQUASTAT
Table 2.10 Agricultural water withdrawal in CambodiaTotal Renewable Water Resources (TRWR) 476km3
Irrigation water requirements 1.20km3
Water use efficiency percentages 30%Water withdrawal for agriculture 4.00km3
Water withdrawal as % of TRWR 1%Source: FAO AQUASTAT
Water Use for Agriculture in Priority River Basins – Section 4 East Asia and the PacificThe Mekong River Basin and the Yangtze River Basin
20
Table 2.11 Water requirements for major irrigated crops in Cambodia
Crop Location (Trans)plantingdate
Total cultivationrequirements
(mm)
Irrigation requirements(mm/ha)
Rice Siemreap 1/6 832 315Phnom Penh 1/6 794 330
Kampot 1/6 825 241Siemreap 1/12 849 802
Phnom Penh 1/12 837 732Kampot 1/12 907 744
Sugarcane Phnom Penh 1/6 1,356 689
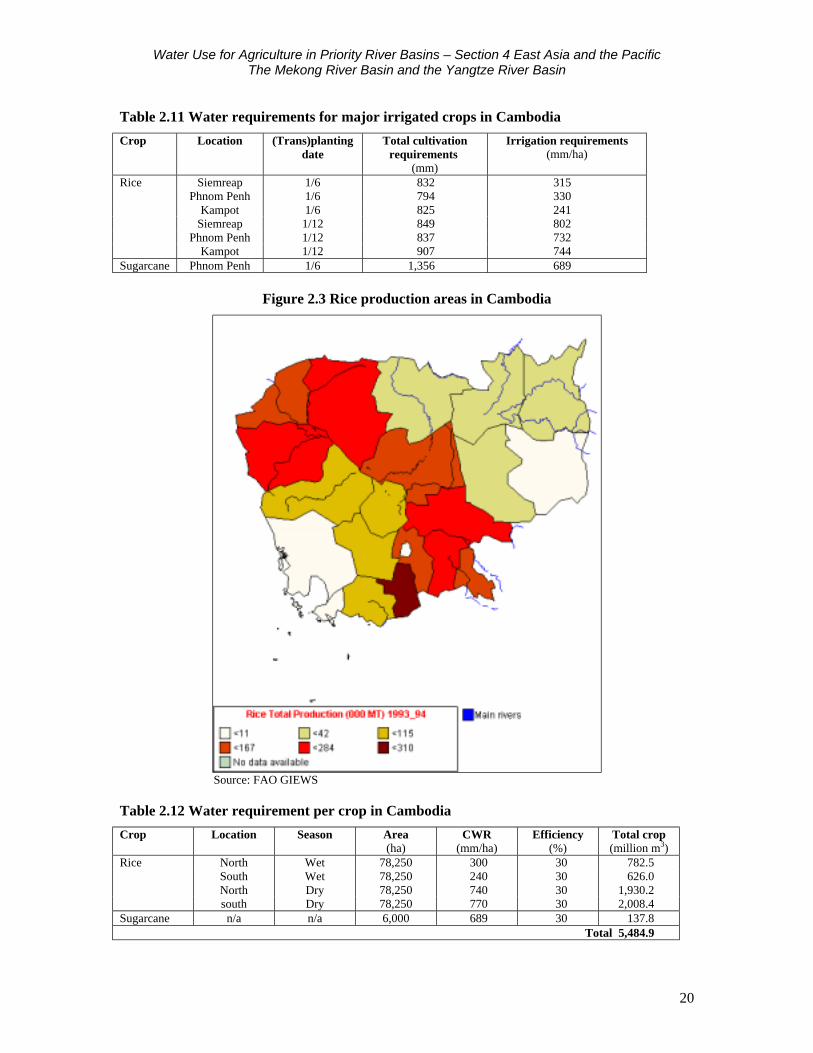
Figure 2.3 Rice production areas in Cambodia
Source: FAO GIEWS
Table 2.12 Water requirement per crop in Cambodia
Crop Location Season Area(ha)
CWR(mm/ha)
Efficiency(%)
Total crop(million m3)
Rice North Wet 78,250 300 30 782.5South Wet 78,250 240 30 626.0North Dry 78,250 740 30 1,930.2south Dry 78,250 770 30 2,008.4
Sugarcane n/a n/a 6,000 689 30 137.8Total 5,484.9
Water Use for Agriculture in Priority River Basins – Section 4 East Asia and the PacificThe Mekong River Basin and the Yangtze River Basin
21
2.4 Vietnam
Vietnam is located in the eastern part of the Indochina peninsula. It is bounded by China in thenorth, Lao PDR and Cambodia in the west, and by the South China Sea in the east. The total landarea is 325,490km2. The country is divided into seven regions based on topographic, climatic andsocio-economic conditions. For administrative purposes there are 38 provinces, including thecapital city of Hanoi.
Mountains and hills cover more than three-quarters of the territory, although over 70 per cent ofthe country lies below 500m above sea level. Vietnam has a dense hydrographic network. About25 per cent of the total land area is covered by plains, the most important being the Bac Bo andNam Ho, corresponding to the courses of the Red and Mekong Rivers respectively.
The total cultivable land area is 7,086,000ha, of which 3,300,000ha are in delta areas. Actualcultivated land covers some 6,757,000ha, 95 per cent of the total cultivable area. In 1995, about5,509,000ha were covered by annual crops (mainly rice), and the remaining 1,248,000ha wereunder permanent crops such as coconut, tea, and rubber.
The total population is estimated at 75,181,000 inhabitants (about 79 per cent rural) and isgrowing at an annual rate of 2.2 per cent. Average population density is about 227inhabitants/km2, ranging from 115 inhabitants/km2 in the northern mountains and midlands regionto 1,085 in the Red River delta region.
Agriculture, including forestry and fisheries, is the largest sector in the economy, accounting for34 per cent of GDP and employing 69 per cent of the labour force.
Vietnam is one of four parties to the Mekong River Commission, signed in April 1995 for thesustainable development of the Mekong River.
2.4.1 Climate and water resources
ClimateVietnam’s climate varies from temperate and subtropical in the north, to tropical in the south.Precipitation varies from 2,000 to 2,500mm in the mountainous areas and from 1,600 to 2,200mmin the midlands and plains. Average annual rainfall is 1,960mm, with a minimum of 650mm inPhan Rang and a maximum of 4,760mm in Bac Quang. The rainy season lasts from April/May toOctober/November. Some 70–80 per cent of the total annual precipitation occurs during the 3–6months of the rainy season.
The driest periods are either from December to February or from January to March, depending onlocation. The temperature varies from 15ºC in winter to 25ºC in summer.
River basins and water resourcesThere are 16 river basins larger than 2,000km2, nine of which are considered major rivers, eachwith a catchment area larger than 10,000km2: Bang-Ky, Cung, Red River/Thai Bin, Ma, Ca, ThuBon, Ba, Dong Nai, and the Mekong delta. These basins represent 80 per cent of the country’s
Water Use for Agriculture in Priority River Basins – Section 4 East Asia and the PacificThe Mekong River Basin and the Yangtze River Basin
22
territory and 70 per cent of its water resources. The largest basins are the Mekong and the RedRiver/Thai Bin, covering half of the country.
Vietnam has abundant surface water resources in terms of total runoff, of which the Red andMekong Rivers carry 75 per cent, while each of the other basins carries 1–3 per cent of the waterresources. Mean annual runoff totals approximately 878km3, of which about 354km3 (40%) aregenerated within the country (corresponding to a runoff coefficient of 0.5).
About 60 per cent of the total water flow in Vietnam originates outside the country. More than 90per cent of the Mekong Basin and half of the Red River Basin lie outside the country. Both theMa and Ca Rivers have about 40 per cent of their catchments outside Vietnam, and 15 per cent ofthe Doug Nai basin also lies outside the country. The contribution from neighbouring countries towater runoff in Vietnam is estimated at 524.7km3/year, including 470.1km3/year (Mekong) and1.4km3/year (Doug Nai) from Cambodia, 44.1km3/year (Red River) from China, and 9.1km3/year(Ca and Ma Rivers) from Lao PDR.
The distribution of water resources in Vietnam during the year is highly variable owing tounevenly distributed monsoon rainfalls. High variations combined with limited storage and floodcontrol infrastructure result in devastating floods in the wet season and extreme low flows in thedry season. About 70–75 per cent of the annual runoff is generated in three to four months.
Groundwater recharge is estimated at 48km3/year. Over 50 per cent of these resources are in thecentral part of the country, about 40 per cent in the north and 10 per cent in the south. A largeamount of water is stored in geological formations of unconsolidated alluvial sand and gravel inplains and valleys. A substantial part of these resources (estimated at 35km3/year) returns to therivers as base flow. The exploitable reserves (i.e. the volumes of flows of satisfactory qualitywhich can be extracted economically given present technology) are estimated at about 6–7km3/year. Adding together the internal and external water resources, Vietnam’s total renewablewater resources are estimated at 891km3/year.
Dams and lakesThere are two natural lakes in Vietnam: Lake Ho-Tay with a surface area of 4.13km2 and avolume of 8 million m3, and Lake Ba Be with a surface area of 4.5km2 and a volume of 90million m3.
There are 3,500 small reservoirs and 650 large and medium-sized reservoirs. Data on the majordams and reservoirs of Vietnam are presented in Table 2.13.
Table 2.13 Major dams and reservoirs in Vietnam
Dam or reservoir Year completed Reservoir surface area(ha)
Reservoir storagecapacity
(million m3)Cam Son 1967 2,600 227Thac Ba 1971 23,400 3,600Hoa Binh 1991 21,800 9,450Dau Tieng - 35,000 1,000Tri An 1985 27,000 1,056
These reservoirs are multi-purpose, constructed for hydropower, flood control, navigation,irrigation, and fisheries. Four large hydropower plants provide a total of 2,608MW: Thac Ba(108MW), Da Nhim (160MW), Tri An (420MW), and Hoa Binh (1,920MW). Approximately 200
Water Use for Agriculture in Priority River Basins – Section 4 East Asia and the PacificThe Mekong River Basin and the Yangtze River Basin
23
small hydropower plants with a total capacity of 3.7MW are in operation, as are numerous micro-hydropower plants with a total capacity of 30MW. Seventy per cent of the country’s electricity isgenerated by hydropower.
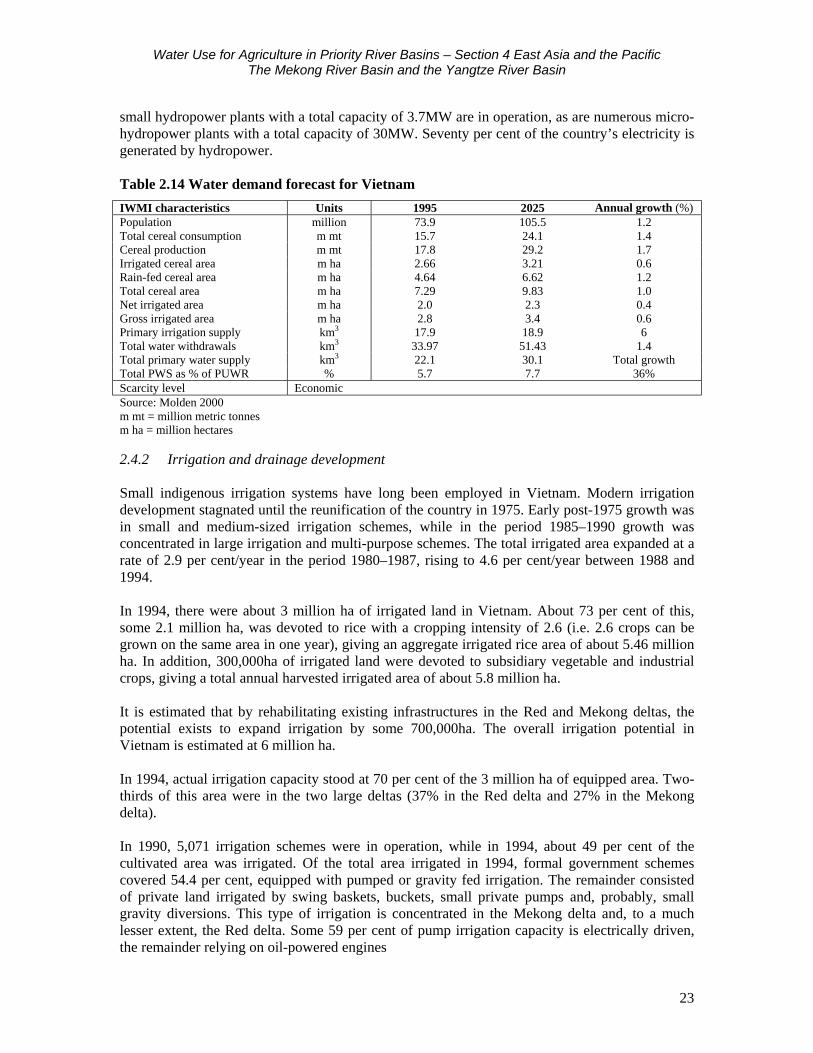
Table 2.14 Water demand forecast for Vietnam
IWMI characteristics Units 1995 2025 Annual growth (%)Population million 73.9 105.5 1.2Total cereal consumption m mt 15.7 24.1 1.4Cereal production m mt 17.8 29.2 1.7Irrigated cereal area m ha 2.66 3.21 0.6Rain-fed cereal area m ha 4.64 6.62 1.2Total cereal area m ha 7.29 9.83 1.0Net irrigated area m ha 2.0 2.3 0.4Gross irrigated area m ha 2.8 3.4 0.6Primary irrigation supply km3 17.9 18.9 6Total water withdrawals km3 33.97 51.43 1.4Total primary water supply km3 22.1 30.1 Total growthTotal PWS as % of PUWR % 5.7 7.7 36%Scarcity level EconomicSource: Molden 2000m mt = million metric tonnesm ha = million hectares
2.4.2 Irrigation and drainage development
Small indigenous irrigation systems have long been employed in Vietnam. Modern irrigationdevelopment stagnated until the reunification of the country in 1975. Early post-1975 growth wasin small and medium-sized irrigation schemes, while in the period 1985–1990 growth wasconcentrated in large irrigation and multi-purpose schemes. The total irrigated area expanded at arate of 2.9 per cent/year in the period 1980–1987, rising to 4.6 per cent/year between 1988 and1994.
In 1994, there were about 3 million ha of irrigated land in Vietnam. About 73 per cent of this,some 2.1 million ha, was devoted to rice with a cropping intensity of 2.6 (i.e. 2.6 crops can begrown on the same area in one year), giving an aggregate irrigated rice area of about 5.46 millionha. In addition, 300,000ha of irrigated land were devoted to subsidiary vegetable and industrialcrops, giving a total annual harvested irrigated area of about 5.8 million ha.
It is estimated that by rehabilitating existing infrastructures in the Red and Mekong deltas, thepotential exists to expand irrigation by some 700,000ha. The overall irrigation potential inVietnam is estimated at 6 million ha.
In 1994, actual irrigation capacity stood at 70 per cent of the 3 million ha of equipped area. Two-thirds of this area were in the two large deltas (37% in the Red delta and 27% in the Mekongdelta).
In 1990, 5,071 irrigation schemes were in operation, while in 1994, about 49 per cent of thecultivated area was irrigated. Of the total area irrigated in 1994, formal government schemescovered 54.4 per cent, equipped with pumped or gravity fed irrigation. The remainder consistedof private land irrigated by swing baskets, buckets, small private pumps and, probably, smallgravity diversions. This type of irrigation is concentrated in the Mekong delta and, to a muchlesser extent, the Red delta. Some 59 per cent of pump irrigation capacity is electrically driven,the remainder relying on oil-powered engines

Water Use for Agriculture in Priority River Basins – Section 4 East Asia and the PacificThe Mekong River Basin and the Yangtze River Basin
24
The drainage system covers over 1 million ha, mostly in the northern and central parts of thecountry, particularly the Red delta.
Average aggregate yield for both irrigated and non-irrigated rice is 3.3t/ha, with the spring cropproviding the highest yield of around 5t/ha, and the summer crop yielding around 2.8t/ha.
Table 2.15 Irrigation and drainage data for Vietnam
Irrigation potential 1994 6,000,000haIrrigation1 Area equipped for irrigation 3,000,000ha
- surface irrigation 3,000,000ha- sprinkler irrigation 0ha- micro-irrigation 0ha% of area irrigated from groundwater% of area irrigated from surface water% of equipped area actually irrigated 70%
2 Spate irrigation -Total irrigation (1+2) 1994 3,000,000ha- as percentage of cultivated area 49%- power irrigated area as % of irrigated area 1994 243 Other water managed area 1994 0haTotal water managed area (1+2+3) 1994 3,000,000ha
- as % of cultivated area 49%- increase over the last 10 years 1994 46%- power irrigated area as % of water managed area 24%
Irrigated cropsTotal irrigated grain production 1997 16,750,000TAs % of total grain production 1997 54.5%Harvested crops under irrigation
- rice 1998 4,500,000ha- vegetables 1998 276,000ha- sugarcane 1998 168,000ha- maize 1998 110,000ha
Drainage-environmentDrained area 1994 1,000,000haDrained area in full or partial control irrigated areas 1994 1,000,000haDrained area as % of cultivated area 14.8%Area salinized by irrigationSource: FAO 1999, FAOSTAT
Irrigation fees were first introduced in 1984 in some provinces, such as Vinh Long. The fee forirrigation and drainage services represents about 4–8 per cent of the total crop output. Afterremaining constant for a number of years, water fee collections rose from an average of 31.6kg to38.8kg of rice per hectare between the periods 1986–1991 and 1992–1994.
Trends in water resources managementGovernment plans indicate an accelerated growth rate of 4.5–5 per cent for the agriculture sector.Other targets include reducing the impact of extreme poverty by 50 per cent, reducingmalnutrition among children to less than 30 per cent, and providing clean drinking water to allurban populations and 80 per cent of the rural population. About 40 per cent of the investmentcapital is projected to come from government, 15 per cent from state enterprises, and the restfrom the private sector. The main items in the public investment programme are transport andwater supply (33%), and irrigation and agriculture (24%).
Water Use for Agriculture in Priority River Basins – Section 4 East Asia and the PacificThe Mekong River Basin and the Yangtze River Basin
25
The Ministry of Agriculture and Rural Development has begun a programme of ruraldevelopment which complements and builds on the strategy for the agriculture sector. The majorobjectives are to raise incomes and living standards in rural areas, diversify the rural economythrough increased production of high-value crops, and conserve the natural resource base,particularly land and water.
The main targets are, by 2010, to raise GDP per capita in the rural areas to US$1,000, irrigate 80per cent of all cultivated land, increase forested areas, and raise food production to 40–45 milliontonnes.
The Mekong Delta Water Resources Development Project is expected to finance irrigation,drainage, saline intrusion control, navigation, rural water supply, and agricultural diversificationin three geographical areas (South Manh Thit, Omon-Xano, and Quanlo-Phunghiep) coveringfive delta provinces. The project started in late 1998, with investment costs of US$130–140million.
2.4.3 Agriculture
The leading sector of the Vietnamese economy is agriculture, which, with fishing and forestry,employs 73 per cent of the labour force. The government has stimulated agricultural productionthrough the removal of price controls and a series of reforms that gives farmers both long-termland leases and the right to keep profits from surplus production. In the early 1990s, Vietnam,which once imported rice, became the world’s third-largest exporter of the crop. The country’sprincipal crops in 2000 included rice, the staple food (32.5 million tonnes), cassava (2 milliontonnes), sweet potatoes (1.6 million tonnes), and sugarcane (15.4 million tonnes). Cash cropsincluded coffee (802,000t), tea (76,000t); soybeans (149,000t), and natural rubber (291,000t).
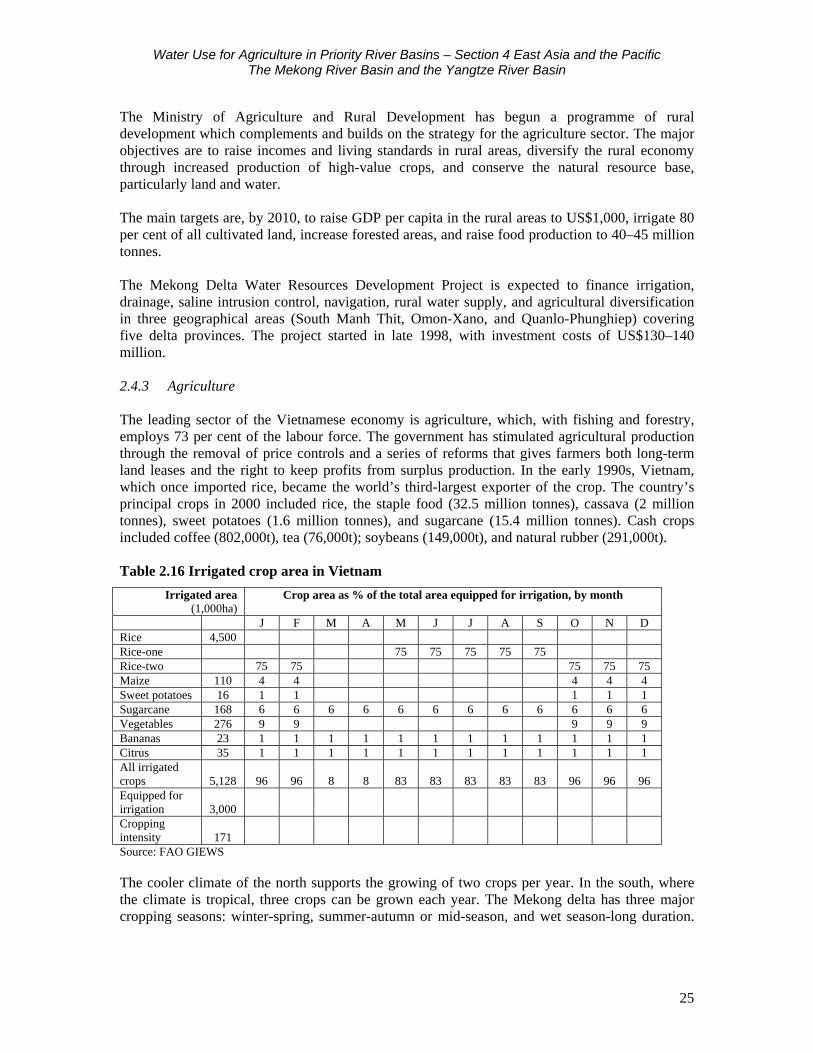
Table 2.16 Irrigated crop area in Vietnam
Irrigated area(1,000ha)
Crop area as % of the total area equipped for irrigation, by month
J F M A M J J A S O N DRice 4,500Rice-one 75 75 75 75 75Rice-two 75 75 75 75 75Maize 110 4 4 4 4 4Sweet potatoes 16 1 1 1 1 1Sugarcane 168 6 6 6 6 6 6 6 6 6 6 6 6Vegetables 276 9 9 9 9 9Bananas 23 1 1 1 1 1 1 1 1 1 1 1 1Citrus 35 1 1 1 1 1 1 1 1 1 1 1 1All irrigatedcrops 5,128 96 96 8 8 83 83 83 83 83 96 96 96Equipped forirrigation 3,000Croppingintensity 171Source: FAO GIEWS
The cooler climate of the north supports the growing of two crops per year. In the south, wherethe climate is tropical, three crops can be grown each year. The Mekong delta has three majorcropping seasons: winter-spring, summer-autumn or mid-season, and wet season-long duration.
Water Use for Agriculture in Priority River Basins – Section 4 East Asia and the PacificThe Mekong River Basin and the Yangtze River Basin
26
Fifty-two per cent of the rice in the Mekong delta is grown in irrigated lowlands, with theremaining 48 per cent grown under rain-fed lowland conditions.
The area under modern rice varieties in the winter-spring, summer-autumn, and part of the wetseason-long duration crop has increased by 15–20 per cent in recent years. On average, winter-spring yields are highest (3.8t/ha), followed by yields of summer-autumn (3.4t/ha) and wetseason-long duration rice (2.7t/ha). Floating rice yields are low at 1.5t/ha.
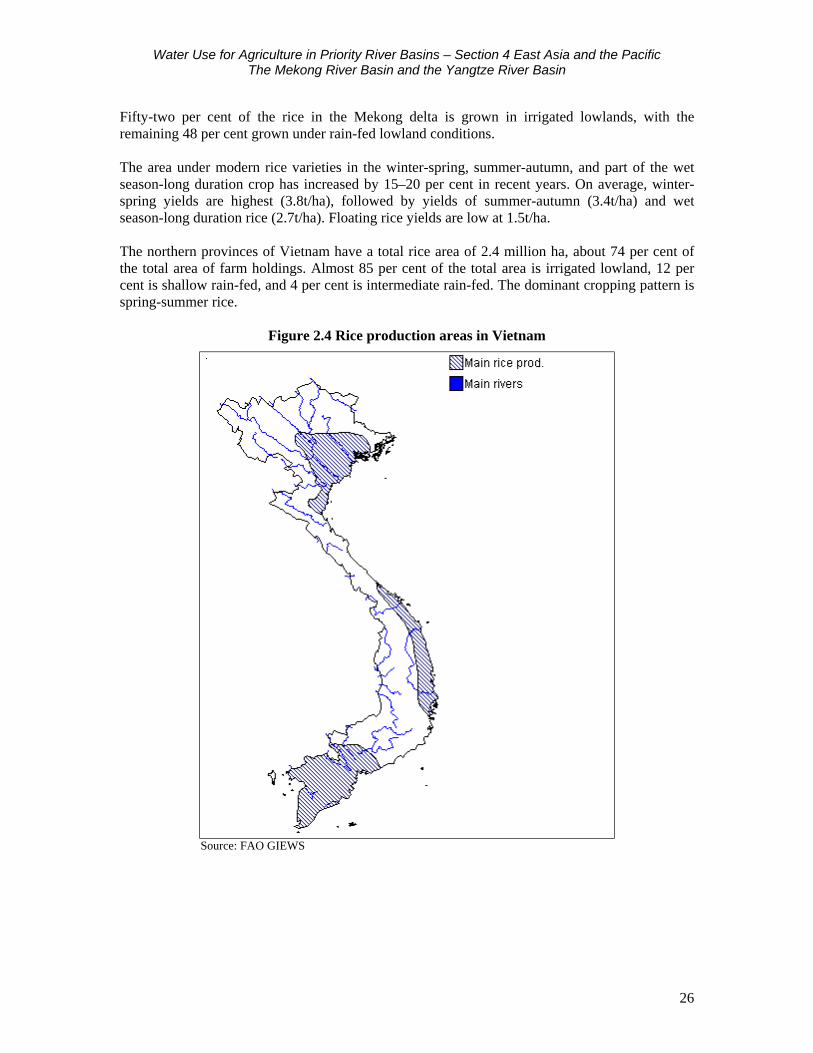
The northern provinces of Vietnam have a total rice area of 2.4 million ha, about 74 per cent ofthe total area of farm holdings. Almost 85 per cent of the total area is irrigated lowland, 12 percent is shallow rain-fed, and 4 per cent is intermediate rain-fed. The dominant cropping pattern isspring-summer rice.
Figure 2.4 Rice production areas in Vietnam
Source: FAO GIEWS
Water Use for Agriculture in Priority River Basins – Section 4 East Asia and the PacificThe Mekong River Basin and the Yangtze River Basin
27
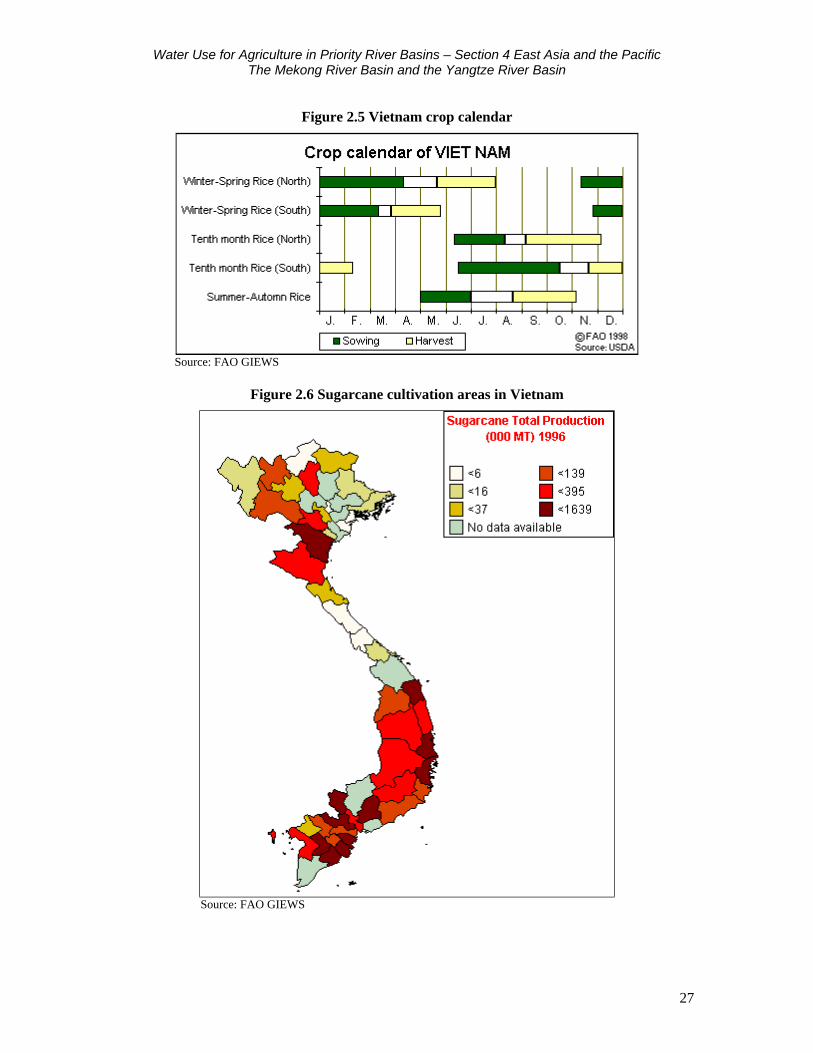
Figure 2.5 Vietnam crop calendar
Source: FAO GIEWS
Figure 2.6 Sugarcane cultivation areas in Vietnam
Source: FAO GIEWS
Water Use for Agriculture in Priority River Basins – Section 4 East Asia and the PacificThe Mekong River Basin and the Yangtze River Basin
28
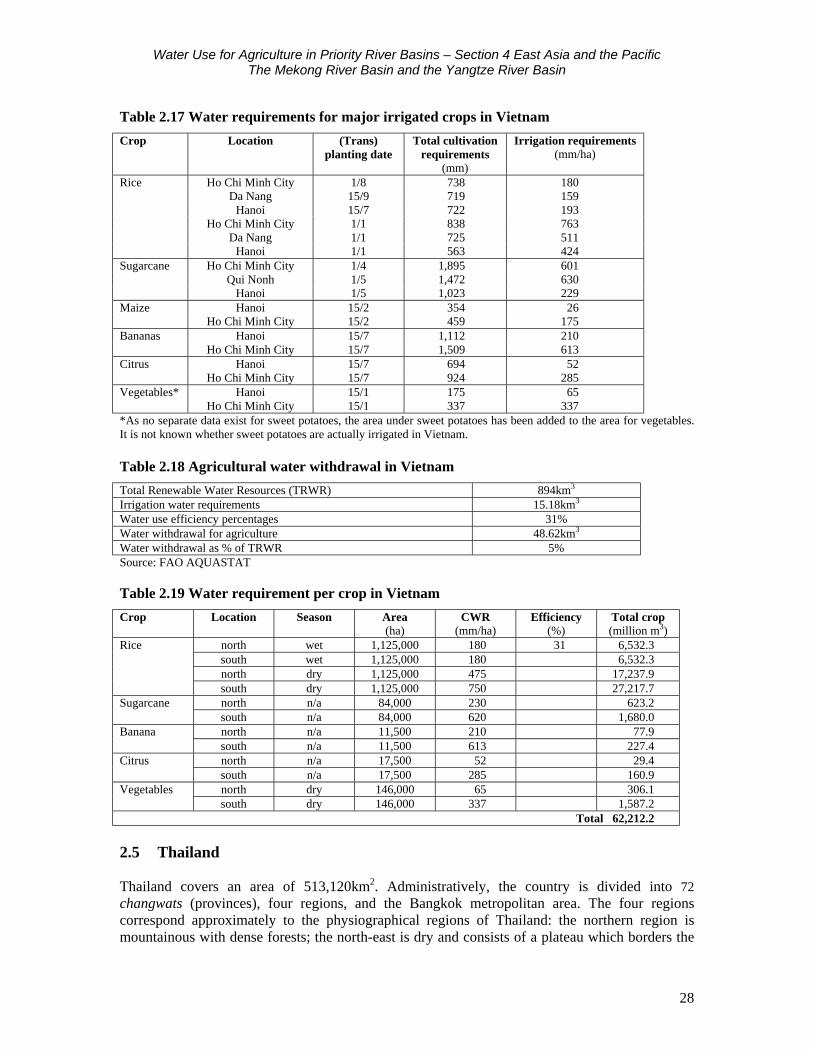
Table 2.17 Water requirements for major irrigated crops in Vietnam
Crop Location (Trans)planting date
Total cultivationrequirements
(mm)
Irrigation requirements(mm/ha)
Rice Ho Chi Minh City 1/8 738 180Da Nang 15/9 719 159
Hanoi 15/7 722 193Ho Chi Minh City 1/1 838 763
Da Nang 1/1 725 511Hanoi 1/1 563 424
Sugarcane Ho Chi Minh City 1/4 1,895 601Qui Nonh 1/5 1,472 630
Hanoi 1/5 1,023 229Maize Hanoi 15/2 354 26
Ho Chi Minh City 15/2 459 175Bananas Hanoi 15/7 1,112 210
Ho Chi Minh City 15/7 1,509 613Citrus Hanoi 15/7 694 52
Ho Chi Minh City 15/7 924 285Vegetables* Hanoi 15/1 175 65
Ho Chi Minh City 15/1 337 337*As no separate data exist for sweet potatoes, the area under sweet potatoes has been added to the area for vegetables.It is not known whether sweet potatoes are actually irrigated in Vietnam.
Table 2.18 Agricultural water withdrawal in Vietnam
Total Renewable Water Resources (TRWR) 894km3
Irrigation water requirements 15.18km3
Water use efficiency percentages 31%Water withdrawal for agriculture 48.62km3
Water withdrawal as % of TRWR 5%Source: FAO AQUASTAT
Table 2.19 Water requirement per crop in Vietnam
Crop Location Season Area(ha)
CWR(mm/ha)
Efficiency(%)
Total crop(million m3)
Rice north wet 1,125,000 180 31 6,532.3south wet 1,125,000 180 6,532.3north dry 1,125,000 475 17,237.9south dry 1,125,000 750 27,217.7
Sugarcane north n/a 84,000 230 623.2south n/a 84,000 620 1,680.0
Banana north n/a 11,500 210 77.9south n/a 11,500 613 227.4
Citrus north n/a 17,500 52 29.4south n/a 17,500 285 160.9
Vegetables north dry 146,000 65 306.1south dry 146,000 337 1,587.2
Total 62,212.2
2.5 Thailand
Thailand covers an area of 513,120km2. Administratively, the country is divided into 72changwats (provinces), four regions, and the Bangkok metropolitan area. The four regionscorrespond approximately to the physiographical regions of Thailand: the northern region ismountainous with dense forests; the north-east is dry and consists of a plateau which borders the
Water Use for Agriculture in Priority River Basins – Section 4 East Asia and the PacificThe Mekong River Basin and the Yangtze River Basin
29
Mekong River; the central region is an extensive plain subject to flooding; and the southern partconsists of a peninsula.
About 26.8 million ha are considered as suitable for agricultural production, and in 2000 thecultivated area was estimated at 18.8 million ha, 37 per cent of the total area. Of this, 15.5 millionha, 82 per cent of the total cultivated area, were under annual crops (mainly paddy rice) and theremaining 3.3 million were under permanent crops.
Thailand has a population of 62.3 million, with an average population density in 2000 of 121.4inhabitants/km2. Average population growth is around 0.9 per cent.
Thailand’s GDP in the last ten years (1990–1999) comprised 41.5 per cent from manufacturing,47.5 per cent from the service sector, and 11 per cent from agriculture; however, the latter fell to10 per cent in 1999. Overall production in the major agricultural sectors (fishery, rubber, and rice)for the period 1994–1998 showed an upward trend. At present, the agricultural sector is focusedon the export market. In 1998, fishery production consisted of 12.5 per cent of export earnings,compared to 8.7 per cent for rice and 5.5 per cent for rubber. Other important commodities arecassava, sugar, and livestock products. The staple food crop is rice, with a farmed value ofUS$4,100 million in 1997.
Thailand is one of four parties to the Mekong River Commission, signed in April 1995 for thesustainable development of the Mekong River. It hosts the commission’s secretariat in Bangkok.
2.5.1 Climate and water resources
Thailand’s climate is governed mainly by the alternation between the south-west monsoon, whichbrings heavy rainfalls (from May to October), and the north-east monsoon, which iscomparatively dry and cool (from October to February). The transitional period is characterizedby heavy thunderstorms.
Average annual rainfall is estimated at 1,485mm, ranging from 1,100mm in the central plain andthe north-east of the country, to 4,000mm in the southern peninsula near the Andaman Sea.
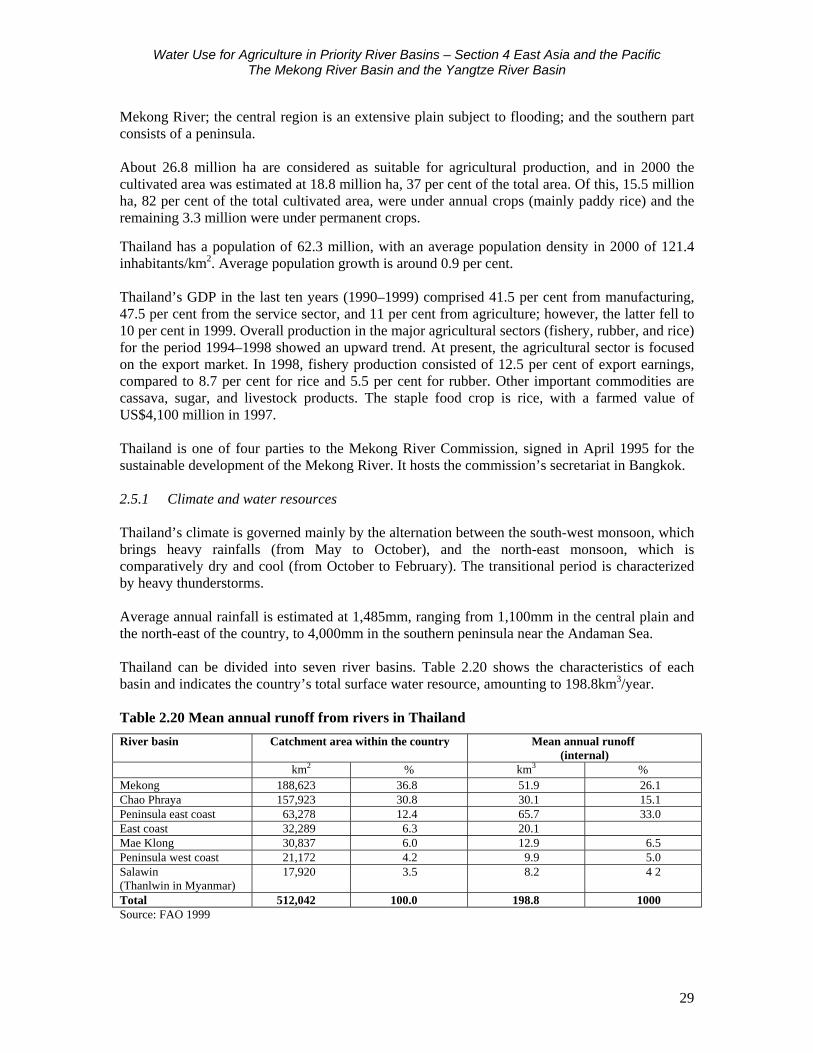
Thailand can be divided into seven river basins. Table 2.20 shows the characteristics of eachbasin and indicates the country’s total surface water resource, amounting to 198.8km3/year.
Table 2.20 Mean annual runoff from rivers in Thailand
River basin Catchment area within the country Mean annual runoff (internal)
km2 % km3 %Mekong 188,623 36.8 51.9 26.1Chao Phraya 157,923 30.8 30.1 15.1Peninsula east coast 63,278 12.4 65.7 33.0East coast 32,289 6.3 20.1Mae Klong 30,837 6.0 12.9 6.5Peninsula west coast 21,172 4.2 9.9 5.0Salawin (Thanlwin in Myanmar)
17,920 3.5 8.2 4 2
Total 512,042 100.0 198.8 1000Source: FAO 1999
Water Use for Agriculture in Priority River Basins – Section 4 East Asia and the PacificThe Mekong River Basin and the Yangtze River Basin
30
Aquifer recharge from rainfall is estimated at 41.9km3/year (about 5–6% of total precipitation).Approximately 30.7km3/year is estimated to return to the river system and are included in thesurface water resources. The total internal water resources of Thailand are therefore estimated at210km3/year.
International riversThailand shares three rivers with its neighbours. The Mekong River forms the border with LaoPDR in the north and east. About 18 per cent of the total Mekong catchment area is located inThailand.
The Salawin River is on the north-western border with Myanmar. No agreement has yet beensigned between the two countries, but a working group is assessing the irrigation and hydropowerpotential of the Salawin River and its tributaries.
The Kolok River forms the southern border with Malaysia.
The Mekong and the Salawin Rivers constitute an additional external water resource for Thailand,which has been estimated as half the discharge of the rivers minus the country’s contribution; thatis, 100km3 (half the Salawin discharge) minus 8.156km3 (Thailand’s contribution to the Salawin)plus 162.225km3 (half the Mekong discharge) minus 5l.9km3 (Thailand’s contribution to theMekong in the border reach) = 199.9km3/year.
Total renewable water resourcesAdding the internal and external resources together, Thailand’s total renewable water resourcesare estimated at 410km3/year.
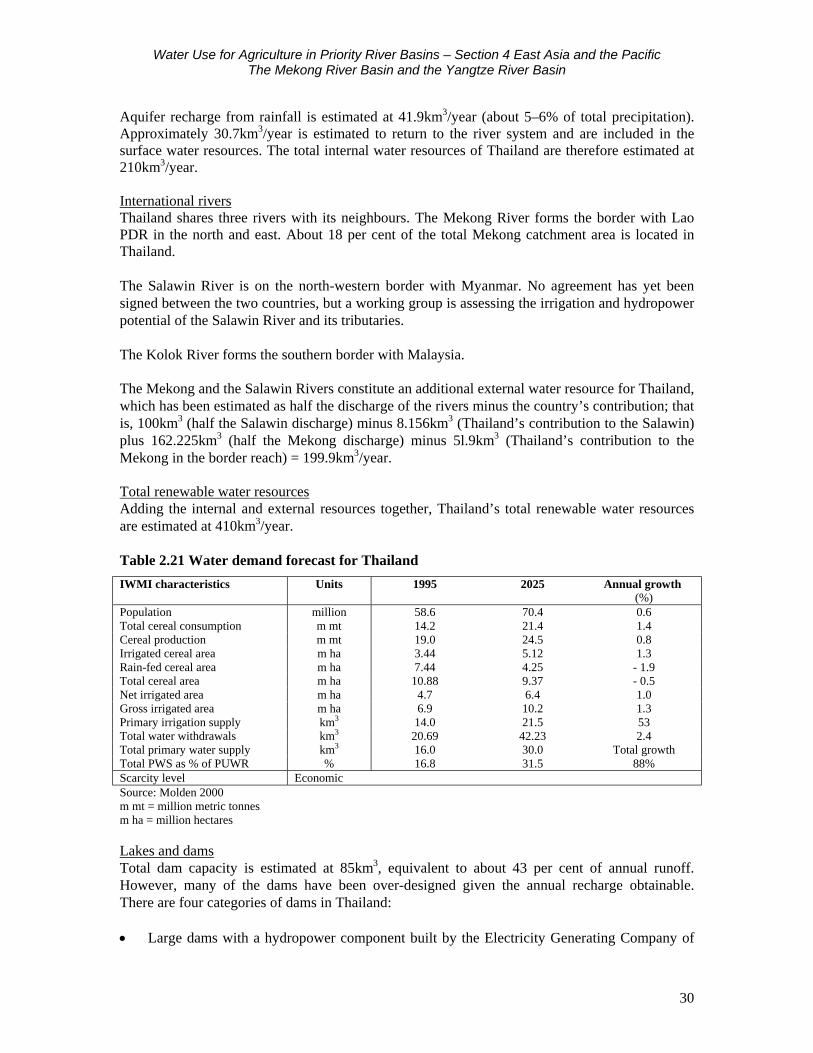
Table 2.21 Water demand forecast for Thailand
IWMI characteristics Units 1995 2025 Annual growth (%)
Population million 58.6 70.4 0.6Total cereal consumption m mt 14.2 21.4 1.4Cereal production m mt 19.0 24.5 0.8Irrigated cereal area m ha 3.44 5.12 1.3Rain-fed cereal area m ha 7.44 4.25 - 1.9Total cereal area m ha 10.88 9.37 - 0.5Net irrigated area m ha 4.7 6.4 1.0Gross irrigated area m ha 6.9 10.2 1.3Primary irrigation supply km3 14.0 21.5 53Total water withdrawals km3 20.69 42.23 2.4Total primary water supply km3 16.0 30.0 Total growthTotal PWS as % of PUWR % 16.8 31.5 88%Scarcity level EconomicSource: Molden 2000m mt = million metric tonnesm ha = million hectares
Lakes and damsTotal dam capacity is estimated at 85km3, equivalent to about 43 per cent of annual runoff.However, many of the dams have been over-designed given the annual recharge obtainable.There are four categories of dams in Thailand:
• Large dams with a hydropower component built by the Electricity Generating Company of
Water Use for Agriculture in Priority River Basins – Section 4 East Asia and the PacificThe Mekong River Basin and the Yangtze River Basin
31
Thailand (EGAT), the Royal Irrigation Department (RID) or the Department of EnergyDevelopment and Promotion, and managed by EGAT. Their total capacity is estimated at53.5km3. Hydropower generation is important in Thailand as its 21 hydropower plantsaccount for 18 per cent of installed capacity and 5 per cent of energy production. However,all these dams are multi-purpose, and irrigation receives priority over other components.
• Large dams with no hydropower component. and therefore mainly destined for irrigation,operated by the RID. Their total capacity was estimated at 31.4km3 in 1995.
• Small dams, which cost about US$200,000 developed by the Office of Accelerated RuralDevelopment under the Ministry of Interior for irrigation, livestock and domestic purposes.
• Small dams of around 100,000m3 each, developed by the Land Development Department ofthe Ministry of Agriculture and Cooperatives. They cost about US$120,000 each and areused for agricultural and domestic purposes. Their total capacity is estimated at 0.1km3. Eachyear, about 200 such dams are constructed or rehabilitated.
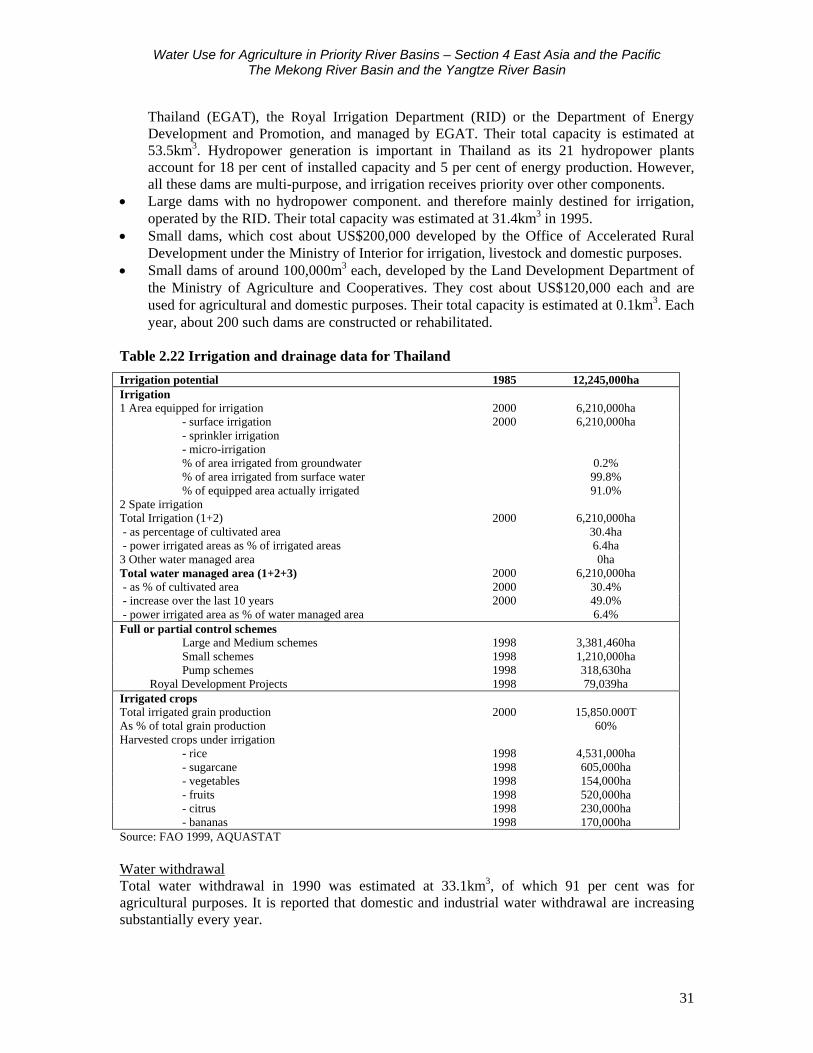
Table 2.22 Irrigation and drainage data for Thailand
Irrigation potential 1985 12,245,000haIrrigation1 Area equipped for irrigation 2000 6,210,000ha
- surface irrigation 2000 6,210,000ha- sprinkler irrigation- micro-irrigation % of area irrigated from groundwater 0.2%% of area irrigated from surface water 99.8%% of equipped area actually irrigated 91.0%
2 Spate irrigationTotal Irrigation (1+2) 2000 6,210,000ha - as percentage of cultivated area 30.4ha - power irrigated areas as % of irrigated areas 6.4ha3 Other water managed area 0haTotal water managed area (1+2+3) 2000 6,210,000ha - as % of cultivated area 2000 30.4% - increase over the last 10 years 2000 49.0% - power irrigated area as % of water managed area 6.4%Full or partial control schemes
Large and Medium schemes 1998 3,381,460haSmall schemes 1998 1,210,000haPump schemes 1998 318,630ha
Royal Development Projects 1998 79,039haIrrigated cropsTotal irrigated grain production 2000 15,850.000TAs % of total grain production 60%Harvested crops under irrigation
- rice 1998 4,531,000ha- sugarcane 1998 605,000ha- vegetables 1998 154,000ha- fruits 1998 520,000ha- citrus 1998 230,000ha- bananas 1998 170,000ha
Source: FAO 1999, AQUASTAT
Water withdrawalTotal water withdrawal in 1990 was estimated at 33.1km3, of which 91 per cent was foragricultural purposes. It is reported that domestic and industrial water withdrawal are increasingsubstantially every year.
Water Use for Agriculture in Priority River Basins – Section 4 East Asia and the PacificThe Mekong River Basin and the Yangtze River Basin
32
Treatment of wastewater in Thailand is not common. Industrial wastewater, for example, isgenerally discharged into rivers and canals. In 1992, about 833 million m3 of wastewater wereproduced, while in 1995, only some 35 million m3 of wastewater were treated. Numerouswastewater treatment projects are being developed in Bangkok metropolitan area. There is no re-use of treated wastewater in Thailand.
2.5.2 Irrigation and drainage development
Irrigation potential in the wet season can be roughly estimated at 12 million ha, taking intoaccount both soil and water availability, but excluding basin transfers. The total area suitable forirrigation is estimated at 16 million ha.
Irrigation through river diversion and from reservoirs started in the north seven centuries ago. Inmodern times, canal construction for irrigation started at the beginning of the 20th century, inparallel with the creation of the Royal Irrigation Department. The aim was to maintain water incanals for irrigation and navigation, and to drain paddy fields during periods of flooding.Irrigation has traditionally been supplementary irrigation during the wet season. It is only recentlythat schemes have been designed for dry season irrigation.
Thailand develops 120,000ha of irrigation schemes each year. In 1995, the area equipped for wetseason irrigation was estimated at 5,003,724ha. These irrigated areas can be divided into fivecategories:
• Large and medium-scale schemes (3,381,460ha in 1995): Ninety-six per cent of theseschemes (around 650 covering an irrigated area of 3,255,124ha) have been designed,constructed and managed by the RID. They are concentrated mainly in the central plainwithin the Chao Phraya River system, which is called the rice bowl of Thailand. Some ofthem are pump schemes. The remaining 4 per cent (65 projects covering 126,336ha) haveonly been partially implemented by the RID, as they rely on dams constructed by EGAT.
• Small-scale (private) schemes: There are 7,246 such schemes covering some 1.21 million ha,designed and built by the RID or other government departments, by NGOs, or by the privatesector. They should be farmer operated and managed, but farmers often require RIDassistance for maintenance once costs exceed US$4,000.
• Pump schemes: These schemes have been implemented mainly in the north-east (50% of thetotal) and north (35%) by EGAT, and are still managed with its assistance. In 1995, the areaequipped for wet season irrigation was about 318,630ha. Only 58,240ha were also irrigatedduring the dry season, of which 22 per cent was for rice cultivation.
• Royal Development Projects: Some 347 projects cover a total area equipped for irrigation of79,039ha. Selected by the King of Thailand, these projects have been implemented andmanaged by the RID, under the supervision of the Office of the Coordinating Committee forRoyal Development Projects. They are generally small-scale and are spread throughout thecountry, mainly in remote areas.
• Self-defense village projects: Implemented in military-sensitive areas by the RID, there are171 of these projects, with a total area equipped for wet season irrigation of 16,377ha.
In 1998, the area actually irrigated was estimated at 124 per cent of the total equipped area. Ingeneral surface water is used for irrigation, but in the Sukhotai area groundwater is pumped up.Sprinkler and drip irrigation are at an experimental stage on fruit trees only.
Water Use for Agriculture in Priority River Basins – Section 4 East Asia and the PacificThe Mekong River Basin and the Yangtze River Basin
33
Early systems were designed to operate at full capacity only in the wet season, and current canalcapacities and control regulators are inadequate for the increasing demand for dry seasonirrigation. Furthermore, the demand for irrigation water has to compete with the demands of othersectors. This becomes a sensitive issue during the dry season. A certain flow of water has to bemaintained for navigation, to prevent salt-water intrusion, and to supply water for domestic andindustrial purposes in the Bangkok area. A situation has been reached where, in the dry season,water resources can no longer meet the increasing water demand from all sectors, particularly forthe increasing needs of the irrigation sub-sector. This has led to poor agricultural performance inrecent dry seasons.
Dry season irrigation is practised on 18 per cent of the equipped area, while part of the irrigatedland is used as fish ponds during the dry season.
Small-scale projects are those which can be completed within one year and without landcompensation. Schemes which cannot be completed within one year or which need landcompensation are considered medium-scale. Projects are classified as large-scale where they havea storage capacity of more than 100 million m3, or where they can irrigate at least 12,800ha.
The main irrigated crop during the wet season is rice, with an average yield of 3.5t/ha.
Normally the RID is responsible for the maintenance of main and secondary canals, while thetertiary and field canals are the responsibility of farmers. Water user associations have not yetbeen set up on a wide scale, except in the north where farmers have formed groups in order torepair and maintain traditional weirs.
In the north-east of the country 10 per cent of irrigated land is affected by salinity, the primarycause being the salt-bearing nature of the materials from which the soils develop. Irrigation servesto accelerate the process, and many programmes have been started to manage cash crops and ricepaddies on saline soils. Salinization is also reported to have affected large parts in coastal areas ofthe central plain.
Trends in water resource management In the central region of Thailand there is a great need for water supply for agricultural irrigationand the urban sector. Most of the water used in this region comes from the north of the country.However, in the last few years there has been an increasing demand for water, especially in theirrigation sector, in the northern region. In the National Water Plan the RID has identified 463projects to be carried out over the period 1997–2006, covering an irrigated area of approximately1.5 million ha, with a storage capacity of 12km3. If the observed trend continues, and if all theprojects in the north are implemented, a point will be reached in the near future where waterreleased from the northern region, after satisfying requirements there, will not be sufficient tomeet the demand for irrigation water in the central region.
To address this problem the government has launched numerous programmes to both reducewater demand and increase water resources. To reduce demand, the RID will encourage andincrease water-use efficiency both at farm and scheme levels. In addition, the introduction ofwater fees following implementation of the new water law should encourage farmers to reducewastage. Ongoing national economic and social development stresses the need for more efficientuse of water and in particular the importance of collecting water fees in irrigated agriculture toavoid wastage. Agricultural water fees should cover operation and maintenance costs only, while
Water Use for Agriculture in Priority River Basins – Section 4 East Asia and the PacificThe Mekong River Basin and the Yangtze River Basin
34
for the domestic and industrial sectors the fees should also take account of the construction andmaintenance costs of water distribution systems.
To increase available resources, inter-basin transfers are being studied and implemented. Onesuch project already exists and diverts water from the Mae Klong River to the Chao Phrayacentral plain. Other more politically sensitive projects, such as the diversion of water from theMekong, Mae Kok and Mae Eng Rivers to the Yom and the An Rivers, are still at the level offeasibility studies.
Overall, it can be observed that water resources development lacks comprehensive planning andcoordination by the different agencies involved. As proposed in the draft water law, thepromotion of the National Water Resources Committee as the lead agency in terms of waterpolicy definition would address the issue. Moreover, a committee dealing with water allocationby river basin would act as a forum for all water users and help to develop seasonal waterallocation plans. The master plan for water resources development will provide a framework forall activities carried out by the various agencies.
2.5.3 Agriculture
Rice is the country’s most important crop and is the staple food of the entire population regardlessof income. The average annual per capita consumption is about 128kg of milled rice. Eventhough declining in relative importance, it still occupies over half of the total cultivated land. Ricefarmers are generally subsistence farmers, selling only their excess production. The main surplusproduction comes from the central region.
Thailand is the major rice exporter in the world market, currently exporting about 4 milliontonnes per year. It has a reputation for high-quality, long-grain, white rice, which usuallycommands a substantial price advantage over lower grades. The emphasis on grain quality is themain reason for the low adoption rate of modern, high-yielding rice varieties in Thailand.
In response to the export opportunities, as well as increasing domestic requirement, land underrice cultivation has increased steadily over time. Only recently has it begun to stabilize at around10 million ha. About a quarter is irrigated; the rest is still rain-fed. Rice production has stagnatedat around 20 million tonnes since 1985.
Rice environmentAdministratively as well as geographically, Thailand is divided into four regions: central, north,north-east, and south. Each region has different rice growing environments.
• North-east: This region encompasses almost a third of the whole of Thailand. Nearly half ofthe country’s rice growing area is located here and the rice farms are, on average, larger thanin other regions. Soil erosion and drought during the dry season are acute, and the capacityof the soil to hold water is extremely poor. Less than 20 per cent of the total of irrigated landin Thailand is located in this region, with less than 10 per cent planted to rice in the dryseason.
• Central: This region is an intensively cultivated alluvial area, a major part of which iscovered with rice during the rainy season. The region accounts for about one-fifth of thecountry’s total cultivated rice area in the wet season.
• North: The northern region has almost 17 million ha of rice, grown in both upland andlowland areas. Lowland rice is grown mainly in lower valleys and on some terraced fields
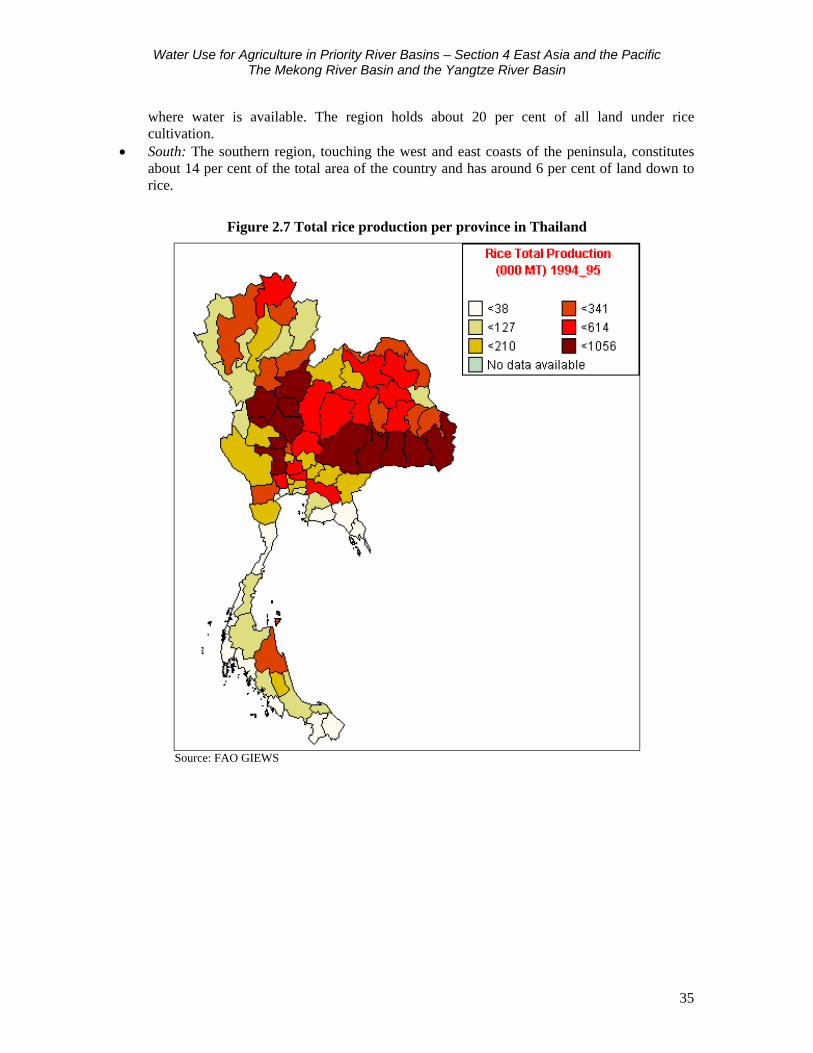
Water Use for Agriculture in Priority River Basins – Section 4 East Asia and the PacificThe Mekong River Basin and the Yangtze River Basin
35
where water is available. The region holds about 20 per cent of all land under ricecultivation.
• South: The southern region, touching the west and east coasts of the peninsula, constitutesabout 14 per cent of the total area of the country and has around 6 per cent of land down torice.
Figure 2.7 Total rice production per province in Thailand
Source: FAO GIEWS
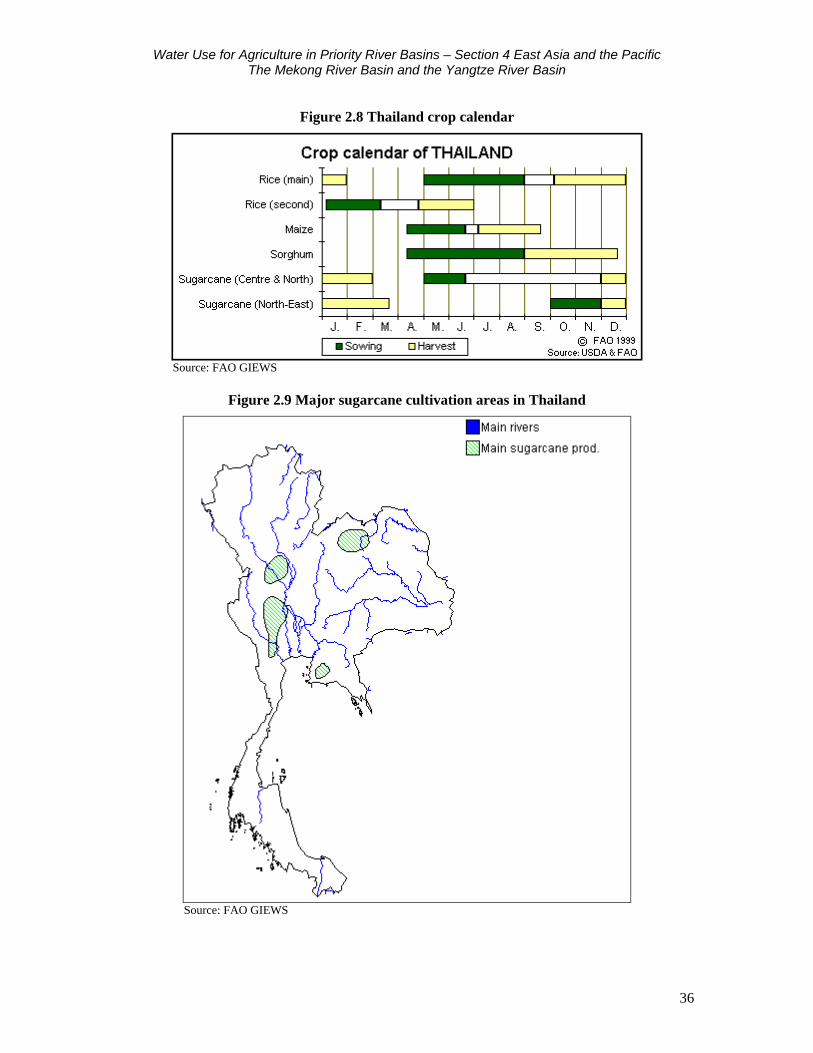
Water Use for Agriculture in Priority River Basins – Section 4 East Asia and the PacificThe Mekong River Basin and the Yangtze River Basin
36
Figure 2.8 Thailand crop calendar
Source: FAO GIEWS
Figure 2.9 Major sugarcane cultivation areas in Thailand
Source: FAO GIEWS
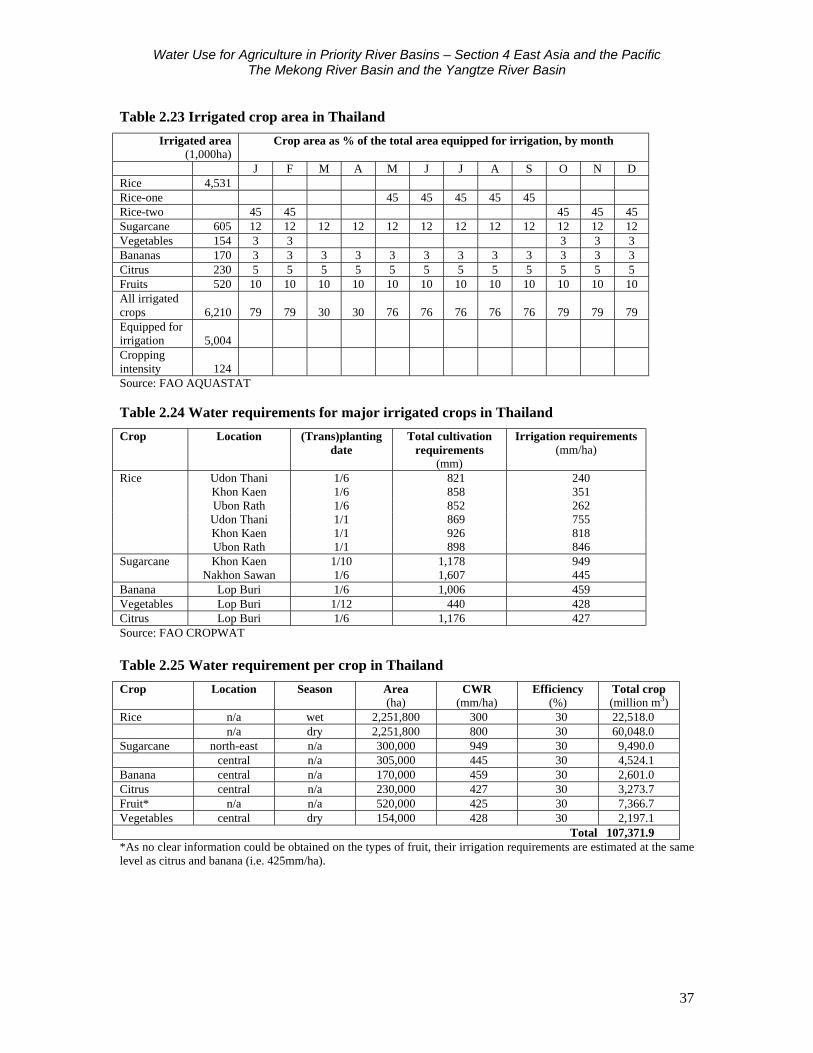
Water Use for Agriculture in Priority River Basins – Section 4 East Asia and the PacificThe Mekong River Basin and the Yangtze River Basin
37
Table 2.23 Irrigated crop area in Thailand
Irrigated area(1,000ha)
Crop area as % of the total area equipped for irrigation, by month
J F M A M J J A S O N DRice 4,531Rice-one 45 45 45 45 45Rice-two 45 45 45 45 45Sugarcane 605 12 12 12 12 12 12 12 12 12 12 12 12Vegetables 154 3 3 3 3 3Bananas 170 3 3 3 3 3 3 3 3 3 3 3 3Citrus 230 5 5 5 5 5 5 5 5 5 5 5 5Fruits 520 10 10 10 10 10 10 10 10 10 10 10 10All irrigatedcrops 6,210 79 79 30 30 76 76 76 76 76 79 79 79Equipped forirrigation 5,004Croppingintensity 124Source: FAO AQUASTAT
Table 2.24 Water requirements for major irrigated crops in Thailand
Crop Location (Trans)plantingdate
Total cultivationrequirements
(mm)
Irrigation requirements(mm/ha)
Rice Udon Thani 1/6 821 240Khon Kaen 1/6 858 351Ubon Rath 1/6 852 262Udon Thani 1/1 869 755Khon Kaen 1/1 926 818Ubon Rath 1/1 898 846
Sugarcane Khon Kaen 1/10 1,178 949Nakhon Sawan 1/6 1,607 445
Banana Lop Buri 1/6 1,006 459Vegetables Lop Buri 1/12 440 428Citrus Lop Buri 1/6 1,176 427Source: FAO CROPWAT
Table 2.25 Water requirement per crop in Thailand
Crop Location Season Area(ha)
CWR(mm/ha)
Efficiency(%)
Total crop(million m3)
Rice n/a wet 2,251,800 300 30 22,518.0n/a dry 2,251,800 800 30 60,048.0
Sugarcane north-east n/a 300,000 949 30 9,490.0central n/a 305,000 445 30 4,524.1
Banana central n/a 170,000 459 30 2,601.0Citrus central n/a 230,000 427 30 3,273.7Fruit* n/a n/a 520,000 425 30 7,366.7Vegetables central dry 154,000 428 30 2,197.1
Total 107,371.9*As no clear information could be obtained on the types of fruit, their irrigation requirements are estimated at the samelevel as citrus and banana (i.e. 425mm/ha).

Water Use for Agriculture in Priority River Basins – Section 4 East Asia and the PacificThe Mekong River Basin and the Yangtze River Basin
38
Table 2.26 Agricultural water withdrawal in Thailand
Total Renewable Water Resources (TRWR) 410km3
Irrigation Water Requirements 23.79km3
Water Use efficiency percentages 30%Water withdrawal for Agriculture 79.29km3
Water withdrawal as % of TRWR 19%Source: FAO AQUASTAT
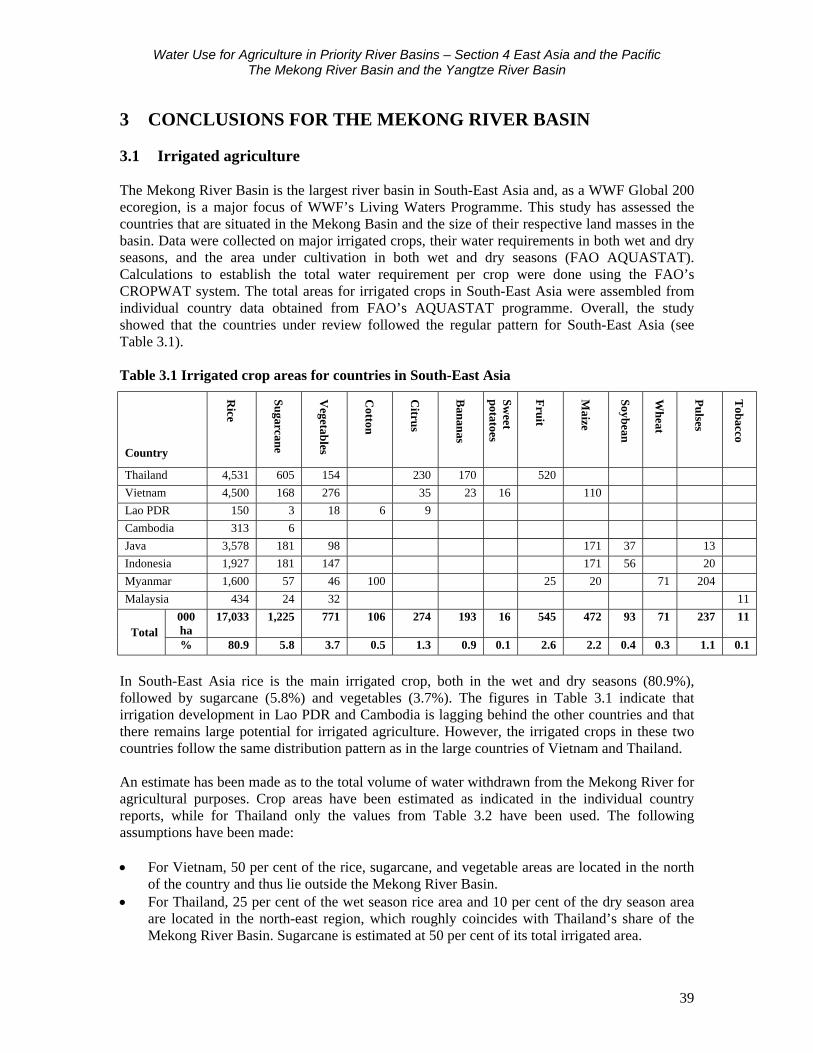
Water Use for Agriculture in Priority River Basins – Section 4 East Asia and the PacificThe Mekong River Basin and the Yangtze River Basin
39
3 CONCLUSIONS FOR THE MEKONG RIVER BASIN
3.1 Irrigated agriculture
The Mekong River Basin is the largest river basin in South-East Asia and, as a WWF Global 200ecoregion, is a major focus of WWF’s Living Waters Programme. This study has assessed thecountries that are situated in the Mekong Basin and the size of their respective land masses in thebasin. Data were collected on major irrigated crops, their water requirements in both wet and dryseasons, and the area under cultivation in both wet and dry seasons (FAO AQUASTAT).Calculations to establish the total water requirement per crop were done using the FAO’sCROPWAT system. The total areas for irrigated crops in South-East Asia were assembled fromindividual country data obtained from FAO’s AQUASTAT programme. Overall, the studyshowed that the countries under review followed the regular pattern for South-East Asia (seeTable 3.1).
Table 3.1 Irrigated crop areas for countries in South-East Asia
Country
Rice
Su
garcane
Vegetab
les
Cotton
Citru
s
Ban
anas
Sweet
potatoes
Fruit
Maize
Soybean
Wh
eat
Pulses
Tobacco
Thailand 4,531 605 154 230 170 520
Vietnam 4,500 168 276 35 23 16 110
Lao PDR 150 3 18 6 9
Cambodia 313 6
Java 3,578 181 98 171 37 13
Indonesia 1,927 181 147 171 56 20
Myanmar 1,600 57 46 100 25 20 71 204
Malaysia 434 24 32 11
000ha
17,033 1,225 771 106 274 193 16 545 472 93 71 237 11Total
% 80.9 5.8 3.7 0.5 1.3 0.9 0.1 2.6 2.2 0.4 0.3 1.1 0.1
In South-East Asia rice is the main irrigated crop, both in the wet and dry seasons (80.9%),followed by sugarcane (5.8%) and vegetables (3.7%). The figures in Table 3.1 indicate thatirrigation development in Lao PDR and Cambodia is lagging behind the other countries and thatthere remains large potential for irrigated agriculture. However, the irrigated crops in these twocountries follow the same distribution pattern as in the large countries of Vietnam and Thailand.
An estimate has been made as to the total volume of water withdrawn from the Mekong River foragricultural purposes. Crop areas have been estimated as indicated in the individual countryreports, while for Thailand only the values from Table 3.2 have been used. The followingassumptions have been made:
• For Vietnam, 50 per cent of the rice, sugarcane, and vegetable areas are located in the northof the country and thus lie outside the Mekong River Basin.
• For Thailand, 25 per cent of the wet season rice area and 10 per cent of the dry season areaare located in the north-east region, which roughly coincides with Thailand’s share of theMekong River Basin. Sugarcane is estimated at 50 per cent of its total irrigated area.
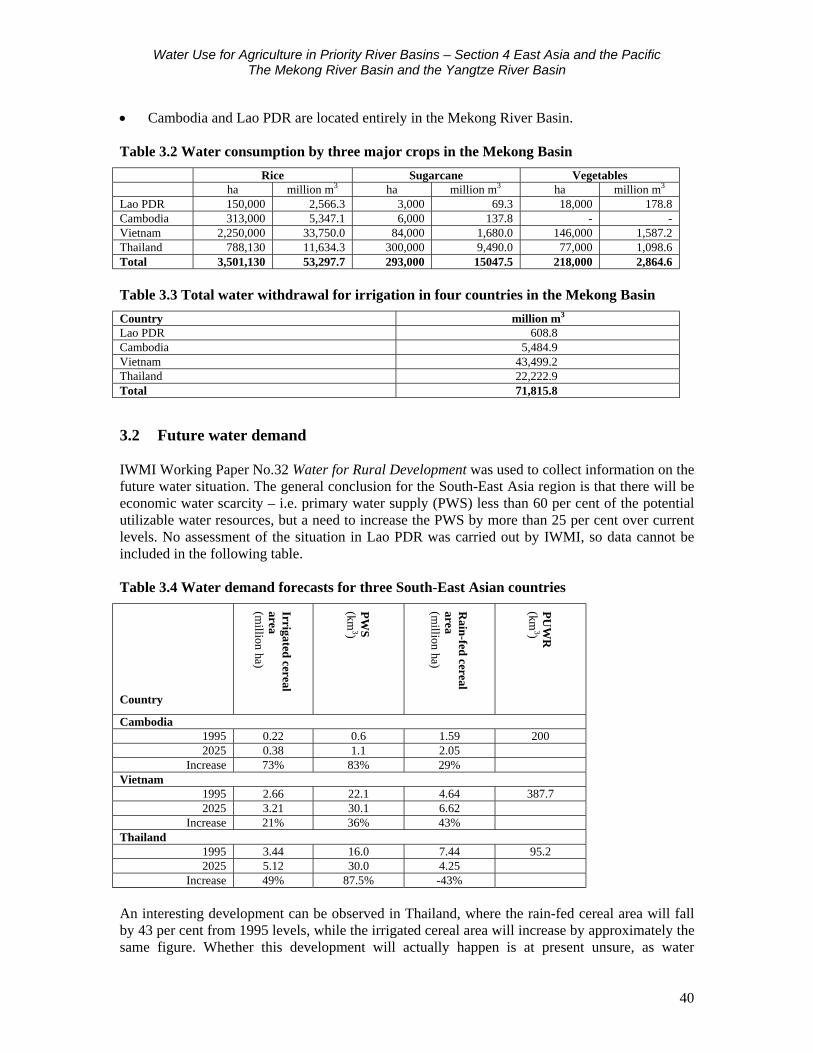
Water Use for Agriculture in Priority River Basins – Section 4 East Asia and the PacificThe Mekong River Basin and the Yangtze River Basin
40
• Cambodia and Lao PDR are located entirely in the Mekong River Basin.
Table 3.2 Water consumption by three major crops in the Mekong Basin
Rice Sugarcane Vegetablesha million m3 ha million m3 ha million m3
Lao PDR 150,000 2,566.3 3,000 69.3 18,000 178.8Cambodia 313,000 5,347.1 6,000 137.8 - -Vietnam 2,250,000 33,750.0 84,000 1,680.0 146,000 1,587.2Thailand 788,130 11,634.3 300,000 9,490.0 77,000 1,098.6Total 3,501,130 53,297.7 293,000 15047.5 218,000 2,864.6
Table 3.3 Total water withdrawal for irrigation in four countries in the Mekong Basin
Country million m3
Lao PDR 608.8Cambodia 5,484.9Vietnam 43,499.2Thailand 22,222.9Total 71,815.8
3.2 Future water demand
IWMI Working Paper No.32 Water for Rural Development was used to collect information on thefuture water situation. The general conclusion for the South-East Asia region is that there will beeconomic water scarcity – i.e. primary water supply (PWS) less than 60 per cent of the potentialutilizable water resources, but a need to increase the PWS by more than 25 per cent over currentlevels. No assessment of the situation in Lao PDR was carried out by IWMI, so data cannot beincluded in the following table.
Table 3.4 Water demand forecasts for three South-East Asian countries
Country
Irrigated cerealarea (m
illion ha)
PW
S (km
3)
Rain-fed cereal
area (m
illion ha)
PU
WR
(km
3)
Cambodia1995 0.22 0.6 1.59 2002025 0.38 1.1 2.05
Increase 73% 83% 29%Vietnam
1995 2.66 22.1 4.64 387.72025 3.21 30.1 6.62
Increase 21% 36% 43%Thailand
1995 3.44 16.0 7.44 95.22025 5.12 30.0 4.25
Increase 49% 87.5% -43%
An interesting development can be observed in Thailand, where the rain-fed cereal area will fallby 43 per cent from 1995 levels, while the irrigated cereal area will increase by approximately thesame figure. Whether this development will actually happen is at present unsure, as water
Water Use for Agriculture in Priority River Basins – Section 4 East Asia and the PacificThe Mekong River Basin and the Yangtze River Basin
41
demands from the industrial and domestic sectors in Thailand are increasing rapidly and locationsfor dam construction are few, or situated in areas that are densely populated or designed asnatural reserves.
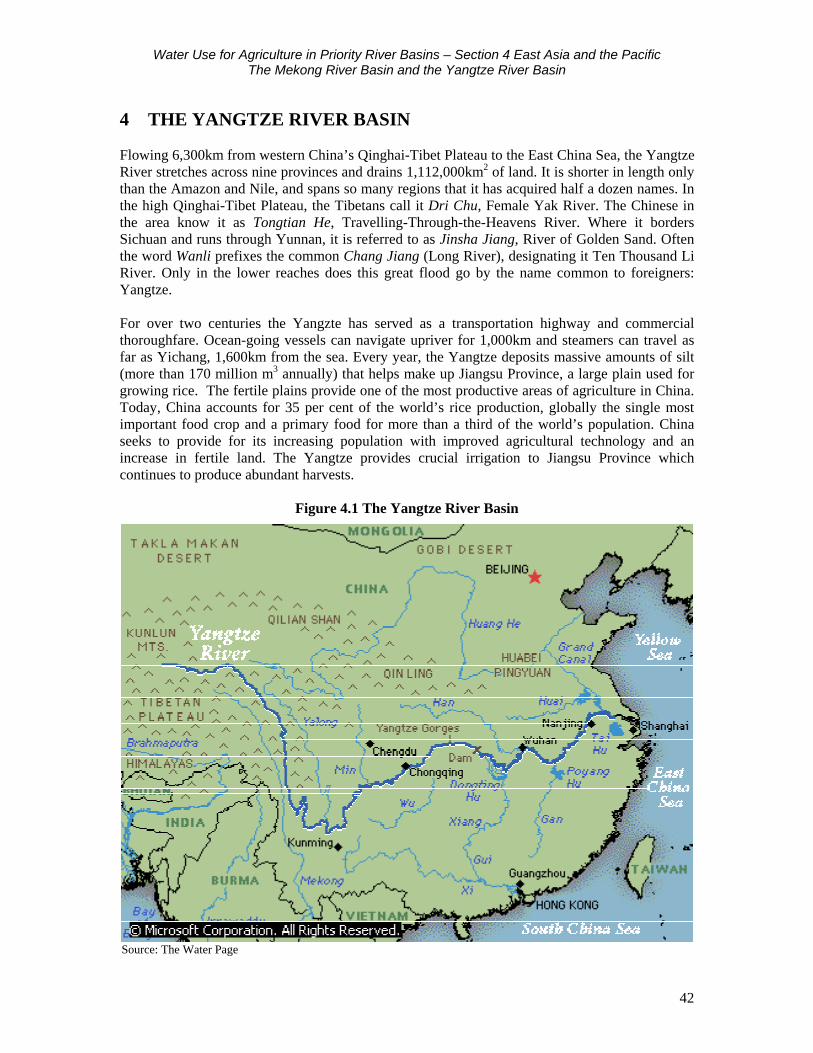
Water Use for Agriculture in Priority River Basins – Section 4 East Asia and the PacificThe Mekong River Basin and the Yangtze River Basin
42
4 THE YANGTZE RIVER BASIN
Flowing 6,300km from western China’s Qinghai-Tibet Plateau to the East China Sea, the YangtzeRiver stretches across nine provinces and drains 1,112,000km2 of land. It is shorter in length onlythan the Amazon and Nile, and spans so many regions that it has acquired half a dozen names. Inthe high Qinghai-Tibet Plateau, the Tibetans call it Dri Chu, Female Yak River. The Chinese inthe area know it as Tongtian He, Travelling-Through-the-Heavens River. Where it bordersSichuan and runs through Yunnan, it is referred to as Jinsha Jiang, River of Golden Sand. Oftenthe word Wanli prefixes the common Chang Jiang (Long River), designating it Ten Thousand LiRiver. Only in the lower reaches does this great flood go by the name common to foreigners:Yangtze.
For over two centuries the Yangzte has served as a transportation highway and commercialthoroughfare. Ocean-going vessels can navigate upriver for 1,000km and steamers can travel asfar as Yichang, 1,600km from the sea. Every year, the Yangtze deposits massive amounts of silt(more than 170 million m3 annually) that helps make up Jiangsu Province, a large plain used forgrowing rice. The fertile plains provide one of the most productive areas of agriculture in China.Today, China accounts for 35 per cent of the world’s rice production, globally the single mostimportant food crop and a primary food for more than a third of the world’s population. Chinaseeks to provide for its increasing population with improved agricultural technology and anincrease in fertile land. The Yangtze provides crucial irrigation to Jiangsu Province whichcontinues to produce abundant harvests.
Figure 4.1 The Yangtze River Basin
Source: The Water Page
Water Use for Agriculture in Priority River Basins – Section 4 East Asia and the PacificThe Mekong River Basin and the Yangtze River Basin
43
4.1 Ecoregions in the Yangtze River Basin
There are five WWF Global 200 Ecoregions in the Yangtze River Basin: Yangtze River andLakes, South-west China Temperate Forests, Hengduan Shan Coniferous Forests, Tibetan PlateauSteppe, and Yunnan Lakes and Streams.
Yangtze River and LakesFrom an elevation of 4,900m, the Yangtze River descends rapidly as it crosses gorges and runspast limestone hills, feeding a series of lakes and undergoing extreme seasonal changes in sizeand depth. During the summer rainy season, the swollen waters of the Yangtze flood into thesurrounding lake basins. In winter and spring, when river levels are low, the lakes drain back intothe river. The flora and fauna are adapted to these cycles. Fish mix freely between lakes duringflood periods and terrestrial mammals swim to high ground. Poyang Lake, one of the largestlakes, serves as winter habitat for numerous waterfowl species.
General threats: Fish farming, deforestation, cultivation of surrounding land for farming andgrazing, pollution, oil drilling, industrialization, urbanization, and introduced diseases fromdomestic waterfowl pose widespread threats to this ecoregion. The most pressing and severethreat is the construction of dams and dykes on the Yangtze and its tributaries. These alter thenatural flow regime, block migratory routes, and sever the connection between the rivers and theirfloodplain habitats. The most notorious of these projects is the Three Gorges Dam, which whencomplete will be 185m high and will store 40 billion m3 of water. Inter-basin water transfers alsothreaten to upset water levels and create opportunities for the introduction of species.
Two species of aquatic mammal are of special concern: Chinese river dolphin (Lipotes vexillifer)and Yangtze finless porpoise (Neophocaena phocaenoides). The river dolphin, restricted to thefreshwater habitats of the Yangtze and its adjoining lakes, is considered the most endangereddolphin species in the world. The finless porpoise is also imperilled but is a more widespreadmarine species, visiting river mouths throughout the Indian Ocean and the Western Pacific. Thedolphins are threatened by pollution and habitat destruction, and by their interaction with fishingoperations. Among numerous threatened fish species are Yangtze sturgeon (Acipenserdabryanus), Chinese sturgeon (A. sinensis), and Chinese swordfish (Psephurus gladius). Othervertebrates include the largest salamander in the world (Audrias davidianus), red-crowned crane(Grus japonensis), and the highly endangered Yangtze alligator (Alligator sinensis).
South-west China Temperate ForestsThis ecoregion includes temperate forests that extend eastward from the Hengduan Mountainsacross northern Sichuan and Sha’anxi Provinces of south-central China. The low hills in this partof China include potential habitat for the endangered giant panda (Ailuropoda melanoleuca).They also include one of the richest assemblages of temperate forest trees in the world. Theseforests support numerous rare species, many of which are endemic.
General threats: Expanding agriculture and increasing demand for timber, both associated with agrowing human population, and the main threats to this ecoregion. Over the past two decades,China’s transition to a market economy has also increased demand for non-timber forest andwildlife products for medicinal and other uses.
Water Use for Agriculture in Priority River Basins – Section 4 East Asia and the PacificThe Mekong River Basin and the Yangtze River Basin
44
Hengduan Shan Coniferous ForestsThis ecoregion includes habitats extending from 1,300m to the tree line at 3,500–4,000m in thenorth-south lying mountain system that defines the eastern edge of the Tibetan Plateau. TheHengduan Mountains include peaks that rise above 7,000m and a number of spectacular rivervalleys. Altitudinal zonation gives this region a high degree of habitat complexity and richbiological diversity. Because much of this ecoregion escaped Pleistocene glaciation, it supports awide diversity of plant and animal species, many of which are endemic relict species. Foremostamong relict plant species is the dawn redwood (Metasequoia glyptostroboides), which untilrecently was presumed extinct. One flagship species in this ecoregion is the giant panda, forwhich a system of nature reserves has been established. Other charismatic mammals that live hereinclude red panda (Ailurus fulens) and the curious takin (Budorcas taxicolor).
General threats: As in many other parts of the world, the demands of a growing humanpopulation are threatening wild habitats, pushing some of the more sensitive species to the brinkof extinction. A particular threat is the growing demand for non-timber forest and wildlifeproducts for medicinal and other uses. Despite laws protecting species such as snow leopard, tigerand black bear, pelts, penises and gall bladders are sold with impunity in local marketsthroughout this ecoregion. For example, markets in the town of Songpan, located on the mainthoroughfare between Wolong (an internationally recognized panda reserve) and Jiuzhaigou (aUNESCO World Heritage site) offered several snow leopard pelts for sale to tourists betweenSeptember 1999 and June 2000.
Tibetan Plateau SteppeThe Tibetan Plateau is situated at the juncture of two zoogeographic realms: the Palearctic andOriental. Due to its size and its position near the tropics, the Tibetan Plateau is one of the mostecologically diverse alpine communities on Earth. Habitats range from gravelly, wind-blownperiglacial environments to moist alpine pastures and scrub.
General threats: Despite low population density, hunting threatens many species of mammalsand large birds.
Yunnan Lakes and StreamsSee under 2.2 Ecoregions in the Mekong River Basin, above.
4.2 Climate and water resources
Vast areas of east China and most of south China are affected by the East Asia monsoon climate.Mountains and plateaux prevent the monsoon from penetrating deeply into the north-west of thecontinent, with resulting low precipitation in this area. In winter, the mainland is generally underthe influence of dry cold air masses from Siberia.
Mean annual precipitation is 648mm. In the coastal areas of the south-east and some regions inthe south-west mean annual precipitation exceeds 2,000mm. To the south of the middle and lowerreaches of the Yangtze River rainfall exceeds 1,000mm, and is between 400 and 800mm in theHuaihe River Basin in the northern plains, north-east and central China. Precipitation is moresignificant in the summer months (April–August in the south and June–September in the North).
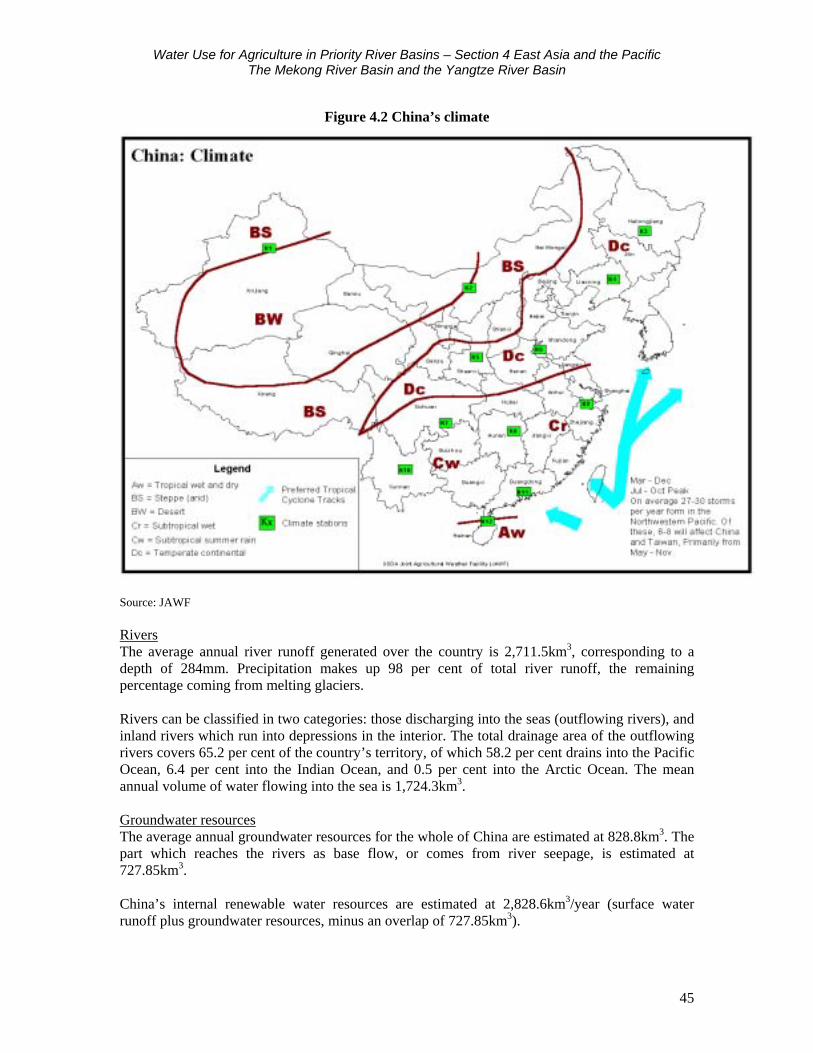
Water Use for Agriculture in Priority River Basins – Section 4 East Asia and the PacificThe Mekong River Basin and the Yangtze River Basin
45
Figure 4.2 China’s climate
Source: JAWF
RiversThe average annual river runoff generated over the country is 2,711.5km3, corresponding to adepth of 284mm. Precipitation makes up 98 per cent of total river runoff, the remainingpercentage coming from melting glaciers.
Rivers can be classified in two categories: those discharging into the seas (outflowing rivers), andinland rivers which run into depressions in the interior. The total drainage area of the outflowingrivers covers 65.2 per cent of the country’s territory, of which 58.2 per cent drains into the PacificOcean, 6.4 per cent into the Indian Ocean, and 0.5 per cent into the Arctic Ocean. The meanannual volume of water flowing into the sea is 1,724.3km3.
Groundwater resourcesThe average annual groundwater resources for the whole of China are estimated at 828.8km3. Thepart which reaches the rivers as base flow, or comes from river seepage, is estimated at727.85km3.
China’s internal renewable water resources are estimated at 2,828.6km3/year (surface waterrunoff plus groundwater resources, minus an overlap of 727.85km3).
Water Use for Agriculture in Priority River Basins – Section 4 East Asia and the PacificThe Mekong River Basin and the Yangtze River Basin
46
Table 4.1 Main rivers in China
River Length (km)
Drainage area (km2)
Average annual runoff (km3)
Mean annualyield modulus(109 m3/km2)
Yangtze (Changjiang) 6,300 1,808,500 951.3 531.57Yellow River (Huang He) 5,646 7562,443 66.1 93.60Amur (Heilongjiang) 3,420 896,756 117.0 149.63Sungari (Songhua) 2,308 557,180 76.2 --Pearl River (Xijang) 2,210 442,100 333.8 810.85Yarlung Zangbo 2,057 240,480 165.0 --Tarim 2,046 194,210 35.0 --Lancangjiang 1,826 167,486 74.0 --Nujiang 1,659 137,818 69.0 --Liao He 1,390 228,960 14.8 167.10Hai He 1,090 263,631 28.8 132.40Huai He 1,000 269,283 62.2 291.90Source: FAO 1999
Water withdrawalIn 2000, the national total water consumption was 549.8km3, of which agricultural water useamounted to 378.4km3 (68.8% of consumption), industrial water use was 113.9km3 (20.7%), anddomestic water use accounted for 57.5km3 (10.5%).
Table 4.2 Water demand forecast for China
IWMI characteristics Units 1995 2025 Annual growth (%)
Population million 1,220.5 1,437.2 0.5Total cereal consumption m mt 379.0 553.8 1.3Cereal production m mt 363.5 572.4 1.5Irrigated cereal area m ha 73.9 102.5 1.1Rain-fed cereal area m ha 39.4 10.8 -4.2Total cereal area m ha 113.3 113.3 0.0Net irrigated area m ha 49.7 67.0 1.0Gross irrigated area m ha 87.0 120.6 1.1Primary irrigation supply km3 325.8 406.4 25Total water withdrawals km3 581.6 916.8 1.5Total primary water supply km3 359 504 TotalTotal PWS as % of PUWR % 44.3 62.3 40%Scarcity level PhysicalSource: Molden 2000m mt = million metric tonnesm ha = million hectares
A computer model developed by Sandia, an American organization, has calculated the waterresources of China as a whole. This shows that there is a surplus of water overall. In five regions,however, all located in the north-east, water use requirements exceed the sustainable yield anddeficits occur in varying degrees. The impact of this deficit will first be felt by the agriculturalsector. Table 4.3 indicates the expected regional water deficit frequency by the year 2025.
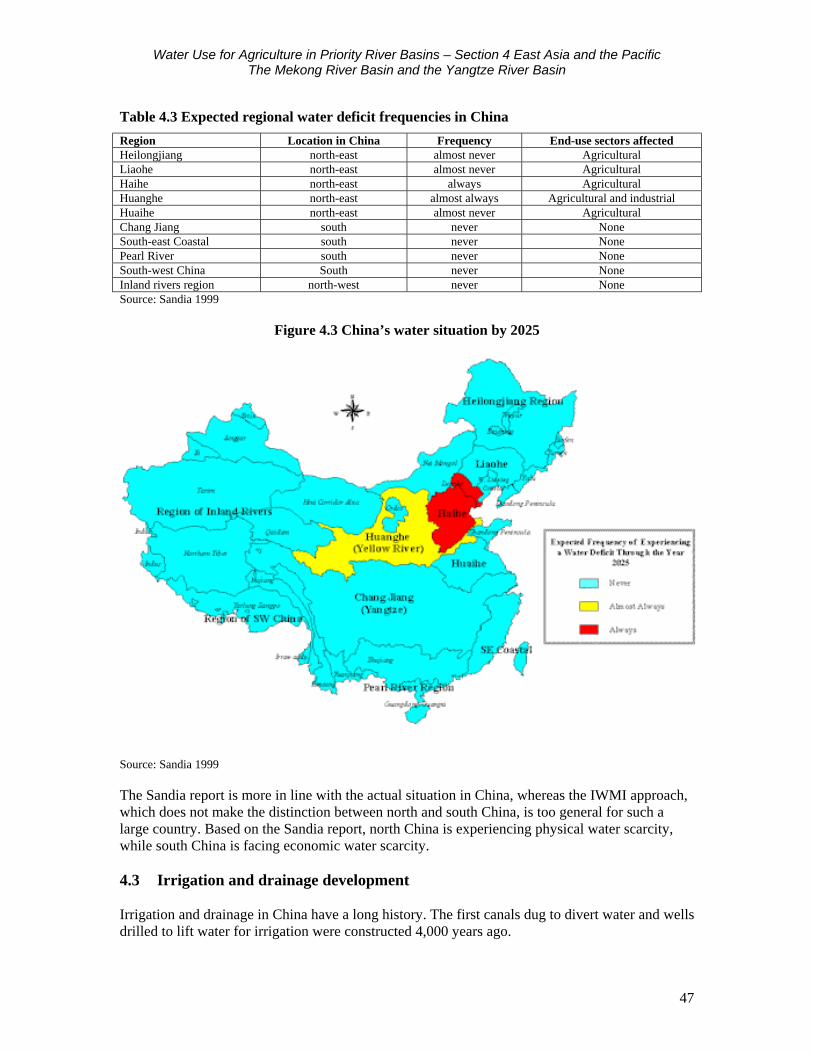
Water Use for Agriculture in Priority River Basins – Section 4 East Asia and the PacificThe Mekong River Basin and the Yangtze River Basin
47
Table 4.3 Expected regional water deficit frequencies in China
Region Location in China Frequency End-use sectors affectedHeilongjiang north-east almost never AgriculturalLiaohe north-east almost never AgriculturalHaihe north-east always AgriculturalHuanghe north-east almost always Agricultural and industrialHuaihe north-east almost never AgriculturalChang Jiang south never NoneSouth-east Coastal south never NonePearl River south never NoneSouth-west China South never NoneInland rivers region north-west never NoneSource: Sandia 1999
Figure 4.3 China’s water situation by 2025
Source: Sandia 1999
The Sandia report is more in line with the actual situation in China, whereas the IWMI approach,which does not make the distinction between north and south China, is too general for such alarge country. Based on the Sandia report, north China is experiencing physical water scarcity,while south China is facing economic water scarcity.
4.3 Irrigation and drainage development
Irrigation and drainage in China have a long history. The first canals dug to divert water and wellsdrilled to lift water for irrigation were constructed 4,000 years ago.
Water Use for Agriculture in Priority River Basins – Section 4 East Asia and the PacificThe Mekong River Basin and the Yangtze River Basin
48
Since the founding of the People’s Republic of China in 1949, irrigation and drainage haveundergone a period of strong development. From 16 million ha of irrigated farmland in 1949, in1990 the figure stood at 43.8 million ha, of which 21.3 million were paddy field, 17.3 millionwere down to grain and 9.3 million ha were devoted to cash crops and vegetables. By 1994, landunder irrigation in mainland China covered in excess of 53.2 million ha, of which 49.9 millionwere irrigated farmland, with orchards covering 1.2 million ha, forests 864,050ha, and pasture770,600ha. Thirty-one per cent of these areas drew water from reservoirs and ponds, 28 per centcame from river diversions, 19 per cent was raised by pumps, 18 per cent came from tube-wells,and 4 per cent from other sources. By 1996, irrigated farmland had grown to 51 million ha.
Three irrigation zones can be distinguished in China:
• Perennial irrigation, where precipitation is less than 400mm and irrigation is required foragriculture. This covers mainly the north-west regions and part of the middle reaches of theHuanghe River.
• The zone in which precipitation ranges from 400–1,000mm, strongly influenced by themonsoon, with a consequently uneven distribution of rainfall. Irrigation is necessary here tosecure production. This zone includes the Hangh Huai Hai plain and north-east China.
• Supplementary irrigation, where annual precipitation exceeds 1,000mm but irrigation is stillnecessary for rice paddies (especially to improve cropping intensity) and supplementaryirrigation is sometimes required for upland crops. This zone covers the middle and lowerreaches of the Yangtze River, the Zhujiang and the Minjiang Rivers and part of south-westChina.
Three categories of irrigation scheme can be distinguished:
• Large irrigation schemes which cover areas over 20,000ha (173 districts covering 8.76million ha)
• Medium-sized schemes which cover areas between 667 and 20,000ha (5,389 irrigationdistricts covering 13.87 million ha)
• Small schemes which cover less than 667ha.
The large and medium schemes are generally administrated by governmental organizations, whilesmall ones are usually farmer-managed, while very small units may be owned by an individualfarmer.
The Ministry of Water Resources estimates that the maximum possible area which might bebrought under irrigation in the first half of the 21st century is around 64 million ha. However, asmuch of this land is located in the arid and semi-arid north of China, a long-term strategy needs tobe formulated in order to provide additional water resources to irrigate these lands. The northernregions of China will experience physical water scarcity according to both the IWMI and Sandiaprojections, so very careful attention has to be paid to this issue. The irrigated area represents 55per cent of the total cultivated area.
Surface irrigation is the main method practised for rice, wheat, millet, vegetables, maize, andcotton and accounts for about 99 per cent of the total irrigated area. The remaining 1 per cent isunder sprinkler and localized irrigation, mainly for fruit trees, vegetables, and tea.
In 1996, the area subject to water logging exceeded 147 million ha, of which 20.28 million hawere controlled through drainage. Saline-alkaline cultivated areas cover 7.73 million ha, of which
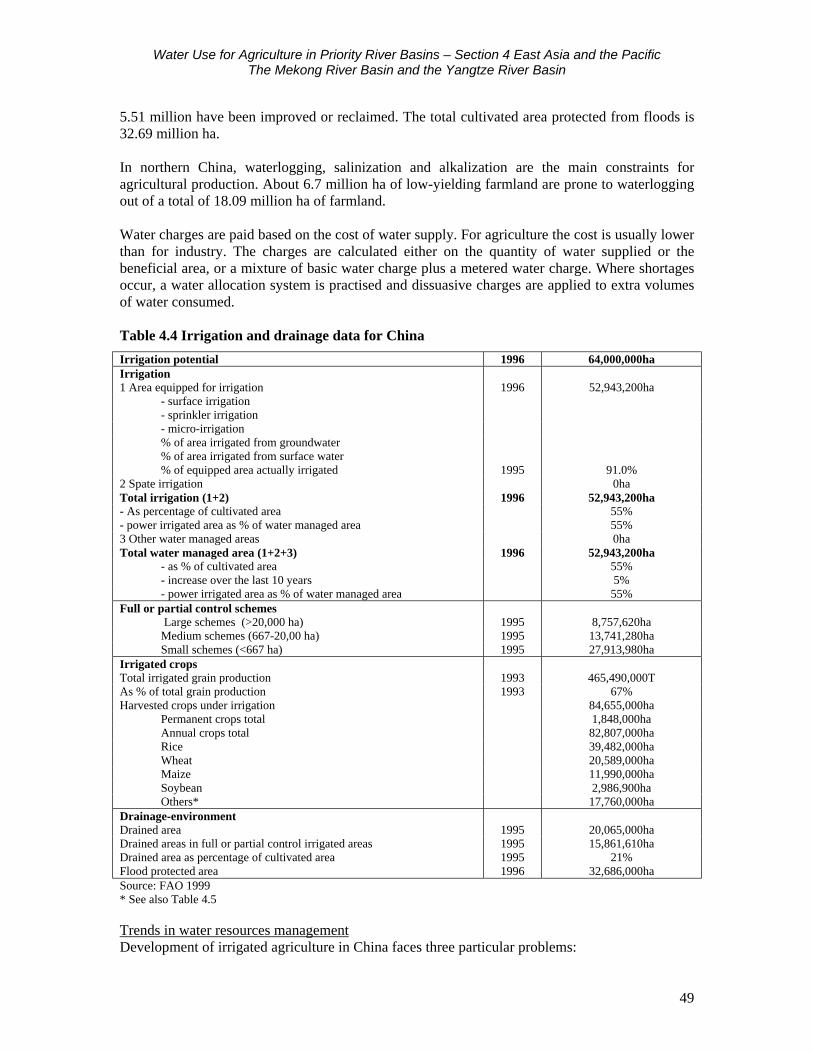
Water Use for Agriculture in Priority River Basins – Section 4 East Asia and the PacificThe Mekong River Basin and the Yangtze River Basin
49
5.51 million have been improved or reclaimed. The total cultivated area protected from floods is32.69 million ha. In northern China, waterlogging, salinization and alkalization are the main constraints foragricultural production. About 6.7 million ha of low-yielding farmland are prone to waterloggingout of a total of 18.09 million ha of farmland.
Water charges are paid based on the cost of water supply. For agriculture the cost is usually lowerthan for industry. The charges are calculated either on the quantity of water supplied or thebeneficial area, or a mixture of basic water charge plus a metered water charge. Where shortagesoccur, a water allocation system is practised and dissuasive charges are applied to extra volumesof water consumed.
Table 4.4 Irrigation and drainage data for China
Irrigation potential 1996 64,000,000haIrrigation1 Area equipped for irrigation 1996 52,943,200ha
- surface irrigation- sprinkler irrigation- micro-irrigation % of area irrigated from groundwater% of area irrigated from surface water% of equipped area actually irrigated 1995 91.0%
2 Spate irrigation 0haTotal irrigation (1+2) 1996 52,943,200ha- As percentage of cultivated area 55%- power irrigated area as % of water managed area 55%3 Other water managed areas 0haTotal water managed area (1+2+3) 1996 52,943,200ha
- as % of cultivated area 55%- increase over the last 10 years 5%- power irrigated area as % of water managed area 55%
Full or partial control schemes Large schemes (>20,000 ha) 1995 8,757,620haMedium schemes (667-20,00 ha) 1995 13,741,280haSmall schemes (<667 ha) 1995 27,913,980ha
Irrigated cropsTotal irrigated grain production 1993 465,490,000TAs % of total grain production 1993 67%Harvested crops under irrigation 84,655,000ha
Permanent crops total 1,848,000haAnnual crops total 82,807,000haRice 39,482,000haWheat 20,589,000haMaize 11,990,000haSoybean 2,986,900haOthers* 17,760,000ha
Drainage-environmentDrained area 1995 20,065,000haDrained areas in full or partial control irrigated areas 1995 15,861,610haDrained area as percentage of cultivated area 1995 21%Flood protected area 1996 32,686,000haSource: FAO 1999* See also Table 4.5
Trends in water resources managementDevelopment of irrigated agriculture in China faces three particular problems:
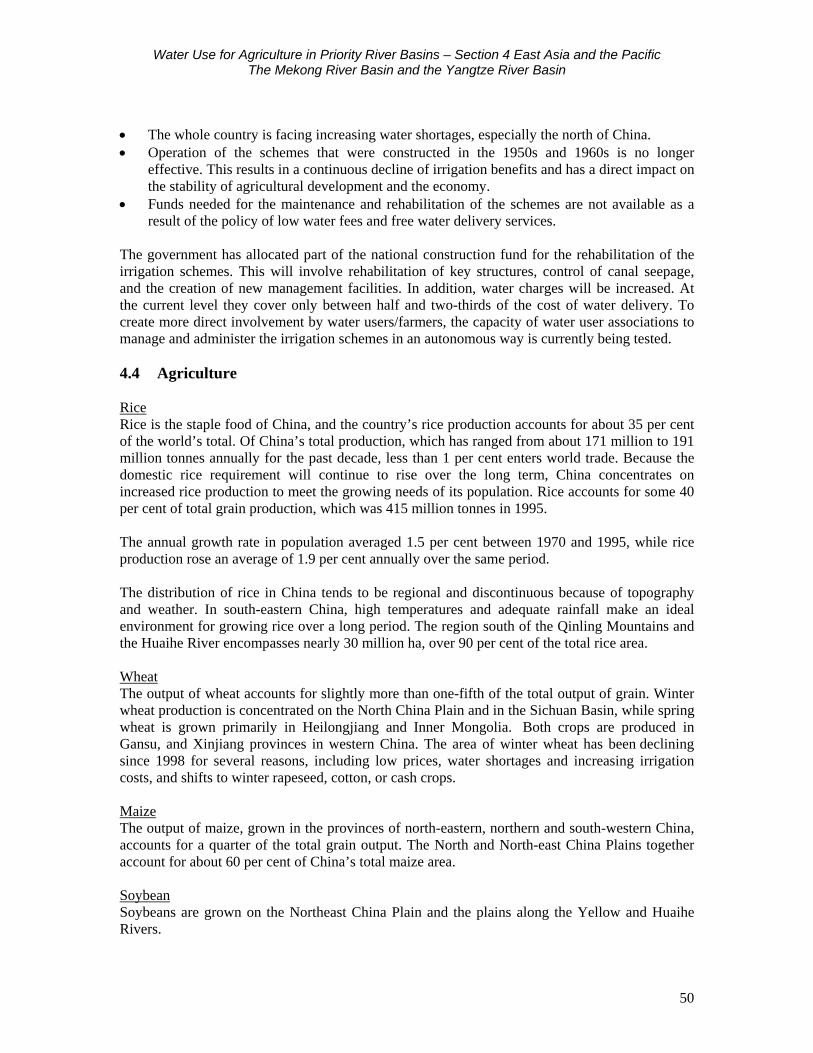
Water Use for Agriculture in Priority River Basins – Section 4 East Asia and the PacificThe Mekong River Basin and the Yangtze River Basin
50
• The whole country is facing increasing water shortages, especially the north of China. • Operation of the schemes that were constructed in the 1950s and 1960s is no longer
effective. This results in a continuous decline of irrigation benefits and has a direct impact onthe stability of agricultural development and the economy.
• Funds needed for the maintenance and rehabilitation of the schemes are not available as aresult of the policy of low water fees and free water delivery services.
The government has allocated part of the national construction fund for the rehabilitation of theirrigation schemes. This will involve rehabilitation of key structures, control of canal seepage,and the creation of new management facilities. In addition, water charges will be increased. Atthe current level they cover only between half and two-thirds of the cost of water delivery. Tocreate more direct involvement by water users/farmers, the capacity of water user associations tomanage and administer the irrigation schemes in an autonomous way is currently being tested. 4.4 Agriculture
RiceRice is the staple food of China, and the country’s rice production accounts for about 35 per centof the world’s total. Of China’s total production, which has ranged from about 171 million to 191million tonnes annually for the past decade, less than 1 per cent enters world trade. Because thedomestic rice requirement will continue to rise over the long term, China concentrates onincreased rice production to meet the growing needs of its population. Rice accounts for some 40per cent of total grain production, which was 415 million tonnes in 1995.
The annual growth rate in population averaged 1.5 per cent between 1970 and 1995, while riceproduction rose an average of 1.9 per cent annually over the same period.
The distribution of rice in China tends to be regional and discontinuous because of topographyand weather. In south-eastern China, high temperatures and adequate rainfall make an idealenvironment for growing rice over a long period. The region south of the Qinling Mountains andthe Huaihe River encompasses nearly 30 million ha, over 90 per cent of the total rice area.
WheatThe output of wheat accounts for slightly more than one-fifth of the total output of grain. Winterwheat production is concentrated on the North China Plain and in the Sichuan Basin, while springwheat is grown primarily in Heilongjiang and Inner Mongolia. Both crops are produced inGansu, and Xinjiang provinces in western China. The area of winter wheat has been decliningsince 1998 for several reasons, including low prices, water shortages and increasing irrigationcosts, and shifts to winter rapeseed, cotton, or cash crops.
MaizeThe output of maize, grown in the provinces of north-eastern, northern and south-western China,accounts for a quarter of the total grain output. The North and North-east China Plains togetheraccount for about 60 per cent of China’s total maize area. SoybeanSoybeans are grown on the Northeast China Plain and the plains along the Yellow and HuaiheRivers.
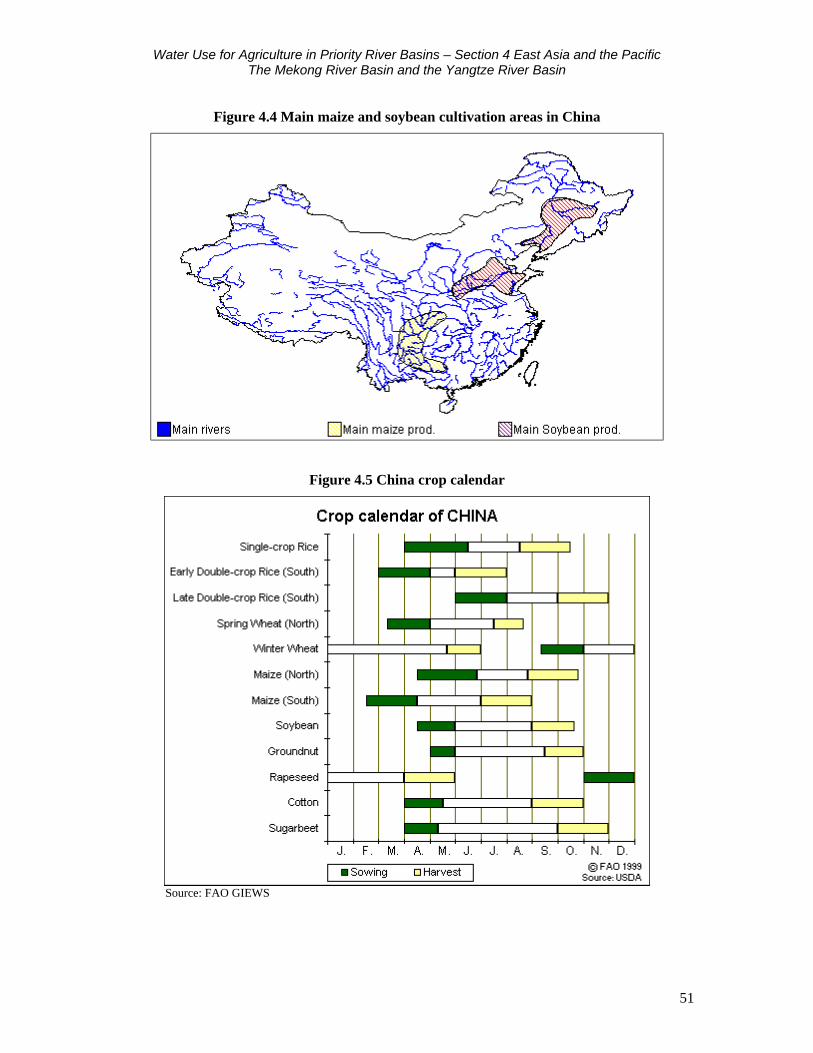
Water Use for Agriculture in Priority River Basins – Section 4 East Asia and the PacificThe Mekong River Basin and the Yangtze River Basin
51
Figure 4.4 Main maize and soybean cultivation areas in China
Figure 4.5 China crop calendar
Source: FAO GIEWS
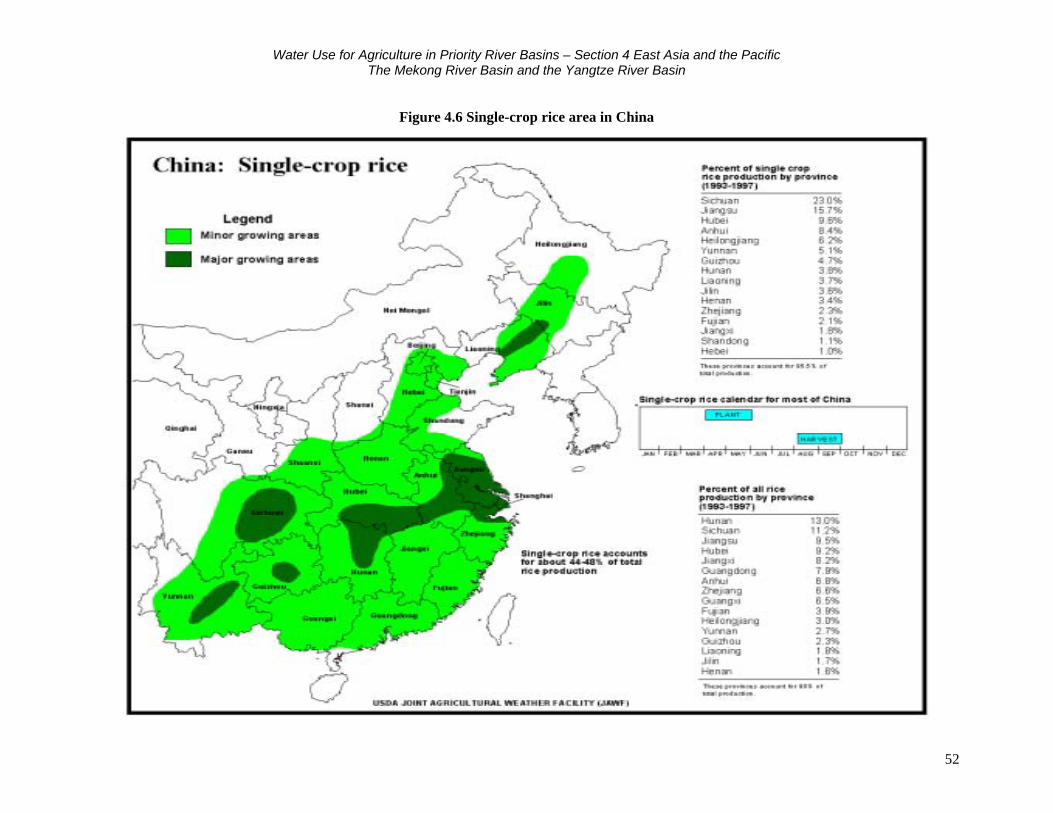
Water Use for Agriculture in Priority River Basins – Section 4 East Asia and the PacificThe Mekong River Basin and the Yangtze River Basin
52
Figure 4.6 Single-crop rice area in China
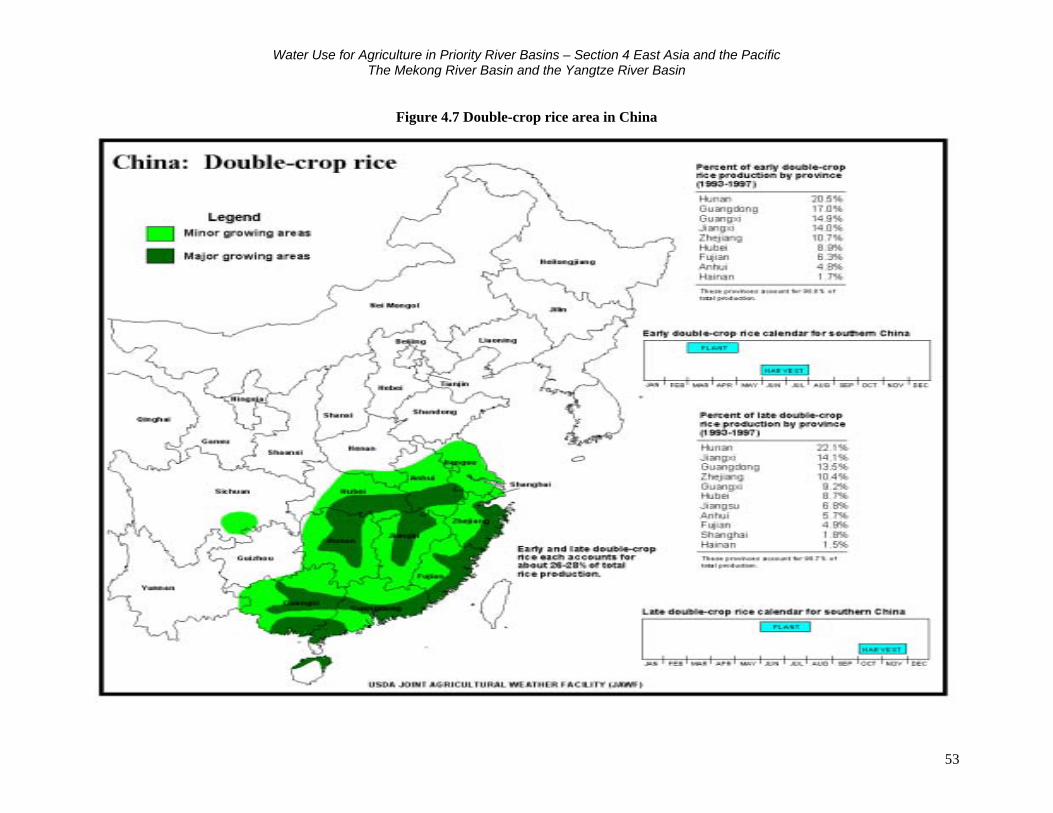
Water Use for Agriculture in Priority River Basins – Section 4 East Asia and the PacificThe Mekong River Basin and the Yangtze River Basin
53
Figure 4.7 Double-crop rice area in China
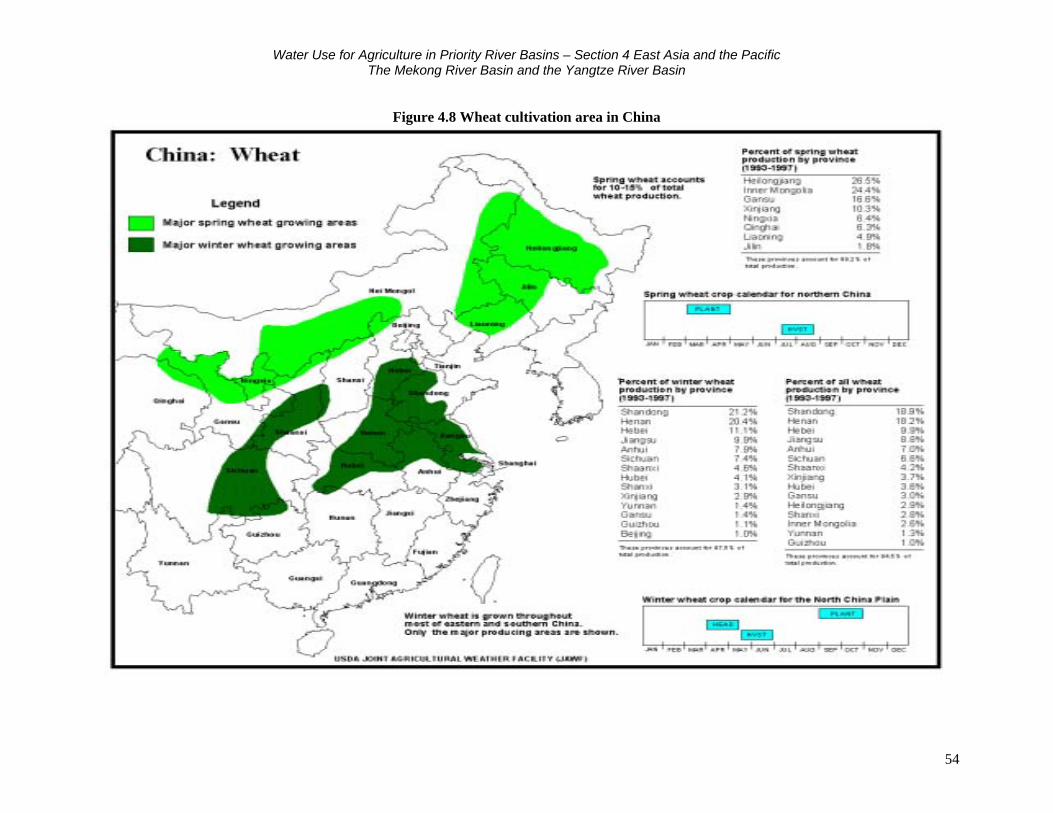
Water Use for Agriculture in Priority River Basins – Section 4 East Asia and the PacificThe Mekong River Basin and the Yangtze River Basin
54
Figure 4.8 Wheat cultivation area in China
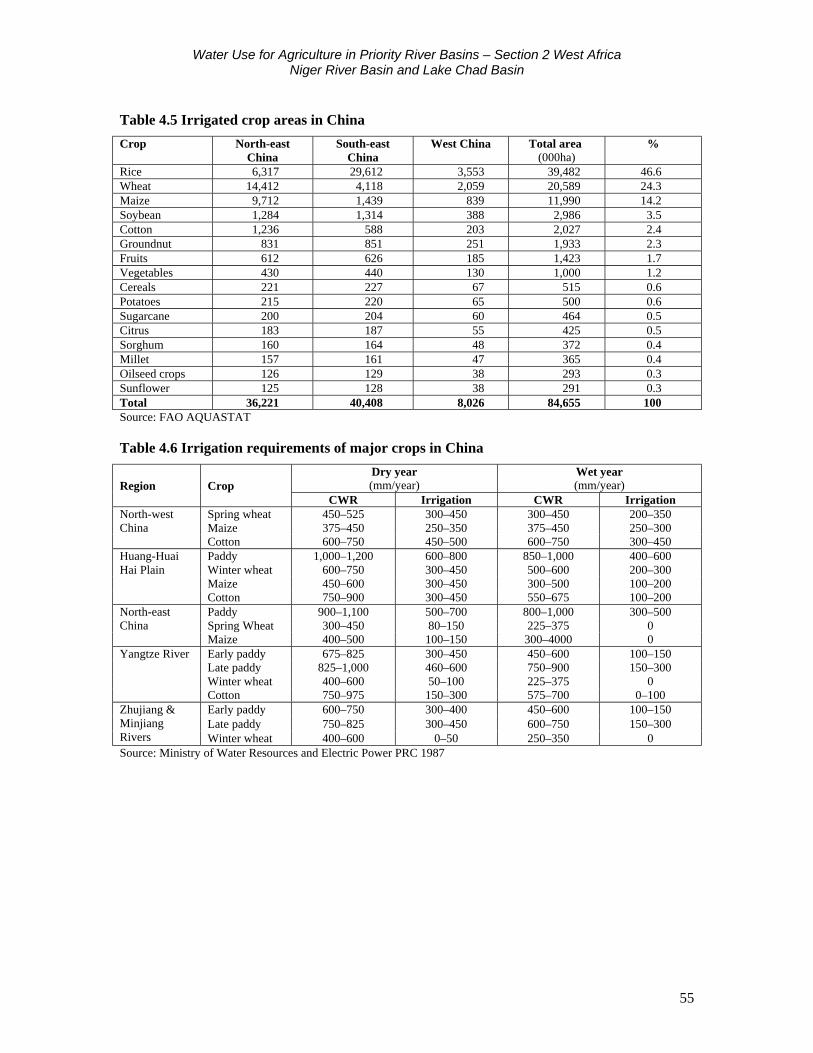
Water Use for Agriculture in Priority River Basins – Section 2 West AfricaNiger River Basin and Lake Chad Basin
55
Table 4.5 Irrigated crop areas in China
Crop North-eastChina
South-eastChina
West China Total area (000ha)
%
Rice 6,317 29,612 3,553 39,482 46.6Wheat 14,412 4,118 2,059 20,589 24.3Maize 9,712 1,439 839 11,990 14.2Soybean 1,284 1,314 388 2,986 3.5Cotton 1,236 588 203 2,027 2.4Groundnut 831 851 251 1,933 2.3Fruits 612 626 185 1,423 1.7Vegetables 430 440 130 1,000 1.2Cereals 221 227 67 515 0.6Potatoes 215 220 65 500 0.6Sugarcane 200 204 60 464 0.5Citrus 183 187 55 425 0.5Sorghum 160 164 48 372 0.4Millet 157 161 47 365 0.4Oilseed crops 126 129 38 293 0.3Sunflower 125 128 38 291 0.3Total 36,221 40,408 8,026 84,655 100Source: FAO AQUASTAT
Table 4.6 Irrigation requirements of major crops in China
Dry year(mm/year)
Wet year(mm/year)Region Crop
CWR Irrigation CWR IrrigationSpring wheat 450–525 300–450 300–450 200–350North-west
China Maize 375–450 250–350 375–450 250–300Cotton 600–750 450–500 600–750 300–450Paddy 1,000–1,200 600–800 850–1,000 400–600Huang-Huai
Hai Plain Winter wheat 600–750 300–450 500–600 200–300Maize 450–600 300–450 300–500 100–200Cotton 750–900 300–450 550–675 100–200Paddy 900–1,100 500–700 800–1,000 300–500North-east
China Spring Wheat 300–450 80–150 225–375 0Maize 400–500 100–150 300–4000 0Early paddy 675–825 300–450 450–600 100–150Late paddy 825–1,000 460–600 750–900 150–300
Yangtze River
Winter wheat 400–600 50–100 225–375 0Cotton 750–975 150–300 575–700 0–100Early paddy 600–750 300–400 450–600 100–150Late paddy 750–825 300–450 600–750 150–300
Zhujiang &MinjiangRivers Winter wheat 400–600 0–50 250–350 0Source: Ministry of Water Resources and Electric Power PRC 1987
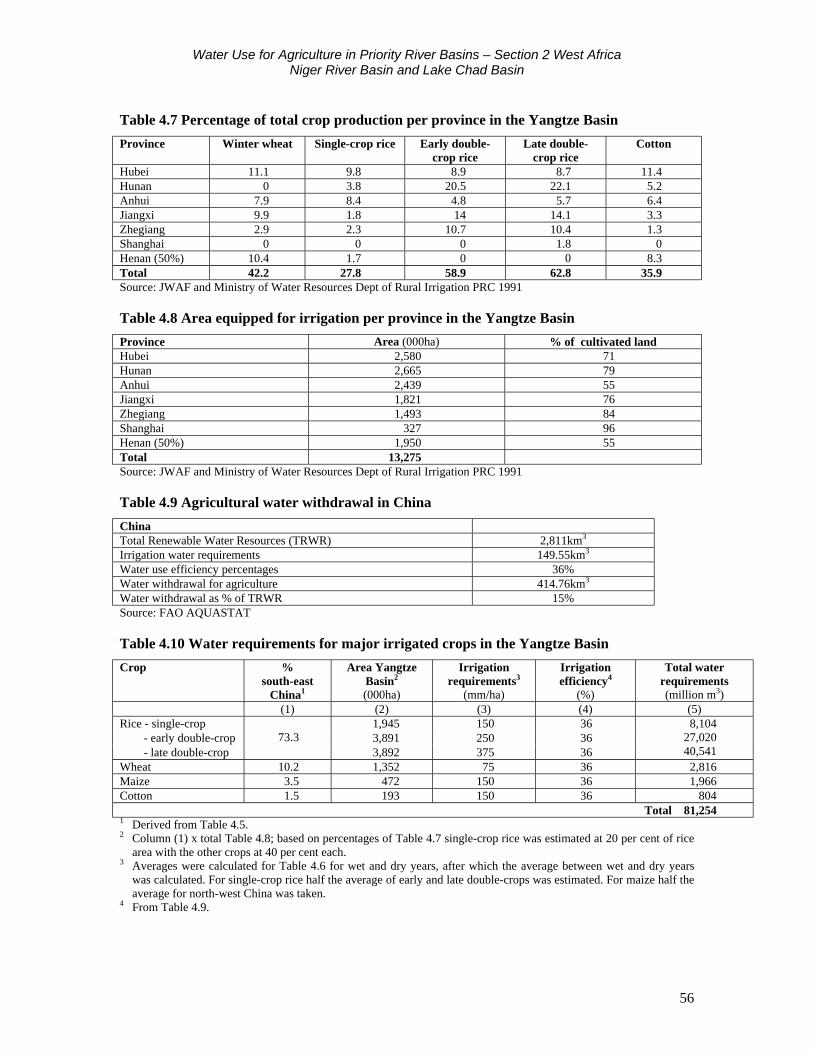
Water Use for Agriculture in Priority River Basins – Section 2 West AfricaNiger River Basin and Lake Chad Basin
56
Table 4.7 Percentage of total crop production per province in the Yangtze Basin
Province Winter wheat Single-crop rice Early double-crop rice
Late double-crop rice
Cotton
Hubei 11.1 9.8 8.9 8.7 11.4Hunan 0 3.8 20.5 22.1 5.2Anhui 7.9 8.4 4.8 5.7 6.4Jiangxi 9.9 1.8 14 14.1 3.3Zhegiang 2.9 2.3 10.7 10.4 1.3Shanghai 0 0 0 1.8 0Henan (50%) 10.4 1.7 0 0 8.3Total 42.2 27.8 58.9 62.8 35.9Source: JWAF and Ministry of Water Resources Dept of Rural Irrigation PRC 1991
Table 4.8 Area equipped for irrigation per province in the Yangtze Basin
Province Area (000ha) % of cultivated landHubei 2,580 71Hunan 2,665 79Anhui 2,439 55Jiangxi 1,821 76Zhegiang 1,493 84Shanghai 327 96Henan (50%) 1,950 55Total 13,275Source: JWAF and Ministry of Water Resources Dept of Rural Irrigation PRC 1991
Table 4.9 Agricultural water withdrawal in China
ChinaTotal Renewable Water Resources (TRWR) 2,811km3
Irrigation water requirements 149.55km3
Water use efficiency percentages 36%Water withdrawal for agriculture 414.76km3
Water withdrawal as % of TRWR 15%Source: FAO AQUASTAT
Table 4.10 Water requirements for major irrigated crops in the Yangtze Basin
Crop %south-east
China1
Area YangtzeBasin2
(000ha)
Irrigationrequirements3
(mm/ha)
Irrigationefficiency4
(%)
Total waterrequirements(million m3)
(1) (2) (3) (4) (5)Rice - single-crop 1,945 150 36 - early double-crop 3,891 250 36 - late double-crop
73.33,892 375 36
8,10427,02040,541
Wheat 10.2 1,352 75 36 2,816Maize 3.5 472 150 36 1,966Cotton 1.5 193 150 36 804
Total 81,2541 Derived from Table 4.5.2 Column (1) x total Table 4.8; based on percentages of Table 4.7 single-crop rice was estimated at 20 per cent of rice
area with the other crops at 40 per cent each.3 Averages were calculated for Table 4.6 for wet and dry years, after which the average between wet and dry years
was calculated. For single-crop rice half the average of early and late double-crops was estimated. For maize half theaverage for north-west China was taken.
4 From Table 4.9.
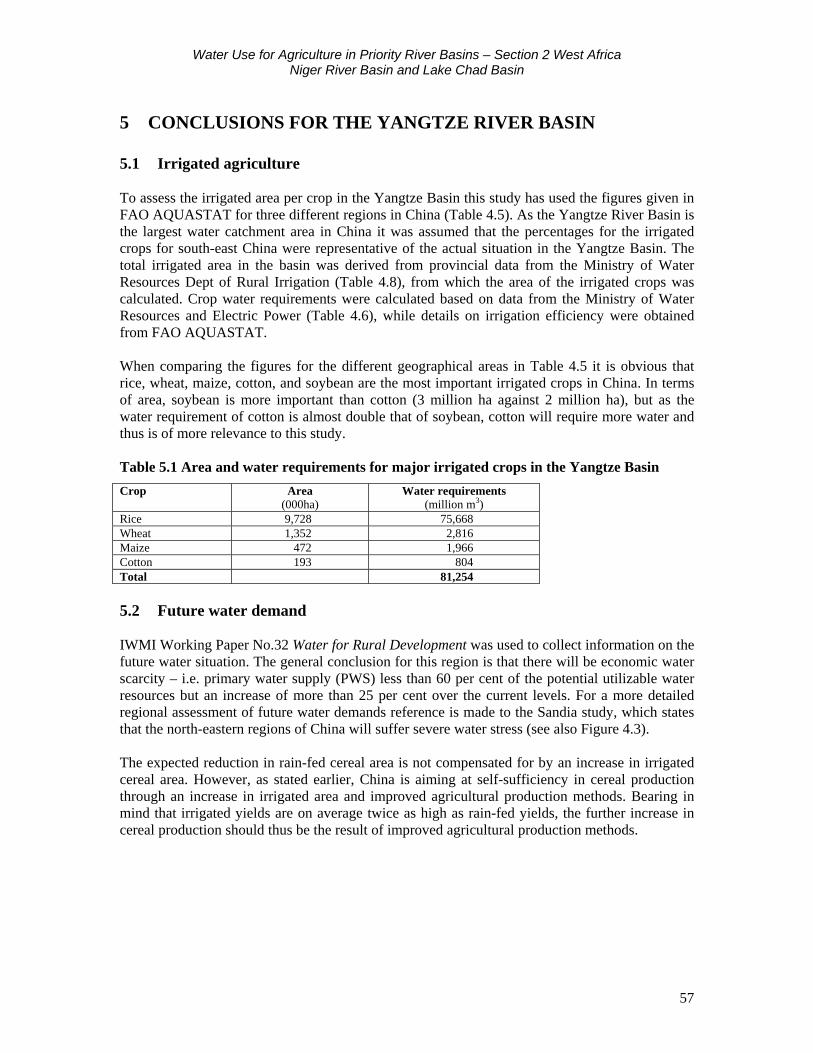
Water Use for Agriculture in Priority River Basins – Section 2 West AfricaNiger River Basin and Lake Chad Basin
57
5 CONCLUSIONS FOR THE YANGTZE RIVER BASIN
5.1 Irrigated agriculture
To assess the irrigated area per crop in the Yangtze Basin this study has used the figures given inFAO AQUASTAT for three different regions in China (Table 4.5). As the Yangtze River Basin isthe largest water catchment area in China it was assumed that the percentages for the irrigatedcrops for south-east China were representative of the actual situation in the Yangtze Basin. Thetotal irrigated area in the basin was derived from provincial data from the Ministry of WaterResources Dept of Rural Irrigation (Table 4.8), from which the area of the irrigated crops wascalculated. Crop water requirements were calculated based on data from the Ministry of WaterResources and Electric Power (Table 4.6), while details on irrigation efficiency were obtainedfrom FAO AQUASTAT.
When comparing the figures for the different geographical areas in Table 4.5 it is obvious thatrice, wheat, maize, cotton, and soybean are the most important irrigated crops in China. In termsof area, soybean is more important than cotton (3 million ha against 2 million ha), but as thewater requirement of cotton is almost double that of soybean, cotton will require more water andthus is of more relevance to this study.
Table 5.1 Area and water requirements for major irrigated crops in the Yangtze Basin
Crop Area(000ha)
Water requirements(million m3)
Rice 9,728 75,668Wheat 1,352 2,816Maize 472 1,966Cotton 193 804Total 81,254
5.2 Future water demand
IWMI Working Paper No.32 Water for Rural Development was used to collect information on thefuture water situation. The general conclusion for this region is that there will be economic waterscarcity – i.e. primary water supply (PWS) less than 60 per cent of the potential utilizable waterresources but an increase of more than 25 per cent over the current levels. For a more detailedregional assessment of future water demands reference is made to the Sandia study, which statesthat the north-eastern regions of China will suffer severe water stress (see also Figure 4.3).
The expected reduction in rain-fed cereal area is not compensated for by an increase in irrigatedcereal area. However, as stated earlier, China is aiming at self-sufficiency in cereal productionthrough an increase in irrigated area and improved agricultural production methods. Bearing inmind that irrigated yields are on average twice as high as rain-fed yields, the further increase incereal production should thus be the result of improved agricultural production methods.
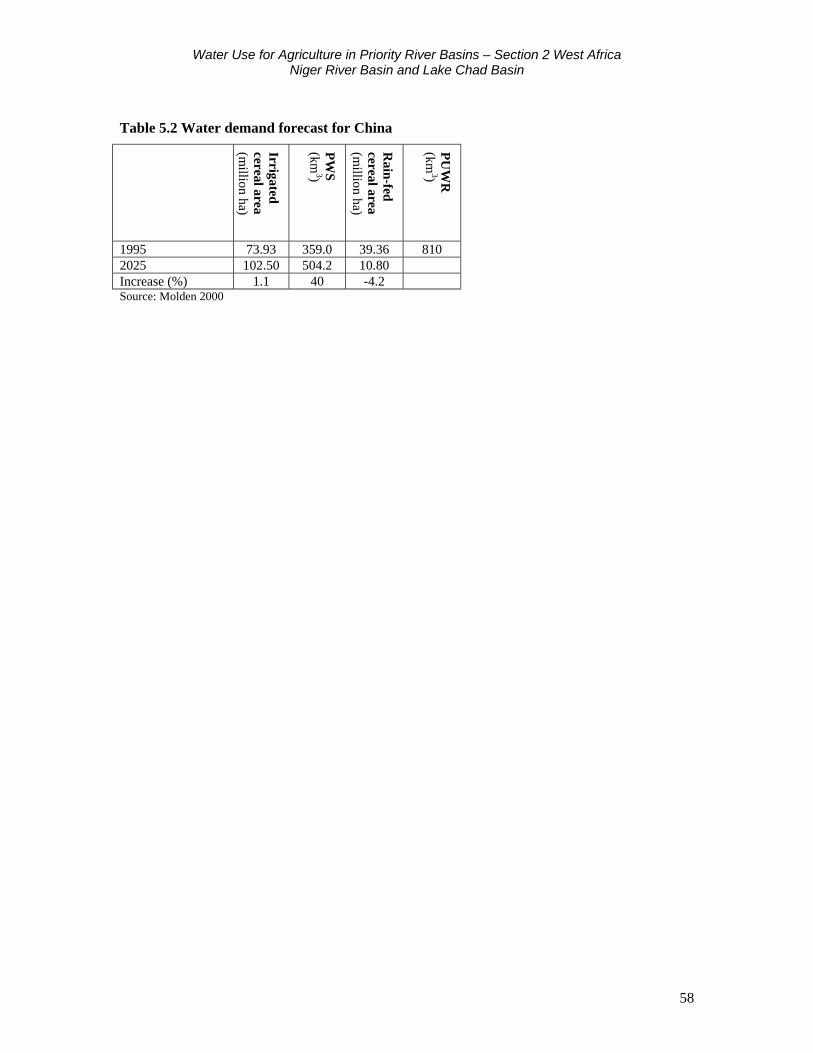
Water Use for Agriculture in Priority River Basins – Section 2 West AfricaNiger River Basin and Lake Chad Basin
58
Table 5.2 Water demand forecast for China
Irrigatedcereal area (m
illion ha)
PW
S
(km3)
Rain-fed
cereal area(m
illion ha)
PU
WR
(km
3)
1995 73.93 359.0 39.36 8102025 102.50 504.2 10.80Increase (%) 1.1 40 -4.2Source: Molden 2000