Embed Size (px)
Citation preview
WATERSHED MODELING IN WATERSHED MODELING IN SOUTHERN CALIFORNIASOUTHERN CALIFORNIA
Kenneth SchiffKenneth Schiff
Southern California Coastal Water Research ProjectSouthern California Coastal Water Research Project
www.sccwrp.orgwww.sccwrp.org
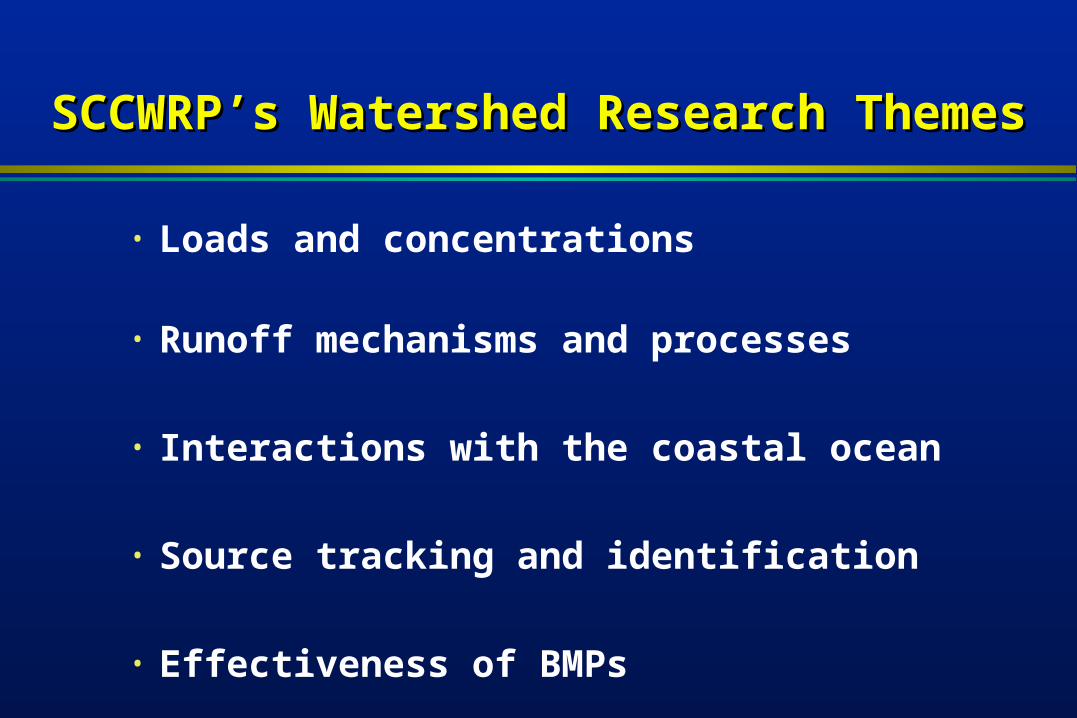
SCCWRP’s Watershed Research ThemesSCCWRP’s Watershed Research Themes
• Loads and concentrations
• Runoff mechanisms and processes
• Interactions with the coastal ocean
• Source tracking and identification
• Effectiveness of BMPs
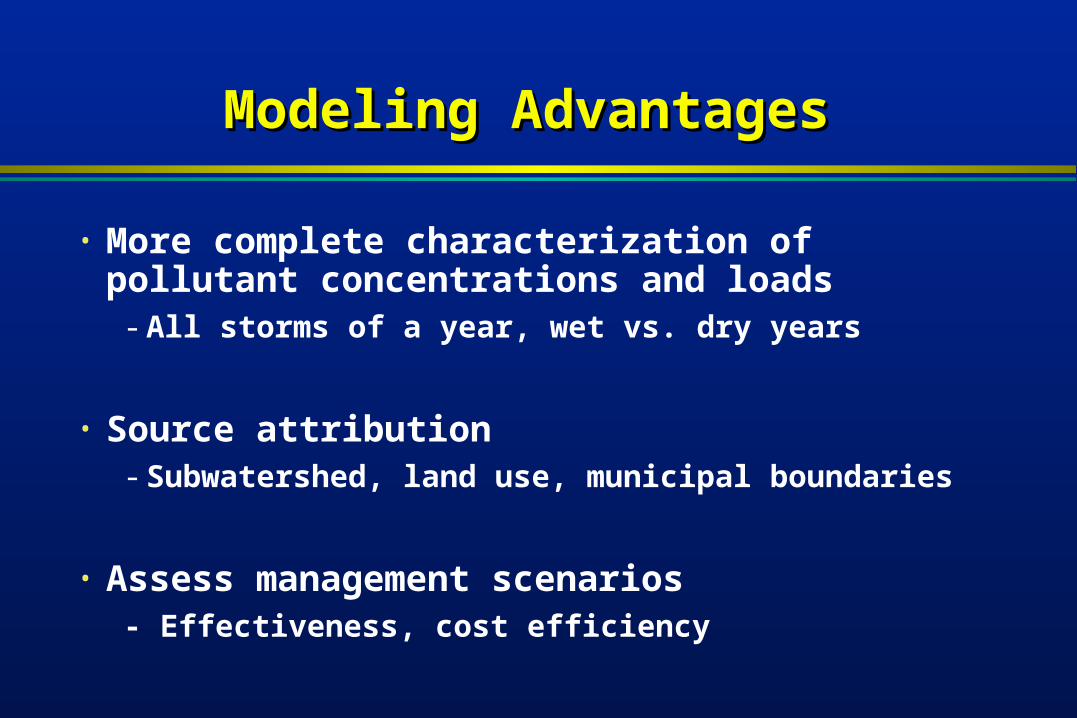
Modeling AdvantagesModeling Advantages
• More complete characterization of pollutant concentrations and loads
- All storms of a year, wet vs. dry years
• Source attribution- Subwatershed, land use, municipal boundaries
• Assess management scenarios- Effectiveness, cost efficiency
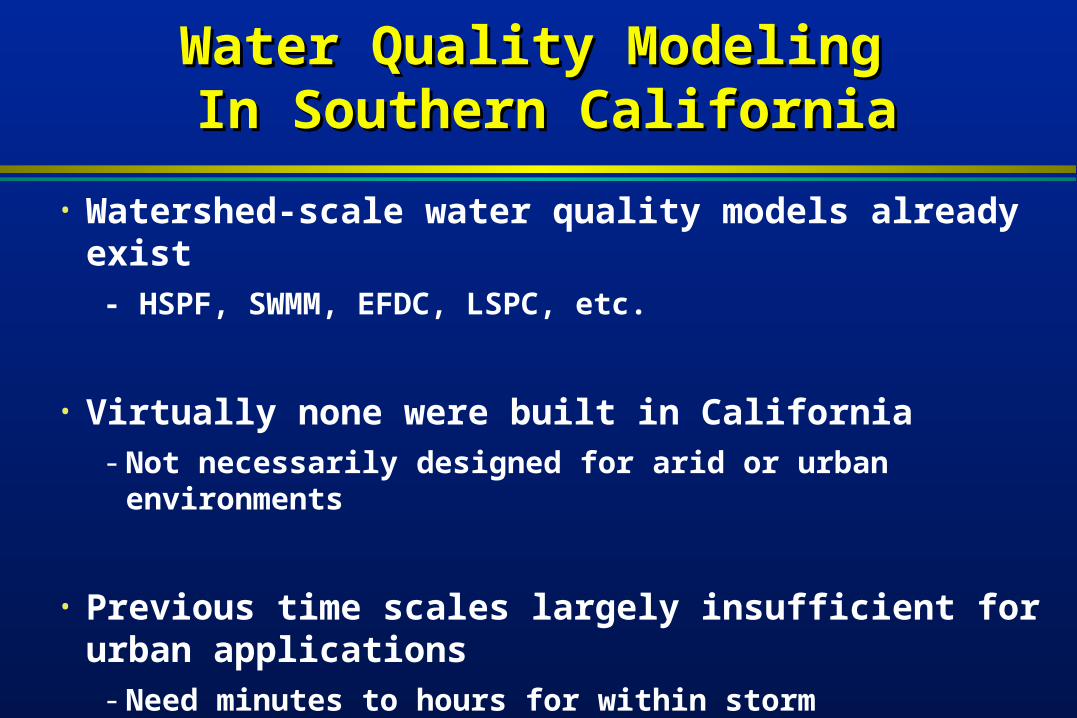
Water Quality Modeling Water Quality Modeling In Southern CaliforniaIn Southern California
• Watershed-scale water quality models already exist- HSPF, SWMM, EFDC, LSPC, etc.
• Virtually none were built in California- Not necessarily designed for arid or urban environments
• Previous time scales largely insufficient for urban applications
- Need minutes to hours for within storm applications
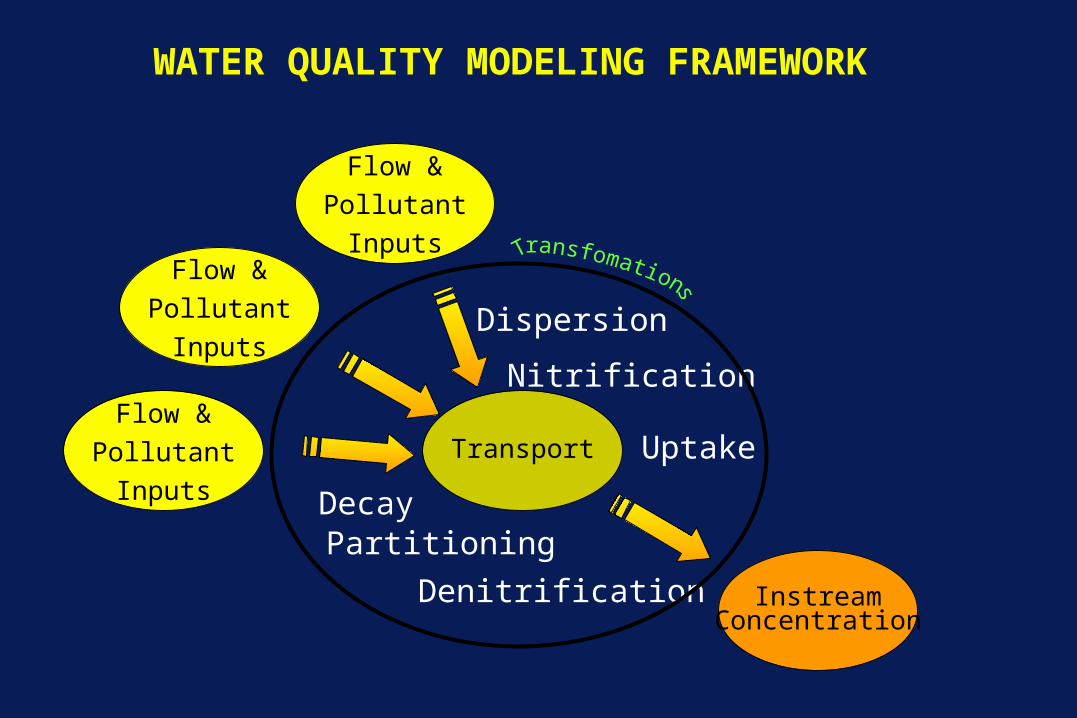
WATER QUALITY MODELING FRAMEWORK
Flow &
Pollutant
Inputs
Transport
InstreamConcentration
Nitrification
Denitrification
Decay
Uptake
Dispersion
Flow &
Pollutant
Inputs
Flow &
Pollutant
Inputs
Partitioning
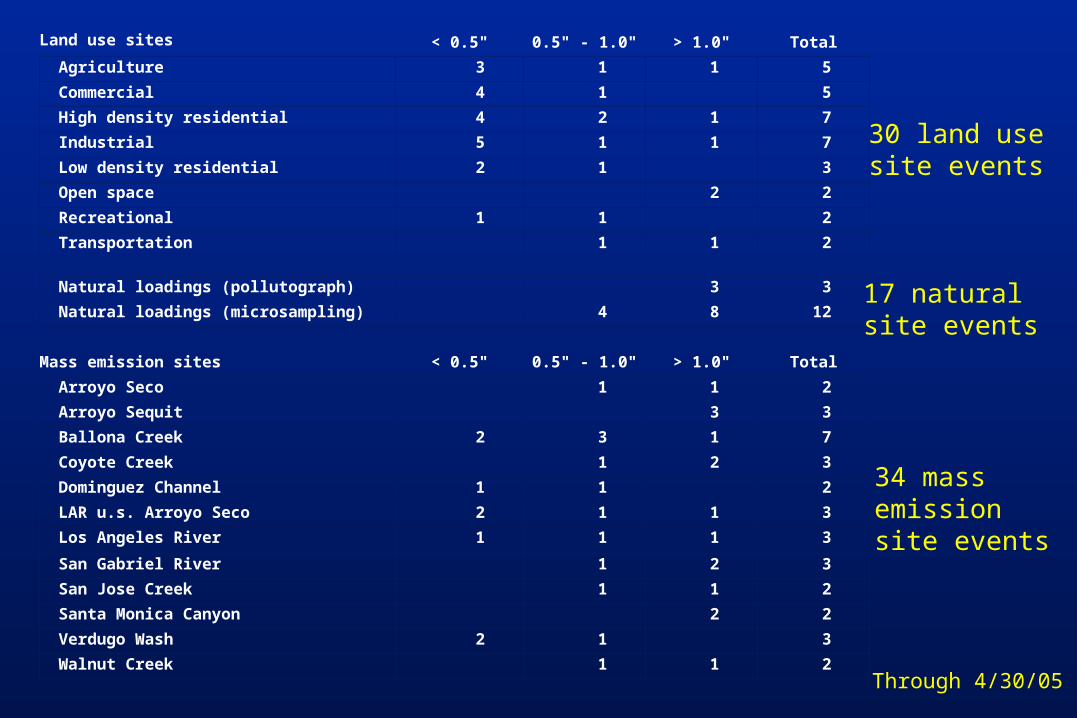
Land use sites < 0.5" 0.5" - 1.0" > 1.0" Total
Agriculture 3 1 1 5
Commercial 4 1 5
High density residential 4 2 1 7
Industrial 5 1 1 7
Low density residential 2 1 3
Open space 2 2
Recreational 1 1 2
Transportation 1 1 2
Natural loadings (pollutograph) 3 3
Natural loadings (microsampling) 4 8 12
Mass emission sites < 0.5" 0.5" - 1.0" > 1.0" Total
Arroyo Seco 1 1 2
Arroyo Sequit 3 3
Ballona Creek 2 3 1 7
Coyote Creek 1 2 3
Dominguez Channel 1 1 2
LAR u.s. Arroyo Seco 2 1 1 3
Los Angeles River 1 1 1 3
San Gabriel River 1 2 3
San Jose Creek 1 1 2
Santa Monica Canyon 2 2
Verdugo Wash 2 1 3
Walnut Creek 1 1 2
30 land usesite events
17 naturalsite events
34 mass emissionsite events
Through 4/30/05
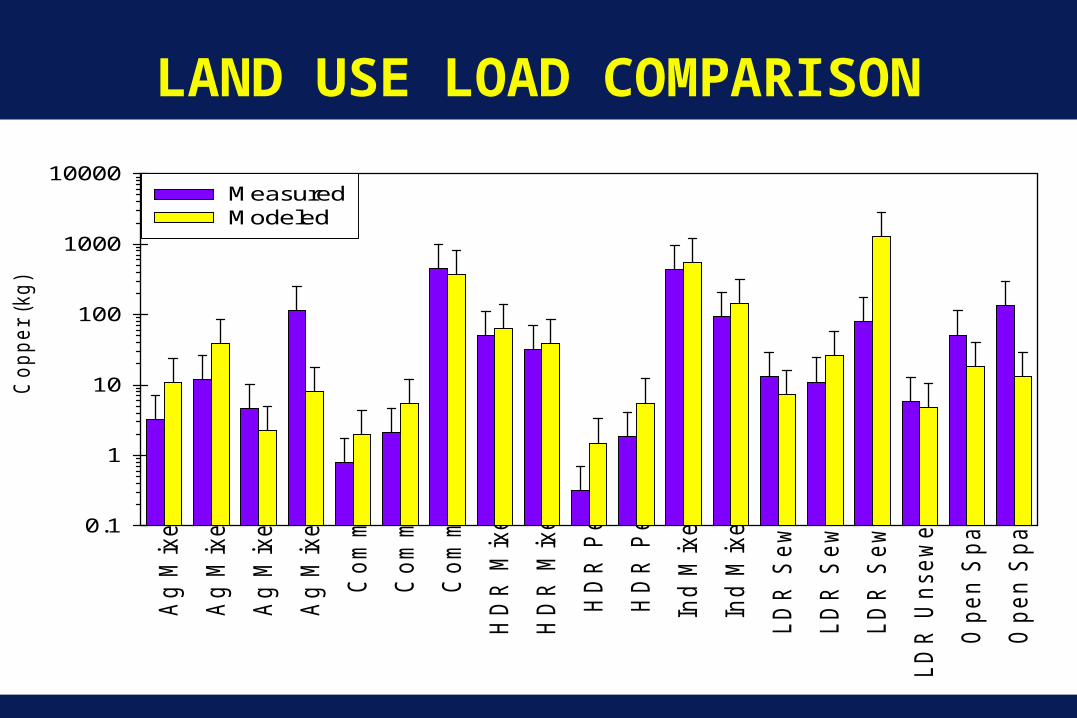
LAND USE LOAD COMPARISON
Ag
Mix
ed
Ag
Mix
ed
Ag
Mix
ed
Ag
Mix
ed
Co
mm
Co
mm
Co
mm
HD
R M
ixe
d
HD
R M
ixe
d
HD
R P
et
HD
R P
et
Ind
Mix
ed
Ind
Mix
ed
LD
R S
ew
er
LD
R S
ew
er
LD
R S
ew
er
LD
R U
nse
we
red
Op
en
Sp
ace
Op
en
Sp
ace
Co
pp
er
(kg)
0.1
1
10
100
1000
10000MeasuredModeled
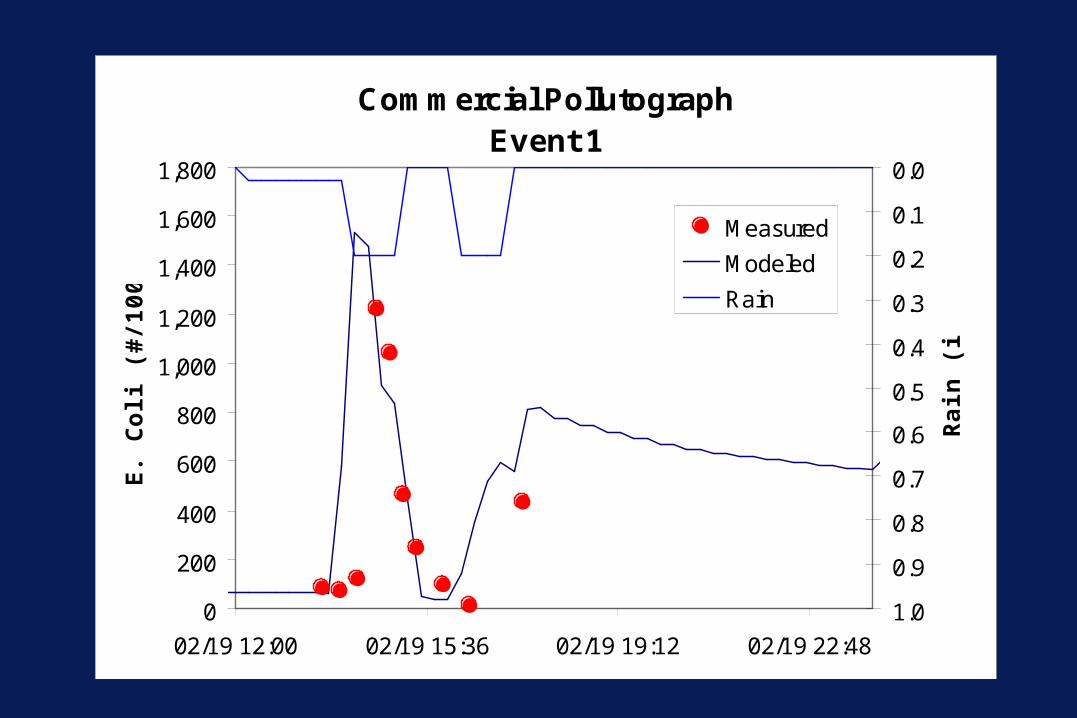
Commercial PollutographEvent 1
0
200
400
600
800
1,000
1,200
1,400
1,600
1,800
02/19 12:00 02/19 15:36 02/19 19:12 02/19 22:48
E. C
oli
(#/1
00
mL
)
0.0
0.1
0.2
0.3
0.4
0.5
0.6
0.7
0.8
0.9
1.0
Ra
in (
in)
Measured
Modeled
Rain

100
1,000
10,000
100,000
1,000,000
10,000,000
0.00 0.01 0.01 0.03 0.04 0.09 0.13 0.20 0.30 0.48 0.62 0.74 1.05 1.61 2.65
Storm Rain (in)
Sto
rm L
oad
(g
ram
s)
Hardness = 100 mg/LCTR = 13.4 ug/L
Copper Loading From Ballona Creek (1990-2000)

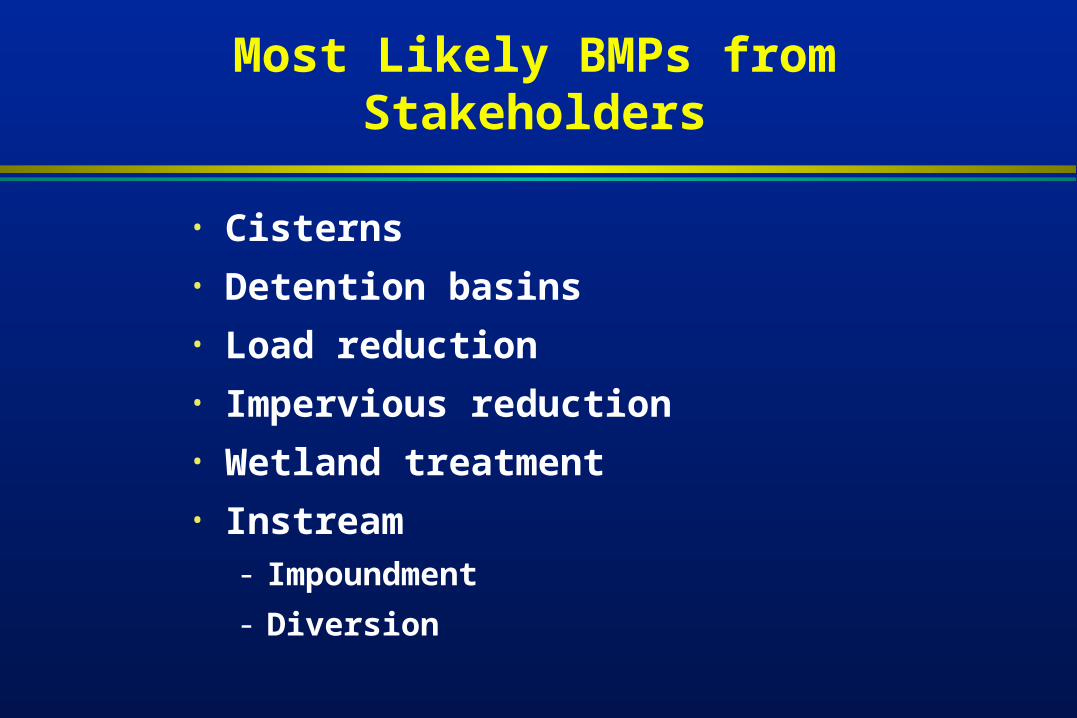
Most Likely BMPs from Stakeholders
• Cisterns
• Detention basins
• Load reduction
• Impervious reduction
• Wetland treatment
• Instream- Impoundment
- Diversion
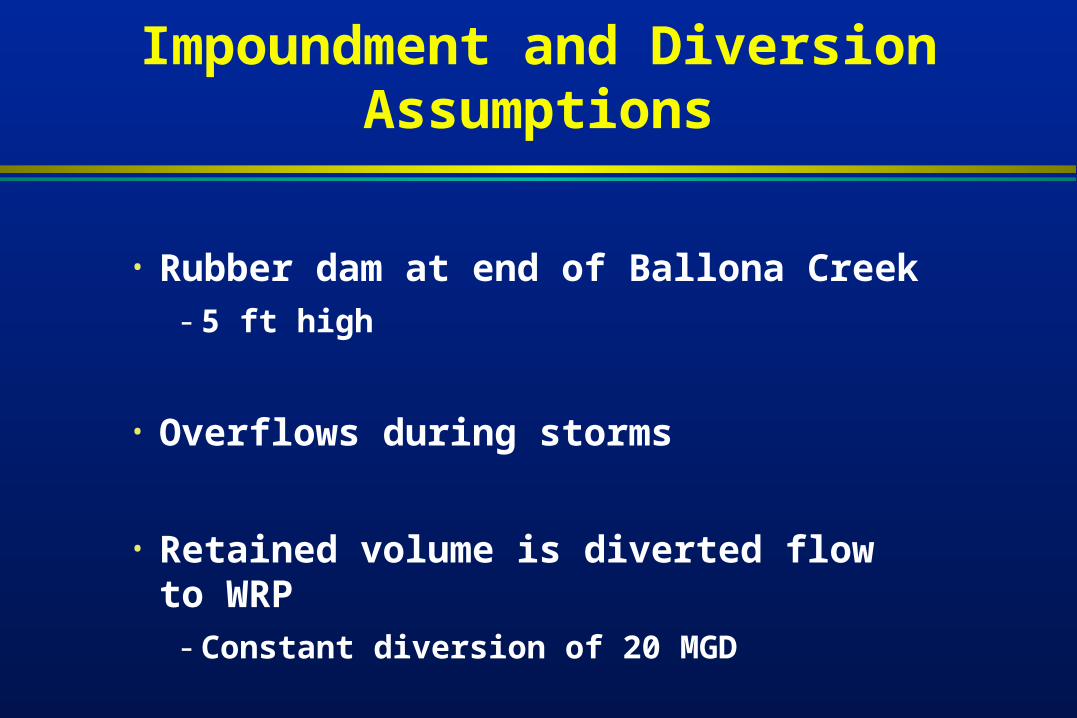
Impoundment and Diversion Assumptions
• Rubber dam at end of Ballona Creek- 5 ft high
• Overflows during storms
• Retained volume is diverted flow to WRP- Constant diversion of 20 MGD

Rubberdam
To WRPhttp://www.salinasvalleywatercoalition.org/images/rubberdam.jpg
http://ca.water.usgs.gov/user_projects/sonoma/pics/rubberdam.jpg
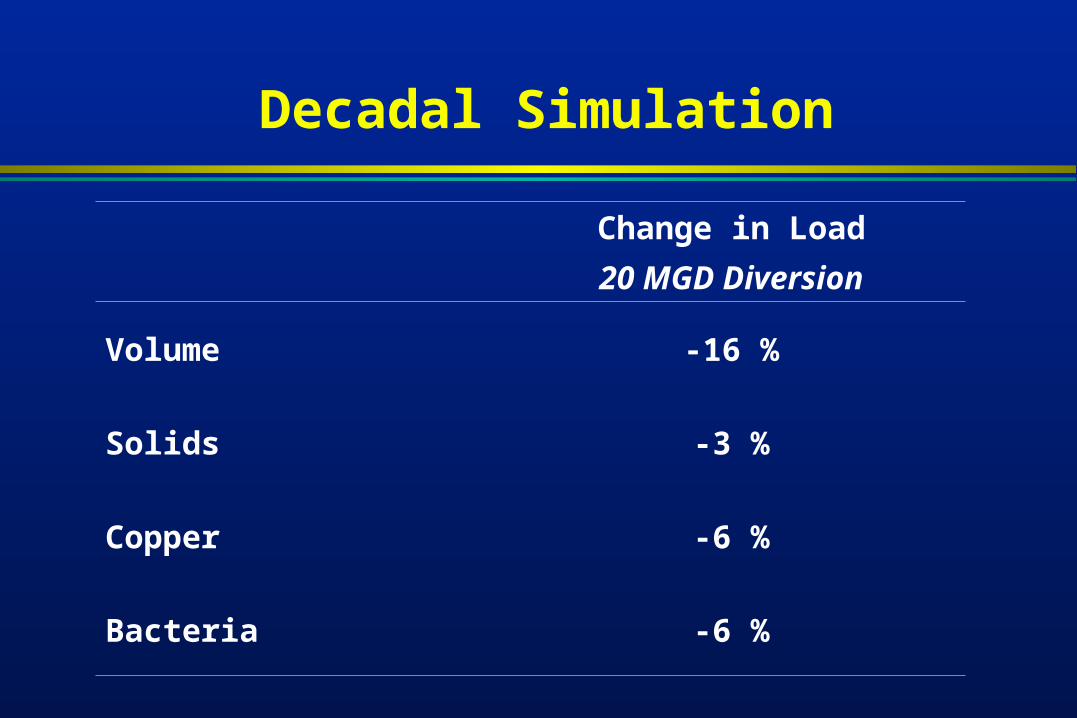
Decadal Simulation
Change in Load
20 MGD Diversion
Volume -16 %
Solids -3 %
Copper -6 %
Bacteria -6 %
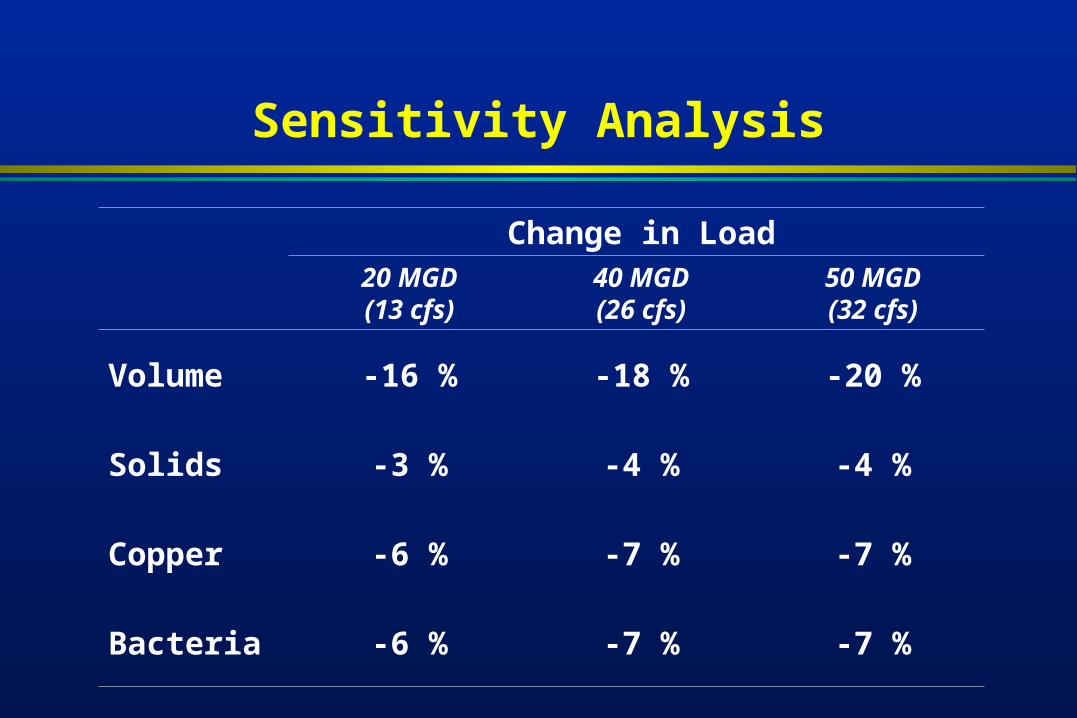
Sensitivity Analysis
Change in Load20 MGD(13 cfs)
40 MGD(26 cfs)
50 MGD(32 cfs)
Volume -16 % -18 % -20 %
Solids -3 % -4 % -4 %
Copper -6 % -7 % -7 %
Bacteria -6 % -7 % -7 %
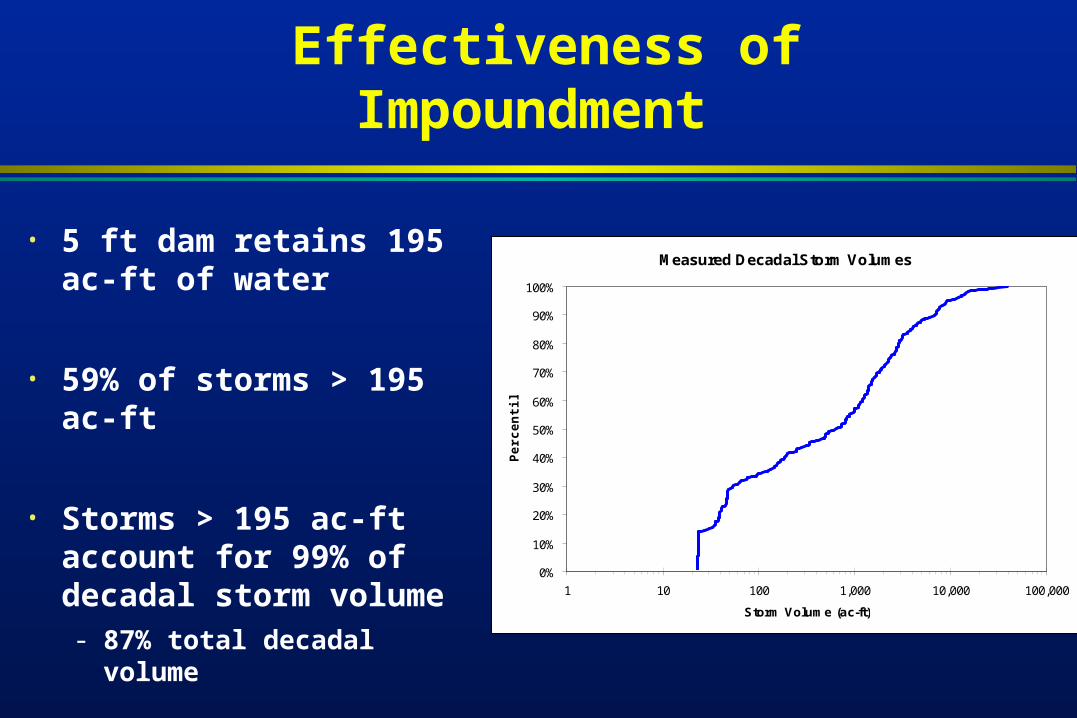
Effectiveness of Impoundment
• 5 ft dam retains 195 ac-ft of water
• 59% of storms > 195 ac-ft
• Storms > 195 ac-ft account for 99% of decadal storm volume- 87% total decadal volume
Measured Decadal Storm Volumes
0%
10%
20%
30%
40%
50%
60%
70%
80%
90%
100%
1 10 100 1,000 10,000 100,000
Storm Volume (ac-ft)
Per
cen
tile
Most Likely BMPs from Stakeholders
• Cisterns
• Detention basins
• Load reduction
• Impervious reduction
• Wetland treatment
• Instream- Impoundment
- Diversion
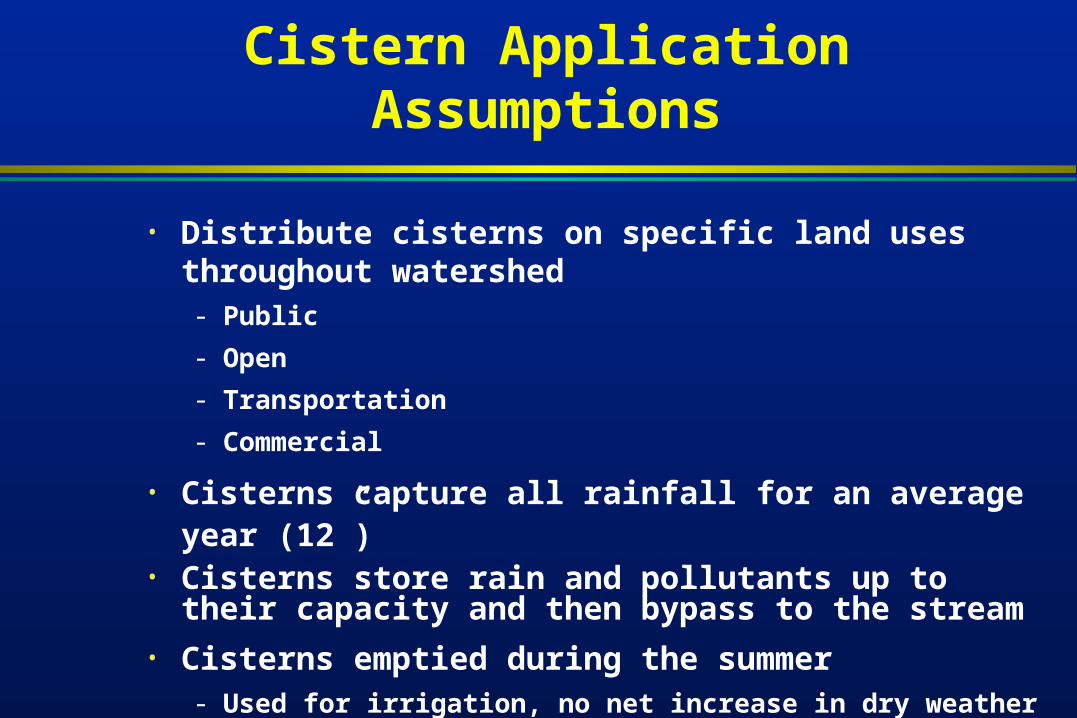
• Distribute cisterns on specific land uses throughout watershed- Public
- Open
- Transportation
- Commercial
• Cisterns capture all rainfall for an average year (12”)• Cisterns store rain and pollutants up to their capacity
and then bypass to the stream
• Cisterns emptied during the summer- Used for irrigation, no net increase in dry weather runoff
Cistern Application Assumptions
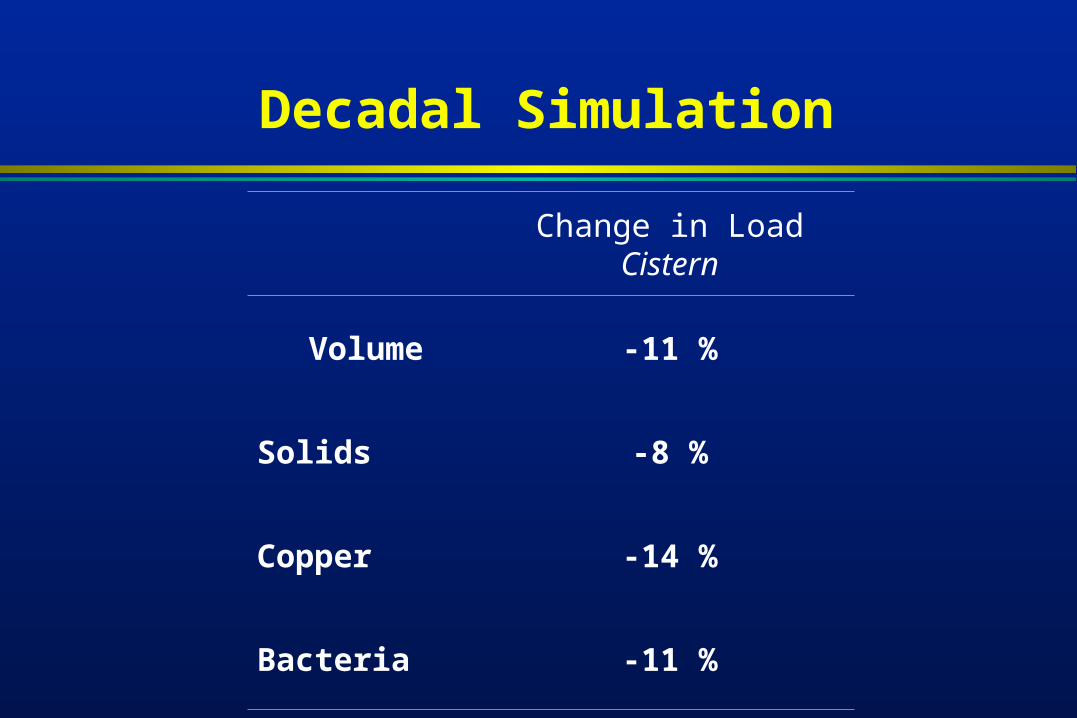
Decadal Simulation
Change in LoadCistern
Volume -11 %
Solids -8 %
Copper -14 %
Bacteria -11 %
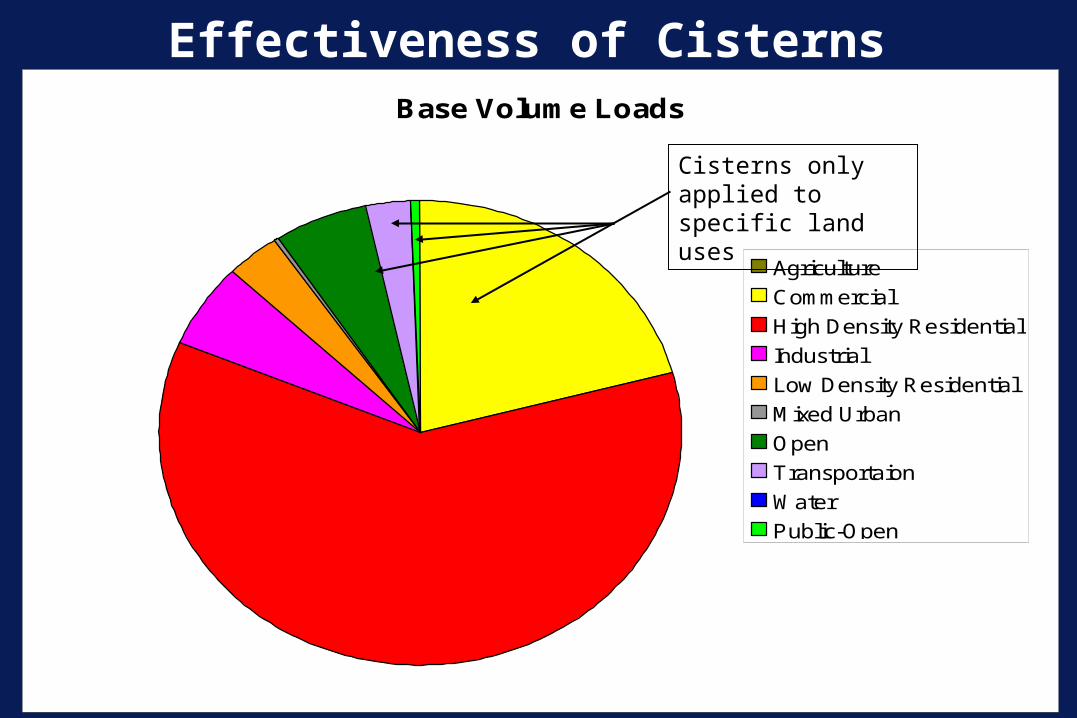
Base Volume Loads
Agriculture
Commercial
High Density Residential
Industrial
Low Density Residential
Mixed Urban
Open
Transportaion
Water
Public-Open
Cisterns only applied to specific land uses
Effectiveness of Cisterns
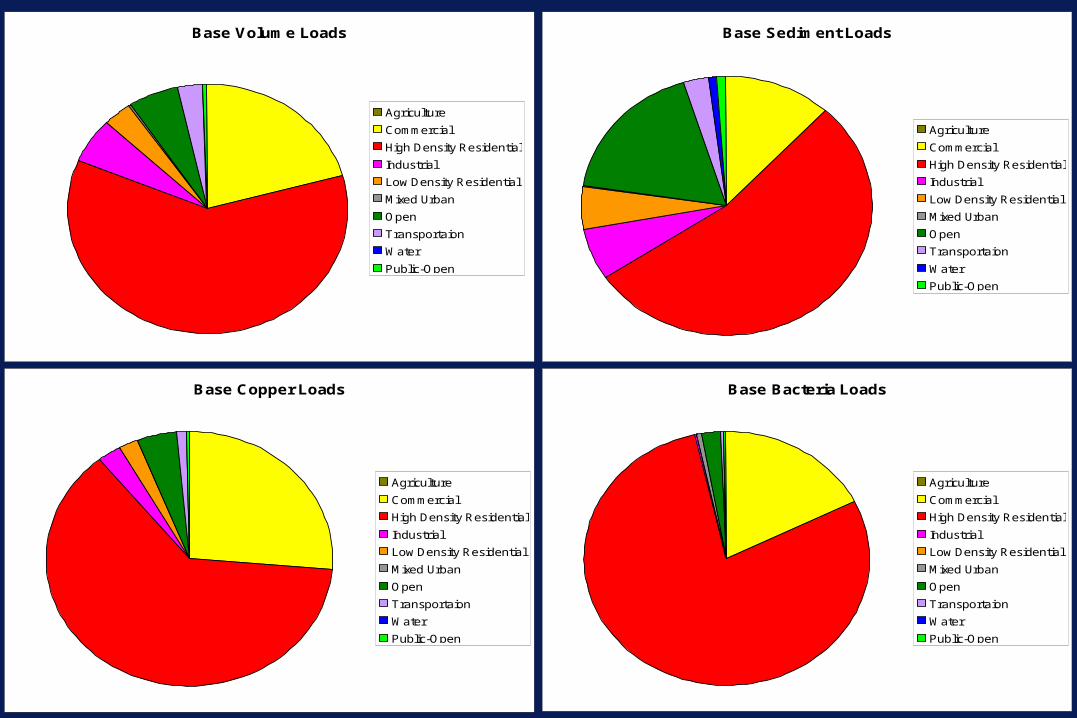
Base Volume Loads
Agriculture
Commercial
High Density Residential
Industrial
Low Density Residential
Mixed Urban
Open
Transportaion
Water
Public-Open
Base Sediment Loads
Agriculture
Commercial
High Density Residential
Industrial
Low Density Residential
Mixed Urban
Open
Transportaion
Water
Public-Open
Base Copper Loads
Agriculture
Commercial
High Density Residential
Industrial
Low Density Residential
Mixed Urban
Open
Transportaion
Water
Public-Open
Base Bacteria Loads
Agriculture
Commercial
High Density Residential
Industrial
Low Density Residential
Mixed Urban
Open
Transportaion
Water
Public-Open
SummarySummary
• Watershed models are a powerful management tool- Extrapolate to unmonitored times/locations
• Requires effort to ensure you believe them - Calibration and validation
- Wet and dry weather
• Provides invaluable insight into evaluating management action effectiveness
- Cost efficiency
Soon To Be ReleasedSoon To Be Released
• More detailed and involved BMPs
• Design storm for water quality - Function of hydrology
- Function of BMP cost
• Linked estuarine models- Contaminated sediments
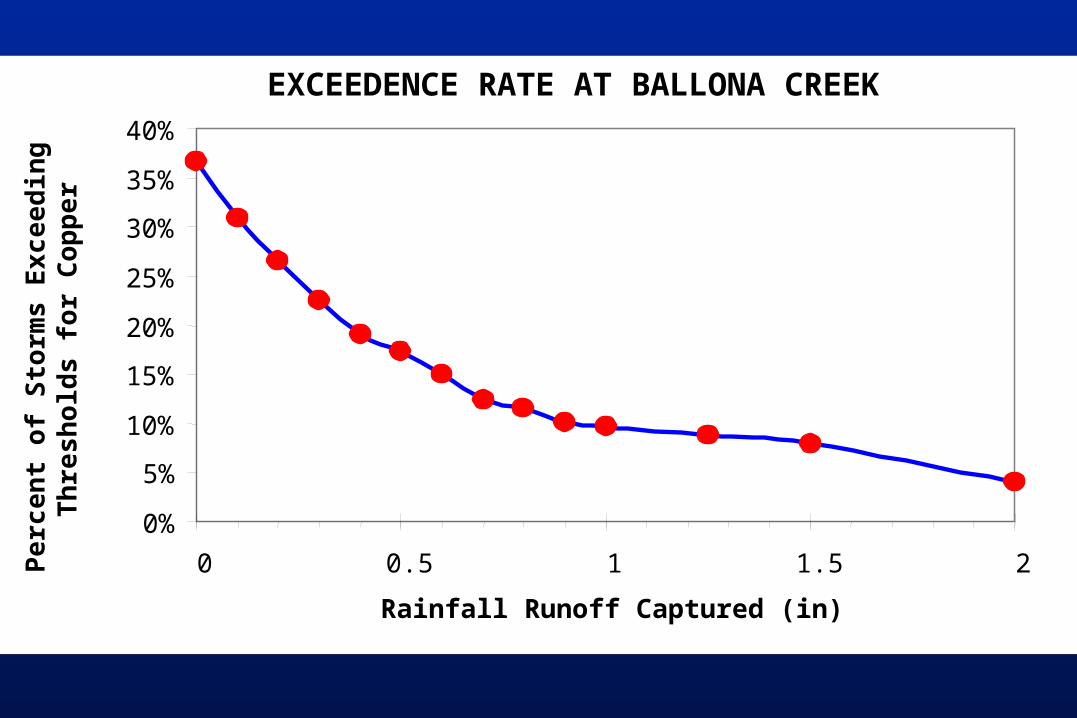
EXCEEDENCE RATE AT BALLONA CREEK
0%
5%
10%
15%
20%
25%
30%
35%
40%
0 0.5 1 1.5 2
Rainfall Runoff Captured (in)
Pe
rce
nt
of
Sto
rms
Ex
cee
din
g
Th
res
ho
lds
fo
r C
op
pe
r