Embed Size (px)
Citation preview

F o r e s t a n d r a n g e e va l u at i o n P r o g r a m
sustainability of Forest and range resources through science and stewardship
r e P o r t # 3 9
april 2015
Watershed status evaluation: an assessment oF 71 Watersheds meeting BC’s Fisheries sensitive Watershed CriteriaPrepared by: Marc Porter, Simon Casley, nick Ochoski, and Sam Huang
april 2015
Dala River on the north coast, photo by Lars Reese-Hansen

M i n i s t r y o f f o r e s t s , M i n e s a n d l a n d s f o r e s t a n d r a n g e e va l u at i o n P r o g r a M
Watershed status evaluation: an assessment of 71 Watersheds meeting BC’s fisheries sensitive Watershed CriteriaPrepared by: Marc Porter, Simon Casley, Nick Ochoski, and Sam Huang
April 2015

The use of trade, firm, or corporation names in this publication is for the information and convenience of the reader. Such use does not constitute an official endorsement or approval by the Government of British Columbia of any product or service to the exclusion of any others that may also be suitable. Contents of this report are presented for discussion purposes only. Funding assistance does not imply endorsement of any statements or information contained herein by the Government of British Columbia.
Management of forest and range resources is a complex process that often involves the balancing of ecological, social, and economic considerations. This evaluation report represents one facet of this process.
Citation: M. Porter, S. Casley, N. Ochoski, and S. Huang. 2015. Watershed Status Evaluation: An Assessment of 71 Watersheds Meeting BC's Fisheries Sensitive Watershed Criteria. Victoria BC FREP Report 39. http://www.for.gov.bc.ca/hfp/frep/publications/index.htm
Prepared by: Marc Porter, Simon Casley, Nick Ochoski, and Sam Huang
For more information on Forest Practices Branch publications, visit our web site at: http://www.for.gov.bc.ca/hfp/meta/publications.htm
© 2015 Province of British Columbia

iv Northern Interior Forest Region: Analysis Of Stand-Level Biodiversity Sampling Results In Six Predominant Biogeoclimatic Subzones
R E P O R T # 3 9
aCknoWledgements
We would like to thank Lars Reese-Hansen, Richard Thompson, Derek Tripp, Peter Tschaplinski, and Zaid Jumean for their continuing assistance, technical reviews, and critical feedback during the development of this report. A sincere thanks is also extended to Dirk Brinkman for his constructive review, commentary, and contributions to improving this document. Finally, we would like to recognize the members of the Watershed Status Evaluation Technical Working Group for their continued discussions and support around the use of potential remote-sensed approaches for describing and tracking watershed risks or pressures.
R E P O R T # 3 9
vNorthern Interior Forest Region: Analysis Of Stand-Level Biodiversity Sampling Results In Six Predominant Biogeoclimatic Subzones
exeCutive summary
Under British Columbia’s Forest and Range Practices Act Government Actions Regulation, and the Oil and Gas Activities Act Environmental Management and Protection Regulation, watersheds with significant fish values and watershed sensitivity can be designated as Fisheries Sensitive Watersheds (FSWs). Effectiveness monitoring and assessment is critical to ensure that FSW designations succeed in achieving the intended goals of maintaining natural functions and processes to conserve healthy fish habitats and associated fish populations. Integrated GIS-based (Tier I) and field-based (Tier II) methods for assessing the habitat status of FSWs have been developed jointly by government and private partners through watershed status evaluation monitoring protocols.
This pilot project used the WSE Tier I GIS-based methods described in Porter et al. (2013) to assess the watershed indicator “risk” status of 71 watersheds across most of British Columbia’s natural resource regions. Measured values for as many as nine habitat indicators within surveyed watersheds were compared to indicator benchmarks defined in Porter et al. (2013) to assess risk “status” for each FSW (i.e., GIS-derived watershed values relative to indicator benchmarks). The defined indicator benchmarks represent one of three risk levels associated with fish habitat impact: (1) low, (2) moderate, and (3) high.
The analytical proficiency of modern GIS spatial tools is easily capable of the type of analysis conducted in this WSE Tier I evaluation. The limitations to this type of analysis exist primarily with the base data. Despite the various uncertainties inherent in current databases and GIS layers supporting watershed status evaluation Tier I assessments, the survey results and interpretations presented here are a good first step toward the development of more consistent and regularly repeated evaluations of broad habitat pressures acting across provincial FSWs. This assessment has helped to identify gaps in underlying data requirements and has flagged several priority needs for improvement.
To improve the utility of future watershed status evaluation Tier I analyses, and other GIS-based forms of analysis, we make the following recommendations.
• As a high government priority, improve critical GIS data layers
• Expand the number of primary indicators
• Increase the frequency of field-based Tier II watershed condition assessments
• Adopt and improve watershed status evaluation Tier I monitoring

vi Northern Interior Forest Region: Analysis Of Stand-Level Biodiversity Sampling Results In Six Predominant Biogeoclimatic Subzones
R E P O R T # 3 9
taBle of Contents
acknowledgements ............................................................................................................................iv
executive summary ............................................................................................................................v
1.0 introduction ............................................................................................................................... 1
2.0 methods .................................................................................................................................... 2
3.0 results .................................................................................................................................... 7
4.0 disCussion ...............................................................................................................................23
4.1 GIS Data Deficiencies ................................................................................................................ 23
4.2 Recommendations .................................................................................................................... 25
literature Cited ................................................................................................................................26
appendices ......................................................................................................................................27
Appendix 1. Attribute information for 71 provincial fisheries sensitive watersheds (designated, candidate, and proposed) assessed using watershed status evaluation Tier I protocols. ..................... 27
Appendix 2. Additional statistics for GIS-derived habitat indicators in 71 fisheries sensitive watersheds (designated, candidate, and proposed) across provincial management regions. ................ 29
Appendix 3. Habitat risk ratings (green = low risk, amber = moderate risk, red = high risk) for WSE Tier I habitat indicators over 71 fisheries sensitive watersheds (designated, candidate, and proposed) in each provincial natural resource region. .................................................................. 32
R E P O R T # 3 9
1Northern Interior Forest Region: Analysis Of Stand-Level Biodiversity Sampling Results In Six Predominant Biogeoclimatic Subzones
1.0 introduCtion
Over the last 10 years, the government of British Columbia has taken steps to conserve watershed-level social, ecological, and economic fisheries values in the province by way of the Forest and Range Practices Act’s (FRPA) Government Actions Regulation (GAR), the Oil and Gas Activities Act’s (OGAA) Environmental Management and Protection Regulation (EMPR), or other similar regulatory tools.1 Under these two regulations, the delegated Minister (or designate) is authorized to designate a watershed with significant fish values and watershed sensitivity as a “fisheries sensitive watershed” (FSW; also referred to generically as a “watershed” in this report). This designation specifically acknowledges the considerable benefits derived from British Columbia’s fisheries resources. The designation also provides the legal framework for forest, range, and oil and gas operators to undertake practices that maintain natural watershed processes by conserving the ecological attributes necessary to protect and sustain fish and their habitat (Reese-Hansen and Parkinson 2006). These conditions and outcomes include (see Government Actions Regulation, Section 14)2:
1. conserving natural hydrological condition, stream bed dynamics, and channel integrity;
2. conserving the quality, quantity, and timing of flows; and
3. preventing cumulative effects.
Under these regulations, the Ministry of Forests, Lands, and Natural Resource Operations (MFLNRO) and Ministry of Environment (MOE) have developed policy and procedures that guide a program for evaluating and designating drainages as FSWs. Thus far, more than 36 FSWs have been legally established under the Government Actions Regulation, whereas a larger number of additional watersheds throughout the province identified as “Candidate” or “Proposed” FSWs are awaiting review before any official designation over the next several years (L. Reese-Hansen, Ministry of Forests, Lands, and Natural Resource Operations, pers. comm., February, 2013).
Effectiveness monitoring and assessment are seen as critical to evaluate potential impacts associated with cumulative effects as well as to ensure that FSW designation is successful in achieving the goals of maintaining natural functions and processes required to conserve healthy fish habitats and associated fish populations. Under the Forest and Range Evaluation Program (FREP), effectiveness monitoring protocols have been developed to evaluate fish habitat conditions in FSWs as part of the Watershed Status Evaluation (WSE) project.3 Protocols developed under this project include:
• broad-scale, Geographic Information System (computer based technology) “risk” evaluation that measures the spatial extent and intensity of development pressures on fish habitat across a watershed (referred to as “Tier I Monitoring”; see Porter et al. 2013); and
• localized, field-based monitoring of watershed fish habitat that measures the condition of a watershed (referred to as “Tier II Monitoring”; see Pickard et al. 2014).
The Tier I monitoring protocol (Porter et al. 2013) has its foundation in methods developed for assessment of watershed status under the province’s Interior and Coastal Watershed Assessment Procedures (i.e., B.C. Ministry of Forests 1995a, 1995b, 1999). Indicators and benchmarks for the protocol were selected from these procedures based on their efficacy, widespread acceptance, and the knowledge base upon which they were developed.
The FSW assessments described in this report used methods outlined in Porter et al. (2013) to generate values for Tier I habitat indicators across a subset of provincially designated FSWs, plus selected regional candidate and high-priority proposed FSWs. Measured habitat values were related to defined benchmarks of concern for each habitat indicator so as to allow evaluations of habitat pressure status (i.e., low, moderate, or high potential risk of habitat degradation) within each FSW.
The purpose of this project was to demonstrate both the application and the utility of Porter et al.’s Tier I procedure (2013). It serves as a means to establish
1 For example, Important Fisheries Watersheds as designated under the Land Act. 2 See Forest and Range Practices Act, Government Actions Regulation, B.C. Reg. 582/2004. http://www.bclaws.ca/civix/document/id/complete/
statreg/582_2004#section14 (Accessed April 2015).3 More information is available on FREP’s website, Watershed-based Fish Values Monitoring Protocol for Watersheds with High Fish Values, at: http://
www.for.gov.bc.ca/hfp/frep/values/watershed.htm.

2 Northern Interior Forest Region: Analysis Of Stand-Level Biodiversity Sampling Results In Six Predominant Biogeoclimatic Subzones
R E P O R T # 3 9
baseline cumulative levels of risk using currently available information, and can be used again in the future to understand any change and trend in levels of risk. This document should serve the needs of land use managers, decision makers, and those interested in watershed monitoring methods in their efforts to plan, approve, conduct, and assess land use activities while conserving aquatic and fish habitat values.
2.0 methods
Watersheds selected for evaluation included currently designated (i.e., as of May 2012), candidate, and proposed FSWs identified by provincial government biologists and hydrologists from most regions of the province.
Established FSWs were used in this assessment because their suitability had been demonstrated through the legal designation process. Candidate and proposed watersheds were selected based on their ability to meet the FSW technical criteria and regional ranking as a high priority. The technical criteria (or regulatory tests) are specified in regulation and require that a watershed have both significant fish values and sensitivity.
Appendix 1 contains a list of the 71 watersheds (with accompanying attributes) evaluated as part of this analysis. The map in Figure 1 shows the locations of these watersheds and indicates their regulatory status (i.e., designated, candidate, or proposed) within British Columbia’s natural resource administrative regions.

R E P O R T # 3 9
3Northern Interior Forest Region: Analysis Of Stand-Level Biodiversity Sampling Results In Six Predominant Biogeoclimatic Subzones
Figure 1. Location of 71 designated, candidate, and proposed fisheries sensitive watersheds within British Columbia’s natural resource management regions.

R E P O R T # 3 9
44 Northern Interior Forest Region: Analysis Of Stand-Level Biodiversity Sampling Results In Six Predominant Biogeoclimatic Subzones
Using approaches described in Porter et al. (2013), the following habitat pressure indicators were quantified for each watershed using a geographical information system (GIS). These habitat indicators are:
• Road density for the entire watershed (km/km2)
• Road density above the H60 line4 (km/km2) (for interior watersheds only)
• Road density less than 100 m from a stream (km/km2)
• Stream crossing density (number per km2)
• Proportion of stream logged (km/km)
• Proportion of fish-bearing stream logged (km/km)
• Density of stream banks logged on slopes greater than 60% (km/km2)
• Peak flow index (unweighted; scale of 0–1)
• Road density on unstable slopes (km/km2)5
To assess current Tier I risk “status” for the watersheds, measured values for each of the above indicators were compared to moderate and high risk benchmarks currently defined for each indicator in Porter et al.
(2013) (i.e., GIS-derived watershed values relative to indicator benchmark values). These indicator benchmarks represented the levels at which fish habitat degradation is considered to be a low, moderate, or high risk.
Figure 2-A shows the areas within the 71 assessed watersheds for which Vegetation Resource Inventory (VRI) information is currently unreported (not available). Figure 2-B indicates the percentages of total watershed area in which VRI is “unreported” within each of the watersheds. (Specific values for VRI unreported are also recorded in Appendix 1.) Equivalent clearcut area (ECA) and the associated peak flow index indicator were calculated only for watersheds with more than 50% of total area represented with VRI data (56 of 71 FSWs). Thirty-two of these 56 watersheds had 100% VRI coverage. For the watersheds where VRI was lacking (i.e., with greater than 50% but less than 100% VRI reported—24 of these 56 watersheds), equivalent clearcut area (ECA) per peak flow index was calculated only for areas with reported VRI ; this calculation assumed that the results were applicable to the entire watershed. For the 15 watersheds with less than 50% VRI reported ECA and the Peak Flow Index were not calculated.
4 The H60 line represents the elevation above which 60% of the watershed area lies.5 For this indicator, slopes greater than 60% served as a coarse surrogate indicator for unstable slopes because GIS layers depicting general terrain
stability at a provincial scale were lacking.

R E P O R T # 3 9
5Northern Interior Forest Region: Analysis Of Stand-Level Biodiversity Sampling Results In Six Predominant Biogeoclimatic Subzones
Figure 2. (A) Areas with unreported VRI land classifications within fishery sensitive watersheds (designated, candidate, and proposed FSWs combined; see Table 1 for watershed names/identifier numbers); (B) percentage VRI unreported within FSWs by region.
a
B
6 Northern Interior Forest Region: Analysis Of Stand-Level Biodiversity Sampling Results In Six Predominant Biogeoclimatic Subzones
R E P O R T # 3 9
The analysis considered FSWs in the West and South Coast natural resource regions as “coastal” watersheds, whereas FSWs in the Omineca, Cariboo, Thompson–Okanagan, and Kootenay–Boundary natural resource regions were considered as “interior” watersheds. Watersheds within the Skeena Natural Resource Region, with its transitional biogeoclimatic conditions, were deemed either coastal or interior, depending on the ecoregion in which the watershed was located. The distinction between coast and interior conditions is based on differences in hydrological processes. Consequently, several different indicator benchmarks are used to reflect their unique hydrological characteristics (B.C. Ministry of Forests 1995a, 1995b; Porter et al. 2013).
Actual measurement units are used to illustrate benchmark break points between the three risk ratings (i.e., low, moderate, and high potential risk of habitat
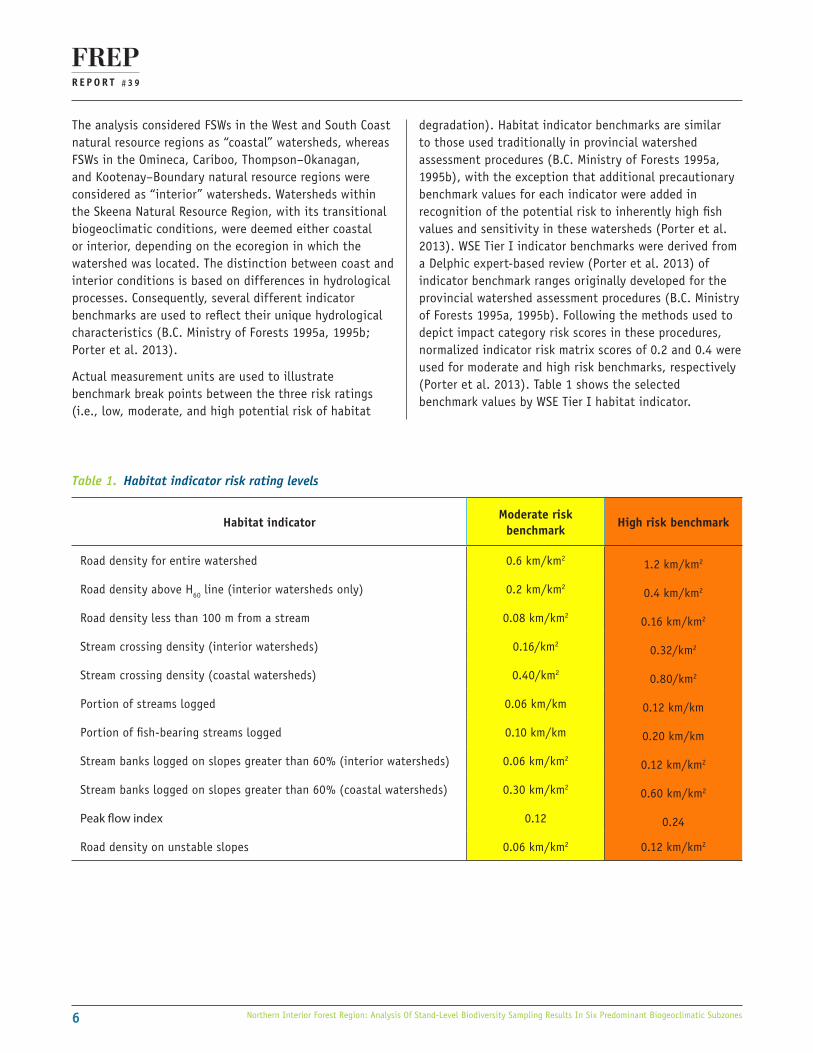
degradation). Habitat indicator benchmarks are similar to those used traditionally in provincial watershed assessment procedures (B.C. Ministry of Forests 1995a, 1995b), with the exception that additional precautionary benchmark values for each indicator were added in recognition of the potential risk to inherently high fish values and sensitivity in these watersheds (Porter et al. 2013). WSE Tier I indicator benchmarks were derived from a Delphic expert-based review (Porter et al. 2013) of indicator benchmark ranges originally developed for the provincial watershed assessment procedures (B.C. Ministry of Forests 1995a, 1995b). Following the methods used to depict impact category risk scores in these procedures, normalized indicator risk matrix scores of 0.2 and 0.4 were used for moderate and high risk benchmarks, respectively (Porter et al. 2013). Table 1 shows the selected benchmark values by WSE Tier I habitat indicator.
Table 1. Habitat indicator risk rating levels
habitat indicatormoderate risk
benchmarkhigh risk benchmark
Road density for entire watershed 0.6 km/km21.2 km/km2
Road density above H60 line (interior watersheds only) 0.2 km/km20.4 km/km2
Road density less than 100 m from a stream 0.08 km/km20.16 km/km2
Stream crossing density (interior watersheds) 0.16/km20.32/km2
Stream crossing density (coastal watersheds) 0.40/km20.80/km2
Portion of streams logged 0.06 km/km 0.12 km/km
Portion of fish-bearing streams logged 0.10 km/km 0.20 km/km
Stream banks logged on slopes greater than 60% (interior watersheds) 0.06 km/km20.12 km/km2
Stream banks logged on slopes greater than 60% (coastal watersheds) 0.30 km/km20.60 km/km2
Peak flow index 0.12 0.24
Road density on unstable slopes 0.06 km/km2 0.12 km/km2

R E P O R T # 3 9
7Northern Interior Forest Region: Analysis Of Stand-Level Biodiversity Sampling Results In Six Predominant Biogeoclimatic Subzones
For each of the watersheds, additional habitat indicator information was also generated, including:
• Percentage of riparian forest disturbed (%)
• Percentage riparian disturbed by forestry (%)
• Percentage of riparian disturbed by land alienation (%)
• Percentage of riparian disturbed by mountain pine beetle and other forest pathogens (%)
• Percentage of riparian disturbed by fire (%)
• Equivalent clearcut area (%)
• From forestry (%)
• From other forms of land development (%)
These habitat indicators provide supplemental information on types of potential habitat disturbances within the watersheds but were not incorporated into the analysis because disturbance benchmarks (i.e., low, moderate, high) are not yet defined or incorporated into the WSE Tier I risk assessment methods (Porter et al. 2013).6 Additional information on the disturbed riparian zones and equivalent clearcut area in the watersheds is provided in Appendix 2.
3.0 results
Values for the nine WSE Tier I habitat indicators measured in this watershed status evaluation pilot project are provided in Figures 3–13 grouped by provincial natural resource region; some indicators are presented in separate figures for coastal versus interior watersheds. In each watershed, values are presented relative to the moderate and high risk benchmarks for each habitat indicator (Porter et al. 2013). Table 2 provides a single matrix summary across all FSWs of risk “status” (low, moderate, high) for each habitat pressure indicator. Table 2 information is also depicted by natural resource region in Appendix 3.
Across the 71 watersheds, the worst performing habitat indicators (i.e., those categorized at high risk across a high proportion of the 71 watersheds) were “stream
crossing density” and “road density within 100 m of a stream.” The best performing habitat indicators (i.e., those categorized as low risk across a high proportion of the 71 watersheds) were “road density on unstable slopes,” “the portion of fish-bearing streams logged,” and “peak flow index” (for interior watersheds).
Most of the 71 watersheds evaluated had a high risk status for at least one of the measured habitat indicators. Exceptions to this were the South Coast Natural Resource Region’s Klite River, Little Toba River, Filer Creek, and Shovelnose Creek, as well as the Skeena Region’s McKay Creek and Pierre Creek, which had low risk status ratings across the full suite of eight (for coastal watersheds) or nine (for interior watersheds) habitat indicators. The Omineca Region’s Goat River also had no high risk ratings, but did have one moderate risk rating associated with “stream crossing density.” For the other watersheds, a variable mix of low, moderate, and high risk ratings occurred across the measured habitat indicators. No watersheds displayed high risk status ratings across all measured habitat indicators, but some were notable for having a significant proportion of high risk ratings (i.e., the Skeena Region’s Jonas Creek and Gramaphone Creek, which had eight and nine habitat indicators rated as high risk, respectively).
On a regional basis, watersheds with the greatest number of high risk habitat indicator ratings were in the interior portion of the Skeena, Cariboo, and Thompson–Okanagan natural resource regions. Conversely, the status of watersheds in the coastal portion of the Skeena Region scored better than those in the interior, with a high proportion of low risk ratings, and a small number of moderate or high risk ratings across all habitat indicators. Watersheds in the South Coast Natural Resource Region appeared to be the least affected by habitat disturbances with a consistently high proportion of low risk ratings, and with only a limited number of moderate or high risk ratings for the “stream crossing density” and “road density near streams” indicators (see Discussion below for important contextual information to data presented here).
6 Total equivalent clearcut area, which includes all forms of disturbance, is incorporated directly into the peak flow index.

8 Northern Interior Forest Region: Analysis Of Stand-Level Biodiversity Sampling Results In Six Predominant Biogeoclimatic Subzones
R E P O R T # 3 9
Figu
re 3
. Ro
ad d
ensi
ty (
km/k
m2 )
for
the
ent
ire
wat
ersh
ed w
ithi
n Br
itis
h Co
lum
bia’
s re
gion
al fi
sher
ies
sens
itiv
e w
ater
shed
s (d
esig
nate
d, c
andi
date
, and
pr
opos
ed).
hig
h ri
sk B
ench
mar
k (1
.2)
mod
erat
e ri
sk B
ench
mar
k (0
.6)
R E P O R T # 3 9
9Northern Interior Forest Region: Analysis Of Stand-Level Biodiversity Sampling Results In Six Predominant Biogeoclimatic Subzones
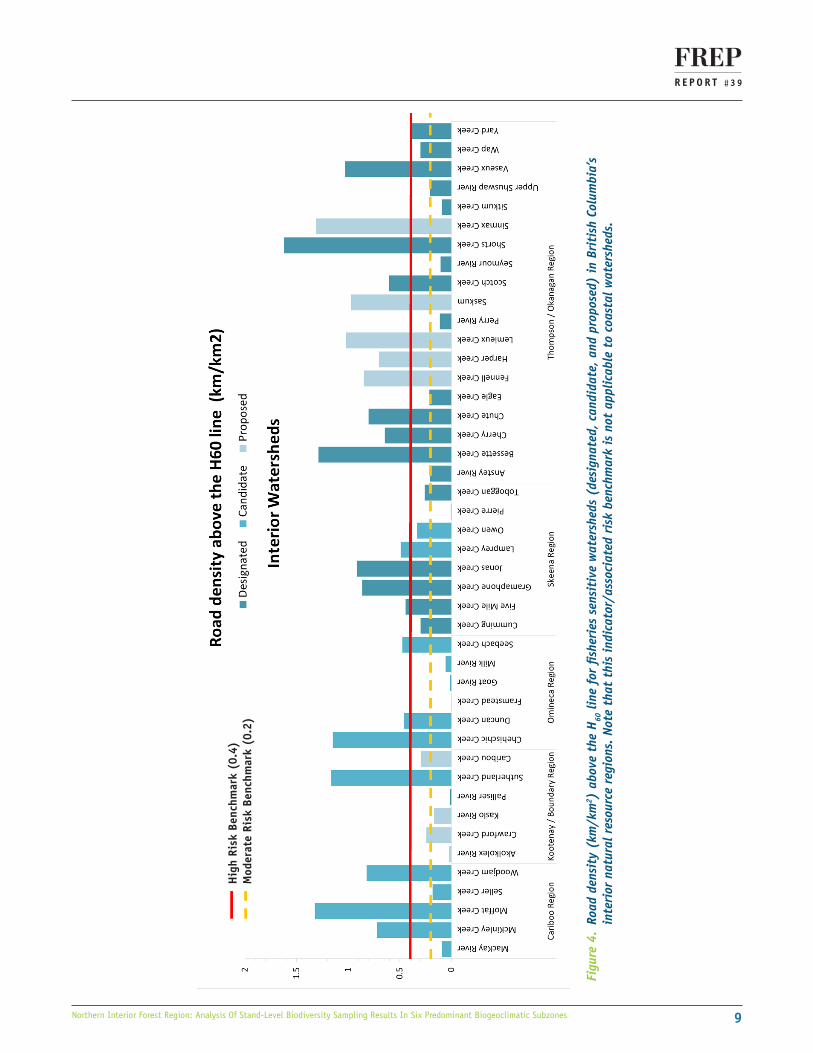
Figu
re 4
. Ro
ad d
ensi
ty (
km/k
m2 )
abo
ve t
he H
60 li
ne f
or fi
sher
ies
sens
itiv
e w
ater
shed
s (d
esig
nate
d, c
andi
date
, and
pro
pose
d) in
Bri
tish
Col
umbi
a’s
inte
rior
nat
ural
res
ourc
e re
gion
s. N
ote
that
thi
s in
dica
tor/
asso
ciat
ed r
isk
benc
hmar
k is
not
app
licab
le t
o co
asta
l wat
ersh
eds.
hig
h ri
sk B
ench
mar
k (0
.4)
mod
erat
e ri
sk B
ench
mar
k (0
.2)

10 Northern Interior Forest Region: Analysis Of Stand-Level Biodiversity Sampling Results In Six Predominant Biogeoclimatic Subzones
R E P O R T # 3 9
Figu
re 5
. Ro
ad d
ensi
ty (
km/k
m2 )
less
tha
n 10
0 m
fro
m a
str
eam
for
Bri
tish
Col
umbi
a’s
fishe
ries
sen
siti
ve w
ater
shed
s (d
esig
nate
d, c
andi
date
, and
pr
opos
ed).
hig
h ri
sk B
ench
mar
k (0
.16)
mod
erat
e ri
sk B
ench
mar
k (0
.08)
R E P O R T # 3 9
11Northern Interior Forest Region: Analysis Of Stand-Level Biodiversity Sampling Results In Six Predominant Biogeoclimatic Subzones
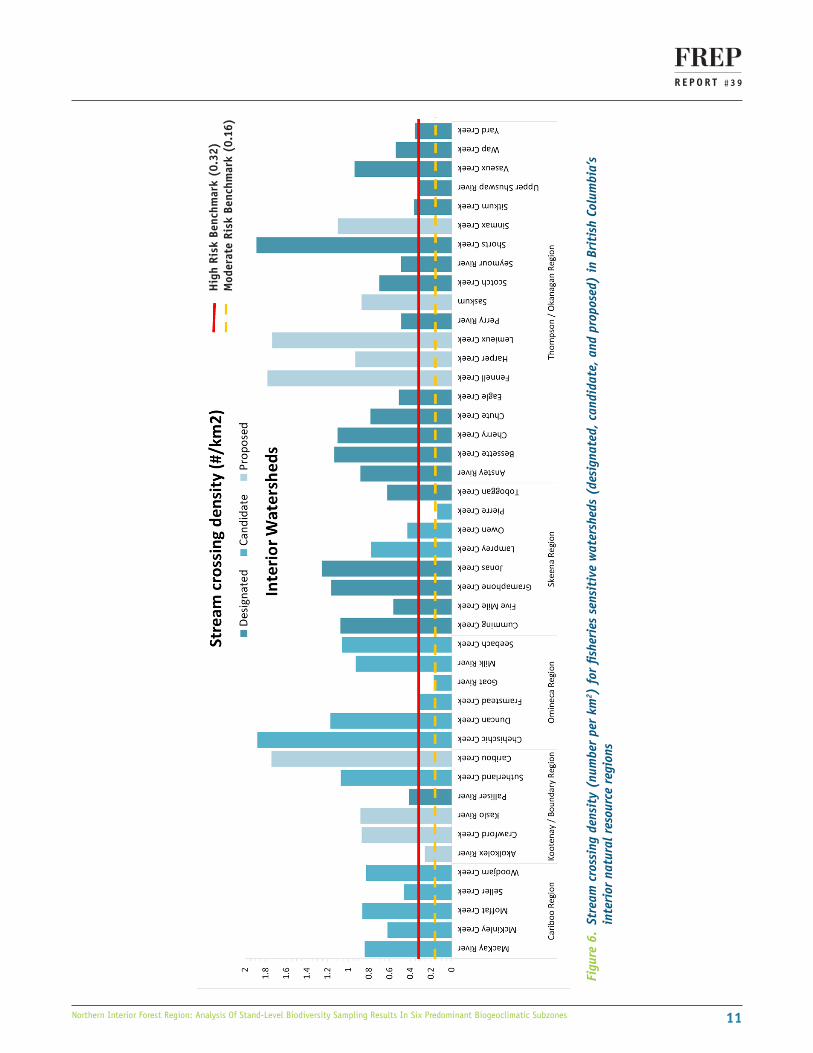
Figu
re 6
. St
ream
cro
ssin
g de
nsit
y (n
umbe
r pe
r km
2 ) f
or fi
sher
ies
sens
itiv
e w
ater
shed
s (d
esig
nate
d, c
andi
date
, and
pro
pose
d) in
Bri
tish
Col
umbi
a’s
inte
rior
nat
ural
res
ourc
e re
gion
s
hig
h ri
sk B
ench
mar
k (0
.32)
mod
erat
e ri
sk B
ench
mar
k (0
.16)

12 Northern Interior Forest Region: Analysis Of Stand-Level Biodiversity Sampling Results In Six Predominant Biogeoclimatic Subzones
R E P O R T # 3 9
Figu
re 7
. St
ream
cro
ssin
g de
nsit
y (n
umbe
r pe
r km
2 ) f
or fi
sher
ies
sens
itiv
e w
ater
shed
s (d
esig
nate
d, c
andi
date
, and
pro
pose
d) in
Bri
tish
Col
umbi
a’s
coas
tal n
atur
al r
esou
rce
regi
ons.
hig
h ri
sk B
ench
mar
k (0
.8)
mod
erat
e ri
sk B
ench
mar
k (0
.4)

R E P O R T # 3 9
13Northern Interior Forest Region: Analysis Of Stand-Level Biodiversity Sampling Results In Six Predominant Biogeoclimatic Subzones
7 Be
caus
e of
cur
renc
y an
d sp
atia
l cov
erag
e lim
itat
ions
of
prov
inci
al G
IS v
eget
atio
n re
sour
ce in
vent
ory
data
, so
me
wat
ersh
eds
in t
his
figur
e ar
e de
pict
ed a
t a
low
er r
isk
leve
l tha
n m
ay b
e th
e ca
se.
This
issu
e is
add
ress
ed in
Sec
tion
4.
Figu
re 8
. Po
rtio
n of
str
eam
s lo
gged
(km
/km
) fo
r Br
itis
h Co
lum
bia’
s re
gion
al fi
sher
ies
sens
itiv
e w
ater
shed
s (d
esig
nate
d, c
andi
date
, and
pro
pose
d).7
hig
h ri
sk B
ench
mar
k (0
.12)
mod
erat
e ri
sk B
ench
mar
k (0
.06)

14 Northern Interior Forest Region: Analysis Of Stand-Level Biodiversity Sampling Results In Six Predominant Biogeoclimatic Subzones
R E P O R T # 3 9
8 Be
caus
e of
cur
renc
y an
d sp
atia
l cov
erag
e lim
itat
ions
of
prov
inci
al G
IS v
eget
atio
n re
sour
ce in
vent
ory
data
, so
me
wat
ersh
eds
in t
his
figur
e ar
e de
pict
ed a
t a
low
er r
isk
leve
l tha
n m
ay b
e th
e ca
se.
This
issu
e is
add
ress
ed in
Sec
tion
4.
Figu
re 9
. Po
rtio
n of
fish
-bea
ring
str
eam
s lo
gged
(km
/km
) fo
r Br
itis
h Co
lum
bia’
s re
gion
al fi
sher
ies
sens
itiv
e w
ater
shed
s (d
esig
nate
d, c
andi
date
, and
pr
opos
ed).
Fis
h-be
arin
g st
atus
(ob
serv
ed a
nd in
ferr
ed)
was
det
erm
ined
for
the
ana
lysi
s us
ing
the
prov
ince
`s m
odel
led
fish
habi
tat
GIS
laye
r (M
ount
et
al. 2
011)
.8
hig
h ri
sk B
ench
mar
k (0
.2)
mod
erat
e ri
sk B
ench
mar
k (0
.1)

R E P O R T # 3 9
15Northern Interior Forest Region: Analysis Of Stand-Level Biodiversity Sampling Results In Six Predominant Biogeoclimatic Subzones
Figu
re 1
0. P
eak
flow
inde
x va
lues
(0–
1) f
or B
riti
sh C
olum
bia’
s re
gion
al fi
sher
ies
sens
itiv
e w
ater
shed
s (d
esig
nate
d, c
andi
date
, and
pro
pose
d).
hig
h ri
sk B
ench
mar
k (0
.24)
mod
erat
e ri
sk B
ench
mar
k (0
.12)

16 Northern Interior Forest Region: Analysis Of Stand-Level Biodiversity Sampling Results In Six Predominant Biogeoclimatic Subzones
R E P O R T # 3 9
Figu
re 1
1. S
trea
m b
anks
logg
ed (
km/k
m2 )
on
slop
es g
reat
er t
han
60%
for
fish
erie
s se
nsit
ive
wat
ersh
eds
(des
igna
ted,
can
dida
te, a
nd p
ropo
sed)
in
Brit
ish
Colu
mbi
a’s
inte
rior
nat
ural
res
ourc
e re
gion
s.
hig
h ri
sk B
ench
mar
k (0
.12)
mod
erat
e ri
sk B
ench
mar
k (0
.06)

R E P O R T # 3 9
17Northern Interior Forest Region: Analysis Of Stand-Level Biodiversity Sampling Results In Six Predominant Biogeoclimatic Subzones
Figu
re 1
2. S
trea
m b
anks
logg
ed (
km/k
m2 )
on
slop
es g
reat
er t
han
60%
for
fish
erie
s se
nsit
ive
wat
ersh
eds
(des
igna
ted,
can
dida
te, a
nd p
ropo
sed)
in
Brit
ish
Colu
mbi
a’s
coas
tal n
atur
al r
esou
rce
regi
ons.
hig
h ri
sk B
ench
mar
k (0
.6)
mod
erat
e ri
sk B
ench
mar
k (0
.3)

18 Northern Interior Forest Region: Analysis Of Stand-Level Biodiversity Sampling Results In Six Predominant Biogeoclimatic Subzones
R E P O R T # 3 9
Figu
re 1
3. R
oad
dens
ity
(km
/km
2 ) o
n un
stab
le s
lope
s fo
r fis
heri
es s
ensi
tive
wat
ersh
eds
(des
igna
ted,
can
dida
te, a
nd p
ropo
sed)
. Not
e th
at a
coa
rse
surr
ogat
e fo
r un
stab
le s
lope
s is
use
d in
thi
s an
alys
is (
i.e.,
slop
es >
60%
are
use
d to
rep
rese
nt u
nsta
ble
slop
es)
in t
he a
bsen
ce o
f an
y cu
rren
t pr
ovin
cial
-sca
le G
IS la
yer
dire
ctly
dep
icti
ng s
lope
sta
bilit
y.
hig
h ri
sk B
ench
mar
k (0
.12)
mod
erat
e ri
sk B
ench
mar
k (0
.06)

R E P O R T # 3 9
19Northern Interior Forest Region: Analysis Of Stand-Level Biodiversity Sampling Results In Six Predominant Biogeoclimatic Subzones
Tabl
e 2.
Hab
itat
ris
k st
atus
rat
ings
(gr
een
= lo
w r
isk,
am
ber
= m
oder
ate
risk
, red
= h
igh
risk
) fo
r W
SE T
ier
I ha
bita
t in
dica
tors
mea
sure
d in
71
prov
inci
al fi
sher
ies
sens
itiv
e w
ater
shed
s (d
esig
nate
d, c
andi
date
, and
pro
pose
d). B
ench
mar
k va
lues
use
d fo
r as
sign
ing
stat
us o
f ea
ch h
abit
at
indi
cato
r ar
e de
fined
in t
he w
ater
shed
sta
tus
eval
uati
on T
ier
I pr
otoc
ol (
Port
er e
t al
. 201
3). B
ench
mar
k va
lues
for
som
e ha
bita
t in
dica
tors
va
ry b
y re
gion
(i.e
., co
asta
l vs.
inte
rior
wat
ersh
eds)
. Not
e th
at a
pea
k flo
w in
dex
(unw
eigh
ted)
val
ue w
as n
ot c
alcu
late
d if
mor
e th
an 5
0% o
f th
e w
ater
shed
are
a la
cked
Veg
etat
ion
Reso
urce
Inv
ento
ry r
epor
ting
(in
dica
ted
by “
null”
).9
Wat
ersh
ed
nam
est
atus
regi
on
road
den
sity
fo
r en
tire
fs
W (
km/
km2 )
road
den
sity
ab
ove
h
60 li
ne
(km
/km
2 )
road
den
sity
<
100
m
from
str
eam
(k
m/k
m2 )
stre
am
cros
sing
de
nsit
y (#
/km
2 )
Port
ion
of
stre
ams
logg
ed (
km/
km)
Port
ion
of
fish-
bear
ing
stre
ams
logg
ed (
km/
km)
stre
am
bank
s lo
gged
on
slop
es
> 60
% (
km/
km2 )
Peak
flow
in
dex
(unw
eigh
ted)
road
de
nsit
y on
un
stab
le
slop
es
(km
/km
2 )
Akol
kole
x Ri
ver
Prop
osed
Koot
enay
–Bo
unda
ry
0.40
0.02
0.10
0.26
0.42
0.07
0.95
0.04
0.06
Anst
ey R
iver
Desi
gnat
edTh
omps
on–
Okan
agan
1.04
0.21
0.31
0.88
0.11
0.05
0.18
0.12
0.13
Anw
eile
r Ri
ver
Cand
idat
eSk
eena
Co
asta
l0.
43NA
0.10
0.29
0.03
0.02
0.03
0.05
0.04
Artl
ish
Rive
rDe
sign
ated
Wes
t Co
ast
1.54
NA0.
581.
480.
720.
241.
400.
110.
11Aw
un R
iver
Cand
idat
eW
est
Coas
t1.
32NA
0.26
0.73
0.05
0.03
0.04
null
0.04
Bess
ette
Cr
eek
Desi
gnat
edTh
omps
on–
Okan
agan
2.68
1.29
0.62
1.14
0.16
0.15
0.11
0.14
0.03
Birk
enhe
ad
Rive
rPr
opos
edSo
uth
Coas
t0.
41NA
0.18
0.50
0.04
0.01
0.08
0.02
0.01
Cari
bou
Cree
kPr
opos
edKo
oten
ay–
Boun
dary
1.08
0.29
0.50
1.74
0.06
0.03
0.13
null
0.12
Ceci
l Cre
ekCa
ndid
ate
Skee
na
Coas
tal
2.59
NA0.
590.
640.
060.
060.
000.
050.
00
Cheh
isch
ic
Cree
kCa
ndid
ate
Omin
eca
1.90
1.15
0.96
1.88
0.56
0.56
0.00
0.30
0.00
Cher
ry C
reek
Desi
gnat
edTh
omps
on–
Okan
agan
1.75
0.64
0.49
1.11
0.11
0.06
0.16
0.11
0.10
Chut
e Cr
eek
Desi
gnat
edTh
omps
on–
Okan
agan
2.29
0.80
0.46
0.79
0.40
0.38
2.02
0.34
0.00
Craw
ford
Cr
eek
Prop
osed
Koot
enay
–Bo
unda
ry1.
140.
240.
360.
870.
180.
070.
270.
050.
15
Cum
min
g Cr
eek
Desi
gnat
edSk
eena
1.14
0.30
0.52
1.08
0.54
0.41
2.46
0.16
0.00
Davi
dson
Cr
eek
Cand
idat
eW
est
Coas
t1.
46NA
0.47
1.44
0.38
0.29
1.03
0.17
0.02
9 Se
e Ap
pend
ix 3
for
a r
egio
nal b
reak
dow
n of
the
info
rmat
ion
in t
his
tabl
e.

20 Northern Interior Forest Region: Analysis Of Stand-Level Biodiversity Sampling Results In Six Predominant Biogeoclimatic Subzones
R E P O R T # 3 9
Wat
ersh
ed
nam
est
atus
regi
on
road
den
sity
fo
r en
tire
fs
W (
km/
km2 )
road
den
sity
ab
ove
h
60 li
ne
(km
/km
2 )
road
den
sity
<
100
m
from
str
eam
(k
m/k
m2 )
stre
am
cros
sing
de
nsit
y (#
/km
2 )
Port
ion
of
stre
ams
logg
ed (
km/
km)
Port
ion
of
fish-
bear
ing
stre
ams
logg
ed (
km/
km)
stre
am
bank
s lo
gged
on
slop
es
> 60
% (
km/
km2 )
Peak
flow
in
dex
(unw
eigh
ted)
road
de
nsit
y on
un
stab
le
slop
es
(km
/km
2 )
Deen
a Cr
eek
Cand
idat
eW
est
Coas
t1.
96NA
0.99
2.62
0.01
0.00
0.03
null
0.06
Dunc
an
Cree
kCa
ndid
ate
Omin
eca
1.20
0.46
0.52
1.17
0.11
0.11
1.53
0.07
0.00
Eagl
e Cr
eek
Desi
gnat
edTh
omps
on–
Okan
agan
0.86
0.21
0.24
0.51
0.06
0.02
0.07
0.07
0.05
Effin
gham
Ri
ver
Desi
gnat
edW
est
Coas
t0.
35NA
0.19
0.53
0.20
0.13
0.13
0.03
0.02
Esca
lant
e Ri
ver
Desi
gnat
edW
est
Coas
t2.
08NA
0.67
1.70
0.46
0.24
0.58
0.18
0.31
Fenn
ell C
reek
Prop
osed
Thom
pson
–Ok
anag
an1.
630.
850.
701.
780.
150.
080.
280.
180.
05
File
r Cr
eek
Prop
osed
Sout
h Co
ast
0.01
NA0.
000.
010.
010.
000.
00nu
ll0.
00Fi
ve M
ile
Cree
kDe
sign
ated
Skee
na0.
970.
440.
270.
570.
380.
391.
150.
130.
00
Fram
stea
d Cr
eek
Cand
idat
eOm
inec
a0.
150.
000.
090.
330.
040.
030.
020.
020.
00
Goat
Riv
erCa
ndid
ate
Omin
eca
0.30
0.01
0.07
0.17
0.01
0.01
0.01
0.04
0.01
Gord
on R
iver
Desi
gnat
edW
est
Coas
t2.
36NA
1.06
3.04
0.09
0.03
0.29
0.08
0.29
Gram
apho
ne
Cree
kDe
sign
ated
Skee
na1.
600.
860.
401.
170.
390.
370.
850.
130.
00
Har
per
Cree
kPr
opos
edTh
omps
on–
Okan
agan
1.18
0.70
0.33
0.93
0.21
0.08
0.66
0.17
0.01
Hat
ton
Cree
kDe
sign
ated
Wes
t Co
ast
2.34
NA0.
942.
700.
070.
010.
27nu
ll0.
19H
emm
ings
en
Cree
kDe
sign
ated
Wes
t Co
ast
2.41
NA0.
993.
000.
060.
010.
160.
070.
29
Jona
s Cr
eek
Desi
gnat
edSk
eena
2.51
0.92
1.04
1.26
0.61
0.58
4.36
0.30
0.00
Kasl
o Ri
ver
Prop
osed
Koot
enay
–Bo
unda
ry1.
010.
170.
380.
880.
050.
020.
080.
050.
13
Klan
awa
Rive
rDe
sign
ated
Wes
t Co
ast
2.64
NA0.
992.
580.
110.
040.
35nu
ll0.
20
Klit
e Ri
ver
Prop
osed
Sout
h Co
ast
0.04
NA0.
030.
070.
030.
020.
050.
000.
01La
mpr
ey
Cree
kCa
ndid
ate
Skee
na1.
140.
490.
350.
780.
360.
360.
040.
380.
00
Lem
ieux
Cr
eek
Prop
osed
Thom
pson
–Ok
anag
an1.
951.
020.
821.
740.
190.
160.
290.
170.
01
Litt
le T
oba
Rive
rPr
opos
edSo
uth
Coas
t0.
13NA
0.06
0.18
0.00
0.00
0.00
null
0.01
Mac
Kay
Rive
rCa
ndid
ate
Cari
boo
1.27
0.09
0.32
0.84
0.10
0.07
0.09
0.12
0.07

R E P O R T # 3 9
21Northern Interior Forest Region: Analysis Of Stand-Level Biodiversity Sampling Results In Six Predominant Biogeoclimatic Subzones
Wat
ersh
ed
nam
est
atus
regi
on
road
den
sity
fo
r en
tire
fs
W (
km/
km2 )
road
den
sity
ab
ove
h
60 li
ne
(km
/km
2 )
road
den
sity
<
100
m
from
str
eam
(k
m/k
m2 )
stre
am
cros
sing
de
nsit
y (#
/km
2 )
Port
ion
of
stre
ams
logg
ed (
km/
km)
Port
ion
of
fish-
bear
ing
stre
ams
logg
ed (
km/
km)
stre
am
bank
s lo
gged
on
slop
es
> 60
% (
km/
km2 )
Peak
flow
in
dex
(unw
eigh
ted)
road
de
nsit
y on
un
stab
le
slop
es
(km
/km
2 )
Mac
ktus
h Cr
eek
Desi
gnat
edW
est
Coas
t2.
53NA
0.67
1.39
0.00
0.00
0.00
null
0.36
Mam
in R
iver
Cand
idat
eW
est
Coas
t1.
98NA
0.80
2.14
0.04
0.02
0.13
null
0.03
Mat
hers
Cr
eek
Cand
idat
eW
est
Coas
t0.
59NA
0.23
0.69
0.01
0.00
0.02
null
0.02
McK
ay C
reek
Cand
idat
eSk
eena
Co
asta
l0.
32NA
0.08
0.24
0.02
0.01
0.05
null
0.02
McK
inle
y Cr
eek
Cand
idat
eCa
ribo
o1.
500.
720.
280.
620.
190.
170.
220.
190.
01
Mem
ekay
Ri
ver
Desi
gnat
edW
est
Coas
t2.
70NA
0.53
1.08
0.06
0.05
0.09
null
0.06
Milk
Riv
erCa
ndid
ate
Omin
eca
0.82
0.06
0.32
0.93
0.06
0.03
0.08
0.12
0.04
Mof
fat
Cree
kCa
ndid
ate
Cari
boo
2.29
1.32
0.45
0.86
0.18
0.18
0.49
0.28
0.00
Nahm
int
Rive
rDe
sign
ated
Wes
t Co
ast
1.15
NA0.
531.
360.
030.
010.
06nu
ll0.
11
Nalb
eela
h Cr
eek
Cand
idat
eSk
eena
Co
asta
l1.
52NA
0.68
1.23
0.07
0.06
0.05
null
0.03
Orfo
rd R
iver
Prop
osed
Sout
h Co
ast
0.27
NA0.
130.
470.
060.
020.
100.
020.
05Ow
en C
reek
Cand
idat
eSk
eena
0.91
0.33
0.20
0.43
0.15
0.06
0.01
0.17
0.00
Palli
ser
Rive
rDe
sign
ated
Koot
enay
–Bo
unda
ry0.
470.
010.
140.
410.
040.
030.
080.
040.
02
Perr
y Ri
ver
Desi
gnat
edTh
omps
on–
Okan
agan
0.78
0.11
0.20
0.49
0.07
0.03
0.05
0.07
0.07
Pier
re C
reek
Cand
idat
eSk
eena
0.16
0.01
0.05
0.14
0.01
0.01
0.00
0.03
0.00
Sask
umPr
opos
edTh
omps
on–
Okan
agan
1.99
0.97
0.35
0.87
0.17
0.09
0.23
0.23
0.09
Scot
ch C
reek
Desi
gnat
edTh
omps
on–
Okan
agan
1.41
0.61
0.30
0.70
0.17
0.09
0.33
0.12
0.03
Seeb
ach
Cree
kCa
ndid
ate
Omin
eca
0.96
0.47
0.41
1.06
0.06
0.06
0.14
null
0.00
Selle
r Cr
eek
Cand
idat
eCa
ribo
o1.
080.
180.
170.
460.
170.
120.
500.
080.
02Se
ymou
r Ri
ver
Desi
gnat
edTh
omps
on–
Okan
agan
0.69
0.10
0.19
0.49
0.08
0.04
0.12
0.09
0.04
Shor
ts C
reek
Desi
gnat
edTh
omps
on–
Okan
agan
2.56
1.62
0.87
1.89
0.44
0.32
0.11
0.29
0.01
Shov
elno
se
Cree
kPr
opos
edSo
uth
Coas
t0.
22NA
0.07
0.11
0.00
0.00
0.00
0.00
0.01
Sinm
ax C
reek
Prop
osed
Thom
pson
–Ok
anag
an2.
011.
310.
511.
100.
220.
120.
110.
250.
03

22 Northern Interior Forest Region: Analysis Of Stand-Level Biodiversity Sampling Results In Six Predominant Biogeoclimatic Subzones
R E P O R T # 3 9
Wat
ersh
ed
nam
est
atus
regi
on
road
den
sity
fo
r en
tire
fs
W (
km/
km2 )
road
den
sity
ab
ove
h
60 li
ne
(km
/km
2 )
road
den
sity
<
100
m
from
str
eam
(k
m/k
m2 )
stre
am
cros
sing
de
nsit
y (#
/km
2 )
Port
ion
of
stre
ams
logg
ed (
km/
km)
Port
ion
of
fish-
bear
ing
stre
ams
logg
ed (
km/
km)
stre
am
bank
s lo
gged
on
slop
es
> 60
% (
km/
km2 )
Peak
flow
in
dex
(unw
eigh
ted)
road
de
nsit
y on
un
stab
le
slop
es
(km
/km
2 )
Sitk
um C
reek
Desi
gnat
edTh
omps
on–
Okan
agan
0.42
0.09
0.14
0.36
0.04
0.01
0.07
0.01
0.02
Suth
erla
nd
Cree
kCa
ndid
ate
Koot
enay
–Bo
unda
ry2.
111.
160.
751.
070.
110.
080.
370.
080.
05
Tobo
ggan
Cr
eek
Desi
gnat
edSk
eena
0.99
0.26
0.31
0.62
0.13
0.09
0.16
0.05
0.01
Toqu
art
Rive
rDe
sign
ated
Wes
t Co
ast
0.82
NA0.
270.
670.
130.
070.
100.
080.
04U
nnam
ed
Trib
utar
yCa
ndid
ate
Skee
na
Coas
tal
0.56
NA0.
180.
740.
150.
070.
310.
040.
04
Upp
er
Shus
wap
Ri
ver
Desi
gnat
edTh
omps
on–
Okan
agan
0.62
0.21
0.13
0.31
0.08
0.04
0.04
0.05
0.02
Vase
ux C
reek
Desi
gnat
edTh
omps
on–
Okan
agan
1.88
1.03
0.52
0.94
0.22
0.22
0.14
0.19
0.00
Wap
Cre
ekDe
sign
ated
Thom
pson
–Ok
anag
an0.
890.
300.
240.
540.
080.
050.
090.
080.
03
Woo
djam
Cr
eek
Cand
idat
eCa
ribo
o1.
580.
820.
390.
830.
160.
170.
140.
220.
00
Yard
Cre
ekDe
sign
ated
Thom
pson
–Ok
anag
an1.
120.
390.
230.
360.
060.
040.
090.
130.
04
R E P O R T # 3 9
23Northern Interior Forest Region: Analysis Of Stand-Level Biodiversity Sampling Results In Six Predominant Biogeoclimatic Subzones
4.0 disCussion
Application of the Tier I risk evaluation protocol (Porter et al. 2013) described here represents a broad-scale, GIS-based assessment procedure used to evaluate the status of 71 British Columbia watersheds with significant fish values and sensitivity. The results from this study show that varying levels of human development activities and, in some cases, compounding natural disturbances, represent a wide range of risk levels to fish and fish habitat in these watersheds. Additionally, the application of this protocol demonstrates the utility and benefits that can be derived from such analysis as a natural resource management tool. The protocol, and information derived from it, can be used to help:
• consolidate essential geographic information from various sources in a way that clearly provides indications of relative levels of risk;
• make quick cross-comparisons between and within watersheds;
• prioritize and realize cost efficiencies by identifying watersheds that require further on-the-ground monitoring activities, research, or restoration opportunities; and
• conduct risk-related trend monitoring using a consistent and repeatable method.
Information of this nature, presented in the format used here, is beneficial to several audiences and users. For example, such information can help inform sound natural resource decisions at appropriate spatial scales. Resource managers may consider this information during resource allocation, mitigation, or offsetting discussions related to management activities in various types of watersheds (i.e., via a scan of indicator results), or as part of a program of long-term trend monitoring to better understand change. In addition, this method of GIS-based monitoring is of benefit to policy makers, First Nations, industry, and the public as a user-friendly approach to data presentation, by helping to serve as a basis for understanding watershed risk, policy strengths or deficiencies, and to stimulate further discussion, engagement, and future work.
While the WSE Tier I methods (Porter et al. 2013) used to generate habitat indicator metrics rely on the best currently available, broad-scale GIS data sourced from provincial and federal agencies, various uncertainties associated with this data may affect the quality and reliability of the derived habitat indicator risk information. Consequently, certain analytical caveats should be considered when interpreting habitat risk ratings. These caveats are related to spatial and temporal inaccuracies in current GIS base data and subsequent representations of the watershed characteristics used to summarize habitat risk indicator information. Examples of these data deficiencies are discussed below.
4.1 GIS Data Deficiencies
Several WSE Tier I habitat indicators rely on accurate mapping of roads, streams, and forest cover (i.e., road density for the entire FSW, road density above the H60 line, road density less than 100 m from a stream, stream crossing density, portion of streams logged, portion of fish-bearing streams logged, road density on unstable slopes). Although the methods used for this analysis consolidated all broadly available provincial road data into a single composite roads layer, initial field assessments suggest that a variable and uncertain amount of both new and older (e.g., abandoned or decommissioned) roads have likely not been identified and therefore not quantified across surveyed watersheds (L. Reese-Hansen, Habitat Management Branch, B.C. Ministry of Forests, Lands and Natural Resource Operations, pers. comm., February, 2013). Furthermore, the spatial depictions of roads between data sources relative to their actual location on-the-ground may vary significantly, affecting important indicators such as road density less than 100 m from a stream. Ongoing work by GeoBC staff should eliminate most of these data issues (Ogborne and Hlasny 2014).
Mapped representations of streams in the FSWs were based on the hydrology GIS layer in the province’s 1:20 000 Freshwater Atlas.10 Although this source provides the most comprehensive and accurate depiction of stream networks in British Columbia, many smaller streams are not captured even within this GIS layer. An example of the significance of this deficiency is its effect on estimates of potential fish passage constraints using stream crossing
10 See http://geobc.gov.bc.ca/base-mapping/atlas/fwa/index.html.

R E P O R T # 3 9
2424 Northern Interior Forest Region: Analysis Of Stand-Level Biodiversity Sampling Results In Six Predominant Biogeoclimatic Subzones
densities along the fluvial margins of large streams, where important small fish streams are not captured by the provincial Freshwater Atlas and thus will not be captured using this GIS layer. This will result in an underestimate of the fish passage constraints. Consequently, the full extent of unquantified stream densities in our analyses is unknown and likely varies by topographic form and region.
Several WSE Tier I habitat indicators rely on data sets that depict the extent and location of past logging activities in a watershed (i.e., portion of streams logged, portion of fish-bearing streams logged, stream banks logged on slopes greater than 60%, and peak flow index). The Porter et al. (2013) methodology used for this analysis involves an amalgamation of all provincial government forestry information available at the time of analysis (i.e., Vegetation Resource Inventory, RESULTS, Forest Tenures Roads layers). Even with this amalgamation of forestry information, several field assessments have shown it to under-represent the total extent of harvesting within some tenures (e.g., Tree Farm Licensees) and historic harvesting generally, especially with increasing age (L. Reese-Hansen, Habitat Management Branch, B.C. Ministry of Forests, Lands and Natural Resource Operations, pers. comm. February, 2013).
Although a significant improvement to the Vegetation Resource Inventory-based information used in the current WSE Tier I protocol, these shortcomings also apply to the province’s newly available Consolidated Cut Blocks GIS layer, which brings together the same VRI, RESULTS, and FTEN information used in the current WSE Tier I protocol, but also supplements these data with LANDSAT satellite imagery analysis identifying additional logging activities outside the currently defined cutblock boundaries. This layer provides a more accurate base for future assessments of logging-related Tier I habitat indicators, but the supplemental information from the LANDSAT imagery analysis only extends back to 2000 (Ann Morrison, Forest Inventory and Analysis Branch, B.C. Ministry of Forests, Lands and Natural Resource Operations, pers. comm., May 2014). An initial review of this layer indicates that in some watersheds a considerable amount of historic logging occurred before 2000 and therefore remains unidentified (L. Reese-Hansen, Habitat Management Branch, B.C. Ministry of Forests, Lands and Natural Resource Operations, pers. comm., May 2014).
Road-related mass wasting can have a significant impact on fish habitat. Because provincial-scale mapping of terrain stability is not currently available, unstable slopes
within our analyses (i.e., for calculating the habitat indicator “road density on unstable slopes”) were defined using a coarse surrogate of terrain stability (i.e., slopes > 60%). Consequently, an inherent amount of uncertainty exists in the assessment of this indicator and it serves only as a coarse indication of road-related mass wasting risk.
Given the broad-brush nature of our analysis, the peak flow index indicator was determined by employing an unweighted equivalent clearcut area calculation across all watersheds. This provides a quick, repeatable index that may be further refined locally if forest alteration in various elevational zones (e.g., rain-on-snow zones) was determined to have a greater influence on peak flows. Watersheds that are contained entirely or partially within tree farm licence areas presented data challenges because VRI information is either not currently available or exists for only a portion of these watersheds. If VRI data was available across at least 50% of a watershed’s total area, an assessment of an unweighted equivalent clearcut area and peak flow index was conducted based on the existing VRI data. Extrapolation from a subset of VRI data to an entire watershed introduces greater uncertainty to the calculation of a final peak flow index. Improving the currency and completion of a contiguous provincial VRI coverage to avoid “work-arounds” of this type will improve the accuracy of future peak flow calculations.
The analytical proficiency of modern GIS spatial tools is easily capable of the type of analysis conducted in this WSE Tier I evaluation. The limitations to this type of analysis exist primarily with the base data. Despite the various uncertainties inherent in current databases and GIS layers supporting watershed status evaluation Tier I assessments, the survey results and interpretations presented here are a good first step toward the development of more consistent and regularly repeated evaluations of broad habitat pressures acting across provincial FSWs. This assessment has helped to identify gaps in underlying data requirements and has flagged several priority needs for improvement.
Although known or suspected inaccuracies in Tier I indicator results are associated with the supporting GIS base data, this form of analysis still provides important and useful information to managers, decision makers, and other analysts. For example, an under-representation of many indicators (e.g., stream crossing, road density, or extent of logging) likely results in a lower risk rating than is warranted. Therefore, the watersheds identified

R E P O R T # 3 9
25Northern Interior Forest Region: Analysis Of Stand-Level Biodiversity Sampling Results In Six Predominant Biogeoclimatic Subzones
with habitat indicators categorized with a high risk rating are potentially at an even higher risk. More problematic, however, is that watersheds in the low-risk category may face more severe habitat pressures than is reflected through the currently available data. This outcome is not unique to this type of analysis and is an important factor in any analysis using the GIS data sets discussed above.
4.2 Recommendations
To improve the utility of future watershed status evaluation Tier I assessment, and other GIS-based forms of analysis, we make the following recommendations.
1. as a high government priority, improve critical gis data layers
Given the accelerating pace of development in various parts of the province, and the utility of the methods described here, we recommend that provincial resource management agencies place a high priority on improving the accuracy, comprehensiveness, and reporting frequency of the underlying data sets and GIS-based information needed to inform WSE Tier I watershed monitoring indicators.
2. expand the number of primary indicators
Consistent with the legacy of the province’s original watershed assessment procedures (B.C. Ministry of Forests 1995a, 1995b), the focus of the current WSE
Tier I monitoring protocol is on forestry-related impacts within watersheds. Although many of these indicators are suitable for “cumulative effects” analysis, we recommend an expansion of the current list of measured indicators to include more possible stressors to fish habitat and water values.
3. increase the frequency of field-based tier ii watershed condition assessments
A GIS analysis of watershed indicators can yield useful information about potential pressures or risks linked to development activities. Nevertheless, not all roads are built equally—a single kilometre of poorly built road may have a higher impact on fish habitat than many kilometres of well-built road. Accordingly, GIS measures alone do not reveal information about current, on-the-ground conditions. We therefore recommend the use of WSE Tier I monitoring as an overview analysis that will help highlight those areas in need of field-based Tier II analysis.
4. adopt and improve watershed status evaluation tier i monitoring
Regardless of the deficiencies discussed here, WSE Tier I risk analysis provides useful information about risks to watershed condition. We recommend the continued use of the current WSE Tier I protocol as a tool for the efficient and repeatable monitoring of watersheds across British Columbia.

26 Northern Interior Forest Region: Analysis Of Stand-Level Biodiversity Sampling Results In Six Predominant Biogeoclimatic Subzones
R E P O R T # 3 9
literature Cited
B.C. Ministry of Forests. 1995a. Interior watershed assessment procedure guidebook. Forest Practices Code of British Columbia guidebook. http://www.for.gov.bc.ca/tasb/legsregs/fpc/fpcguide/iwap/iwap-toc.htm (Accessed April 2015).
_______. 1995b. Coastal watershed assessment procedure guidebook (CWAP). Forest Practices Code of British Columbia guidebook. http://www.for.gov.bc.ca/tasb/legsregs/fpc/fpcguide/iwap/iwap-toc.htm (Accessed April 2015).
_______. 1999. Watershed assessment procedure guidebook. 2nd ed., Version 2.1. Forest Practices Branch, Victoria, B.C. Forest Practices Code of British Columbia guidebook. https://www.for.gov.bc.ca/tasb/legsregs/fpc/fpcguide/wap/WAPGdbk-Web.pdf (Accessed April 2015).
Mount, C., S. Norris, R. Thompson, and D. Tesch. 2011. GIS modelling of fish habitat and road crossings for prioritizing of culvert assessment and remediation. Streamline Watershed Management Bulletin 14(2):7–13. http://www.forrex.org/sites/default/files/publications/articles/Streamline_Vol14_No2_art2.pdf (Accessed April 2015).
Ogborne, C. and B. Hlasny. 2014. The BC Resource Roads Integration Program: Adding ‘missing resource roads’ to the provincial corporate database. In: Resource roads
in British Columbia: Environmental challenges at the landscape level. Columbia Mountain Institute of Applied Biology, Revelstoke, B.C. pp. 102–109. http://cmiae.org/wp-content/uploads/Resource-Roads-conference-2014-summary_FINAL_3.pdf (Accessed April 2015).
Pickard, D., M. Porter, L. Reese-Hansen, R. Thompson, D. Tripp, B. Carson, P. Tschaplinski, T. Larden, and S. Casley. 2014. Fish values: Watershed status evaluation. B.C. Ministry of Forests, Lands and Natural Resource Operations and B.C. Ministry of the Environment, Victoria, B.C. Draft Version 1.0. https://www.for.gov.bc.ca/hfp/frep/values/watersheds/140402%20WSE%20Protocol%20April%2002_14.pdf (Accessed April 2015).
Porter, M., S. Casley, Darcy Pickard, E. Snead, and K. Wieckowski. 2013. Tier I watershed status evaluation protocol. B.C. Ministry of Forests, Lands and Natural Resource Operations and B.C. Ministry of the Environment, Victoria, B.C. Draft Version 3.1. https://www.for.gov.bc.ca/hfp/frep/values/watersheds/Tier%201%20watershed%20values%20monitoring%20protocol_V3.2_May24_2013.pdf (Accessed April 2015).
Reese-Hansen, L. and E. Parkinson. 2006. Evaluating and designating Fisheries Sensitive Watersheds: An overview of B.C.’s new FSW procedure. B.C. Ministry of Environment, Victoria, B.C. Draft. http://www.env.gov.bc.ca/wld/documents/fsw/FSW%202006%20Information%20Paper%20v1.1.pdf (Accessed April 2015).

R E P O R T # 3 9
27Northern Interior Forest Region: Analysis Of Stand-Level Biodiversity Sampling Results In Six Predominant Biogeoclimatic Subzones
aPPendiCes
Appendix 1. Attribute information for 71 provincial fisheries sensitive watersheds (designated, candidate, and proposed) assessed using watershed status evaluation Tier I protocols.11,12
Watershed name Watershed identifier # area (km2) natural resource region regulatory status
MacKay River 38 143.7 Cariboo Candidate
McKinley Creek 43 453.5 Cariboo Candidate
Moffat Creek 46 552.6 Cariboo Candidate
Seller Creek 57 89.0 Cariboo Candidate
Woodjam Creek 70 91.7 Cariboo Candidate
Akolkolex River 1 390.1 Kootenay–Boundary Proposed
Caribou Creek 8 529.1 Kootenay–Boundary Proposed
Crawford Creek 13 187.2 Kootenay–Boundary Proposed
Kaslo River 32 450.8 Kootenay–Boundary Proposed
Palliser River 51 428.1 Kootenay–Boundary Designated
Sutherland Creek 64 93.2 Kootenay–Boundary Candidate
Chehischic Creek 10 193.5 Omineca Candidate
Duncan Creek 17 77.5 Omineca Candidate
Framstead Creek 24 465.6 Omineca Candidate
Seebach Creek 56 414.8 Omineca Candidate
Goat River 25 472.6 Omineca Candidate
Milk River 45 189.6 Omineca Candidate
Anweiler River 3 116.6 Skeena (coastal) Candidate
Cecil Creek 9 66.9 Skeena (coastal) Candidate
Cumming Creek 14 30.7 Skeena (interior) Designated
Five Mile Creek 23 44.2 Skeena (interior) Designated
Gramaphone Creek 27 60.9 Skeena (interior) Designated
Jonas Creek 31 13.5 Skeena (interior) Designated
Lamprey Creek 35 240.2 Skeena (interior) Candidate
McKay Creek 42 139.9 Skeena (coastal) Candidate
Nalbeelah Creek 48 51.8 Skeena (coastal) Candidate
Owen Creek 50 212.4 Skeena (interior) Candidate
Pierre Creek 53 93.1 Skeena (interior) Candidate
Toboggan Creek 65 110.5 Skeena (interior) Designated
Unnamed Tributary 67 72.7 Skeena (coastal) Candidate
Birkenhead River 7 685.2 South Coast Proposed
Filer Creek 22 565.5 South Coast Proposed
11 This list represents watersheds that are either currently designated as fisheries sensitive watersheds, candidates for designation, or are known high-priority “proposed” watersheds with the requisite fish values and sensitivity. This list does not represent a complete list of all potential FSWs in the province.
12 For this analysis, FSWs in the Skeena Natural Resource Region have been separated into coastal versus interior watersheds based on their location; this reflects the markedly different biogeoclimatic zones across this region.

28 Northern Interior Forest Region: Analysis Of Stand-Level Biodiversity Sampling Results In Six Predominant Biogeoclimatic Subzones
R E P O R T # 3 9
Watershed name Watershed identifier # area (km2) natural resource region regulatory status
Klite River 34 128.4 South Coast Proposed
Little Toba River 37 306.5 South Coast Proposed
Orford River 49 423.0 South Coast Proposed
Shovelnose Creek 60 18.6 South Coast Proposed
Anstey River 2 232.1 Thompson–Okanagan Designated
Bessette Creek 6 554.5 Thompson–Okanagan Designated
Cherry Creek 11 508.4 Thompson–Okanagan Designated
Chute Creek 12 47.1 Thompson–Okanagan Designated
Eagle Creek 18 344.3 Thompson–Okanagan Designated
Fennell Creek 21 111.6 Thompson–Okanagan Proposed
Harper Creek 28 185.6 Thompson–Okanagan Proposed
Lemieux Creek 36 537.2 Thompson–Okanagan Proposed
Perry River 52 436.3 Thompson–Okanagan Designated
Saskum 54 215.5 Thompson–Okanagan Proposed
Scotch Creek 55 588.1 Thompson–Okanagan Designated
Seymour River 58 709.5 Thompson–Okanagan Designated
Shorts Creek 59 155.6 Thompson–Okanagan Designated
Upper Shuswap River 61 597.6 Thompson–Okanagan Designated
Sinmax Creek 62 193.2 Thompson–Okanagan Proposed
Sitkum Creek 63 101.7 Thompson–Okanagan Designated
Vaseux Creek 68 280.7 Thompson–Okanagan Designated
Wap Creek 69 357.9 Thompson–Okanagan Designated
Yard Creek 71 120.6 Thompson–Okanagan Designated
Artlish River 4 124.5 West Coast Designated
Awun River 5 72.2 West Coast Candidate
Davidson Creek 15 118.6 West Coast Candidate
Deena Creek 16 67.5 West Coast Candidate
Effingham River 19 60.5 West Coast Designated
Escalante River 20 79.0 West Coast Designated
Gordon River 26 307.7 West Coast Designated
Hatton Creek 29 42.1 West Coast Designated
Hemmingsen Creek 30 62.8 West Coast Designated
Klanawa River 33 242.3 West Coast Designated
Macktush Creek 39 28.1 West Coast Designated
Mamin River 40 145.5 West Coast Candidate
Mathers Creek 41 80.0 West Coast Candidate
Memekay River 44 214.4 West Coast Designated
Nahmint River 47 94.2 West Coast Designated
Toquart River 66 102.1 West Coast Designated

R E P O R T # 3 9
29Northern Interior Forest Region: Analysis Of Stand-Level Biodiversity Sampling Results In Six Predominant Biogeoclimatic Subzones
Appe
ndix
2.
Addi
tion
al s
tati
stic
s fo
r GI
S-de
rive
d ha
bita
t in
dica
tors
in 7
1 fis
heri
es s
ensi
tive
wat
ersh
eds
(des
igna
ted,
can
dida
te, a
nd p
ropo
sed)
acr
oss
prov
inci
al m
anag
emen
t re
gion
s.13
Wat
ersh
ed
nam
est
atus
regi
on
code
regi
on
vege
tati
on
reso
urce
in
vent
ory
unre
port
ed
(%)
ripa
rian
fo
rest
di
stur
bed
(%)
fore
stry
di
stur
bed
ripa
rian
(%
)
alie
nate
d di
stur
bed
ripa
rian
(%
)
mPB
(B
eetl
e)
dist
urbe
d ri
pari
an
(%)
fire
di
stur
bed
ripa
rian
(%
)
tota
l eq
uiva
lent
cl
earc
ut
area
(%
)
equi
vale
nt
clea
rcut
ar
ea f
rom
de
velo
ped
land
(%
)
equi
vale
nt
clea
rcut
ar
ea f
rom
fo
rest
ry
(%)
Akol
kole
x Ri
ver
Prop
osed
2Ko
oten
ay–
Boun
dary
0.04
43.0
942
.30
0.16
0.00
0.63
3.97
0.24
3.73
Anst
ey R
iver
Desi
gnat
ed6
Thom
pson
–Ok
anag
an0.
0012
.07
5.74
0.71
1.02
4.60
14.4
54.
2210
.23
Anw
eile
r Ri
ver
Cand
idat
e4
Skee
na
Coas
tal
7.89
3.15
2.89
0.23
0.00
0.03
5.10
0.37
4.32
Artl
ish
Rive
rDe
sign
ated
7W
est
Coas
t0.
1576
.33
75.0
51.
280.
000.
0010
.71
1.27
9.43
Awun
Riv
erCa
ndid
ate
7W
est
Coas
t92
.76
4.46
4.07
0.39
0.00
0.00
null
null
2.75
Bess
ette
Cre
ekDe
sign
ated
6Th
omps
on–
Okan
agan
0.00
36.6
011
.04
2.72
19.5
13.
3414
.22
2.72
11.5
0
Birk
enhe
ad
Rive
rPr
opos
ed5
Sout
h Co
ast
0.00
10.8
70.
540.
406.
363.
562.
390.
441.
96
Cari
bou
Cree
kPr
opos
ed2
Koot
enay
–Bo
unda
ry50
.25
17.5
72.
210.
718.
546.
11nu
llnu
ll5.
35
Ceci
l Cre
ekCa
ndid
ate
4Sk
eena
Co
asta
l24
.25
3.82
0.00
1.94
0.27
1.61
4.55
2.51
0.93
Cheh
isch
ic
Cree
kCa
ndid
ate
3Om
inec
a0.
0071
.65
32.4
11.
8136
.32
1.11
30.4
01.
7728
.63
Cher
ry C
reek
Desi
gnat
ed6
Thom
pson
–Ok
anag
an0.
1024
.02
2.57
1.34
14.8
15.
2910
.53
1.53
8.99
Chut
e Cr
eek
Desi
gnat
ed6
Thom
pson
–Ok
anag
an0.
0069
.81
3.42
2.20
5.24
58.9
533
.76
1.91
31.8
4
Craw
ford
Cre
ekPr
opos
ed2
Koot
enay
–Bo
unda
ry0.
0012
.23
0.00
1.14
3.71
7.38
5.17
1.08
4.10
Cum
min
g Cr
eek
Desi
gnat
ed4
Skee
na0.
0023
.58
4.86
0.89
17.8
30.
0015
.93
0.98
14.9
5Da
vids
on C
reek
Cand
idat
e7
Wes
t Co
ast
0.00
8.56
7.82
0.74
0.00
0.00
17.5
30.
8616
.67
Deen
a Cr
eek
Cand
idat
e7
Wes
t Co
ast
99.9
74.
481.
481.
510.
001.
49nu
llnu
ll0.
19Du
ncan
Cre
ekCa
ndid
ate
3Om
inec
a0.
0046
.43
0.75
1.10
37.8
16.
766.
661.
065.
60
Eagl
e Cr
eek
Desi
gnat
ed6
Thom
pson
–Ok
anag
an0.
0112
.16
1.53
1.17
0.08
9.37
8.15
2.77
5.38
Effin
gham
Riv
erDe
sign
ated
7W
est
Coas
t0.
091.
831.
460.
360.
000.
002.
780.
272.
51Es
cala
nte
Rive
rDe
sign
ated
7W
est
Coas
t29
.08
17.7
414
.98
1.81
0.00
0.95
18.3
21.
6811
.31
Fenn
ell C
reek
Prop
osed
6Th
omps
on–
Okan
agan
2.64
46.5
35.
121.
3322
.52
17.5
519
.40
4.43
14.4
6
File
r Cr
eek
Prop
osed
5So
uth
Coas
t99
.21
2.01
0.62
0.01
0.00
1.38
null
null
0.00
Five
Mile
Cre
ekDe
sign
ated
4Sk
eena
0.00
35.7
43.
600.
818.
8222
.51
12.5
30.
9911
.54
13
Yello
w h
ighl
ight
s re
pres
ent
FSW
s w
ith
a la
rge
prop
orti
on (
> 50
%)
of t
otal
are
a la
ckin
g Ve
geta
tion
Res
ourc
e In
vent
ory
repo
rtin
g an
d fo
r w
hich
equ
ival
ent
clea
rcut
are
a w
as n
ot c
alcu
late
d (i
ndic
ated
by
“nul
l”).

R E P O R T # 3 9
3030 Northern Interior Forest Region: Analysis Of Stand-Level Biodiversity Sampling Results In Six Predominant Biogeoclimatic Subzones
Wat
ersh
ed
nam
est
atus
regi
on
code
regi
on
vege
tati
on
reso
urce
in
vent
ory
unre
port
ed
(%)
ripa
rian
fo
rest
di
stur
bed
(%)
fore
stry
di
stur
bed
ripa
rian
(%
)
alie
nate
d di
stur
bed
ripa
rian
(%
)
mPB
(B
eetl
e)
dist
urbe
d ri
pari
an
(%)
fire
di
stur
bed
ripa
rian
(%
)
tota
l eq
uiva
lent
cl
earc
ut
area
(%
)
equi
vale
nt
clea
rcut
ar
ea f
rom
de
velo
ped
land
(%
)
equi
vale
nt
clea
rcut
ar
ea f
rom
fo
rest
ry
(%)
Fram
stea
d Cr
eek
Cand
idat
e3
Omin
eca
0.00
5.54
4.91
0.13
0.13
0.38
2.45
0.09
2.35
Goat
Riv
erCa
ndid
ate
3Om
inec
a0.
004.
580.
120.
390.
443.
633.
910.
783.
13Go
rdon
Riv
erDe
sign
ated
7W
est
Coas
t29
.80
19.0
62.
112.
340.
0014
.61
8.10
2.52
3.16
Gram
apho
ne
Cree
kDe
sign
ated
4Sk
eena
0.00
41.8
411
.17
0.97
29.7
10.
0013
.52
1.28
12.2
4
Har
per
Cree
kPr
opos
ed6
Thom
pson
–Ok
anag
an0.
0036
.21
1.31
0.86
1.07
32.9
616
.92
1.65
15.2
6
Hat
ton
Cree
kDe
sign
ated
7W
est
Coas
t52
.38
7.74
6.10
1.64
0.00
0.00
null
null
7.02
Hem
min
gsen
Cr
eek
Desi
gnat
ed7
Wes
t Co
ast
1.20
9.76
5.18
1.73
0.00
2.85
14.7
510
.46
4.11
Jona
s Cr
eek
Desi
gnat
ed4
Skee
na0.
0036
.65
15.0
82.
1116
.87
2.59
30.1
42.
0028
.14
Kasl
o Ri
ver
Prop
osed
2Ko
oten
ay–
Boun
dary
0.00
25.0
80.
791.
043.
4819
.77
5.27
0.97
4.30
Klan
awa
Rive
rDe
sign
ated
7W
est
Coas
t98
.06
12.4
211
.18
1.24
0.00
0.00
null
null
3.84
Klit
e Ri
ver
Prop
osed
5So
uth
Coas
t0.
5120
.36
0.00
0.06
0.00
20.3
00.
300.
040.
26La
mpr
ey C
reek
Cand
idat
e4
Skee
na0.
0057
.99
15.9
81.
0539
.03
1.93
37.9
11.
0136
.90
Lem
ieux
Cre
ekPr
opos
ed6
Thom
pson
–Ok
anag
an0.
4064
.93
11.0
42.
3750
.94
0.58
16.9
42.
2414
.63
Litt
le T
oba
Rive
rPr
opos
ed5
Sout
h Co
ast
99.8
31.
410.
000.
130.
001.
28nu
llnu
ll10
.40
Mac
Kay
Rive
rCa
ndid
ate
1Ca
ribo
o0.
0012
.25
1.28
0.78
9.95
0.25
12.3
81.
1611
.23
Mac
ktus
h Cr
eek
Desi
gnat
ed7
Wes
t Co
ast
99.8
24.
130.
111.
850.
002.
17nu
llnu
ll25
.72
Mam
in R
iver
Cand
idat
e7
Wes
t Co
ast
98.8
14.
993.
361.
640.
000.
00nu
llnu
ll0.
90M
athe
rs C
reek
Cand
idat
e7
Wes
t Co
ast
100.
002.
091.
700.
380.
000.
00nu
llnu
ll17
.58
McK
ay C
reek
Cand
idat
e4
Skee
na
Coas
tal
100.
004.
514.
380.
130.
000.
00nu
llnu
ll0.
00
McK
inle
y Cr
eek
Cand
idat
e1
Cari
boo
0.00
35.7
54.
530.
9221
.42
8.88
19.8
82.
3017
.58
Mem
ekay
Riv
erDe
sign
ated
7W
est
Coas
t98
.51
10.3
28.
641.
440.
000.
23nu
llnu
ll1.
95M
ilk R
iver
Cand
idat
e3
Omin
eca
0.00
4.52
0.79
1.93
0.00
1.80
11.9
21.
5210
.40
Mof
fat
Cree
kCa
ndid
ate
1Ca
ribo
o0.
0064
.28
14.4
71.
2046
.60
2.01
27.7
32.
0125
.72
Nahm
int
Rive
rDe
sign
ated
7W
est
Coas
t98
.42
3.22
2.60
0.62
0.00
0.00
null
null
15.4
4Na
lbee
lah
Cree
kCa
ndid
ate
4Sk
eena
Co
asta
l65
.13
5.01
1.92
1.28
0.00
1.82
null
null
21.1
0
Orfo
rd R
iver
Prop
osed
5So
uth
Coas
t0.
096.
170.
630.
370.
005.
162.
230.
281.
95Ow
en C
reek
Cand
idat
e4
Skee
na0.
0055
.58
2.81
1.81
38.0
312
.93
16.6
81.
2415
.44
Palli
ser
Rive
rDe
sign
ated
2Ko
oten
ay–
Boun
dary
0.00
19.6
61.
360.
2715
.03
3.01
4.21
0.37
3.84
Perr
y Ri
ver
Desi
gnat
ed6
Thom
pson
–Ok
anag
an0.
0026
.52
1.47
0.52
0.00
24.5
36.
962.
414.
55
Pier
re C
reek
Cand
idat
e4
Skee
na0.
0045
.17
1.16
0.08
14.9
329
.01
2.87
0.13
2.75

R E P O R T # 3 9
31Northern Interior Forest Region: Analysis Of Stand-Level Biodiversity Sampling Results In Six Predominant Biogeoclimatic Subzones
Wat
ersh
ed
nam
est
atus
regi
on
code
regi
on
vege
tati
on
reso
urce
in
vent
ory
unre
port
ed
(%)
ripa
rian
fo
rest
di
stur
bed
(%)
fore
stry
di
stur
bed
ripa
rian
(%
)
alie
nate
d di
stur
bed
ripa
rian
(%
)
mPB
(B
eetl
e)
dist
urbe
d ri
pari
an
(%)
fire
di
stur
bed
ripa
rian
(%
)
tota
l eq
uiva
lent
cl
earc
ut
area
(%
)
equi
vale
nt
clea
rcut
ar
ea f
rom
de
velo
ped
land
(%
)
equi
vale
nt
clea
rcut
ar
ea f
rom
fo
rest
ry
(%)
Sask
umPr
opos
ed6
Thom
pson
–Ok
anag
an0.
4440
.81
4.61
0.96
11.3
323
.92
23.9
42.
7321
.10
Scot
ch C
reek
Desi
gnat
ed6
Thom
pson
–Ok
anag
an0.
0027
.47
4.05
1.13
1.53
20.7
612
.31
1.28
11.0
3
Seeb
ach
Cree
kCa
ndid
ate
3Om
inec
a97
.27
3.42
2.18
0.78
0.01
0.45
null
null
4.55
Selle
r Cr
eek
Cand
idat
e1
Cari
boo
0.00
61.4
02.
230.
6258
.53
0.03
8.17
0.96
7.20
Seym
our
Rive
rDe
sign
ated
6Th
omps
on–
Okan
agan
0.00
14.0
02.
440.
630.
0510
.89
9.21
1.48
7.73
Shor
ts C
reek
Desi
gnat
ed6
Thom
pson
–Ok
anag
an0.
1254
.93
18.4
22.
1722
.98
11.3
628
.60
2.02
26.5
5
Shov
elno
se
Cree
kPr
opos
ed5
Sout
h Co
ast
21.2
20.
650.
440.
210.
000.
000.
200.
160.
00
Sinm
ax C
reek
Prop
osed
6Th
omps
on–
Okan
agan
0.00
36.0
87.
162.
2818
.28
8.36
24.5
92.
3722
.22
Sitk
um C
reek
Desi
gnat
ed6
Thom
pson
–Ok
anag
an0.
2553
.65
0.00
0.27
0.22
53.1
61.
330.
311.
02
Suth
erla
nd
Cree
kCa
ndid
ate
2Ko
oten
ay–
Boun
dary
0.00
49.6
43.
634.
8322
.02
19.1
58.
202.
765.
43
Tobo
ggan
Cre
ekDe
sign
ated
4Sk
eena
0.00
18.9
92.
340.
853.
9311
.87
4.88
1.01
3.87
Toqu
art
Rive
rDe
sign
ated
7W
est
Coas
t0.
513.
813.
300.
510.
000.
008.
310.
597.
68U
nnam
ed
Trib
utar
yCa
ndid
ate
4Sk
eena
Co
asta
l0.
053.
523.
080.
440.
000.
004.
040.
483.
56
Upp
er S
husw
ap
Rive
rDe
sign
ated
6Th
omps
on–
Okan
agan
0.31
22.8
61.
620.
350.
6520
.25
5.49
0.46
5.01
Vase
ux C
reek
Desi
gnat
ed6
Thom
pson
–Ok
anag
an0.
1485
.77
9.43
2.33
0.91
73.1
119
.11
1.73
17.3
5
Wap
Cre
ekDe
sign
ated
6Th
omps
on–
Okan
agan
0.05
8.46
1.69
0.64
0.97
5.16
9.50
2.88
6.61
Woo
djam
Cre
ekCa
ndid
ate
1Ca
ribo
o0.
1273
.71
8.89
0.98
61.7
12.
1225
.26
7.44
17.7
9
Yard
Cre
ekDe
sign
ated
6Th
omps
on–
Okan
agan
0.00
9.29
0.81
0.92
6.80
0.76
13.0
01.
0911
.91

32 Northern Interior Forest Region: Analysis Of Stand-Level Biodiversity Sampling Results In Six Predominant Biogeoclimatic Subzones
R E P O R T # 3 9Ap
pend
ix 3
. H
abit
at r
isk
rati
ngs
(gre
en =
low
ris
k, a
mbe
r =
mod
erat
e ri
sk, r
ed =
hig
h ri
sk)
for
WSE
Tie
r I
habi
tat
indi
cato
rs o
ver
71 fi
sher
ies
sens
itiv
e w
ater
shed
s (d
esig
nate
d, c
andi
date
, and
pro
pose
d) in
eac
h pr
ovin
cial
nat
ural
res
ourc
e re
gion
.14
Cari
boo
nat
ural
res
ourc
e re
gion
Wat
ersh
ed
nam
est
atus
road
den
sity
fo
r en
tire
fs
W (
km/
km2 )
road
den
sity
ab
ove
h
60 li
ne
(km
/km
2 )
road
den
sity
<
100
m f
rom
st
ream
(km
/km
2 )
stre
am
cros
sing
de
nsit
y (#
/km
2 )
Port
ion
of
stre
ams
logg
ed (
km/
km)
Port
ion
of
fish-
bear
ing
stre
ams
logg
ed (
km/
km)
stre
am b
anks
lo
gged
on
slop
es
> 60
% (
km/
km2 )
Peak
flow
in
dex
(unw
eigh
ted)
road
den
sity
on
uns
tabl
e sl
opes
(km
/km
2 )
Mac
Kay
Rive
rCa
ndid
ate
1.27
0.09
0.32
0.84
0.10
0.07
0.09
0.12
0.07
McK
inle
y Cr
eek
Cand
idat
e1.
500.
720.
280.
620.
190.
170.
220.
190.
01M
offa
t Cr
eek
Cand
idat
e2.
291.
320.
450.
860.
180.
180.
490.
280.
00Se
ller
Cree
kCa
ndid
ate
1.08
0.18
0.17
0.46
0.17
0.12
0.50
0.08
0.02
Woo
djam
Cre
ekCa
ndid
ate
1.58
0.82
0.39
0.83
0.16
0.17
0.14
0.22
0.00
koot
enay
–Bou
ndar
y n
atur
al r
esou
rce
regi
on
Wat
ersh
ed
nam
est
atus
road
den
sity
fo
r en
tire
fs
W (
km/
km2 )
road
den
sity
ab
ove
h
60 li
ne
(km
/km
2 )
road
den
sity
<
100
m f
rom
st
ream
(km
/km
2 )
stre
am
cros
sing
de
nsit
y (#
/km
2 )
Port
ion
of
stre
ams
logg
ed (
km/
km)
Port
ion
of
fish-
bear
ing
stre
ams
logg
ed (
km/
km)
stre
am b
anks
lo
gged
on
slop
es
> 60
% (
km/
km2 )
Peak
flow
in
dex
(unw
eigh
ted)
road
den
sity
on
uns
tabl
e sl
opes
(km
/km
2 )
Akol
kole
x Ri
ver
Prop
osed
0.40
0.02
0.10
0.26
0.42
0.07
0.95
0.04
0.06
Cari
bou
Cree
kPr
opos
ed1.
080.
290.
501.
740.
060.
030.
13nu
ll0.
12Cr
awfo
rd C
reek
Prop
osed
1.14
0.24
0.36
0.87
0.18
0.07
0.27
0.05
0.15
Kasl
o Ri
ver
Prop
osed
1.01
0.17
0.38
0.88
0.05
0.02
0.08
0.05
0.13
Palli
ser
Rive
rDe
sign
ated
0.47
0.01
0.14
0.41
0.04
0.03
0.08
0.04
0.02
Suth
erla
nd
Cree
kCa
ndid
ate
2.11
1.16
0.75
1.07
0.11
0.08
0.37
0.08
0.05
14
See
Port
er e
t al
. (2
013)
for
ben
chm
ark
valu
es u
sed
to a
ssig
n st
atus
of
each
hab
itat
indi
cato
r. B
ench
mar
k va
lues
for
som
e ha
bita
t in
dica
tors
var
y by
reg
ion
(i.e
., c
oast
al v
s. in
teri
or w
ater
shed
s).
A pe
ak fl
ow in
dex
(unw
eigh
ted)
val
ue w
as n
ot c
alcu
late
d if
mor
e th
an 5
0% o
f th
e w
ater
shed
are
a la
cked
Veg
etat
ion
Reso
urce
Inv
ento
ry r
epor
ting
(in
dica
ted
by “
null”
).

R E P O R T # 3 9
33Northern Interior Forest Region: Analysis Of Stand-Level Biodiversity Sampling Results In Six Predominant Biogeoclimatic Subzones
omin
eca
nat
ural
res
ourc
e re
gion
Wat
ersh
ed
nam
est
atus
road
den
sity
fo
r en
tire
fs
W (
km/
km2 )
road
den
sity
ab
ove
h
60 li
ne
(km
/km
2 )
road
den
sity
<
100
m f
rom
st
ream
(km
/km
2 )
stre
am
cros
sing
de
nsit
y (#
/km
2 )
Port
ion
of
stre
ams
logg
ed (
km/
km)
Port
ion
of
fish-
bear
ing
stre
ams
logg
ed (
km/
km)
stre
am b
anks
lo
gged
on
slop
es
> 60
% (
km/
km2 )
Peak
flow
in
dex
(unw
eigh
ted)
road
den
sity
on
uns
tabl
e sl
opes
(km
/km
2 )
Cheh
isch
ic
Cree
kCa
ndid
ate
1.90
1.15
0.96
1.88
0.56
0.56
0.00
0.30
0.00
Dunc
an C
reek
Cand
idat
e1.
200.
460.
521.
170.
110.
111.
530.
070.
00Fr
amst
ead
Cree
kCa
ndid
ate
0.15
0.00
0.09
0.33
0.04
0.03
0.02
0.02
0.00
Goat
Riv
erCa
ndid
ate
0.30
0.01
0.07
0.17
0.01
0.01
0.01
0.04
0.01
Milk
Riv
erCa
ndid
ate
0.82
0.06
0.32
0.93
0.06
0.03
0.08
0.12
0.04
Seeb
ach
Cree
kCa
ndid
ate
0.96
0.47
0.41
1.06
0.06
0.06
0.14
null
0.00
skee
na n
atur
al r
esou
rce
regi
on (
inte
rior
wat
ersh
eds)
Wat
ersh
ed
nam
est
atus
road
den
sity
fo
r en
tire
fs
W (
km/
km2 )
road
den
sity
ab
ove
h
60 li
ne
(km
/km
2 )
road
den
sity
<
100
m f
rom
st
ream
(km
/km
2 )
stre
am
cros
sing
de
nsit
y (#
/km
2 )
Port
ion
of
stre
ams
logg
ed (
km/
km)
Port
ion
of
fish-
bear
ing
stre
ams
logg
ed (
km/
km)
stre
am b
anks
lo
gged
on
slop
es
> 60
% (
km/
km2 )
Peak
flow
in
dex
(unw
eigh
ted)
road
den
sity
on
uns
tabl
e sl
opes
(km
/km
2 )
Cum
min
g Cr
eek
Desi
gnat
ed1.
140.
300.
521.
080.
540.
412.
460.
160.
00Fi
ve M
ile C
reek
Desi
gnat
ed0.
970.
440.
270.
570.
380.
391.
150.
130.
00Gr
amap
hone
Cr
eek
Desi
gnat
ed1.
600.
860.
401.
170.
390.
370.
850.
130.
00
Jona
s Cr
eek
Desi
gnat
ed2.
510.
921.
041.
260.
610.
584.
360.
300.
00La
mpr
ey C
reek
Cand
idat
e1.
140.
490.
350.
780.
360.
360.
040.
380.
00Ow
en C
reek
Cand
idat
e0.
910.
330.
200.
430.
150.
060.
010.
170.
00Pi
erre
Cre
ekCa
ndid
ate
0.16
0.01
0.05
0.14
0.01
0.01
0.00
0.03
0.00
Tobo
ggan
Cre
ekDe
sign
ated
0.99
0.26
0.31
0.62
0.13
0.09
0.16
0.05
0.01

34 Northern Interior Forest Region: Analysis Of Stand-Level Biodiversity Sampling Results In Six Predominant Biogeoclimatic Subzones
R E P O R T # 3 9sk
eena
nat
ural
res
ourc
e re
gion
(co
asta
l wat
ersh
eds)
Wat
ersh
ed
nam
est
atus
road
den
sity
fo
r en
tire
fs
W (
km/
km2 )
road
den
sity
ab
ove
h
60 li
ne
(km
/km
2 )
road
den
sity
<
100
m f
rom
st
ream
(km
/km
2 )
stre
am
cros
sing
de
nsit
y (#
/km
2 )
Port
ion
of
stre
ams
logg
ed (
km/
km)
Port
ion
of
fish-
bear
ing
stre
ams
logg
ed (
km/
km)
stre
am b
anks
lo
gged
on
slop
es
> 60
% (
km/
km2 )
Peak
flow
in
dex
(unw
eigh
ted)
road
den
sity
on
uns
tabl
e sl
opes
(km
/km
2 )
Anw
eile
r Ri
ver
Cand
idat
e0.
43NA
0.10
0.29
0.03
0.02
0.03
0.05
0.04
Ceci
l Cre
ekCa
ndid
ate
2.59
NA0.
590.
640.
060.
060.
000.
050.
00M
cKay
Cre
ekCa
ndid
ate
0.32
NA0.
080.
240.
020.
010.
05nu
ll0.
02Na
lbee
lah
Cree
kCa
ndid
ate
1.52
NA0.
681.
230.
070.
060.
05nu
ll0.
03Unn
amed
Tr
ibut
ary
Cand
idat
e0.
56NA
0.18
0.74
0.15
0.07
0.31
0.04
0.04
sout
h Co
ast
nat
ural
res
ourc
e re
gion
Wat
ersh
ed
nam
est
atus
road
den
sity
fo
r en
tire
fs
W (
km/
km2 )
road
den
sity
ab
ove
h
60 li
ne
(km
/km
2 )
road
den
sity
<
100
m f
rom
st
ream
(km
/km
2 )
stre
am
cros
sing
de
nsit
y (#
/km
2 )
Port
ion
of
stre
ams
logg
ed (
km/
km)
Port
ion
of
fish-
bear
ing
stre
ams
logg
ed (
km/
km)
stre
am b
anks
lo
gged
on
slop
es
> 60
% (
km/
km2 )
Peak
flow
in
dex
(unw
eigh
ted)
road
den
sity
on
uns
tabl
e sl
opes
(km
/km
2 )
Birk
enhe
ad
Rive
rPr
opos
ed0.
41NA
0.18
0.50
0.04
0.01
0.08
0.02
0.01
File
r Cr
eek
Prop
osed
0.01
NA0.
000.
010.
010.
000.
00nu
ll0.
00Kl
ite
Rive
rPr
opos
ed0.
04NA
0.03
0.07
0.03
0.02
0.05
0.00
0.01
Litt
le T
oba
Rive
rPr
opos
ed0.
13NA
0.06
0.18
0.00
0.00
0.00
null
0.01
Orfo
rd R
iver
Prop
osed
0.27
NA0.
130.
470.
060.
020.
100.
020.
05Sh
ovel
nose
Cr
eek
Prop
osed
0.22
NA0.
070.
110.
000.
000.
000.
000.
01

R E P O R T # 3 9
35Northern Interior Forest Region: Analysis Of Stand-Level Biodiversity Sampling Results In Six Predominant Biogeoclimatic Subzones
thom
pson
–oka
naga
n n
atur
al r
esou
rce
regi
on
Wat
ersh
ed
nam
est
atus
road
den
sity
fo
r en
tire
fs
W (
km/
km2 )
road
den
sity
ab
ove
h
60 li
ne
(km
/km
2 )
road
den
sity
<
100
m f
rom
st
ream
(km
/km
2 )
stre
am
cros
sing
de
nsit
y (#
/km
2 )
Port
ion
of
stre
ams
logg
ed (
km/
km)
Port
ion
of
fish-
bear
ing
stre
ams
logg
ed (
km/
km)
stre
am b
anks
lo
gged
on
slop
es
> 60
% (
km/
km2 )
Peak
flow
in
dex
(unw
eigh
ted)
road
den
sity
on
uns
tabl
e sl
opes
(km
/km
2 )
Anst
ey R
iver
Desi
gnat
ed1.
040.
210.
310.
880.
110.
050.
180.
120.
13Be
sset
te C
reek
Desi
gnat
ed2.
681.
290.
621.
140.
160.
150.
110.
140.
03Ch
erry
Cre
ekDe
sign
ated
1.75
0.64
0.49
1.11
0.11
0.06
0.16
0.11
0.10
Chut
e Cr
eek
Desi
gnat
ed2.
290.
800.
460.
790.
400.
382.
020.
340.
00Ea
gle
Cree
kDe
sign
ated
0.86
0.21
0.24
0.51
0.06
0.02
0.07
0.07
0.05
Fenn
ell C
reek
Prop
osed
1.63
0.85
0.70
1.78
0.15
0.08
0.28
0.18
0.05
Har
per
Cree
kPr
opos
ed1.
180.
700.
330.
930.
210.
080.
660.
170.
01Le
mie
ux C
reek
Prop
osed
1.95
1.02
0.82
1.74
0.19
0.16
0.29
0.17
0.01
Perr
y Ri
ver
Desi
gnat
ed0.
780.
110.
200.
490.
070.
030.
050.
070.
07Sa
skum
Prop
osed
1.99
0.97
0.35
0.87
0.17
0.09
0.23
0.23
0.09
Scot
ch C
reek
Desi
gnat
ed1.
410.
610.
300.
700.
170.
090.
330.
120.
03Se
ymou
r Ri
ver
Desi
gnat
ed0.
690.
100.
190.
490.
080.
040.
120.
090.
04Sh
orts
Cre
ekDe
sign
ated
2.56
1.62
0.87
1.89
0.44
0.32
0.11
0.29
0.01
Sinm
ax C
reek
Prop
osed
2.01
1.31
0.51
1.10
0.22
0.12
0.11
0.25
0.03
Sitk
um C
reek
Desi
gnat
ed0.
420.
090.
140.
360.
040.
010.
070.
010.
02Upp
er S
husw
ap
Rive
rDe
sign
ated
0.62
0.21
0.13
0.31
0.08
0.04
0.04
0.05
0.02
Vase
ux C
reek
Desi
gnat
ed1.
881.
030.
520.
940.
220.
220.
140.
190.
00W
ap C
reek
Desi
gnat
ed0.
890.
300.
240.
540.
080.
050.
090.
080.
03Ya
rd C
reek
Desi
gnat
ed1.
120.
390.
230.
360.
060.
040.
090.
130.
04

36 Northern Interior Forest Region: Analysis Of Stand-Level Biodiversity Sampling Results In Six Predominant Biogeoclimatic Subzones
R E P O R T # 3 9W
est
Coas
t n
atur
al r
esou
rce
regi
on
Wat
ersh
ed
nam
est
atus
road
den
sity
fo
r en
tire
fs
W (
km/
km2 )
road
den
sity
ab
ove
h
60 li
ne
(km
/km
2 )
road
den
sity
<
100
m f
rom
st
ream
(km
/km
2 )
stre
am
cros
sing
de
nsit
y (#
/km
2 )
Port
ion
of
stre
ams
logg
ed (
km/
km)
Port
ion
of
fish-
bear
ing
stre
ams
logg
ed (
km/
km)
stre
am b
anks
lo
gged
on
slop
es
> 60
% (
km/
km2 )
Peak
flow
in
dex
(unw
eigh
ted)
road
den
sity
on
uns
tabl
e sl
opes
(km
/km
2 )
Artl
ish
Rive
rDe
sign
ated
1.54
NA0.
581.
480.
720.
241.
400.
110.
11Aw
un R
iver
Cand
idat
e1.
32NA
0.26
0.73
0.05
0.03
0.04
null
0.04
Davi
dson
Cre
ekCa
ndid
ate
1.46
NA0.
471.
440.
380.
291.
030.
170.
02De
ena
Cree
kCa
ndid
ate
1.96
NA0.
992.
620.
010.
000.
03nu
ll0.
06Ef
fingh
am R
iver
Desi
gnat
ed0.
35NA
0.19
0.53
0.20
0.13
0.13
0.03
0.02
Esca
lant
e Ri
ver
Desi
gnat
ed2.
08NA
0.67
1.70
0.46
0.24
0.58
0.18
0.31
Gord
on R
iver
Desi
gnat
ed2.
36NA
1.06
3.04
0.09
0.03
0.29
0.08
0.29
Hat
ton
Cree
kDe
sign
ated
2.34
NA0.
942.
700.
070.
010.
27nu
ll0.
19H
emm
ings
en
Cree
kDe
sign
ated
2.41
NA0.
993.
000.
060.
010.
160.
070.
29
Klan
awa
Rive
rDe
sign
ated
2.64
NA0.
992.
580.
110.
040.
35nu
ll0.
20M
ackt
ush
Cree
kDe
sign
ated
2.53
NA0.
671.
390.
000.
000.
00nu
ll0.
36M
amin
Riv
erCa
ndid
ate
1.98
NA0.
802.
140.
040.
020.
13nu
ll0.
03M
athe
rs C
reek
Cand
idat
e0.
59NA
0.23
0.69
0.01
0.00
0.02
null
0.02
Mem
ekay
Riv
erDe
sign
ated
2.70
NA0.
531.
080.
060.
050.
09nu
ll0.
06Na
hmin
t Ri
ver
Desi
gnat
ed1.
15NA
0.53
1.36
0.03
0.01
0.06
null
0.11
Toqu
art
Rive
rDe
sign
ated
0.82
NA0.
270.
670.
130.
070.
100.
080.
04