Embed Size (px)
Citation preview

Wavelength-agile diode-laser sensing strategiesfor monitoring gas properties in optically harsh
flows: application in cesium-seeded pulsedetonation engine
Scott T. Sanders*, Daniel W. Mattison, Lin Ma, Jay B. Jeffries, and Ronald K. HansonStanford University, Mechanical Engineering Dept., Stanford, CA 94305 USA
*current address: University of Wisconsin – Madison, Mechanical Engineering Dept., Madison, WI 53706 [email protected]
Abstract: The rapid, broad wavelength scanning capabilities of advanceddiode lasers allow extension of traditional diode-laser absorption techniquesto high pressure, transient, and generally hostile environments. Here, wedemonstrate this extension by applying a vertical cavity surface-emittinglaser (VCSEL) to monitor gas temperature and pressure in a pulsedetonation engine (PDE). Using aggressive injection current modulation,the VCSEL is scanned through a 10 cm-1 spectral window at megahertzrates – roughly 10 times the scanning range and 1000 times the scanningrate of a conventional diode laser. The VCSEL probes absorptionlineshapes of the ~ 852 nm D2 transition of atomic Cs, seeded at ~ 5 ppminto the feedstock gases of a PDE. Using these lineshapes, detonated-gastemperature and pressure histories, spanning 2000 – 4000 K and 0.5 – 30atm, respectively, are recorded with microsecond time response. Theincreasing availability of wavelength-agile diode lasers should support thedevelopment of similar sensors for other harsh flows, using other absorberssuch as native H2O.2002 Optical Society of AmericaOCIS codes: (300.6260) Spectroscopy, diode lasers; (300.1030) Absorption; (300.2140)Emission; (300.6210) Spectroscopy, atomic
References and links1. J. Wang, S. T. Sanders, J. B. Jeffries, and R. K. Hanson, “Oxygen measurements at high pressures using
vertical cavity surface-emitting lasers,” Appl. Phys. B. 72, 127-135 (2001).2. S. T. Sanders, J. Wang, J. B. Jeffries, and R. K. Hanson, “Diode-laser absorption sensor for line-of-sight
gas temperature distributions,” Appl. Opt. 40, 4405-4415 (2001).3. S. T. Sanders, D. W. Mattison, J. B. Jeffries, and R. K. Hanson, “Rapid temperature-tuning of a 1.4 µm
diode laser with application to high pressure H2O absorption spectroscopy,” Opt. Lett. 26, 1568-1570(2001).
4. S. T. Sanders, “Diode-laser sensors for harsh environments with application to pulse detonation engines,”Ph.D. Thesis, Stanford University, Stanford, CA (2001), http://vonkarman.stanford.edu/tsd/TSD-142.pdf
5. E. Schlosser, T. Fernholz, H. Teichert, and V. Ebert, “In-situ detection of potassium atoms in high-temperature coal-combustion systems using near-infrared-diode lasers,” Spectrochimica Acta, 2002, (inpress).
6. Z. J. Jabbour, J. Sagle, R. K. Namiotka, and J. Huennekens, “Measurement of the self-broadening ratecoefficients of the cesium resonance lines,” J. Quant. Spectrosc. Radiat. Transfer 54, 767-778 (1995).
7. C. Affolderbach, A. Nagel, S. Knappe, C. Jung, D. Wiedenmann, and R. Wynands, “Nonlinearspectroscopy with a vertical-cavity surface-emitting laser (VCSEL),” Appl. Phys. B. 70, 407-413 (2000).
8. H. Groll and K. Niemax, “Multielement diode laser atomic absorption spectrometry in graphite tubefurnaces and analytical flames,” Spectrochimica Acta 48B, 633-641 (1993).
9. C. J. Chang-Hasnain, “Tunable VCSEL,” IEEE J. Sel. Top. Quantum Electron. 6, 978-987 (2000).10. L. A. Coldren, “Monolithic Tunable Diode Lasers,” IEEE J. Sel. Top. Quantum Electron. 6, 988-999
(2000).
(C) 2002 OSA 17 June 2002 / Vol. 10, No. 12 / OPTICS EXPRESS 505#1118 - $15.00 US Received May 03, 2002; Revised June 13, 2002

11. T. Bussing and G. Pappas, “An introduction to pulse detonation engines,” paper 0263 at the 32nd AIAAAerospace Sciences Meeting, Reno, NV (1994).
12. J. E. Shepherd, F. Pintgen, J. M. Austin, and C. A. Eckett, “The structure of the detonation front in gases,”paper 0773 at the 40th AIAA Aerospace Sciences Meeting and Exhibit, Reno NV, 14-17 January (2002).
13. S. T. Sanders, J. A. Baldwin, T. P. Jenkins, D. S. Baer, and R. K. Hanson, “Diode-Laser Sensor forMonitoring Multiple Combustion Parameters in Pulse Detonation Engines,” Proc. Combust. Inst. 28, 587-594 (2000).
14. S. T. Sanders, D. W. Mattison, J. B. Jeffries, and R. K. Hanson, “Time-of-flight diode-laser velocimeterusing a locally seeded atomic absorber: application in a pulse detonation engine,” (submitted to ShockWaves).
15. B. N. Littleton, A. I. Bishop, T. J. McIntyre, P. F. Barker, H. Rubinsztein-Dunlop, “Flow taggingvelocimetry in a superorbital expansion tube,” Shock Waves 10, 225-228 (2000).
16. S. D. Wehe, “Development of a tunable diode laser probe for measurements in hypervelocity flows,” Ph.D.Thesis, Stanford University, Stanford, CA (2000), http://vonkarman.stanford.edu/tsd/WeheThesis.pdf
17. S. T. Sanders, D. W. Mattison, J. B. Jeffries, and R. K. Hanson, “Sensors for high-pressure, harshcombustion environments using wavlength-agile diode lasers,” Proc. Combust. Inst. 29, (in press, 2002).
18. P. Teulet, J. P. Sarrette, and A. M. Gomes, “Collisional-radiative modeling of one- and two-temperature airand air-sodium plasmas at atmospheric pressure with temperatures of 2000-12000K,” J. Quant. Spectrosc.Radiat. Transfer 70, 159-187 (2000).
19. I. Glassman, Combustion, (Academic Press, 1996), Chap. 5.20. L. Ma, S. T. Sanders, J. B. Jeffries, and R. K. Hanson, “Monitoring and control of a pulse detonation engine
using a diode-laser fuel concentration and temperature sensor,” Proc. Combust. Inst. 29, in press (2002).21. S. T. Sanders, T. P. Jenkins, and R. K. Hanson, “Diode laser sensor system for multi-parameter
measurements in pulse detonation engine flows,” paper #3592 at the 36th Joint Propulsion Conference, July16-19, Huntsville, AL, (2000).
22. K. Kailasanath and G. Patnaik, “Performance estimates of pulsed detonation engines,” Proc. Combust. Inst.28, 595-601 (2000).
23. A. P. Nefedov, V. A. Sinel’shchikov, and A. D. Usachev, “Collisional broadening of the Na-D lines bymolecular gases,” Physica Scripta 59, 432-442 (1999).
Introduction
The benefits of wavelength-agility for diode-laser sensing in high-pressure, nonuniform-temperature, transient, and otherwise harsh environments have been thoroughly detailed [1-4].Recently, demonstrations of wavelength-agile sensing in practical combustion systems (suchas a coal power plant [5]) have emerged. In the present work, measurements in a pulsedetonation engine (PDE), seen as a step toward practical sensing in industrial propulsionsystems, are presented.
Previous work [1,3] has established the superior tunability of selected VCSELs overconventional edge-emitting diode lasers. Here, a VCSEL similar to one scanned through 30cm-1 at 10 kHz repetition rate [1] is scanned through 10 cm-1 at 1 MHz repetition rate. Theslight decrease in scan range is traded for a great increase in scan repetition rate by switchingfrom standard ramp modulation (using a commercial diode laser current source) to direct,square-wave voltage modulation (using a commercial pulse generator). Although this“aggressive” tuning approach removes laser protection circuitry and therefore may increasethe risk of laser failure, it ensures that the laser’s tunability is limited only by its thermalinertia. The high scan repetition rate is needed in this application to provide enhanced sensortime response and immunity to PDE noise.
Atomic cesium, studied extensively in static cells [6-7] and flames [8] using diode lasersensors, was chosen as a tracer species for this work. Native absorbers such as H2O might bepreferable, but VCSELs and advanced wavelength-agile lasers (e.g., c-VCSELs [9], SGDBRlasers [10]) are not yet available at wavelengths necessary to access such species.Furthermore, at the high temperatures (up to ~ 4000 K) produced by PDEs, the absorbance ofmolecular species becomes prohibitively weak due to three effects: partition function (morerotational and vibrational states populated means less population in any one state), numberdensity (decreases as 1/T), and chemical equilibrium (H2O dissociates to OH, H, and O). Ofatomic absorbers, Cs was chosen for its low natural abundance (eliminating the possibility ofunwanted seeding from trace contaminants), simple spectroscopy (a single natural isotope,133Cs, is present in nature) and its low melting point as described below. However, because of
(C) 2002 OSA 17 June 2002 / Vol. 10, No. 12 / OPTICS EXPRESS 506#1118 - $15.00 US Received May 03, 2002; Revised June 13, 2002

other concerns such as toxicity, a variety of other atomics might be considered for futureapplications.
PDEs have received significant attention in recent years, owing to their high theoreticalspecific impulse and few moving parts [11]. Several laser-based PDE studies have beenreported, primarily in the areas of PLIF imaging [12] and diode-laser sensing [13]. The highpressures (up to ~ 30 bar), high temperatures (up to ~ 4000 K), and shock waves generated byPDE flows undermine all but the most robust optical diagnostics. The sensor presented hereovercomes these challenges through wavelength-agility: the laser wavelength scans so rapidlythat all PDE noise sources are effectively frozen while an individual Cs lineshape is recorded[4]. A major aim of the work presented here is to advance PDE development by validatingnumerical detonation simulations and by enabling PDE monitoring and control. The successof wavelength-agile sensors in this role should motivate their use in other harsh-flow sensingapplications.
Experiment
To seed Cs into gas-phase flows, researchers have typically used CsCl aerosols (e.g., saltwatersprayed into a flame [8]) or surface coatings (e.g., saltwater painted onto an intrusive sting[14] or shock tube diaphragm [15]). However, sprays are experimentally messy and can alterflow properties; surface coatings tend to provide nonuniform seeding and can biasmeasurements toward boundary layer regions [4,16]. To circumvent these issues, we used thenovel approach depicted in Fig. 1 to seed Cs rather uniformly – enabling line-of-sight-averaged measurements – into the PDE fill gases. The Stanford PDE facility shown in Fig. 1consists of a stainless steel tube closed at one end and open to a large dump tank at the other.Along with feedstock C2H4 and O2, Cs is seeded into the tube near the closed end from a tankcontaining Cs vapor and argon. During an engine fill, when all three supply-line valves areopened, a relatively weak Ar flow (containing trace Cs vapor) is mixed with the C2H4 / O2 fillgases. The Cs immediately reacts with feedstock oxygen to form CsO particulate in themixing tee. Thus the charge that fills the PDE contains a trace of CsO dust. Duringcombustion, the CsO dissociates to yield a significant fraction of atomic Cs that is probed bythe sensor [14]. The temperature of the Cs tank (and its mixing tee supply line) can beadjusted to optimize the Cs seeding fraction (in this case ~ 5 ppm was achieved at atemperature of ~ 500 K). Cesium is the easiest alkali metal to seed in this way because it hasthe lowest melting point (and the highest vapor pressure at any given temperature). Cesiummetal is typically supplied in glass ampules which must be broken inside the tank while underAr purge. The tank, valves, and supply line must be made of inert materials; we found thatstainless steel components with teflon seals were acceptable. In liquid-fueled engines, asimpler seeding strategy is available; Cs can be added to the fuel in the tank (e.g., as CsClsalt) to generate a roughly uniform Cs concentration in the charge.
igniter
grating
det 1
det 2
144 cm
160 cm
cm3.8
852 nm VCSEL
iris
iris
pressure transducer
premixed gases:74.25% O24.75% C H1% Ar5 ppm Cs (in form of CsO dust)
22
4
2O296 K
C H2 4
296 K
Ar Cs~500 K (variable)
X
X
XX 852 nm emission
Fig. 1. Schematic of the Stanford PDE facility, with VCSEL-absorption sensor applied tomeasure gas temperature and pressure near the exit. Detector 1 monitors Cs absorptionlineshapes and detector 2 monitors thermal emission from Cs.
(C) 2002 OSA 17 June 2002 / Vol. 10, No. 12 / OPTICS EXPRESS 507#1118 - $15.00 US Received May 03, 2002; Revised June 13, 2002

0.606 0.607 0.608 0.609 0.610 4.882 4.883
detonationprior to distorted by detonation
P = 0.8 atm, T = 2125 KP = 33.3 atmT = 3937 K
tran
smis
sion
sign
al -1
in 1 µs~1 nm
etalon: FSR = 0.39 cm
wave arrival
time after ignition [ms]
Fig. 2. Raw transmission data recorded by detector 1 of Fig. 1, with etalon trace overlaid. Thefirst scan is prior to the detonation wave arrival. The detonation arrives during the second scan,and for this scan only the associated beamsteering noise is on the order of the scan repetitionrate, thus preventing an accurate absorption measurement. The third scan provides a high-quality absorption feature exhibiting strong collisional broadening. The fourth scan isapproximately 4 ms after the detonation wave arrival, and reveals hyperfine splitting.
0 1 2 3 4 5 6 7
0.01
0.1
1
emis
sion
sign
al[V
olts
]
time after ignition [ms]
Figure 3. Raw Cs emission signal recorded by detector 2 of Fig. 1. Emission is in the 852 ± 5nm spectral region and is proportional to the Cs population in the excited 62P3/2 state. Theinterfering emission in this band (on the order of 10% of the Cs emission) has beencharacterized using unseeded detonations and subtracted to obtain this trace.
The diagnostic shown in Fig. 1 uses a single, rapidly scanning VCSEL near 852 nm andtwo detectors. A diffraction grating is used to direct the VCSEL beam (in zeroth order)through the flow and the PDE luminosity (in first order) to a detector on the VCSEL side. Itis worth noting that if the grating is appropriately blazed, the efficiencies of the VCSEL beamreflection and the luminosity diffraction can both be greater than 50%; using a 30 degreeblaze-angle grating, we achieved ~ 70% throughput for both channels in this case. Thus thesystem shown in Fig. 1 outperforms the more standard beamsplitter-based system [17].
As a detonation wave passes the measurement station, detector 1 monitors Cs absorptionlineshapes; a raw data trace, overlaid with an etalon trace, is shown in Fig. 2. Detector 2simultaneously monitors Cs emission from the volume probed by the VCSEL beam; a rawdata trace is shown in Fig. 3. These data are digitized on a 12-bit scope at 100 megasamplesper second. Two different Cs vapor temperatures, an electronic temperature and a kinetictemperature, can be obtained from this sensor; these are expected to be equal because theelectronic excitation time constant for typical PDE conditions is < 1 µs [18]. The electronictemperature, TCs, electronic, is obtained from the ratio of the Cs population in the excitedelectronic state (62P3/2, given by detector 2) to the Cs population in the ground electronic state(62S1/2, given by the integrated absorbance areas of the lineshapes recorded by detector 1:nCs,6
2S1/2[cm-3] = 3.2×10¹² [cm-1] × Area[cm-1] / L[cm]). The kinetic temperature, TCs, kinetic, is
obtained from the FWHM collisional width in the detector 1 lineshapes, ∆νc, governed by
,;2 ,n
o
kineticCsoC T
TP
=⋅=∆ γγγν (1)
(C) 2002 OSA 17 June 2002 / Vol. 10, No. 12 / OPTICS EXPRESS 508#1118 - $15.00 US Received May 03, 2002; Revised June 13, 2002

where γ (= γCs-detonation products) is the overall collisional broadening parameter, P is the pressure(typically measured by a wall-mounted transducer), To is a reference temperature (300 K inthis paper), γo is the value of γ at temperature To, and n is the temperature broadeningexponent. Thus, with measurements of ∆νc and P (and thus of γ), TCs, kinetic can be obtainedfrom eq. 1, provided γo and n are known.
Results and Discussion
Given the data shown in Figs. 2 and 3, the first step in obtaining either temperature is to fit theFig. 2 data as illustrated in Fig. 4. The data shown in Fig. 4 correspond to the Cs absorptionfeature obtained immediately after detonation wave passage; the high pressure accounts forthe large collisional width and shift relative to the hyperfine structure, provided for referencein Fig. 4.
11729 11731 11733 11735 117370.0
0.1
0.2
0.3
0.4
0.5
0.6
0.7
o- ν c- ∆ν- area
three-parameter fit:
pressure shift
hyperfine structure of the D2
line in133
Cs
P = 33.3 atm L = 4 cmT = 3937 K Χ
Cs= 44 ppb
abs
orba
nce
11732.1 11732.2 11732.3 11732.40
1x10⁶
2x10⁶
79=
S4
+ S5
+ S6
S6
S5
S4
S3
S2
S1
S1
+ S2
+ S3
stre
ngth
[cm
-2a
tm-1
]
frequency [cm-1
]
6 S9193
151
201
251
6 P
2
2
1/2
3/2
F = 5
F = 4
F = 3
F = 2
F = 4
F = 3
Fig. 4. Cesium absorption feature recorded immediately after detonation wave passage.Although the feature contains six hyperfine-split transitions (splittings given in MHz in thediagram at right), a two-line Voigt fit (assuming fixed spacing and fixed relative heights) issufficiently accurate for extracting total feature area, collisional linewidths (assumed equal),and feature position.
Even though the hyperfine structure contains 6 individual transitions, the small upper-state splittings can be neglected for current purposes. Thus, a two-line Voigt profile is fit tothe data. An arbitrary two-line Voigt fit would have 8 total free parameters: two each of (area,∆νc, Doppler width ∆νD, and position νo). However, in this case (partly because of Cesium’shigh molecular weight and partly because of the high gas pressures existing during much ofthe detonation experiment), fixing both ∆νD values to 0.03266 cm-1 (their values at the lowestexpected temperature of 2000 K) introduces negligible errors. Also, the ratio of the two areasis fixed at 9/7, the line separation ∆νo is fixed at 9193 MHz = 0.3066 cm-1, and the two ∆νc
are assumed equal. Thus, 5 of the 8 free parameters have been removed; the two-line Voigtfit now returns only three parameters: area, ∆νc, and νo. The area is used to obtain TCs, electronic,∆νc is used to obtain TCs, kinetic, and νo is not used. Note that νo contains pressure-shiftinformation; like ∆νc, such information is pressure- and temperature-dependent, and thereforecould be incorporated in future sensors. Histories of area and ∆νc obtained by repeatedapplication of the two-line Voigt fit during a 7 ms detonation experiment (3710 total scans)are shown in Fig. 5.
(C) 2002 OSA 17 June 2002 / Vol. 10, No. 12 / OPTICS EXPRESS 509#1118 - $15.00 US Received May 03, 2002; Revised June 13, 2002

0 1 2 3 4 5 6 7 80
1
2
3
4
c∆ν
area
area
[cm
-1]
time [ms]
c∆ν
[cm
-1]
0.00
1.75
3.50
2.625
0.875
Fig. 5. History of pertinent lineshape parameters obtained by repeated application (3710 totalfits) of the two-line Voigt fit shown in Fig. 4. The integrated Cs absorbance area (right-handaxis) provides the ground state (62S1/2) Cs population, which is used to calculate TCs, electronic
(shown in Fig. 6). The collisional linewidth of each component line, ∆νc, is used to calculateTCs, kinetic (also shown in Fig. 6).
The area can also be used to infer the Cs vapor mole fraction (44 ppb for the scan shownin Fig. 4). In this experiment, the measured Cs vapor mole fraction is always much less thanthe Cs seeding fraction (5 ppm; see Fig. 1) because the majority of the Cs is present as eitherCsOH or Cs+ (the former at temperatures below ~ 2600 K and the latter at temperatures above~ 2600 K [14]). The ionization to Cs+ at high temperatures is actually convenient foremission measurements because it limits the required dynamic range (if Cs+ were not favoredat 4000 K, the emission would be some 10000 × the emission at 2000 K, rather than the ~ 50× seen in Fig. 3).
The measured emission (Fig. 3) is corrected for radiative trapping using the absorptiondata and then divided by the measured area (Fig. 5); from this ratio, TCs, electronic is inferredusing the Boltzmann distribution. However, because the emission measurement is notabsolute, the TCs, electronic history requires calibration. Conveniently, in this well-controlleddetonation experiment, the first TCs, electronic data point can be fixed to the Chapman-Jouget (C-J) temperature [19]; this can be done with high confidence (±3%) in the Stanford PDEbecause fueling [20] and detonation initiation [21] have been thoroughly characterized. Theresulting electronic temperature history is shown in Fig. 6; we estimate the uncertainty to be ±5%.
(C) 2002 OSA 17 June 2002 / Vol. 10, No. 12 / OPTICS EXPRESS 510#1118 - $15.00 US Received May 03, 2002; Revised June 13, 2002

0 1 2 3 4 5 6 71600
2000
2400
2800
3200
3600
4000T
C-J= 3937 K
(population ratio)
(collisional linewidth)TCs, kinetic
TCs, electronic
NRL simulationTem
pera
ture
[K]
time [ms]
Fig. 6. Measured and computed gas temperatures for detonation of stoichiometric C2H4 / O2.
Note that in less-controlled detonation experiments (particularly in practical PDEs) it maynot be appropriate to calibrate the TCs, electronic sensor using the Chapman-Jouget value; in manyinstances one may wish to measure whether individual detonations reach the Chapman-Jougettemperature. The TCs, kinetic sensor, discussed below, is suitable for this purpose. Also shownin Fig. 6 is an initial comparison of the temperature measurements to a simulation performedby the Naval Research Laboratory (NRL); although discrepancies are apparent, the trends inthe temperature histories generally agree. Such comparisons are part of an ongoingcollaboration aimed at advancing PDE development. Details of the simulation are available inthe literature [22].
Knowing both TCs, electronic and pressure (from a wall-mounted transducer; see Fig. 9), thecorresponding equilibrium species concentration histories can be computed, as shown in Fig.7. Note that the predicted equilibrium gas composition changes dramatically during thisdetonation experiment, and with it the ratio of specific heats, k.
0 1 2 3 4 5 6 7 80.0
0.1
0.2
0.3
0.4
0.5
0.6
k = 1.178k = 1.174k = 1.177k = 1.238
CO, OH, O2, O, H, H
2)
remainder (primarily
CO2
H2O
spec
ies
mol
efr
actio
n
time [ms]
Fig. 7. Calculated equilibrium species concentration histories for detonation of stoichiometricC2H4 / O2, obtained using the measured TCs, electronic history shown in Fig. 6 and the measuredPspectroscopic history shown in Fig. 9. The ratio of specific heats, k, is indicated at selectedcompositions.
To determine TCs, kinetic from the ∆νc record shown in Fig. 5, we first divide ∆νc by 2 × Pto obtain γ (following eq. 1). Next, best-fit values of the parameters n (–2.02) andγo (9.48 cm-1/atm) are found using TCs, electronic as the temperature standard, as shown in Fig. 8.Although such data are scarce in the literature, these values can be compared with an
(C) 2002 OSA 17 June 2002 / Vol. 10, No. 12 / OPTICS EXPRESS 511#1118 - $15.00 US Received May 03, 2002; Revised June 13, 2002

estimation of n = –1.38 and γo = 0.68 cm-1/atm for N2-broadened potassium [16]. The largediscrepancy in γo values is reconciled by a finding that sodium’s D2 line is broadened muchmore severely by H2O than N2 (γNa-H2O,2000K ≈ γNa-N2,500K [23]). Note that direct measurementof room-temperature γo values for atomic alkalis broadened by species such as H2O and CO2
are difficult because of the extreme reactivity of these gases.Returning to the linear fit in Fig. 8, the curvature of the data at high temperatures
indicates that a single γo and n are somewhat inappropriate over the full temperature range,presumably because of the changing gas composition shown in Fig. 7. A composition-dependent fit is applied to capture this curvature. The linear fit is applicable over the 2000–3200 K temperature range; the composition-dependent fit is applicable over the fulltemperature range. Neither fit is intended to provide fundamentally accurate spectroscopicdata; rather, the fits are designed to enable ∆νc-based temperature measurements over alimited temperature range and for a specific gas composition (namely, one approximating theequilibrium products of C2H4 / O2). Further work is required to extend the kinetic temperaturemeasurement technique presented here to other gas compositions or temperature ranges.
1.8 1.9 2.0 2.1 2.2 2.3 2.4 2.5 2.6-3.0
-2.8
-2.6
-2.4
-2.2
-2.0
-1.8
-1.6
-1.4
γ[cm
-1/a
tm]
0.061
0.074
0.091
0.111
0.135
0.165
0.202
0.247
TCs, electronic
[K]3655330729922708245022172006
+ (Xremainder
)0.86(T/300)-1.00
γ, [cm-1
/atm] = (XH2O
+XCO2
)9.40(T/300)-2.00
γ, [cm-1
/atm] = 9.48(T/300)-2.02
2-line Voigt fitmeasured using
( )300 K
TCs, electronic
ln(γ
)
ln
Fig. 8. Determination of the best-fit overall Cs collisional broadening parameter, γCs-detonation
products, and its temperature dependence, using the measured Cs electronic temperature as thestandard. A linear fit and a gas composition-dependent fit are shown. The composition-dependent fit is used to determine the gas (kinetic) temperature result shown in Fig. 6 fromlineshape and pressure measurements. To demonstrate an alternate approach, the same fit isused to find the gas pressure result shown in Fig. 9 from lineshape and (electronic) temperaturemeasurements.
Using the composition-dependent fit shown in Fig. 8, the measured γ values plotted inFig. 8 can be converted to the TCs, kinetic record shown in Fig. 6. The uncertainty in TCs, kinetic isestimated at ± 7%. The fit performed in Fig. 8 forces the two temperature records plotted inFig. 6 to agree (to the extent that the composition-dependent fit matches the Fig. 8 data).Even so, the agreement represents a critical advancement, because now both detector 2 andthe diffraction grating can be removed from the Fig. 1 setup and temperature measurementsbased on absorption only can be performed. Furthermore, the absorption-based (∆νc-based)measurements are absolute; the single-laser, single-detector sensor can be used withoutcalibration to obtain gas temperature in any Cs-seeded, C2H4 / O2 combustor (using anauxiliary pressure measurement).
(C) 2002 OSA 17 June 2002 / Vol. 10, No. 12 / OPTICS EXPRESS 512#1118 - $15.00 US Received May 03, 2002; Revised June 13, 2002
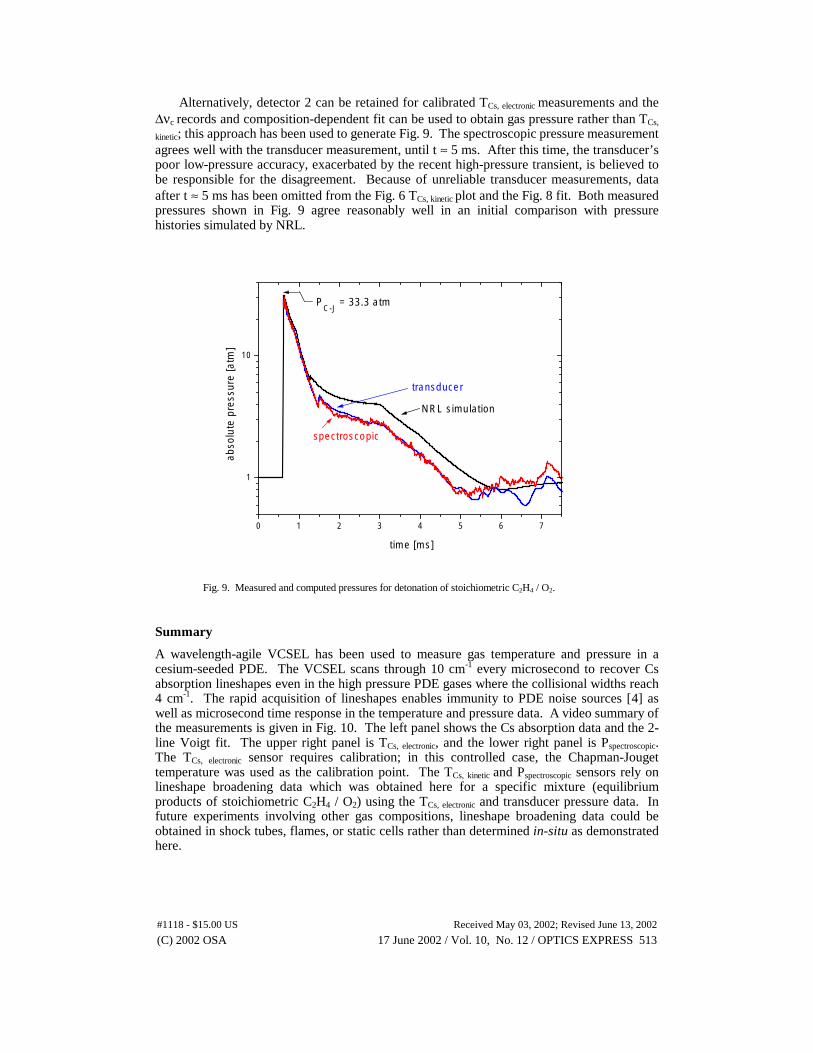
Alternatively, detector 2 can be retained for calibrated TCs, electronic measurements and the∆νc records and composition-dependent fit can be used to obtain gas pressure rather than TCs,
kinetic; this approach has been used to generate Fig. 9. The spectroscopic pressure measurementagrees well with the transducer measurement, until t ≈ 5 ms. After this time, the transducer’spoor low-pressure accuracy, exacerbated by the recent high-pressure transient, is believed tobe responsible for the disagreement. Because of unreliable transducer measurements, dataafter t ≈ 5 ms has been omitted from the Fig. 6 TCs, kinetic plot and the Fig. 8 fit. Both measuredpressures shown in Fig. 9 agree reasonably well in an initial comparison with pressurehistories simulated by NRL.
0 1 2 3 4 5 6 7
1
10
time [ms]
abso
lute
pres
sure
[atm
]
NRL simulation
transducer
spectroscopic
PC-J
= 33.3 atm
Fig. 9. Measured and computed pressures for detonation of stoichiometric C2H4 / O2.
Summary
A wavelength-agile VCSEL has been used to measure gas temperature and pressure in acesium-seeded PDE. The VCSEL scans through 10 cm-1 every microsecond to recover Csabsorption lineshapes even in the high pressure PDE gases where the collisional widths reach4 cm-1. The rapid acquisition of lineshapes enables immunity to PDE noise sources [4] aswell as microsecond time response in the temperature and pressure data. A video summary ofthe measurements is given in Fig. 10. The left panel shows the Cs absorption data and the 2-line Voigt fit. The upper right panel is TCs, electronic, and the lower right panel is Pspectroscopic.The TCs, electronic sensor requires calibration; in this controlled case, the Chapman-Jougettemperature was used as the calibration point. The TCs, kinetic and Pspectroscopic sensors rely onlineshape broadening data which was obtained here for a specific mixture (equilibriumproducts of stoichiometric C2H4 / O2) using the TCs, electronic and transducer pressure data. Infuture experiments involving other gas compositions, lineshape broadening data could beobtained in shock tubes, flames, or static cells rather than determined in-situ as demonstratedhere.
(C) 2002 OSA 17 June 2002 / Vol. 10, No. 12 / OPTICS EXPRESS 513#1118 - $15.00 US Received May 03, 2002; Revised June 13, 2002

Fig. 10. (2.37 MB) Animated summary of the sensor’s results for a single pulse of the PDE.The left panel shows the Cs absorption data (light blue circles) and the 2-line Voigt fit (solidblue fill). A Cs absorption feature is recorded every 2 µs. Each feature produces a TCs, electronic
data point (upper right panel) and Pspectroscopic data point (lower right panel). 3710 consecutivescans over the Cs feature are used to obtain the ~ 7ms long temperature and pressure history.Time accelerates during the animation to emphasize the data recorded immediately afterdetonation passage. (7.64 MB version)
Because wavelength-agile diode-laser sensing has been successful in this harsh PDEflow, applications in other harsh flows such as gas turbine and piston engines are anticipated.As wavelength-agile lasers become available at wavelengths above 1 µm, native species suchas H2O and fuel vapor can be targeted using similar sensing strategies, thus eliminating theneed for seeding. Because of the small footprint and robust nature of wavelength-agilesensors, they are amenable to widespread industrial use.
Acknowledgements
The authors would like to thank Dr. Kailas Kailasanath at the Naval Research Laboratory inWashington, DC, for providing the detonation simulations and for many thoughtfuldiscussions. This work was supported by the U.S. Office of Naval Research, with Dr. GabrielRoy as technical monitor and by the U.S. Air Force Office of Scientific Research, AerospaceSciences Directorate, with Dr. Julian Tishkoff as technical monitor.
(C) 2002 OSA 17 June 2002 / Vol. 10, No. 12 / OPTICS EXPRESS 514#1118 - $15.00 US Received May 03, 2002; Revised June 13, 2002