Embed Size (px)
Citation preview
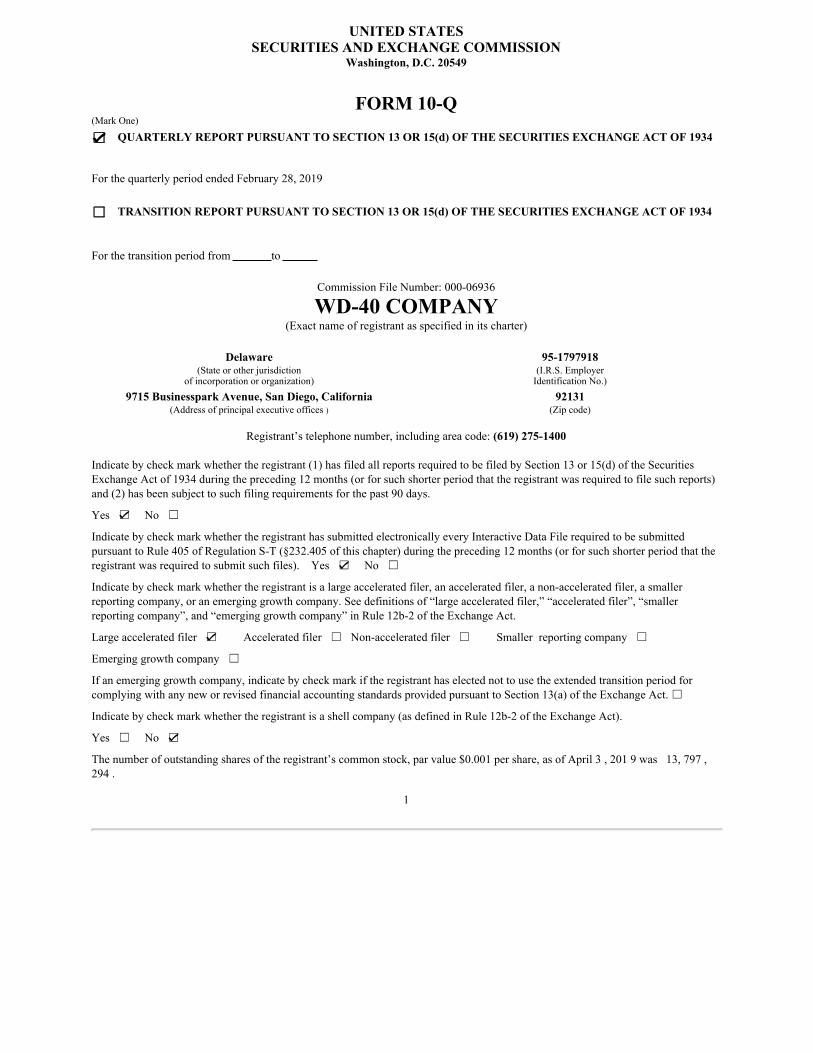
UNITED STATESSECURITIES AND EXCHANGE COMMISSION
Washington, D.C. 20549
FORM 10-Q
(MarkOne)
☑☑ QUARTERLY REPORT PURSUANT TO SECTION 13 OR 15(d) OF THE SECURITIES EXCHANGE ACT OF 1934
ForthequarterlyperiodendedFebruary28,2019
☐☐ TRANSITION REPORT PURSUANT TO SECTION 13 OR 15(d) OF THE SECURITIES EXCHANGE ACT OF 1934
Forthetransitionperiodfromto
CommissionFileNumber:000-06936
WD-40 COMPANY(Exactnameofregistrantasspecifiedinitscharter)
Delaware 95-1797918(Stateorotherjurisdiction
ofincorporationororganization)(I.R.S.EmployerIdentificationNo.)
9715 Businesspark Avenue, San Diego, California 92131(Addressofprincipalexecutiveoffices) (Zipcode)
Registrant’stelephonenumber,includingareacode:(619) 275-1400
Indicatebycheckmarkwhethertheregistrant(1)hasfiledallreportsrequiredtobefiledbySection13or15(d)oftheSecuritiesExchangeActof1934duringthepreceding12months(orforsuchshorterperiodthattheregistrantwasrequiredtofilesuchreports)and(2)hasbeensubjecttosuchfilingrequirementsforthepast90days.
Yes☑No☐
IndicatebycheckmarkwhethertheregistranthassubmittedelectronicallyeveryInteractiveDataFilerequiredtobesubmittedpursuanttoRule405ofRegulationS-T(§232.405ofthischapter)duringthepreceding12months(orforsuchshorterperiodthattheregistrantwasrequiredtosubmitsuchfiles).Yes☑No☐
Indicatebycheckmarkwhethertheregistrantisalargeacceleratedfiler,anacceleratedfiler,anon-acceleratedfiler,asmallerreportingcompany,oranemerginggrowthcompany.Seedefinitionsof“largeacceleratedfiler,”“acceleratedfiler”,“smallerreportingcompany”,and“emerginggrowthcompany”inRule12b-2oftheExchangeAct.
Largeacceleratedfiler☑Acceleratedfiler☐Non-acceleratedfiler☐Smallerreportingcompany☐
Emerginggrowthcompany☐
Ifanemerginggrowthcompany,indicatebycheckmarkiftheregistranthaselectednottousetheextendedtransitionperiodforcomplyingwithanyneworrevisedfinancialaccountingstandardsprovidedpursuanttoSection13(a)oftheExchangeAct.☐
Indicatebycheckmarkwhethertheregistrantisashellcompany(asdefinedinRule12b-2oftheExchangeAct).
Yes☐No☑
Thenumberofoutstandingsharesoftheregistrant’scommonstock,parvalue$0.001pershare,asofApril3,2019was13,797,294.
1
WD-40 COMPANYQUARTERLY REPORT ON FORM 10-QFor the Quarter Ended February 28, 2019
TABLE OF CONTENTS
PART I — FINANCIAL INFORMATION
PageItem1. FinancialStatements(Unaudited)
CondensedConsolidatedBalanceSheets 3CondensedConsolidatedStatementsofOperations 4CondensedConsolidatedStatementsofComprehensiveIncome 5CondensedConsolidatedStatementofShareholders’Equity 6CondensedConsolidatedStatementsofCashFlows 8NotestoCondensedConsolidatedFinancialStatements 9
Item2. Management’sDiscussionandAnalysisofFinancialConditionandResultsofOperations 25Item3. QuantitativeandQualitativeDisclosuresAboutMarketRisk 47Item4. ControlsandProcedures 47
PART II —OTHER INFORMATION
Item1. LegalProceedings 48Item1A. RiskFactors 48Item2. UnregisteredSalesofEquitySecuritiesandUseofProceeds 48Item6. Exhibits 49
2
PART 1 - FINANCIA L INFORMATION
Item 1. Financial Statements
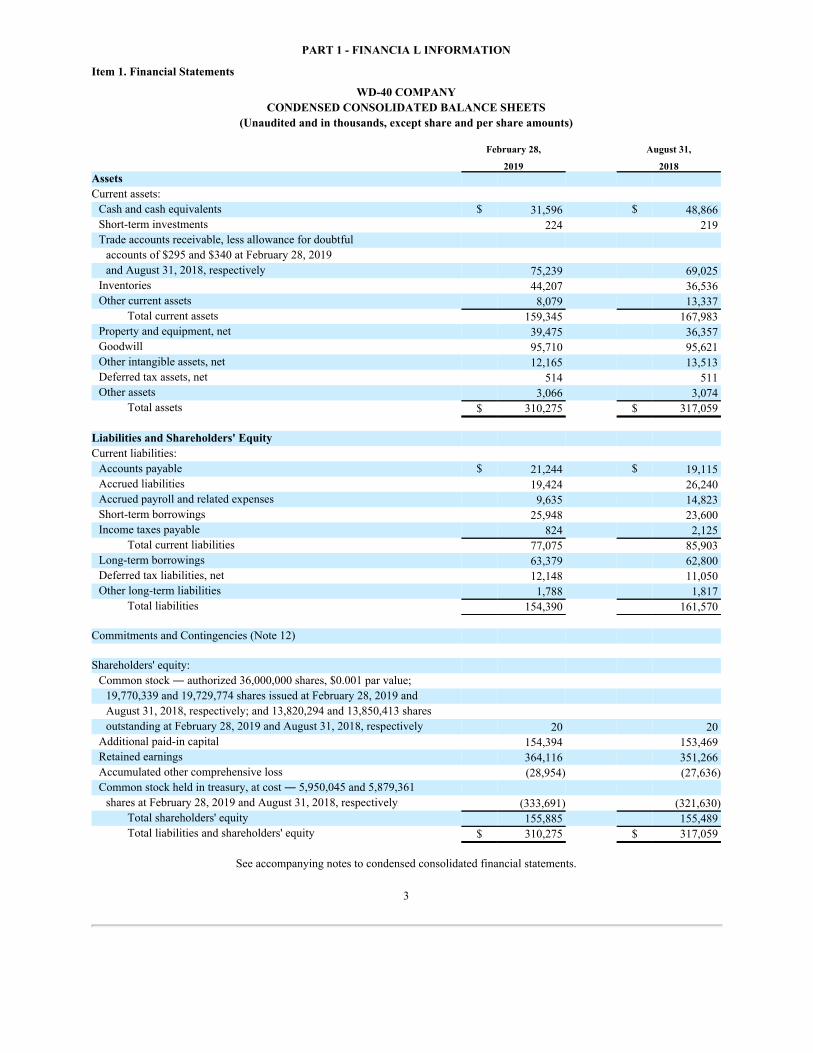
WD-40 COMPANYCONDENSED CONSOLIDATED BALANCE SHEETS
(Unaudited and in thousands, except share and per share amounts)
February 28, August 31,
2019 2018AssetsCurrentassets:Cashandcashequivalents $ 31,596 $ 48,866Short-terminvestments 224 219Tradeaccountsreceivable,lessallowancefordoubtfulaccountsof$295and$340atFebruary28,2019andAugust31,2018,respectively 75,239 69,025
Inventories 44,207 36,536Othercurrentassets 8,079 13,337
Totalcurrentassets 159,345 167,983Propertyandequipment,net 39,475 36,357Goodwill 95,710 95,621Otherintangibleassets,net 12,165 13,513Deferredtaxassets,net 514 511Otherassets 3,066 3,074
Totalassets $ 310,275 $ 317,059
Liabilities and Shareholders' EquityCurrentliabilities:Accountspayable $ 21,244 $ 19,115Accruedliabilities 19,424 26,240Accruedpayrollandrelatedexpenses 9,635 14,823Short-termborrowings 25,948 23,600Incometaxespayable 824 2,125
Totalcurrentliabilities 77,075 85,903Long-termborrowings 63,379 62,800Deferredtaxliabilities,net 12,148 11,050Otherlong-termliabilities 1,788 1,817
Totalliabilities 154,390 161,570
CommitmentsandContingencies(Note12)
Shareholders'equity:Commonstock―authorized36,000,000shares,$0.001parvalue;19,770,339and19,729,774sharesissuedatFebruary28,2019andAugust31,2018,respectively;and13,820,294and13,850,413sharesoutstandingatFebruary28,2019andAugust31,2018,respectively 20 20
Additionalpaid-incapital 154,394 153,469Retainedearnings 364,116 351,266Accumulatedothercomprehensiveloss (28,954) (27,636)Commonstockheldintreasury,atcost―5,950,045and5,879,361sharesatFebruary28,2019andAugust31,2018,respectively (333,691) (321,630)
Totalshareholders'equity 155,885 155,489Totalliabilitiesandshareholders'equity $ 310,275 $ 317,059
Seeaccompanyingnotestocondensedconsolidatedfinancialstatements.
3
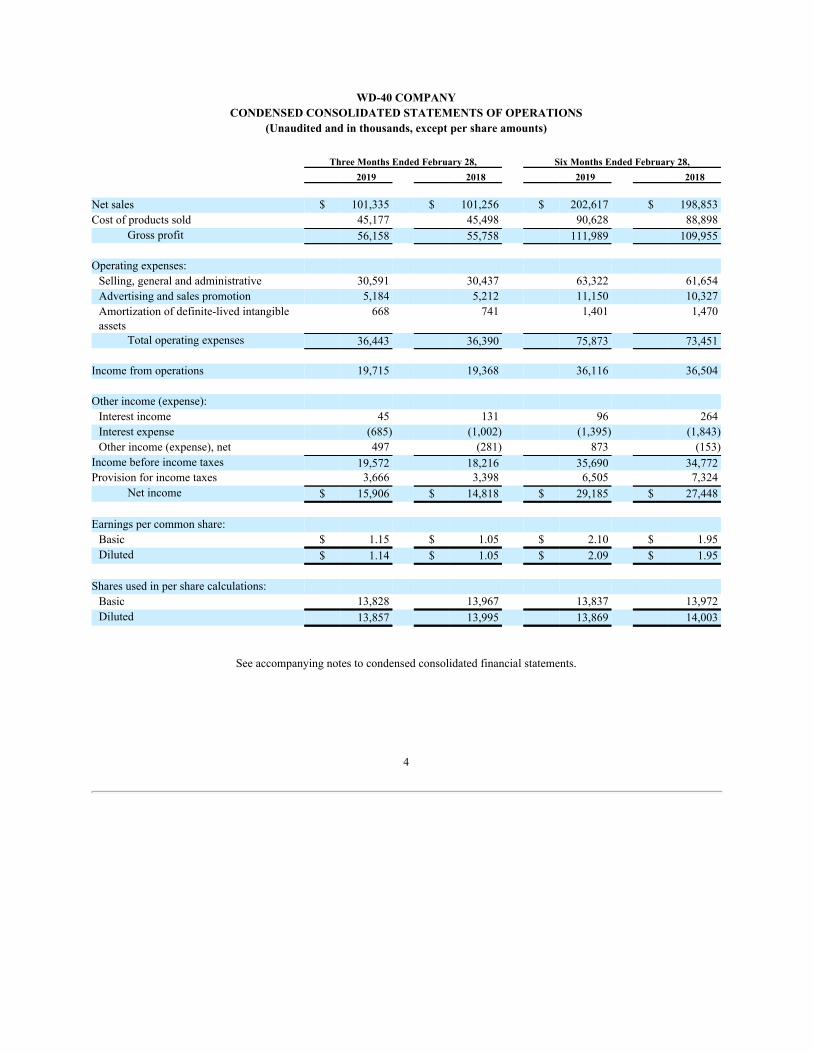
WD-40 COMPANYCONDENSED CONSOLIDATED STATEMENTS OF OPERATIONS
(Unaudited and in thousands, except per share amounts)
Three Months Ended February 28, Six Months Ended February 28,2019 2018 2019 2018
Netsales $ 101,335 $ 101,256 $ 202,617 $ 198,853Costofproductssold 45,177 45,498 90,628 88,898
Grossprofit 56,158 55,758 111,989 109,955
Operatingexpenses:Selling,generalandadministrative 30,591 30,437 63,322 61,654Advertisingandsalespromotion 5,184 5,212 11,150 10,327Amortizationofdefinite-livedintangibleassets
668 741 1,401 1,470
Totaloperatingexpenses 36,443 36,390 75,873 73,451
Incomefromoperations 19,715 19,368 36,116 36,504
Otherincome(expense):Interestincome 45 131 96 264Interestexpense (685) (1,002) (1,395) (1,843)Otherincome(expense),net 497 (281) 873 (153)
Incomebeforeincometaxes 19,572 18,216 35,690 34,772Provisionforincometaxes 3,666 3,398 6,505 7,324
Netincome $ 15,906 $ 14,818 $ 29,185 $ 27,448
Earningspercommonshare:Basic $ 1.15 $ 1.05 $ 2.10 $ 1.95Diluted $ 1.14 $ 1.05 $ 2.09 $ 1.95
Sharesusedinpersharecalculations:Basic 13,828 13,967 13,837 13,972Diluted 13,857 13,995 13,869 14,003
Seeaccompanyingnotestocondensedconsolidatedfinancialstatements.
4
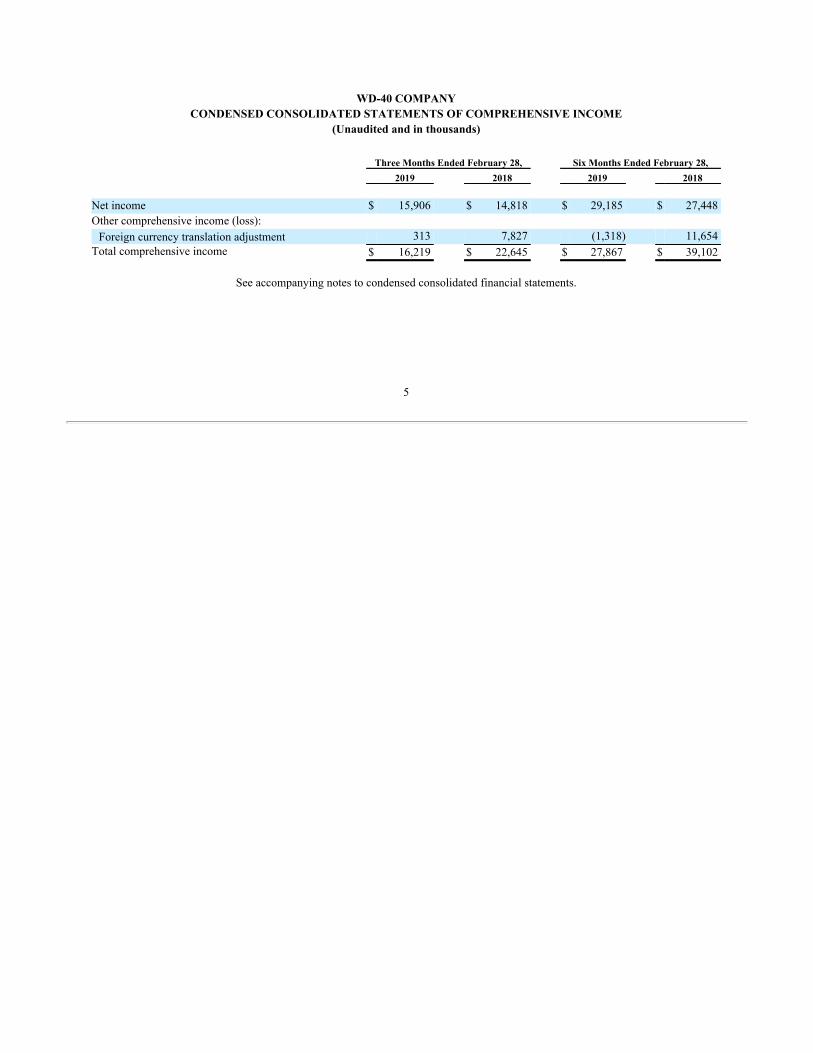
WD-40 COMPANYCONDENSED CONSOLIDATED STATEMENTS OF COMPREHENSIVE INCOME
(Unaudited and in thousands)
Three Months Ended February 28, Six Months Ended February 28,2019 2018 2019 2018
Netincome $ 15,906 $ 14,818 $ 29,185 $ 27,448Othercomprehensiveincome(loss):Foreigncurrencytranslationadjustment 313 7,827 (1,318) 11,654
Totalcomprehensiveincome $ 16,219 $ 22,645 $ 27,867 $ 39,102
Seeaccompanyingnotestocondensedconsolidatedfinancialstatements.
5
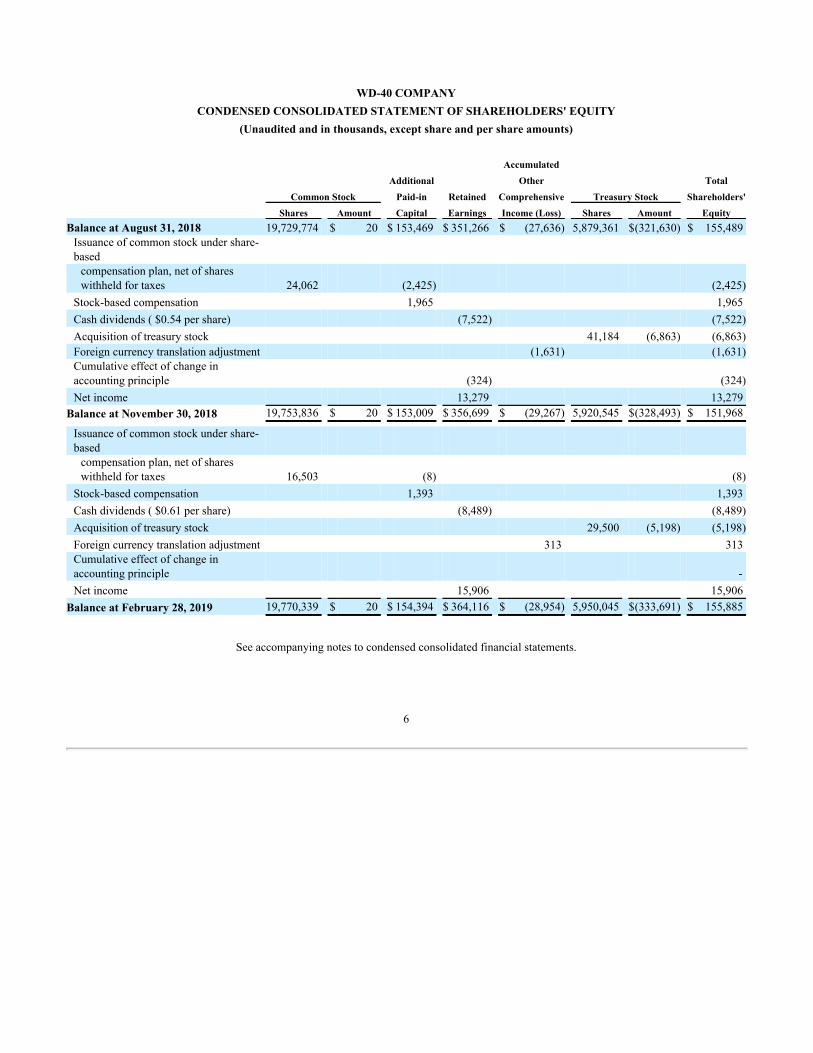
WD-40 COMPANYCONDENSED CONSOLIDATED STATEMENT OF SHAREHOLDERS' EQUITY
(Unaudited and in thousands, except share and per share amounts)
AccumulatedAdditional Other Total
Common Stock Paid-in Retained Comprehensive Treasury Stock Shareholders'Shares Amount Capital Earnings Income (Loss) Shares Amount Equity
Balance at August 31, 2018 19,729,774 $ 20 $ 153,469 $ 351,266 $ (27,636) 5,879,361 $(321,630) $ 155,489Issuanceofcommonstockundershare-basedcompensationplan,netofshareswithheldfortaxes 24,062 (2,425) (2,425)
Stock-basedcompensation 1,965 1,965Cashdividends($0.54pershare) (7,522) (7,522)Acquisitionoftreasurystock 41,184 (6,863) (6,863)Foreigncurrencytranslationadjustment (1,631) (1,631)Cumulativeeffectofchangeinaccountingprinciple (324) (324)Netincome 13,279 13,279
Balance at November 30, 2018 19,753,836 $ 20 $ 153,009 $ 356,699 $ (29,267) 5,920,545 $(328,493) $ 151,968
Issuanceofcommonstockundershare-basedcompensationplan,netofshareswithheldfortaxes 16,503 (8) (8)
Stock-basedcompensation 1,393 1,393Cashdividends($0.61pershare) (8,489) (8,489)Acquisitionoftreasurystock 29,500 (5,198) (5,198)Foreigncurrencytranslationadjustment 313 313Cumulativeeffectofchangeinaccountingprinciple -Netincome 15,906 15,906
Balance at February 28, 2019 19,770,339 $ 20 $ 154,394 $ 364,116 $ (28,954) 5,950,045 $(333,691) $ 155,885
Seeaccompanyingnotestocondensedconsolidatedfinancialstatements.
6
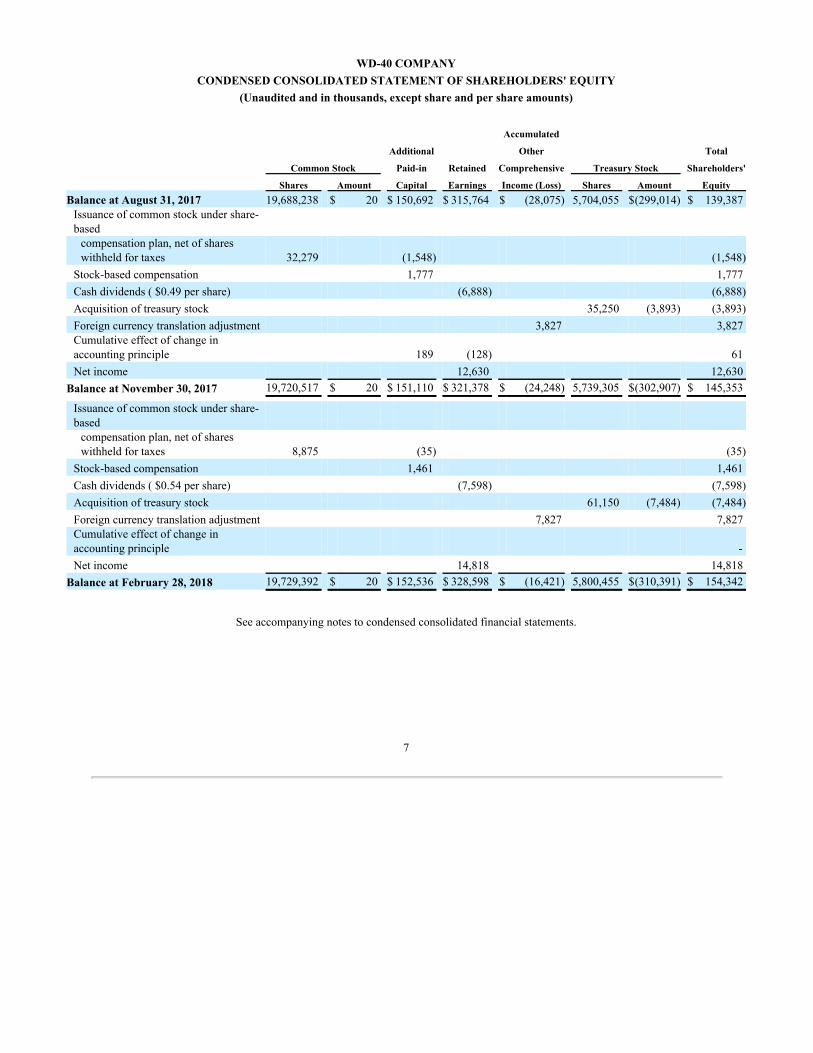
WD-40 COMPANYCONDENSED CONSOLIDATED STATEMENT OF SHAREHOLDERS' EQUITY
(Unaudited and in thousands, except share and per share amounts)
Accumulated
Additional Other Total
Common Stock Paid-in Retained Comprehensive Treasury Stock Shareholders'
Shares Amount Capital Earnings Income (Loss) Shares Amount EquityBalance at August 31, 2017 19,688,238 $ 20 $ 150,692 $ 315,764 $ (28,075) 5,704,055 $(299,014) $ 139,387Issuanceofcommonstockundershare-basedcompensationplan,netofshareswithheldfortaxes 32,279 (1,548) (1,548)
Stock-basedcompensation 1,777 1,777Cashdividends($0.49pershare) (6,888) (6,888)Acquisitionoftreasurystock 35,250 (3,893) (3,893)Foreigncurrencytranslationadjustment 3,827 3,827Cumulativeeffectofchangeinaccountingprinciple 189 (128) 61Netincome 12,630 12,630
Balance at November 30, 2017 19,720,517 $ 20 $ 151,110 $ 321,378 $ (24,248) 5,739,305 $(302,907) $ 145,353
Issuanceofcommonstockundershare-basedcompensationplan,netofshareswithheldfortaxes 8,875 (35) (35)
Stock-basedcompensation 1,461 1,461Cashdividends($0.54pershare) (7,598) (7,598)Acquisitionoftreasurystock 61,150 (7,484) (7,484)Foreigncurrencytranslationadjustment 7,827 7,827Cumulativeeffectofchangeinaccountingprinciple -Netincome 14,818 14,818
Balance at February 28, 2018 19,729,392 $ 20 $ 152,536 $ 328,598 $ (16,421) 5,800,455 $(310,391) $ 154,342
Seeaccompanyingnotestocondensedconsolidatedfinancialstatements.
7
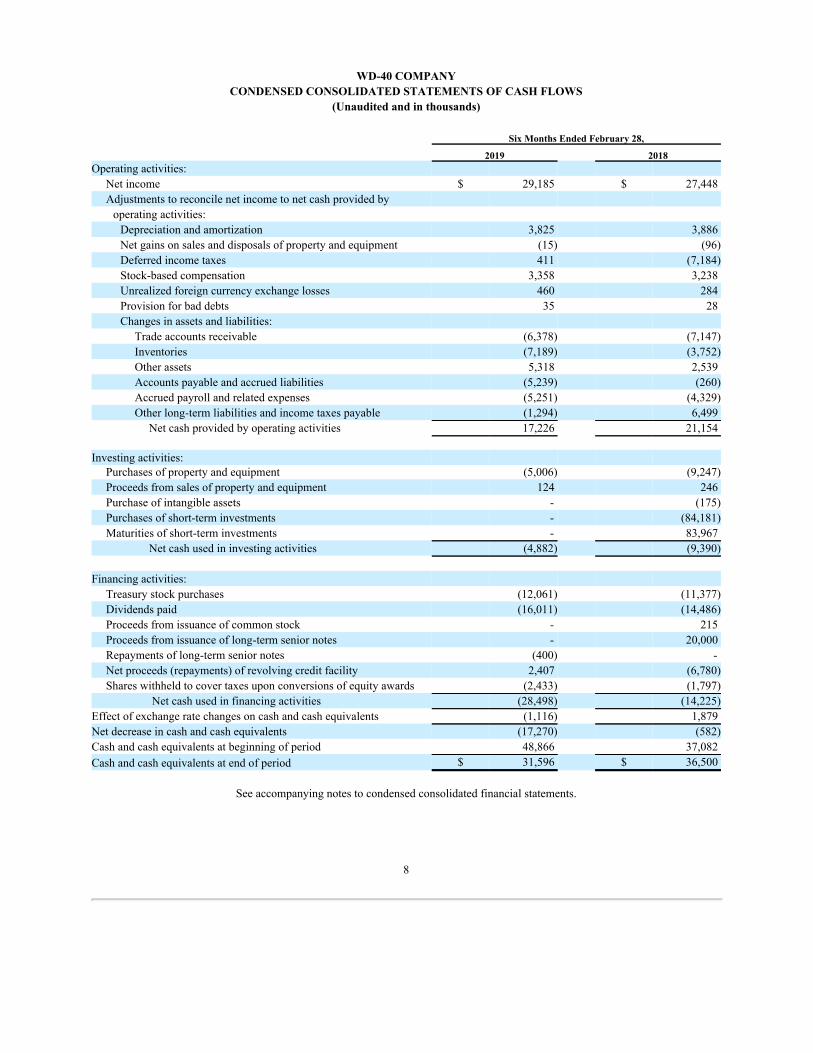
WD-40 COMPANYCONDENSED CONSOLIDATED STATEMENTS OF CASH FLOWS
(Unaudited and in thousands)
Six Months Ended February 28,
2019 2018Operatingactivities:
Netincome $ 29,185 $ 27,448Adjustmentstoreconcilenetincometonetcashprovidedbyoperatingactivities:Depreciationandamortization 3,825 3,886Netgainsonsalesanddisposalsofpropertyandequipment (15) (96)Deferredincometaxes 411 (7,184)Stock-basedcompensation 3,358 3,238Unrealizedforeigncurrencyexchangelosses 460 284Provisionforbaddebts 35 28Changesinassetsandliabilities:
Tradeaccountsreceivable (6,378) (7,147)Inventories (7,189) (3,752)Otherassets 5,318 2,539Accountspayableandaccruedliabilities (5,239) (260)Accruedpayrollandrelatedexpenses (5,251) (4,329)Otherlong-termliabilitiesandincometaxespayable (1,294) 6,499
Netcashprovidedbyoperatingactivities 17,226 21,154
Investingactivities:Purchasesofpropertyandequipment (5,006) (9,247)Proceedsfromsalesofpropertyandequipment 124 246Purchaseofintangibleassets - (175)Purchasesofshort-terminvestments - (84,181)Maturitiesofshort-terminvestments - 83,967
Netcashusedininvestingactivities (4,882) (9,390)
Financingactivities:Treasurystockpurchases (12,061) (11,377)Dividendspaid (16,011) (14,486)Proceedsfromissuanceofcommonstock - 215Proceedsfromissuanceoflong-termseniornotes - 20,000Repaymentsoflong-termseniornotes (400) -Netproceeds(repayments)ofrevolvingcreditfacility 2,407 (6,780)Shareswithheldtocovertaxesuponconversionsofequityawards (2,433) (1,797)
Netcashusedinfinancingactivities (28,498) (14,225)Effectofexchangeratechangesoncashandcashequivalents (1,116) 1,879Netdecreaseincashandcashequivalents (17,270) (582)Cashandcashequivalentsatbeginningofperiod 48,866 37,082Cashandcashequivalentsatendofperiod $ 31,596 $ 36,500
Seeaccompanyingnotestocondensedconsolidatedfinancialstatements.
8
WD-40 COMPANY
NOTES TO CONDENSED CONSOL IDATED FINANCIAL STATEMENTS (Unaudited)
Note 1. The Company
WD-40Company(“theCompany”),basedinSanDiego,California,isaglobalmarketingorganizationdedicatedtocreatingpositivelastingmemoriesbydevelopingandsellingproductsthatsolveproblemsinworkshops,factoriesandhomesaroundtheworld.TheCompanymarkets its maintenance products andits homecare andcleaning products under the followingwell-knownbrands: WD-40®,3-IN-ONE®,GT85®,X-14®,2000Flushes®, Carpet Fresh®,novac®,Spot Shot®,1001®,Lava®andSolvol®.CurrentlyincludedintheWD-40brandaretheWD-40Multi-UseProductandtheWD-40Specialist®andWD-40BIKE®productlines.
The Company’s brands are sold in various locations around the world. Maintenance products are sold worldwide in marketsthroughoutNorth,CentralandSouthAmerica,Asia,Australia,Europe,theMiddleEastandAfrica.HomecareandcleaningproductsaresoldprimarilyinNorthAmerica,theUnitedKingdom(“U.K.”)andAustralia.TheCompany’sproductsaresoldprimarilythroughmassretailandhomecenterstores,warehouseclubstores,grocerystores,hardwarestores,automotivepartsoutlets,sportsretailers,independentbikedealers,onlineretailersandindustrialdistributorsandsuppliers.
Note 2. Basis of Presentation and Summary of Significant Accounting Policies
Basis of Consolidation
ThecondensedconsolidatedfinancialstatementsincludedhereinhavebeenpreparedbytheCompany,withoutaudit,accordingtotherules and regulations of the Securities and Exchange Commission (“SEC”). Certain information and footnote disclosures normallyincludedinfinancialstatementspreparedinaccordancewithaccountingprinciplesgenerallyacceptedintheUnitedStatesofAmerica(“U.S.GAAP”)havebeencondensedoromittedpursuanttosuchrulesandregulations.TheAugust31,2018year-endcondensedconsolidatedbalancesheetdatawasderivedfromauditedfinancialstatements,butdoesnotincludealldisclosuresrequiredbyU.S.GAAP.
Intheopinionofmanagement,theunauditedfinancialinformationfortheinterimperiodsshownreflectsalladjustmentsnecessaryfora fair statement thereof and such adjustments are of a normal recurring nature. These condensed consolidated financial statementsshouldbereadinconjunctionwiththeconsolidatedfinancialstatementsandnotestheretoincludedintheCompany’sAnnualReportonForm10-KforthefiscalyearendedAugust31,2018,whichwasfiledwiththeSEConOctober22,2018.
The condensed consolidated financial statements include the accounts of the Company and its wholly-owned subsidiaries. Allintercompanytransactionsandbalanceshavebeeneliminatedinconsolidation.
Use of Estimates
ThepreparationoffinancialstatementsinconformitywithU.S.GAAPrequiresmanagementtomakeestimatesandassumptionsthataffect thereportedamountsofassets, liabilities, revenuesandexpensesandthedisclosureofcontingentassetsandliabilities atthedateofthefinancialstatementsandthereportedamountsofrevenuesandexpensesduringthereportingperiods.Actualresultscoulddifferfromthoseestimates.Operatingresultsforinterimperiodsarenotnecessarilyindicativeofoperatingresultsforanentirefiscalyear.
Foreign Currency Forward Contracts
Inthenormalcourseofbusiness,theCompanyemploysestablishedpoliciesandprocedurestomanageitsexposuretofluctuationsinforeign currency exchange rates. The Company’s U.K. subsidiary, whose functional currency is Pound Sterling, utilizes foreigncurrencyforwardcontractstolimititsexposuretonetassetbalancesheldinnon-functionalcurrencies,whichincludetheEuroandtheU.S.Dollar.TheCompanyregularlymonitorsitsforeigncurrencyexchangerateexposurestoensuretheoveralleffectivenessofitsforeigncurrencyhedgepositions.WhiletheCompanyengagesinforeigncurrencyhedgingactivitytoreduceitsrisk,foraccountingpurposes,noneofitsforeigncurrencyforwardcontractsaredesignatedashedges.TheCompanysignificantlyreducedoreliminateditsuseofEuroforeigncurrencyforwardcontracts
9
startinginthesecondquarteroffiscalyear2019sincetheEurodrawsthatitsU.K.subsidiarymadeonthelineofcreditwithBankofAmericainJanuary2019reducedthenetassetbalancesheldinEuros.SeeNote7–DebtforadditionalinformationontheEurolineofcredit.
Foreigncurrencyforwardcontractsarecarriedatfairvalue,withnetrealizedandunrealizedgainsandlossesrecognizedcurrentlyinother income (expense) in the Company’s consolidated statements of operations. Cash flows fromsettlements of foreign currencyforwardcontractsareincludedinoperatingactivitiesintheconsolidatedstatementsofcashflows.Foreigncurrencyforwardcontractsinanassetpositionattheendofthereportingperiodareincludedinothercurrentassets,whileforeigncurrencyforwardcontractsinaliabilitypositionattheendofthereportingperiodareincludedinaccruedliabilitiesintheCompany’sconsolidatedbalancesheets.AtFebruary28,2019,theCompanyhadanotionalamountof$6.3millionoutstandinginforeigncurrencyforwardcontracts,whichmature d inMarch 201 9 . Unrealized net gains and losses related to foreign currency forward contracts were not significant atFebruary28,2019and2018.Realizedgainsrelatedtoforeigncurrencyforwardcontractswere$0.3millionforthethreemonthsendedFebruary28,2019,whilerealizednetgainsandlossesforsuchcontractswerenotsignificantforeachofthethreemonthsendedFebruary28,2018.RealizednetgainsandlossesrelatedtoforeigncurrencyforwardcontractswerenotsignificantforthesixmonthsendedFebruary28,2019whilerealizedgainsforsuchcontractswere$0.4millionforthesixmonthsendedFebruary28,2018.Bothunrealizedandrealizednetgainsandlossesarerecordedinotherincome(expense),netontheCompany’sconsolidatedstatementsofoperations.
Fair Value Measurements
AccountingStandardsCodification(“ASC”)820,“Fair Value Measurements and Disclosures” ,definesfairvalueastheexchangeprice that would be received for an asset or paid to transfer a liability in an orderly transaction betweenmarket participants at themeasurementdate.TheCompanycategorizesitsfinancialassetsandliabilitiesmeasuredatfairvalueintoahierarchythatcategorizesfairvaluemeasurementsintothefollowingthreelevelsbasedonthetypesofinputsusedinmeasuringtheirfairvalue:
Level1:Observableinputssuchasquotedmarketpricesinactivemarketsforidenticalassetsorliabilities;Level2:Observablemarket-basedinputsorobservableinputsthatarecorroboratedbymarketdata;andLevel3:UnobservableinputsreflectingtheCompany’sownassumptions.
Underfairvalueaccounting,assetsandliabilitiesareclassifiedintheirentiretybasedonthelowestlevelofinputthatissignificanttothefairvaluemeasurement.AsofFebruary28,2019,theCompanyhadnoassetsorliabilitiesthataremeasuredatfairvalueinthefinancialstatementsonarecurringbasis,withtheexceptionoftheforeigncurrencyforwardcontractswhichareclassifiedasLevel2within the fair value hierarchy. The carrying values of cash equivalents, short-term investments and short-term borrowings arerecordedatcost,whichapproximatestheirfairvaluesprimarilyduetotheirshort-termmaturitiesandareclassifiedasLevel2withinthe fair value hierarchy. In addition, the carrying value of borrowings held under the Company’s revolving credit facilityapproximatesfairvalueduetothevariablenatureofunderlyinginterestrates, whichgenerallyreflectmarketconditionsandsuchborrowingsareclassifiedasLevel2withinthefairvaluehierarchy.TheCompany’sfixedratelong-termborrowingsconsistofseniornoteswhicharealsoclassifiedasLevel2withinthefairvaluehierarchyandarerecordedatcarryingvalue.TheCompanyestimatesthatthefairvalueofitsseniornoteswasapproximately$18.7millionasofFebruary28,2019,whichwasdeterminedbasedonadiscountedcashflowanalysisusingcurrentmarketinterestratesforinstrumentswithsimilarterms,comparedtoitscarryingvalueof$19.2million.DuringthesixmonthsendedFebruary28,2019,theCompanydidnotrecordanysignificantnonrecurringfairvaluemeasurementsforassetsorliabilitiesinperiodssubsequenttotheirinitialrecognition.
Recently Adopted Accounting Standards
In May 2014, the Financial Accounting Standards Board (“FASB”) issued ASU No. 2014-09, “ Revenue from Contracts withCustomers ”(“ASC606”),whichsupersedestherevenuerecognitionrequirementsinASC605,“Revenue Recognition ”.Thecoreprinciple of this updated guidance and related amendments is that an entity should recognize revenue to depict the transfer ofpromised goods or services to customers in an amount that reflects the consideration to which the entity expects to be entitled inexchangeforthosegoodsorservices.Thenewstandardrequiresadditionaldisclosurestoenableusersofthefinancialstatementstobetterunderstandthenature,amount,timing,risks,andjudgmentsrelatedtorevenuerecognitionfromcontractswithcustomers.OnSeptember 1, 2018, the CompanyadoptedASC606ona modified retrospective basis andthe Companyrecognizeda reductionof$0.3milliontoopeningretainedearningsasthecumulativeeffectofadoptingthenew
10
revenuestandard.ThisadjustmentdidnothaveamaterialimpactontheCompany’sconsolidatedfinancialstatements.SeeNote10–RevenueRecognitionforadditionalinformationandincrementaldisclosuresrelatedtotheadoptionofthisstandard
Recently Issued Accounting Standards
In August 2018, the FASB issued ASU No. 2018-15, “ Customer’s Accounting for Implementation Costs Incurred in a CloudComputing Arrangement That Is a Service Contract ”toaligntherequirements for capitalizing implementation costs incurredin ahosting arrangement that is a service contract with the requirements for capitalizing implementation costs incurred to develop orobtaininternal-usesoftware.Theupdatedguidancealsorequiresanentitytoexpensethecapitalizedimplementationcostsofahostingarrangement that is a service contract over thetermof thehostingarrangement andincludes expandeddisclosure requirements forsuch costs. This guidance is effective for fiscal years beginning after December 15, 2019, and interim periods within those fiscalyears. Early adoption is permitted and the guidance may be applied either retrospectively or prospectively. The Company hasevaluated the potential impacts of this updated guidance, and it does not expect the adoption of this guidance to have a materialimpact onits consolidated financial statements andrelated disclosures.The Company plans to early adopt this newguidance on aprospectivebasisduringthethirdquarteroffiscalyear2019.
In February 2018, the FASB issued ASU No. 2018-02, “Reclassification of Certain Tax Effects from Accumulated OtherComprehensive Income” ,tooptionallyallowentitiestoreclassifystrandedtaxeffects,resultingfromtheTaxAct,fromaccumulatedothercomprehensiveincometoretainedearnings.SincetheamendmentswithinthisguidanceonlyrelatetothereclassificationoftheincometaxeffectsassociatedwiththeTaxAct,theunderlyingguidancethatrequiresthattheeffectofachangeintaxlawsorratesbeincludedinincomefromcontinuingoperationsisnotaffected.ThisguidanceiseffectiveforfiscalyearsbeginningafterDecember15, 2018, including interim periods within that reporting period. Early adoption is permitted. The amendments in this updatedguidanceshouldbeappliedeitherintheperiodofadoptionorretrospectivelytoeachperiodinwhichtheeffectofthechangeintheU.S.corporatefederalincometaxrateintheTaxActisrecognized.TheCompanyhasevaluatedthepotentialimpactsofthisupdatedguidance,anditdoesnotexpecttheadoptionofthisguidancetohaveamaterialimpactonitsconsolidatedfinancialstatementsandrelateddisclosures, assuchstrandedtaxeffects areimmaterial.TheCompanyplanstoearly adopt this guidanceduringfiscal year2019andwillreclassifythesestrandedtaxeffectsfromaccumulatedothercomprehensiveincometoretainedearningsonMarch1,2018.
InFebruary2016,theFASBissuedASUNo.2016-02,“Leases” underASC842,whichsupersedesleaseaccountinganddisclosurerequirementsinASC840. Thenewstandardestablishesaright-of-usemodelthatrequiresalesseetorecordaright-of-useassetandaleaseliabilityonthebalancesheetforleaseswithfixedpaymentobligationsandtermslongerthantwelvemonths.Leaseswillbeclassifiedaseitherfinanceoroperating,withclassificationaffectingthepatternofexpenserecognitionintheincomestatement. ThisguidanceiseffectiveforfiscalyearsbeginningafterDecember15,2018,includinginterimperiodswithinthatreportingperiod.Although early adoption is permitted, the Company has concluded that it will not adopt this guidance early and it will becomeeffective for the Company on September 1, 2019. The Company will adopt this new guidance following the optional transitionmethoddescribedinASUNo.2018-11,“Leases – Targeted Improvements” whichwasissuedinJuly2018,ratherthantheoriginalmodified retrospective approachthat requires entities to applythe guidanceat the beginningof the earliest periodpresentedin thefinancialstatements.Undertheoptionaltransitionmethod,theCompanywillrecognizeanycumulativeeffectofinitiallyapplyingtheguidance as an adjustment to the opening balance of retained earnings on September 1, 2019. Therefore, the requirements of thisguidancewillapplyonlyforperiodspresentedthatareafterthedateofadoptionandwillnotaffectcomparativeperiods.Managementis in the process of a detailed review of the Company’s lease contracts. This review is focused principally on, but not limited to,developingacompleteinventoryoftheCompany’sleasecontactsandthetermsandconditionscontainedwithinthesecontracts toappropriately account for them under the new lease model. Additionally, the Company is in the process of reviewing currentaccountingpolicies,businessprocesses,systemsandinternalcontrolsinordertodetermineupdatesthatwillbeneededinsupportofadopting this new standard. Management expects the adoption of this guidance will have a material impact on the Company'sconsolidatedbalancesheetsandrelateddisclosures,althoughithasnotyetquantifiedtheimpact.Managementiscurrentlyassessingwhethertheadoptionofthisguidancewillhaveamaterialimpactontheconsolidatedstatementsofoperationsandcashflows.
11
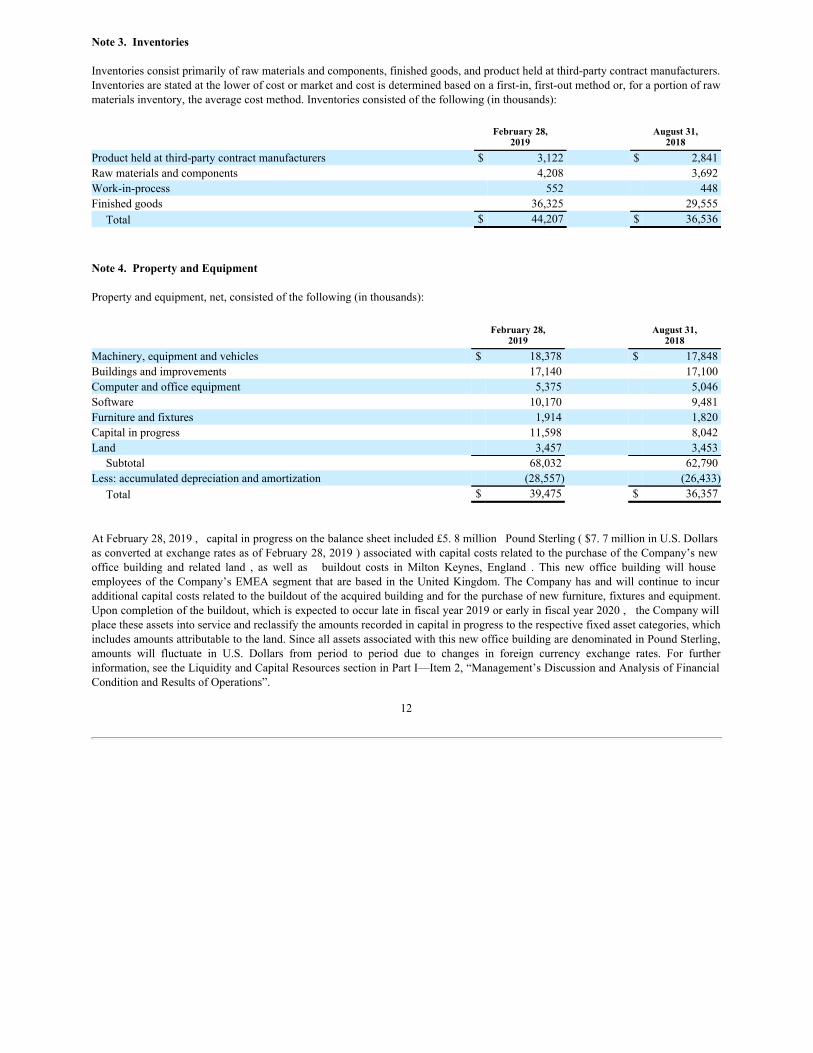
Note 3. Inventories
Inventoriesconsistprimarilyofrawmaterialsandcomponents,finishedgoods,andproductheldatthird-partycontractmanufacturers.Inventoriesarestatedatthelowerofcostormarketandcostisdeterminedbasedonafirst-in,first-outmethodor,foraportionofrawmaterialsinventory,theaveragecostmethod.Inventoriesconsistedofthefollowing(inthousands):
February 28, August 31,2019 2018
Productheldatthird-partycontractmanufacturers $ 3,122 $ 2,841Rawmaterialsandcomponents 4,208 3,692Work-in-process 552 448Finishedgoods 36,325 29,555
Total $ 44,207 $ 36,536
Note 4. Property and Equipment
Propertyandequipment,net,consistedofthefollowing(inthousands):
February 28, August 31,2019 2018
Machinery,equipmentandvehicles $ 18,378 $ 17,848Buildingsandimprovements 17,140 17,100Computerandofficeequipment 5,375 5,046Software 10,170 9,481Furnitureandfixtures 1,914 1,820Capitalinprogress 11,598 8,042Land 3,457 3,453
Subtotal 68,032 62,790Less:accumulateddepreciationandamortization (28,557) (26,433)
Total $ 39,475 $ 36,357
AtFebruary28,2019,capitalinprogressonthebalancesheetincluded£5.8millionPoundSterling($7.7millioninU.S.DollarsasconvertedatexchangeratesasofFebruary28,2019)associatedwithcapitalcostsrelatedtothepurchaseoftheCompany’snewoffice building and related land , as well as buildout costs in Milton Keynes, England . This new office building will houseemployeesof theCompany’s EMEAsegmentthat arebasedintheUnitedKingdom.TheCompanyhas andwill continue toincuradditionalcapitalcostsrelatedtothebuildoutoftheacquiredbuildingandforthepurchaseofnewfurniture,fixturesandequipment.Uponcompletionofthebuildout,whichisexpectedtooccurlateinfiscalyear2019orearlyinfiscalyear2020,theCompanywillplacetheseassetsintoserviceandreclassifytheamountsrecordedincapitalinprogresstotherespectivefixedassetcategories,whichincludesamountsattributabletotheland.SinceallassetsassociatedwiththisnewofficebuildingaredenominatedinPoundSterling,amounts will fluctuate in U.S. Dollars from period to period due to changes in foreign currency exchange rates. For furtherinformation,seetheLiquidityandCapitalResourcessectioninPartI—Item2,“Management’sDiscussionandAnalysisofFinancialConditionandResultsofOperations”.
12
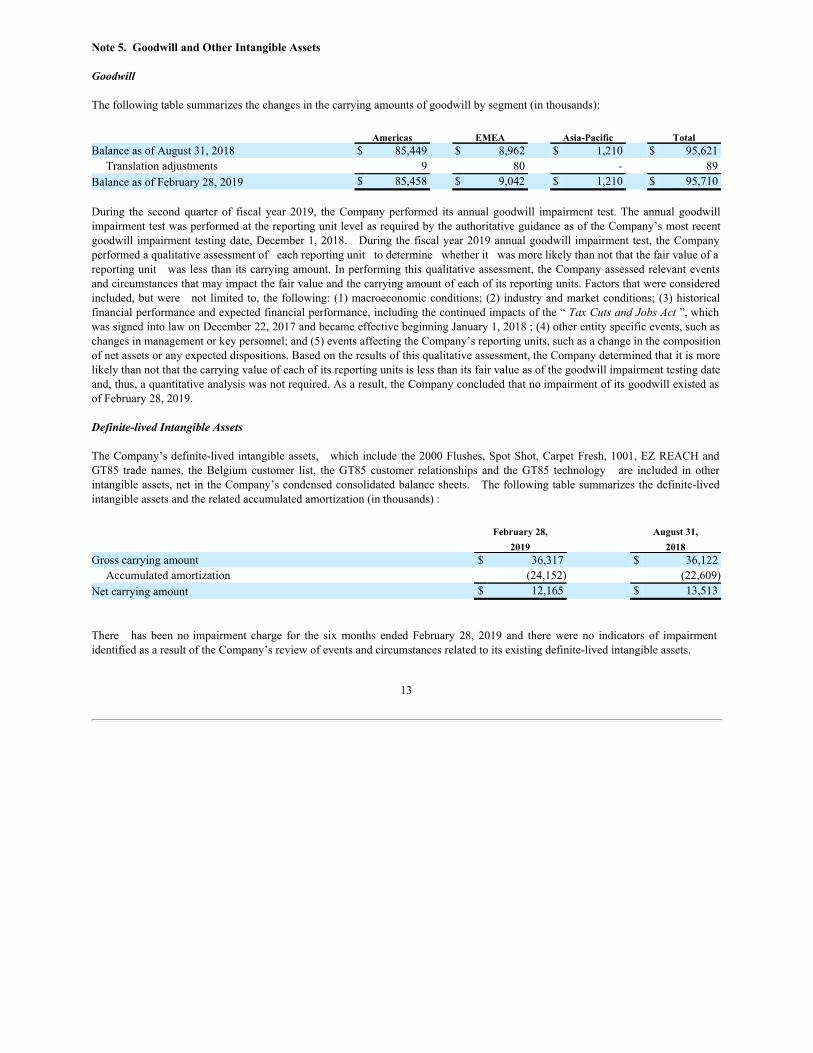
Note 5. Goodwill and Other Intangible Assets
Goodwill
Thefollowingtablesummarizesthechangesinthecarryingamountsofgoodwillbysegment(inthousands):
Americas EMEA Asia-Pacific TotalBalanceasofAugust31,2018 $ 85,449 $ 8,962 $ 1,210 $ 95,621
Translationadjustments 9 80 - 89BalanceasofFebruary28,2019 $ 85,458 $ 9,042 $ 1,210 $ 95,710
During the second quarter of fiscal year 2019, the Company performed its annual goodwill impairment test. The annual goodwillimpairmenttestwasperformedatthereportingunitlevelasrequiredbytheauthoritativeguidanceasoftheCompany’smostrecentgoodwill impairmenttestingdate, December1,2018. Duringthefiscal year2019annualgoodwill impairmenttest, theCompanyperformedaqualitativeassessmentofeachreportingunittodeterminewhetheritwasmorelikelythannotthatthefairvalueofareportingunitwaslessthanitscarryingamount.Inperformingthisqualitativeassessment, theCompanyassessedrelevanteventsandcircumstancesthatmayimpactthefairvalueandthecarryingamountofeachofitsreportingunits.Factorsthatwereconsideredincluded,butwerenotlimitedto, thefollowing:(1)macroeconomicconditions; (2)industryandmarket conditions; (3)historicalfinancialperformanceandexpectedfinancialperformance,includingthecontinuedimpactsofthe“Tax Cuts and Jobs Act ”,whichwassignedintolawonDecember22,2017andbecameeffectivebeginningJanuary1,2018;(4)otherentityspecificevents,suchaschangesinmanagementorkeypersonnel;and(5)eventsaffectingtheCompany’sreportingunits,suchasachangeinthecompositionofnetassetsoranyexpecteddispositions.Basedontheresultsofthisqualitativeassessment,theCompanydeterminedthatitismorelikelythannotthatthecarryingvalueofeachofitsreportingunitsislessthanitsfairvalueasofthegoodwillimpairmenttestingdateand,thus,aquantitativeanalysiswasnotrequired.Asaresult,theCompanyconcludedthatnoimpairmentofitsgoodwillexistedasofFebruary28,2019.
Definite-lived Intangible Assets
TheCompany’sdefinite-livedintangibleassets, whichincludethe2000Flushes, SpotShot, Carpet Fresh, 1001, EZREACHandGT85 trade names, the Belgium customer list, the GT85 customer relationships and the GT85 technology are included in otherintangibleassets,netintheCompany’scondensedconsolidatedbalancesheets. Thefollowingtablesummarizesthedefinite-livedintangibleassetsandtherelatedaccumulatedamortization(inthousands):
February 28, August 31,2019 2018
Grosscarryingamount $ 36,317 $ 36,122Accumulatedamortization (24,152) (22,609)
Netcarryingamount $ 12,165 $ 13,513
There has beennoimpairment charge for the six months ended February 28, 2019 and there were no indicators of impairmentidentifiedasaresultoftheCompany’sreviewofeventsandcircumstancesrelatedtoitsexistingdefinite-livedintangibleassets.
13
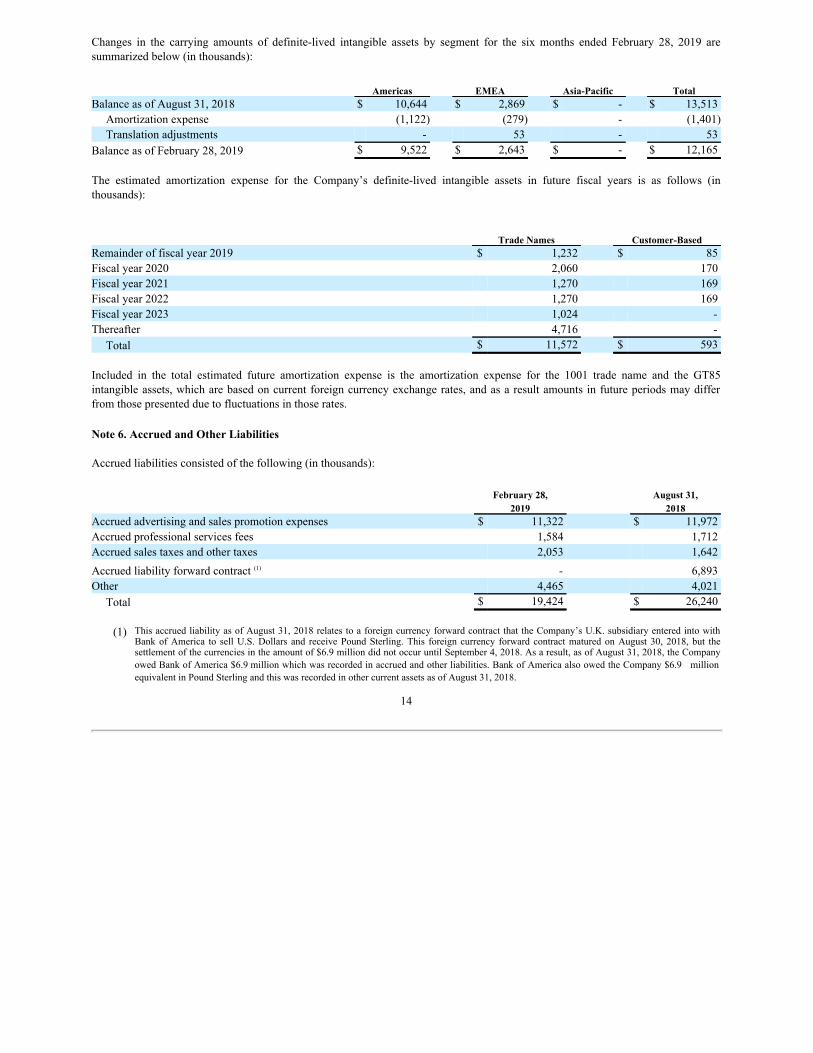
Changes in the carrying amounts of definite-lived intangible assets by segment for the six months ended February 28, 2019 aresummarizedbelow(inthousands):
Americas EMEA Asia-Pacific TotalBalanceasofAugust31,2018 $ 10,644 $ 2,869 $ - $ 13,513
Amortizationexpense (1,122) (279) - (1,401)Translationadjustments - 53 - 53
BalanceasofFebruary28,2019 $ 9,522 $ 2,643 $ - $ 12,165
The estimated amortization expense for the Company’s definite-lived intangible assets in future fiscal years is as follows (inthousands):
Trade Names Customer-BasedRemainderoffiscalyear2019 $ 1,232 $ 85Fiscalyear2020 2,060 170Fiscalyear2021 1,270 169Fiscalyear2022 1,270 169Fiscalyear2023 1,024 -Thereafter 4,716 -
Total $ 11,572 $ 593
Included in the total estimated future amortization expense is the amortization expense for the 1001 trade name and the GT85intangibleassets, whicharebasedoncurrent foreigncurrencyexchangerates, andasaresult amountsinfutureperiodsmaydifferfromthosepresentedduetofluctuationsinthoserates.
Note 6. Accrued and Other Liabilities
Accruedliabilitiesconsistedofthefollowing(inthousands):
February 28, August 31,2019 2018
Accruedadvertisingandsalespromotionexpenses $ 11,322 $ 11,972Accruedprofessionalservicesfees 1,584 1,712Accruedsalestaxesandothertaxes 2,053 1,642Accruedliabilityforwardcontract(1) - 6,893Other 4,465 4,021
Total $ 19,424 $ 26,240
(1) ThisaccruedliabilityasofAugust31,2018relatestoaforeigncurrencyforwardcontractthattheCompany’sU.K.subsidiaryenteredintowithBank of America to sell U.S. Dollars and receive Pound Sterling. This foreign currency forward contract matured on August 30, 2018, but thesettlementofthecurrenciesintheamountof$6.9milliondidnotoccuruntilSeptember4,2018.Asaresult,asofAugust31,2018,theCompanyowedBankofAmerica$6.9millionwhichwasrecordedinaccruedandotherliabilities.BankofAmericaalsoowedtheCompany$6.9 millionequivalentinPoundSterlingandthiswasrecordedinothercurrentassetsasofAugust31,2018.
14
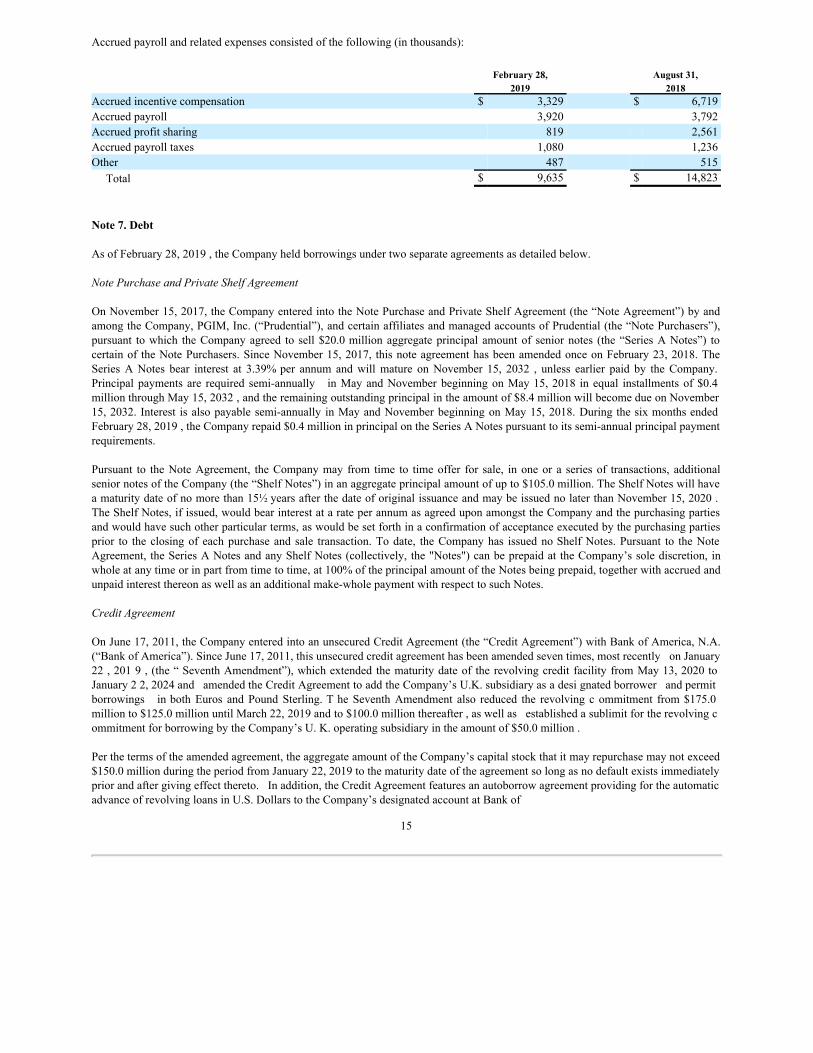
Accruedpayrollandrelatedexpensesconsistedofthefollowing(inthousands):
February 28, August 31,2019 2018
Accruedincentivecompensation $ 3,329 $ 6,719Accruedpayroll 3,920 3,792Accruedprofitsharing 819 2,561Accruedpayrolltaxes 1,080 1,236Other 487 515
Total $ 9,635 $ 14,823
Note 7. Debt
AsofFebruary28,2019,theCompanyheldborrowingsundertwoseparateagreementsasdetailedbelow.
Note Purchase and Private Shelf Agreement
OnNovember15,2017,theCompanyenteredintotheNotePurchaseandPrivateShelfAgreement(the“NoteAgreement”)byandamongtheCompany,PGIM,Inc.(“Prudential”),andcertainaffiliatesandmanagedaccountsofPrudential(the“NotePurchasers”),pursuant to which the Company agreed to sell$20.0million aggregate principal amount of senior notes (the “Series ANotes”) tocertainof theNotePurchasers.SinceNovember15, 2017, this noteagreement hasbeenamendedonceonFebruary23, 2018.TheSeries A Notes bear interest at 3.39%per annum and will mature onNovember 15, 2032 , unless earlier paid by the Company.Principal payments are required semi-annually in May and November beginning onMay15, 2018 in equal installments of$0.4millionthroughMay15,2032,andtheremainingoutstandingprincipalintheamountof$8.4millionwillbecomedueonNovember15, 2032. Interest is alsopayable semi-annually in MayandNovemberbeginning on May15, 2018.DuringthesixmonthsendedFebruary28,2019,theCompanyrepaid$0.4millioninprincipalontheSeriesANotespursuanttoitssemi-annualprincipalpaymentrequirements.
Pursuant to the Note Agreement, the Company may fromtime to time offer for sale, in one or a series of transactions, additionalseniornotesoftheCompany(the“ShelfNotes”)inanaggregateprincipalamountofupto$105.0million.TheShelfNoteswillhaveamaturitydateofnomorethan15½yearsafterthedateoforiginalissuanceandmaybeissuednolaterthanNovember15,2020.TheShelfNotes,ifissued,wouldbearinterestatarateperannumasagreeduponamongsttheCompanyandthepurchasingpartiesandwouldhavesuchotherparticularterms,aswouldbesetforthinaconfirmationofacceptanceexecutedbythepurchasingpartiesprior to the closing of each purchase and sale transaction. To date, the Company has issuednoShelf Notes. Pursuant to the NoteAgreement, theSeriesANotesandanyShelfNotes(collectively, the"Notes")canbeprepaidattheCompany’ssolediscretion,inwholeatanytimeorinpartfromtimetotime,at100%oftheprincipalamountoftheNotesbeingprepaid,togetherwithaccruedandunpaidinterestthereonaswellasanadditionalmake-wholepaymentwithrespecttosuchNotes.
Credit Agreement
OnJune17,2011,theCompanyenteredintoanunsecuredCreditAgreement(the“CreditAgreement”)withBankofAmerica,N.A.(“BankofAmerica”).SinceJune17,2011,thisunsecuredcreditagreementhasbeenamendedseventimes,mostrecentlyonJanuary22,2019,(the“SeventhAmendment”),whichextendedthematurity date of the revolvingcredit facility fromMay13,2020toJanuary22,2024andamendedtheCreditAgreementtoaddtheCompany’sU.K.subsidiaryasadesignatedborrowerandpermitborrowings inboth Euros and Pound Sterling.The Seventh Amendment also reduced the revolving commitment from$175.0millionto$125.0millionuntilMarch22,2019andto$100.0millionthereafter,aswellasestablishedasublimitfortherevolvingcommitmentforborrowingbytheCompany’sU.K.operatingsubsidiaryintheamountof$50.0million.
Perthetermsoftheamendedagreement,theaggregateamountoftheCompany’scapitalstockthatitmayrepurchasemaynotexceed$150.0millionduringtheperiodfromJanuary22,2019tothematuritydateoftheagreementsolongasnodefaultexistsimmediatelypriorandaftergivingeffectthereto.Inaddition,theCreditAgreementfeaturesanautoborrowagreementprovidingfortheautomaticadvanceofrevolvingloansinU.S.DollarstotheCompany’sdesignatedaccountatBankof
15
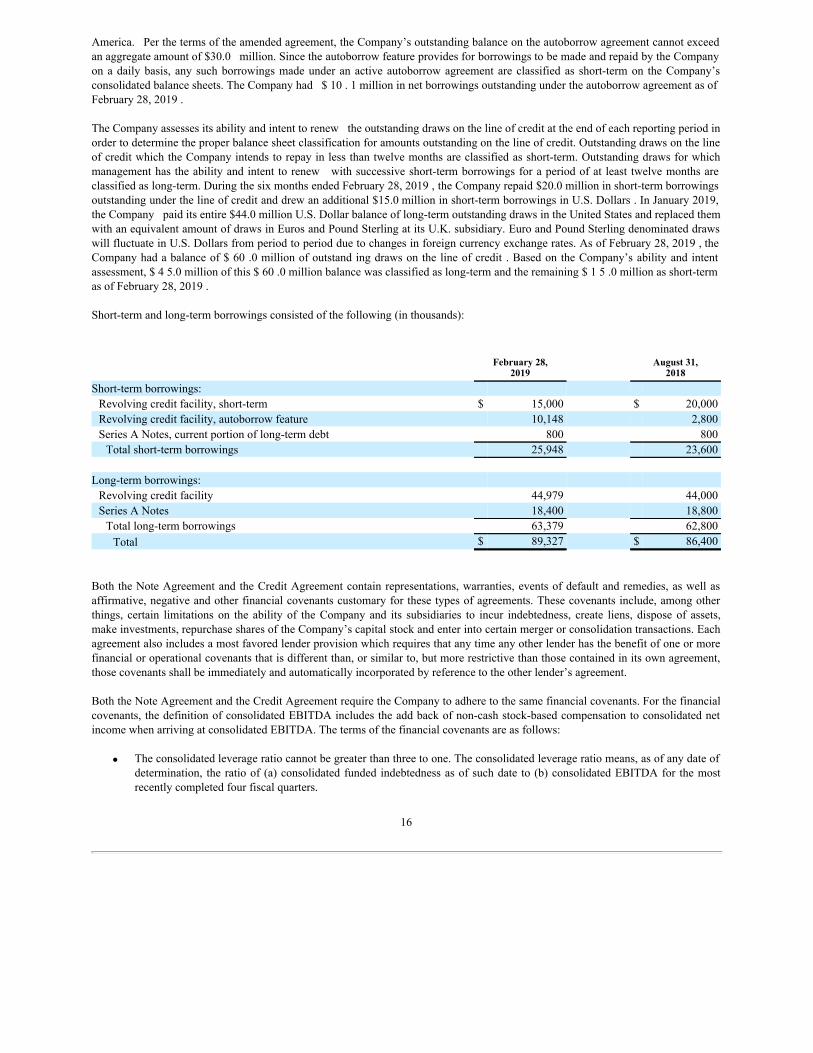
America.Perthetermsoftheamendedagreement,theCompany’soutstandingbalanceontheautoborrowagreementcannotexceedanaggregateamountof$30.0million.SincetheautoborrowfeatureprovidesforborrowingstobemadeandrepaidbytheCompanyona daily basis, any such borrowings made under an active autoborrowagreement are classified as short-termon the Company’sconsolidatedbalancesheets.TheCompanyhad$10.1millioninnetborrowingsoutstandingundertheautoborrowagreementasofFebruary28,2019.
TheCompanyassessesitsabilityandintenttorenewtheoutstandingdrawsonthelineofcreditattheendofeachreportingperiodinordertodeterminetheproperbalancesheetclassificationforamountsoutstandingonthelineofcredit.OutstandingdrawsonthelineofcreditwhichtheCompanyintendstorepayinlessthantwelvemonthsareclassifiedasshort-term.Outstandingdrawsforwhichmanagementhastheabilityandintenttorenewwithsuccessiveshort-termborrowingsforaperiodofat least twelvemonthsareclassifiedaslong-term.DuringthesixmonthsendedFebruary28,2019,theCompanyrepaid$20.0millioninshort-termborrowingsoutstandingunderthelineofcreditanddrewanadditional$15.0millioninshort-termborrowingsinU.S.Dollars.InJanuary2019,theCompanypaiditsentire$44.0millionU.S.Dollarbalanceoflong-termoutstandingdrawsintheUnitedStatesandreplacedthemwithanequivalentamountofdrawsinEurosandPoundSterlingatitsU.K.subsidiary.EuroandPoundSterlingdenominateddrawswillfluctuateinU.S.Dollarsfromperiodtoperiodduetochangesinforeigncurrencyexchangerates.AsofFebruary28,2019,theCompanyhadabalanceof$60.0millionofoutstandingdrawsonthelineofcredit .BasedontheCompany’s ability andintentassessment,$45.0millionofthis$60.0millionbalancewasclassifiedaslong-termandtheremaining$15.0millionasshort-termasofFebruary28,2019.
Short-termandlong-termborrowingsconsistedofthefollowing(inthousands):
February 28, August 31,2019 2018
Short-termborrowings:Revolvingcreditfacility,short-term $ 15,000 $ 20,000Revolvingcreditfacility,autoborrowfeature 10,148 2,800SeriesANotes,currentportionoflong-termdebt 800 800Totalshort-termborrowings 25,948 23,600
Long-termborrowings:Revolvingcreditfacility 44,979 44,000SeriesANotes 18,400 18,800Totallong-termborrowings 63,379 62,800Total $ 89,327 $ 86,400
BoththeNoteAgreementandtheCredit Agreementcontainrepresentations, warranties, eventsofdefault andremedies, aswell asaffirmative,negativeandotherfinancialcovenantscustomaryforthesetypesofagreements.Thesecovenantsinclude,amongotherthings, certain limitations on the ability of the Company and its subsidiaries to incur indebtedness, create liens, dispose of assets,makeinvestments,repurchasesharesoftheCompany’scapitalstockandenterintocertainmergerorconsolidationtransactions.Eachagreementalsoincludesamostfavoredlenderprovisionwhichrequiresthatanytimeanyotherlenderhasthebenefitofoneormorefinancialoroperationalcovenantsthatisdifferentthan,orsimilarto,butmorerestrictivethanthosecontainedinitsownagreement,thosecovenantsshallbeimmediatelyandautomaticallyincorporatedbyreferencetotheotherlender’sagreement.
BoththeNoteAgreementandtheCreditAgreementrequiretheCompanytoadheretothesamefinancialcovenants.Forthefinancialcovenants,thedefinitionofconsolidatedEBITDAincludestheaddbackofnon-cashstock-basedcompensationtoconsolidatednetincomewhenarrivingatconsolidatedEBITDA.Thetermsofthefinancialcovenantsareasfollows:
· Theconsolidatedleverageratiocannotbegreaterthanthreetoone.Theconsolidatedleverageratiomeans,asofanydateofdetermination, theratioof (a) consolidatedfundedindebtednessasof suchdateto(b) consolidatedEBITDAforthemostrecentlycompletedfourfiscalquarters.
16
· Theconsolidatedinterestcoverageratiocannotbelessthanthreetoone.Theconsolidatedinterestcoverageratiomeans,asofanydateofdetermination,theratioof(a)consolidatedEBITDAforthemostrecentlycompletedfourfiscalquartersto(b)consolidatedinterestchargesforthemostrecentlycompletedfourfiscalquarters.
AsofFebruary 28, 2019, theCompanywasin compliance with all debt covenants under both the Note Agreement andthe CreditAgreement.
Note 8. Share Repurchase Plan
OnJune19,2018,theCompany’sBoardofDirectorsapprovedasharebuy-backplan.Undertheplan,whichbecameeffectiveonSeptember1,2018,theCompanyisauthorizedtoacquireupto$75.0millionofitsoutstandingsharesthroughAugust31,2020.ThetimingandamountofrepurchasesarebasedontermsandconditionsasmaybeacceptabletotheCompany’sChiefExecutiveOfficer and Chief Financial Officer and in compliance with all laws and regulations applicable thereto . During the period fromSeptember1,2018throughFebruary28,2019,theCompanyrepurchased70,684sharesatanaveragepriceof$170.60pershare,foratotalcostof$12.1millionunderthis$75.0millionplan.
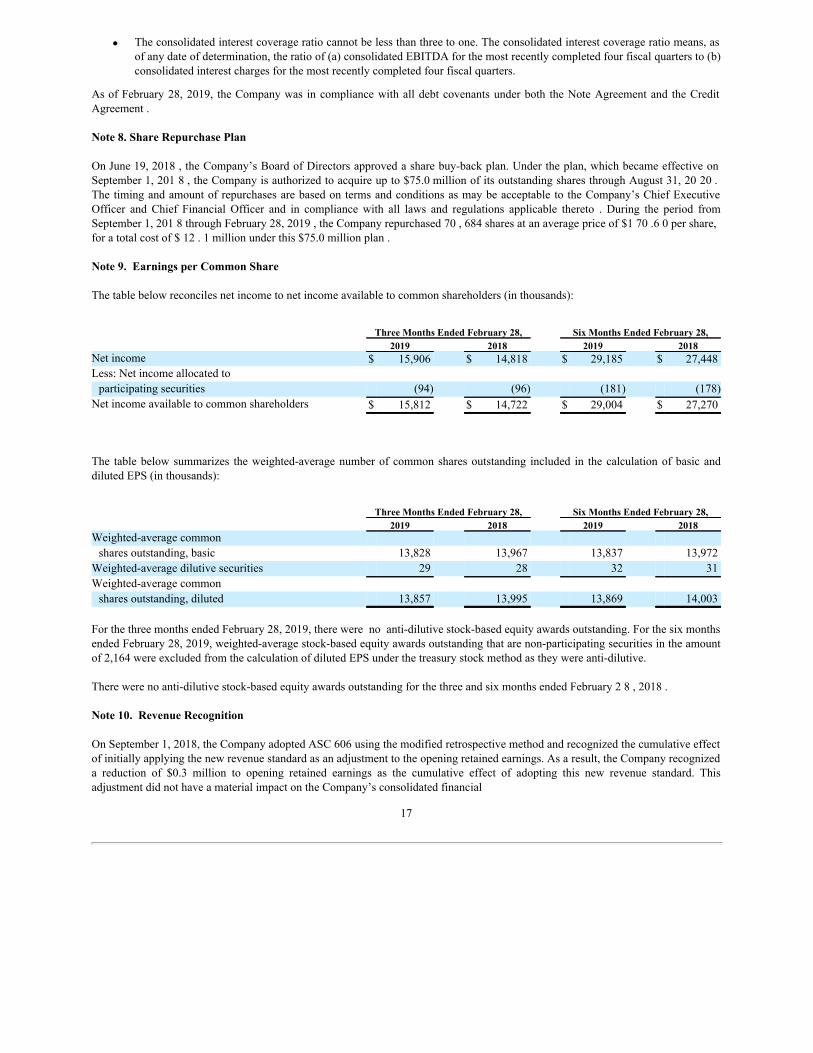
Note 9. Earnings per Common Share
Thetablebelowreconcilesnetincometonetincomeavailabletocommonshareholders(inthousands):
Three Months Ended February 28, Six Months Ended February 28,2019 2018 2019 2018
Netincome $ 15,906 $ 14,818 $ 29,185 $ 27,448Less:Netincomeallocatedtoparticipatingsecurities (94) (96) (181) (178)
Netincomeavailabletocommonshareholders $ 15,812 $ 14,722 $ 29,004 $ 27,270
The table belowsummarizes the weighted-average number of commonshares outstanding included in the calculation of basic anddilutedEPS(inthousands):
Three Months Ended February 28, Six Months Ended February 28,2019 2018 2019 2018
Weighted-averagecommonsharesoutstanding,basic 13,828 13,967 13,837 13,972
Weighted-averagedilutivesecurities 29 28 32 31Weighted-averagecommonsharesoutstanding,diluted 13,857 13,995 13,869 14,003
ForthethreemonthsendedFebruary28,2019,therewerenoanti-dilutivestock-basedequityawardsoutstanding.ForthesixmonthsendedFebruary28,2019,weighted-averagestock-basedequityawardsoutstandingthatarenon-participatingsecuritiesintheamountof2,164wereexcludedfromthecalculationofdilutedEPSunderthetreasurystockmethodastheywereanti-dilutive.
Therewerenoanti-dilutivestock-basedequityawardsoutstandingforthethreeandsixmonthsendedFebruary28,2018.
Note 10. Revenue Recognition
OnSeptember1,2018,theCompanyadoptedASC606usingthemodifiedretrospectivemethodandrecognizedthecumulativeeffectofinitiallyapplyingthenewrevenuestandardasanadjustmenttotheopeningretainedearnings.Asaresult,theCompanyrecognizeda reduction of $0.3 million to opening retained earnings as the cumulative effect of adopting this new revenue standard. ThisadjustmentdidnothaveamaterialimpactontheCompany’sconsolidatedfinancial
17
statements.ResultsforreportingperiodsbeginningafterSeptember1,2018arepresentedunderASC606,whilepriorperiodamountsarepresentedundertheaccountingstandardsineffectforthoserespectiveperiods.
As a result of the adoption of ASC 606 and management’s consideration of the factors in the five-step approach, the timing forrecognizingrevenuehasbeendelayedforcertaincustomersandacceleratedforothers,particularlyforcustomersintheCompany’sAmericassegment.UnderASC606,thetimingofrevenuerecognitionisdeterminedwhencontroltransferstoourcustomers,whileunderthepriorrevenuerecognitionguidance,timingofrevenuewasfocusedmoreonthetransferoftherisksandrewards.Underthepriorrevenuerecognitionguidance,theCompanyeffectivelyretainedtheriskoflossuntilthegoodsreachedthecustomerasifthosecustomershaddesignatedshippingterms.UnderASC606,transferofrisksandrewardsisjustoneindicatorofwhethercontrolhastransferredandmanagementdeterminedthatrevenue,afterconsideringallindicators,isrecognizedforthosecustomerswhengoodsareshippedorpickedupfromtheCompany’swarehouses.TheCompanyassessedthefinanciallineitemsimpactedbyadoptingthisstandard compared to the previous revenue guidance, and management concluded that any differences in financial statement lineitemsareinconsequentialtotheCompany’sconsolidatedfinancialstatementsforboththethreeandsixmonthsendedFebruary28,2019.
The following paragraphs detail the Company’s revenue recognition policies and provide additional information used in itsdeterminationofnetsalesandcontractbalancesunderASC606.
Revenue Recognition
TheCompanygeneratesrevenuefromsalesofitsproductstocustomersinitsAmericas,EMEAandAsia-Pacificsegments.ProductsalesfortheCompanyincludemaintenanceproductsandhomecareandcleaningproducts.TheCompanyrecognizesrevenuerelatedtothesaleoftheseproductswhenitsatisfiesaperformanceobligationinanamountreflectingtheconsiderationtowhichitexpectstobeentitled. Salesarerecordednetofallowancesfordamagedgoodsandothersalesreturns, salesincentives, tradepromotionsandcashdiscounts.TheCompanyappliesafive-stepapproachindeterminingtheamountandtimingofrevenuetoberecognizedwhichincludes the following: (1) identifying the contract with a customer, (2) identifying the performance obligations in the contract,(3) determining the transaction price, (4) allocating the transaction price to the performance obligations in the contract and(5)recognizingrevenuewhentheperformanceobligationissatisfied.
Contracts with customers are renewable periodically and contain terms and conditions with respect to payment, delivery, salesincentives, warrantyandsupply,butdonotrequiremandatorypurchasecommitments. Intheabsenceofaspecificsalesagreementwith a customer, the Company’s standard terms and conditions at the time of acceptance of purchase orders apply to the salestransaction.TheCompany’sstandardtermsandconditionsareeitherincludedinastandalonedocumentorontheCompany’spricelists or both, and these standard terms and conditions are provided to the customer prior to the sales transaction. The Companyconsidersthecustomerpurchaseorders,governedbyspecificsalesagreementsortheCompany’sstandardtermsandconditions,tobethecontractwiththecustomer.TheCompanyconsiderseachtransactiontosellproductsasseparateanddistinct,withnoadditionalpromisesmade,andasaresult,alloftheCompany'ssalesaresingleperformanceobligationarrangementsforwhichthetransactionprice is equivalent to the stated price of the product, net of any variable consideration for items such as sales returns, discounts,rebates andother sales incentives. TheCompanyrecognizes sales at a point in time upontransferring control of its product to thecustomer.Thistypicallyoccurswhenproductsareshippedordelivered,dependingonwhenrisksoflossandtitlehavepassedtothecustomerperthetermsofthecontract.
TaxesimposedbygovernmentalauthoritiesontheCompany'srevenue,suchassalestaxesandvalueaddedtaxes,areexcludedfromnetsales.Salescommissionsarepaidtocertainthird-partiesbaseduponspecificsaleslevelsachievedduringadefinedtimeperiod.SincetheCompany’s contracts related to thesesales commissions donot exceedoneyear, the Companyhaselected as a practicalexpedienttoexpensethesepaymentsasincurred.TheCompanyalsoelectedthepracticalexpedientrelatedtoshippingandhandlingfeeswhichallowstheCompanytoaccountforfreightcostsasfulfillmentactivitiesinsteadofassessingsuchactivitiesasperformanceobligations.TheCompany’sfreightcostsaresometimespaidbythecustomer,whileothertimes,thefreightcostsareincludedinthesalesprice.TheCompanydoesnotaccountforfreightcostsasaseparateperformanceobligation,butratherasanactivityperformedtotransfertheproductstoitscustomers.
Variable Consideration - Sales Incentives
Indeterminingthetransactionprice,theCompanyevaluateswhetherthepriceissubjecttorefundoradjustmentrelatedtovariableconsideration to determine the net consideration to which the Company expects to be entitled. The Company records estimates ofvariableconsideration,whichprimarilyincludesrebates(cooperativemarketingprogramsandvolume-based
18
discounts), coupon offers, cash discount allowances, and sales returns, as a reduction of sales in its consolidated statements ofoperations.Theseestimatesarebasedonthemostlikelyoutcomemethodconsideringallreasonablyavailableinformation,includingcurrentandpasttradepromotionspendingpatterns,statusoftradepromotionactivities,theinterpretationofhistoricalspendingtrendsby customer and category, customer agreements and/or currently known factors that arise in the normal course of business. TheCompanyreviewsitsassumptionsandadjuststhesalesincentiveallowancesaccordinglyonaquarterlybasis.
Rebates—TheCompanyoffersvariouson-goingtradepromotionprogramswithcustomersthatrequiremanagementtoestimateandaccruefortheexpectedcostsofsuchprograms.Theseprogramsincludecooperativemarketing,volume-baseddiscounts,shelfpricereductions,considerationandallowancesgiventoretailersforshelfspaceand/orfavorabledisplaypositionsintheirstoresandotherpromotionalactivities.Costsrelatedtorebates,cooperativeadvertisingandotherpromotionalactivitiesarerecordedasareductiontosalesupondeliveryoftheCompany’sproductstoitscustomers.AsofFebruary28,2019,theCompanyhada$8.4millionbalanceinrebate liabilities, which are included in accrued liabilities on the Company’s condensed consolidated balance sheets, and recordedapproximately$4.5millionand$8.8millioninrebates as a reduction to sales during the three and six month periods endedFebruary28,2019,respectively.Coupons—Couponcostsarebaseduponhistorical redemptionratesandarerecordedasareductiontosalesasincurred,whichiswhenthecouponsarecirculated.AsofFebruary28,2019,theCompanyhada$0.2millionbalanceincouponredemptionliabilities,whichareincludedinaccruedliabilitiesontheCompany’scondensedconsolidatedbalancesheets,andrecordedapproximately$0.1million and $0.2million in coupons as a reduction to sales during the three and six month periods ended February 28, 2019,respectively.
Cashdiscounts—TheCompanyofferscertainofitscustomersacashdiscountprogramtoincentivizethemtopaytheinvoiceearlierthanthenormalpaymentdateontheinvoice. Althoughpayment termsvary, mostcustomerstypicallypaywithin30to90daysofinvoicing. As ofFebruary 28, 2019 , the Company had a $0.4million balance in the allowance for cash discounts and recordedapproximately$1.0millionand$2.0millionincashdiscountsasareductiontosalesduringthethreeandsixmonthperiodsendedFebruary28,2019,respectively.Salesreturns—TheCompanyrecognizesrevenuenetofallowancesforestimatedreturns,whichisbasedonhistoricalreturnrates,with a corresponding reduction to cost of products sold. Although the Company typically does not have definitive sales returnprovisionsincludedinthecontracttermswithitscustomers,whensuchprovisionshavebeenincluded,theyhavenotbeensignificant.UndertheprovisionsofASC606,theCompanyisnowrequiredtopresentitsprovisionforsalesreturnsonagrossbasisasaliability.TheCompany’srefundliabilityforsalesreturnswas$0.4millionatFebruary28,2019,whichisincludedinaccruedliabilitiesandrepresentstheamountexpectedtobeowedtothecustomersforproductreturns.TheCompanynowalsorecordsanassetforthevalueofinventorythatrepresentstherighttorecoverproductsfromcustomersassociatedwithsalesreturns.Thevalueofthisinventoryisrecordedtoothercurrentassetsandthebalanceinthisaccountassociatedwithproductreturnswas$0.1millionatFebruary28,2019.Inpriorperiods,theCompanyrecognizedaprovisionforestimatedsalesreturnsonanetbasis,andasallowedunderthemodifiedretrospectiveapproach,thecomparativepriorperiodinformationhasnotbeenrestatedforthischange.
Disaggregation of Revenue
TheCompany'srevenueispresentedonadisaggregatedbasisinNote14–BusinessSegmentsandForeignOperationsincludedinthisreport.TheCompanydisclosescertaininformationaboutitsbusinesssegments,whicharedeterminedconsistentwiththewaytheCompany’sChiefOperatingDecisionMakerorganizesandevaluatesfinancialinformationinternallyformakingoperatingdecisionsand assessing performance. The Chief Operating Decision Maker assesses and measures revenue based on geographic area andproductgroups.
Contract Balances
Contract liabilities consist of deferred revenue related to undelivered products. Deferred revenue is recorded when payments havebeenreceivedfromcustomers for undelivered products. Revenueis subsequently recognizedwhenrevenuerecognition criteria aremet,generallywhencontroloftheproducttransferstothecustomer.TheCompanyhadcontractliabilitiesof$1.1millionand$1.2millionasofSeptember1,2018andFebruary28,2019,respectively.Allofthe$1.1millionthatwasincludedincontractliabilitiesasofSeptember1,2018wasrecognizedtorevenueduringthefirstquarteroffiscalyear2019.
19
ThesecontractliabilitiesarerecordedinaccruedliabilitiesontheCompany’scondensedconsolidatedbalancesheets.TheCompanydidnothaveanycontractassetsasofSeptember1,2018andFebruary28,2019.
Note 1 1 . Related Parties
OnOctober 11, 2011, the Company’s Board of Directors elected Mr. Gregory A. Sandfort as a director of WD-40 Company. Mr.SandfortistheChiefExecutiveOfficerofTractorSupplyCompany(“TractorSupply”),whichisaWD-40CompanycustomerthatacquiresproductsfromtheCompanyintheordinarycourseofbusiness.
The condensed consolidated financial statements include sales to Tractor Supply of $0.3million and$0.2million for the threemonthsendedFebruary28,2019and2018,respectively,and$0.7millionand$0.5millionforthesixmonthsendedFebruary28,2019and2018,respectively.AccountsreceivablefromTractorSupplywere$0.3millionatFebruary28,2019and$0.5millionasofAugust31,2018.
Note 1 2 . Commitments and Contingencies
Purchase Commitments
TheCompanyhasongoingrelationshipswithvarioussuppliers(contractmanufacturers)whomanufacturetheCompany’sproducts.Thecontractmanufacturersmaintaintitleandcontrolofcertainrawmaterialsandcomponents,materialsutilizedinfinishedproducts,andofthefinishedproductsthemselvesuntilshipmenttotheCompany’scustomersorthird-partydistributioncentersinaccordancewithagreeduponshipmentterms.AlthoughtheCompanyhasdefinitiveminimumpurchaseobligationsincludedinthecontracttermswith certain of its contract manufacturers, when such obligations have been included, they have either been immaterial or theminimumamountshavebeensuchthattheyarewellbelowthevolumeofgoodsthattheCompanyhashistoricallypurchased.Intheordinarycourseofbusiness,supplyneedsarecommunicatedbytheCompanytoitscontractmanufacturersbasedonordersandshort-termprojections, rangingfromtwoto five months. TheCompanyis committed to purchase the products producedbythe contractmanufacturersbasedontheprojectionsprovided.
Upontheterminationofcontractswithcontractmanufacturers,theCompanyobtainscertaininventorycontrolrightsandisobligatedtoworkwiththecontractmanufacturertosellthroughallproductheldbyormanufacturedbythecontractmanufactureronbehalfoftheCompanyduringtheterminationnotificationperiod.Ifanyinventoryremainsatthecontractmanufacturerattheterminationdate,theCompanyisobligatedtopurchasesuchinventorywhichmayincluderawmaterials,componentsandfinishedgoods.Theamountsforinventorypurchasedunderterminationcommitmentshavebeenimmaterial.
Inadditiontothecommitmentstopurchaseproductsfromcontractmanufacturersdescribedabove,theCompanymayalsoenterintocommitmentswithothermanufacturerstopurchasefinishedgoodsandcomponentstosupportinnovationandrenovationinitiativesand/orsupplychaininitiatives.AsofFebruary28,2019,nosuchcommitmentswereoutstanding.
Litigation
Fromtimetotime,theCompanyissubjecttovariousclaims,lawsuits,investigationsandproceedingsarisingintheordinarycourseofbusiness, including but not limited to, product liability litigation and other claims and proceedings with respect to intellectualproperty,breachofcontract,laborandemployment,taxandothermatters.Exceptasdisclosedherein,therearenounassertedclaimsor pending proceedings for claims against the Company that the Company believes may result in a reasonably possible loss, theCompanybelievesthatnoreasonablypossibleoutcomeofanysuchclaimwillhaveamateriallyadverseimpactontheCompany’sfinancialcondition,resultsofoperationsorcashflows.
OnoraboutJuly31,2018,claimsfordamageswereassertedagainsttheCompanyinan“AmendedStatementofClaim”filedinacivilproceedinginMalaysiabeforetheHighCourtofMalayaatShahAlamintheStateofSelangorDarulEhsan,CivilSuitNo.BA-22NCvC-531-09/2017 (the “Malay Litigation”). The Malay Litigation was first filed in September 2017 by Sunway Winstar Sdn.Bhd. (“Sunway”) against a former employee of Sunway and the former employee’s new employer, Ekotrends Capital Sdn. Bdh(“Ekotrends”).SunwaywasamarketingdistributorfortheCompanyforthecountryofMalaysiafrom2004until2017.EkotrendsisanaffiliateofBunSengHardwareSdn.Bdh.(“BunSeng”), theCompany’scurrentmarketingdistributorforMalaysia. TheMalayLitigation asserted that the former employee and Ekotrends misappropriated confidential information, including customer lists,associatedwithSunway’sterminatedrelationshipastheCompany’sexclusivemarketingdistributor.ByorderofthecourtfollowingtheCompany’smotiontointerveneinordertoprotectand
20
assert its right to ownership of the customer lists and other confidential information associated with the Company’s business inMalaysia, Sunway filed its Amended Statement of Claim to add Bun Seng as a defendant and to assert new and separate claimsagainsttheCompanyallegingconspiracywithEkotrendsandBunSengtoinjurethebusinessandreputationofSunway.
The Company denies the allegations asserted by Sunway and will vigorously defend itself in the Malay Litigation. The CompanybelievesthatanunfavorableoutcomeintheMalayLitigationisnotprobable, butthatanawardofdamagesisreasonablypossible.Due to uncertainty as to the theories for recovery of damages asserted by Sunway against the Company and as to results inproceedingsunderMalaysianlaw,theCompanyisunabletoestimatethepossiblelossorrangeofloss.
ForfurtherinformationontheriskstheCompanyfacesfromexistingandfutureclaims,suits,investigationsandproceedings,seetheCompany’sriskfactorsdisclosedinPart I―Item1A,“RiskFactors,”inits AnnualReport onForm10-Kforthefiscal yearendedAugust31,2018,whichwasfiledwiththeSEConOctober22,2018.
Indemnifications
AspermittedunderDelawarelaw,theCompanyhasagreementswherebyitindemnifiesseniorofficersanddirectorsforcertaineventsor occurrences while theofficer or director is, or was, servingat theCompany’s request in suchcapacity. ThemaximumpotentialamountoffuturepaymentstheCompanycouldberequiredtomakeundertheseindemnificationagreementsisunlimited;however,the Company maintains Director and Officer insurance coverage that mitigates the Company’s exposure with respect to suchobligations. As a result of the Company’s insurance coverage, management believes that the estimated fair value of theseindemnificationagreementsisminimal.Thus,noliabilitieshavebeenrecordedfortheseagreementsasofFebruary28,2019.
Fromtime to time, the Company enters into indemnification agreements with certain contractual parties in the ordinary course ofbusiness,includingagreementswithlenders,lessors,contractmanufacturers, marketingdistributors,customersandcertainvendors.All suchindemnification agreements are enteredintoin thecontext of theparticular agreements andare providedin anattempt toproperly allocate risk of loss in connection with the consummation of the underlying contractual arrangements. Although themaximum amount of future payments that the Company could be required to make under these indemnification agreements isunlimited, management believes that the Company maintains adequate levels of insurance coverage to protect the Company withrespect to most potential claims arising fromsuch agreements and that such agreements do not otherwise have value separate andapart from the liabilities incurred in the ordinary course of the Company’s business. Thus, noliabilities have been recorded withrespecttosuchindemnificationagreementsasofFebruary28,2019.
Note 1 3 . Income Taxes
The Company uses an estimated annual effective tax rate, which is based on expected annual income, statutory tax rates and taxplanningopportunitiesavailableinthevariousjurisdictionsinwhichtheCompanyoperates,todetermineitsquarterlyprovisionforincometaxes.Certainsignificantorunusualitemsareseparatelyrecognizedinthequarterinwhichtheyoccurandcanbeasourceofvariabilityintheeffectivetaxratesfromquartertoquarter.
OnDecember 20, 2017the United States House of Representatives andthe Senate passed the “TaxCuts andJobs Act” (the “TaxAct”),whichwassignedintolawonDecember22,2017andbecameeffectivebeginningJanuary1,2018.Duetothecomplexityofthe Tax Act, the SEC issued guidance in SAB 118 which clarified the accounting for income taxes under ASC 740 if certaininformationwasnotyetavailable,preparedoranalyzedinreasonabledetailtocompletetheaccountingforincometaxeffectsoftheTaxAct.SAB118providedforameasurementperiodofuptooneyearaftertheenactmentoftheTaxAct,duringwhichtimetherequiredanalysesandaccountingmusthavebeencompleted.Duringthemeasurementperiod,(i)incometaxeffectsoftheTaxActmusthavebeenreportediftheaccountingwascompleted;(ii)provisionalamountsmusthavebeenreportedforincometaxeffectsoftheTaxActforwhichtheaccountingwasincompletebutareasonableestimatecouldbedetermined;and(iii) provisionalamountswere not required to be reported for income tax effects of the Tax Act for which a reasonable estimate could not be determined.Duringfiscalyear2018,theCompanyrecordedprovisionalamountsfortheincometaxeffectsofthechangesintaxlawandtaxrates,asreasonableestimatesweredeterminedbymanagementduringthisperiod.Duringthefirstquarteroffiscalyear2019,theCompanydidnotsignificantlyadjustprovisionalamountsrecordedinthepriorfiscalyearandtheSAB118measurementperiodsubsequentlyended on December 22, 2018 , which was during the Company’s second quarter of fiscal year 2019 . Although the Company nolongerconsiderstheseamountstobeprovisional,thedeterminationoftheTaxAct’sincometaxeffectsmaychangefollowingfuturelegislationorfurther
21
interpretationoftheTaxActbasedonthepublicationofrecentlyproposedU.S.TreasuryregulationsandguidancefromtheInternalRevenueServiceandstatetaxauthorities.
On November 28, 2018 the U.S. Treasury released proposed regulations that specifically address, and are inconsistent with, theCompany’spositionregardingtheinterpretationandapplicationoftheTaxAct’smandatoryone-time“tolltax”onunremittedforeignearnings. These newly proposed regulations are subject to the regulatory review process prior to finalization and do not takeprecedence over enacted law. As such, the Company’s position regarding its interpretation and application of the toll tax has notchanged.
Managementhasassessedthefiscalyear2019impactsoftheTaxActandhasdeterminedthattheCompanywilllosethebenefitfromtheDomesticProductionActivitiesDeduction.However,theCompanywillalsoacquirecertainnetbenefitsbeginninginfiscalyear2019fromthefavorable impacts oftheForeignDerivedIntangibleIncome(“FDII”) sectionoftheTaxAct, partially offset bytheunfavorable impacts of the Global Intangible Low-Taxed Income (“GILTI”). Another significant section of the Tax Act, the BaseErosionAnti-AbuseTax(“BEAT”),willnotapplytotheCompany’sfiscalyear2019astheCompanydoesnotmeettheminimumrevenue requirements under the BEAT. The Company will continue to evaluate the BEAT to determine whether it will have anysignificantimpactontheCompany’sconsolidatedfinancialstatementsinfutureyears.
TheTaxActrequirestaxpayerstoelectanaccountingmethodforexpensesallocatedtotheGILTIcalculation.AsASC740,IncomeTaxes , doesnotdirectlyaddresstheaccountingforGILTI,theFASBstaffconcludedthatentitiesmustmakeanaccountingpolicyelectiontoeither:(1)treatGILTIasaperiodcostifandwhenincurred,or(2)recognizedeferredtaxesforbasisdifferencesthatareexpectedtoreverseasGILTIinfutureyears. Duringthefirst quarter offiscal year2019,managementmadetheaccountingpolicyelectiontoaccountforexpensesallocatedtotheGILTIcalculationundertheperiodcostmethod.
Theprovisionforincometaxeswasconstantat18.7%ofincomebeforeincometaxesforeachofthethreemonthsendedFebruary28,2019and2018.ForthethreemonthsendedFebruary28,2018,theCompany’sincometaxratewastheresultofthefavorableimpactsfromtheTaxActwhichwaseffectiveinthesecondquarteroftheCompany’fiscalyear2018.FortheCompany’sfiscalyear2019,theCompany’sfederalstatutorytaxrateis21%.ForthethreemonthsendedFebruary28,2019,theCompany’sincometaxratewasfavorablyimpactedprimarilyduetoexcesstaxbenefitsfromsettlementsofstock-basedequityawardsduringthequarterthatarerecognizedintheprovisionforincometax.
Theprovisionforincometaxeswas18.2%and21.1%ofincomebeforeincometaxesforthesixmonthsendedFebruary28,2019and2018, respectively . The decrease in the effective incometax rate fromperiod to period was primarily due to the continuedimpactresultingfromtheTaxActanditseffectontheCompany’sfiscalyear.AstheCompany’sfiscalyearendsonAugust31st,theTaxActresultedinablendedfederalstatutorytaxrateof25.7%forfiscalyear2018.Forfiscalyear2019,however,theTaxActisineffectfortheCompany’sfullyearandresultedinafederalstatutorytaxratefortheyearof21%.
TheCompanyissubjecttotaxationintheU.S.andinvariousstateandforeignjurisdictions.Duetoexpiredstatutesandclosedaudits,the Company’s federal income tax returns for years prior to fiscal year 2016 are not subject to examination by the U.S. InternalRevenueService.Generally, for the majority of state and foreign jurisdictions where the Companydoes business, periods prior tofiscalyear2015arenolongersubjecttoexamination.TheCompanyhasestimatedthatupto$0.2millionofunrecognizedtaxbenefits related to income tax positions may be affected by the resolution of tax examinations or expiring statutes oflimitationwithinthenexttwelvemonths.Auditoutcomesandthetimingofsettlementsaresubjecttosignificantuncertainty.
22
Note 1 4 . Business Segments and Foreign Operations
TheCompanyevaluatestheperformanceofitssegmentsandallocatesresourcestothembasedonsalesandoperatingincome.TheCompanyisorganizedonthebasisofgeographicalareaintothefollowingthreesegments:theAmericas;EMEA;andAsia-Pacific.Segmentdatadoesnotincludeinter-segmentrevenues.Unallocatedcorporateexpensesaregeneralcorporateoverheadexpensesnotdirectly attributable to the operating segments and are reported separate from the Company’s identified segments. The corporateoverheadcostsincludeexpensesfortheCompany’saccountingandfinance,informationtechnology,humanresources,researchanddevelopment, quality control and executive management functions, as well as all direct costs associated with public companycompliancemattersincludinglegal,auditandotherprofessionalservicescosts.
Summaryinformationaboutreportablesegmentsisasfollows(inthousands):
UnallocatedFor the Three Months Ended Americas EMEA Asia-Pacific Corporate (1) TotalFebruary 28, 2019:
Netsales $ 43,897 $ 40,966 $ 16,472 $ - $ 101,335Incomefromoperations $ 9,992 $ 10,630 $ 5,143 $ (6,050) $ 19,715Depreciationandamortizationexpense $ 1,132 $ 644 $ 71 $ 53 $ 1,900
Interestincome $ 10 $ 2 $ 33 $ - $ 45Interestexpense $ 620 $ 63 $ 2 $ - $ 685
February 28, 2018:Netsales $ 44,967 $ 39,632 $ 16,657 $ - $ 101,256Incomefromoperations $ 10,336 $ 10,532 $ 5,181 $ (6,681) $ 19,368Depreciationandamortizationexpense $ 1,046 $ 646 $ 81 $ 196 $ 1,969
Interestincome $ - $ 118 $ 13 $ - $ 131Interestexpense $ 999 $ - $ 3 $ - $ 1,002
Six Months Ended:February 28, 2019:
Netsales $ 91,688 $ 79,711 $ 31,218 $ - $ 202,617Incomefromoperations $ 21,294 $ 19,005 $ 8,884 $ (13,067) $ 36,116Depreciationandamortizationexpense $ 2,263 $ 1,316 $ 141 $ 105 $ 3,825
Interestincome $ 16 $ 20 $ 60 $ - $ 96Interestexpense $ 1,328 $ 63 $ 4 $ - $ 1,395
February 28, 2018:Netsales $ 91,130 $ 74,660 $ 33,063 $ - $ 198,853Incomefromoperations $ 21,366 $ 18,368 $ 9,801 $ (13,031) $ 36,504Depreciationandamortizationexpense $ 2,140 $ 1,205 $ 153 $ 388 $ 3,886
Interestincome $ 1 $ 237 $ 26 $ - $ 264Interestexpense $ 1,838 $ - $ 5 $ - $ 1,843
(1) Unallocated corporate expenses are general corporate overhead expenses not directly attributable to any one of the businesssegments. TheseexpensesarereportedseparatefromtheCompany’sidentifiedsegmentsandareincludedinSelling,GeneralandAdministrativeexpensesontheCompany’scondensedconsolidatedstatementsofoperations.
23
TheCompany’s Chief Operating DecisionMaker does not reviewassets bysegment as part of the financial information provided.Therefore,noassetinformationisprovidedintheabovetable.
Netsalesbyproductgroupareasfollows(inthousands):
Three Months Ended February 28, Six Months Ended February 28,2019 2018 2019 2018
Maintenanceproducts $ 92,370 $ 92,319 $ 184,838 $ 180,349Homecareandcleaningproducts 8,965 8,937 17,779 18,504
Total $ 101,335 $ 101,256 $ 202,617 $ 198,853
Note 1 5 . Subsequent Events
OnMarch19,2019,theCompany’sBoardofDirectorsdeclaredacashdividendof$0.61persharepayableonApril30,2019toshareholdersofrecordonApril19,2019.
24
Item 2. Management’s Discussion and Analysis of Financial Condition and Results of Operations
As used in this report, the terms “we,” “our,” “us” and “the Company” refer to WD-40 Company and its wholly-owned subsidiaries, unless the context suggests otherwise. Amounts and percentages in tables and discussions may not total due torounding.
The following information is provided as a supplement to, and should be read in conjunction with, the unaudited condensedconsolidatedfinancialstatementsandnotestheretoincludedinPartI― Item1ofthisQuarterlyReportandtheauditedconsolidatedfinancialstatementsandnotestheretoandManagement’sDiscussionandAnalysisofFinancialConditionandResultsofOperationsincludedinourAnnualReport onForm10-Kforthefiscal yearendedAugust 31,2018, whichwasfiledwiththeSecuritiesandExchangeCommission(“SEC”)onOctober22,2018.
Inordertoshowtheimpact ofchangesinforeigncurrencyexchangeratesonourresults ofoperations, wehaveincludedconstantcurrency disclosures, where necessary, in the Overview and Results of Operations sections which follow. Constant currencydisclosuresrepresentthetranslationofourcurrentfiscalyearrevenuesandexpensesfromthefunctionalcurrenciesofoursubsidiariestoU.S.dollarsusingtheexchangeratesineffectforthecorrespondingperiodofthepriorfiscalyear.Weuseresultsonaconstantcurrency basis as one of the measures to understand our operating results and evaluate our performance in comparison to priorperiods.ResultsonaconstantcurrencybasisarenotinaccordancewithaccountingprinciplesgenerallyacceptedintheUnitedStatesofAmerica(“non-GAAP”)andshouldbeconsideredinadditionto,notasasubstitutefor,resultspreparedinaccordancewithGAAP.
Forward-Looking Statements
The Private Securities Litigation ReformAct of 1995 provides a “safe harbor” for certain forward-looking statements. This reportcontains forward-looking statements, which reflect the Company’s current views with respect to future events and financialperformance.
These forward-looking statements include, but are not limited to, discussions about future financial and operating results,including:growthexpectationsforcertainproducts;expectedlevelsofpromotionalandadvertisingspending;plansforandsuccessofproductinnovation,theimpactofnewproductintroductionsonthegrowthofsales;anticipatedresultsfromproductlineextensionsales; the impact of the “Tax Cuts and Jobs Act ”; andforecasted foreign currencyexchange rates andcommodity prices. Theseforward-lookingstatementsaregenerallyidentifiedwithwordssuchas“believe,”“expect,”“intend,”“plan,”“could,”“may,”“aim,”“anticipate,”“target,”“estimate” and similar expressions. The Company undertakes no obligation to revise or update any forwardlookingstatements.
Actualeventsorresultsmaydiffermateriallyfromthoseprojectedinforward-lookingstatementsduetovariousfactors, including,butnotlimitedto,thoseidentifiedinPartI― Item1A,“RiskFactors,”intheCompany’sAnnualReportonForm10-KforthefiscalyearendedAugust31,2018,andintheCompany’sQuarterlyReportsonForm10-Q,whichmaybeupdatedfromtimetotime.
Overview
The Company
WD-40Company(“theCompany”),basedinSanDiego,California,isaglobalmarketingorganizationdedicatedtocreatingpositivelastingmemoriesbydevelopingandsellingproductsthatsolveproblemsinworkshops,factoriesandhomesaroundtheworld.Wemarketourmaintenanceproductsandourhomecareandcleaningproductsunderthefollowingwell-knownbrands:WD-40®,3-IN-ONE®,GT85®,X-14®,2000Flushes®,CarpetFresh®,novac®,SpotShot®,1001®,Lava®andSolvol®.CurrentlyincludedintheWD-40brandaretheWD-40Multi-UseProductandtheWD-40Specialist®andWD-40BIKE®productlines.Ourbrandsaresoldinvariouslocationsaroundtheworld. Maintenanceproductsaresoldworldwideinmarkets throughoutNorth,CentralandSouthAmerica,Asia,Australia,Europe,theMiddleEastandAfrica.HomecareandcleaningproductsaresoldprimarilyinNorthAmerica,theUnitedKingdom(“U.K.”)andAustralia.Wesellourproductsprimarilythroughmassretailandhomecenterstores, warehouse club stores, grocery stores, hardware stores, automotive parts outlets, sports retailers, independent bike dealers,onlineretailersandindustrialdistributorsandsuppliers.
25
Highlights
ThefollowingsummarizesthefinancialandoperationalhighlightsforourbusinessduringthesixmonthsendedFebruary28,2019:
· Consolidated net sales increased $3.8 million for the six months ended February 28, 2019 compared to the correspondingperiod of the prior fiscal year. Changes in foreign currency exchange rates ha d a n un favorable impact of $ 4. 4 millionon consolidated net sales for the six months ended February 28, 2019 compared to the corresponding period of the priorfiscal year. Thus, on a constant currency basis, net sales would have increased by $ 8.2 million from period to period. Thisun favorable impact from changes in foreign currency exchange rates significantly came from our EMEA segment, whichaccounted for 3 9 % of our consolidated sales for the six months ended February 28, 2019 .
· Consolidated net sales for the WD-40 Specialist product line were $ 16 . 5 million, which is a 1 0 % increase for the sixmonths ended February 28, 2019 compared to the corresponding period of the prior fiscal year. Although the WD-40Specialist product line is expected to provide the Company with long-term growth opportunities, we will see somevolatility in sales levels from period to period due to the timing of promotional programs, the building of distribution, andvarious other factors that come with building a new product line.
· Gross profit as a percentage of net sales remained constant at 55.3% for each of the six months ended February 28,2019 and 2018 .
· Consolidated net income increased $1. 7 million to $ 29.2 million for the six months ended February 28, 2019 comparedto the corresponding period of the prior fiscal year. Changes in foreign currency exchange rates had a n un favorableimpact of $ 0 . 9 million on consolidated net income for the six months ended February 28, 2019 compared to thecorresponding period of the prior fiscal year. Thus, on a constant currency basis, net income would have increased $ 2 . 6million.
· Diluted earnings per common share for the six months ended February 28, 2019 were $ 2.09 versus $ 1.95 in the priorfiscal year period.
· Net income and diluted earnings per common share were favorably impacted for the six months ended February 28, 2019due to the U.S. “Tax Cuts and Jobs Act” which became effective for the Company on January 1, 2018 and resulted in alower effective income tax rate from period to period.
· Share repurchases were executed under our current $75.0 million share buy-back plan, which was approved by theCompany’s Board of Directors in June 2018 and became effective on September 1, 201 8 . During the period fromSeptember 1, 201 8 through February 28, 2019 , the Company repurch ased 70 , 6 84 shares at an average price of $1 70.6 0 per share, for a total cost of $ 12 . 1 million.
Ourstrategicinitiativesandtheareaswherewewillcontinuetofocusourtime,talentandresourcesinfutureperiodsinclude: (i)maximizing WD-40 Multi-Use Product sales through geographic expansion, increased market penetration and the development ofnewanduniquedeliverysystems;(ii)leveragingtheWD-40brandbygrowingtheWD-40Specialistproductline;(iii)leveragingthestrengthsoftheCompanythroughbroadenedproductandrevenuebase;(iv)attracting,developingandretainingtalentedpeople;and(v)operatingwithexcellence.
26
Results of Operations
Three Months Ended February 28, 2019 Compared to Three Months Ended February 28, 2018
Operating Items
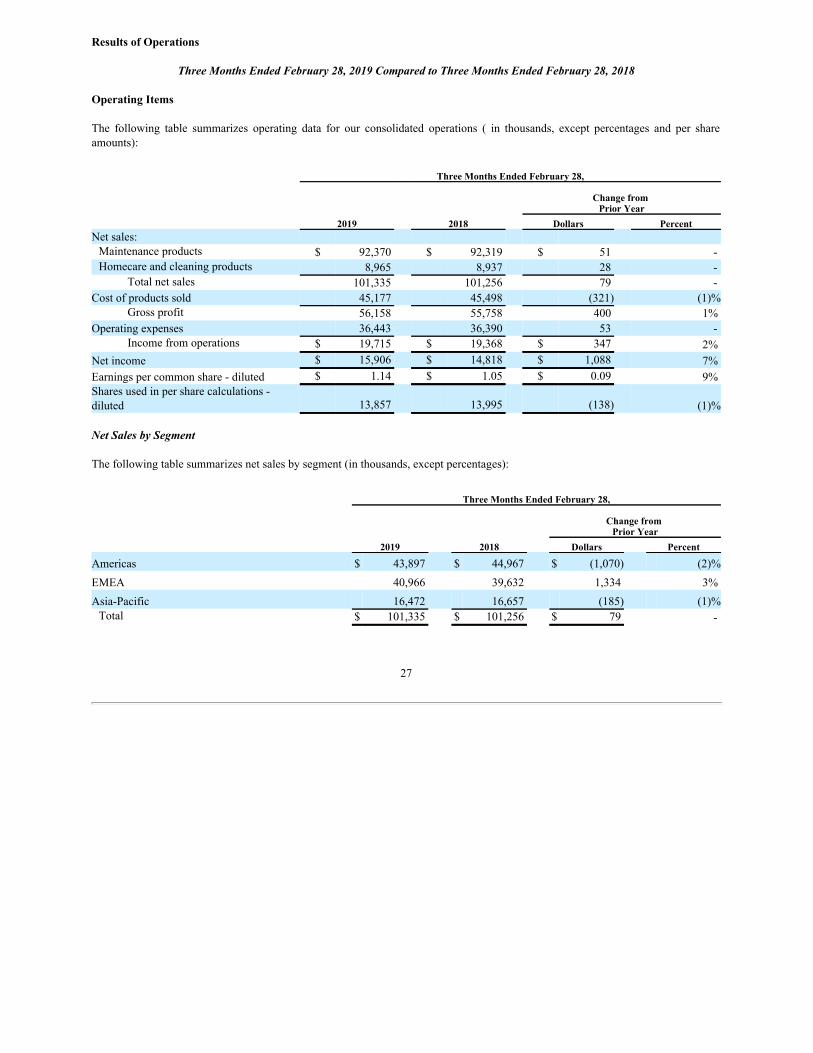
The following table summarizes operating data for our consolidated operations ( in thousands, except percentages and per shareamounts):
Three Months Ended February 28,
Change from Prior Year
2019 2018 Dollars PercentNetsales:Maintenanceproducts $ 92,370 $ 92,319 $ 51 -Homecareandcleaningproducts 8,965 8,937 28 -
Totalnetsales 101,335 101,256 79 -Costofproductssold 45,177 45,498 (321) (1)%
Grossprofit 56,158 55,758 400 1%Operatingexpenses 36,443 36,390 53 -
Incomefromoperations $ 19,715 $ 19,368 $ 347 2%Netincome $ 15,906 $ 14,818 $ 1,088 7%Earningspercommonshare-diluted $ 1.14 $ 1.05 $ 0.09 9%Sharesusedinpersharecalculations-diluted 13,857 13,995 (138) (1)%
Net Sales by Segment
Thefollowingtablesummarizesnetsalesbysegment(inthousands,exceptpercentages):
Three Months Ended February 28,
Change from Prior Year
2019 2018 Dollars Percent
Americas $ 43,897 $ 44,967 $ (1,070) (2)%EMEA 40,966 39,632 1,334 3%Asia-Pacific 16,472 16,657 (185) (1)%Total $ 101,335 $ 101,256 $ 79 -
27
Americas
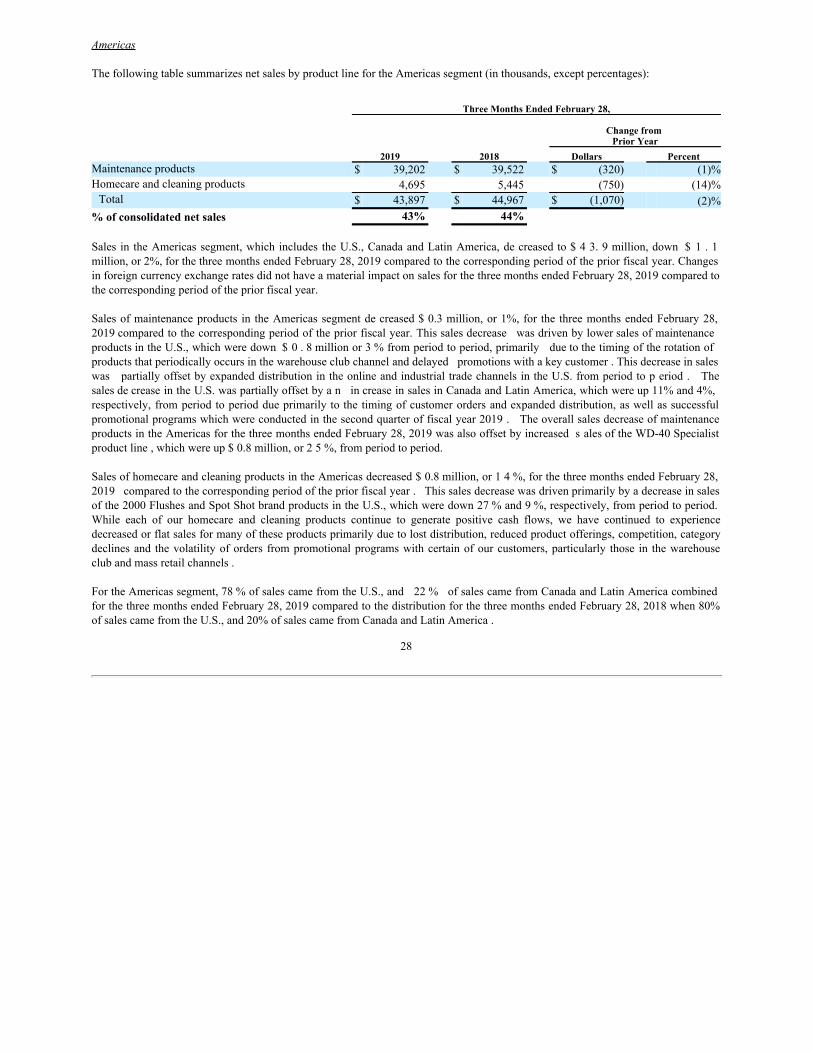
ThefollowingtablesummarizesnetsalesbyproductlinefortheAmericassegment(inthousands,exceptpercentages):
Three Months Ended February 28,
Change from Prior Year
2019 2018 Dollars PercentMaintenanceproducts $ 39,202 $ 39,522 $ (320) (1)%Homecareandcleaningproducts 4,695 5,445 (750) (14)%Total $ 43,897 $ 44,967 $ (1,070) (2)%
% of consolidated net sales 43% 44%
SalesintheAmericas segment, whichincludestheU.S., CanadaandLatinAmerica,decreasedto$43.9million,down$ 1.1million,or2%,forthethreemonthsendedFebruary28,2019comparedtothecorrespondingperiodofthepriorfiscalyear.ChangesinforeigncurrencyexchangeratesdidnothaveamaterialimpactonsalesforthethreemonthsendedFebruary28,2019comparedtothecorrespondingperiodofthepriorfiscalyear.
Sales of maintenanceproducts intheAmericas segmentdecreased$0.3million, or 1%,for the three months endedFebruary 28,2019comparedtothecorrespondingperiodofthepriorfiscalyear.ThissalesdecreasewasdrivenbylowersalesofmaintenanceproductsintheU.S.,whichweredown$0.8millionor3%fromperiodtoperiod,primarilyduetothetimingoftherotationofproductsthatperiodicallyoccursinthewarehouseclubchannelanddelayedpromotionswithakeycustomer.ThisdecreaseinsaleswaspartiallyoffsetbyexpandeddistributionintheonlineandindustrialtradechannelsintheU.S.fromperiodtoperiod.ThesalesdecreaseintheU.S.waspartiallyoffsetbyanincreaseinsalesinCanadaandLatinAmerica,whichwereup11%and4%,respectively, fromperiodtoperioddueprimarilytothetimingofcustomerordersandexpandeddistribution,aswellassuccessfulpromotionalprogramswhichwereconductedinthesecondquarteroffiscalyear2019.TheoverallsalesdecreaseofmaintenanceproductsintheAmericasforthethreemonthsendedFebruary28,2019wasalsooffsetbyincreasedsalesoftheWD-40Specialistproductline,whichwereup$0.8million,or25%,fromperiodtoperiod.
SalesofhomecareandcleaningproductsintheAmericasdecreased$0.8million,or14%,forthethreemonthsendedFebruary28,2019comparedtothecorrespondingperiodofthepriorfiscalyear.Thissalesdecreasewasdrivenprimarilybyadecreaseinsalesofthe2000FlushesandSpotShotbrandproductsintheU.S.,whichweredown27%and9%,respectively,fromperiodtoperiod.While each of our homecare and cleaning products continue to generate positive cash flows, we have continued to experiencedecreasedorflatsalesformanyoftheseproductsprimarilyduetolostdistribution,reducedproductofferings,competition,categorydeclines andthe volatility of orders frompromotional programswith certain of our customers, particularly those in the warehouseclubandmassretailchannels.
FortheAmericassegment,78%ofsalescamefromtheU.S.,and22%ofsalescamefromCanadaandLatinAmericacombinedforthethreemonthsendedFebruary28,2019comparedtothedistributionforthethreemonthsendedFebruary28,2018when80%ofsalescamefromtheU.S.,and20%ofsalescamefromCanadaandLatinAmerica.
28
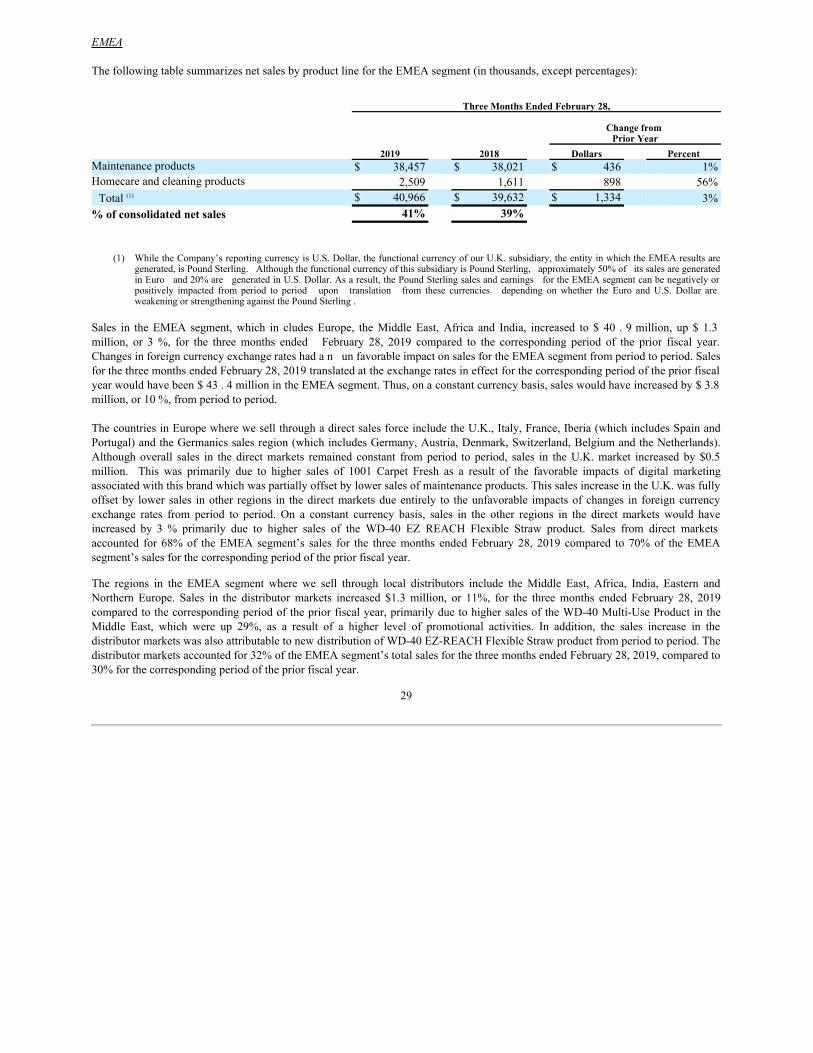
EMEA
ThefollowingtablesummarizesnetsalesbyproductlinefortheEMEAsegment(inthousands,exceptpercentages):
Three Months Ended February 28,
Change from Prior Year
2019 2018 Dollars PercentMaintenanceproducts $ 38,457 $ 38,021 $ 436 1%Homecareandcleaningproducts 2,509 1,611 898 56%Total(1) $ 40,966 $ 39,632 $ 1,334 3%
% of consolidated net sales 41% 39%
(1) WhiletheCompany’sreportingcurrencyisU.S.Dollar,thefunctionalcurrencyofourU.K.subsidiary,theentityinwhichtheEMEAresultsaregenerated,isPoundSterling.AlthoughthefunctionalcurrencyofthissubsidiaryisPoundSterling,approximately50%ofitssalesaregeneratedinEuroand20%aregeneratedinU.S.Dollar.Asaresult,thePoundSterlingsalesandearningsfortheEMEAsegmentcanbenegativelyorpositively impacted from period to period upon translation from these currencies depending on whether the Euro and U.S. Dollar areweakeningorstrengtheningagainstthePoundSterling.
Sales in the EMEAsegment, which in cludes Europe, the Middle East, Africa and India, increased to $ 40.9million, up $ 1.3million, or 3%, for the three months ended February 28, 2019 compared to the corresponding period of the prior fiscal year.ChangesinforeigncurrencyexchangerateshadanunfavorableimpactonsalesfortheEMEAsegmentfromperiodtoperiod.SalesforthethreemonthsendedFebruary28,2019translatedattheexchangeratesineffectforthecorrespondingperiodofthepriorfiscalyearwouldhavebeen$43.4millionintheEMEAsegment.Thus,onaconstantcurrencybasis,saleswouldhaveincreasedby$3.8million,or10%,fromperiodtoperiod.
ThecountriesinEuropewherewesellthroughadirectsalesforceincludetheU.K.,Italy,France,Iberia(whichincludesSpainandPortugal)andtheGermanicssalesregion(whichincludesGermany,Austria,Denmark,Switzerland,BelgiumandtheNetherlands).Although overall sales in the direct markets remained constant from period to period, sales in the U.K. market increased by $0.5million. This was primarily due to higher sales of 1001 Carpet Fresh as a result of the favorable impacts of digital marketingassociatedwiththisbrandwhichwaspartiallyoffsetbylowersalesofmaintenanceproducts.ThissalesincreaseintheU.K.wasfullyoffset by lower sales in other regions in the direct markets due entirely to the unfavorable impacts of changes in foreign currencyexchange rates from period to period. On a constant currency basis, sales in the other regions in the direct markets would haveincreased by 3% primarily due to higher sales of the WD-40 EZ REACH Flexible Straw product. Sales from direct marketsaccounted for 68%of the EMEAsegment’s sales for the three months ended February 28, 2019 compared to 70%of the EMEAsegment’ssalesforthecorrespondingperiodofthepriorfiscalyear.
The regions in the EMEA segment where we sell through local distributors include the Middle East, Africa, India, Eastern andNorthern Europe. Sales in the distributor markets increased $1.3 million, or 11%, for the three months ended February 28, 2019comparedtothecorrespondingperiodofthepriorfiscalyear,primarilyduetohighersalesoftheWD-40Multi-UseProductintheMiddle East, which were up 29%, as a result of a higher level of promotional activities. In addition, the sales increase in thedistributormarketswasalsoattributabletonewdistributionofWD-40EZ-REACHFlexibleStrawproductfromperiodtoperiod.Thedistributormarketsaccountedfor32%oftheEMEAsegment’stotalsalesforthethreemonthsendedFebruary28,2019,comparedto30%forthecorrespondingperiodofthepriorfiscalyear.
29
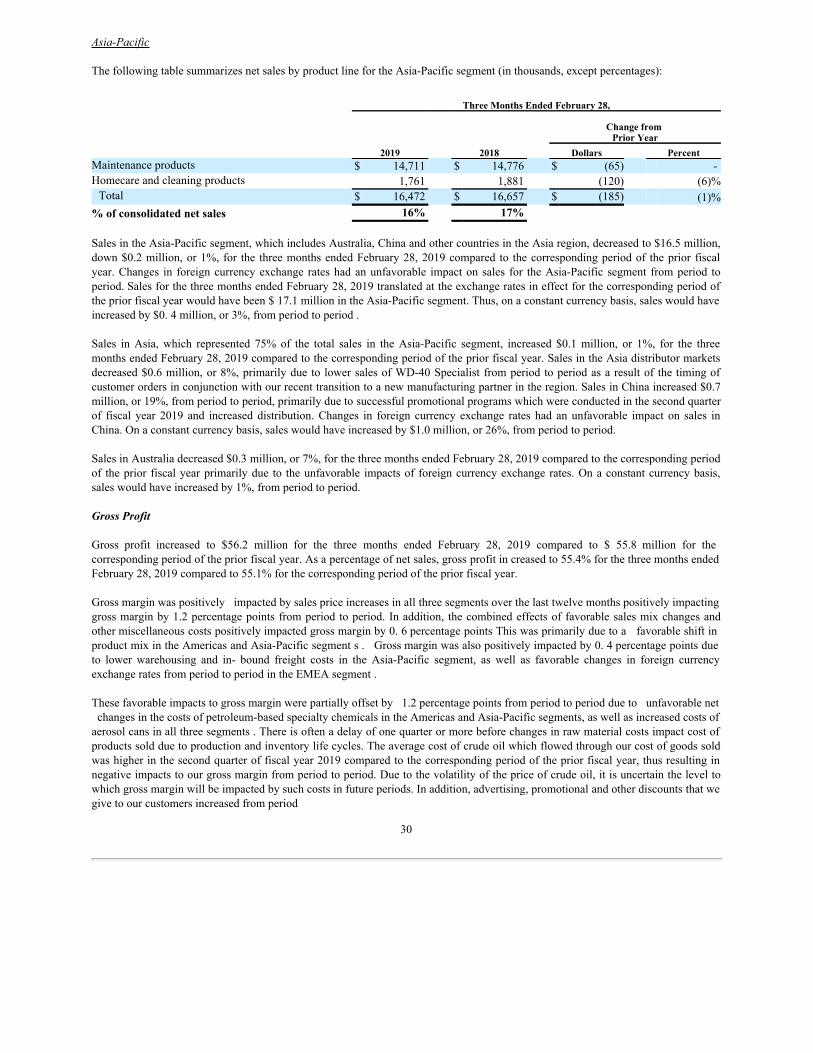
Asia-Pacific
ThefollowingtablesummarizesnetsalesbyproductlinefortheAsia-Pacificsegment(inthousands,exceptpercentages):
Three Months Ended February 28,
Change from Prior Year
2019 2018 Dollars PercentMaintenanceproducts $ 14,711 $ 14,776 $ (65) -Homecareandcleaningproducts 1,761 1,881 (120) (6)%Total $ 16,472 $ 16,657 $ (185) (1)%
% of consolidated net sales 16% 17%
SalesintheAsia-Pacificsegment,whichincludesAustralia,ChinaandothercountriesintheAsiaregion,decreasedto$16.5million,down$0.2million, or 1%,for the three monthsendedFebruary28, 2019comparedto thecorrespondingperiodof theprior fiscalyear. Changes in foreign currency exchange rates had an unfavorable impact on sales for the Asia-Pacific segment fromperiod toperiod.SalesforthethreemonthsendedFebruary28,2019translatedattheexchangeratesineffectforthecorrespondingperiodofthepriorfiscalyearwouldhavebeen$17.1millionintheAsia-Pacificsegment.Thus,onaconstantcurrencybasis,saleswouldhaveincreasedby$0.4million,or3%,fromperiodtoperiod.
Sales in Asia, which represented 75% of the total sales in the Asia-Pacific segment, increased $0.1 million, or 1%, for the threemonthsendedFebruary28,2019comparedtothecorrespondingperiodofthepriorfiscalyear.SalesintheAsiadistributormarketsdecreased$0.6million, or8%,primarily duetolowersalesofWD-40Specialist fromperiodtoperiodasaresult of thetimingofcustomerordersinconjunctionwithourrecenttransitiontoanewmanufacturingpartnerintheregion.SalesinChinaincreased$0.7million,or19%,fromperiodtoperiod,primarilyduetosuccessfulpromotionalprogramswhichwereconductedinthesecondquarterof fiscal year 2019 and increased distribution. Changes in foreign currency exchange rates had an unfavorable impact on sales inChina.Onaconstantcurrencybasis,saleswouldhaveincreasedby$1.0million,or26%,fromperiodtoperiod.
SalesinAustraliadecreased$0.3million,or7%,forthethreemonthsendedFebruary28,2019comparedtothecorrespondingperiodof theprior fiscal year primarily dueto theunfavorable impacts of foreigncurrencyexchangerates. Ona constant currencybasis,saleswouldhaveincreasedby1%,fromperiodtoperiod.
Gross Profit
Gross profit increased to $56.2 million for the three months ended February 28, 2019 compared to $ 55.8 million for thecorrespondingperiodofthepriorfiscalyear.Asapercentageofnetsales,grossprofitincreasedto55.4%forthethreemonthsendedFebruary28,2019comparedto55.1%forthecorrespondingperiodofthepriorfiscalyear.
Grossmarginwaspositivelyimpactedbysalespriceincreasesinallthreesegmentsoverthelasttwelvemonthspositivelyimpactinggrossmarginby1.2percentagepointsfromperiodtoperiod. Inaddition, thecombinedeffects offavorable salesmixchangesandothermiscellaneouscostspositivelyimpactedgrossmarginby0.6percentagepointsThiswasprimarilyduetoafavorableshiftinproductmixintheAmericasandAsia-Pacificsegments.Grossmarginwasalsopositivelyimpactedby0.4percentagepointsdueto lower warehousing and in- bound freight costs in the Asia-Pacific segment, as well as favorable changes in foreign currencyexchangeratesfromperiodtoperiodintheEMEAsegment.
Thesefavorableimpactstogrossmarginwerepartiallyoffsetby1.2percentagepointsfromperiodtoperiodduetounfavorablenetchangesinthecostsofpetroleum-basedspecialtychemicalsintheAmericasandAsia-Pacificsegments,aswellasincreasedcostsofaerosolcansinallthreesegments.Thereisoftenadelayofonequarterormorebeforechangesinrawmaterialcostsimpactcostofproductssoldduetoproductionandinventorylifecycles.Theaveragecostofcrudeoilwhichflowedthroughourcostofgoodssoldwashigherinthesecondquarteroffiscalyear2019comparedtothecorrespondingperiodofthepriorfiscalyear,thusresultinginnegativeimpactstoourgrossmarginfromperiodtoperiod.Duetothevolatilityofthepriceofcrudeoil,itisuncertaintheleveltowhichgrossmarginwillbeimpactedbysuchcostsinfutureperiods.Inaddition,advertising,promotionalandotherdiscountsthatwegivetoourcustomersincreasedfromperiod
30
to period negatively impacting gross margin by 0.7 percentage point. In general, the timing of advertising, promotional and otherdiscountsmaycausefluctuationsingrossmarginfromperiodtoperiod.Thecostsassociatedwithcertainpromotionalactivitiesarerecordedasareductiontosaleswhileothersarerecordedasadvertisingandsalespromotionexpenses.Advertising,promotionalandotherdiscountsthataregiventoourcustomersarerecordedasareductiontosales,whereasadvertisingandsalespromotionalcostsassociatedwithpromotionalactivitiesthatwepaytothirdpartiesarerecordedasadvertisingandsalespromotionexpenses.
Note that our gross profit andgross margin maynot be comparable to those of other consumer product companies, since someofthese companies include all costs related to distribution of their products in cost of products sold, whereas weexclude the portionassociatedwithamountspaidtothirdpartiesforshipmenttoourcustomersfromourdistributioncentersandcontractmanufacturersandincludethesecosts inselling, general andadministrative expenses.Thesecoststotaled$4.2millionand$4.6millionforthethreemonthsendedFebruary28,2019and2018,respectively.
Selling, General and Administrative Expenses
Selling,generalandadministrative(“SG&A”)expensesforthethreemonthsendedFebruary28,2019increased$0.2million,or1%,to$30.6millionfrom$30.4millionforthecorrespondingperiodofthepriorfiscalyear.Asapercentageofnetsales,SG&Aexpensesincreasedto30.2%forthethreemonthsendedFebruary28,2019from30.1%forthecorrespondingperiodofthepriorfiscal year . The increase in SG&Aexpenses was primarily attributable to higher employee-related costs, increasedprofessionalservicescosts,andahigherlevelofexpensesassociatedwithtravelandmeetings.Employee-relatedcosts,whichincludesalaries,incentivecompensation,profitsharing,stock-basedcompensationandotherfringebenefits,increasedby$0.6million.Thisincreasewasprimarilyduetoincreasedheadcountandannualcompensationincreases,whichtakeeffectinthefirstquarterofthefiscalyear,partiallyoffset bylowerearnedincentivecompensationformperiodtoperiod.Professionalservicescostsincreased$0.3millionduetoincreaseduseofsuchservicesfromperiodtoperiod,primarilyintheAmericasandEMEAsegments.Inaddition,travelandmeetingexpensesincreased$0.1millionduetoahigherleveloftravelexpensesintheAmericasandEMEAsegmentsassociatedwithvarioussalesmeetingsandactivitiesinsupportofourstrategicinitiatives.Theseincreasesweresignificantlyoffsetbyfavorablechangesinforeigncurrencyexchangerates,whichdecreasedSG&Aexpensesby$0.8millionfromperiodtoperiod.
We continued our research and development investment, the majority of which is associated with our maintenance products, insupportofourfocusoninnovationandrenovationofourproducts .Researchanddevelopmentcostswere$1.5millionand$1.6million for the three months ended February 28, 2019 and 201 8 , respectively. Our research and development team engages inconsumer research, product development, current product improvement and testing activities. This teamleverages its developmentcapabilitiesbypartneringwithanetworkofoutsideresourcesincludingourcurrentandprospectiveoutsourcedsuppliers.Thelevelandtypesofexpensesincurredwithinresearchanddevelopmentcanvaryfromperiodtoperioddependinguponthetypesofactivitiesbeingperformed.
Advertising and Sales Promotion Expenses
Advertisingandsalespromotionexpensesremainedconstantat$5.2millionforeachofthethreemonthsendedFebruary28,2019and2018.Asapercentageofnetsales,theseexpensesalsoremainedconstantat5.1%foreachofthethreemonthsendedFebruary28,2019and2018.Investmentinglobaladvertisingandsalespromotionexpensesforfiscalyear2019isexpectedtobebetween5.5%and6.0%ofnetsales.
As a percentage of net sales, advertising and sales promotion expenses may fluctuate period to period based upon the type ofmarketingactivitiesweemployandtheperiodinwhichthecostsareincurred.TotalpromotionalcostsrecordedasareductiontosalesforthethreemonthsendedFebruary28,2019were$4.8millioncomparedto$4.7millionforthecorrespondingperiodofthepriorfiscalyear.Therefore,ourtotalinvestmentinadvertisingandsalespromotionactivitiestotaled$10.0millionand$9.9millionforthethreemonthsendedFebruary28,2019and2018,respectively.
31
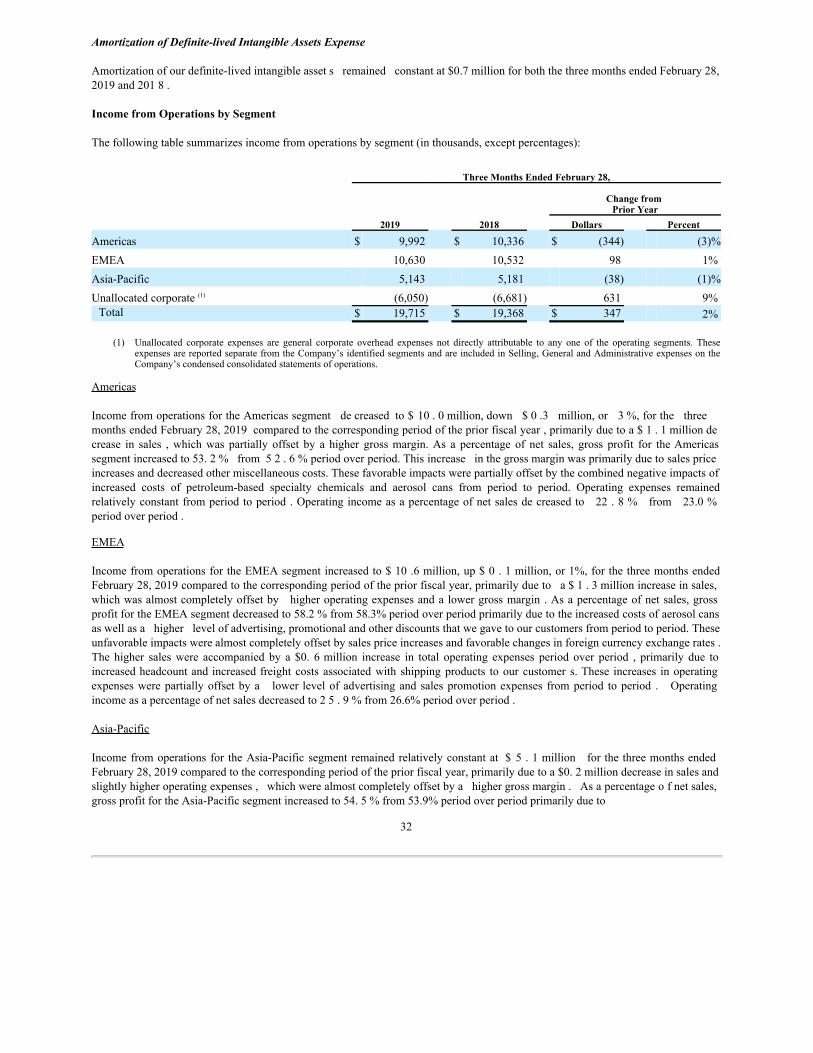
Amortization of Definite-lived Intangible Assets Expense
Amortizationofourdefinite-livedintangibleassetsremainedconstantat$0.7millionforboththethreemonthsendedFebruary28,2019and2018.
Income from Operations by Segment
Thefollowingtablesummarizesincomefromoperationsbysegment(inthousands,exceptpercentages):
Three Months Ended February 28,
Change from Prior Year
2019 2018 Dollars Percent
Americas $ 9,992 $ 10,336 $ (344) (3)%EMEA 10,630 10,532 98 1%Asia-Pacific 5,143 5,181 (38) (1)%Unallocatedcorporate(1) (6,050) (6,681) 631 9%Total $ 19,715 $ 19,368 $ 347 2%
(1) Unallocated corporate expenses are general corporate overhead expenses not directly attributable to any one of the operating segments. TheseexpensesarereportedseparatefromtheCompany’sidentifiedsegmentsandareincludedinSelling,GeneralandAdministrativeexpensesontheCompany’scondensedconsolidatedstatementsofoperations.
Americas
IncomefromoperationsfortheAmericassegmentdecreasedto$10.0million,down$0.3million,or3%,forthethreemonthsendedFebruary28,2019comparedtothecorrespondingperiodofthepriorfiscalyear,primarilyduetoa$1.1milliondecrease in sales , which was partially offset by a higher gross margin.As a percentage of net sales, gross profit for theAmericassegmentincreasedto53.2%from52.6%periodoverperiod.Thisincreaseinthegrossmarginwasprimarilyduetosalespriceincreasesanddecreasedothermiscellaneouscosts.Thesefavorableimpactswerepartiallyoffsetbythecombinednegativeimpactsofincreased costs of petroleum-based specialty chemicals and aerosol cans from period to period. Operating expenses remainedrelativelyconstant fromperiodtoperiod . Operatingincomeasapercentageofnetsalesdecreasedto22.8%from23.0%periodoverperiod.
EMEA
IncomefromoperationsfortheEMEAsegmentincreasedto$10.6million,up$0.1million,or1%,forthethreemonthsendedFebruary28,2019comparedtothecorrespondingperiodofthepriorfiscalyear,primarilyduetoa$1.3millionincreaseinsales,whichwasalmostcompletelyoffsetbyhigheroperatingexpensesandalowergross margin .Asapercentageofnet sales, grossprofitfortheEMEAsegmentdecreasedto58.2%from58.3%periodoverperiodprimarilyduetotheincreasedcostsofaerosolcansaswellasahigherlevelofadvertising,promotionalandotherdiscountsthatwegavetoourcustomersfromperiodtoperiod.Theseunfavorableimpactswerealmostcompletelyoffsetbysalespriceincreasesandfavorablechangesinforeigncurrencyexchangerates.The higher sales were accompanied by a $0. 6million increase in total operating expenses period over period , primarily due toincreasedheadcountandincreasedfreight costs associated with shipping products to our customer s.These increases in operatingexpenses were partially offset bya lowerlevel of advertising and sales promotion expenses fromperiod to period . Operatingincomeasapercentageofnetsalesdecreasedto25.9%from26.6%periodoverperiod.
Asia-Pacific
Incomefromoperations for the Asia-Pacific segmentremainedrelatively constant at $ 5.1millionforthethreemonthsendedFebruary28,2019comparedtothecorrespondingperiodofthepriorfiscalyear,primarilyduetoa$0.2milliondecreaseinsalesandslightlyhigheroperatingexpenses,whichwerealmostcompletelyoffsetbyahighergrossmargin.Asapercentageofnetsales,grossprofitfortheAsia-Pacificsegmentincreasedto54.5%from53.9%periodoverperiodprimarilydueto
32
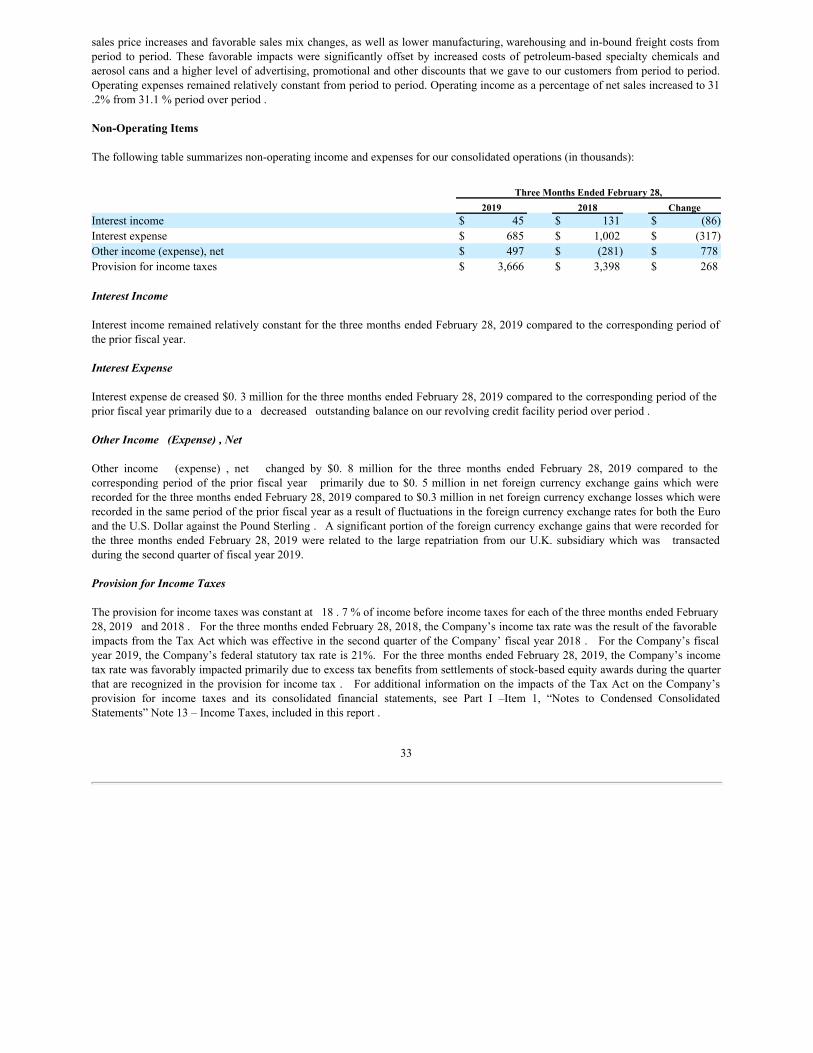
salespriceincreasesandfavorablesalesmixchanges,aswellaslowermanufacturing,warehousingandin-boundfreightcostsfromperiod to period. These favorable impacts were significantly offset by increased costs of petroleum-based specialty chemicals andaerosolcansandahigherlevelofadvertising,promotionalandotherdiscountsthatwegavetoourcustomersfromperiodtoperiod.Operatingexpensesremainedrelativelyconstantfromperiodtoperiod.Operatingincomeasapercentageofnetsalesincreasedto31.2%from31.1%periodoverperiod.
Non-Operating Items
Thefollowingtablesummarizesnon-operatingincomeandexpensesforourconsolidatedoperations(inthousands):
Three Months Ended February 28,2019 2018 Change
Interestincome $ 45 $ 131 $ (86)Interestexpense $ 685 $ 1,002 $ (317)Otherincome(expense),net $ 497 $ (281) $ 778Provisionforincometaxes $ 3,666 $ 3,398 $ 268
Interest Income
InterestincomeremainedrelativelyconstantforthethreemonthsendedFebruary28,2019comparedtothecorrespondingperiodofthepriorfiscalyear.
Interest Expense
Interestexpensedecreased$0.3millionforthethreemonthsendedFebruary28,2019comparedtothecorrespondingperiodofthepriorfiscalyearprimarilyduetoadecreasedoutstandingbalanceonourrevolvingcreditfacilityperiodoverperiod.
Other Income (Expense) , Net
Other income (expense) , net changed by $0. 8 million for the three months ended February 28, 2019 compared to thecorresponding period of the prior fiscal year primarily due to $0. 5million innet foreign currency exchange gains which wererecordedforthethreemonthsendedFebruary28,2019comparedto$0.3millioninnetforeigncurrencyexchangelosseswhichwererecordedinthesameperiodofthepriorfiscalyearasaresultoffluctuationsintheforeigncurrencyexchangeratesforboththeEuroandtheU.S.DollaragainstthePoundSterling.Asignificantportionoftheforeigncurrencyexchangegainsthatwererecordedforthe three months ended February 28, 2019 were related to the large repatriation fromour U.K. subsidiary whichwas transactedduringthesecondquarteroffiscalyear2019.
Provision for Income Taxes
Theprovisionforincometaxeswasconstantat18.7%ofincomebeforeincometaxesforeachofthethreemonthsendedFebruary28,2019and2018.ForthethreemonthsendedFebruary28,2018,theCompany’sincometaxratewastheresultofthefavorableimpactsfromtheTaxActwhichwaseffectiveinthesecondquarteroftheCompany’fiscalyear2018.FortheCompany’sfiscalyear2019,theCompany’sfederalstatutorytaxrateis21%.ForthethreemonthsendedFebruary28,2019,theCompany’sincometaxratewasfavorablyimpactedprimarilyduetoexcesstaxbenefitsfromsettlementsofstock-basedequityawardsduringthequarterthatarerecognizedintheprovisionforincometax.ForadditionalinformationontheimpactsoftheTaxActontheCompany’sprovision for income taxes and its consolidated financial statements, see Part I –Item 1, “Notes to Condensed ConsolidatedStatements”Note13–IncomeTaxes,includedinthisreport.
33

Net Income
Netincomewas$15.9million,or$1.14percommonshareonafullydilutedbasis,forthethreemonthsendedFebruary28,2019comparedto$14.8million,or$1.05percommonshareonafullydilutedbasis,forthecorrespondingperiodofthepriorfiscalyear.Changesinforeigncurrencyexchangerateshadanunfavorableimpactof$0.7milliononnetincomeforthethreemonthsendedFebruary 28, 2019 compared to the corresponding period of the prior fiscal year. Thus, on a constant currency basis, net incomewouldhaveincreasedby$1.8millionfromperiodtoperiod.
34
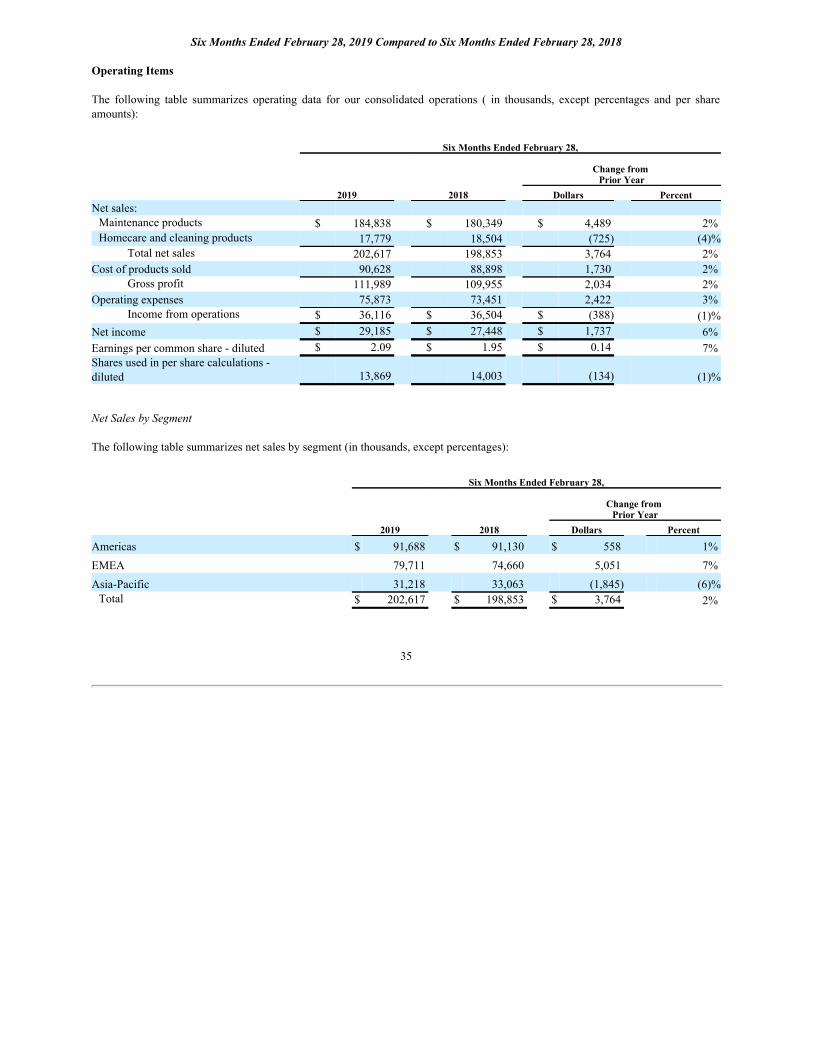
Six Months Ended February 28, 2019 Compared to Six Months Ended February 28, 2018
Operating Items
The following table summarizes operating data for our consolidated operations ( in thousands, except percentages and per shareamounts):
Six Months Ended February 28,
Change from Prior Year
2019 2018 Dollars PercentNetsales:Maintenanceproducts $ 184,838 $ 180,349 $ 4,489 2%Homecareandcleaningproducts 17,779 18,504 (725) (4)%
Totalnetsales 202,617 198,853 3,764 2%Costofproductssold 90,628 88,898 1,730 2%
Grossprofit 111,989 109,955 2,034 2%Operatingexpenses 75,873 73,451 2,422 3%
Incomefromoperations $ 36,116 $ 36,504 $ (388) (1)%Netincome $ 29,185 $ 27,448 $ 1,737 6%Earningspercommonshare-diluted $ 2.09 $ 1.95 $ 0.14 7%Sharesusedinpersharecalculations-diluted 13,869 14,003 (134) (1)%
Net Sales by Segment
Thefollowingtablesummarizesnetsalesbysegment(inthousands,exceptpercentages):
Six Months Ended February 28,
Change from Prior Year
2019 2018 Dollars Percent
Americas $ 91,688 $ 91,130 $ 558 1%EMEA 79,711 74,660 5,051 7%Asia-Pacific 31,218 33,063 (1,845) (6)%Total $ 202,617 $ 198,853 $ 3,764 2%
35
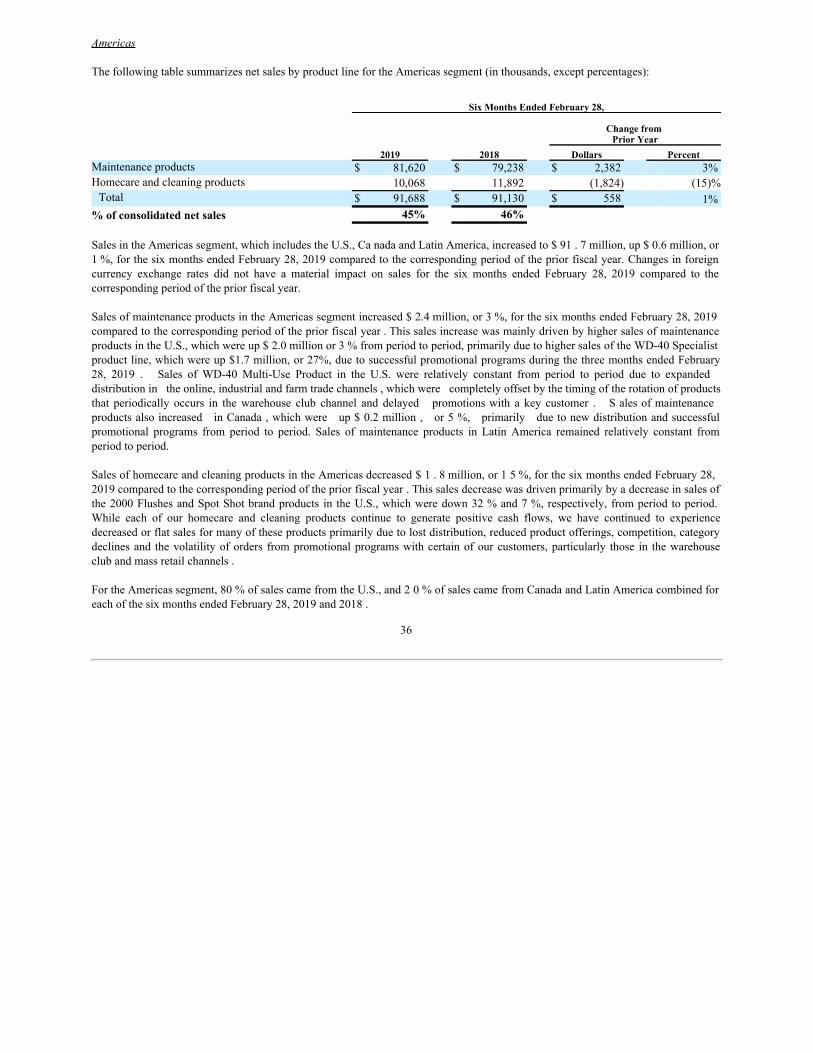
AmericasThefollowingtablesummarizesnetsalesbyproductlinefortheAmericassegment(inthousands,exceptpercentages):
Six Months Ended February 28,
Change from Prior Year
2019 2018 Dollars PercentMaintenanceproducts $ 81,620 $ 79,238 $ 2,382 3%Homecareandcleaningproducts 10,068 11,892 (1,824) (15)%Total $ 91,688 $ 91,130 $ 558 1%
% of consolidated net sales 45% 46%
SalesintheAmericassegment,whichincludestheU.S.,CanadaandLatinAmerica,increasedto$91.7million,up$0.6million,or1%,forthesixmonthsendedFebruary28,2019comparedtothecorrespondingperiodofthepriorfiscalyear.Changesinforeigncurrency exchange rates did not have a material impact on sales for the six months ended February 28, 2019 compared to thecorrespondingperiodofthepriorfiscalyear.SalesofmaintenanceproductsintheAmericassegmentincreased$2.4million,or3%,forthesixmonthsendedFebruary28,2019comparedtothecorrespondingperiodofthepriorfiscalyear.ThissalesincreasewasmainlydrivenbyhighersalesofmaintenanceproductsintheU.S.,whichwereup$2.0millionor3%fromperiodtoperiod,primarilyduetohighersalesoftheWD-40Specialistproductline,whichwereup$1.7million,or27%,duetosuccessfulpromotionalprogramsduringthethreemonthsendedFebruary28, 2019 . Sales of WD-40 Multi-Use Product in the U.S. were relatively constant from period to period due to expanded distributionintheonline,industrialandfarmtradechannels,whichwerecompletelyoffsetbythetimingoftherotationofproductsthat periodically occurs in the warehouse club channel and delayed promotionswith a key customer . SalesofmaintenanceproductsalsoincreasedinCanada,whichwereup$0.2million,or5%,primarilyduetonewdistributionandsuccessfulpromotional programs from period to period. Sales of maintenance products in Latin America remained relatively constant fromperiodtoperiod.
SalesofhomecareandcleaningproductsintheAmericasdecreased$1.8million,or15%,forthesixmonthsendedFebruary28,2019comparedtothecorrespondingperiodofthepriorfiscalyear.Thissalesdecreasewasdrivenprimarilybyadecreaseinsalesofthe2000Flushes andSpotShotbrandproducts in the U.S., whichwere down32%and7%,respectively, fromperiodtoperiod.While each of our homecare and cleaning products continue to generate positive cash flows, we have continued to experiencedecreasedorflatsalesformanyoftheseproductsprimarilyduetolostdistribution,reducedproductofferings,competition,categorydeclines andthe volatility of orders frompromotional programswith certain of our customers, particularly those in the warehouseclubandmassretailchannels.
FortheAmericassegment,80%ofsalescamefromtheU.S.,and20%ofsalescamefromCanadaandLatinAmericacombinedforeachofthesixmonthsendedFebruary28,2019and2018.
36
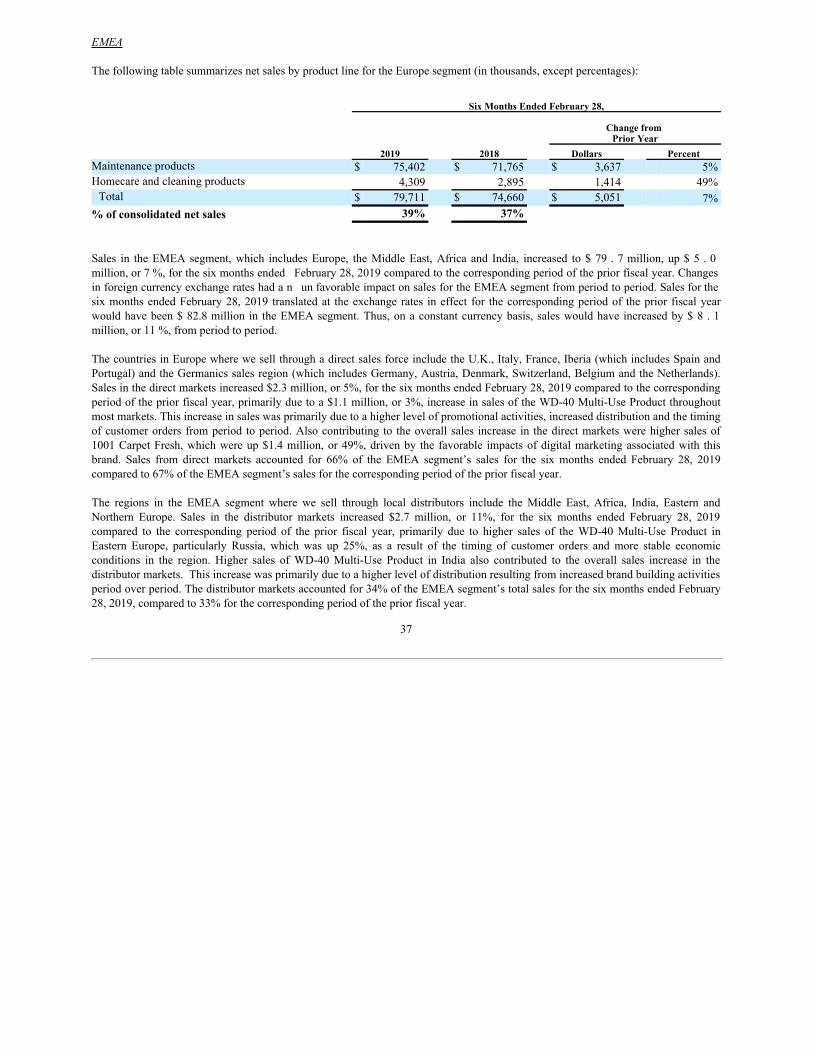
EMEA
ThefollowingtablesummarizesnetsalesbyproductlinefortheEuropesegment(inthousands,exceptpercentages):
Six Months Ended February 28,
Change from Prior Year
2019 2018 Dollars PercentMaintenanceproducts $ 75,402 $ 71,765 $ 3,637 5%Homecareandcleaningproducts 4,309 2,895 1,414 49%Total $ 79,711 $ 74,660 $ 5,051 7%
% of consolidated net sales 39% 37%
Sales in the EMEAsegment, which includes Europe, the Middle East, Africa and India, increased to $79.7million, up$5.0million,or7%,forthesixmonthsendedFebruary28,2019comparedtothecorrespondingperiodofthepriorfiscalyear.ChangesinforeigncurrencyexchangerateshadanunfavorableimpactonsalesfortheEMEAsegmentfromperiodtoperiod.Salesforthesix months ended February 28, 2019 translated at the exchangerates in effect for the correspondingperiodof the prior fiscal yearwouldhavebeen$82.8millionin theEMEAsegment. Thus, ona constant currencybasis, sales wouldhaveincreasedby$8.1million,or11%,fromperiodtoperiod.
ThecountriesinEuropewherewesellthroughadirectsalesforceincludetheU.K.,Italy,France,Iberia(whichincludesSpainandPortugal)andtheGermanicssalesregion(whichincludesGermany,Austria,Denmark,Switzerland,BelgiumandtheNetherlands).Salesinthedirectmarketsincreased$2.3million,or5%,forthesixmonthsendedFebruary28,2019comparedtothecorrespondingperiodofthepriorfiscalyear,primarilyduetoa$1.1million,or3%,increaseinsalesoftheWD-40Multi-UseProductthroughoutmostmarkets.Thisincreaseinsaleswasprimarilyduetoahigherlevelofpromotionalactivities,increaseddistributionandthetimingofcustomerorders fromperiodtoperiod. Alsocontributingtotheoverall sales increase inthedirect markets werehighersales of1001Carpet Fresh, whichwere up$1.4 million, or 49%,drivenbythe favorable impacts of digital marketing associated with thisbrand. Sales from direct markets accounted for 66% of the EMEA segment’s sales for the six months ended February 28, 2019comparedto67%oftheEMEAsegment’ssalesforthecorrespondingperiodofthepriorfiscalyear.
The regions in the EMEA segment where we sell through local distributors include the Middle East, Africa, India, Eastern andNorthern Europe. Sales in the distributor markets increased $2.7 million, or 11%, for the six months ended February 28, 2019compared to the corresponding period of the prior fiscal year, primarily due to higher sales of the WD-40 Multi-Use Product inEastern Europe, particularly Russia, which was up 25%, as a result of the timing of customer orders and more stable economicconditions in the region. Higher sales of WD-40 Multi-Use Product in India also contributed to the overall sales increase in thedistributormarkets.Thisincreasewasprimarilyduetoahigherlevelofdistributionresultingfromincreasedbrandbuildingactivitiesperiodoverperiod.Thedistributormarketsaccountedfor34%oftheEMEAsegment’stotalsalesforthesixmonthsendedFebruary28,2019,comparedto33%forthecorrespondingperiodofthepriorfiscalyear.
37
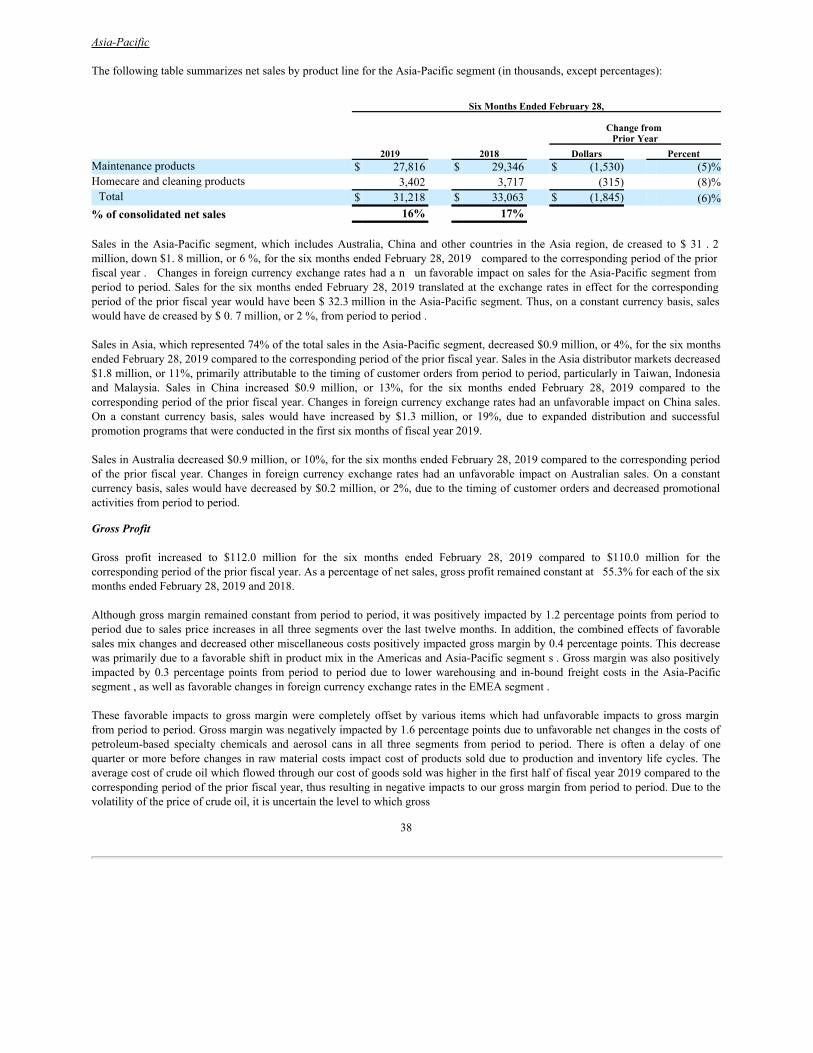
Asia-Pacific
ThefollowingtablesummarizesnetsalesbyproductlinefortheAsia-Pacificsegment(inthousands,exceptpercentages):
Six Months Ended February 28,
Change from Prior Year
2019 2018 Dollars PercentMaintenanceproducts $ 27,816 $ 29,346 $ (1,530) (5)%Homecareandcleaningproducts 3,402 3,717 (315) (8)%Total $ 31,218 $ 33,063 $ (1,845) (6)%
% of consolidated net sales 16% 17%
Sales in theAsia-Pacific segment, which includes Australia, China and other countries in the Asia region, decreased to $ 31.2million,down$1.8million,or6%,forthesixmonthsendedFebruary28,2019comparedtothecorrespondingperiodofthepriorfiscalyear.ChangesinforeigncurrencyexchangerateshadanunfavorableimpactonsalesfortheAsia-Pacificsegmentfromperiodtoperiod.SalesforthesixmonthsendedFebruary28, 2019translatedattheexchangeratesineffect forthecorrespondingperiodofthepriorfiscalyearwouldhavebeen$32.3millionintheAsia-Pacificsegment.Thus,onaconstantcurrencybasis,saleswouldhavedecreasedby$0.7million,or2%,fromperiodtoperiod.
SalesinAsia,whichrepresented74%ofthetotalsalesintheAsia-Pacificsegment,decreased$0.9million,or4%,forthesixmonthsendedFebruary28,2019comparedtothecorrespondingperiodofthepriorfiscalyear.SalesintheAsiadistributormarketsdecreased$1.8million,or11%,primarilyattributabletothetimingofcustomerordersfromperiodtoperiod,particularlyinTaiwan,Indonesiaand Malaysia. Sales in China increased $0.9 million, or 13%, for the six months ended February 28, 2019 compared to thecorrespondingperiodofthepriorfiscalyear.ChangesinforeigncurrencyexchangerateshadanunfavorableimpactonChinasales.On a constant currency basis, sales would have increased by $1.3 million, or 19%, due to expanded distribution and successfulpromotionprogramsthatwereconductedinthefirstsixmonthsoffiscalyear2019.
SalesinAustraliadecreased$0.9million,or10%,forthesixmonthsendedFebruary28,2019comparedtothecorrespondingperiodof the prior fiscal year. Changes in foreign currency exchange rates had an unfavorable impact on Australian sales. Ona constantcurrencybasis,saleswouldhavedecreasedby$0.2million,or2%,duetothetimingofcustomerordersanddecreasedpromotionalactivitiesfromperiodtoperiod.
Gross Profit
Gross profit increased to $112.0 million for the six months ended February 28, 2019 compared to $110.0 million for thecorrespondingperiodofthepriorfiscalyear.Asapercentageofnetsales,grossprofitremainedconstantat55.3%foreachofthesixmonthsendedFebruary28,2019and2018.
Althoughgrossmarginremainedconstantfromperiodtoperiod,itwaspositivelyimpactedby1.2percentagepointsfromperiodtoperiodduetosalespriceincreasesinallthreesegmentsoverthelasttwelvemonths.Inaddition,thecombinedeffectsoffavorablesalesmixchangesanddecreasedothermiscellaneouscostspositivelyimpactedgrossmarginby0.4percentagepoints.ThisdecreasewasprimarilyduetoafavorableshiftinproductmixintheAmericasandAsia-Pacificsegments.Grossmarginwasalsopositivelyimpacted by 0.3 percentage points fromperiod to period due to lower warehousing and in-bound freight costs in the Asia-Pacificsegment,aswellasfavorablechangesinforeigncurrencyexchangeratesintheEMEAsegment.
These favorable impacts to gross margin werecompletely offset byvarious items whichhad unfavorable impacts to gross marginfromperiodtoperiod.Grossmarginwasnegativelyimpactedby1.6percentagepointsduetounfavorablenetchangesinthecostsofpetroleum-based specialty chemicals and aerosol cans in all three segments from period to period. There is often a delay of onequarterormorebeforechangesinrawmaterial costsimpactcostofproductssoldduetoproductionandinventorylifecycles. Theaveragecostofcrudeoilwhichflowedthroughourcostofgoodssoldwashigherinthefirsthalfoffiscalyear2019comparedtothecorrespondingperiodofthepriorfiscalyear,thusresultinginnegativeimpactstoourgrossmarginfromperiodtoperiod.Duetothevolatilityofthepriceofcrudeoil,itisuncertaintheleveltowhichgross
38
marginwillbeimpactedbysuchcostsinfutureperiods.Inaddition,advertising,promotionalandotherdiscountsthatwegivetoourcustomersincreasedfromperiodtoperiodnegativelyimpactinggrossmarginby0.3percentagepoints.
Note that our gross profit andgross margin maynot be comparable to those of other consumer product companies, since someofthese companies include all costs related to distribution of their products in cost of products sold, whereas weexclude the portionassociatedwithamountspaidtothirdpartiesforshipmenttoourcustomersfromourdistributioncentersandcontractmanufacturersandincludethesecostsinselling,generalandadministrativeexpenses.Thesecoststotaled$8.3millionand$8.9millionforthesixmonthsendedFebruary28,2019and2018,respectively.
Selling, General and Administrative Expenses
Selling,generalandadministrativeexpensesforthesixmonthsendedFebruary28,2019increased$1.7million,or3%,to$63.3million from$61.6millionfor thecorrespondingperiodof the prior fiscal year. Asa percentage of net sales, SG&Aexpensesincreasedto31.3%forthesixmonthsendedFebruary28,2019from31.0%forthecorrespondingperiodofthepriorfiscalyear.TheincreaseinSG&Aexpenseswasprimarilyattributable tohigheremployee-relatedcosts, a higherlevel ofexpensesassociatedwithtravel and meetings, a nd increased professional services costs. Employee-related costs, which include salaries, incentivecompensation, profit sharing, stock-based compensation and other fringe benefits, increased by $1.4million. This increase wasprimarilyduetoincreasedheadcountandannualcompensationincreases,whichtakeeffectinthefirstquarterofthefiscalyear,aswell as higher stock-based compensation expense from period to period. These increases in employee-related costs were slightlyoffsetbylowerearnedincentivecompensationfromperiodtoperiod.Travelandmeetingexpensesincreased$0.6millionduetoahigherleveloftravelexpensesintheAmericasandEMEAsegmentsassociatedwithvarioussalesmeetingsandactivitiesinsupportofourstrategicinitiatives.Inaddition,professionalservicescostsincreased$0.6millionduetoincreaseduseofsuchservicesfromperiodtoperiod,primarilyintheAmericasandEMEAsegments.Othermiscellaneousexpenses,thelargestofwhichwererelatedtosalescommissions,generalofficeoverheadanddepreciationexpense,increasedby$0.3millionperiodoverperiod.Theseincreaseswerepartiallyoffsetbyfavorablechangesinforeigncurrencyexchangerates,whichdecreasedSG&Aexpensesby$1.2millionfromperiodtoperiod.
We continued our research and development investment, the majority of which is associated with our maintenance products, insupportofourfocusoninnovationandrenovationofourproducts.Researchanddevelopmentcostswere$3.3millionforeachofthesixmonthsendedFebruary28,2019and2018.
Advertising and Sales Promotion Expenses
AdvertisingandsalespromotionexpensesforthesixmonthsendedFebruary28,2019increased$0.8million,or8%,to$11.1million from$10.3millionfor the correspondingperiodof the prior fiscal year . Asa percentage of net sales, these expenses increased to 5.5% for the six months ended February 28, 2019 from 5. 2% for the corresponding period of the prior fiscal year.Changesinforeigncurrencyexchangerateshadafavorableimpactonsuchexpensesof$0.2millionfromperiodtoperiod.Thus,onaconstantcurrencybasis,advertisingandsalespromotionexpensesforthesixmonthsendedFebruary28,2019wouldhaveincreased$1.0millioncomparedtothecorrespondingperiodofthepriorfiscalyear.TheincreaseinadvertisingandsalespromotionexpenseswasprimarilyduetoahigherlevelofpromotionalprogramsandmarketingsupportintheAmericasandEMEAsegmentsfromperiodtoperiod.
As a percentage of net sales, advertising and sales promotion expenses may fluctuate period to period based upon the type ofmarketingactivitiesweemployandtheperiodinwhichthecostsareincurred.TotalpromotionalcostsrecordedasareductiontosalesforthesixmonthsendedFebruary28,2019were$9.1millioncomparedto$10.1millionforthecorrespondingperiodofthepriorfiscalyear.Therefore,ourtotalinvestmentinadvertisingandsalespromotionactivitiestotaled$20.2millionand$20.4millionforthesixmonthsendedFebruary28,2019and2018,respectively.
39
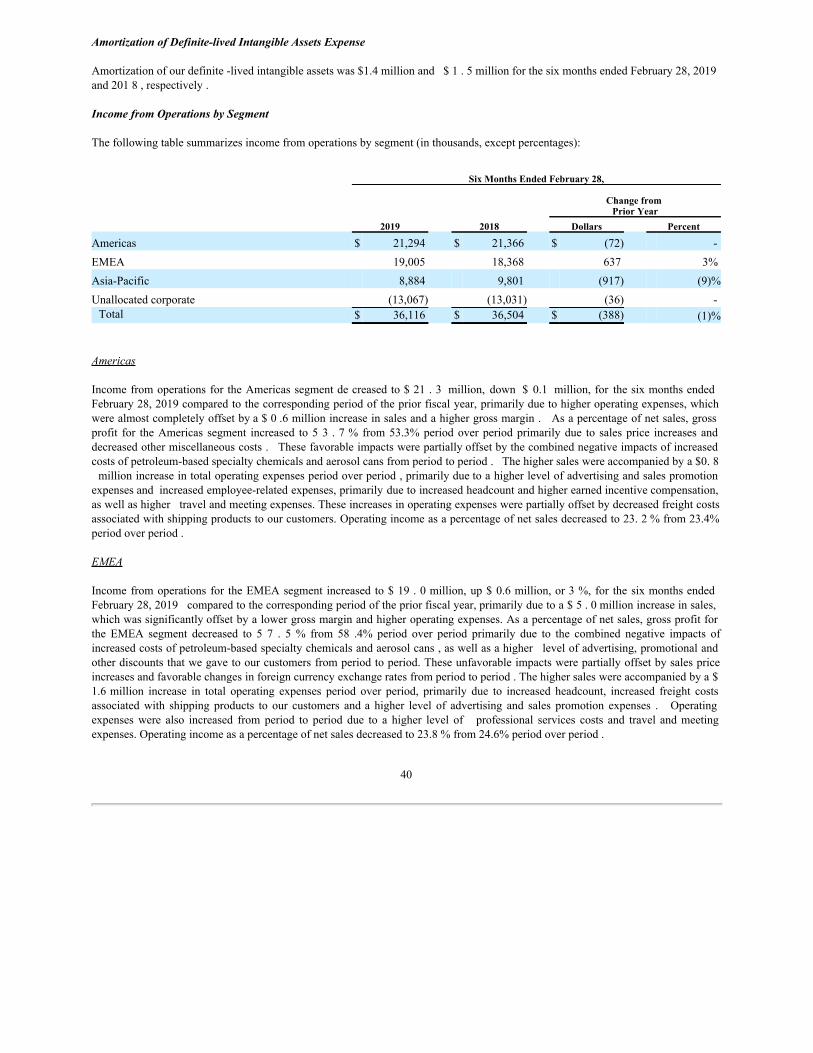
Amortization of Definite-lived Intangible Assets Expense
Amortizationofourdefinite-livedintangibleassetswas$1.4millionand$1.5millionforthesixmonthsendedFebruary28,2019and2018,respectively.
Income from Operations by Segment
Thefollowingtablesummarizesincomefromoperationsbysegment(inthousands,exceptpercentages):
Six Months Ended February 28,
Change from Prior Year
2019 2018 Dollars Percent
Americas $ 21,294 $ 21,366 $ (72) -EMEA 19,005 18,368 637 3%Asia-Pacific 8,884 9,801 (917) (9)%Unallocatedcorporate (13,067) (13,031) (36) -Total $ 36,116 $ 36,504 $ (388) (1)%
Americas
IncomefromoperationsfortheAmericassegmentdecreasedto$21.3million, down$ 0.1million,for thesixmonthsendedFebruary28,2019comparedtothecorrespondingperiodofthepriorfiscalyear,primarilyduetohigheroperatingexpenses,whichwerealmostcompletelyoffsetbya$0.6millionincreaseinsalesandahighergrossmargin.Asapercentageofnetsales,grossprofit for the Americas segment increased to 53.7%from53.3%period over period primarily due to sales price increases anddecreasedothermiscellaneouscosts.Thesefavorableimpactswerepartiallyoffsetbythecombinednegativeimpactsofincreasedcostsofpetroleum-basedspecialtychemicalsandaerosolcansfromperiodtoperiod.Thehighersaleswereaccompaniedbya$0.8millionincreaseintotaloperatingexpensesperiodoverperiod,primarilyduetoahigherlevelofadvertisingandsalespromotionexpensesandincreasedemployee-relatedexpenses,primarilyduetoincreasedheadcountandhigherearnedincentivecompensation,aswellashighertravelandmeetingexpenses.Theseincreasesinoperatingexpenseswerepartiallyoffsetbydecreasedfreightcostsassociatedwithshippingproductstoourcustomers.Operatingincomeasapercentageofnetsalesdecreasedto23.2%from23.4%periodoverperiod.
EMEA
Incomefromoperations for the EMEAsegment increasedto$19.0million, up$0.6million,or3%, for thesixmonthsendedFebruary28,2019comparedtothecorrespondingperiodofthepriorfiscalyear,primarilyduetoa$5.0millionincreaseinsales,whichwassignificantlyoffsetbyalowergrossmarginandhigheroperatingexpenses.Asapercentageofnetsales,grossprofitforthe EMEA segment decreased to 5 7 . 5% from 58 .4% period over period primarily due to the combined negative impacts ofincreasedcostsofpetroleum-basedspecialtychemicalsandaerosolcans,aswellasahigherlevelofadvertising,promotionalandotherdiscountsthatwegavetoourcustomersfromperiodtoperiod.Theseunfavorableimpactswerepartiallyoffsetbysalespriceincreasesandfavorablechangesinforeigncurrencyexchangeratesfromperiodtoperiod.Thehighersaleswereaccompaniedbya$1.6million increase in total operating expenses period over period, primarily due to increased headcount, increased freight costsassociated with shipping products to our customers anda higher level of advertising and sales promotion expenses . Operatingexpenses were also increased from period to period due to a higher level of professional services costs and travel and meetingexpenses.Operatingincomeasapercentageofnetsalesdecreasedto23.8%from24.6%periodoverperiod.
40
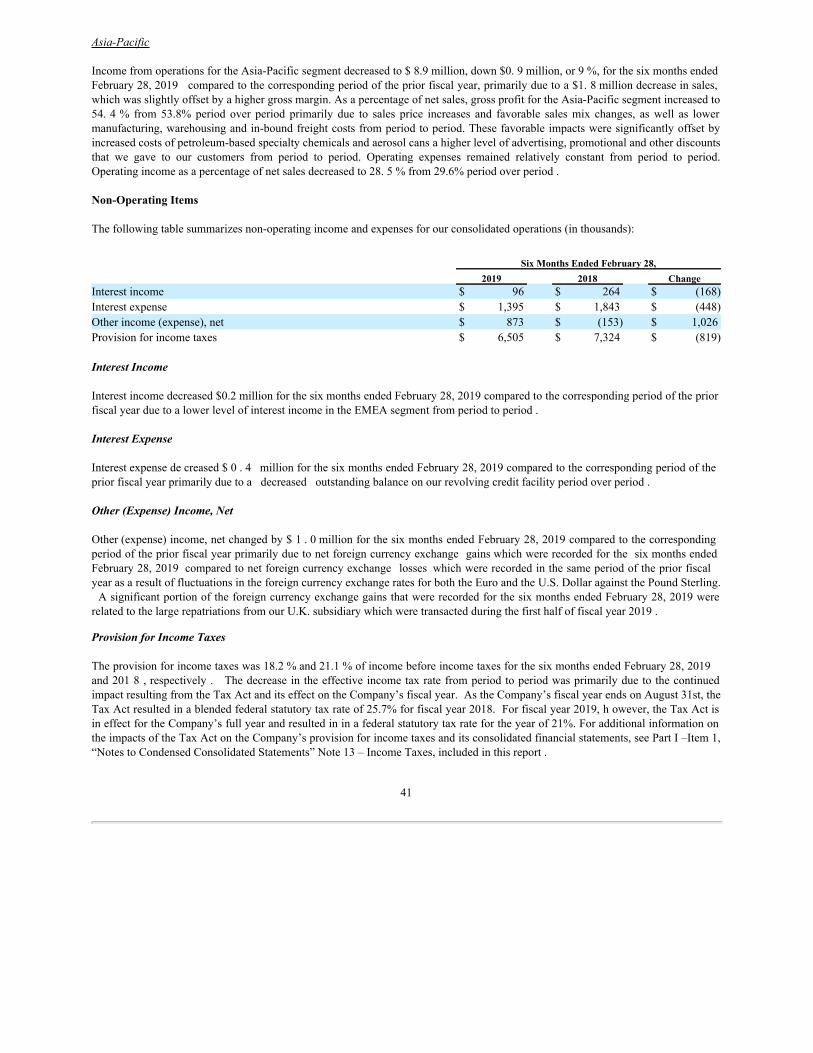
Asia-Pacific
IncomefromoperationsfortheAsia-Pacificsegmentdecreasedto$8.9million,down$0.9million,or9%,forthesixmonthsendedFebruary28,2019comparedtothecorrespondingperiodofthepriorfiscalyear,primarilyduetoa$1.8milliondecreaseinsales,whichwasslightlyoffsetbyahighergrossmargin.Asapercentageofnetsales,grossprofitfortheAsia-Pacificsegmentincreasedto54.4% from 53.8% period over period primarily due to sales price increases and favorable sales mix changes, as well as lowermanufacturing,warehousingandin-boundfreightcostsfromperiodtoperiod.Thesefavorableimpactsweresignificantlyoffsetbyincreasedcostsofpetroleum-basedspecialtychemicalsandaerosolcansahigherlevelofadvertising,promotionalandotherdiscountsthat we gave to our customers from period to period. Operating expenses remained relatively constant from period to period.Operatingincomeasapercentageofnetsalesdecreasedto28.5%from29.6%periodoverperiod.
Non-Operating Items
Thefollowingtablesummarizesnon-operatingincomeandexpensesforourconsolidatedoperations(inthousands):
Six Months Ended February 28,2019 2018 Change
Interestincome $ 96 $ 264 $ (168)Interestexpense $ 1,395 $ 1,843 $ (448)Otherincome(expense),net $ 873 $ (153) $ 1,026Provisionforincometaxes $ 6,505 $ 7,324 $ (819)
Interest Income
Interestincomedecreased$0.2millionforthesixmonthsendedFebruary28,2019comparedtothecorrespondingperiodofthepriorfiscalyearduetoalowerlevelofinterestincomeintheEMEAsegmentfromperiodtoperiod.
Interest Expense
Interestexpensedecreased$0.4millionforthesixmonthsendedFebruary28,2019comparedtothecorrespondingperiodofthepriorfiscalyearprimarilyduetoadecreasedoutstandingbalanceonourrevolvingcreditfacilityperiodoverperiod.
Other (Expense) Income, Net
Other(expense)income,netchangedby$1.0millionforthesixmonthsendedFebruary28,2019comparedtothecorrespondingperiodofthepriorfiscalyearprimarilyduetonetforeigncurrencyexchangegainswhichwererecordedforthesixmonthsendedFebruary28,2019comparedtonetforeigncurrencyexchange losseswhichwererecordedinthesameperiodofthepriorfiscal yearasaresultoffluctuationsintheforeigncurrencyexchangeratesforboththeEuroandtheU.S.DollaragainstthePoundSterling.AsignificantportionoftheforeigncurrencyexchangegainsthatwererecordedforthesixmonthsendedFebruary28,2019wererelatedtothelargerepatriationsfromourU.K.subsidiarywhichweretransactedduringthefirsthalfoffiscalyear2019.
Provision for Income Taxes
Theprovisionforincometaxeswas18.2%and21.1%ofincomebeforeincometaxesforthesixmonthsendedFebruary28,2019and2018,respectively.ThedecreaseintheeffectiveincometaxratefromperiodtoperiodwasprimarilyduetothecontinuedimpactresultingfromtheTaxActanditseffectontheCompany’sfiscalyear.AstheCompany’sfiscalyearendsonAugust31st,theTaxActresultedinablendedfederalstatutorytaxrateof25.7%forfiscalyear2018.Forfiscalyear2019,however,theTaxActisineffectfortheCompany’sfullyearandresultedininafederalstatutorytaxratefortheyearof21%.ForadditionalinformationontheimpactsoftheTaxActontheCompany’sprovisionforincometaxesanditsconsolidatedfinancialstatements,seePartI–Item1,“NotestoCondensedConsolidatedStatements”Note13–IncomeTaxes,includedinthisreport.
41

Net Income
Netincomewas$29.2million,or$2.09percommonshareonafullydilutedbasis,forthesixmonthsendedFebruary28,2019comparedto$27.4million,or$1.95percommonshareonafullydilutedbasis,forthecorrespondingperiodofthepriorfiscalyear.Changesinforeigncurrencyexchangerateshadanunfavorableimpactof$0.9milliononnetincomeforthesixmonthsendedFebruary28,2019comparedtothecorrespondingperiodofthepriorfiscalyear.Onaconstantcurrencybasis,netincomewouldhaveincreasedby$2.6millionfromperiodtoperiod.
42
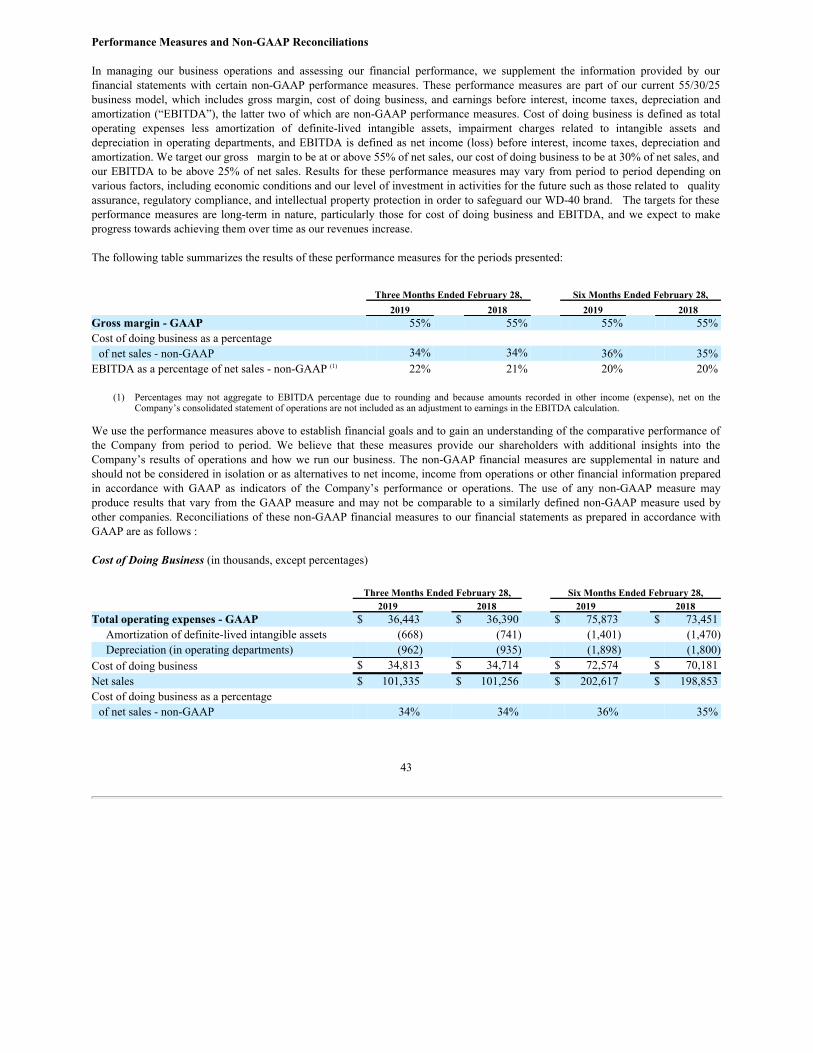
Performance Measures and Non-GAAP Reconciliations
In managing our business operations and assessing our financial performance, we supplement the information provided by ourfinancial statements with certain non-GAAPperformance measures. These performance measures are part of our current 55/30/25business model, which includes gross margin, cost of doing business, and earnings before interest, incometaxes, depreciation andamortization(“EBITDA”),thelattertwoofwhicharenon-GAAPperformancemeasures.Costofdoingbusinessisdefinedastotaloperating expenses less amortization of definite-lived intangible assets, impairment charges related to intangible assets anddepreciationinoperatingdepartments, andEBITDAisdefinedasnetincome(loss) beforeinterest, incometaxes, depreciationandamortization.Wetargetourgrossmargintobeatorabove55%ofnetsales,ourcostofdoingbusinesstobeat30%ofnetsales,andourEBITDAtobeabove25%ofnet sales. Results for theseperformancemeasures mayvaryfromperiodtoperioddependingonvariousfactors,includingeconomicconditionsandourlevelofinvestmentinactivitiesforthefuturesuchasthoserelatedtoqualityassurance,regulatorycompliance,andintellectualpropertyprotectioninordertosafeguardourWD-40brand.Thetargetsfortheseperformance measures are long-termin nature, particularly those for cost of doing business and EBITDA,and weexpect to makeprogresstowardsachievingthemovertimeasourrevenuesincrease.
Thefollowingtablesummarizestheresultsoftheseperformancemeasuresfortheperiodspresented:
Three Months Ended February 28, Six Months Ended February 28,2019 2018 2019 2018
Gross margin - GAAP 55% 55% 55% 55%Costofdoingbusinessasapercentageofnetsales-non-GAAP 34% 34% 36% 35%
EBITDAasapercentageofnetsales-non-GAAP(1) 22% 21% 20% 20%
(1) Percentages may not aggregate to EBITDA percentage due to rounding and because amounts recorded in other income (expense), net on theCompany’sconsolidatedstatementofoperationsarenotincludedasanadjustmenttoearningsintheEBITDAcalculation.
Weusetheperformancemeasuresabovetoestablishfinancialgoalsandtogainanunderstandingofthecomparativeperformanceofthe Company from period to period. We believe that these measures provide our shareholders with additional insights into theCompany’s results of operations andhowwerunour business. Thenon-GAAPfinancial measures are supplemental in nature andshouldnotbeconsideredinisolationorasalternativestonetincome,incomefromoperationsorotherfinancialinformationpreparedin accordance with GAAP as indicators of the Company’s performance or operations. The use of any non-GAAP measure mayproduceresults that varyfromtheGAAPmeasure andmaynot becomparable to a similarly definednon-GAAPmeasure usedbyothercompanies.Reconciliationsofthesenon-GAAPfinancialmeasurestoourfinancialstatementsaspreparedinaccordancewithGAAPareasfollows:
Cost of Doing Business (inthousands,exceptpercentages)
Three Months Ended February 28, Six Months Ended February 28, 2019 2018 2019 2018
Total operating expenses - GAAP $ 36,443 $ 36,390 $ 75,873 $ 73,451Amortizationofdefinite-livedintangibleassets (668) (741) (1,401) (1,470)Depreciation(inoperatingdepartments) (962) (935) (1,898) (1,800)
Costofdoingbusiness $ 34,813 $ 34,714 $ 72,574 $ 70,181Netsales $ 101,335 $ 101,256 $ 202,617 $ 198,853Costofdoingbusinessasapercentageofnetsales-non-GAAP 34% 34% 36% 35%
43
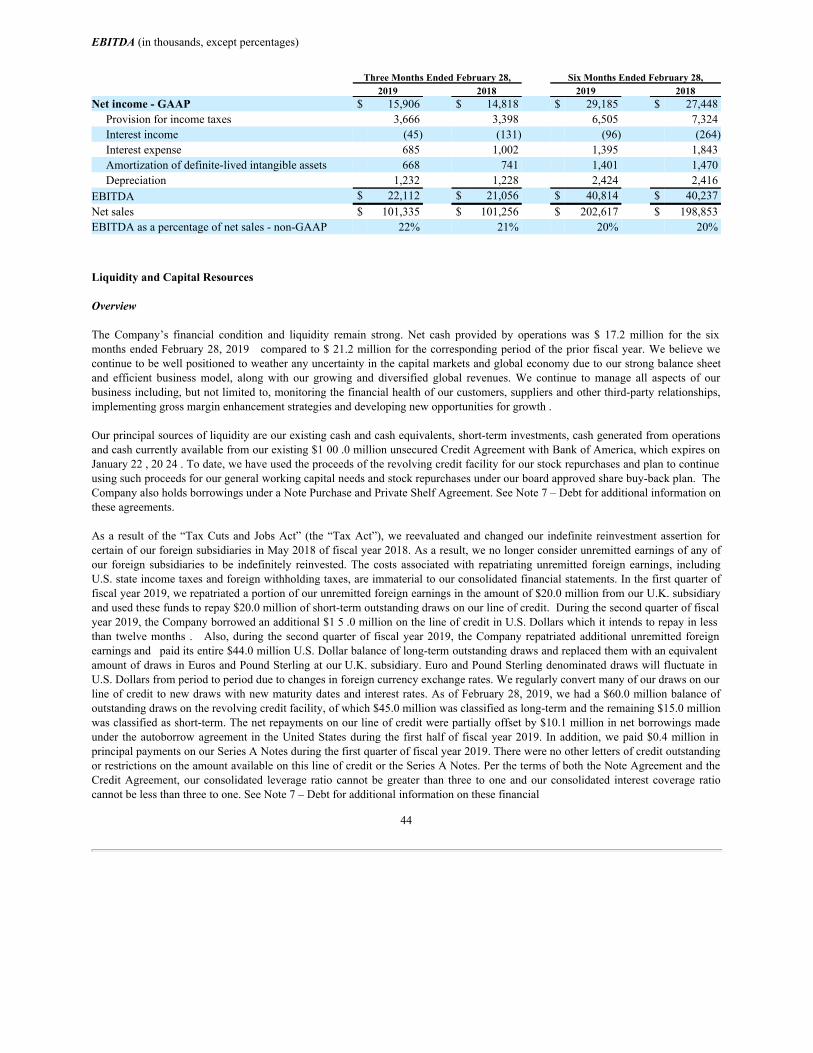
EBITDA (inthousands,exceptpercentages)
Three Months Ended February 28, Six Months Ended February 28, 2019 2018 2019 2018
Net income - GAAP $ 15,906 $ 14,818 $ 29,185 $ 27,448Provisionforincometaxes 3,666 3,398 6,505 7,324Interestincome (45) (131) (96) (264)Interestexpense 685 1,002 1,395 1,843Amortizationofdefinite-livedintangibleassets 668 741 1,401 1,470Depreciation 1,232 1,228 2,424 2,416
EBITDA $ 22,112 $ 21,056 $ 40,814 $ 40,237Netsales $ 101,335 $ 101,256 $ 202,617 $ 198,853EBITDAasapercentageofnetsales-non-GAAP 22% 21% 20% 20%
Liquidity and Capital Resources
Overview
The Company’s financial condition and liquidity remain strong. Net cash provided by operations was $ 17.2million for the sixmonthsendedFebruary28,2019comparedto$21.2millionforthecorrespondingperiodofthepriorfiscalyear.Webelievewecontinuetobewellpositionedtoweatheranyuncertaintyinthecapitalmarketsandglobaleconomyduetoourstrongbalancesheetand efficient business model, along with our growing and diversified global revenues. We continue to manage all aspects of ourbusinessincluding,butnotlimitedto,monitoringthefinancialhealthofourcustomers,suppliersandotherthird-partyrelationships,implementinggrossmarginenhancementstrategiesanddevelopingnewopportunitiesforgrowth.
Ourprincipalsourcesofliquidityareourexistingcashandcashequivalents,short-terminvestments,cashgeneratedfromoperationsandcashcurrentlyavailablefromourexisting$100.0millionunsecuredCreditAgreementwithBankofAmerica,whichexpiresonJanuary22,2024.Todate,wehaveusedtheproceedsoftherevolvingcreditfacilityforourstockrepurchasesandplantocontinueusingsuchproceedsforourgeneralworkingcapitalneedsandstockrepurchasesunderourboardapprovedsharebuy-backplan.TheCompanyalsoholdsborrowingsunderaNotePurchaseandPrivateShelfAgreement.SeeNote7–Debtforadditionalinformationontheseagreements.
Asa result of the “TaxCuts andJobs Act” (the “TaxAct”), wereevaluated andchangedour indefinite reinvestment assertion forcertainofourforeignsubsidiariesinMay2018offiscalyear2018.Asaresult,wenolongerconsiderunremittedearningsofanyofour foreign subsidiaries to be indefinitely reinvested. The costs associated with repatriating unremitted foreign earnings, includingU.S.stateincometaxesandforeignwithholdingtaxes,areimmaterialtoourconsolidatedfinancialstatements.Inthefirstquarteroffiscalyear2019,werepatriatedaportionofourunremittedforeignearningsintheamountof$20.0millionfromourU.K.subsidiaryandusedthesefundstorepay$20.0millionofshort-termoutstandingdrawsonourlineofcredit.Duringthesecondquarteroffiscalyear2019,theCompanyborrowedanadditional$15.0milliononthelineofcreditinU.S.Dollarswhichitintendstorepayinlessthan twelve months .Also, during the secondquarter of fiscal year 2019, the Companyrepatriated additional unremitted foreignearningsandpaiditsentire$44.0millionU.S.Dollarbalanceoflong-termoutstandingdrawsandreplacedthemwithanequivalentamountofdrawsinEurosandPoundSterlingatourU.K.subsidiary.EuroandPoundSterlingdenominateddrawswillfluctuateinU.S.Dollarsfromperiodtoperiodduetochangesinforeigncurrencyexchangerates.Weregularlyconvertmanyofourdrawsonourlineofcredit tonewdrawswithnewmaturitydatesandinterestrates.AsofFebruary28,2019,wehada$60.0millionbalanceofoutstandingdrawsontherevolvingcreditfacility,ofwhich$45.0millionwasclassifiedaslong-termandtheremaining$15.0millionwasclassifiedasshort-term.Thenetrepaymentsonourlineofcreditwerepartiallyoffsetby$10.1millioninnetborrowingsmadeunder the autoborrowagreementin the UnitedStatesduringthe firsthalfof fiscal year 2019. In addition, wepaid $0.4million inprincipalpaymentsonourSeriesANotesduringthefirstquarteroffiscalyear2019.TherewerenootherlettersofcreditoutstandingorrestrictionsontheamountavailableonthislineofcreditortheSeriesANotes.PerthetermsofboththeNoteAgreementandtheCredit Agreement, our consolidated leverage ratio cannot be greater than three to one and our consolidated interest coverage ratiocannotbelessthanthreetoone.SeeNote7–Debtforadditionalinformationonthesefinancial
44
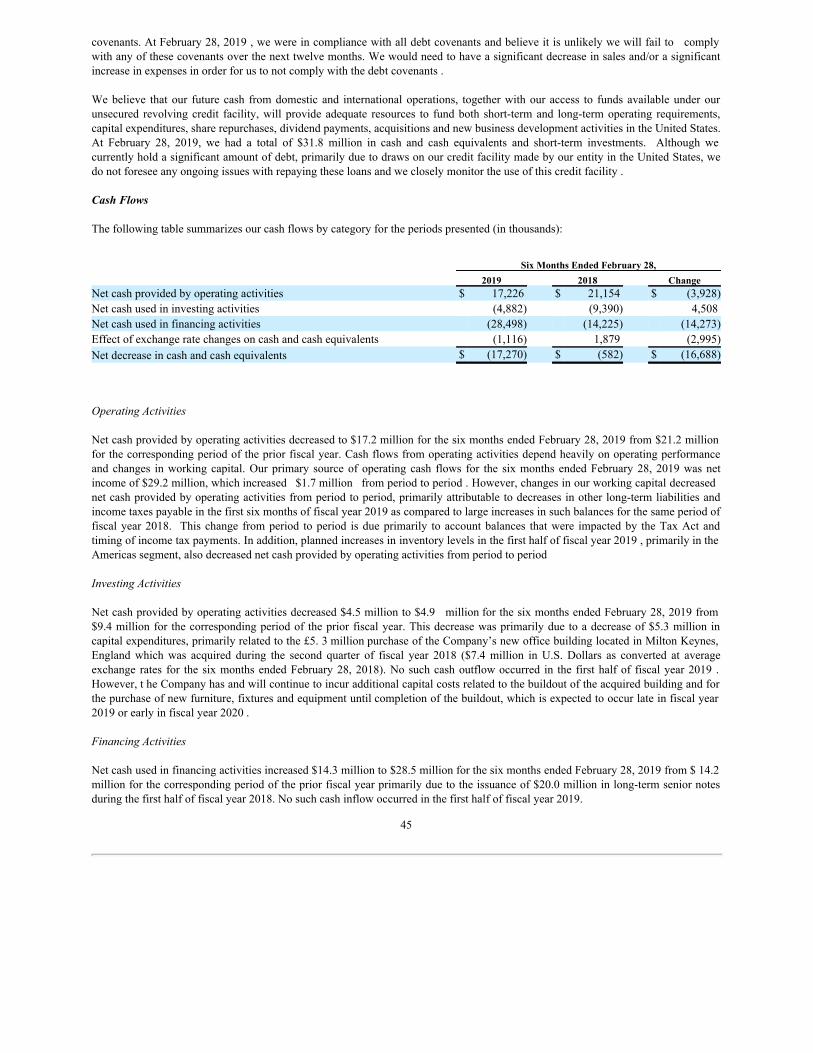
covenants.AtFebruary28,2019,wewereincompliancewithalldebtcovenantsandbelieveitisunlikelywewillfailtocomplywithanyofthesecovenantsoverthenexttwelvemonths.Wewouldneedtohaveasignificantdecreaseinsalesand/orasignificantincreaseinexpensesinorderforustonotcomplywiththedebtcovenants.
Webelieve that our future cash fromdomestic and international operations, together with our access to funds available under ourunsecured revolving credit facility, will provide adequate resources to fund both short-termand long-termoperating requirements,capitalexpenditures,sharerepurchases,dividendpayments,acquisitionsandnewbusinessdevelopmentactivitiesintheUnitedStates.At February 28, 2019, we had a total of $31.8 million in cash and cash equivalents and short-term investments. Although wecurrentlyholdasignificantamountofdebt,primarilyduetodrawsonourcreditfacilitymadebyourentityintheUnitedStates,wedonotforeseeanyongoingissueswithrepayingtheseloansandwecloselymonitortheuseofthiscreditfacility.
Cash Flows
Thefollowingtablesummarizesourcashflowsbycategoryfortheperiodspresented(inthousands):
Six Months Ended February 28,2019 2018 Change
Netcashprovidedbyoperatingactivities $ 17,226 $ 21,154 $ (3,928)Netcashusedininvestingactivities (4,882) (9,390) 4,508Netcashusedinfinancingactivities (28,498) (14,225) (14,273)Effectofexchangeratechangesoncashandcashequivalents (1,116) 1,879 (2,995)Netdecreaseincashandcashequivalents $ (17,270) $ (582) $ (16,688)
Operating Activities
Netcashprovidedbyoperatingactivitiesdecreasedto$17.2millionforthesixmonthsendedFebruary28,2019from$21.2millionforthecorrespondingperiodofthepriorfiscalyear.Cashflowsfromoperatingactivitiesdependheavilyonoperatingperformanceand changes in working capital. Our primary source of operating cash flows for the six months ended February 28, 2019 was netincomeof$29.2million,whichincreased$1.7millionfromperiodtoperiod.However,changesinourworkingcapitaldecreasednetcashprovidedbyoperatingactivitiesfromperiodtoperiod,primarilyattributabletodecreasesinotherlong-termliabilitiesandincometaxespayableinthefirstsixmonthsoffiscalyear2019ascomparedtolargeincreasesinsuchbalancesforthesameperiodoffiscal year 2018. This change fromperiod to period is due primarily to account balances that were impacted by the Tax Act andtimingofincometaxpayments.Inaddition,plannedincreasesininventorylevelsinthefirsthalfoffiscalyear2019,primarilyintheAmericassegment,alsodecreasednetcashprovidedbyoperatingactivitiesfromperiodtoperiod
Investing Activities
Netcashprovidedbyoperatingactivitiesdecreased$4.5millionto$4.9millionforthesixmonthsendedFebruary28,2019from$9.4millionforthecorrespondingperiodoftheprior fiscalyear. Thisdecreasewasprimarilyduetoadecreaseof$5.3millionincapitalexpenditures,primarilyrelatedtothe£5.3millionpurchaseoftheCompany’snewofficebuildinglocatedinMiltonKeynes,England which was acquired during the second quarter of fiscal year 2018 ($7.4 million in U.S. Dollars as converted at averageexchange rates for the six months ended February 28, 2018).Nosuchcashoutflowoccurred in the first half of fiscal year 2019 .However,theCompanyhasandwillcontinuetoincuradditionalcapitalcostsrelatedtothebuildoutoftheacquiredbuildingandforthepurchaseofnewfurniture,fixturesandequipmentuntilcompletionofthebuildout,whichisexpectedtooccurlateinfiscalyear2019orearlyinfiscalyear2020.
Financing Activities
Netcashusedinfinancingactivitiesincreased$14.3millionto$28.5millionforthesixmonthsendedFebruary28,2019from$14.2millionforthecorrespondingperiodofthepriorfiscalyearprimarilyduetotheissuanceof$20.0millioninlong-termseniornotesduringthefirsthalfoffiscalyear2018.Nosuchcashinflowoccurredinthefirsthalfoffiscalyear2019.
45
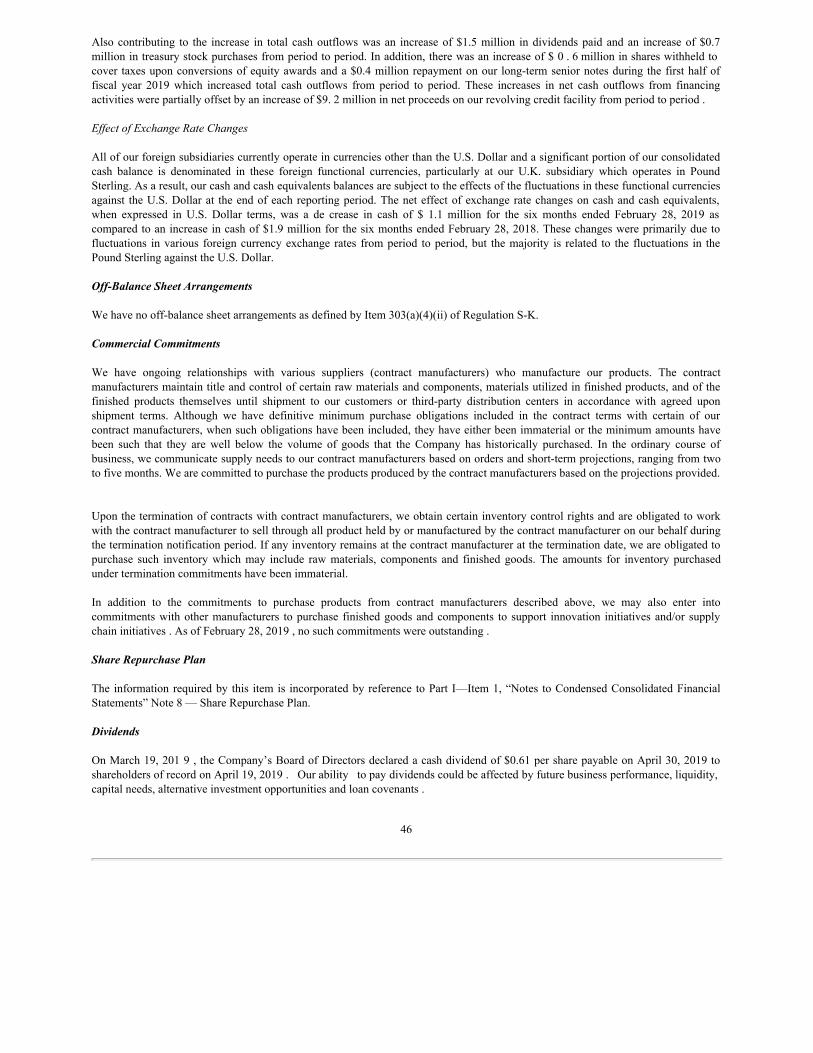
Also contributing to the increase in total cash outflows was an increase of $1.5 million in dividends paid and an increase of $0.7millionintreasurystockpurchasesfromperiodtoperiod.Inaddition,therewasanincreaseof$0.6millioninshareswithheldtocovertaxesuponconversionsofequityawardsanda$0.4millionrepaymentonourlong-termsenior notesduringthefirst half offiscal year 2019 which increased total cash outflows from period to period. These increases in net cash outflows from financingactivitieswerepartiallyoffsetbyanincreaseof$9.2millioninnetproceedsonourrevolvingcreditfacilityfromperiodtoperiod.
Effect of Exchange Rate Changes
AllofourforeignsubsidiariescurrentlyoperateincurrenciesotherthantheU.S.Dollarandasignificantportionofourconsolidatedcash balance is denominated in these foreign functional currencies, particularly at our U.K. subsidiary which operates in PoundSterling.Asaresult,ourcashandcashequivalentsbalancesaresubjecttotheeffectsofthefluctuationsinthesefunctionalcurrenciesagainst theU.S. Dollar at theendof eachreportingperiod.Thenet effect of exchangerate changesoncashandcashequivalents,when expressed in U.S. Dollar terms, was a de crease in cash of $ 1.1million for the six months ended February 28, 2019 ascomparedtoanincreaseincashof$1.9millionforthesixmonthsendedFebruary28,2018.Thesechangeswereprimarilyduetofluctuations in various foreign currency exchange rates fromperiod to period, but the majority is related to the fluctuations in thePoundSterlingagainsttheU.S.Dollar.
Off-Balance Sheet Arrangements
Wehavenooff-balancesheetarrangementsasdefinedbyItem303(a)(4)(ii)ofRegulationS-K.
Commercial Commitments
We have ongoing relationships with various suppliers (contract manufacturers) who manufacture our products. The contractmanufacturersmaintaintitleandcontrolofcertainrawmaterialsandcomponents,materialsutilizedinfinishedproducts,andofthefinished products themselves until shipment to our customers or third-party distribution centers in accordance with agreed uponshipment terms. Although we have definitive minimum purchase obligations included in the contract terms with certain of ourcontractmanufacturers,whensuchobligationshavebeenincluded,theyhaveeitherbeenimmaterialortheminimumamountshavebeen such that they are well below the volume of goods that the Company has historically purchased. In the ordinary course ofbusiness,wecommunicatesupplyneedstoourcontractmanufacturersbasedonordersandshort-termprojections,rangingfromtwotofivemonths.Wearecommittedtopurchasetheproductsproducedbythecontractmanufacturersbasedontheprojectionsprovided.
Upontheterminationofcontractswithcontractmanufacturers,weobtaincertaininventorycontrolrightsandareobligatedtoworkwiththecontractmanufacturertosellthroughallproductheldbyormanufacturedbythecontractmanufactureronourbehalfduringtheterminationnotificationperiod.Ifanyinventoryremainsatthecontractmanufacturerattheterminationdate,weareobligatedtopurchase such inventory which may include raw materials, components and finished goods. The amounts for inventory purchasedunderterminationcommitmentshavebeenimmaterial.
In addition to the commitments to purchase products from contract manufacturers described above, we may also enter intocommitments with other manufacturers to purchase finished goods and components to support innovation initiatives and/or supplychaininitiatives.AsofFebruary28,2019,nosuchcommitmentswereoutstanding.
Share Repurchase Plan
Theinformationrequiredbythis itemis incorporated byreference to Part I—Item1, “Notes to CondensedConsolidatedFinancialStatements”Note8—ShareRepurchasePlan.
Dividends
OnMarch19,2019,theCompany’sBoardofDirectorsdeclaredacashdividendof$0.61persharepayableonApril30,2019toshareholdersofrecordonApril19,2019.Ourabilitytopaydividendscouldbeaffectedbyfuturebusinessperformance,liquidity,capitalneeds,alternativeinvestmentopportunitiesandloancovenants.
46
Critical Accounting Policies
Our discussion and analysis of our operating results and financial condition is based upon our consolidated financial statements,whichhavebeenpreparedinaccordancewithaccountingprinciplesgenerallyacceptedintheUnitedStatesofAmerica.
Criticalaccountingpoliciesarethosethatinvolvesubjectiveorcomplexjudgments,oftenasaresultoftheneedtomakeestimates.Thefollowingareasall require theuseof judgments andestimates: revenuerecognition, accountingfor incometaxes, valuationofgoodwillandimpairmentofdefinite-livedintangibleassets.Estimatesineachoftheseareasarebasedonhistoricalexperienceandvariousjudgmentsandassumptionsthatwebelieveareappropriate.Actualresultsmaydifferfromtheseestimates.
OnSeptember1, 2018,theCompanyadoptedASC606,“RevenuefromContractswithCustomers”, whichresultedinachangeinaccountingprinciplerelatedtorevenuerecognition,acriticalaccountingpolicyfortheCompany,effectiveinthefirstquarteroffiscalyear2019.Foradditionalinformationonthischangeinaccountingprinciple,seePartI—Item1,“NotestoCondensedConsolidatedFinancial Statements” Note 2 —Basis of Presentation andSummaryof Significant AccountingPolicies; andNote 10—RevenueRecognition,includedinthisreport.Exceptasdisclosedtherein,therehavebeennoothermaterialchangesinourcriticalaccountingpolicies from those disclosed in Part II―Item 7, “Management’s Discussion and Analysis of Financial Condition and Results ofOperations,” andNote2toourconsolidatedfinancial statements containedinourAnnualReport onForm10-Kforthefiscal yearendedAugust31,2018,whichwasfiledwiththeSEConOctober22,2018.
Recently Issued Accounting Standards
InformationonRecentlyIssuedAccountingStandardsthatcouldpotentiallyimpacttheCompany’sconsolidatedfinancialstatementsandrelateddisclosuresisincorporatedbyreferencetoPartI—Item1,“NotestoCondensedConsolidatedFinancialStatements”Note2—BasisofPresentationandSummaryofSignificantAccountingPolicies,includedinthisreport.
Item 3. Quantitative and Qualitative Disclosures About Market Risk
The information required by this itemis incorporated by reference to Part II―Item7A, “Quantitative and Qualitative DisclosuresAboutMarketRisk,”inourAnnualReportonForm10-KforthefiscalyearendedAugust31,2018,whichwasfiledwiththeSEConOctober22,2018.
Item 4. Controls and Procedures
The term “disclosure controls and procedures” is defined in Rules 13a-15(e) and 15d-15(e) promulgated under the SecuritiesExchange Act of 1934 (“Exchange Act”). The term disclosure controls and procedures means controls and other procedures of aCompanythataredesignedtoensuretheinformationrequiredtobedisclosedbytheCompanyinthereportsthatitfilesorsubmitsunder theExchangeAct is recorded, processed, summarizedandreportedwithinthetimeperiodsspecifiedin theSEC’srules andforms. Disclosure controls andprocedures include, without limitation, controls andprocedures designedto ensure that informationrequired to be disclosed by a Company in the reports that it files or submits under the Exchange Act is accumulated andcommunicated to the Company’s management, including its principal executive and principal financial officers, or personsperforming similar functions, as appropriate to allow timely decisions regarding required disclosures. The Company’s ChiefExecutiveOfficerandChiefFinancialOfficerhaveevaluatedtheeffectivenessoftheCompany’sdisclosurecontrolsandproceduresasofFebruary28,2019,theendoftheperiodcoveredbythisreport(theEvaluationDate),andtheyhaveconcludedthat,asoftheEvaluationDate,suchcontrolsandprocedureswereeffectiveatensuringthatrequiredinformationwillbedisclosedonatimelybasisintheCompany’sreportsfiledundertheExchangeAct.AlthoughmanagementbelievestheCompany’sexistingdisclosurecontrolsandproceduresareadequatetoenabletheCompanytocomplywithitsdisclosureobligations,managementcontinuestoreviewandupdatesuchcontrolsandprocedures.TheCompanyhasadisclosurecommittee,whichconsistsofcertainmembersoftheCompany’sseniormanagement.
TherewerenochangestotheCompany’sinternalcontroloverfinancial reportingthatoccurredduringtheCompany’smostrecentfiscalquarterthatmateriallyaffected,orwouldbereasonablylikelytomateriallyaffect,theCompany’sinternalcontroloverfinancialreporting.EnhancementsweremadetotheCompany’sinternalcontrolsoverfinancialreporting,effectivebeginningonSeptember1,2018,duetotheimplementationofthenewrevenueguidanceunderASC606.Althoughthenew
47
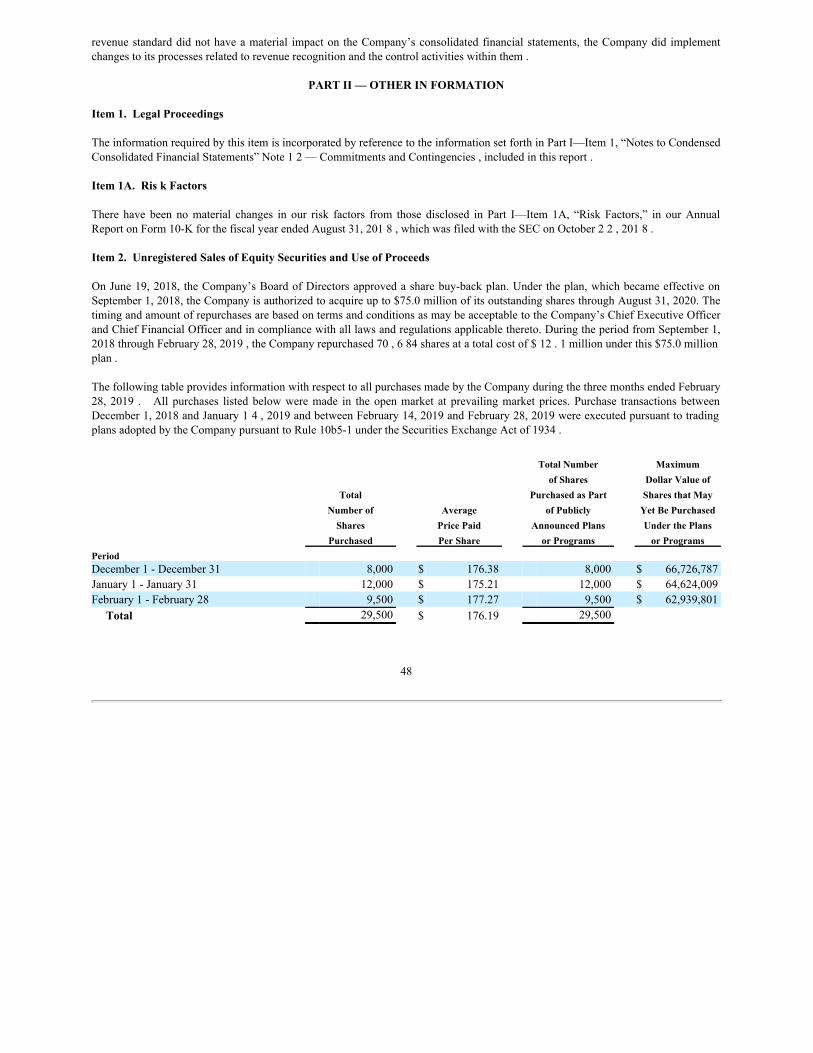
revenuestandarddidnot haveamaterial impact ontheCompany’s consolidatedfinancial statements, theCompanydidimplementchangestoitsprocessesrelatedtorevenuerecognitionandthecontrolactivitieswithinthem.
PART II — OTHER IN FORMATION
Item 1. Legal Proceedings TheinformationrequiredbythisitemisincorporatedbyreferencetotheinformationsetforthinPartI—Item1,“NotestoCondensedConsolidatedFinancialStatements”Note12—CommitmentsandContingencies,includedinthisreport.
Item 1A. Ris k Factors
There have been no material changes in our risk factors from those disclosed in Part I—Item 1A, “Risk Factors,” in our AnnualReportonForm10-KforthefiscalyearendedAugust31,2018,whichwasfiledwiththeSEConOctober22,2018.
Item 2. Unregistered Sales of Equity Securities and Use of Proceeds
OnJune19,2018,theCompany’sBoardofDirectorsapprovedasharebuy-backplan. Undertheplan, whichbecameeffectiveonSeptember1,2018,theCompanyisauthorizedtoacquireupto$75.0millionofitsoutstandingsharesthroughAugust31,2020.ThetimingandamountofrepurchasesarebasedontermsandconditionsasmaybeacceptabletotheCompany’sChiefExecutiveOfficerandChiefFinancialOfficerandincompliancewithalllawsandregulationsapplicablethereto.DuringtheperiodfromSeptember1,2018throughFebruary28,2019,theCompanyrepurchased70,684sharesatatotalcostof$12.1millionunderthis$75.0millionplan.
ThefollowingtableprovidesinformationwithrespecttoallpurchasesmadebytheCompanyduringthethreemonthsendedFebruary28, 2019 . All purchases listed belowwere made in the open market at prevailing market prices.Purchase transactions betweenDecember1,2018andJanuary14,2019andbetweenFebruary14,2019andFebruary28,2019wereexecutedpursuanttotradingplansadoptedbytheCompanypursuanttoRule10b5-1undertheSecuritiesExchangeActof1934.
Total Number Maximumof Shares Dollar Value of
Total Purchased as Part Shares that MayNumber of Average of Publicly Yet Be Purchased
Shares Price Paid Announced Plans Under the PlansPurchased Per Share or Programs or Programs
PeriodDecember1-December31 8,000 $ 176.38 8,000 $ 66,726,787January1-January31 12,000 $ 175.21 12,000 $ 64,624,009February1-February28 9,500 $ 177.27 9,500 $ 62,939,801
Total 29,500 $ 176.19 29,500
48
Item 6. Exhibits Exhibit No. Description
3(a) CertificateofIncorporation,incorporatedbyreferencefromtheRegistrant’sForm10-KfiledOctober22,2018,Exhibit3(a)thereto.
3(b) AmendedandRestatedBylawsofWD-40Company,incorporatedbyreferencefromtheRegistrant’sForm8-KfiledAugust16,2018,Exhibit3.1thereto.
10(a) SeventhAmendmenttoCreditAgreementdatedJanuary22,2019amongWD-40CompanyandBankofAmerica,N.A.,incorporatedbyreferencefromtheRegistrant’sForm8-KfiledJanuary25,2019,Exhibit10(a)thereto.
31(a) CertificationofChiefExecutiveOfficerpursuanttoSection302oftheSarbanes-OxleyActof2002.
31(b) CertificationofChiefFinancialOfficerpursuanttoSection302oftheSarbanes-OxleyActof2002.
32(a) CertificationofChiefExecutiveOfficerpursuanttoSection906oftheSarbanes-OxleyActof2002.
32(b) CertificationofChiefFinancialOfficerpursuanttoSection906oftheSarbanes-OxleyActof2002.
101.INS XBRLInstanceDocument
101.SCH XBRLTaxonomyExtensionSchemaDocument
101.CAL XBRLTaxonomyExtensionCalculationLinkbaseDocument
101.DEF XBRLTaxonomyExtensionDefinitionLinkbaseDocument
101.LAB XBRLTaxonomyExtensionLabelsLinkbaseDocument
101.PRE XBRLTaxonomyExtensionPresentationLinkbaseDocument
49
SIGNATURES
PursuanttotherequirementsoftheSecuritiesExchangeActof1934,theRegistranthasdulycausedthisreporttobesignedonitsbehalfbytheundersignedthereuntodulyauthorized.
WD-40COMPANYRegistrant
Date:April9,2019 By: /s/GARRYO.RIDGEGarryO.RidgePresidentandChiefExecutiveOfficer(PrincipalExecutiveOfficer)
By: /s/JAYW.REMBOLTJayW.RemboltVicePresident,FinanceTreasurerandChiefFinancialOfficer
50
/s/GARRYO.RIDGE
GarryO.RidgePresidentandChiefExecutiveOfficer
Exhibit 31(a)
CERTIFICATION OF CHIEF EXECUTIVE OFFICER PURSUANT TO SECTION 302 OF THE SARBANES-OXLEY ACT OF 2002
I,GarryO.Ridge,certifythat:
1. IhavereviewedthisreportonForm10-QofWD-40Company;
2. Basedonmyknowledge,thisreportdoesnotcontainanyuntruestatementofamaterialfactoromittostateamaterialfactnecessarytomakethestatementsmade,inlightofthecircumstancesunderwhichsuchstatementsweremade,notmisleadingwithrespecttotheperiodcoveredbythisreport;
3. Basedonmyknowledge,thefinancialstatements,andotherfinancialinformationincludedinthisreport,fairlypresentinallmaterialrespectsthefinancialcondition,resultsofoperations,andcashflowsoftheRegistrantasof,andfor,theperiodspresentedinthisreport;
4. TheRegistrant’sothercertifyingofficerandIareresponsibleforestablishingandmaintainingdisclosurecontrolsandprocedures(asdefinedinExchangeActRules13a-15(e)and15d-15(e))andinternalcontroloverfinancialreporting(asdefinedinExchangeActRules13a-15(f)and15d-15(f))fortheRegistrantandhave:
a) Designedsuchdisclosurecontrolsandprocedures,orcausedsuchdisclosurecontrolsandprocedurestobedesignedunderoursupervision,toensurethatmaterialinformationrelatingtotheRegistrant,includingitsconsolidatedsubsidiaries,ismadeknowntousbyotherswithinthoseentities,particularlyduringtheperiodinwhichthisreportisbeingprepared;
b) Designedsuchinternalcontroloverfinancialreporting,orcausedsuchinternalcontroloverfinancialreportingtobedesignedunderoursupervision,toprovidereasonableassuranceregardingthereliabilityoffinancialreportingandthepreparationoffinancialstatementsforexternalpurposesinaccordancewithgenerallyacceptedaccountingprinciples;
c) EvaluatedtheeffectivenessoftheRegistrant’sdisclosurecontrolsandproceduresandpresentedinthisreportourconclusionsabouttheeffectivenessofthedisclosurecontrolsandprocedures,asoftheendoftheperiodcoveredbythisreportbasedonsuchevaluation;and
d) DisclosedinthisreportanychangeintheRegistrant’sinternalcontroloverfinancialreportingthatoccurredduringtheRegistrant’smostrecentfiscalquarter(theRegistrant’sfourthfiscalquarterinthecaseofanannualreport)thathasmateriallyaffected,orisreasonablylikelytomateriallyaffect,theRegistrant’sinternalcontroloverfinancialreporting;and
5. TheRegistrant’sothercertifyingofficerandIhavedisclosed,basedonourmostrecentevaluationofinternalcontroloverfinancialreporting,totheRegistrant’sauditorsandtheauditcommitteeoftheRegistrant’sboardofdirectors(orpersonsperformingtheequivalentfunctions):
a) AllsignificantdeficienciesandmaterialweaknessesinthedesignoroperationofinternalcontroloverfinancialreportingwhicharereasonablylikelytoadverselyaffecttheRegistrant’sabilitytorecord,process,summarize,andreportfinancialinformation;and
b) Anyfraud,whetherornotmaterial,thatinvolvesmanagementorotheremployeeswhohaveasignificantroleintheRegistrant’sinternalcontroloverfinancialreporting.
Date:April9,2019
/s/JAYW.REMBOLT
JayW.RemboltVicePresident,Finance,TreasurerandChiefFinancialOfficer
Exhibit 31(b )
CERTIFICATION OF CHIEF FINANCIAL OFFICER PURSUANT TO SECTION 302 OF THE SARBANES-OXLEY ACT OF 2002
I,JayW.Rembolt,certifythat:1. IhavereviewedthisreportonForm10-QofWD-40Company;2. Basedonmyknowledge,thisreportdoesnotcontainanyuntruestatementofamaterialfactoromittostatea
materialfactnecessarytomakethestatementsmade,inlightofthecircumstancesunderwhichsuchstatementsweremade,notmisleadingwithrespecttotheperiodcoveredbythisreport;
3. Basedonmyknowledge,thefinancialstatements,andotherfinancialinformationincludedinthisreport,fairlypresentinallmaterialrespectsthefinancialcondition,resultsofoperations,andcashflowsoftheRegistrantasof,andfor,theperiodspresentedinthisreport;
4. TheRegistrant’sothercertifyingofficerandIareresponsibleforestablishingandmaintainingdisclosurecontrolsandprocedures(asdefinedinExchangeActRules13a-15(e)and15d-15(e))andinternalcontroloverfinancialreporting(asdefinedinExchangeActRules13a-15(f)and15d-15(f))fortheRegistrantandhave:a) Designedsuchdisclosurecontrolsandprocedures,orcausedsuchdisclosurecontrolsandprocedurestobe
designedunderoursupervision,toensurethatmaterialinformationrelatingtotheRegistrant,includingitsconsolidatedsubsidiaries,ismadeknowntousbyotherswithinthoseentities,particularlyduringtheperiodinwhichthisreportisbeingprepared;
b) Designedsuchinternalcontroloverfinancialreporting,orcausedsuchinternalcontroloverfinancialreportingtobedesignedunderoursupervision,toprovidereasonableassuranceregardingthereliabilityoffinancialreportingandthepreparationoffinancialstatementsforexternalpurposesinaccordancewithgenerallyacceptedaccountingprinciples;
c) EvaluatedtheeffectivenessoftheRegistrant’sdisclosurecontrolsandproceduresandpresentedinthisreportourconclusionsabouttheeffectivenessofthedisclosurecontrolsandprocedures,asoftheendoftheperiodcoveredbythisreportbasedonsuchevaluation;and
d) DisclosedinthisreportanychangeintheRegistrant’sinternalcontroloverfinancialreportingthatoccurredduringtheRegistrant’smostrecentfiscalquarter(theRegistrant’sfourthfiscalquarterinthecaseofanannualreport)thathasmateriallyaffected,orisreasonablylikelytomateriallyaffect,theRegistrant’sinternalcontroloverfinancialreporting;and
5. TheRegistrant’sothercertifyingofficerandIhavedisclosed,basedonourmostrecentevaluationofinternalcontroloverfinancialreporting,totheRegistrant’sauditorsandtheauditcommitteeoftheRegistrant’sboardofdirectors(orpersonsperformingtheequivalentfunctions):a) Allsignificantdeficienciesandmaterialweaknessesinthedesignoroperationofinternalcontroloverfinancial
reportingwhicharereasonablylikelytoadverselyaffecttheRegistrant’sabilitytorecord,process,summarize,andreportfinancialinformation;and
b) Anyfraud,whetherornotmaterial,thatinvolvesmanagementorotheremployeeswhohaveasignificantroleintheRegistrant’sinternalcontroloverfinancialreporting.
Date:April9,2019
/s/GARRYO.RIDGEGarryO.RidgePresidentandChiefExecutiveOfficer
Exhibit 32(a)
CERTIFICATION PURSUANT TO18 U.S.C. SECTION 1350,
AS ADOPTED PURSUANT TOSECTION 906 OF THE SARBANES-OXLEY ACT OF 2002
I,GarryO.Ridge,ChiefExecutiveOfficerofWD-40Company(the“Company”),havereviewedtheQuarterlyReportonForm10-QoftheCompanyforthequarterendedFebruary28,2019(the“Report”).ForpurposesofSection1350ofTitle18,UnitedStatesCode,Icertifythattothebestofmyknowledge:
(1) the Report fully complies with the requirements of section 13(a) or 15(d) of the Securities Exchange Act of 1934, asamended;and
(2) the information contained in the Report fairly presents, in all material respects, the financial condition and results ofoperationsoftheCompany.
Date:April9,2019
/s/JAYW.REMBOLTJayW.RemboltVicePresident,Finance,TreasurerandChiefFinancialOfficer
Exhibit 32(b )
CERTIFICATION PURSUANT TO18 U.S.C. SECTION 1350,
AS ADOPTED PURSUANT TOSECTION 906 OF THE SARBANES-OXLEY ACT OF 2002
I,JayW.Rembolt,ChiefFinancialOfficerofWD-40Company(the“Company”),havereviewedtheQuarterlyReportonForm10-QoftheCompanyforthequarterendedFebruary28,2019(the“Report”).ForpurposesofSection1350ofTitle18,UnitedStatesCode,Icertifythattothebestofmyknowledge:
(1) the Report fully complies with the requirements of section 13(a) or 15(d) of the Securities Exchange Act of 1934, asamended;and
(2) the information contained in the Report fairly presents, in all material respects, the financial condition and results ofoperationsoftheCompany.
Date:April9,2019


![(RON) 14AUG 0.95 1.01 1.05 1.05 1.05 1.04 2.3% PSB Industries [FR] 11.6x 1.3x … · 2017-08-14 · APS (RON) 0.95 1.01 1.05 1.05 1.05 1.04 2.3% 11.6x 1.3x ROaE À 8.2% 0.7% 0.8%](https://img.pdfslide.net/doc/110x75/5f7f1b4bb4b94c6a071b1181/ron-14aug-095-101-105-105-105-104-23-psb-industries-fr-116x-13x-2017-08-14.jpg)


![National Defense Medical Center · 2020-04-08 · 1.78 (95% : [1.64 1.80 (95% cl : [l .66 1.95]) , 1.05 (95% : [0.98 1.04 (95% : [0.96 hiv/aids zostavax 48 , zostavax (l) 201 70 i-iz](https://img.pdfslide.net/doc/110x75/5f65a978eb647e33454afeb6/national-defense-medical-center-2020-04-08-178-95-164-180-95-cl-l.jpg)


![1.05 Mb [Download]](https://img.pdfslide.net/doc/110x75/587f2c131a28abb43f8bc435/105-mb-download.jpg)