Embed Size (px)
Citation preview
We Love Nature

Long-Term Vision & Medium and Long Term Management Plan
Our Long-Term Vision P.18
Medium and Long-Term Management Plan P.19
Appendix
ESG & SDGs Activities P.20
ESG in the Value Chains P.21
Project of the Developing Green Tea-Producing Regions
P.22
Data Collection (Data Base)
Management Index (Consolidated) P.23
INDEX Beverage Market in Japan P.1
Results of Operations FYE April 2017 P.2
Forecasts FYE April 2018 P.3
Management Policy P.4
ITO EN Brand Strategy
Results & Forecasts by Category (Non-Consolidated) P.6
Brand Strategy P.7
Tea Leaf Products P.8
Oi Ocha (Green Tea) P.9
Healthy Mineral Barley Tea & Other RTD Tea P.11
One day Veggie & Other Vegetable Beverage P.12
TULLY'S COFFEE (RTD) P.13
Group Business Overview
Tully's Coffee Japan P.14
Chichiyasu (Yogurt Company) P.15
Overseas Business P.16

85.2 217.1
447.0 405.0 401.0 415.0 435.0 445.0
579.3
484.3 480.0 475.5 458.0 477.0 487.5
648.9 538.5 698.0 705.0 720.0 725.0 725.0
922.3 955.1 938.7 929.3 942.0
951.0 952.0
145.6 159.2
164.4 147.2 140.0 152.2 153.5
447.4 376.4 329.9 317.0 305.0
306.0 306.0 97.7 157.5
244.0 258.2 267.0 284.0 280.0 260.1
276.3
260.0 244.2 244.0 246.0 246.0 222.0
218.4 160.0 182.6 187.0
193.8 195.0
0
1,000
2,000
3,000
4,000
1980 1985 1990 1995 2000 2005 2013 2014 2015 2016 2017
Forecast
(¥ billion)
(885.0)
1
Beverage Market in Japan
(Tea total) Other Tea
Carbonated
Coffee
Vegetable
Fruit
Mineral Water
Others/Functional
Sports Drink
Green Tea
Monthly Sales Volume Trends (ITO EN vs. Market)
RTD Market Trends
1980 1985 1990 1995 2000 2005 2013 2014 2015 20162017
Forecast
Total (\ billion) - - 2,707.5 3,100.1 3,540.3 3,612.7 3,680.0 3,660.0 3,678.0 3,770.0 3,790.0
YOY %Change - - - - - - 1% -1% 0% 3% 1%
-2.0 -1.0
1.0
3.0
7.0
1.0
3.0
0.0
4.0
-1.0
1.0
-5.0
1.0
0.0 1.0
4.0
6.0
0.0
2.0
2.0
4.0
0.0
3.0
-3.0
-5
0
5
10
May Jun Jul Aug Sep Oct Nov Dec Jan Feb Mar Apr
YOY (%)
Source: ITO EN, (Chart) May 2016 to Apr 2017
ITO EN Kumamoto
earthquakes (Apr. 2016)
Market
Topics of Beverage Market (2016)
・RTD Green Tea Market: Performed well
(RTD Green Tea, Blended Tea and Barley Tea)
・RTD Coffee Market: Steady
(Bottle Cans Led Market)
・Vegetable Beverage: Recovered
(Especially Tomato Beverages)
Carbonated has become popular
Coffee has become popular
Tea has become Popular Start of the Unsweetened RTD Tea Market
1980 Pioneering of
Canned Oolong Tea
Source: ITO EN, Calendar year
(932.5) (912.0) (873.0) (876.5)
(931.3)
(796.4)
1985 Pioneering of
Canned Green Tea
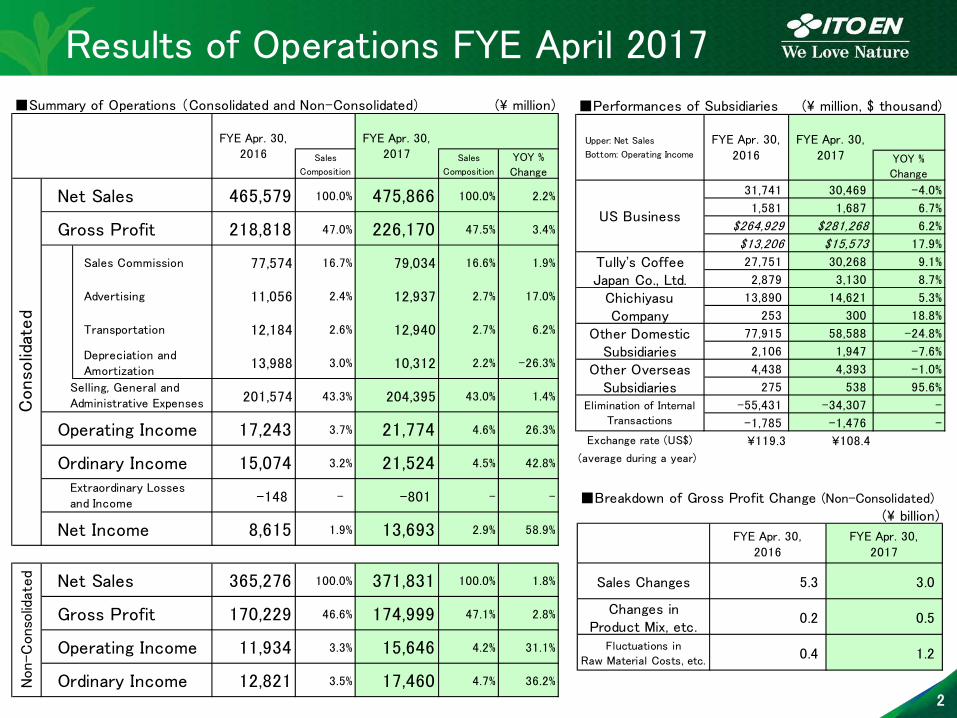
Results of Operations FYE April 2017
2
■Summary of Operations (Consolidated and Non-Consolidated) (\ million)
Sales
Composition
Sales
Composition
YOY %
Change
465,579 100.0% 475,866 100.0% 2.2%
218,818 47.0% 226,170 47.5% 3.4%
Sales Commission 77,574 16.7% 79,034 16.6% 1.9%
Advertising 11,056 2.4% 12,937 2.7% 17.0%
Transportation 12,184 2.6% 12,940 2.7% 6.2%
Depreciation and Amortization
13,988 3.0% 10,312 2.2% -26.3%
201,574 43.3% 204,395 43.0% 1.4%
17,243 3.7% 21,774 4.6% 26.3%
15,074 3.2% 21,524 4.5% 42.8%
-148 - -801 - -
8,615 1.9% 13,693 2.9% 58.9%
365,276 100.0% 371,831 100.0% 1.8%
170,229 46.6% 174,999 47.1% 2.8%
11,934 3.3% 15,646 4.2% 31.1%
12,821 3.5% 17,460 4.7% 36.2% Ordinary IncomeNon-C
onso
lidate
d Net Sales
Gross Profit
Operating Income
FYE Apr. 30,2016
FYE Apr. 30,2017
Conso
lidat
ed
Net Sales
Gross Profit
Extraordinary Losses and Income
Net Income
Operating Income
Ordinary Income
Selling, General and Administrative Expenses
■Performances of Subsidiaries (\ million, $ thousand)
YOY %
Change
31,741 30,469 -4.0%
1,581 1,687 6.7%
$264,929 $281,268 6.2%
$13,206 $15,573 17.9%
27,751 30,268 9.1%
2,879 3,130 8.7%
13,890 14,621 5.3%
253 300 18.8%
77,915 58,588 -24.8%
2,106 1,947 -7.6%
4,438 4,393 -1.0%
275 538 95.6%
-55,431 -34,307 -
-1,785 -1,476 -
Exchange rate (US$) ¥119.3 ¥108.4
(average during a year)
Elimination of Internal
Transactions
Other OverseasSubsidiaries
Upper: Net Sales
Bottom: Operating Income
FYE Apr. 30,2016
FYE Apr. 30,2017
US Business
Tully's CoffeeJapan Co., Ltd.
Other DomesticSubsidiaries
ChichiyasuCompany
■Breakdown of Gross Profit Change (Non-Consolidated)
(\ billion)
FYE Apr. 30,2016
FYE Apr. 30,2017
Sales Changes 5.3 3.0
Changes inProduct Mix, etc.
0.2 0.5
Fluctuations in
Raw Material Costs, etc.0.4 1.2
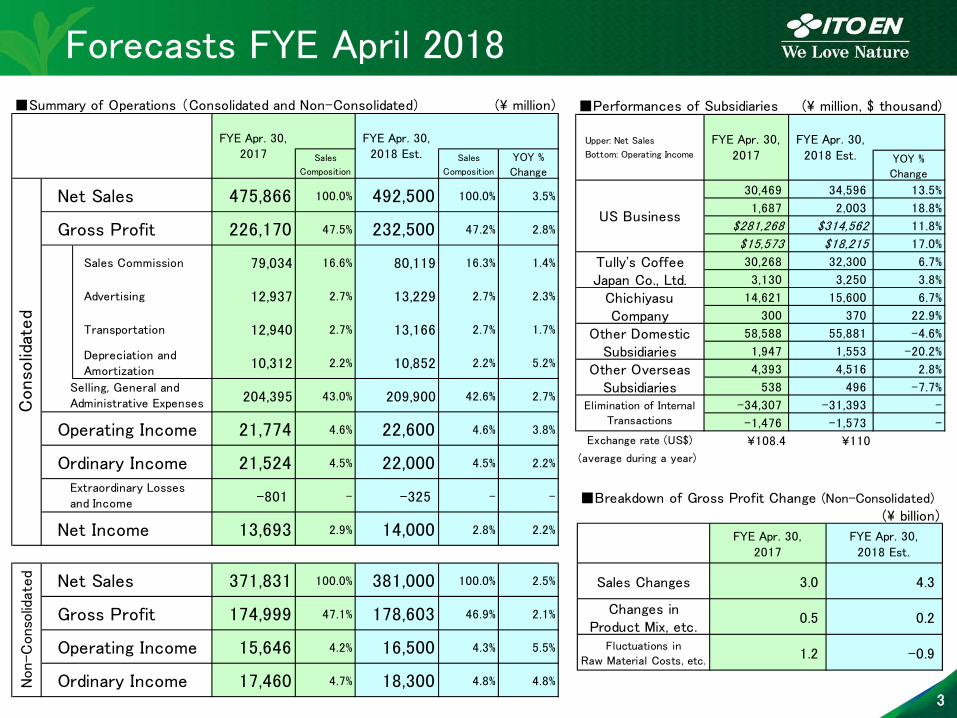
Forecasts FYE April 2018
3
■Summary of Operations (Consolidated and Non-Consolidated) (\ million)
Sales
Composition
Sales
Composition
YOY %
Change
475,866 100.0% 492,500 100.0% 3.5%
226,170 47.5% 232,500 47.2% 2.8%
Sales Commission 79,034 16.6% 80,119 16.3% 1.4%
Advertising 12,937 2.7% 13,229 2.7% 2.3%
Transportation 12,940 2.7% 13,166 2.7% 1.7%
Depreciation and Amortization
10,312 2.2% 10,852 2.2% 5.2%
204,395 43.0% 209,900 42.6% 2.7%
21,774 4.6% 22,600 4.6% 3.8%
21,524 4.5% 22,000 4.5% 2.2%
-801 - -325 - -
13,693 2.9% 14,000 2.8% 2.2%
371,831 100.0% 381,000 100.0% 2.5%
174,999 47.1% 178,603 46.9% 2.1%
15,646 4.2% 16,500 4.3% 5.5%
17,460 4.7% 18,300 4.8% 4.8% Ordinary IncomeNon-C
onso
lidate
d Net Sales
Gross Profit
Operating Income
FYE Apr. 30,2017
FYE Apr. 30,2018 Est.
Conso
lidat
ed
Net Sales
Gross Profit
Extraordinary Losses and Income
Net Income
Operating Income
Ordinary Income
Selling, General and Administrative Expenses
■Performances of Subsidiaries (\ million, $ thousand)
YOY %
Change
30,469 34,596 13.5%
1,687 2,003 18.8%
$281,268 $314,562 11.8%
$15,573 $18,215 17.0%
30,268 32,300 6.7%
3,130 3,250 3.8%
14,621 15,600 6.7%
300 370 22.9%
58,588 55,881 -4.6%
1,947 1,553 -20.2%
4,393 4,516 2.8%
538 496 -7.7%
-34,307 -31,393 -
-1,476 -1,573 -
Exchange rate (US$) ¥108.4 ¥110
(average during a year)
Elimination of Internal
Transactions
Other OverseasSubsidiaries
Upper: Net Sales
Bottom: Operating Income
FYE Apr. 30,2017
FYE Apr. 30,2018 Est.
US Business
Tully's CoffeeJapan Co., Ltd.
Other DomesticSubsidiaries
ChichiyasuCompany
■Breakdown of Gross Profit Change (Non-Consolidated)
(\ billion)
FYE Apr. 30,2017
FYE Apr. 30,2018 Est.
Sales Changes 3.0 4.3
Changes inProduct Mix, etc.
0.5 0.2
Fluctuations in
Raw Material Costs, etc.1.2 -0.9

4
Management Policy (1)
To be a "Global Tea Company" with Sustainable Growth
Enlargement of the Group's Synergy
Double-digit Growth, Mainly in the North American Business
1. Strengthening of the Domestic Business
2. Strengthening of the International Business
3. Strengthening ROE Management
Increasing Company's Share in the Beverage Market
4. Strengthening of CSR/CSV Management
・Strengthening of major brands' sales ・Strengthening relationship with customer (more frequent face-to-face communication) ・Acquiring new customers ・Strengthening of the "Digital Marketing" and the "Direct Communication"
Priority theme Activities
・Improvement of productivity
・Strengthening of control on sales promotion and sales commission
・Reducing total costs
Improvement of Profitability
・Strengthening of the Development of the "Oi Ocha" Brand ・Strengthening of Tea Leaf Products' Sales, mainly Global Brand Products
Improvement of Profitability and Capital Efficiency Increasing EPS Stable return to Stockholders
Sustainable Community Sustainable Production and Consumption Legacy Creation
・Social Activities by taking advantage for our core business
・Stable Raw Materials Procurement and Quality Control Systems
・Appealing of Tea Culture
・Enlargement of "ITO EN" Brand ・Enhancing Exchange Training Programs
・Continuing activities/projects to improve profitability
・Total Return Ratio 40%

5
Management Policy (2)
2017 Change Current assets 159,517 174,657 15,140
Cash and deposits 53,259 64,202 10,942
Accounts receivable-trade and
inventories88,609 92,577 3,967
Property, plant and equipment 81,018 83,039 2,020 Land 20,644 21,587 942
Leased assets 29,154 27,889 -1,265
Other 31,219 33,562 2,342
Intangible fixed assets 27,154 24,454 -2,700 Goodwill 20,179 18,371 -1,807
Investments and other assets 20,012 20,254 242 Total assets 287,702 302,405 14,703 Current liabilities 100,756 81,560 -19,196
Accounts payable 33,353 33,061 -291
Short-term loans payable 1,801 2,364 563
Current portion of bonds 20,000 - -20,000
Lease obligations 10,442 8,995 -1,447
Income taxes payable 3,945 4,490 544
Non-current liabilities 59,729 84,135 24,405 Corporate bonds - 10,000 10,000
Long-term loans payable 29,653 47,433 17,779
Lease obligations 16,630 13,468 -3,162
Total liabilities 160,486 165,696 5,209 Net assets 127,215 136,709 9,493
2016
(\ million)
Consolidated Balance Sheet (as of April 30, 2016 and 2017)
Consolidated Cash Flows
■Topics・Main Investment ・Acquisition of Own Shares (Stock Buyback)Jun. 2016: "Matcha Ko Bo " Issued: Feb. 2017 Class of shares: Class-A Preferred Stock
(manufacturing plant of real Matcha Powder Total amount of issue: \10,000 million Total number of shares: 341,500 shares
in ITO EN Shizuoka Sagara Plant) Unissued: \30,000 million Total value of shares: \700 million
Sep. 2016: Kobe Plant Use of funds: Redemption of bonds Period: Feb to Mar 2017
(Hyogo Prefecture) Rating: A+
・ITO EN, LTD. 2nd Series Unsecured Pari Passu Bonds
24,300
17,751
30,085
27,098 28,000
-4,598
-9,242 -8,150 -8,243
-14,603
19,702
8,508
21,935
18,854 13,397
-15,000
-5,000
5,000
15,000
25,000
35,000
'14/4 '15/4 '16/4 '17/4 '18/4
Est.
(¥ Million) CF from Operating Activities
CF from Investing Activities
Free CF
'14/4 '15/4 '16/4 '17/4'18/4Est.
Capital
Investments4,663 3,359 8,241 8,135 13,477
Depreciation
Amortization4,204 4,568 5,203 5,418 6,376
Leased
Assets Depr.10,936 11,085 10,872 7,051 7,065
Lease obligations
(Repayment) -12,456 -12,143 -11,236 -10,361 -8,793

ITO EN Brand Strategy

Results & Forecasts by Category (Non-Consolidated)
6
(\ million)
Sales
Composition
YOY %
Change
Sales
Composition
YOY %
Change
Sales
Composition
YOY %
Change
365,276 100.0% 3.3% 371,831 100.0% 1.8% 381,000 100.0% 2.5%
32,468 8.9% 4.7% 33,675 9.1% 3.7% 35,740 9.4% 6.1%
329,455 90.2% 3.1% 334,843 90.0% 1.6% 341,947 89.7% 2.1%
3,351 0.9% 2.9% 3,312 0.9% -1.2% 3,311 0.9% 0.0%
181,126 49.6% 4.6% 183,644 49.4% 1.4% 188,826 49.6% 2.8%
17,483 4.8% 6.4% 17,037 4.6% -2.6% 17,354 4.5% 1.9%
42,931 11.7% -2.5% 44,300 11.9% 3.2% 44,877 11.8% 1.3%
10,933 3.0% -18.2% 10,739 2.9% -1.8% 11,027 2.9% 2.7%
41,143 11.3% 21.2% 42,399 11.4% 3.1% 43,643 11.4% 2.9%
6,082 1.7% -42.3% 4,900 1.3% -19.4% 4,486 1.2% -8.5%
6,918 1.9% 28.8% 7,064 1.9% 2.1% 7,201 1.9% 1.9%
9,312 2.5% 14.6% 10,958 2.9% 17.7% 10,535 2.8% -3.9%
9,751 2.7% -3.3% 9,988 2.7% 2.4% 10,488 2.7% 5.0%
3,772 1.0% -13.9% 3,809 1.0% 1.0% 3,506 0.9% -8.0%
Others
FYE Apr. 30,2016
FYE Apr. 30,2017
FYE Apr. 30,2018 Est.
Tea Leaves
Drinks
Net Sales
Others
Bre
akdo
wn o
f D
rinks
Japanese Tea / Healthy Tea
Chinese Tea
Vegetable
Fruit
Coffee
Black Tea
Functional
Mineral Water
Carbonated

7
Brand Strategy
1. Strengthening of the Major Brands 2. Enhancing synergy - Tea Leaf Products and RTD Products
Major brands
over
10 million
cases *
Tea Leaves
Tea Bags
Instant
Demand Expansion through Tea Enlightenment Activities
Accelerated Introduction through Variety Development
Adaptation to the Changes in the Life Style
Oi Ocha
Healthy Mineral
Barley Tea
One Day Veggie
Increasing market share by providing many variety of flavors and sizes
Expanding business by appealing "Caffeine Free" and "Mineral Ingredients"
Enhancing consumption by appealing Nutritional Values
TULLY'S COFFEE Further Brand Strengthening by Products' Lineup Expansion
Leaf Major Beverage Brand
Mega Brands
over
30 million
cases *
* sales annually

8
Tea Leaf Products
■Market Overview (2016)
Estimated that the Market Size (monetary amount) is 2% lower than previous year
Easy-to-Use Green Tea Products Market continued to perform well
■Sales Strategy
Increase in the Products' Sales Counter Occupancy Ratio ・Expansion of the Tea Leaves and the Tea Beverages Interlocking Sales Counters
Creation and Evocation of the Products' Demand ・Abundant Products' Lineup and Products' Forms ・Provision of Original Pots for Cold Water-Brewed Tea and Original Japanese Style Kettles "Kyusu"
Strengthening of the Unique to ITO EN Sales Proposal Power, as Specialized Company in the Tea Field ・Enlightenment Activities by Employees, having the Tea Taster Qualification Certificates
■TOPICS
"Skilled Professional on ITO EN TEA TASTER "
"The Tea Taster System" that had been operated as an in-house qualification system was approved by "Skilled Professional on ITO EN TEA TASTER " by Ministry of Health, Labor and Welfare on March 24, 2017.
Green Tea Leaf Product Market
Sales Activities with Special Features
Interlocking Sales with
Beverage Products
The Tea Tasters* are
participating events at the
stores to demonstrate how to
serve tea
Source: ITO EN, Market: Calendar year ITO EN: May to Apr
Evoking Tea Leaves Products'
Demand by the Summer season
Iced-Water-Brewed Tea Proposal
* Employees having the Tea Taster Qualification Certificates
17.2 18.3 19.2 20.4 22.7 23.9 25.0 25.9
280.8 270.3
254.9 242.5
227.9 221.9 216.6 210.9
298.0 288.6
274.1 262.9
250.6 245.8 241.6 236.8
9% 11% 11% 11%
12% 13% 13%
14%
0
50
100
150
200
250
300
'09 '10 '11 '12 '13 '14 '15 '16
(¥ billion)
Leaf
Easy-to-Use ITO EN Share
of Packaged Tea Leaf

9
Oi Ocha (1)
■Market Overview (2016)
An Expansion Trend, Coming Along with the Market Revitalization
■Brand Strategy
No.1 Brand Awareness
Increasing market share by providing many variety of flavors and sizes
■TOPICS
The Cumulative Sales Volume has exceeded 30 Billion Bottles *1
New "Oi Ocha "
・Quality "From Farm to Bottle" (Vertical Integration) Fresh, Safe and Delicious
・Taste Mild and Clear Umami Taste
・Design A New Type of a Bamboo Pipe-Shaped PET Bottle, with added English Inscription on its Label
No.1 Tea Category Beverage Brand *2
A New Type of a PET Bottle, Possessing both
Excellent Design- and Functional Properties
(Protecting the Tea's Delicious Taste
from the light's influence)
*2 Source: ITO EN, Jan 2016 to Dec 2016 *1 Valid As of May 2017, 500ml PET Bottle Conversion Calculation Result
217.1
268.5 279.2 309.4
409.3
447.0 421.0 415.0
402.0 382.0 375.0 375.0 383.0
405.0 401.0 415.0
435.0 445.0
31%
28% 31% 33%
29% 29% 32%
34% 36% 37% 39% 38% 37% 35% 35% 35% 33% 34%
0
2
3
4
5
6
8
0
100
200
300
400
500
'00 '01 '02 '03 '04 '05 '06 '07 '08 '09 '10 '11 '12 '13 '14 '15 '16 '17
Est.
(¥ billion)
ITO EN
ITO EN Share
Source: ITO EN, Calendar year
Green Tea Beverage Market

10
Oi Ocha (2)
Brand Slogan
Bringing "Oi Ocha" to the World
2011
2017
1985
1989
1996
2006
Long-Term Goals
*1 Developed in 1984
*2 500ml PET Bottle Conversion Calculation Result
The Cumulative Sales Volume exceeded
(Broke through)
10 Billion Bottles *2
Launched the world's first
Canned Green Tea *1
Birth of "Oi Ocha"
Brand
Innovated and Released
PET 500ml Bottle
The Cumulative Sales Volume exceeded
(Broke through)
20 Billion Bottles *2
The Cumulative Sales Volume has Exceeded
(Broke through)
30 Billion Bottles *2
Annual Sales Volume 100 Million Cases
Start of the "Shin Haiku (New Kind of
Haiku Poems) Contest"
Strengthening
Global Business

11
Healthy Mineral Barley Tea & Other RTD Tea
■Market Overview (2016)
The Barley Tea "Mugi-cha" has growing continuously The Blended Tea has shown recovery tendency in it growth
■Brand Strategy
Expanding business by appealing "Caffeine Free" and "Mineral Ingredients"
Strengthening of the Store Counter Development Ability, as a "Whole-Year-Sold Product"
・Providing many variety of container size ・Seeking more synergy of RTD and Tea Bags
■TOPICS
Double-digit Increase in four (4) Consecutive Fiscal years
Exceeding (Breaking through) 30 Million Cases *
No.1 Share in the "Caffeine Free RTD Tea" category *
* Source: ITO EN, Jan 2016 to Dec 2016
Barley Tea and Blended Tea Markets
Source: ITO EN, Market: Calendar year ITO EN: May to Apr
Further Pursuing of Possibilities in the Tea Beverages Category
34.5 39.5 45.5 51.0 63.0 71.0
80.0 88.0
126.5 120.0 118.0 114.0
116.0 112.5
128.0 128.0
0
50
100
150
200
'10 '11 '12 '13 '14 '15 '16 '17
Est.
(¥ billion)
Blended Tea
Barley Tea

12
One day Veggie & Other Vegetable Beverage
■Market Overview (2016)
A Recovery Tendency is observed in the 100% Vegetable Juice Segment, with a Steady Performance
Especially the Tomato Juice Drinks Segment is leading the market
■Brand Strategy
Enhancing consumption by appealing Nutritional Values, doing Demonstration in stores and introducing recipes used our vegetable juice
■One day Veggie (a day' s worth of vegetables)
No.1Brand Share in the 100% Vegetable Juice Segment *
■Jujitsu Yasai (vegetable and fruit mix juice)
25th Sales Release Anniversary in Sep 2017
Original Package
in 1992
School Lunch Program (Red Cup Campaign of the United Nations WFP)
Aojiru
6 Types of Healthy Raw Materials
are used, including Japanese-Grown
Green Barley Grass and Mugworth
("Oomugi-Wakaba")
・Buying of "Jujitsu Yasai "
Big Size PET Bottle Product
・Posting of Pictures with Red
Cup Drinking Scenes on the
SNS Media
⇒Part of sales is donated to WFP
Riso-no Tomato
Containing 30 mg of
Lycopene
(Sugar and Salt
Additive-Free)
Vegetable Juice Market
59.2 61.7
80.8 80.1 73.0
71.6 80.6
81.5
87.6 88.4
86.6 84.3 74.2 68.3 71.6
72.0
146.8 150.1
167.4 164.4
147.2 139.9
152.2 153.5
26% 28% 30% 30% 29% 30% 29% 30%
0
50
100
150
200
'10 '11 '12 '13 '14 '15 '16 '17
Est.
(¥ billion)
Vegetable 100%
Fruit Mix ITO EN Share
Source: ITO EN, Market: Calendar year ITO EN: May to Apr
* Source: ITO EN, Jan 2016 to Dec 2016
(Tomato Juice) (Green Juice)

13
TULLY'S COFFEE (RTD)
■Market Overview (2016)
The Market Size is estimated to be 951.0 Billion Yen, growing by 1% compared to previous fiscal year
The Bottle-Can Containers Market's Strong Performance Tendency is estimated to be continued in future as well
■Brand Strategy
We are planning to strengthen Tully's brand by Products' Lineup Expansion
Pursuing the "Tully's Quality" by the Tully's Barista Coffee Professionals ・Supervision of the Coffee Raw Material's Commitment
Shop and RTD Interlocking Campaign
■TOPICS
10th Anniversary of the Sales Release of the Tully's Brand Beverages
Even if only the Black Coffee Product Segment is taken into account, it has broken through 10 Million Cases *
* Source: ITO EN, May 2016 to Apr 2017
Iced-Water-Brewing Extraction
No Natural/Artificial Flavor added
Expansion of the Products' Lineup and Sales Channels
Coffee Beverage Market (share by type of container and size)
11% 12% 13% 14% 16% 20%
24%
40% 41% 39% 38% 35% 31% 28%
0
4
8
12
16
0%
20%
40%
60%
80%
100%
'10 '11 '12 '13 '14 '15 '16
(million cases)
Sales Volume of TULLY'S COFFEE
PET bottles
201~599ml Can
Others
126~200ml Can
Source Market: INTAGE Inc. SRI, 2010 to 2016 ITO EN: May 2010 to Apr 2016 Market share by sales amount for all coffee beverage containers and quantities (total for supermarkets, convenience stores and drug stores)

Group Business Overview

(\ million)
YOY %Change
YOY %Change
YOY %Change
Net Sales 27,751 6.6% 30,268 9.1% 32,300 6.7%
OperatingIncome 2,879 -19.4% 3,130 8.7% 3,250 3.8%
(Shops)
Number ofShops 638 +50 671 +33 700 +29
FYE Apr. 30,2016
FYE Apr. 30,2017
FYE Apr. 30,2018 Est.
Shop in TAKASHIMAYA GATETOWER MALL
Rare Species of the "Peaberry
Coffee Beans" Used
Tully's Coffee Japan
Concept Shop oriented towards Female Customers
14
Commemorative
Reprinting Menu Edition
(Hot Bagel Sandwich)
Promoting 20th Anniversary Items
13.9 13.9 15.3
19.3 21.0
23.8 26.0
27.7
30.2 32.3
357 375 410
461 513
555 588
638 671 700
0
250
500
750
1,000
0
5
10
15
20
25
30
35
'09/3 '10/3 '11/3 '12/4 '13/4 '14/4 '15/4 '16/4 '17/4 '18/4
Est
(Shops) (¥ billion)
# of shops
Net Sales
Business Overview Net Sales exceeded 30 Billion Yen
・Actively opening new shops in good Locations
(As of April 2017, 671 shops)
・Strong Performance of the Limited-Sales-Area Products
・Promotion of the Community Café Shops
20th Anniversary since Establishment (Foundation)
・Sequential Sales Release of of a Commemorative Product since March 2017
Result/Forecast of Sales
and Number of Shops New Concept Shop Topics
"Casual & Cozy for Female Customers"
(Nagoya-city, Aichi)
"TULLY‘S BRAZIL FAZENDA BAU
PEABERRY YELLOW BOURBON "

Chichiyasu (Yogurt Company)
Inside the "LECT" Large Scale Commercial Facility
of Izumi Co., Ltd.
(Hiroshima Prefecture, Hiroshima City, West Ward)
(\ million)
YOY %Change
YOY %Change
YOY %Change
Net Sales 13,890 5.3% 14,621 5.3% 15,600 6.7%
OperatingIncome 253 188.4% 300 18.8% 370 22.9%
FYE Apr. 30,2016
FYE Apr. 30,2017
FYE Apr. 30,2018 Est.
15
Establishment : 1886 (Foundation)
Head Office: Hiroshima Prefecture
Chichiyasu
First-in-Class Yogurt
Product in Japan
(1917)
Business Overview
100th Anniversary of the Chichiyasu's Yogurt Products Sales Release ・ Pursuing "Safety, Relief, Delicious Taste, Healthiness", as a pioneer of Yogurt product in Japan (for the First Time in the History).
Opened First Flagship Shop ・ Showroom of Chichiyasu's First Opening as an Anniversary Memorial Business Service ・ Appealing of Chichiyasu Brands to all the local residents and community
100th Anniversary of the Chichiyasu's Yogurt Products Sales Release New products
Renewal of the "Classic Yogurt"- and the "Lowered Sugar Contents
Yogurt" Products
Additive-Free Honey Yogurt
Topics
Additive-Free Honey Yogurt,
that Every Mother will be
Happy to Give it to Her
Children, to be Eaten by Them
Opening of the Showroom "CHICHI YASU"
* Japanese Professional Baseball Team, with Home Stadium based in Hiroshima City
A Collaborative Drink
(Beverage) Product with the
"Hiroshima Toyo Carp" * Team

Overseas Business (1)
16
*Excluding ITO EN. Before elimination of internal transactions (\ million, $ thousand)
YOY %
Change
YOY %
Change
YOY %
Change
31,741 169.0% 30,469 -4.0% 34,596 13.5%
$264,929 150.0% $281,268 6.2% $314,562 11.8%
4,438 31.3% 4,393 -1.0% 4,516 2.8%
Net Sales 36,180 138.3% 34,863 -3.6% 39,112 12.2%
1,581 802.4% 1,687 6.7% 2,003 18.8%
$13,206 603.6% $15,573 17.9% $18,215 17.0%
275 107.5% 538 95.6% 496 -7.7%
Operating Income 1,856 502.9% 2,225 19.9% 2,500 12.4%
¥119.3 ¥108.4 ¥110
(average during a year)
Exchange rate (US$)
FYE Apr. 30,2016
FYE Apr. 30,2017
FYE Apr. 30,2018 Est.
US Business
US Business
Asia/Australia Business
Asia/Australia Business
■US Business
■Asia/Australia Business
: Both Tea Leaf and Tea Beverage Business showed a strong performance, with Double-digit increase in both Revenue and Profit, that is estimated to continue in future as Well (Based on Local Currency Figures)
: Distant Lands Trading Company (DLTC) is also showing a stable performance
: Business in China is showing a strong performance, especially ITO EN BEVERAGE (SHANGHAI), LTD.
: Businesses in Australia and in Southeast Asia are also developed in a favorable Manner
: In April 2017, ITO EN Singapore Pte. Ltd. and ITO EN (Thailand) Co., Ltd. had become profitable for the first time in their history after their establishment

3% 4%
8% 7%
8%
0%
5%
10%
15%
0
10
20
30
40
'14/4 '15/4 '16/4 '17/4 '18/4
Est.
(¥ billion) US Business
Asia/Australia Business
Overseas Business sales ratio
Overseas Business (2)
17 USA China AUS Thailand
Estimation of the ITO EN's International Business Development Pathway
China
Oceania
Asia
Hawaii (1987~)
Fujian Province (1987~)
Australia (1994~)
Southeast Asia (2012~)
Singapore, Thailand & Others
USA New York (2001~)
Zhejiang Province (1994~)
Shanghai (2012~)
Consolidated DLTC
USA・AUS・Asia China
Barley Tea "Mugi-
Cha" is Very Popular
Local Brand
USA China
Exchange
rate (US$)¥100.6 ¥111.2 ¥119.3 ¥108.4 ¥110
■ International Brand Strategy Strengthening of "Oi Ocha" Brand Development and Expansion ・ Unification of the Label Design ・ Inscriptions in the Corresponding Local Languages on the Product's Label
Strengthening of Sales of Tea Leaf Products
Product Development that is Corresponding to the Specific Area's Characteristics
Development of
"matcha Love"

Long-Term Vision & Medium and Long-Term Management Plan
18
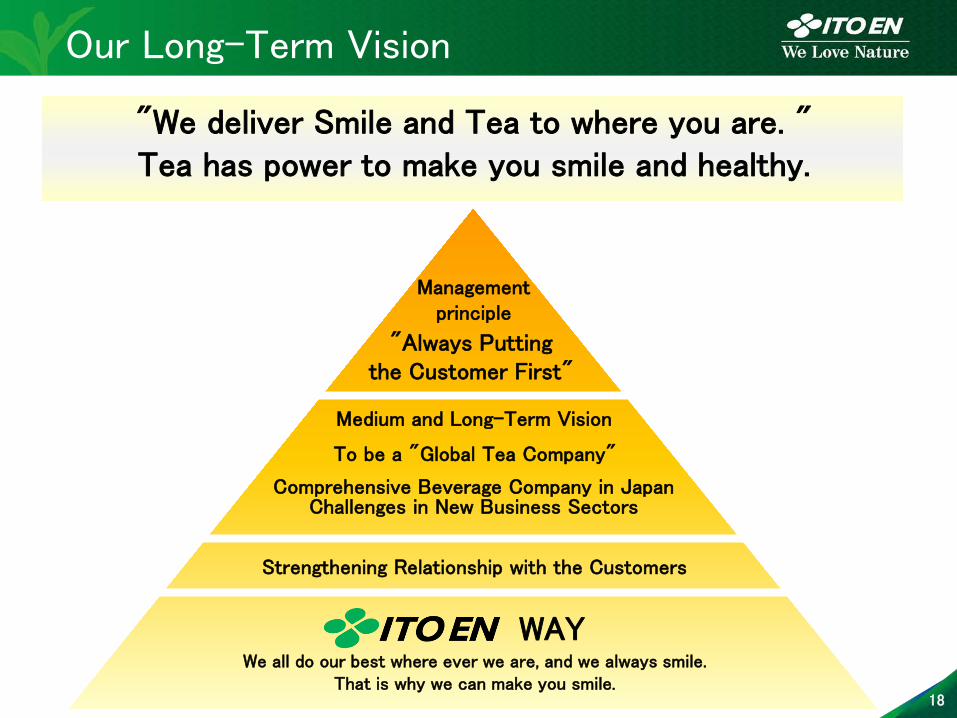
Our Long-Term Vision
Management principle
"Always Putting the Customer First"
WAY We all do our best where ever we are, and we always smile.
That is why we can make you smile.
Strengthening Relationship with the Customers
Medium and Long-Term Vision
Comprehensive Beverage Company in Japan Challenges in New Business Sectors
To be a "Global Tea Company"
"We deliver Smile and Tea to where you are. "
Tea has power to make you smile and healthy.

19
Medium and Long-Term Management Plan
2018 – 2022
Medium and Long-Term Management Plan
2015 – 2017
Medium-Term Management Plan
1. Improving profitability of business in Japan 2. Sales release of Global Brand Products
FYE April 2017
Net Sales
Total Return Ratio
ROE
43.5%
¥475.8 billion
10.5%
FYE April 2022 Plan
Over 40%
Over 10%
¥600.0 billion
Long-Term Vision "Global Tea Company"
To be a "Global Tea Company"
1. Global expansion of " " and "Oi Ocha" Brands
2. #.1 market shares both in Domestic and Global Green Tea Markets
3. Training of "Tea Tasters" who can introduce Tea Culture in all over the world
Comprehensive Domestic Beverage Manufacturer, Challenges in New Business Sectors
1. Brand strengthening, development of new brands
2. Expansion of total number of customers, Improving profitability of business in Japan
3. Challenges in new business sectors
(Consolidated)
30th Anniversary of the "Oi Ocha" (February 2019)
The Tokyo Olympic and Paralympic Games (to be held in Tokyo in 2020)
FYE April 2020

Appendix

ESG and SDGs Activities
20
"Sustainable Development Goals (SDGs)" are Introduced to ITO EN's CSR/CSV Concepts ESG Classification
Major CSR Targets (KPI)
E
S
* These logos belong to the United Nations Information Centre
G

ESG in the Value Chains
21
Shared Values Produced by an Authentic Value Chains
Sales and Distribution Product planning and development
Production and Logistics Procurement
Control of the Value Chains ・Development of the Tea Leaves Raw Materials Producing Regions
・Training of the Tea Farmers
・Whole Volume Deals (Transactions)
The Tea-Producing Regions
Development Project ・Promotion of the Environment- Conservative Type of Agriculture
High Capability of Procuring Crude Tea
The Tea-Producing Regions Development Project ・An Effective Utilization of Abandoned Farmlands
G
S
E
Business Subcontractors Control
Block production and logistics systems
Resource Saving /Energy Saving Production ・NS System *
Used Tea Leaves Recycling System
Quality control system ・Increasing of the Brand Values ・Meet the consumer requests for security and safety
Patent Strategy /Trademark Strategy
ECO (Ecological) Containers ・Beverage Paper Packages, Not Containing Aluminum Sheets
Product Development Ability ・Provision of Healthy Values
Control and monitor sales activities
Compliance with the Regional Laws and Regulations
Prevention of the Global Warming ・Introduction of an Ecologically -Friendly Driving and Environmentally -Friendly Vehicles
Resource Saving and Emissions Reduction ・Collection of Empty Containers ・Recycling of All Waste Quantities by Recycling Agent
Route sales ・The community-based sales system
Tea Tasters System *
・Spreading and Inheriting the Tea Culture
Integrated system from tea plantation to tea grounds
* NS (Non-Sterilant) System * "The Tea Taster System" that had been operated as an in-house qualification system was approved by "Skilled Professional on ITOEN TEA TASTER " by MHLW on March 24, 2017.
ITO EN was ranked #18 "50 Companies That Are Changing The World"
Activities such as "Tea Harvesting Fields Development Project" and "Used Tea Leaves Recycling System" were Highly Evaluated. Those Activities were Featured in the Article of the Business Magazine "FORTUNE", which ranked ITO EN on the 18th Place, the Highest Position among All Japanese Companies. (Issue dated 1st September 2016)
©2016 Time Inc. All rights reserved. FORTUNE September 1, 2016 issue

Project of the Developing Green Tea-Producing Regions
22
Since 1970s Cultivation under contract with individual tea farms
Since 2001 The large-scale new tea farms business that uses abandoned farmlands, etc.
・Stable Procurement of a High Quality Green Tea Leaf made in Japan
・Training of the Tea Farmers
・Proactive Use of Abandoned Farmlands
Business Purpose Project of the Developing
Green Tea-Producing Regions
Green Tea Leaf for Matcha Used Tea Leaves Recycling System
A Recycling System that transforms "Used Tea Leaves" from manufacturing process of tea beverages into "Useful Resources"
Used Tea Leaves
(Annual Emission Amount: 49,000 Tons)
* Partially Including Budged Plan Values
Contracted Farms of Green Tea Leaf for Matcha (Tencha) in Kyoto and Kagoshima
3,285
3,630
4,371 4,892
957 1,034
1,226 1,401
2,000
0
500
1,000
1,500
2,000
2,500
0
1,000
2,000
3,000
4,000
5,000
6,000
'14 '15 '16 17
Est.
(ha) (Tons) Production volume (ton)
Dimention of green tea farms (ha)
Long-term target
2,000ha
* Including contract cultivation farms
Total Volume of Domestic Green Tea Leaf Production
89,300
100,000
85,000 84,800 83,500 79,500 80,200
18% 21%
27% 24% 24% 25% 25%
0%
10%
20%
30%
40%
50%
60%
0
20,000
40,000
60,000
80,000
100,000
'00 '05 '10 '13 '14 '15 '16
(Tons) Total Domestic Tea Leaf Production
ITO EN Consumption
ITO EN Consumption (%)

Data Collection (Data Base)

23
Management Indexes (Consolidated)
351.6 369.2
403.9
437.7 430.5
465.5 475.8 492.5
50.6
52.1 52.4 51.6 51.8
53.0 52.5 52.8
35
45
55
65
0
100
200
300
400
500
'11/4 '12/4 '13/4 '14/4 '15/4 '16/4 '17/4 '18/4
Est.
(%) (¥ billion) Net Sales
% Cost of Sales
17.6
18.9 20.2 21.1
11.3
17.2
21.7 22.6
5.0 5.1 5.0 4.8 2.6
3.7
4.6 4.6
2
4
6
8
10
12
0
5
10
15
20
25
'11/4 '12/4 '13/4 '14/4 '15/4 '16/4 '17/4 '18/4
Est.
(%) (¥ billion) Operating Income
% Operating Income
7.6
9.2
11.2 12.0
7.2
8.6
13.6 14.0
7.6 8.9
10.3 10.4
5.9 6.8
10.5 10.0
0
5
10
15
20
25
0
5
10
15
'11/4 '12/4 '13/4 '14/4 '15/4 '16/4 '17/4 '18/4
Est.
(%) (¥ billion) Net Income
ROE
19.7 21.4
24.0 24.3
17.7
30.0 27.0 28.0
-2.1
-8.0 -9.2
-4.5
-9.2 -8.1 -8.2
-14.6
17.5
13.3 14.7
19.7
8.5
21.9
18.8 13.3
-20
-10
0
10
20
30
'11/4 '12/4 '13/4 '14/4 '15/4 '16/4 '17/4 '18/4
Est.
(¥ billion) CF from Operating Activities
CF from Investing Activities
Free CF
2.0
5.6 6.6 4.8
3.7
8.6
8.1
13.4
3.4 3.6 3.9 4.2 4.5
5.2 5.4
6.3
5.5
7.2
9.8
10.9 11.0 10.8
7.0 7.0
0
2
4
6
8
10
12
14
'11/4 '12/4 '13/4 '14/4 '15/4 '16/4 '17/4 '18/4
Est.
(¥ billion) Capital Investments
Depr. & Amort.
Leased Assets Depr.
48 48 48 49
50 50 50 50
38 38 38 39
40 40 40 40
65.6
54.4 44.5
42.4
72.0
61.0
38.3 37.4
0
20
40
60
80
100
0
20
40
60
80
'11/4 '12/4 '13/4 '14/4 '15/4 '16/4 '17/4 '18/4
Est.
(%) (¥) Dividend(Preferred Stock)
Dividend(Common Stock)
Payout Ratio
Net Sales & % Cost of Sales Operating Income Net Income & ROE
Cash Flows Capital investments & Depr. & Amort. Dividend & Payout Ratio

The purpose of the materials you have received is to provide the means for a more thorough understanding of ITO EN and should not necessarily be regarded as
a recommendation to invest. Furthermore, the data in these materials is based on what we believe is the most accurate information. However, please understand
that even without advance notice, both past data and future forecasts may be revised.


![Varieties of Japanese Food Varieties of Japanese Food€¦ · [Tea] Sencha -Japanese Green Tea. Certified by FSSC 22000 and Organic JAS YAMAMA MASUDAEN CO, LTD [Fat and oil] Rice](https://img.pdfslide.net/doc/110x75/5f640bdd026fd603de58139e/varieties-of-japanese-food-varieties-of-japanese-food-tea-sencha-japanese-green.jpg)


![Japanese Tea Ceremony ( 茶の湯 ) [ Chanoyu ]](https://img.pdfslide.net/doc/110x75/56816585550346895dd83434/japanese-tea-ceremony-chanoyu-.jpg)