Embed Size (px)
Citation preview

00
Weatherford International Ltd.Merrill LynchNovember 1, 2006

1
Nine months ended September 2006 Annualized ($ in millions)
Vital Statistics
$ 1,765EBITDA
$ 953Capital Expenditures
$ 835Net Income
$ 1,293Operating Income
$ 6,362Revenue
Evaluation, Drilling & Intervention Services
Completion & Production Systems
85Manufacturing Facilities
716Service Bases
68%% of Employees outside US
Two Divisions:
Ten Service Lines
108Number of Countries
32,057Employees
Financial Operational

2
Geographic Overview
United States
38%
Latin America
11%
Eastern Hemisphere
32%
Canada
19%
Revenues
Nine months ended September 30, 2006

3
Drilling Services• Directional Drilling• MWD• LWD• Rotary Steerable• Underbalanced • Managed Pressure• Coiled Tubing Drilling• Drilling with Casing
Wireline• Open Hole Wireline• Geoscience• Cased Hole Wireline• Slickline
Well Construction• Tubular Running• Cementation• Liner Hangers• Inflatables• Expandable Solids
Evaluation, Drilling & Intervention Services
Re-entry and Fishing• Casing Exit• Fishing • Thru-Tubing
Drilling Tools• Drilling Products • Rentals
Integrated Drilling
4
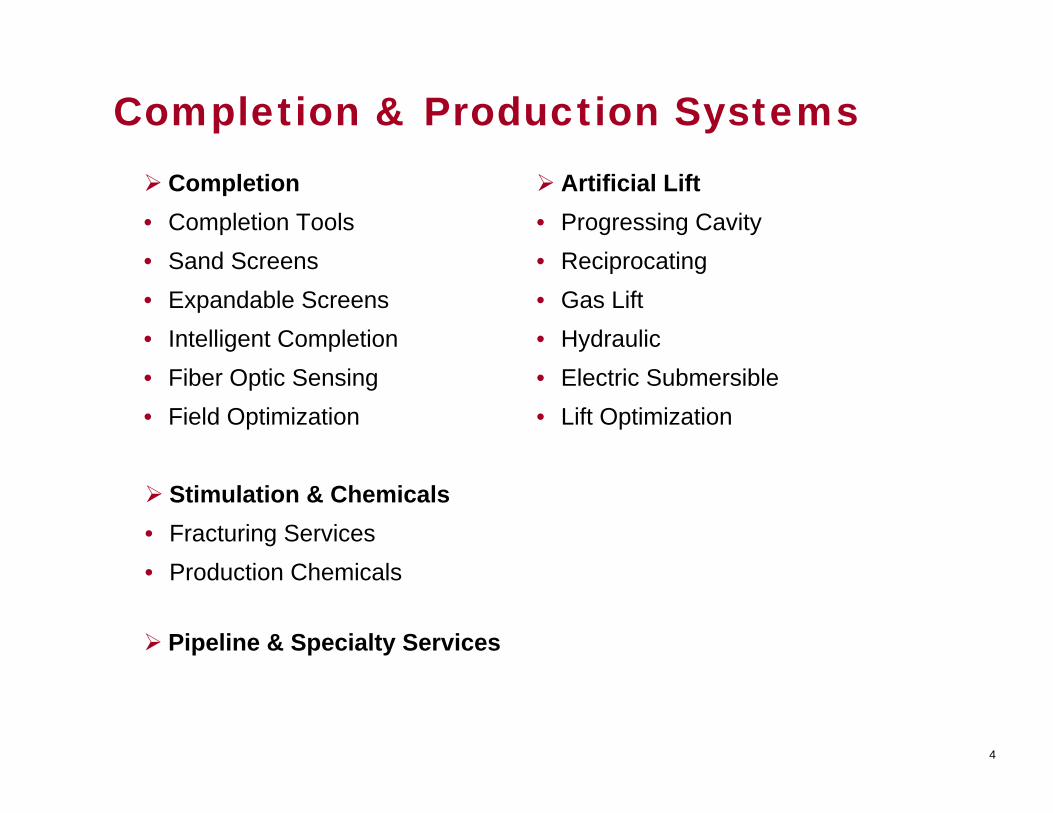
Completion• Completion Tools• Sand Screens• Expandable Screens• Intelligent Completion• Fiber Optic Sensing• Field Optimization
Artificial Lift• Progressing Cavity• Reciprocating• Gas Lift• Hydraulic• Electric Submersible• Lift Optimization
Stimulation & Chemicals• Fracturing Services• Production Chemicals
Completion & Production Systems
Pipeline & Specialty Services

5
Service Lines
Nine months ended September 2006 Annualized
($ in millions)
6505. Completion
7254. Drilling Tools
9752. Well Construction
9010. Pipeline & Specialty Services
3459. Integrated Drilling
3608. Stimulation & Chemicals
4807. Re-entry & Fishing
6406. Wireline
9303. Directional & Underbalanced
$ 1,1701. Artificial Lift
3
6
Highest GrowthRate

6
Segments: Technology, Market Position ED
I
#2Med• Liner Hangers
#1Low• Cementation
#4High• Directional
#4LowIntegrated Drilling
#1Low• Non-Proprietary
#1Med• Proprietary
Drilling Tools
#1MedRe-entry & Fishing
#4Med• Cased Hole
#4High• Open Hole
Wireline
#2High• Expandables
#1Med• TRS
Well Construction
#1High• Underbalanced
Drilling Services
Market LeadershipTechnology Intensity

7
Segments: Technology, Market Position C
PS
#1Low• Gas
#1Low• Hydraulic
#1Low• Recriprocating
#4High• Sand Control
#3Med• Completion Tools
Completion
N/AMedPipeline & Specialty Services
#5LowStimulation & Chemicals
#1High• Optimization
#6Med• ESP
#1Med• Progressing
Artificial Lift
#1High• Sensing
Market LeadershipTechnology Intensity

8
Historical Operating Results($ in millions, except EPS)
+78% Year-on-Year
Q3 Q4 Q1 Q2 Q3
Evaluation, Drilling & Intervention 627.7$ 920.1$ 1,006.3$ 965.5$ 1,100.1$
Completion & Production 449.1 541.3 529.7 573.1 596.7
Total Revenues 1,076.8$ 1,461.4$ 1,536.0$ 1,538.6$ 1,696.8$
Evaluation, Drilling & Intervention 143.3$ 209.6$ 271.2$ 241.0$ 293.0$
Completion & Production 67.8 89.6 92.2 115.9 131.1
Research & Development (27.1) (35.3) (36.4) (37.4) (38.3)
Equity in Earnings 3.0 3.3 2.6 3.3 (0.2)
Corporate (19.2) (21.0) (22.2) (21.5) (24.7)
Total Operating Income 167.8$ 246.2$ 307.4$ 301.3$ 360.9$
Net Income from Continuing Operations 117.6$ 163.9$ 203.3$ 188.6$ 234.2$
EPS from Continuing Operations .37 .46 .57 .53 .66
2005 2006

9
Balance Sheets
Net Debt / Net Debt / CapitalizationCapitalization
~ 25.9%~ 25.9%
Repurchased Repurchased 12 million 12 million
SharesSharesYearYear--toto--datedate
($ in millions)
December 2005
September 2006
ASSETSCash 134.2$ 120.3$ Accounts Receivable 1,260.0 1,522.2 Inventories 890.1 1,169.0 Other Current Assets 354.6 449.4
Total Current Assets 2,638.9$ 3,260.9$ Fixed Assets 2,367.2 2,818.4 Goodwill 2,808.2 3,007.6 Other Assets 766.0 759.3
8,580.3$ 9,846.2$
LIABILITIES & SHAREHOLDERS' EQUITYCurrent Portion of Debt 954.8$ 633.0$ Current Liabilities 1,043.3 1,372.9 Long-Term Debt 632.1 1,571.4 Long-Term Liabilities 283.3 307.3 Shareholders' Equity 5,666.8 5,961.6
8,580.3$ 9,846.2$

10
Forward Regional Spotlight:North America
11
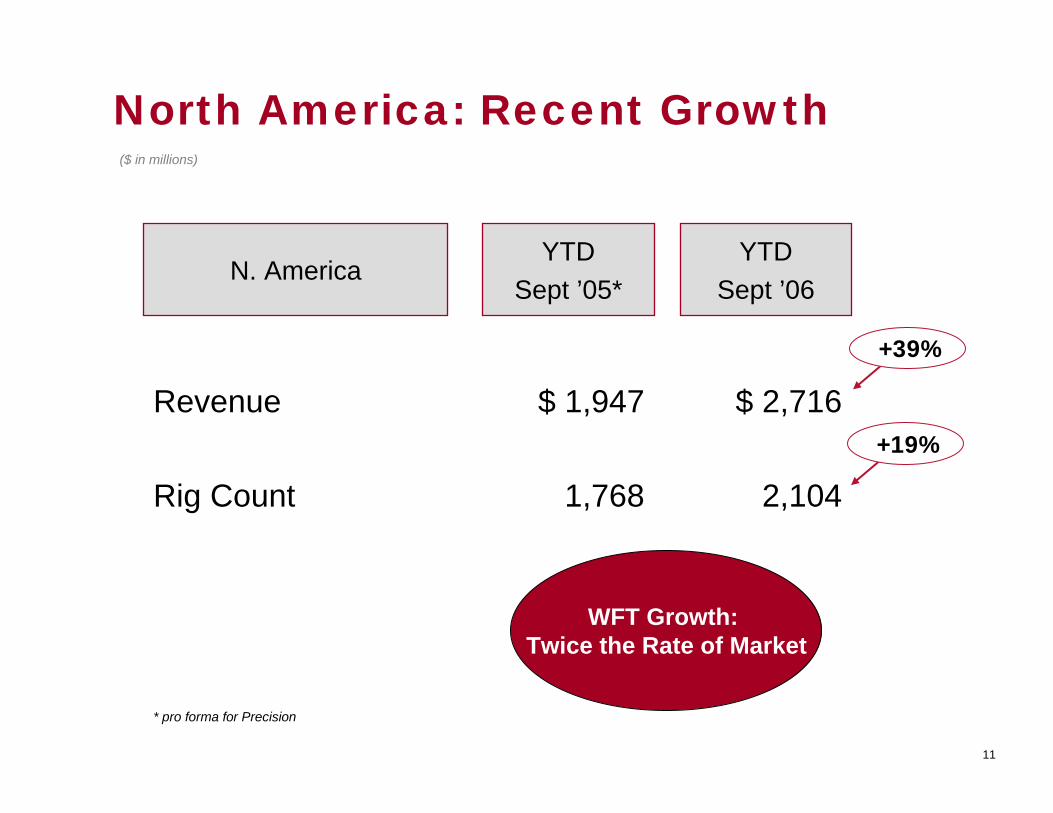
North America: Recent Growth
2,1041,768Rig Count
$ 2,716$ 1,947Revenue
YTDSept ’06
YTDSept ’05*
N. America
* pro forma for Precision
+39%
+19%
WFT Growth: Twice the Rate of Market
($ in millions)

12
Market Penetration• Directional• Electric Submersible Pumps• Intelligent Completion• Lift Optimization• Open Hole Wireline• Sand Control• Solid Expandables• Stimulation• Tubular Running Services• Underbalanced
2007 Growth Prognosis: U.S. Higher than Rig Activity

13
Forward Regional Spotlight:Eastern Hemisphere

14
United States
38%
Latin America
11%
Eastern Hemisphere
32%
Canada
19%
E & P Spending *WFT
* Lehman – 2006 Survey
Eastern Hemisphere: Most Growth Opportunities
Eastern Hemisphere
10%
United States
Canada
25%
53%
Latin America
12%

15
Eastern Hemisphere0 50,000 100,000 150,000 200,000 250,000 300,000 350,000
Saudi Aramco
Gazprom
NIOC
Qatar Petroleum
INOC
KPC
PDVSA
ADNOC
NOC
Sonotrach
NNPC
Rosneft
ExxonMobil
Pemex
Shell
Lukoil
Petronas
PetroChina
BP
Pertamina
Reserves (Mboe)
Black is W. HemisphereWhite is Mixed
Orange is E. Hemisphere

16
E. Hemisphere Competitive Requirements
• Breadth
• Depth
• Infrastructure

17
Latin America103 Service Locations10 Manufacturing Facilities17% of employees
North America422 Service Locations47 Manufacturing Facilities44% of employees
Asia60 Service Locations10 Manufacturing Facilities7% of employees
Europe / W Africa77 Service Locations14 Manufacturing Facilities9% of employees
Middle East54 Service Locations4 Manufacturing Facilities23% of employees
Infrastructure

18

19
Eastern Hemisphere – Growth Track Record
$ 269213180Rig Count
$ 572$ 302$ 214Middle East*
Q3 YTD ’06Annualized
20032001WeatherfordRevenues
* Excluding impact of acquisitions
+167%
+49%
($ in millions)

20
Segments with Early E. Hemisphere Market PenetrationED
I
#2Med• Liner Hangers
#1Low• Cementation
#4High• Directional
#4LowIntegrated Drilling
#1Low• Non-Proprietary
#1Med• Proprietary
Drilling Tools
#1MedRe-entry & Fishing
#4Med• Cased Hole
#4High• Open Hole
Wireline
#2High• Expandables
#1Med• TRS
Well Construction
#1High• Underbalanced
Drilling Services
Market LeadershipTechnology Intensity

21
CPS
#1Low• Gas
#1Low• Hydraulic
#1Low• Recriprocating
#4High• Sand Control
#3Med• Completion Tools
Completion
N/AMedPipeline & Specialty Services
#5LowStimulation & Chemicals
#1High• Optimization
#6Med• ESP
#1Med• Progressing
Artificial Lift
#1High• Sensing
Market LeadershipTechnology Intensity
Segments with Early E. Hemisphere Market Penetration

22
E. Hemisphere: Return to 40%
Targeted
Rest of World68%
Eastern Hemisphere32%
2006
Current
Eastern Hemisphere
40%
Rest of World60%
2008

23
Geographic Revenue Prognosis: 2007 vs 2006
Eastern Hemisphere + 40 - 50%
Canada Higher than Rig Activity
United States Higher than Rig Activity
Latin America + 20 - 25%

24
Technology: Underlying Growth Factor

25
Accelerating decline rates & aging of exploitation base
WaterSand
DrainageCorrosionPressure
TemperatureDepleted Zones
Differential StickingFormation Damage
Complex Architecture
• Technology existential for our clients
• Technology secures:- Higher rates of growth- Higher returns

26
Oilfield Services Own Technology
Number of Issued Upstream Patents
FourMajor Oil
Companies**
SixService
Companies*
0 100 200 300 400 500 600 700
2003
1996199719981999200020012002
20042005
2003
1996199719981999200020012002
20042005
* BHI, BJS, HAL, SII, SLB, WFT** BP, Chevron, Exxon, Shell
Service Companies Lead Upstream
Innovation

27
WFT Research and Development
• Technology Culture
• Large Inventory of Intellectual Property
2.5%
$ 107.4
’05
2.3%
$149.4
’06*
2.7%% of revenue
$ 83.6R&D
’04
*Nine months ended September 2006 Annualized

Pursuit of Intellectual Property Advantage
0 100 200 300 400 500 600
1996
1997
1998
1999
2000
2001
2002
2003
2004
2005
HALSLBBHIWFTSIIBJS
U.S. Patents IssuedWFT
WFT

29
Accelerated Growth Through TechnologyGrowth Accelerators:• Compact™ logging • Extreme LWD• Underbalanced / CPD• EM / MWD• Drilling with Casing• Rotary steerable• Solid expandables• Zonal Isolation• Top drive TRS• Sand screens• Fiber optic sensing• Lift optimization

30
Examples of Milestones for WFT’s Core Technology• Installed first installation of wireless, non-reciprocating system for cyclical steam injection well
• First application of Managed Pressure Drilling in GoM
• Underbalanced wells in 32 countries
• Installed 50th Expandable Solids System
• Installed over 175 Optical Sensing Systems
• Installed 400th Expandable Sand Screen System
• Completed 575 Drilling with Casing operations to date
• Installed 1000th Subsurface Safety Valve without a reported failure
• Installed 1200th Electric Submersible Pump
• Passed 4,000 Underbalanced jobs in one year during 2005
• Completed Drilling with Casing with highest pressure differential: 6,550 PSI
• Monitoring 75,000 wells real time with optimization technology
• Surpassed 1,000,000 feet of optical cable installed in wellbores
• Exceeded 5 billion barrels of heavy oil lifted

31
Three Examples of Early Commercialization Technology at WFT

32
• Unique conveyance options• Flexibility for challenging wellbores
- Horizontal, extended reach- Highly deviated wells- Mobilization to remote areas
Compact® Logging System

33
Age of Drainage
• Optimized well construction• Directional drilling• Controlled pressure drilling• Flexible formation evaluation• Multilaterals• Expandables• Subsurface monitoring• Subsurface control systems

34
34%
72%
4%0%
10%
20%
30%
40%
50%
60%
70%
80%
19941995
19961997
19981999
20002001
20022003
20042005
Directional Land Directional Offshore Underbalanced
% o
f Tot
al R
igs
Underlying Secular Trend : Growth of Directional: Birth of Underbalanced
Percent of Drilling Rigs: Land, Offshore & Underbalanced

35
• Highest Rate of Angle Build: 16° per 100 ft.• Full Size Range• Very High Secular Growth
Point-the-bitPush-the-bit
Revolution® Rotary Steerable Systems
Hole Quality
Current Market > $1 billionCurrent Market > $1 billion
WFT: < 2% Market ShareWFT: < 2% Market Share
All Western HemisphereAll Western Hemisphere

36
HEL® LWD systems
• Record setting temperature and pressure- 315°F 32,000 PSI- Deepwater Record
• Deep-reading resistivity• Speed of Logging• Wireline quality measurements• Drilled and logged world’s deepest offshore wells
Current Market > $1.5 billionCurrent Market > $1.5 billion
WFT: < 5% Market ShareWFT: < 5% Market Share
All Western HemisphereAll Western Hemisphere

37
• Drilling 6 miles from the drillship
• 32,000 psi 6.5 elephants on an ipod
• > 315° F temperature of molten sugar
HEL® LWD: 3 World Records
38
Further Growth: North AmericaAccelerating Growth: Eastern Hemisphere
Early Commercialization: Technology

39
This presentation contains forward-looking statements within the meaning of the Private Securities Litigation Reform Act of 1995
concerning, among other things, the prospects for Weatherford’s operations which are subject to certain risks, uncertainties and
assumptions. These risks and uncertainties, which are more fully described in Weatherford International Ltd.’s reports and registration
statements filed with the SEC, include the impact of oil and natural gas prices and worldwide economic conditions on drilling activity, the
demand for and pricing of Weatherford's products and services and domestic and international economic and regulatory conditions. Should
one or more of these risks or uncertainties materialize, or should the assumptions prove incorrect, actual results may vary in material aspects
from those currently anticipated.