Embed Size (px)
Citation preview

© 20071
Investor Presentation – Fourth Quarter 2008Knoll, Inc.
Andrew Cogan, CEOBarry McCabe, EVP, CFO
© 20072
DisclaimerThe following information includes forward-looking statements within the meaning of Section 27A of the Securities Act of 1933, as amended, and Section 21E of the Securities Exchange Act of 1934, as amended. All statements regarding Knoll, Inc.’s expected future financial position, results of operations, cash flows, business strategy, budgets, projected costs, capital expenditures, products, competitive positions, growth opportunities, plans, goals and objectives of management for future operations, as well as statements that include words such as "anticipate," "if," "believe," "plan," "estimate," "expect," "intend," "may," "could," "should," "will," and other similar expressions are forward-looking statements. Such forward-looking statements are inherently uncertain, and readers must recognize that actual results may differ materially from the expectations of Knoll management. Knoll does not undertake a duty to update such forward-looking statements. Factors that may cause actual results to differ materially from those in the forward-looking statements include, without limitation, corporate spending and service-sector employment, price competition, acceptance of Knoll’s new products, the pricing and availability of raw material and components, foreign exchange pressures, transportation costs, demand for high quality, well designed office furniture solutions, changes in the competitive marketplace, changes in the trends in the market for office furniture, the financial strength and stability of our suppliers, customers and dealers, access to capital, and other risks identified in Knoll’s Annual Report on Form 10-K and other filings with the Securities and Exchange Commission. Many of these factors are outside of Knoll’s control.
© 200733
Our Strategy Of Focusing On High Design Content
Businesses Is Driving Our Results As We Celebrate 70 Years Of Design Leadership

© 20074
Performance Remains Strong
KNOLL, INC.3RD QUARTER & YTD
SEPTEMBER, YEAR TO DATE2008 2007 2008 2007
SALES 283,517 253,962 843,861 773,998% YEAR OVER YEAR GROWTH 11.6% 4.2% 9.0% 9.1%
GROSS MARGIN 104,198 88,249 295,608 266,16636.8% 34.7% 35.0% 34.4%
ADJ OPERATING PROFIT (1) 41,090 34,282 111,521 102,69714.5% 13.5% 13.2% 13.3%
ADJ EARNINGS PER SHARE (1) $0.52 $0.37 $1.37 $1.03% YEAR OVER YEAR GROWTH 40.5% 12.1% 33.0% 27.2%
3RD QUARTER
(1) Adjusted operating profit and adjusted EPS exclude certain non-recurring costs. For a reconciliation of these non-GAAP measures to the comparable GAAP measure, see page 22.

© 20075
For 70 Years, Knoll Has Used Modern Design to Connect People With Their Work, Their Lives and Their World• A product portfolio by prominent, internationally acknowledged architects and designers• Recognized as a design leader with a premier brand identity• Products noted for their high quality and sophisticated aesthetics
Ludwig Mies van der Rohe
Hans andFlorence
Eero Saarinen
Formway Design
FrankGehry
Shelton Mindel
© 20076
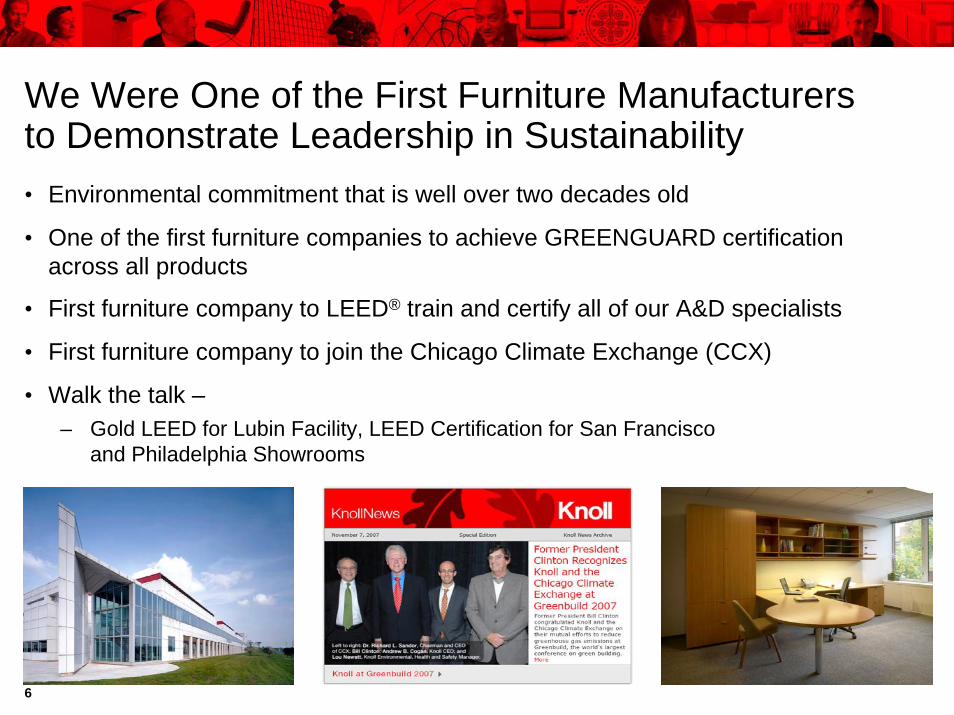
We Were One of the First Furniture Manufacturers to Demonstrate Leadership in Sustainability• Environmental commitment that is well over two decades old
• One of the first furniture companies to achieve GREENGUARD certification across all products
• First furniture company to LEED® train and certify all of our A&D specialists
• First furniture company to join the Chicago Climate Exchange (CCX)
• Walk the talk –– Gold LEED for Lubin Facility, LEED Certification for San Francisco
and Philadelphia Showrooms

© 20077
Premier Brand IdentityKnoll Targets the Middle to Upper End of the Market Where Image, Performance and Customer Service are Key Differentiating Factors
Pric
e R
a nge
High
Mid-High
Mid-Low
Budget
North America Market Share¹ 17.0%14.3% 18.3%8.6%
(1) Based on LTM June 30, 2008 North America or U.S. publicly reported segments as a percent of LTM June 30, 2008 BIFMA U.S. industry shipments.
© 20078
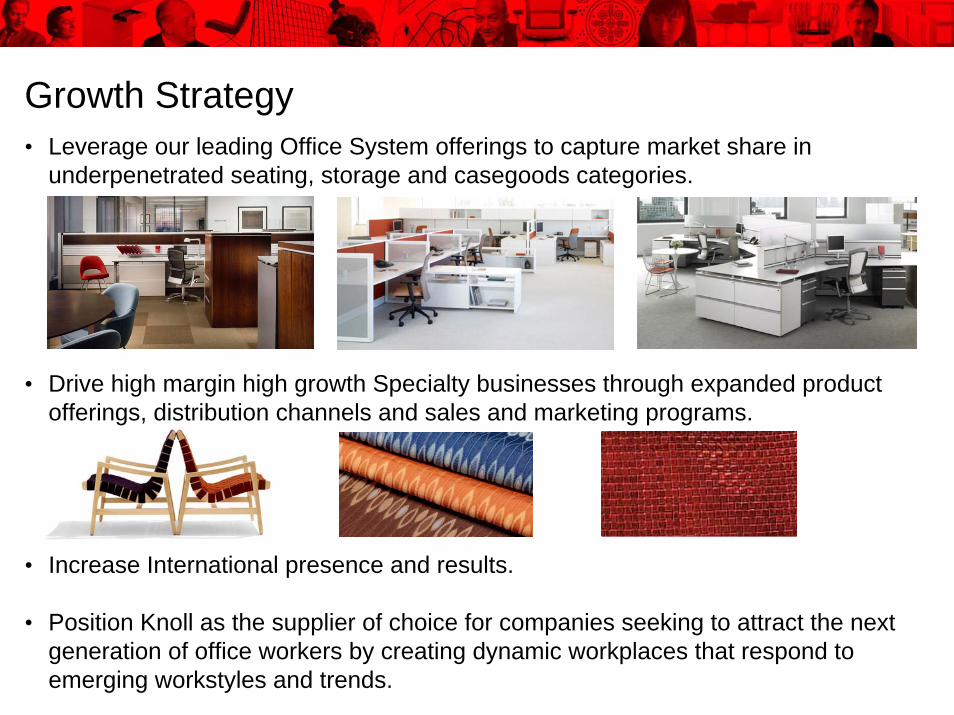
Growth Strategy • Leverage our leading Office System offerings to capture market share in
underpenetrated seating, storage and casegoods categories.
• Drive high margin high growth Specialty businesses through expanded product offerings, distribution channels and sales and marketing programs.
• Increase International presence and results.
• Position Knoll as the supplier of choice for companies seeking to attract the next generation of office workers by creating dynamic workplaces that respond to emerging workstyles and trends.

© 20079
We Still Have Significant Market Share Opportunity in Underpenetrated Categories
$75m
27% 27%
21%
11%
17%
4% 3%
1%
0
5
10
15
20
25
30
Office Systems Seating Storage Casegoods
Cat
egor
y Sh
are
(%)2
Category Share of Total Industry Shipments¹Knoll Category Share
$3,082
$538
$3,120
$118
$2,377
$81
$1,244
+$300 M
1. Percent of LTM 12/31/07 industry shipments of $11.4 billion, as reported by BIFMA2. As of LTM 12/31/07
(dollars in millions)
© 20071010
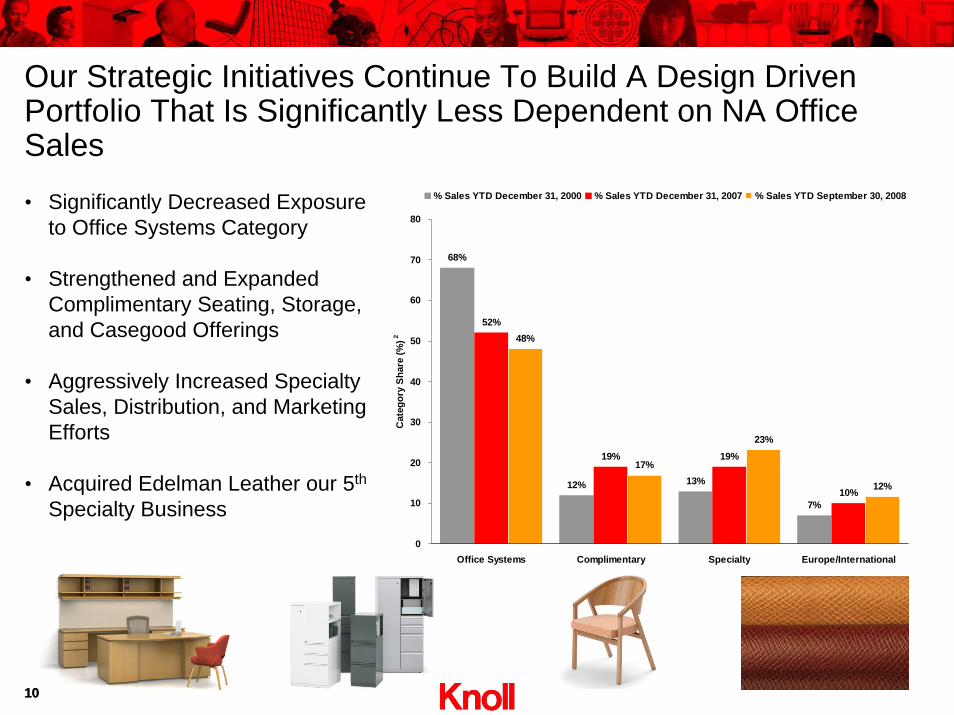
Our Strategic Initiatives Continue To Build A Design Driven Portfolio That Is Significantly Less Dependent on NA Office Sales• Significantly Decreased Exposure
to Office Systems Category
• Strengthened and Expanded Complimentary Seating, Storage, and Casegood Offerings
• Aggressively Increased Specialty Sales, Distribution, and Marketing Efforts
• Acquired Edelman Leather our 5th
Specialty Business
68%
12% 13%
7%
52%
19% 19%
10%
23%
12%
17%
48%
0
10
20
30
40
50
60
70
80
Office Systems Complimentary Specialty Europe/International
Cat
egor
y Sh
are
(%)2
% Sales YTD December 31, 2000 % Sales YTD December 31, 2007 % Sales YTD September 30, 2008

© 200711
SALES
NA Office
Specialty andInternational
GROSS PROFIT
NA Office
Specialty andInternational
OPERATING PROFIT
NA Office
Specialty andInternational
SALES GROSS PROFIT OPERATING PROFIT
2008 (as of 9/30/08)
2000
15.8%
41.7%
79.7% 84.2%81.1%
54.3%58.3%
65.8%
34.2%
20.3%
45.7%
18.9%
This Transformation Is Having A Significant Mix Impact On What Drives Our OP Results With The Effect Of Lowering Our Profit Dependence On NA Office Sales

© 200712
Trends We WatchAmerican Institute of Architects Billings Index
30
40
50
60
2002 2003 2004 2005 2006 2007 March2008
May2008
June2008
July2008
August2008
Inde
x
Absorption and Vacancy Rates
(40)
(30)
(20)
(10)
-
10
20
30
40
Net
Abs
orpt
ion
(mill
ions
sq
. ft.)
7.5%
10.0%
12.5%
15.0%
17.5%
20.0%%
Vacancy
Net Absorption Vacancy %
1998 2002 2004 Q2 200820062000-10.00%
-5.00%
0.00%
5.00%
10.00%
15.00%
20.00%
25.00%
30.00%
J M M J S N J M M J S N J M M J S N J M M J S N J M M J S N J M M J
% C
hang
e fr
om P
rior Y
ear
2002 2003 2004 2005 2006 2007 2008
Billings Index = The nine to twelve months lag between architecture billings and construction spending
Source: Grubb & Ellis
Source: American institute of Architects Billings index
Source: U.S. Census Bureau Source: Forecasted Amounts - McGraw Hill Construction
Valu
e of
Non
resi
dent
ialC
onst
ruct
ion
Source: U.S. Bureau of Labor Statistics
Change in Office Employment
-0.04
-0.03
-0.02
-0.01
0.00
0.01
0.02
0.03
0.04
0.05
Perc
ent C
hang
e ov
er P
rior Y
ear
2000 20052004200320022001 Aug 200820072006
McGraw Hill Forecasts a 2% decline in 2008 on non-
residential construction starts

© 200713
SOURCE: BIFMA
Y/Y Orders Growth
-0.7%
14.1%
3.3%
4.9%5.4%
13.5%
9.4%
3.2%
0.5%
5.8%
7.2%
-2.3%
1.4%
-1.1%
2.6%
1.2%1.5%
-3.7%
1.1%
-0.5%
-6.0%
-4.0%
-2.0%
0.0%
2.0%
4.0%
6.0%
8.0%
10.0%
12.0%
14.0%
16.0%
Jan-07 Mar-07 May-07 Jul-07 Sep-07 Nov-07 Jan-08 Mar-08 May-08 Jul-08
YOY ORDERS GROWTH
YTD % CHANGE 2008 vs 2007SHIPMENTS ORDERS
-1.0% 0.1%
Office Furniture MarketOrder Trend
Trailing Twelve Months
7,000
8,000
9,000
10,000
11,000
12,000
13,000
14,000
Jan-00 Jan-01 Jan-02 Jan-03 Jan-04 Jan-05 Jan-06 Jan-07 Jan-08
Office Furniture MarketShipment Trend
Trailing Twelve Months
7,000
8,000
9,000
10,000
11,000
12,000
13,000
14,000
Jan-00 Jan-01 Jan-02 Jan-03 Jan-04 Jan-05 Jan-06 Jan-07 Jan-08
© 200714
Financial Performance

© 200715
(5)%
0%
5%
10%
15%
20%
25%
2000 2001 2002 2003 2004 2005 2006 2007 LTM September2008
Ope
ratin
g M
argi
n
Knoll Herman Miller Steelcase
Industry-leading Margins Throughout Business Cycle
Source: Knoll financials and publicly available information
(1) Knoll Operating margins excludes certain non-recurring costs. See reconciliation of Knoll adjusted operating profit to the comparable GAAP measure for the period 2004 through LTM September 2008 on page 22. No adjustments were made to operating margins for the periods prior to 2004.
13.4%
12.5%
5.2%
(1)

© 200716
Over the Course of Our Public Life We Have Established A Strong Track Record
Knoll Has Reported 16 Consecutive Quarters Of Year Over Year Adjusted EPS Growth
$-
$0.10
$0.20
$0.30
$0.40
$0.50
$0.60
12/31
/2004
6/30/2
00512
/31/200
56/3
0/2006
12/31
/2006
6/30/2
00712
/31/200
76/3
0/2008
0.00%
10.00%
20.00%
30.00%
40.00%
50.00%
60.00%
70.00%
AdjustedEPS
GrowthYear overYear
(1) Adjusted EPS exclude certain non-recurring costs. For a reconciliation of these non-GAAP measures to the comparable GAAP measure, see page 23.
© 200717
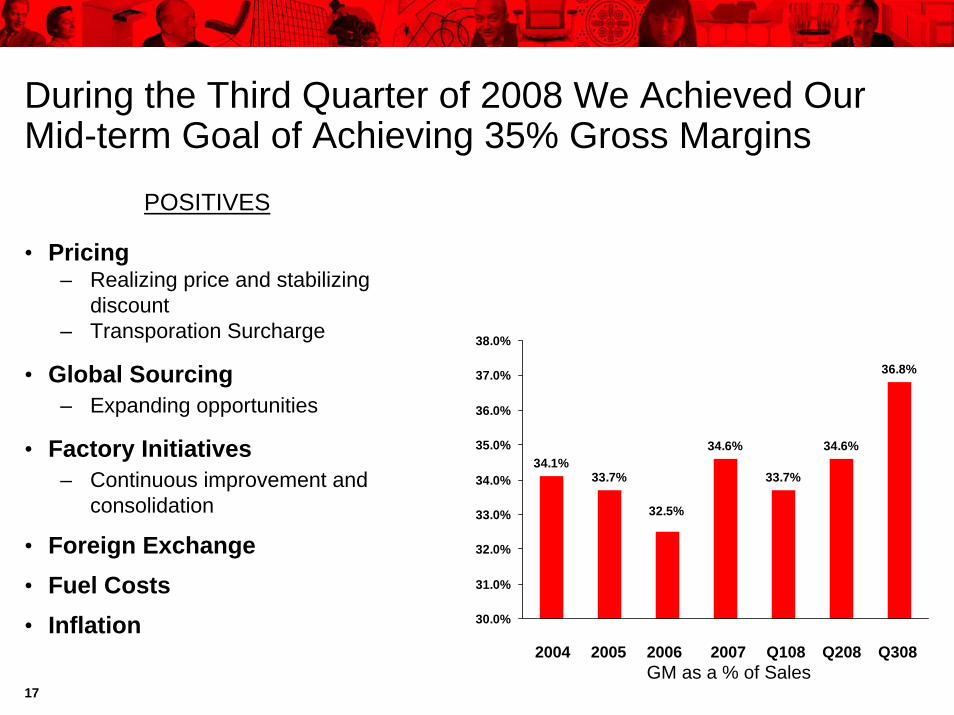
During the Third Quarter of 2008 We Achieved Our Mid-term Goal of Achieving 35% Gross Margins
GM as a % of Sales
34.1%33.7%
34.6%
33.7%
34.6%
36.8%
32.5%
30.0%
31.0%
32.0%
33.0%
34.0%
35.0%
36.0%
37.0%
38.0%
2004 2005 2006
• Pricing– Realizing price and stabilizing
discount– Transporation Surcharge
• Global Sourcing– Expanding opportunities
• Factory Initiatives– Continuous improvement and
consolidation
2007
• Fuel Costs
POSITIVES
Q108 Q208
• Foreign Exchange
Q308• Inflation

© 200718
We Continue to Work Towards Our Mid-term Goal of Achieving 15% Operating Margins
10.7%11.6%
13.5%
11.9%
13.2%
14.5%
12.1%
0.0%
2.0%
4.0%
6.0%
8.0%
10.0%
12.0%
14.0%
16.0%
2004 2005 20072006
Adjusted Operating Margins as a % of Sales
(1) Adjusted operating margins exclude certain non-recurring costs. For a reconciliation of adjusted operating profit to the comparable GAAP measure, see page 22. No adjustments were made to operating margins of 2007.
• Continue Leveraging Our SG&A
– Selectively invest in our support infrastructure
– Where possible, keep costs variable
– Keep SG&A at 21-22% of sales
Q108 Q208
(1)
Q308
© 200719
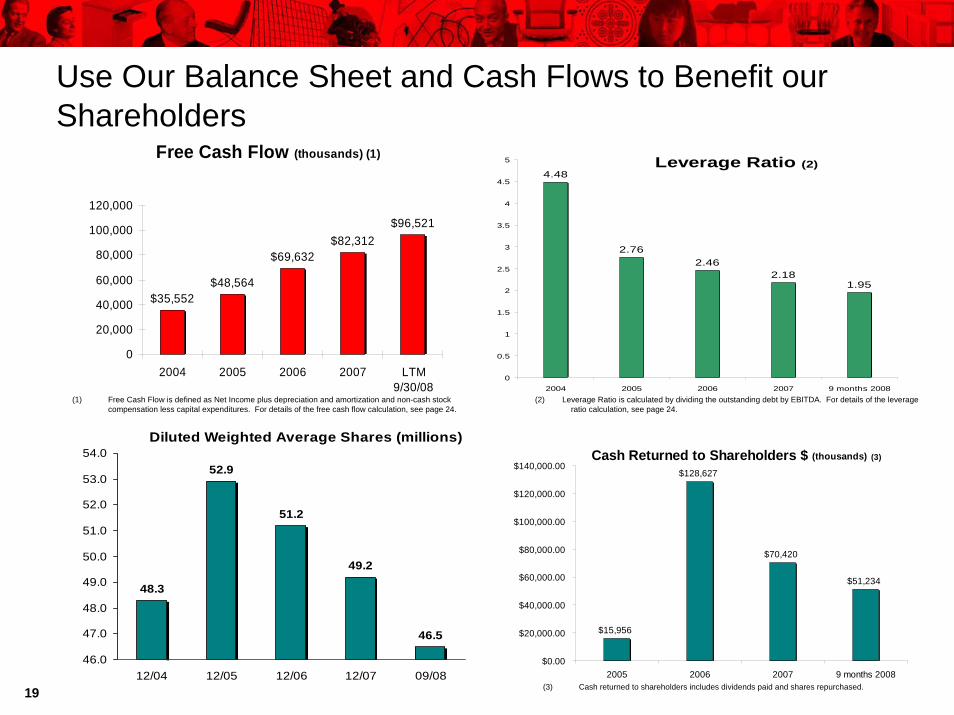
Free Cash Flow (thousands) (1)
$35,552$48,564
$69,632$82,312
$96,521
0
20,000
40,000
60,000
80,000
100,000
120,000
2004 2005 2006 2007 LTM9/30/08
Cash Returned to Shareholders $ (thousands) (3)
$15,956
$128,627
$70,420
$51,234
$0.00
$20,000.00
$40,000.00
$60,000.00
$80,000.00
$100,000.00
$120,000.00
$140,000.00
2005 2006 2007 9 months 2008
Diluted Weighted Average Shares (millions)
48.3
52.9
51.2
49.2
46.5
46.0
47.0
48.0
49.0
50.0
51.0
52.0
53.0
54.0
12/04 12/05 12/06 12/07 09/08
Debt Levels $316 $332 $324 $375 $350 $329$357
Use Our Balance Sheet and Cash Flows to Benefit our Shareholders
(1) Free Cash Flow is defined as Net Income plus depreciation and amortization and non-cash stock compensation less capital expenditures. For details of the free cash flow calculation, see page 24.
(3) Cash returned to shareholders includes dividends paid and shares repurchased.
Leverage Ratio (2)4.48
2.762.46
2.181.95
0
0.5
1
1.5
2
2.5
3
3.5
4
4.5
5
2004 2005 2006 2007 9 months 2008
(2) Leverage Ratio is calculated by dividing the outstanding debt by EBITDA. For details of the leverage ratio calculation, see page 24.
© 200720
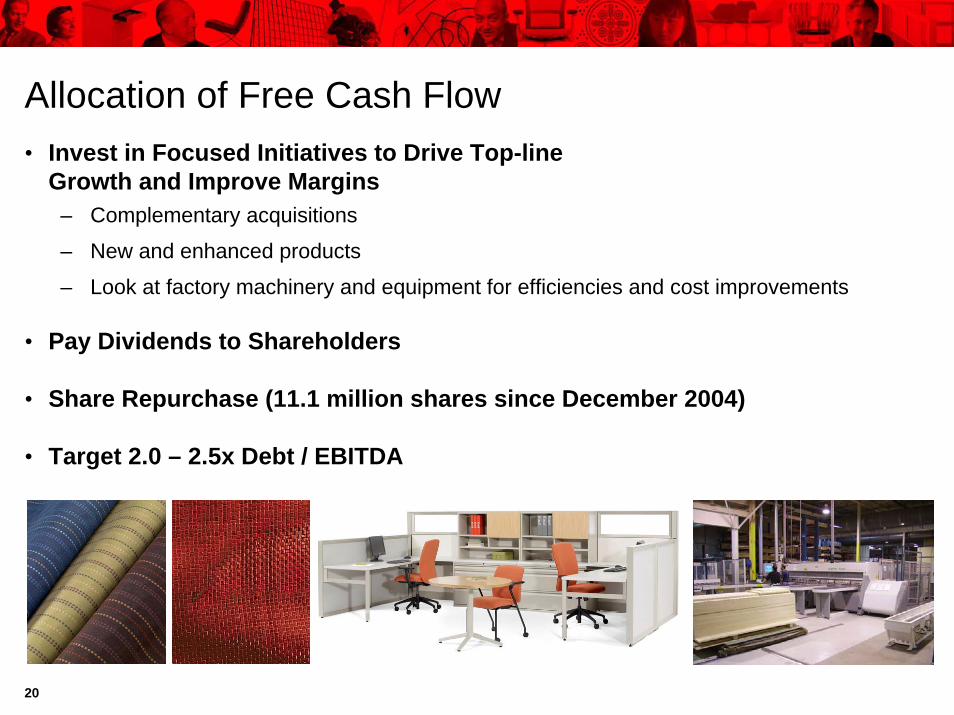
Allocation of Free Cash Flow• Invest in Focused Initiatives to Drive Top-line
Growth and Improve Margins– Complementary acquisitions
– New and enhanced products
– Look at factory machinery and equipment for efficiencies and cost improvements
• Pay Dividends to Shareholders
• Share Repurchase (11.1 million shares since December 2004)
• Target 2.0 – 2.5x Debt / EBITDA

© 200721 www.knoll.com
Thank You
www.knoll.com

© 200722
Reconciliation of Non-GAAP ResultsNine Months Ended 9/30/08
Nine Months Ended 9/30/07 FY 2007 FY 2006 FY 2005 FY 2004
Operating Profit ($mm) 108.1$ 102.7$ 142.2$ 116.9$ 92.8$ 71.3$
Add back:
Restructuring charges 3.4 - - - 0.8 - Public offering expenses - - - 1.5 - 4.4
Adjusted Operating Profit 111.5$ 102.7$ 142.2$ 118.4$ 93.6$ 75.7$
Net Sales 843.9$ 774.0$ 1,055.8$ 982.2$ 808.0$ 706.4$
Adjusted Operating Margin 13.2% 13.3% 13.5% 12.1% 11.6% 10.7%
Earnings per Share (Diluted) 1.32$ 1.03$ 1.45$ 1.14$ 0.68$ 0.55$
Add back:
Restructuring charges 0.05 - - 0.01 - Public offering expenses - - 0.03 - 0.08 Write-off of deferred financing fees - 0.02 0.02 - 0.05 0.03 Taxes related to repatriation of foreign earnings - - - 0.06 -
Adjusted Earnings per Share 1.37$ 1.05$ 1.47$ 1.17$ 0.80$ 0.66$
Three Months Ended 9/30/08
Three Months Ended 9/30/07
Three Months Ended 6/30/08
Three Months Ended 6/30/07
Three Months Ended 3/31/08
Three Months Ended 3/31/07
Operating Profit ($mm) 41.1$ 34.3$ 35.1$ 37.6$ 31.9$ 30.8$
Add back:Restructuring charges - - 3.4 - - -
Adjusted Operating Profit 41.1$ 34.3$ 38.5$ 37.6$ 31.9$ 30.8$
Net Sales 283.5$ 254.0$ 292.5$ 272.1$ 267.8$ 247.9$
Adjusted Operating Margin 14.5% 13.5% 13.2% 13.8% 11.9% 12.4%
Earnings per Share (Diluted) 0.52$ 0.37$ 0.44$ 0.35$ 0.36$ 0.30$
Add back:
Restructuring charges - - 0.05 - - - Write-off of deferred financing fees - - - 0.02 - -
Adjusted Earnings per Share 0.52$ 0.37$ 0.49$ 0.37$ 0.36$ 0.30$
© 200723
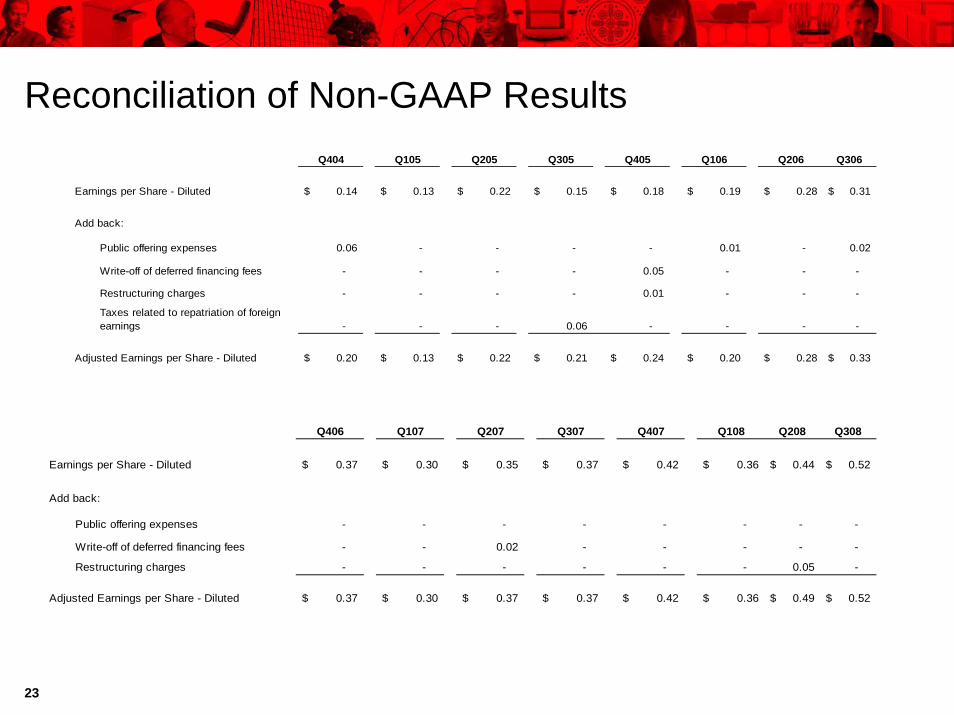
Q404 Q105 Q205 Q305 Q405 Q106 Q206 Q306
Earnings per Share - Diluted 0.14$ 0.13$ 0.22$ 0.15$ 0.18$ 0.19$ 0.28$ 0.31$
Add back:
Public offering expenses 0.06 - - - - 0.01 - 0.02
Write-off of deferred financing fees - - - - 0.05 - - -
Restructuring charges - - - - 0.01 - - -
Taxes related to repatriation of foreign earnings - - - 0.06 - - - -
Adjusted Earnings per Share - Diluted 0.20$ 0.13$ 0.22$ 0.21$ 0.24$ 0.20$ 0.28$ 0.33$
Q406 Q107 Q207 Q307 Q407 Q108 Q208 Q308
Earnings per Share - Diluted 0.37$ 0.30$ 0.35$ 0.37$ 0.42$ 0.36$ 0.44$ 0.52$
Add back:
Public offering expenses - - - - - - - -
Write-off of deferred financing fees - - 0.02 - - - - -
Restructuring charges - - - - - - 0.05 -
Adjusted Earnings per Share - Diluted 0.37$ 0.30$ 0.37$ 0.37$ 0.42$ 0.36$ 0.49$ 0.52$
Reconciliation of Non-GAAP Results
© 200724
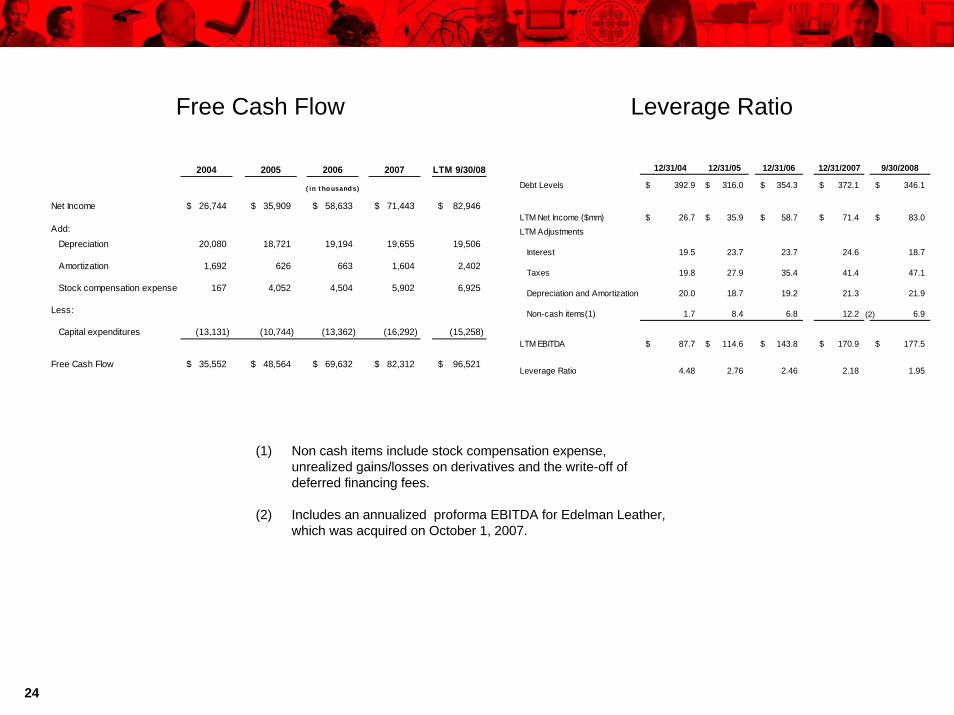
2004 2005 2006 2007 LTM 9/30/08
Net Income 26,744$ 35,909$ 58,633$ 71,443$ 82,946$
Add: Depreciation 20,080 18,721 19,194 19,655 19,506
Amortization 1,692 626 663 1,604 2,402
Stock compensation expense 167 4,052 4,504 5,902 6,925
Less:
Capital expenditures (13,131) (10,744) (13,362) (16,292) (15,258)
Free Cash Flow 35,552$ 48,564$ 69,632$ 82,312$ 96,521$
( in t ho usand s)
(1) Non cash items include stock compensation expense, unrealized gains/losses on derivatives and the write-off of deferred financing fees.
(2) Includes an annualized proforma EBITDA for Edelman Leather, which was acquired on October 1, 2007.
12/31/04 12/31/05 12/31/06 12/31/2007 9/30/2008
Debt Levels 392.9$ 316.0$ 354.3$ 372.1$ 346.1$
LTM Net Income ($mm) 26.7$ 35.9$ 58.7$ 71.4$ 83.0$ LTM Adjustments
Interest 19.5 23.7 23.7 24.6 18.7
Taxes 19.8 27.9 35.4 41.4 47.1
Depreciation and Amortization 20.0 18.7 19.2 21.3 21.9
Non-cash items(1) 1.7 8.4 6.8 12.2 6.9
LTM EBITDA 87.7$ 114.6$ 143.8$ 170.9$ 177.5$
Leverage Ratio 4.48 2.76 2.46 2.18 1.95
Free Cash Flow Leverage Ratio
(2)