Embed Size (px)
Citation preview
Oil price and stock market synchronization in GCC countries
Rosmy Jean Louisa
Faruk Balli b
Abstract
With a background of the Gulf Cooperation Council (GCC) economies being dichotomous in nature and with growth in the non-oil sector being tributary to the oil sector, we document the extent of synchronization between crude oil prices and stock markets for each of the GCC markets and for the GCC as an economic bloc. We use both the bivariate and multivariate non-parametric synchronicity measures proposed by Mink et al. (2007) to assess that linkage. We find a low to mild (mild to strong) degree of synchronization between oil price and stock market returns (volatilities). In a very few instances, we found very strong (above 80%) associations between these variables. These results hold, irrespective of whether we assume that stock market participants form adaptive or rational expectations about the price of oil. Dynamic factor results confirm that shocks to volatility are more important than shocks to oil price returns for the GCC stock markets.
Keywords: Oil price, GCC stock markets, and synchronicity measures.
JEL CODES:
___________________________
a Corresponding author, Department of Economics and Finance, Faculty of Management, Vancouver Island University, 900 FIFTH Street, Nanaimo, BC, Canada V9R 5S5, email: [email protected], phone: 1-250-753-3245 ext. 2233.
b School of Economics and Finance, Massey University, Private Bag 11-222, Palmerston North, New Zealand.
We think Eninim Ekon of the MBA/ MScIB program at VIU for excellent research assistance.
1
Introduction
It is well known that crude oil is the backbone of the Gulf Cooperation Council (GCC) economies. A change in the price of oil, however, may produce quite ambiguous effects on these economies. As oil is a main source of energy, a rise in its market price boosts profits for oil companies while increases costs for goods-producing companies, if other cost-cutting measures are not implemented. Since most of the GCC oil companies are government owned, the resulting boost in oil export revenues serves as a means of fostering investment in education, infrastructure, education and tourism, among other sectors. An increase in the price of oil also brings the misfortune of raising the cost of imported capital goods, and therefore hampers growth in the GCC markets. This line of reasoning is akin to the macro view that oil prices can influence the real sector of the economy mainly via its effects on consumption as firms shift a portion of their costs to consumers, production, and government budgets (see, for example, Basher, 2010; Ravichandran and Alkhathlan, 2010; Basher and Sadorsky, 2006). Research in this strand of the literature has linked fluctuations in key macroeconomic indicators to stock market performance. These include the work of Chen et al. (1986), Hamao (1989), and Kaneko and Lee (1995) for Japan; Ferson and Harvey (1995) for 18 stock markets, King et al. (1994) for a sample of developed and emerging markets; Jones and Kaul (1996) for Canada, the United States (US), Japan and the United Kingdom (UK); Sadorsky (2003) for the US; Papapetrou (2001) for Greece; and El-Wassal (2005) for oil exporting countries in Asia, Africa and Latin America, among others. Their overall findings are in line with what Hamilton (1983, 1996, 2003), Hamilton and Herrera (2004), Cunado and Perez de Garcia (2005), and Kilian (2008a) have documented: oil price shocks affect key macroeconomic variables in both developed and emerging markets with different intensities and through different mechanisms. Not surprisingly, given the newness of the GCC stock markets and the lack of high frequency macroeconomic data, this line of research has not been exploited.1
Another strand of the literature has focused on the differing effects that unanticipated change in the price of oil can have on the share prices of oil and non-oil companies as expectations about future dividends are factored into investors’ portfolio decisions. To this end, researchers have conducted two types of inquiry at the cross-country level: (a) assessment of the state of stock market integration, and (b) investigation into the linkages between oil price returns (volatilities) and national stock indices. Several methodological approaches have been followed and data of various frequencies from various sources have been used. Early studies on stock market linkages include the work of Harvey (1995a,b), Darrat et al. (2000), Abraham et al. (2001), Omran and Gunduz (2001), Girard et al. (2003), and Girard and Ferreira (2004) for the Middle East and North African (MENA) region; and Hammoudeh and Aleisa (2004), and Al-Khazali et al. (2006) for a sample of the GCC markets, Bley and Chen (2006) for all of the GCC markets. A number of other studies have focused instead on contagion and spillover effects that
1 For example, macroeconomic data on inflation and output are available on a yearly basis for all GCC countries except Saudi Arabia. Data on interest rates and unemployment are not available. Although stock trading began as far back as 1935 (Saudi Arabia), 1952 (Kuwait) and 1957 (Bahrain), electronic trading started in the late 1980s for Bahrain and Saudi Arabia, the mid- to late 1990s for Oman and Kuwait, and the early 2000s for the United Arab Emirates (UAE) and Qatar. For a chronology of the GCC stock market and its economic characteristics, see Bley and Chen (2006), and Arouri et al. (2011).
2
may take place through financial markets, trade and real-economic sector linkages.2 For example, Suliman (2011) examines contagion and spillover effects in the GCC and finds evidence of contagion from the US stock market crash and the Thai devaluation to the GCC via Saudi Arabia, the largest country in the GCC. Abraham et al. (2002) tested the random walk behavior and efficiency of the GCC stock markets and found evidence for this in Bahrain and Saudi Arabia. Al-Khazali et al. (2007) used variance ratio tests on raw data to show that the hypothesis of random walk is rejected for Bahrain, Kuwait, Oman, Saudi Arabia and four other MENA countries that are not part of the GCC. Earlier works by Rao and Shankaraiah (2003), Sharma (2005), and Elango and Hussein (2008) produced similar results. Bley (2011), however, investigated weak-form efficiency in GCC stock markets using daily, weekly and monthly data over the period 2000–2009 and found that rejection of the random walk hypothesis depends on the frequency of the data used. Results differ across markets for weekly and monthly data, while daily data show a clear tendency towards rejection of the random walk hypothesis.
Research on the linkages between oil prices and stock market prices for the GCC countries has gained impetus following early contributions by Jones and Kaul (1996), Huang et al. (1996), Sadorsky (1999) and El-Sharif et al. (2005) for the major stock markets; and Papapetrou (2001), and Basher and Sadorsky (2006) for emerging markets.3 For example, Hammoudeh and Aleisa (2004) used the Johansen cointegration technique and daily data and found that oil future prices can help forecast stock market returns for Saudi Arabia only. Abu Zarour (2006) used the vector autoregression (VAR) technique and concluded that only the Saudi Arabia and Oman stock markets can be predicted with oil price innovations. Hamoudeh and Choi (2006) used a vector-error correction (VEC) model to investigate the short-run bilateral causal relationships among the GCC weekly stock index returns and their relationships with oil prices, among other factors. They found no direct impact of oil prices on these markets. Maghyereh and Al-Kandari (2007), by contrast, found that the impacts of oil price changes on GCC stock prices were significant over the long run.
Arouri and Fouquau (2009) investigate the relationship between oil prices and GCC stock markets using a non-parametric method. Their results show that stock markets in Qatar, Oman, and the UAE exhibit asymmetric and regime switching linkages with changes in oil price. Arouri et al. (2011) provided further evidence that the effects of oil price on GCC stock prices differ across member countries. Arouri and Rault (2010) used panel data analysis to study the sensitivity of GCC stock markets to oil prices. They showed that the causal relationship is bidirectional for Saudi Arabia only when the data are either weekly or quarterly. For other GCC countries, however, they found strong statistical evidence that oil price disturbances Granger cause stock price changes. They therefore surmise that investors in the GCC stock markets should pay close attention to fluctuations in oil prices, while investors in oil markets
2 This line of research follows in the footsteps of Calvo et al. (1993), Glick and Rose (1999), Masson (1999a, b, c), Dornbusch et al. (2000), Forbes and Rigobon (2001, 2002), Hernandez et al. (2001), Favero and Giavazzi (2002), Van Rijckeghem and Weder (2003), and Dungey et al. (2005, 2006). Sadorsky (1999) relied on an unrestricted VAR model and monthly data for the US to gauge the relationship between fuel oil prices and stock prices. His results show that both oil price return and volatility play an important role in the dynamics of real stock returns.
3 Although Basher and Sadorsky (2006) is one of the most comprehensive studies on the effects of oil price changes on emerging stock market returns, none of the GCC countries was incorporated in their study.
3
should follow the Saudi stock market closely. Fayyad and Daly (2011) considered a VAR with the US, the UK and all GCC countries except Saudi Arabia to investigate the time varying nature of that relationship. Their results show that the sensitivity of GCC stock returns to oil price increases due to a rise in the price of oil and increased during the recent global financial crises. They also found that of all the stock markets, Qatar and the United Arab Emirates (UAE) stock returns are the most responsive to oil shocks.
The empirical literature on the feedback effects between GCC stock markets and oil markets has thus far been concentrated on the performance of national stock indices, which are weighted averages of sectoral stock indices. However, little was known about the relationship between GCC sectoral stock market disturbances and oil price innovations until the publication of Mohanty et al. (2011).4 These authors assessed the relation between changes in crude oil prices and stock returns using both country-level and industry-level stock market data. At the country level, they showed that, except for Kuwait, GCC stock markets have significant positive exposure to oil price shocks. At the industry level, they found that the responses of industry-specific returns to oil shocks are significantly positive for only 12 of the 20 industries. Their study also provided evidence that oil price changes have asymmetric effects on stock market returns at both levels. However, Mohanty et al. did not consider stock market and oil price volatilities in their study.
Focusing on disaggregated stock market data in analyzing the impact of oil price shocks on stock returns is a sensible approach since it allows us to factor in speculators’ sentiments in buying and selling stocks on a daily basis. Instinctively, an investor contemplating a quick return will closely follow movement in various stocks to capitalize on any relationship that might exist. For example, if the performances of oil and industry sectors are inversely correlated, expectations of an increase in the price of oil may prompt investors to purchase oil company stocks while selling industrial company shares. Heterogeneity of industries makes it possible for these potential gains to materialize, as risks are being minimized (Fama and French, 1993). Therefore, a study on the relationship between stock market returns at the industry level and oil price movements are of utmost importance to market participants. Recent studies by Kilian (2008b, 2009), and Kilian and Park (2009) have established that the effects of oil price shocks on the real economy depend on whether these shocks are driven by global demand or supply factors. Killian and Park (2009) have also shown that the effects of oil price shocks on stock market returns hinge on the underlying causes of the oil shocks, and these effects vary across industries. Their findings suggest that sectoral analysis is the most appropriate for capturing the relationship between oil prices and stock market disturbances.
In this paper, we make three major contributions to the existing literature on the linkages between oil price movement and stock prices. First, we use both the bivariate and multivariate non-parametric approach proposed by Mink et al. (2007) to measure the synchronicity between oil market returns (volatilities) and sectoral/national/regional stock market returns (volatilities) in the GCC. Second, we
4 Hammoudeh and Choi’s (2006) work on GCC markets was based on national stock market indices. At the industry level, a number of studies have paved the way for Mohanty et al. and our study, e.g. Huang et al. (1996), Aleisa et al. (2003), Hammoudeh and Li (2005), and Mohanty and Nandha (2011) for the US; Faff and Brailsford (1999) for Australia; Sadorsky (2001) for Canada; Nandha and Faff (2008) for the global industries; and Driesprong et al. (2008) on 18 developed and 30 developing countries. The results are mixed and vary across industries.
4
document the extent of synchronization between past or future oil prices and GCC stock prices. Third, in search of robustness, we investigate whether GCC stock market dynamics at all levels are governed by a common factor, and whether oil price return and volatility can explain this common factor.5 To this end, we estimate variants of the dynamic factor model proposed by Stock and Watson (1989, 1991)6. In terms of coverage, our paper follows Mohanty et al. (2011) in using industry-level stock price data for the GCC. Mohanty et al.’s study only covers Bahrain, Kuwait, Oman and Qatar because data covering a sufficiently long period are not available for Saudi Arabia and the UAE in Thomson Reuters Database; however, due to its flexibility, our methodology, which differs from theirs, allows for the inclusion of all of the GCC countries in our analysis. We are not aware of other papers similar to ours in the literature, though Mohanty et al.’s (2011) is the closest.
The results can be summarized as follows: for the synchronicity between oil price and sectoral/national stock markets, we find the bivariate synchronicity measures range from (a) low (less than 40%) to mild (40–60%) for the return cycles; and (b) borderline mild and strong to strong (low 60% range to a high of 78%).7 The multivariate synchronicity measures are, on average, lower than the mean of the bivariate measures, with the 10-day volatility showing a tighter link. It is worth noting that the aggregate GCC sectors follow similar patterns, but the energy sector based on the 50-day volatility is at the borderline of mild and high (59%) synchronization with the oil price. Saudi Arabia’s stock sectors are the most tied to oil price in terms of volatility whether we consider a 10- or a 50-day horizon. In general, there is less association between individual stock return and oil cycles than there is between their volatility cycles. These results hold whether we consider the lagged or lead values of the oil price. The dynamic factor models reveal that sectoral as well as national stock markets in the GCC are governed by a common underlying factor, which is weakly explained by disturbances in oil markets.
The remainder of the paper is organized as follows. Section 2 presents the methodology. Section 3 describes and analyzes the data. Section 4 discusses the empirical results and summarizes the findings Section 6 concludes the paper.
Section 2 Methodology
2.1 Measuring synchronicity
The starting point towards documenting the synchronicity (or lack thereof) between sectoral/national stock markets and oil markets is to determine a measure of the cyclical fluctuations in both the return and return volatilities of these assets. A number of alternative techniques are available in the literature to extract and investigate the extent of co-movement of the cycles. These include Markov-switching vector autoregression decomposition (Artis et al., 2004 Krolzig, 1997a, 1997b, 2005; Krolzig and Sensier,
5 The motivation here is to avoid spurious synchronicity. Two variables may co-move just because of luck. Our contention is that for synchronicity to be meaningful, the dynamics of both variables must be driven by a common factor. This is pretty much the idea embodied in cointegration and correlation analyses. 6 Other contributors to the development and applications of dynamic-factor models include Geweke (1977), Sargent and Sims (1977), and Watson and Engle (1983).7 A mild association of the 50-day volatility cycles is noted for the Dubai Financial Market (DFM) and the Abu Dhabi Exchange (ADX). The ADX is also more sensitive to oil price disturbances than the DFM.
5
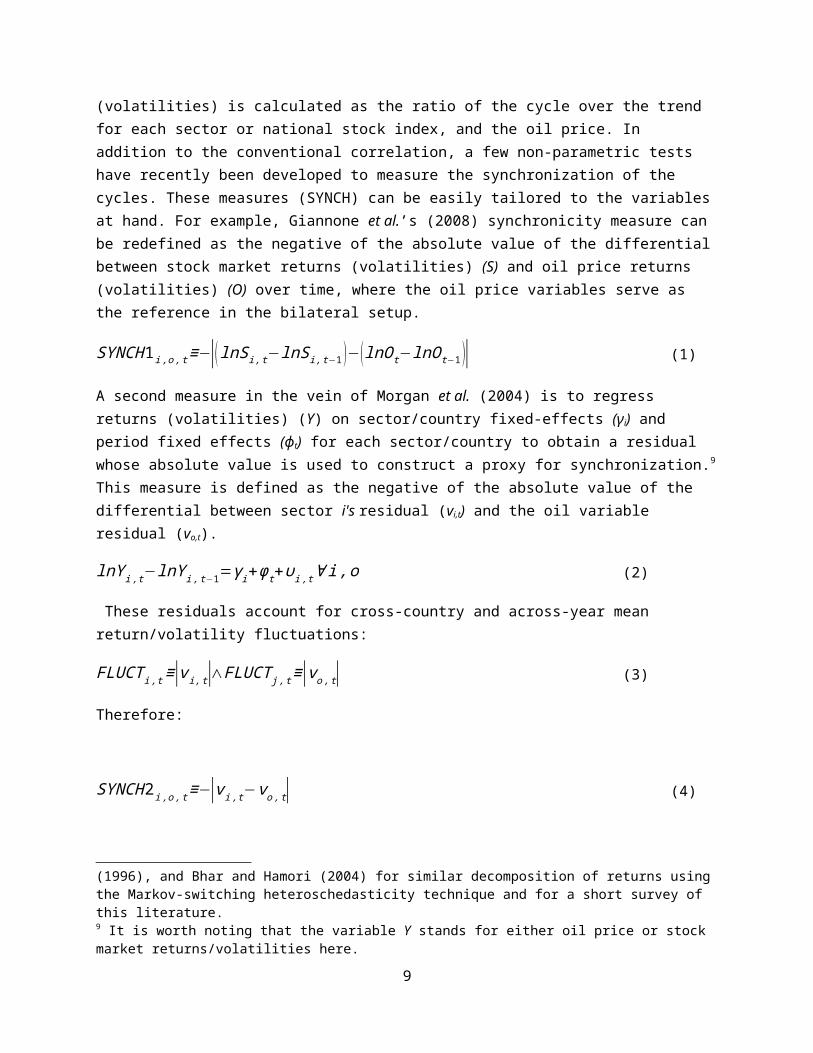
2000), cointegration analysis (Engle and Granger, 1987; Stock and Watson, 1988; Johansen, 1988, 1991), testing for common features (Engel and Kozicki, 1993), and tests for common trends and common cycles (Beveridge and Nelson, 1981; Vahid and Engle, 1993; Engle and Issler, 1995). Nonetheless, due to its simplicity and popularity, we use the Hodrick and Prescott (1997) nonparametric filter to decompose returns and volatilities into a trend (the permanent component) and a cycle (a transitory component), where the trend is the long-term return and the cycle is the deviation of the actual return from its trend, which may arise due to speculation and uncertainty.8 The gap between the two returns (volatilities) is calculated as the ratio of the cycle over the trend for each sector or national stock index, and the oil price. In addition to the conventional correlation, a few non-parametric tests have recently been developed to measure the synchronization of the cycles. These measures (SYNCH) can be easily tailored to the variables at hand. For example, Giannone et al.’s (2008) synchronicity measure can be redefined as the negative of the absolute value of the differential between stock market returns (volatilities) (S) and oil price returns (volatilities) (O) over time, where the oil price variables serve as the reference in the bilateral setup.
SYNCH 1i , o ,t≡−|(lnSi ,t−lnSi ,t−1 )−(lnOt−lnO t−1 )| (1)
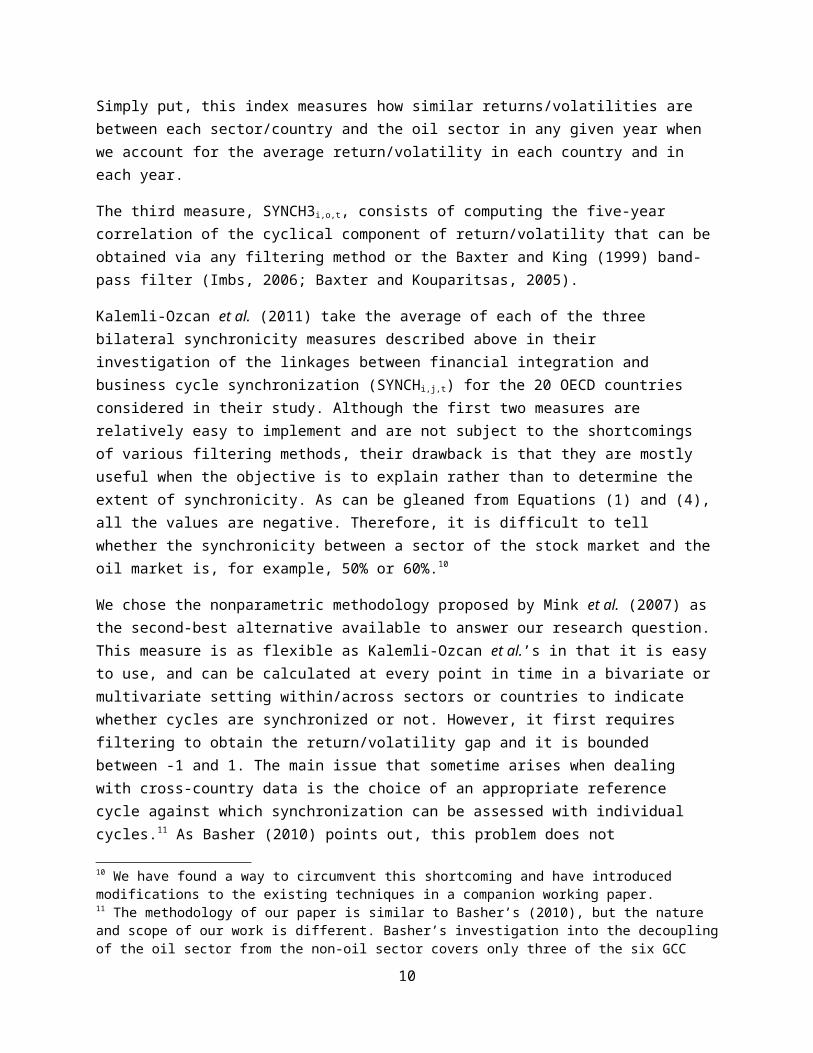
A second measure in the vein of Morgan et al. (2004) is to regress returns (volatilities) (Y) on sector/country fixed-effects (γi) and period fixed effects (ϕt) for each sector/country to obtain a residual whose absolute value is used to construct a proxy for synchronization.9 This measure is defined as the negative of the absolute value of the differential between sector i's residual (vi,t) and the oil variable residual (vo,t).
lnY i ,t−lnY i , t−1=γi+ϕt+υi , t∀ i , o (2)
These residuals account for cross-country and across-year mean return/volatility fluctuations:
FLUCT i , t≡|v i ,t|∧FLUCT j ,t≡|vo , t| (3)
Therefore:
SYNCH 2i , o ,t≡−|v i ,t−vo ,t| (4)
8 The notion of decomposing returns into a trend and a cycle is in line with market participants’ behavior towards risks and returns. Some investors purchase shares for retirement or as long-term investments and therefore are not concerned with day-to-day fluctuations in stock prices. Their goals are to collect dividends over time while waiting for the share price to reach a certain level. Others, however, make a living off the market by monitoring share prices closely. The interested reader is referred to Kim and Kim (1996), and Bhar and Hamori (2004) for similar decomposition of returns using the Markov-switching heteroschedasticity technique and for a short survey of this literature.9 It is worth noting that the variable Y stands for either oil price or stock market returns/volatilities here.
6
Simply put, this index measures how similar returns/volatilities are between each sector/country and the oil sector in any given year when we account for the average return/volatility in each country and in each year.
The third measure, SYNCH3i,o,t, consists of computing the five-year correlation of the cyclical component of return/volatility that can be obtained via any filtering method or the Baxter and King (1999) band-pass filter (Imbs, 2006; Baxter and Kouparitsas, 2005).
Kalemli-Ozcan et al. (2011) take the average of each of the three bilateral synchronicity measures described above in their investigation of the linkages between financial integration and business cycle synchronization (SYNCHi,j,t) for the 20 OECD countries considered in their study. Although the first two measures are relatively easy to implement and are not subject to the shortcomings of various filtering methods, their drawback is that they are mostly useful when the objective is to explain rather than to determine the extent of synchronicity. As can be gleaned from Equations (1) and (4), all the values are negative. Therefore, it is difficult to tell whether the synchronicity between a sector of the stock market and the oil market is, for example, 50% or 60%.10
We chose the nonparametric methodology proposed by Mink et al. (2007) as the second-best alternative available to answer our research question. This measure is as flexible as Kalemli-Ozcan et al.’s in that it is easy to use, and can be calculated at every point in time in a bivariate or multivariate setting within/across sectors or countries to indicate whether cycles are synchronized or not. However, it first requires filtering to obtain the return/volatility gap and it is bounded between -1 and 1. The main issue that sometime arises when dealing with cross-country data is the choice of an appropriate reference cycle against which synchronization can be assessed with individual cycles.11 As Basher (2010) points out, this problem does not necessarily exist in sectoral analysis, since the choice of the reference cycle is, at times, pretty straightforward. In this paper, cyclical fluctuations in oil price return and volatility are used as the references. The shortcoming of fixing the reference cycle is that spillovers from other sectors cannot be factored into computation of the bivariate synchronicity measure.
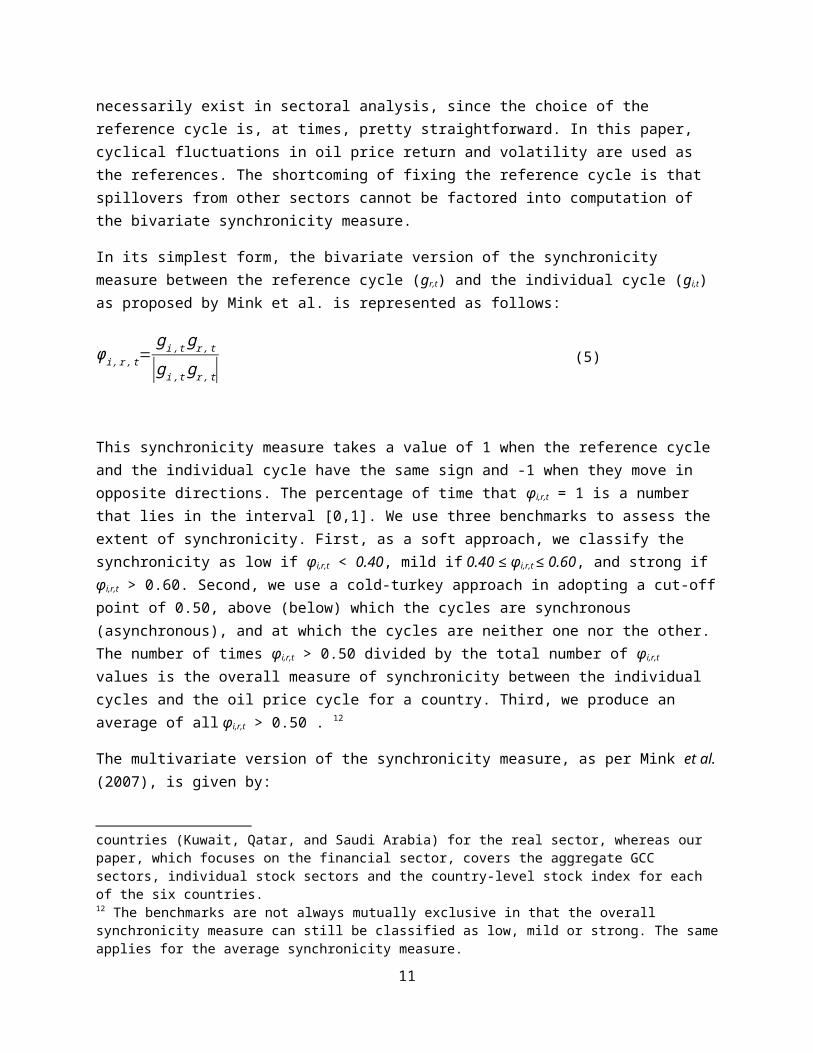
In its simplest form, the bivariate version of the synchronicity measure between the reference cycle (gr,t) and the individual cycle (gi,t) as proposed by Mink et al. is represented as follows:
φ i ,r , t=gi , t gr , t
|gi , t gr , t| (5)
10 We have found a way to circumvent this shortcoming and have introduced modifications to the existing techniques in a companion working paper. 11 The methodology of our paper is similar to Basher’s (2010), but the nature and scope of our work is different. Basher’s investigation into the decoupling of the oil sector from the non-oil sector covers only three of the six GCC countries (Kuwait, Qatar, and Saudi Arabia) for the real sector, whereas our paper, which focuses on the financial sector, covers the aggregate GCC sectors, individual stock sectors and the country-level stock index for each of the six countries.
7

This synchronicity measure takes a value of 1 when the reference cycle and the individual cycle have the same sign and -1 when they move in opposite directions. The percentage of time that φi,r,t = 1 is a number that lies in the interval [0,1]. We use three benchmarks to assess the extent of synchronicity. First, as a soft approach, we classify the synchronicity as low if φi,r,t < 0.40, mild if 0.40 ≤ φi,r,t ≤ 0.60, and strong if φi,r,t > 0.60. Second, we use a cold-turkey approach in adopting a cut-off point of 0.50, above (below) which the cycles are synchronous (asynchronous), and at which the cycles are neither one nor the other. The number of times φi,r,t > 0.50 divided by the total number of φi,r,t values is the overall measure of synchronicity between the individual cycles and the oil price cycle for a country. Third, we produce an average of all φi,r,t > 0.50 . 12
The multivariate version of the synchronicity measure, as per Mink et al. (2007), is given by:
φ t=1N∑
i=1
N gi , t gr ,t|gi , t gr ,t|
, (6)
where N is the number of cycle pairs. This equation tells us the average synchronicity of the individual countries’ cycles with the reference cycle at each point in time. Positive values of φ t indicate the dominance of synchronous cycles over asynchronous cycles in relation to the reference for a given day. We use both versions of Mink et al.’s synchronicity measure in our investigation of the linkage between GCC stock markets and the international oil market.
2.2 Dynamic factor model
Although the non-parametric method of Mink et al. is quite flexible in accommodating even small data samples, there is the possibility that the synchronicity observed may be spurious in that cycles that are not related at all may show co-movement without any underlying common component. We attempt to overcome this issue by reformulating the research question without deviating from the main objective. We ask whether GCC stock markets at both the industry- and the country-level are governed by a common factor, and whether oil price return and volatility cycles can explain the dynamics of that factor.
The dynamic factor (DF) models as developed by Geweke (1977), Sargent and Sims (1977), Stock and Watson (1989, 1991), and Watson and Engle (1983) consist in estimating a vector of n endogenous variables as linear functions of k < n unobserved factors and some exogenous covariates. The model assumes that the vector Yt of stock indices can be modeled as consisting of an intercept, α; a sector/country/overall GCC sector-specific autoregressive component of order one, AYt-1; k unobservable factors Ft= [F1,t,… ,Fk,t] that are common to all series, which follow a first-order autoregressive process; and a normally distributed disturbance term, et. Generally, the model estimated can be represented as follows:
12 The benchmarks are not always mutually exclusive in that the overall synchronicity measure can still be classified as low, mild or strong. The same applies for the average synchronicity measure.
8
Y t=α+A Y t−1+B F t+et , F t=DF t−1+v t, (7)
where B is an n × k sensitivity matrix that captures the contemporaneous effects of changes in the common factor on each series Yi; vt is also a white noise disturbance. The variance–covariance matrix of et is assumed to be diagonal, with diagonal elements equal to σ i
2. We estimate the basic DF model proposed by Stock and Watson by setting the following: Model 1: α = 0 and A = 0; Model 2: A = 0 and et = δet-1 + ut; Model 3: α = 0; Model 4’s specification is in fact Eq. (7) with the autocorrelated error term.
Once a set of common factors has been obtained for each country and for the GCC as a bloc, we then ask whether oil price returns and volatilities (not their cyclical components) have any explanatory power. To this end, we estimate the following equation generally:
F t=γ0+∑j=1
n
γ jOt+1− j+ut (8)
The sign and significance of the slope coefficients indicate to what extent the return or volatility of oil prices can explain the dynamics of the common factor underlying the GCC stock markets. Thus far, our focus has been on the common factor that underlies the sectoral stock markets in each country, the GCC sectors as a group and the country-level indices. Although the overall GCC stock sectors are weighted averages of the individual countries’ stock sectors, it is, in our view, not convincing enough to argue that the same holds for the common factors. To that effect, we expand the analysis by investigating whether the industry-level common factors across GCC countries share a common component that is also associated with oil price returns and volatility. This layer of the analysis is motivated by the uneven number of sectors across countries that we can obtain from the Thomson Database, and it also allows us to capture the depth and breadth of the research question at hand.
Section 3 Data and Data Analysis
The stock market data for this paper are of daily frequency and were extracted from the Thomson Reuters database. The data are organized by industries or sectors, by country and by region. We exploit all three dimensions for the GCC region. A perceptible feature of the data shown in Table 1 is that the number of sectors and the sample sizes vary across countries:
Bahrain (6 sectors, 1698 samples), Kuwait (8 sectors, 2241 samples), Oman (3 sectors, 3128 samples), Qatar (4 sectors, 2515 samples), Saudi Arabia (15 sectors, 967 samples), UAE–Abu Dhabi and UAE–Dubai (9 sectors and 875 samples each), GCC (12 sectors, 1045 samples).
9
Sectors that are common to all are banking, insurance, industry and services.13 Since our primary objective is to examine the synchronicity (or lack thereof) between individual stock sectors and the crude oil market, this feature of the data does not constitute an impediment in our search for a general pattern. The crude oil price (or oil price for short) is the West Texas Intermediate, which is the most widely used in the world. This data sample was adjusted to match the stock data sample of each country/economic bloc. Figure 1 displays the paths of the stock market indices and the oil price for individual GCC countries and for the GCC as a bloc. As can be gleaned from this figure, the two series tend to co-move over time, whether we focus on sectoral or national stock markets. However, nothing at this point can be said about the strength of that synchronicity.
Table 1 about hereFigure 1 about here
We begin the data analysis by computing daily returns as:
rt= ln (Pt /P t−1 ) , (9)
where rt is the daily return of either the stock or the crude oil market, ln is the natural logarithm and Pt is either the stock index or the oil price at time t. We then compute the annualized historical or N-period’s rolling window moving average estimator of the volatility, which corresponds to the product of the square root of the number of trading days and the standard deviation of the window:
σ t=T1 /2 √ 1
N−1∑t=1
N
(r t−r t )2 , (10)
where rt is the average daily return and T is the number of trading days. It is quite a daunting task to arrive at the appropriate window size N because volatility changes over time and more data may lead to more accuracy. Also, while more recent data are more relevant for measuring volatility, the deeper we dig into the past, the less accurate the measure is for forecasting. For this reason, we explore windows of 10 and 50 days to represent, respectively, as close as possible to the period used by most traders and slight distance into the past. There are two shortcomings in using historical instead of GARCH-based dynamic volatility. The first is that historical volatility is indifferent to fluctuations in the series; for example, continuous increases in a stock price can create high volatility on the upside that investors may not be concerned about. The second disadvantage is that it assigns equal weights to all daily returns whether the return is for recent times or from deep in the past. Despite these weaknesses, historical volatility is one of the most used measures of volatility due to its simplicity and the fact that it does not impinge on the estimation of a parametric model (Pindyck, 2004). A debate is still ongoing as to whether volatility based on ARCH models provides forecasts that are superior to volatility based on the simple standard deviation (Suganuma, 2000; Andersen and Bollerslev, 1998; Cumby et al., 1993).14
13 The data span for each of these countries respectively begin on 30 June 2004, 31 March 2004, 1 June 1999, 14 May 2001, 19 April 2007, 27 August 2007 and 1 January 2007, and end on 31 December 2010.14 We use standard GARCH (1, 1) to measure volatility in a follow-up paper. We could not incorporate these results in this paper due to space limitations.
10
The descriptive statistics not reported here show that the average daily return in percentage terms varies as shown below:
from -0.02 (investment) to 0.05 (hotel and tourism) for Bahrain, from -0.05 (investment) to 0.05 (banking) for Kuwait, from 0.0045 (banking and investment) to 0.04 (industry) for Oman, from -0.024 (services) to -0.0032 (banking and finance) for Qatar, from -0.11 (media and publishing) to 0.02 (petrochemical) for Saudi Arabia, from -0.12 (real estate) to 0.03 (industry) for UAE–Abu Dhabi, from -0.22 (utilities) to -0.03 (transportation) for UAE–Dubai.
In comparison to an average daily return on crude oil of 0.03% over the different samples in Table 1, the data suggest that only investments in hotel and tourism stocks in Bahrain, banks in Kuwait and industry in Oman were more profitable than the crude oil market, whereas investment in industry stocks in UAE–Abu Dhabi was as good as investment in crude oil. Hence, a portfolio made of these stocks would be more desirable than any other GCC portfolio of similar risk levels. This finding is good news for the typical risk-averse GCC investor who can freely participate in these markets.
It is customary in the literature to compare the standard deviation of different variables to determine the relative degree of volatility or risk. This measure ranges:
from 0.60% (industry) to 1.14% (commercial banks) with hotels and tourism at 0.65% for Bahrain,
from 1.90% (Kuwaiti companies) to 13.72% (food) with banks at 5.88% for Kuwait, from 1.17% (services) to 1.55% (industry) for Oman, from 1.76% (Qatar exchange) to 2.25% (insurance) for Qatar, from 1.56% (cement) to 2.69% (petrochemical) for Saudi Arabia, from 0.84% (insurance) to 6.89% (energy) for UAE–Abu Dhabi from 1.14% (insurance) to 3.60% (utilities) for UAE–Dubai.
With the average daily oil price volatility hovering around 3%, the crude oil market is less volatile than sectors such as food (Kuwait), energy (UAE–Abu Dhabi) and utility (UAE–Dubai). On the basis of relative risk, the portfolio that emerges for the average daily return analysis also performs quite well. Higher risk with higher return is only confirmed for the industry sector; the remaining stocks in the portfolio have lower risk attached than other stocks within the same market.
The Granger causality and pairwise correlation results between the daily stock market return and oil price return are incorporated in Table 1. We find strong evidence that oil price returns can help forecast stock market returns in most GCC countries and for most sectors. The converse is mostly true for Saudi Arabia.15 Results not presented here show that most sectoral stock returns are positively and highly correlated and significant at the 1% level. In only very few cases could we detect a negative correlation.
15 This finding complements Arouri and Rault’s (2010) findings that were based on weekly and monthly data.
11
The link with the oil price returns, however, is weak, but significant, at the 10% level. The correlation coefficient fluctuates:
between -0.03 (hotel and tourism) and 0.05 (commercial banks) for Bahrain, between -0.03 (banks) and 0.05 (industry) for Kuwait, between 0.08 (industry) and 0.11 (banking and investment) for Oman, between 0.06 (industry) and 0.10 (insurance) for Qatar, between 0.08 (hotel and tourism) and 0.19 (cement) for Saudi Arabia, between 0.03 (banking and finance) and 0.11 (ADX) for UAE–Abu Dhabi, between 0.02 (materials) and 0.14 (DFM), between 0.03 (utilities) and 0.13 (cyclical and non-cyclical goods) for the overall GCC.
These results suggest that a movement in crude oil prices is not a strong signal when it comes to watching fluctuations in sectoral and national stock prices for speculative purposes.
None of the daily return series is normally distributed as per the Jarque–Bera, Shapiro–Wilk and Shapiro–Francia non-normality tests at the 1% significance level. The distributions of returns are negatively skewed and leptokurtic (kurtosis is far above 3 in all cases), meaning that they have both higher peaks and fatter tails than a normal distribution.
Section 4 Empirical Analysis
4.1 The synchronicity results
To determine the degree of synchronicity between oil prices and GCC stock prices, returns and rolling window volatilities were each decomposed into a permanent component or trend and a transitory component or cycle, using the popular HP filter with a smoothing parameter, λ, equal to (90)4 × 1600 = 104,976,000,000 as suggested by Ravn and Uhlig (2002) for daily data. The trend captures long-term returns, while the cycle is associated with market sentiments. We use the cycle definition that expresses the cycle as a share of the actual trend. The cyclical component of volatility is assumed to capture transitory noise whereas the permanent component reflects disturbances to economic fundamentals.
We use a five-step approach to arrive at the synchronicity ratio (SR) for each pairing of the cycles on the basis of Equations (5) and (6). The oil price return (volatility) gap is used as the reference cycle for the nation-wide and sector-wide stock price return (volatility) cycles. First, we count the number of synchronized cycles (+1s) and divergent cycles (-1s), and obtain a total equal to the number of cycles over the years for each pairing with the reference cycle. Second, we compute the proportion of +1s within the total. Third, we produced a count of the proportions of +1s that were greater than 0.50. Fourth, we calculated the SR as the count of proportions of +1s that were greater than 0.50 over the total (+1s and -1s) multiplied by 100 and rounded off to the nearest whole number. Fifth, we assess the degree of synchronicity using the three benchmarks described in the above methodology.
For the multivariate synchronicity measures, we computed the horizontal average of the +1s and -1s stemming from the matching of the reference cycle with the individual cycle at every point in time. This
12
calculation produced a column series of T observations between -1 and +1, where T is the sample size. Positive values indicate a tendency towards synchronization, whereas negative values indicate the opposite. The multivariate SR is computed as the count of the positive averages over the total of all averages (positive and negative). The same benchmarks are used for classification. Unless otherwise specified, the synchronicity results hereafter are expressed in percentage terms.
Tables 2 to 9 display the SR for both the bivariate and the multivariate synchronicity measures based on returns and volatilities. We also explore whether expectations of an oil price change or past disturbances to oil prices carry effects into the future that investors should take into consideration in purchasing stocks. To that effect, the tables also present the synchronicity results documenting the association between lead and lagged oil price return cycles with contemporaneous stock market return (volatility) cycles. At the sectoral level, we find contemporaneous synchronicity with oil price based on returns covers a range of values as follows:
from 49 (commercial banks/investment) to 52 (insurance) for Bahrain, from 47 (Kuwait companies) to 50 (banks/ food) for Kuwait, from 50 (banking and investment) to 51 (services and insurance/industry) for Oman, from 48 (insurance) to 53 (industry) for Qatar, from 44 (cement) to 54 (petrochemicals and retail) for Saudi Arabia, from 47 (energy and real estate) to 52 (healthcare) for UAE–Abu Dhabi, from 43 (real estate) to 52 (consumer staples) for UAE–Dubai, from 46 (real estate) to 53 (non-cyclical goods/utilities) for the entire GCC.
At the country level, the overall indices synchronicity with oil price stands at 50 (Bahrain), 49 (Kuwait), Oman (50), 48 (Qatar), 49 (Saudi Arabia), 46 (UAE–Abu Dhabi) and 45 (UAE–Dubai). Results based on lead and lagged oil price return cycles do not differ much from the contemporaneous synchronicity results, which suggest that there is a mild association between the crude oil and stock markets.
Tables 2 to 9 about here
Contemporaneous volatility synchronicity results based on 10- and 50-day rolling windows are, on average, higher than the return synchronicity. We summarize the results using a bracket system where the first value corresponds to the 10-day volatility and the second value corresponds to the 50-day volatility. The same applies to the associated industries. We find synchronicity as follows:
between (48, 49) (insurance, insurance) and (62, 63) (industry, investment) for Bahrain, between (60, 56) (food, real estate and Kuwait companies) and (64, 63) (investment, food) for
Kuwait, between (60, 57) (services and insurance, industry) and (63, 62) (banking and investments,
banking and investments) for Oman, between (60, 40) (industry and services, services) and (62, 56) (banking and finance, insurance)
for Qatar, between (57, 53) (energy and utilities, energy and utilities) and (78, 73) (petrochemicals,
agriculture and food/cement) for Saudi Arabia,
13
between (42, 27) (insurance, consumer goods) and (66, 53) (real estate, construction) for UAE–Abu Dhabi, between (52, 35) (insurance, insurance) and (69, 64) (financial investment, consumer staples/financial investment/transport) for UAE–Dubai,
between (64, 59) (cyclical goods, energy) to (76, 75) (banking and investment services, basic materials) for GCC as a whole.
At the country level, the synchronicity values are, respectively, (59, 69), (63, 71), (61, 61), (61, 47), (78, 68), (71, 54) and (67, 63) for Bahrain, Kuwait, Oman, Qatar, Saudi Arabia, UAE–Abu Dhabi and UAE–Dubai. A number of insights can be gathered from the results as presented. First, we find evidence that the 10-day volatility association of the cycles is relatively strong, as per our definition, except for Bahrain, for which it is mild. Second, the 50-day volatility synchronicity fluctuates from low (35 in the case of Abu Dhabi’s insurance) to strong (75 in the case of the GCC’s basic materials). Third, the 10-day volatility associations are greater than those of the 50-day volatility, except for Bahrain’s insurance sector. At the country level, the results suggest that volatility synchronicity ranges from mild to strong, and when the two measures are compared in terms of their relative magnitude, the outcome is mixed. For some countries (Bahrain and Kuwait), the 50-day volatility dominates; for other countries of the group, it is the 10-day volatility that shows more associations. For Oman, however, there is no difference. The overall results do not differ much when we focus on the synchronicity between the contemporaneous stock market volatility cycle and the oil price return volatility cycle during period t+1 or t-1. Nonetheless, we find a clear dominance of the 10-day volatility over the 50-day volatility for Qatar, UAE–Abu Dhabi, UAE–Dubai and the GCC as a whole.
Contrary to the common belief that crude oil is the main driver of the GCC economies, this paper finds that the linkage is not that strong for most sectors and for most countries. However, Saudi Arabia, which is understandably the largest oil producer and the largest country of the group, relies more heavily on oil revenues to foment growth in other sectors. This feature is quite evident when we peruse the 10-day volatility results: Saudi Arabia sectoral stock market synchronicity is, on average, larger than that of any other country and of the GCC as a whole. The decoupling of the non-oil sector from the oil sector that has taken place in most GCC countries may be the reason underlying the extent of association of the cycles we have observed (see Basher, 2010). Also, as Balli et al. (2009) have argued, the repatriation of capital to the Middle East after September 11 may be a contributing factor to economic diversification.
The dynamic factor results
The synchronicity results have thus far shown that there is co-movement between crude oil and stock markets. However, it could also be pure luck. To overcome the potential problems of spurious synchronicity, we reformulate the research question with a twist by asking whether there is a common underlying factor driving sectoral stock markets in each GCC country, and, should this be so, whether oil price return/volatility can explain such a factor. Tables 10, 11 and 12 show the dynamic factor results for the returns, 10-day volatility and 50-day volatility, respectively. We only report and discuss coefficients that are statistically significant. Table 9 presents the parameter estimates for Model 3 using sectoral
14
stock returns for each country, the entire GCC and national stock returns.16 We find the idiosyncratic autoregressive coefficient, ai, is significant for investment in Bahrain; all sectors in Oman; all sectors except services in Qatar; consumer goods only in UAE–Abu Dhabi; bank, consumer staples and telecommunications in UAE–Dubai; building and construction, and energy and utility in Saudi Arabia; cyclical and non-cyclical goods in the GCC. At the national level, ai is significant for Saudi Arabia and UAE–Abu Dhabi. This indicates that for each country/bloc/group, there are stock market return dynamics that are not fully captured by the dynamics of the common factor but rather by their autoregressive components or own dynamics. The factor loadings, bi, which capture the sensitivity of individual stock market returns to the common factor, are statistically significant for most sectors within countries, the GCC-wide sectors, and national stock markets. The only exceptions are for industry in Bahrain, insurance in UAE–Abu Dhabi, and consumer staples and materials in UAE–Dubai. Thus, there is evidence of a common factor driving the growth dynamics of stock market returns in the GCC. The degree of persistence of this common factor, however, varies across countries, as captured by the value of d.
Tables 10 to 12 about here
We collapse the daily data into quarterly data to plot the estimated common factors (Figure 2). As can be gleaned from this figure, the common factors suggest that sectoral and national stock markets shared the recent major financial crisis where the stock market crash of 2008 lasted until 2009, a span of 17 months. UAE–Dubai is the only stock market that showed a spike during that period, but it fell dramatically in 2009 when investors became concerned that Dubai might not be able to meet its debt requirements in November of that year. For as long as the sample period allows, the common factor is able to show that sectoral markets in the GCC were affected by the dotcom burst in early 2000s, the September 11 attack in 2001, the war in Iraq starting in 2003, and heightened nuclear tensions between Western nations and Iran in 2005–2006, and the stock market crash of 2005–2006.
Figure 2 about here
Does a common factor underlie the volatility of stock market returns in the GCC countries? We answer this question by estimating similar dynamic factor models. One impediment encountered, however, is that the optimization algorithm fails to converge for some model specifications. Since our primary objective is not to find a common factor that embraces all GCC sectors, we report the model that works for each country but we refrain from making cross-country comparisons. For the 10-day rolling volatility series, we find that Model 1, with a common factor that follows a second-order autoregressive process, works for all countries, whereas for the 50-day rolling volatility, the same model works for most markets/groups except Kuwait, Oman and Qatar.
16 Although we were able to estimate all four types of models for the return, due to space constraints, we only presents resulting pertaining to the estimation of Model 3, which is equivalent to Model 4 when α=0. These are the most complete models of all. However, when it comes to assessing the importance of oil price returns, we use common factors from all four models. Dynamic factor results based on Models 1, 2, and 4 are available upon request. Kuwait was left out in the estimation of most models because of non-convergence of the algorithm.
15
Table 10 shows the results pertaining to the DF model using the 10-day volatility series. Save for Dubai’s financial investment sector, the common factor coefficient estimates are statistically significant at the 5% level for all sectors and main indices. The common factor is quite persistent, as indicated by the sum of d1 and d2, and shows signs of explosion in certain cases in response to shocks. These features are also evident in Table 11 for the common factors that emerge from the 50-day volatility series. We find the slope coefficients for the common factor to be negative but statistically significant for all sectors in Kuwait.17 Therefore, irrespective of whether one uses a 10- or 50-day horizon, there is a common unobservable variable influencing the evolution of the return volatility series.18
Given the finding that GCC stock markets are all driven by a common factor, the interesting question is to ask whether crude oil price returns/volatility can explain such a factor. We tackle this question by estimating Eq. (8) with robust standard errors while including contemporaneous values and up to eight lags, as per the general-to-specific approach. Tables 13, 14 and 15 report the results. Table 13 shows that while contemporaneous oil price returns have no effect on the common factor, the lagged effects are statistically significant for most models. We find statistically significant negative impacts when the common factor is extracted from Model 1 for Bahrain; Models 2, 3 and 4 for UAE–Dubai; and Model 1 for UAE–Abu Dhabi. The R-squares are quite small, varying from 1% to 11%, thereby indicating that of all the variables underlying the common dynamic of stock markets in the GCC, oil price return is one of them but not the principal driver.
Tables 13 to 15 about here
Table 14 presents the regression results linking the common factors to the 10-day rolling volatility in oil price returns. For common factors originating from Models 1 and 3 only, the contemporaneous effects, as well as past effects after eight days, are positive and statistically significant. The only exception is for Model 3, in the case of Oman, where the effects are negative and statistically significant. The R-squares fluctuate from 62% to 79% with two outliers: Kuwait (Model 1: 7%) and GCC national indices (Model 3: 10%). When we turn to the impact of the 50-day rolling volatility (Table 15), we find the contemporaneous effects to be significant only for Qatar, Saudi Arabia, UAE–Dubai, the GCC-wide sectors and the national indices. There are no impacts after the eighth lag, except for the GCC-wide sectors when the common factor is taken from Model 4. The R-squares lie between 54% and 84% with two exceptions: GCC-wide sectors and GCC national indices (Model 4: 15% each). These results suggest that the volatility of oil price returns is the main driver of the common factor observed for each GCC stock market.19 17 With respect to the negative signs, the Technical Note of the Time Series Manual of Stata 11 p. 93 states the following: “The signs of the coefficients on the unobserved factors are not identified. They are not identified because we can multiply the unobserved factors and the coefficients on the unobserved factors by negative one without changing the log likelihood or any of the model predictions. Altering either the starting values for the maximization process, the maximization technique used, or the platform on which the command is run can cause the signs of the estimated coefficients on the unobserved factors to change. Changes in the signs of the estimated coefficients on the unobserved factors do not alter the implications of the model or the model predictions.”18 Our results are in line with Rao’s (2008) findings that volatility in the GCC markets is quite persistent. However, we could not assert Rao’s claim that the bulk of it originates from the domestic market because we did not incorporate foreign market volatilities in our study. This is a matter for further research. 19 It is important to note that the common factors used as dependent variables are related to stock price returns not stock price return volatility, because we could not find a single model that works for all countries or groupings. Also, since we report only coefficient that are statistically significant, models that are not listed in Tables 13 and 14 did not deliver such coefficients when we regress their common factors on either the oil price return or volatility.
16
In Table 16, we display the results of the investigation into a common component underlying the industry-level common factors across the GCC countries, and its association with oil price returns and volatility.20 We find, irrespective of the model estimated, that the common component is positive and statistically significant in each country’s common factor equation and is also quite persistent. This layer of the analysis thus suggests the existence of an overall common driver of the GCC stock markets that is linked to national and sectoral markets dynamics despite their inherent differences.
Table 16 about here
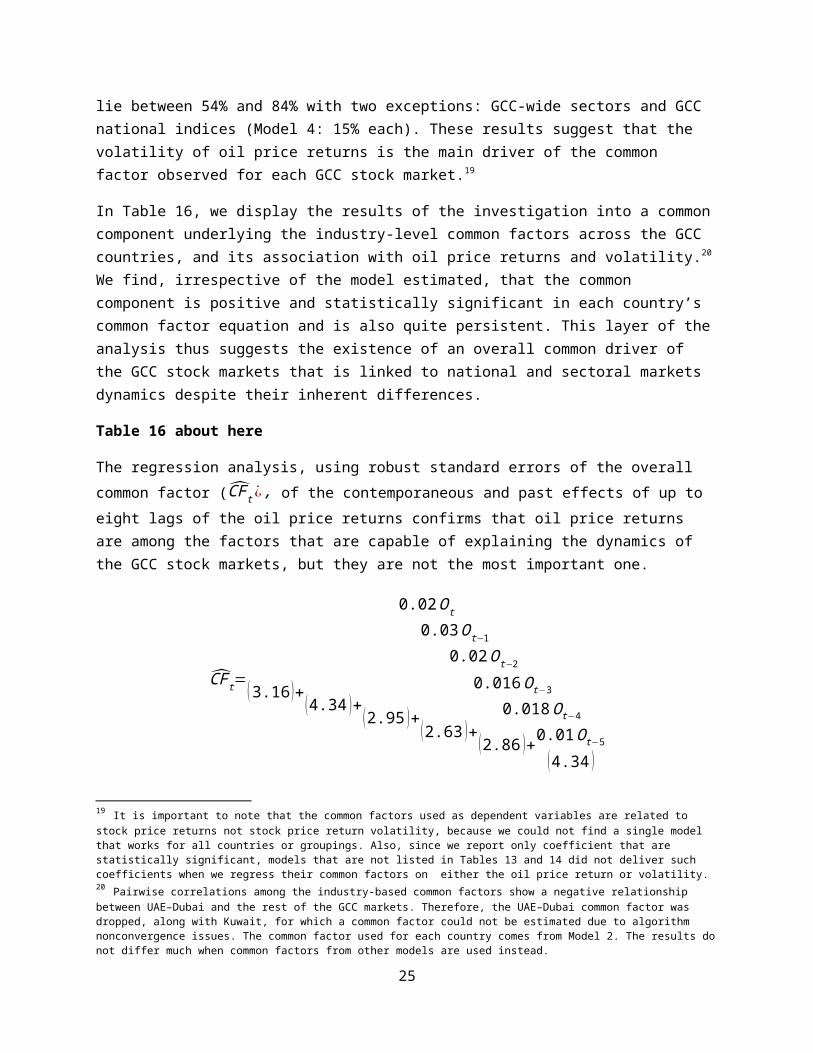
The regression analysis, using robust standard errors of the overall common factor (CFt ¿ , of the contemporaneous and past effects of up to eight lags of the oil price returns confirms that oil price returns are among the factors that are capable of explaining the dynamics of the GCC stock markets, but they are not the most important one.
CFt=
0.02Ot
(3.16 )+
0.03Ot−1
(4.34 )+
0.02Ot−2
(2.95 )+
0.016Ot−3
(2.63 )+0.018Ot−4
(2.86 )+0.01Ot−5
(4.34 )
R2=0.14 ,RMSE=0.43 ,∧t statistics are∈parentheses(11)
Results based on the historical volatility of 10- and 50-day rolling windows oil price did not produce any statistically significant coefficients, thereby indicating that oil price volatility, though quite important in explaining the dynamics of industry-level common factors, does not influence the dynamics of the common component of these factors.
Conclusion
In this paper, we had the objective of documenting the degree of synchronicity between crude oil and stock markets in the GCC in line with the commonly held view that oil constitutes the backbone of these economies. We use the bivariate and multivariate synchronicity measures proposed by Mink et al. (2007) and daily data on sectoral, GCC-wide sectoral and national stock market data. The results show that cyclical fluctuations in oil prices and stock market returns are mildly synchronized (between 40% and 60%), whereas the fluctuations of volatility fall between mild and strong (above 60%). These results suggest that shocks to oil price volatility matter more than shocks to oil price returns for the GCC stock markets. Upon this finding, we reformulate the research question with a twist by asking if we were to leave oil price return and volatility in standby, would we be able to find an underlying common factor
20 Pairwise correlations among the industry-based common factors show a negative relationship between UAE–Dubai and the rest of the GCC markets. Therefore, the UAE–Dubai common factor was dropped, along with Kuwait, for which a common factor could not be estimated due to algorithm nonconvergence issues. The common factor used for each country comes from Model 2. The results do not differ much when common factors from other models are used instead.
17
driving the dynamics of the different GCC stock market groupings and – if and when we find that common factor – we can then ask whether its dynamics can be explained by oil price return and volatility?
We have shown that a distinct common factor underlyies sectoral stock markets within each GCC country, and the GCC-wide and GCC national stock markets. Shocks to oil price return explain the dynamics of each common factor, with no clear evidence supporting the view that oil price is the main driver of the dynamics of the stock market for any of the groupings. Shocks inducing changes in oil price volatility, by contrast, are quite important. Further research into the underlying common component of the industry-level common factors confirm the existence of such an overall common driver, which is positively correlated with the common factors of the GCC-wide sectoral and the GCC national stock markets. For this unique industry-level common factor, representative of all sectors in the GCC, although the importance of shocks to oil price return does not change, volatility no longer carries any explanatory power.
Further research
This paper has made a valuable contribution to the literature by advancing our understanding of the linkage between crude oil and the GCC stock markets. A number of refinements, however, are worth exploring in the future. The first is the use of dynamic volatility decomposition such as CGARCH instead of rolling-windows historical volatility. The second is the use of alternative measures of synchronicity like the ones used by Kalemli-Ozcan et al. (2011), which was also laid out in the methodology section. The third is to consider stock prices at the firm level, and the fourth is to expand the research to all other oil-exporting countries.
18
References
Abraham A., F. J. Seyyed, and Ali Al-Elg, (2001). Analysis of diversification benefits of investing in the emerging gulf stock markets. Managerial Finance, 27 (10/11): 47–57.
Abraham A., J. Fazal, S. Seyyed, and A. Alsakran (2002). Testing the random walk behavior and efficiency of the Gulf stock markets. Financial Review, 37 (3): 469–480.
Abu Zarour, B. (2006). Wild oil prices, but brave stock markets! The case of GCC stock markets. Operational Research: An International Journal 6: 145–162.
Al-Khazali, O., A. Darrat, and M. Saad (2006). Inter-regional integration of the GCC stock markets: has market liberalization made a difference? Applied Financial Economics, 16 (17): 1265–1272.
Al-Khazali, O., D. Ding, and C.S. Pyun (2007). A new variance ratio test of random walk in emerging markets: a revisit. Financial Review, 42: 302–317.
Aleisa, E., S. Dibooglu, and D. Hammoudeh (2003). Relationships among U.S. oil prices and oil industry stock indices. International Review of Economics and Finance, 15: 1–29.
Andersen, T. and T. Bollerslev (1998). Answering the skeptics: yes, standard volatility models do provide accurate forecasts. International Economic Review, 39: 885–905.
Arouri, M. and J. Fouquau (2009). On the short-term influence of oil price changes on stock markets in gcc countries: linear and nonlinear analyses. Economics Bulletin, AccessEcon, 29 (2): 795–804.
Arouri, M., and C. Rault (2010). Oil prices and stock markets: what drives what in the Gulf Cooperation Council? CESifo Working Paper Number 460, Munich, Germany.
Arouri, M., M. Bellalah, and D. Nguyen (2011). Further evidence on the responses of stock prices in GCC countries to oil price shocks. International Journal of Business 16: 89–103.
Arouri, M.E.H., A. Lahiani, and D. K. Nguyen (2011) Return and volatility transmission between world oil prices and stock markets of the GCC countries. Economic Modelling, 28 (4): 1815–1825.
Artis, M., H-M. Krolzig, and J. Toro (2004). “The European Business Cycle.” Oxford Economic Papers, 56: 1–44.
Balli, F., R. Jean Louis and M.A. Osman, (2009). International portfolio inflows to GCC markets. are there any general patterns? Review of Middle East Economics and Finance, 5 (2): 1-23.
Basher, S. A. (2010). Has the non-oil sector decoupled from oil sector? A case study of Gulf Cooperation Council countries. http://www.syedbasher.org/wp/decoupling.pdf, accessed April 15, 2011.
Basher, S. A., and P. Sadorsky (2006). Oil price risk and emerging stock markets. Global Finance Journal, 17: 224–251.
19
Baxter, M., and M. Kouparitsas (2005). Determinants of business cycle co-movement: a robust analysis. Journal of Monetary Economics, 52(1): 113–157.
Baxter, M., and R. G. King (1999). Measuring business cycles: approximate band-pass filters for economic time-series. Review of Economics and Statistics, 81(4): 575–593.
Beveridge, S. and C. R. Nelson (1981). A new approach to decomposition of economic time series into permanent and transitory components with particular attention to measurement of the business cycle. Journal of Monetary Economics 7 (1981)P: 151–174.
Bhar, R. and S. Hamori (2004). Empirical characteristics of the permanent and transitory components of stock return: analysis in a Markov switching heteroscedasticity framework. Economics Letters, 82 (2004): 157–165.
Bley, J., and K. H. Chen (2006). Gulf Cooperation Council (GCC) stock markets: the dawn of a new era. Global Finance Journal, 17: 75–91.
Bley, J. (2011). Are GCC stock markets predictable? Emerging Markets Review, 12 (3): 217–237.
Calvo,G., L. Leiderman and C. Reinhart (1993). Capital flows and the real exchange rate appreciation in Latin America: the role of external factors. IMF Staff Papers 40, March. (Washington: International Monetary Fund)
Chen, N. F., R. Roll and S. A. Ross (1986). Economic forces and the stock market. Journal of Business, 59: 383–403.
Cumby, R., S. Figlewski and J. Hasbrouck (1993). Forecasting volatility and correlations with EGARCH models. Journal of Derivatives, Winter: 51–63.
Cunado, J., F. Perez de Garcia (2005). Oil prices, economic activity and inflation: evidence for some Asian countries. The Quarterly Review of Economics and Finance 45(1): 65–83.
Darrat, A. F., K. Elkhal, and S. R. Hakim (2000). On the integration of emerging stock markets in the Middle East. Journal of Economic Development, 25 (2): 119 - 129, December .
Dornbusch, Rudiger, Y. C. Park and S. Claessens (2000). Contagion: How it spreads and how it can be stopped. World Bank Research Observer, 15 (2): 177–197.
Driesprong, G., B. Jacobsen and B. Maat (2008). Striking oil: Another puzzle? Journal of Financial Economics, 89: 307–327.
Dungey, M., R. Fry, B. González-Hermosillo and V. Martin (2005). Empirical modeling of contagion: a review of methodologies. Quantitative Finance, 5(1): 9–24.
——— (2006). Contagion in international bond markets during the Russian and LTCM crises. Journal of Financial Stability, 2(1): 1–27.
20
Elango, R. and M. I. Hussein (2008). An empirical analysis on the weak-form efficiency of the GCC markets applying selected statistical tests. International Review of Business Research Papers, 4 (1): 140–159.
El Sharif, I., D. Brown, B. Burton, B. Nixon and A. Russell (2005). Evidence on the nature and extent of the relationship between oil prices and stock values in the UK. Energy Economics, 27: 819–830.
El-Wassal, K. (2005). Stock market growth: an analysis of co-integration and causality. Economic Issues, 10: 37–58.
Engle, R. F. , and C. W. J. Granger (1987). Co-integration and error correction: representation, estimation and testing. Econometrica 55: 251–276.
Engle, R. F. , and J. Issler (1995). Common trends and common cycles in Latin America. Revista Brasileira de Economia, 47: 149–176.
Engle, R. F., and S. Kozicki (1993). Testing for common features. Journal of Business and Economic Statistics, 11 (1993): 369–380.
Faff, R., and T. Brailsford (1999). Oil price risk and the Australian stock market. Journal of Energy Finance and Development, 4: 69–87.
Fama, E. F., and K. R. French (1993). Common risk factors in the returns on stocks and bonds. Journal of Financial Economics, 33: 3–56.
Fayyad, A., and K. Daly (2011). The impact of oil price shocks on stock market returns: comparing GCC countries with the UK and USA. Emerging Markets Review, 12: 61–78.
Ferson, W., and C. Harvey (1995). Predictability and time-varying risk in world stock markets. Research in Finance, 13: 25-88.
Favero, C.A. and F. Giavazzi (2002). Is the international propagation of financial shocks non-linear? Evidence from the ERM. Journal of International Economics, 51: 231–246.
Forbes, K. and R. Rigobon (2001) Measuring contagion: conceptual and empirical issues. In Claessens, S. and Forbes, K. (eds.), International Financial Contagion. (: Kluwer Academic Publishers), Springer, Ch. 3: 43-66 .
Forbes, K. and R. Rigobon (2002). No contagion, only interdependence: measuring stock market co-movements. Journal of Finance, 57(5):. 2223–2261.
Geweke, J. (1977). The dynamic factor analysis of economic time series. In Aigner, D. J. and Goldberger, A. S. (eds.) Latent Variables in Socio-Economic Models (Amsterdam: North-Holland) 365–383.
Giannone, D., M. Lenza and L. Reichlin (2008). Explaining the great moderation: it is not the shocks. Journal of the European Economic Association, 6(2–3): 621–633.
21
Girard, E., and E. Ferreira (2004). Long term stochastic trends in MENA capital markets. The International Business and Economics Research Journal, 3 (2):. 23–45.
Girard, E., M. Omran, and T. Zaher (2003). On risk and return in MENA capital markets. International Journal of Business, 8: 285–314.
Glick, R. and A. K. Rose (1999). Contagion and trade: why are currency crises regional? Journal of International Money and Finance, 18: 603–617.
Hamao, Y. (1989). An empirical examination of the arbitrage pricing theory: using Japanese data. Japan and the World Economy, 1: 45–61.
Hamilton, J. D. (1983). Oil and macro-economy since World War II. Journal of Political Economy, 91: 228–248.
Hamilton, J. D. (1996). This is what happened to the oil price-macroeconomy relationship. Journal of Monetary Economics, 38: 215–220.
Hamilton, J. D. (2003). What is an oil shock? Journal of Econometrics, 113: 363–398.
Hamilton, J. D., and A. M. Herrera (2004). Oil shocks and aggregate macroeconomic behavior: The role of monetary policy. Journal of Money, Credit and Banking, 36: 751–782.
Hammoudeh, S., and E. Aleisa (2004). Dynamic relationship among GCC stock markets and NYMEX oil futures. Contemporary Economic Policy, 22: 250–269.
Hammoudeh, S., and K. Choi (2006). Behavior of GCC stock markets and impacts of US oil and financial markets. Research in International Business and Finance, 20: 22–44.
Hammoudeh, S., and H. Li, (2005). Oil sensitivity and systematic risk in oil-sensitive stock indices. Journal of Economics and Business, 57: 1–21.
Harvey, C. R. (1995a). Predictable risk and returns in emerging markets. Review of Financial Studies, 8: 773–816.
Harvey, C. R. (1995b). The risk exposure of emerging markets. World Bank Economic Review, 9: 19--50.
Hernandez, L., P. Mellado and R. Valdés (2001). Determinants of private capital flows in the 1970s and 1990s: is there evidence of contagion? Working Paper 64. (Washington: International Monetary Fund)
Hodrick, R. J., and E. C. Prescott (1997). Postwar U.S. business cycles: an empirical investigation. Journal of Money, Credit, and Banking, 29 (1): 1–16.
Huang, R.,R. Masulis and H. Stoll (1996). Energy, shocks and financial market. Journal of Futures Markets, 16: 1–27.
22
Imbs, J. (2006). The real effects of financial integration. Journal of International Economics, 68(2): 296–324.
Johansen, S. (1988). Statistical analysis of cointegration vectors. Journal of Economic Dynamics and Control, 12: 231–254.
Johansen, S. (1991). Estimation and hypothesis testing of cointegrating vectors in Gaussian autoregression models. Econometrica, 59: 1551–1580.
Jones, C., and G.Kaul (1996). Oil and the stock markets. Journal of Finance, 51: 463–491.
Kalemli-Ozcan, S., E. Papaioannou, and J. L. Peydro (2011) Financial regulation, financial globalization and the synchronization of economic activity. NBER Working Paper 14887, under revision for Journal of Finance.
Kaneko, T., and B. S. Lee (1995). Relative importance of economic factors in the U.S. and Japanese stock markets. Journal of the Japanese and International Economies, 9: 290–307.
Kilian, L. (2008a). The economic effects of energy price shocks. Journal of Economic Literature, 46: 871–1009.
Kilian, L. (2008b). Exogenous oil supply shocks: how big are they and how much do they matter for the U.S. economy? Review of Economics and Statistics, 90: 216–240.
Kilian, L. (2009). Not all oil price shocks are alike: disentangling demand and supply shocks in the crude oil market. American Economic Review, 99: 1053–1069.
Kilian, L., and C. Park (2009). The impact of oil prices shocks and the U.S. stock market. International Economic Review, 50: 1267–1287.
Kim, C.-J., and M.-J. Kim (1996). Transient fads and the crash of ’87. Journal of Applied Econometrics, 11: 41–58.
King, M., E. Sentana and S. Wadhwani (1994). Volatility and links between national stock markets. Econometrica, 62: 901–933.
Krolzig, H.-M. (1997a). Markov-Switching Vector Autoregressions: Modelling, Statistical Inference, and Application to Business Cycle Analysis. Springer-Verlag.
Krolzig, Hans-Martin (1997b). International business cycles: regime shifts in the stochastic process of economic growth. Applied Economics Discussion Paper 194. (Oxford, UK: Oxford University Press)
Krolzig, H.-M. (2005). MSVAR 1.32 for OX 3.4. http://www.economics.ox.ac.uk/research/kr, Accessed January 15, 2006.
Krolzig, H-M and M. Sensier (2000). A disaggregated Markov-switching model of the business cycle in UK manufacturing. The Manchester School, 68(4): 442–460.
23
Maghyereh, A., A. Al-Kandari (2007). Oil prices and stock markets in GCC countries: new evidence from nonlinear cointegration analysis. Managerial Finance, 33 (7): 449–460.
Masson, P. (1999a). Contagion: macroeconomic models with multiple equilibria. Journal of International Money and Finance, 18: 587–602.
Masson, P. (1999b). Contagion: monsoonal effects, spillovers, and jumps between multiple equilibria. In Agenor, P.R., Miller, M., Vines, D. and Weber, A. (eds.), The Asian Financial Crisis: Causes, Contagion and Consequences (Cambridge ,UK: Cambridge University Press).
Masson, P. (1999c). Multiple equilibria, contagion and the emerging market crises. IMF Working Paper 99/164. (Washington: International Monetary Fund).
Mink, M., J. Jacobs and J. de Haan (2007). Measuring synchronicity and comovement of business cycles with an application to the Euro area. CESifo Working Paper 2112, Munich, Germany.
Mohanty, S., and M. Nandha (2011). On oil risk exposure: the case of the U.S. oil and gas sector. Financial Review, 46: 165–191.
Mohanty, S. K., M. Nandha, A. Q. Turkistani and M. Y. Alaitani (2011). Oil price movements and stock market returns: Evidence from Gulf Cooperation Council (GCC) countries. Global Finance Journal (2011), doi:10.1016/j.gfj.2011.05.004.
Morgan, D. P., Rime, B., and P. Strahan (2004). Bank integration and state business cycles. Quarterly Journal of Economics, 119(3): 1555–1585.
Nandha, M., and R. Faff (2008). Does oil move stock prices? A global view. Energy Economics, 30: 986–997.
Omran, M., and L. Gunduz (2001). Stochastic trends and stock prices in emerging markets: the case of Middle East and North Africa region. Istanbul Stock Exchange Review, 5 (2001): 3–16.
Papapetrou, E. (2001). Oil price shocks, stock market, economic activity and employment in Greece. Energy Economics, 23: 511–32.
Pindyck, R. S. (2004). Volatility in natural gas and oil markets. The Journal of Energy and Development, 30 (1): 1 - 20
Rao, A. (2008). Analysis of volatility persistence in Middle East emerging stock markets. Studies in Economics and Finance, 25: 93–111.
Rao DN, and K. Shankaraiah (2003). Stock market efficiency and strategies for developing GCC financial markets: a case study of the Bahrain stmck Market. The Arab Bank Review, 5(2): 16–21.
Ravichandran, K., and K. A. Alkhathlan (2010). Impact of oil prices on GCC stock market. Research in Applied Economics, MacroThink Institute, 2 (1): 1 - 12 .
24
Ravn, M. O., and H. Uhlig (2002). On adjusting the Hodrick–Prescott filter for the frequency of observations. The Review of Economics and Statistics, 84 (2): 371–375.
Sadorsky, P. (1999). Oil price shocks and stock market activity. Energy Economics, 21: 449–469.
Sadorsky, P. (2001). Risk factors in stock returns of Canadian oil and gas companies. Energy Economics, 23: 17–28.
Sadorsky, P. (2003). The macroeconomic determinants of technology stock price volatility. Review of. Financial Economics, 12: 191–205.
Sargent, T. J. and C. A. Sims (1977). Business cycle modelling without pretending to have too much a priori economic theory. In Cristopher A. Sims (ed.) New Methods in Business Research (Minneapolis: Federal Reserve Bank of Minneapolis).
Sharma, E., 2005. On the non-normality of GCC stock markets. Journal of Applied Corporate Finance, (July Issue) : 51–58.
STATA 11, Time Series Manual, 2011,p.93.
Stock, J.H. and M. Watson (1988). Testing for common trends. Journal of the American Statistical Association, 83: 1097–1107.
--- (1989). New indexes of coincident and leading economic indicators. In Blanchard, O. J. and Fischer, S. (eds) NBER Macroeconomics Annual 1989 Vol. 4. pp 351–394. (Cambridge, MA: MIT Press).
--- (1991). A probability model of the coincident economic indicators. In Lahiri, K. and Moore, G. H. (eds) Leading Economic Indicators: New Approaches and Forecasting Records. pp 63–89. (Cambridge, UK: Cambridge University Press).
Suganuma, R. (2000). Reality Check for Volatility Models. Working Paper 0508. (San Diego: University of California at San Diego).
Suliman, O. (2011). The large country effect, contagion and spillover effects in the GCC. Applied Economic Letters, 18 (3): 285–294.
Vahid, F. and R. F. Engle (1993). Common trends and common cycles. Journal of Applied Econometrics, 8: 341–360.
Van Rijckeghem, C. and B. Weder (2003). Spillovers through banking centers: a panel data analysis of bank flows. Journal of International Money and Finance, 22: 483–509.
Watson, M. W. and R. F. Engle (1983). Alternative algorithms for the estimation of dynamic factors, MIMIC, and varying coefficient regression models. Journal of Econometrics, 23: 385–400.
25
![[XLS]Load Reduction Estimating Workbook - Ohio …water.ohiodnr.gov/portals/soilwater/data/xls/Load... · Web viewOil/Grit Separator storm sewers. Feedlots Feedlot Pollution Reduction](https://img.pdfslide.net/doc/110x75/5b5e17937f8b9a310a8bbb8c/xlsload-reduction-estimating-workbook-ohio-water-web-viewoilgrit-separator.jpg)