Embed Size (px)
Citation preview
WEBINAR: UNENTDECKTER KAUKASUS
AußenwirtschaftsCenter Istanbul & Moskauzusammen mit dem Wiener Institut für Internationale Wirtschaftsvergleiche
11:00 Uhr MEZ | 20. Februar 2018
Wiener Institut für
Internationale
Wirtschaftsvergleiche
The Vienna Institute for
International Economic
Studies
www.wiiw.ac.at
Webinar WKÖ-wiiw
20 February 2017
Southern Caucasus: Connectivity, Similarity and
Heterogeneity of Armenia, Azerbaidjan and Georgia
Peter Havlik
The Vienna Institute for International Economic Studies (wiiw)
3
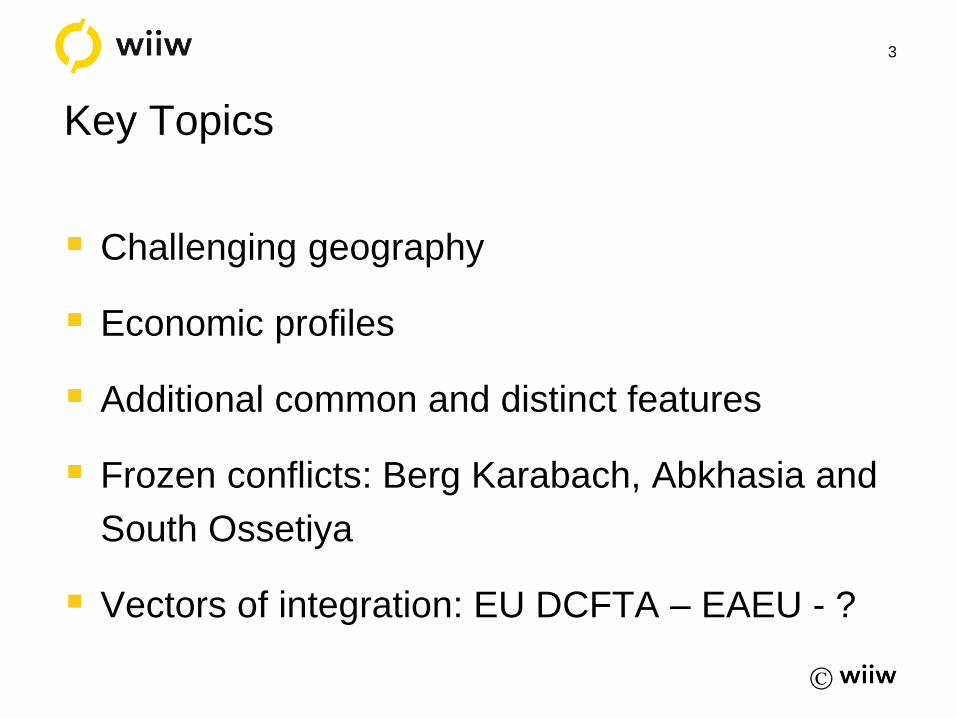
Challenging geography
Economic profiles
Additional common and distinct features
Frozen conflicts: Berg Karabach, Abkhasia and
South Ossetiya
Vectors of integration: EU DCFTA – EAEU - ?
Key Topics
4
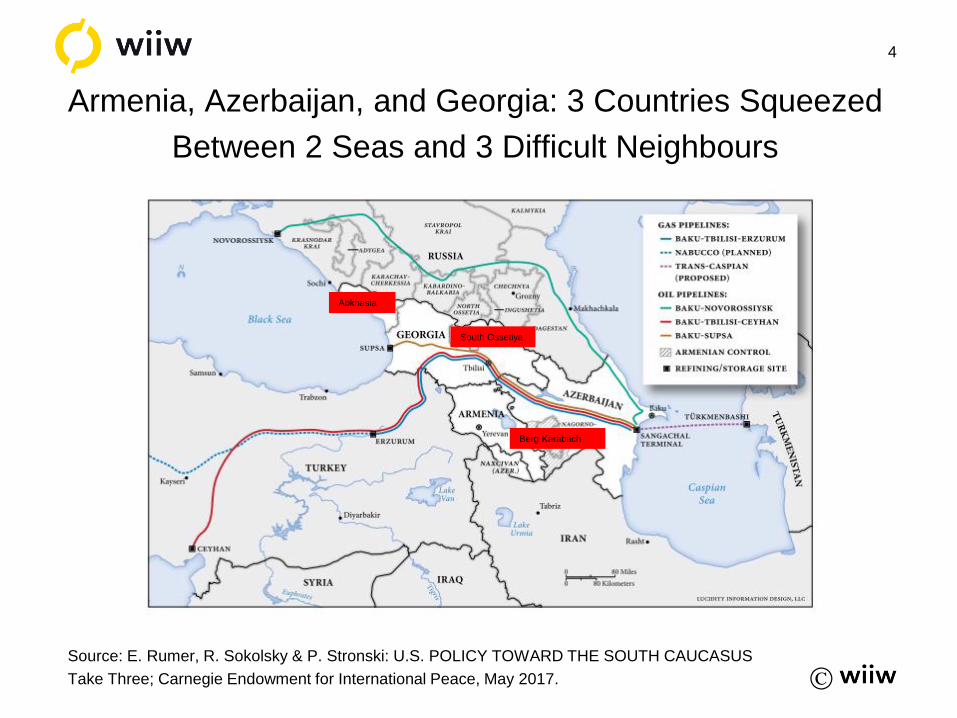
Source: E. Rumer, R. Sokolsky & P. Stronski: U.S. POLICY TOWARD THE SOUTH CAUCASUS
Take Three; Carnegie Endowment for International Peace, May 2017.
Armenia, Azerbaijan, and Georgia: 3 Countries Squeezed
Between 2 Seas and 3 Difficult Neighbours
Abkhasia
South Ossetiya
Berg Karabacha
5
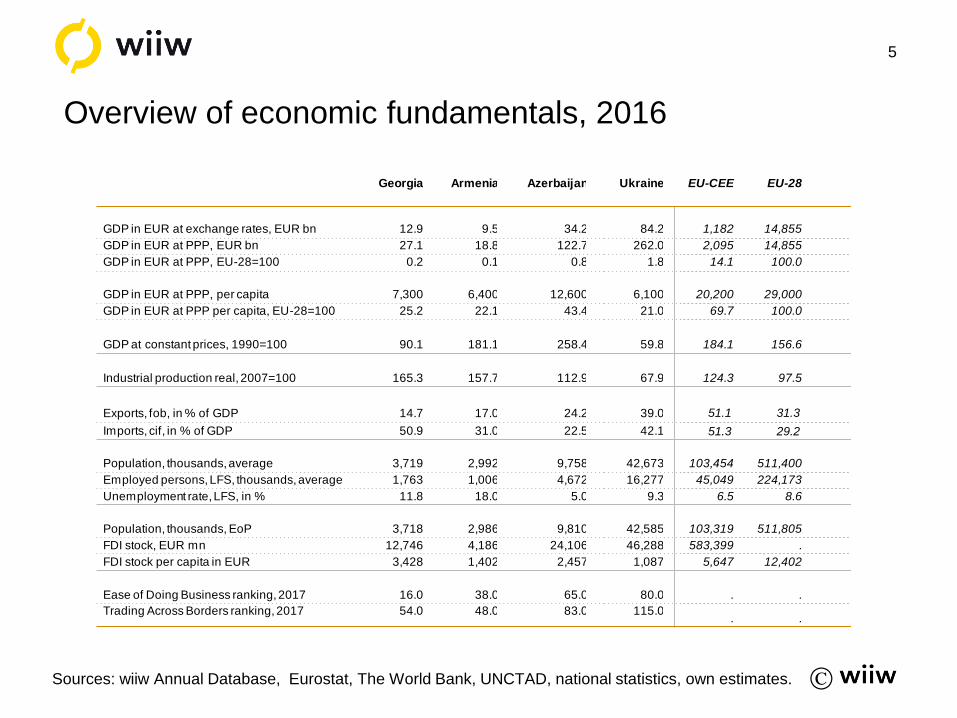
Sources: wiiw Annual Database, Eurostat, The World Bank, UNCTAD, national statistics, own estimates.
Overview of economic fundamentals, 2016
Georgia Armenia Azerbaijan Ukraine1) EU-CEE EU-28
GDP in EUR at exchange rates, EUR bn 12.9 9.5 34.2 84.2 1,182 14,855
GDP in EUR at PPP, EUR bn 27.1 18.8 122.7 262.0 2,095 14,855
GDP in EUR at PPP, EU-28=100 0.2 0.1 0.8 1.8 14.1 100.0
GDP in EUR at PPP, per capita 7,300 6,400 12,600 6,100 20,200 29,000
GDP in EUR at PPP per capita, EU-28=100 25.2 22.1 43.4 21.0 69.7 100.0
GDP at constant prices, 1990=100 90.1 181.1 258.4 59.8 184.1 156.6
Industrial production real, 2007=100 165.3 157.7 112.9 67.9 124.3 97.5
Exports, fob, in % of GDP 14.7 17.0 24.2 39.0 . .
Imports, cif, in % of GDP 50.9 31.0 22.5 42.1 . .
Population, thousands, average 3,719 2,992 9,758 42,673 103,454 511,400
Employed persons, LFS, thousands, average 1,763 1,006 4,672 16,277 45,049 224,173
Unemployment rate, LFS, in % 11.8 18.0 5.0 9.3 6.5 8.6
Population, thousands, EoP 3,718 2,986 9,810 42,585 103,319 511,805
FDI stock, EUR mn 12,746 4,186 24,106 46,288 583,399 .
FDI stock per capita in EUR 3,428 1,402 2,457 1,087 5,647 12,402
Ease of Doing Business ranking, 2017 16.0 38.0 65.0 80.0 . .
Trading Across Borders ranking, 2017 54.0 48.0 83.0 115.0. .
51.1 31.3
51.3 29.2
Wiener Institut für
Internationale
Wirtschaftsvergleiche
The Vienna Institute for
International Economic
Studies
www.wiiw.ac.at
Thank you for your attention!
You can visit us at:
www.wiiw.ac.at
ERKUNDEN SIE ARMENIEN!
ARMENIENS WIRTSCHAFT – CHANCEN UND RISIKEN FÜR ÖSTERREICHISCHE UNTERNEHMEN
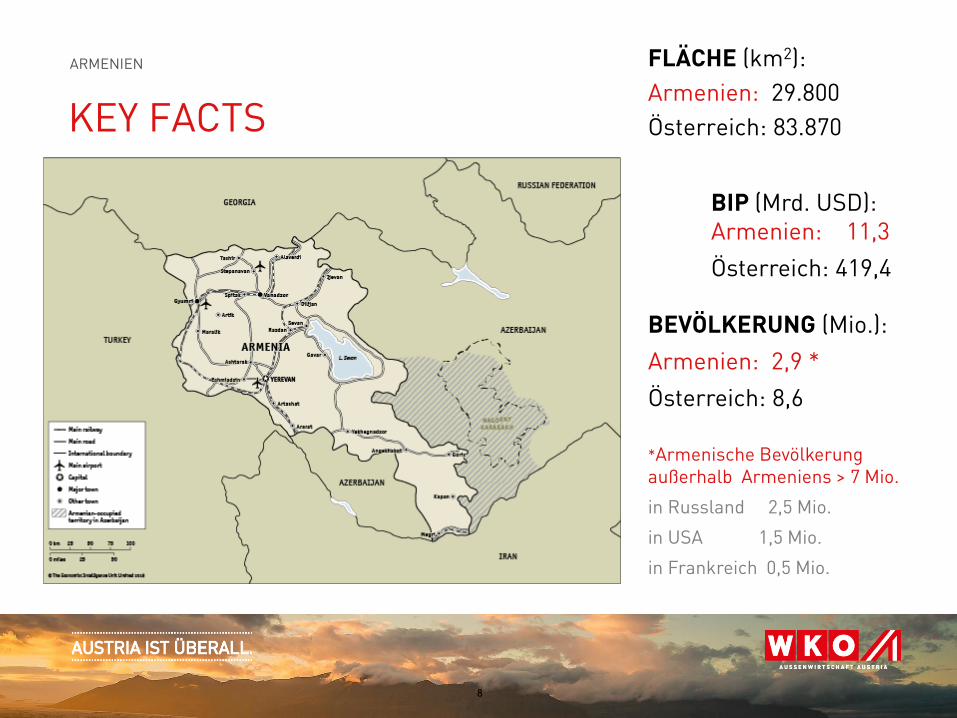
KEY FACTS
ARMENIEN
8
FLÄCHE (km2):
Armenien: 29.800
Österreich: 83.870
BIP (Mrd. USD):Armenien: 11,3
Österreich: 419,4
BEVÖLKERUNG (Mio.):
Armenien: 2,9 *
Österreich: 8,6
*Armenische Bevölkerung außerhalb Armeniens > 7 Mio.
in Russland 2,5 Mio.
in USA 1,5 Mio.
in Frankreich 0,5 Mio.
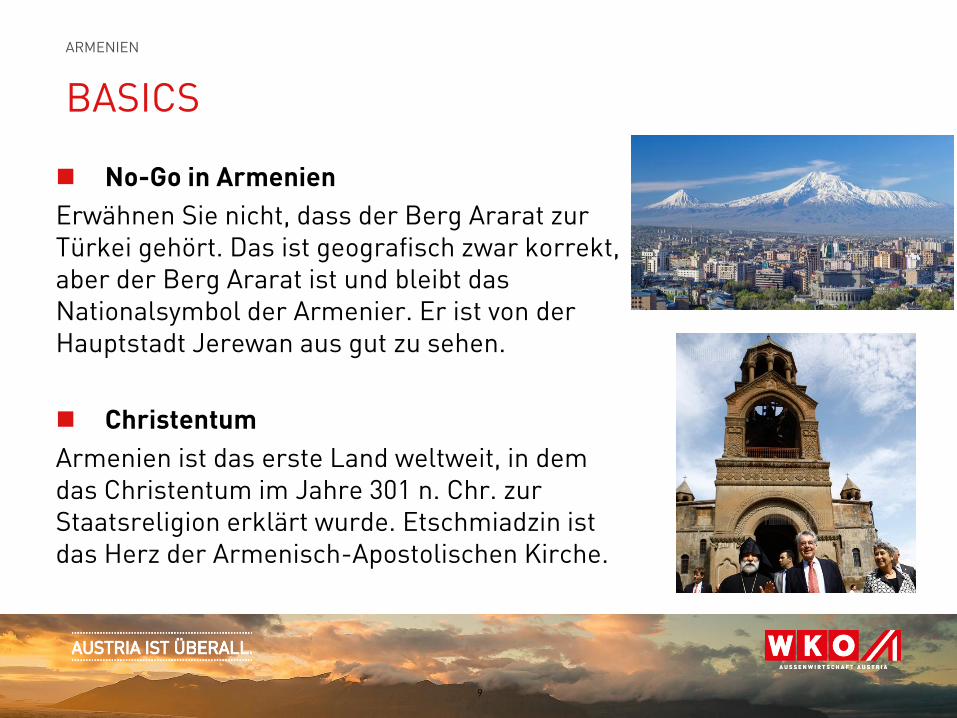
BASICS
No-Go in Armenien
Erwähnen Sie nicht, dass der Berg Ararat zur Türkei gehört. Das ist geografisch zwar korrekt, aber der Berg Ararat ist und bleibt das Nationalsymbol der Armenier. Er ist von der Hauptstadt Jerewan aus gut zu sehen.
Christentum
Armenien ist das erste Land weltweit, in dem das Christentum im Jahre 301 n. Chr. zur Staatsreligion erklärt wurde. Etschmiadzin ist das Herz der Armenisch-Apostolischen Kirche.
ARMENIEN
9
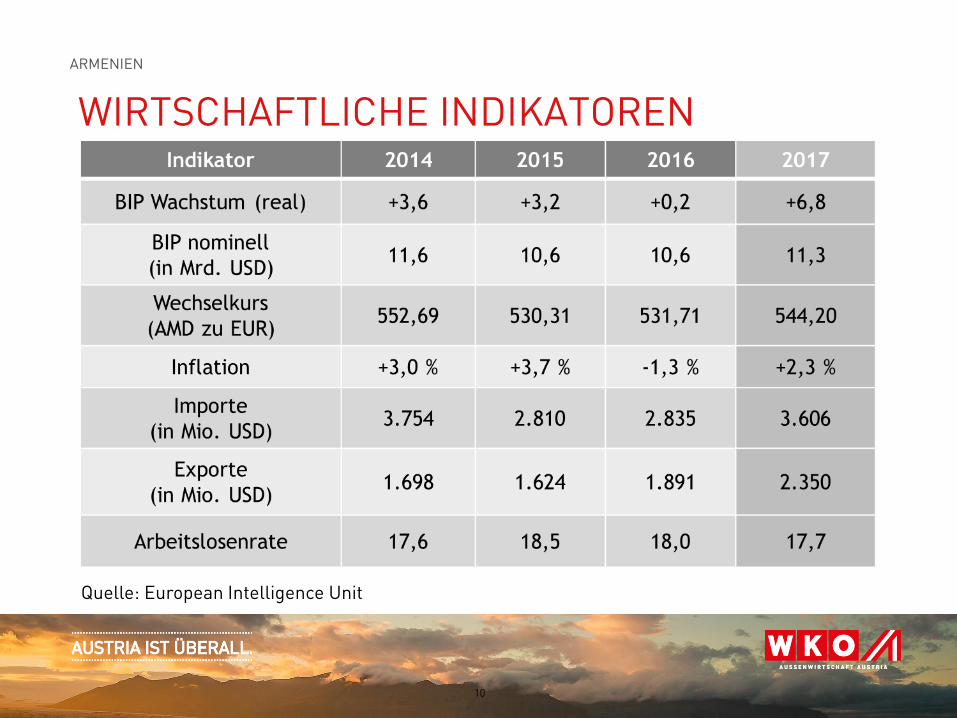
WIRTSCHAFTLICHE INDIKATOREN
10
Quelle: European Intelligence Unit
ARMENIEN
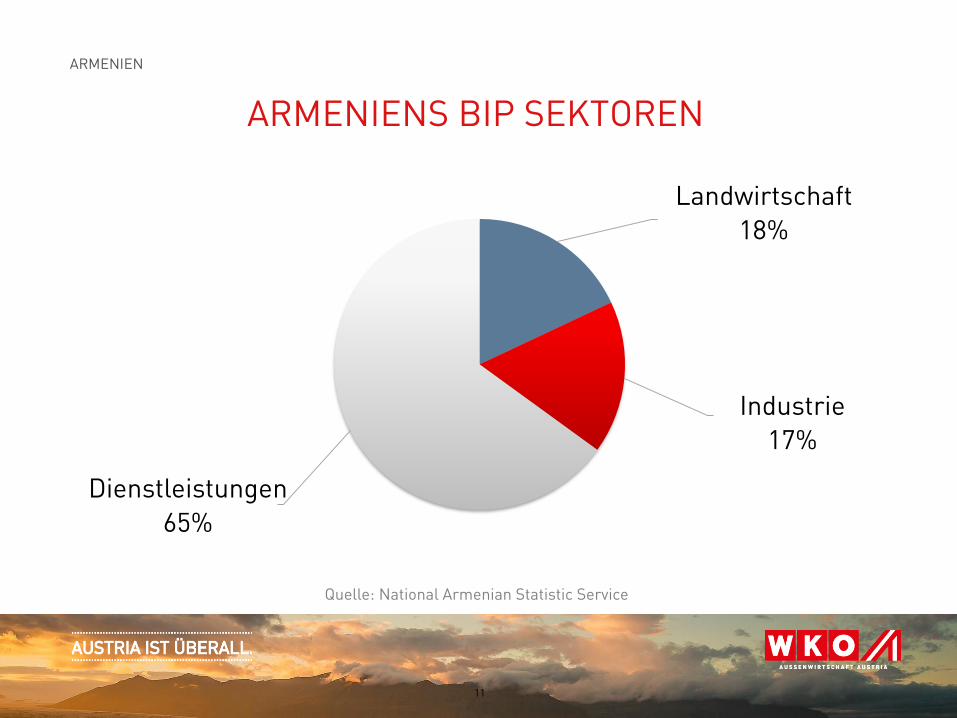
ARMENIENS BIP SEKTOREN
ARMENIEN
11
Landwirtschaft
18%
Industrie
17%
Dienstleistungen
65%
Quelle: National Armenian Statistic Service
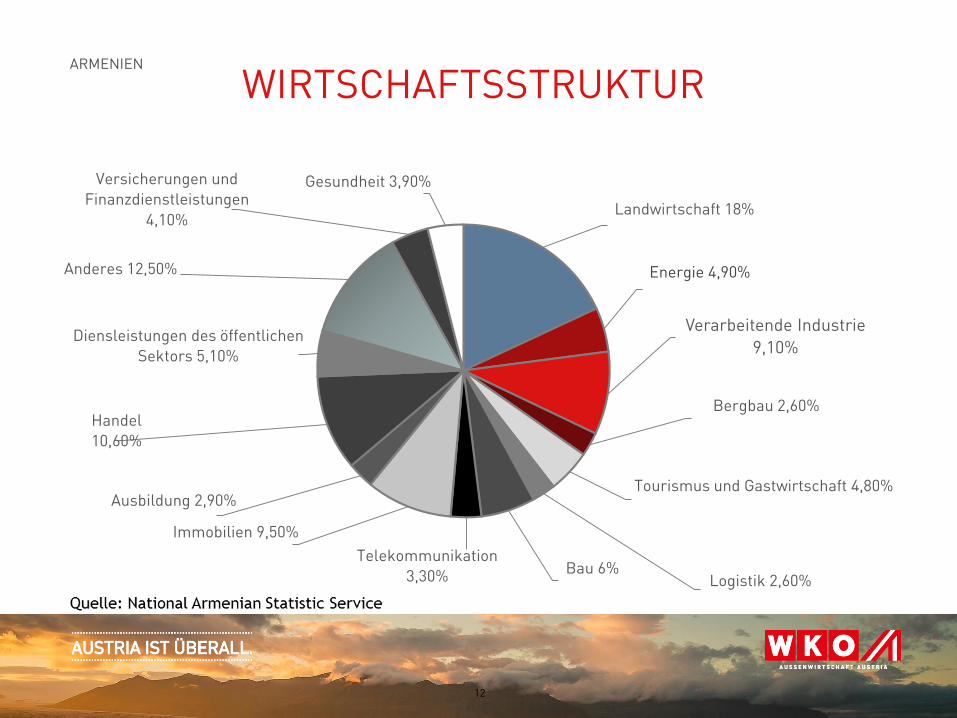
WIRTSCHAFTSSTRUKTURARMENIEN
12
Landwirtschaft 18%
Energie 4,90%
Verarbeitende Industrie
9,10%
Bergbau 2,60%
Tourismus und Gastwirtschaft 4,80%
Logistik 2,60%Bau 6%
Telekommunikation
3,30%
Immobilien 9,50%
Ausbildung 2,90%
Handel
10,60%
Diensleistungen des öffentlichen
Sektors 5,10%
Anderes 12,50%
Versicherungen und
Finanzdienstleistungen
4,10%
Gesundheit 3,90%
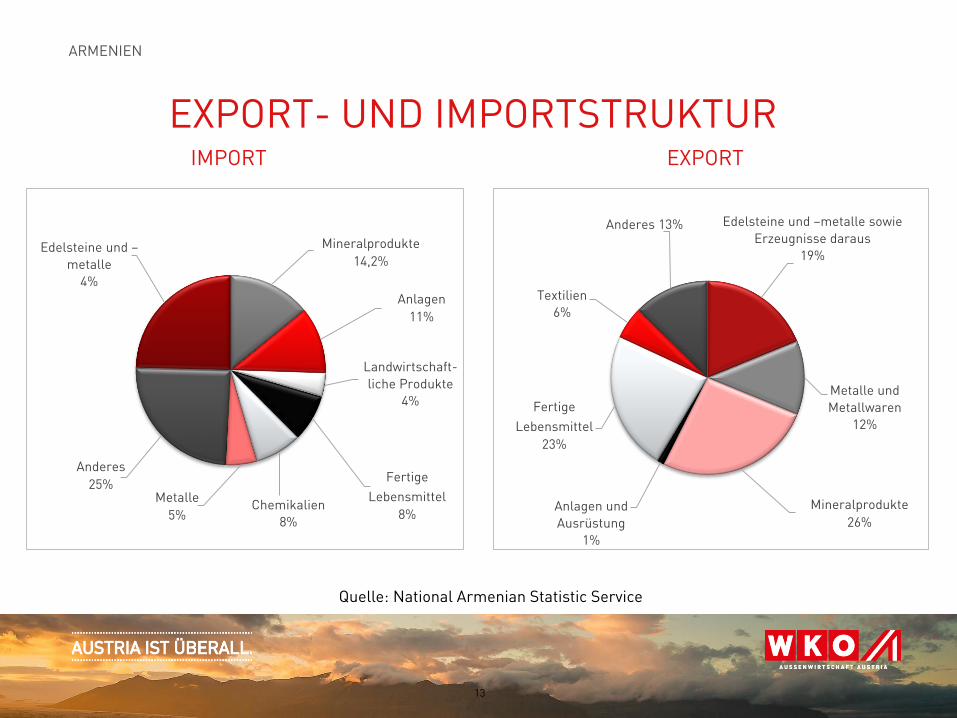
IMPORT EXPORT
EXPORT- UND IMPORTSTRUKTUR
13
Mineralprodukte
14,2%
Anlagen
11%
Landwirtschaft-
liche Produkte
4%
Fertige
Lebensmittel
8%Chemikalien
8%
Metalle
5%
Anderes
25%
Edelsteine und –
metalle
4%
Edelsteine und –metalle sowie
Erzeugnisse daraus
19%
Metalle und
Metallwaren
12%
Mineralprodukte
26%Anlagen und
Ausrüstung
1%
Fertige
Lebensmittel
23%
Textilien
6%
Anderes 13%
Quelle: National Armenian Statistic Service
ARMENIEN
ARMENIEN UND RUSSLAND
Militärzusammenarbeit mit Russland
Die größte armenische Diaspora ist in Russland
Russische Sprache weit verbreitet
Historische Verflechtung mit Russland
Russland der größte Energielieferant
Russland ist der größte Handelspartner
Russland ist der größte Investor
14
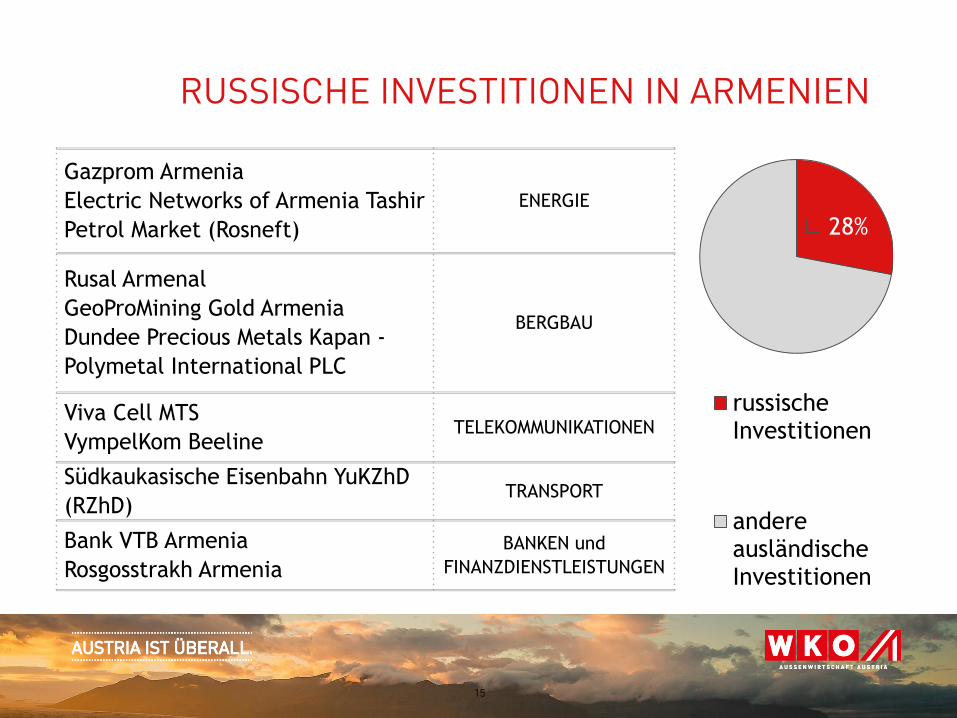
RUSSISCHE INVESTITIONEN IN ARMENIEN
15
Gazprom Armenia
Electric Networks of Armenia Tashir
Petrol Market (Rosneft)
ENERGIE
Rusal Armenal
GeoProMining Gold Armenia
Dundee Precious Metals Kapan -
Polymetal International PLC
BERGBAU
Viva Cell MTS
VympelKom BeelineTELEKOMMUNIKATIONEN
Südkaukasische Eisenbahn YuKZhD
(RZhD)TRANSPORT
Bank VTB Armenia
Rosgosstrakh Armenia
BANKEN und
FINANZDIENSTLEISTUNGEN
28%
russischeInvestitionen
andereausländischeInvestitionen
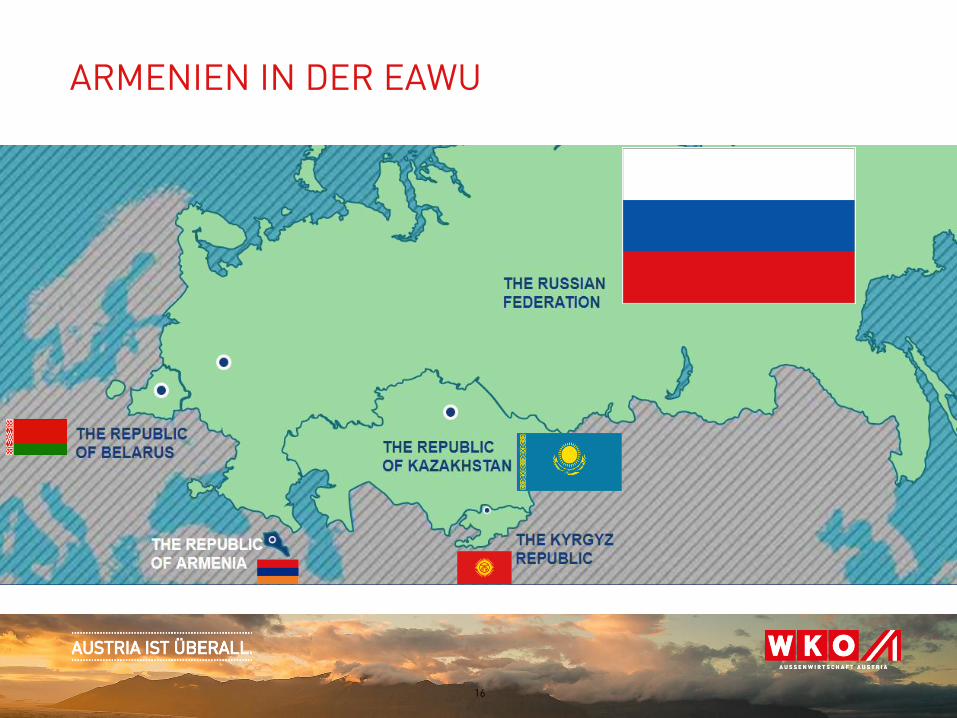
ARMENIEN IN DER EAWU
16
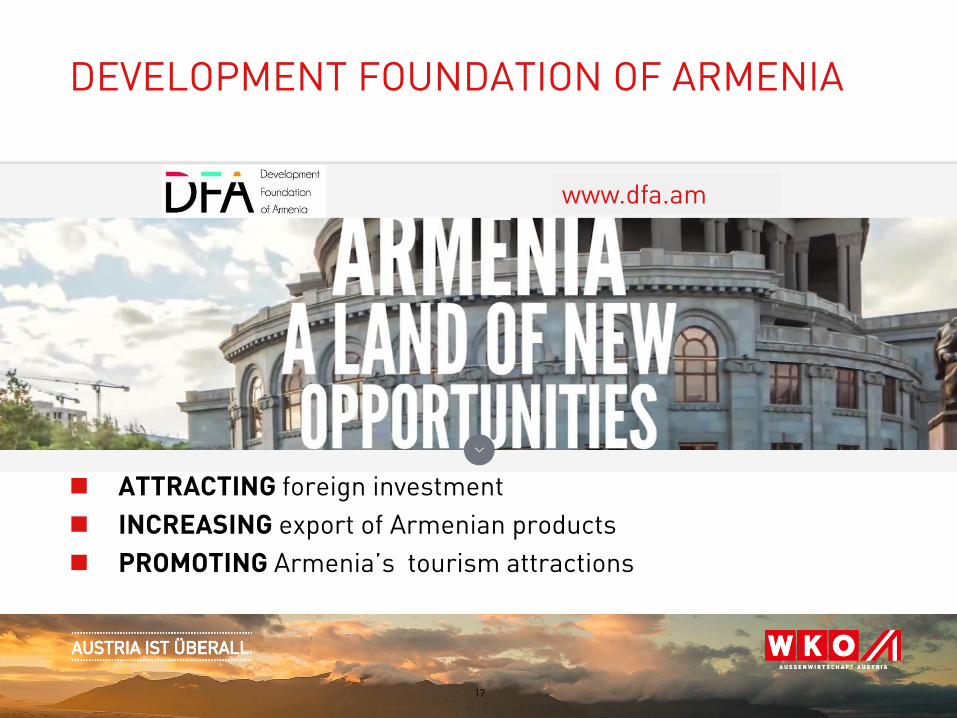
DEVELOPMENT FOUNDATION OF ARMENIA
17
www.dfa.am
ATTRACTING foreign investment
INCREASING export of Armenian products
PROMOTING Armenia’s tourism attractions
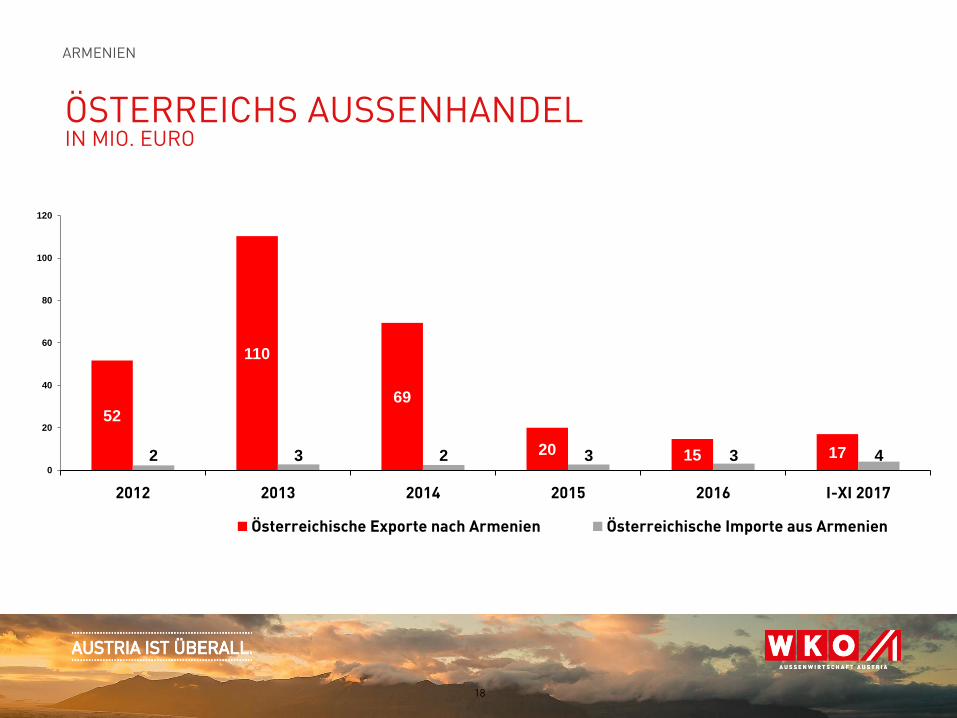
ÖSTERREICHS AUSSENHANDELIN MIO. EURO
ARMENIEN
18
52
110
69
20 15 172 3 2 3 3 40
20
40
60
80
100
120
2012 2013 2014 2015 2016 I-XI 2017
Österreichische Exporte nach Armenien Österreichische Importe aus Armenien
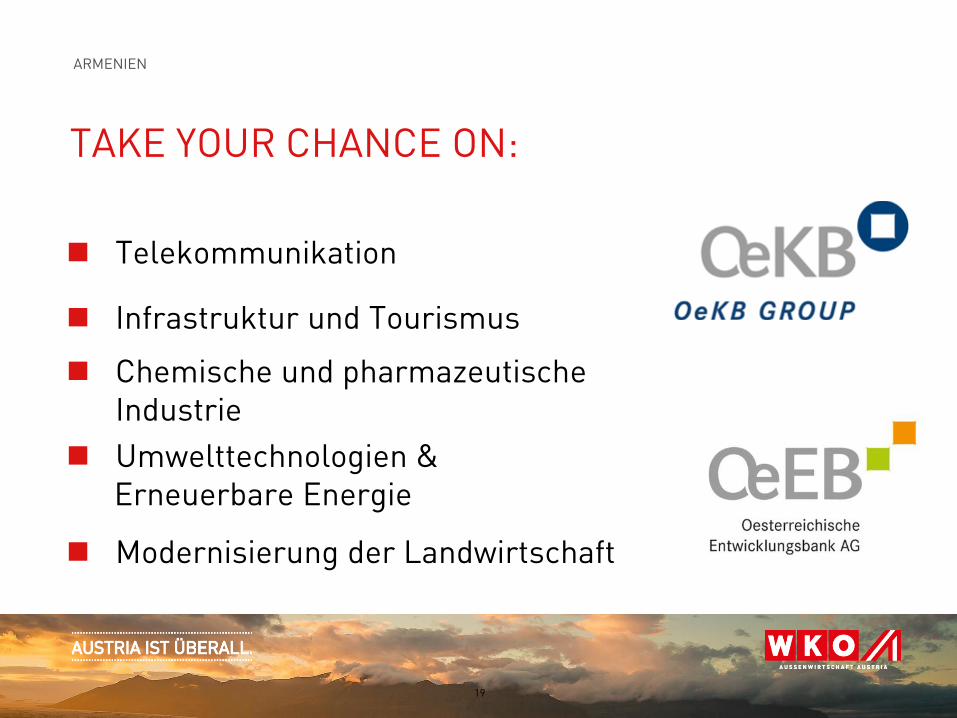
TAKE YOUR CHANCE ON:
Telekommunikation
Infrastruktur und Tourismus
Chemische und pharmazeutische Industrie
Umwelttechnologien & Erneuerbare Energie
Modernisierung der Landwirtschaft
ARMENIEN
19
NEUE INFRASTRUKTURPROJEKTE Ausbau des Nord-Süd-Autobahnkorridors durch
Armenien
Technische Ausrüstung der zweitgrößten Goldmine Armeniens (Region Wajoz Dsor)
Verarbeitung von Abfällen der Erzförderung in Südarmenien (Region Sjunik)
Bau von vier großen Wasserspeichern für die Bewässerung
Ausbau mehrerer Kombi-Wärmekraftwerke
20
ARMENIEN
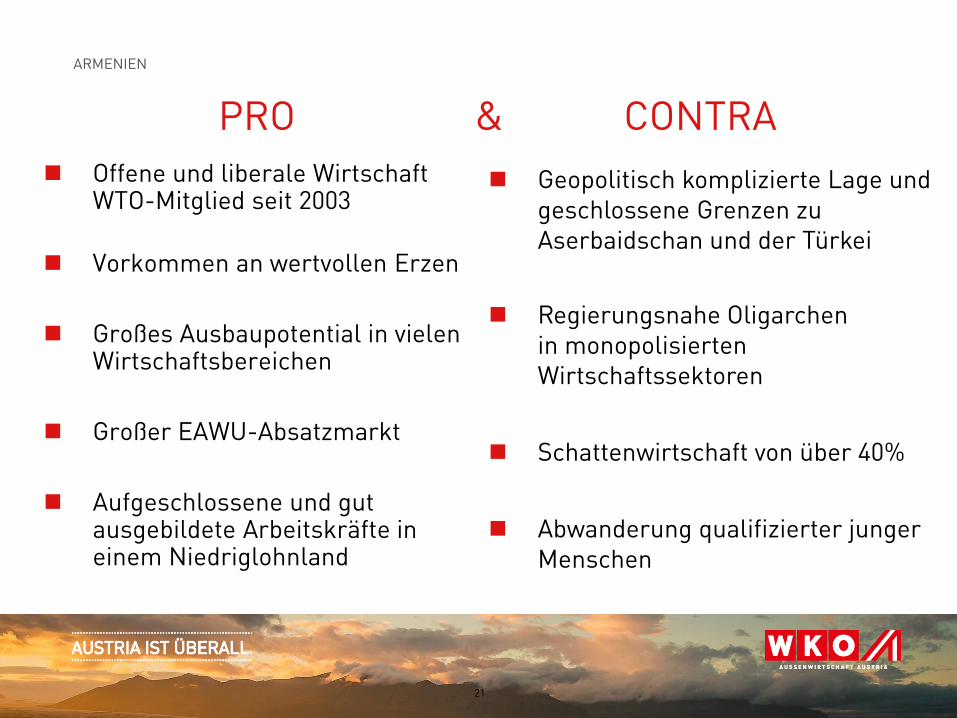
PRO & CONTRA
Offene und liberale Wirtschaft WTO-Mitglied seit 2003
Vorkommen an wertvollen Erzen
Großes Ausbaupotential in vielen Wirtschaftsbereichen
Großer EAWU-Absatzmarkt
Aufgeschlossene und gut ausgebildete Arbeitskräfte in einem Niedriglohnland
ARMENIEN
21
Geopolitisch komplizierte Lage und geschlossene Grenzen zu Aserbaidschan und der Türkei
Regierungsnahe Oligarchen in monopolisierten Wirtschaftssektoren
Schattenwirtschaft von über 40%
Abwanderung qualifizierter junger Menschen
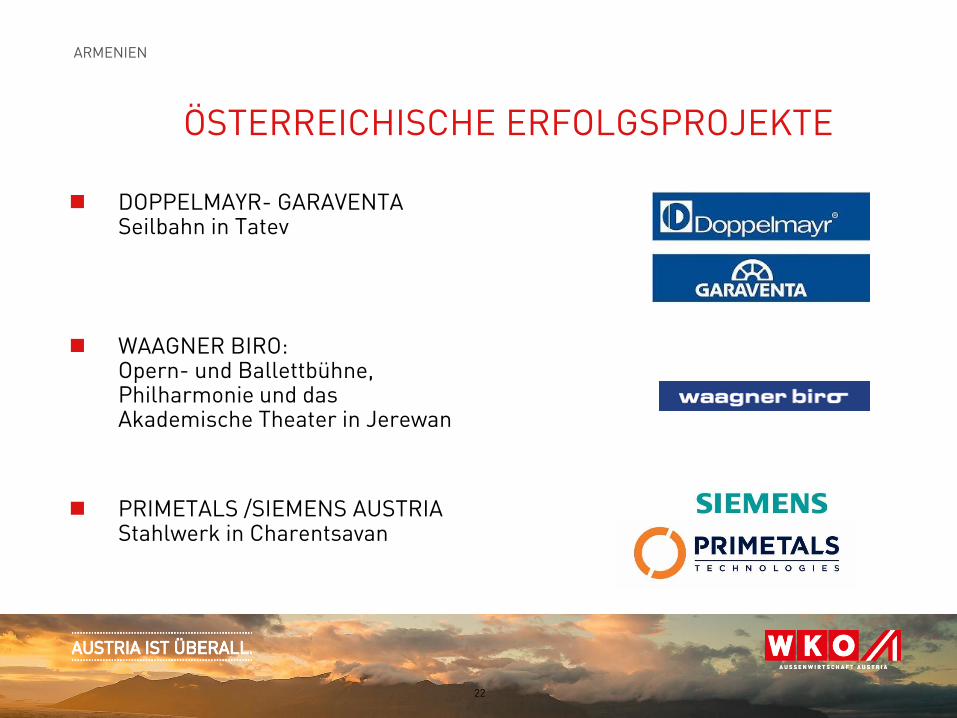
ÖSTERREICHISCHE ERFOLGSPROJEKTE
DOPPELMAYR- GARAVENTA Seilbahn in Tatev
WAAGNER BIRO:Opern- und Ballettbühne, Philharmonie und das Akademische Theater in Jerewan
PRIMETALS /SIEMENS AUSTRIA Stahlwerk in Charentsavan
22
ARMENIEN
Über Ihre Fragen freuen wir uns!
Mag. Rudolf LukavskyDer österreichische Wirtschaftsdelegierte in MoskauAußenwirtschaftsCenter Moskau
Starokonyushenny Pereulok 1115127 PCI-2 Moskau, Russische FöderationT +7 495 725 63 66F +7 495 725 63 [email protected] www.wko.at/aussenwirtschaft/am
23
GEORGIEN:
EIN KLEINER MARKT MIT GUTEN CHANCEN
GEORGIEN ENTWICKELT SICH ZU EINEM VERLÄSSLICHEN WIRTSCHAFTSPARTNER FÜR DEN KAUKASUS-RAUM
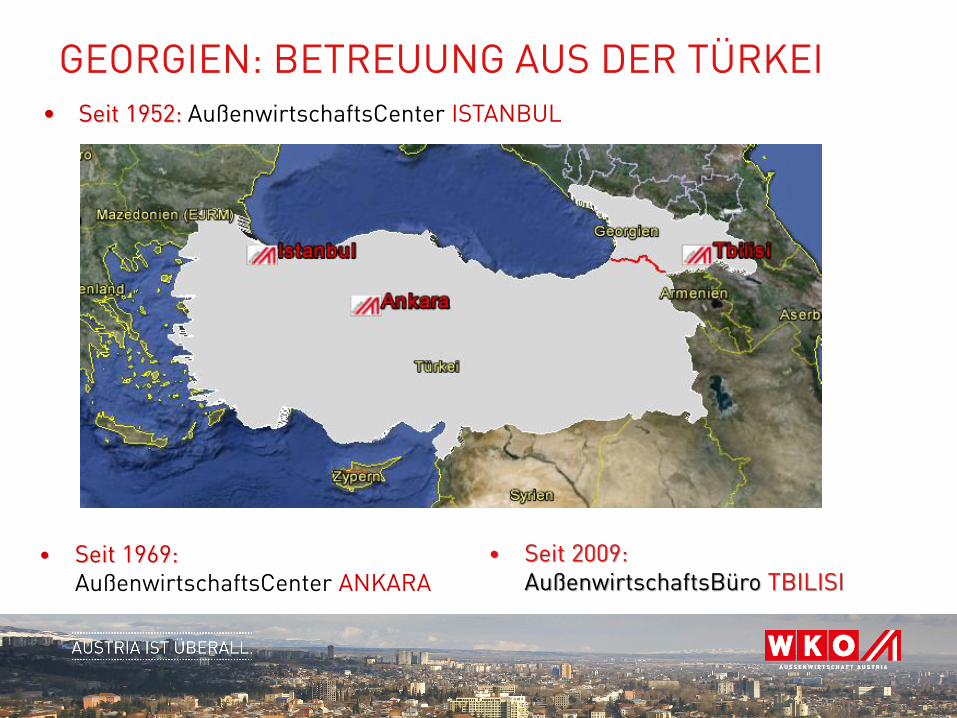
GEORGIEN: BETREUUNG AUS DER TÜRKEI
• Seit 1969:AußenwirtschaftsCenter ANKARA
• Seit 2009: AußenwirtschaftsBüro TBILISI
• Seit 1952: AußenwirtschaftsCenter ISTANBUL
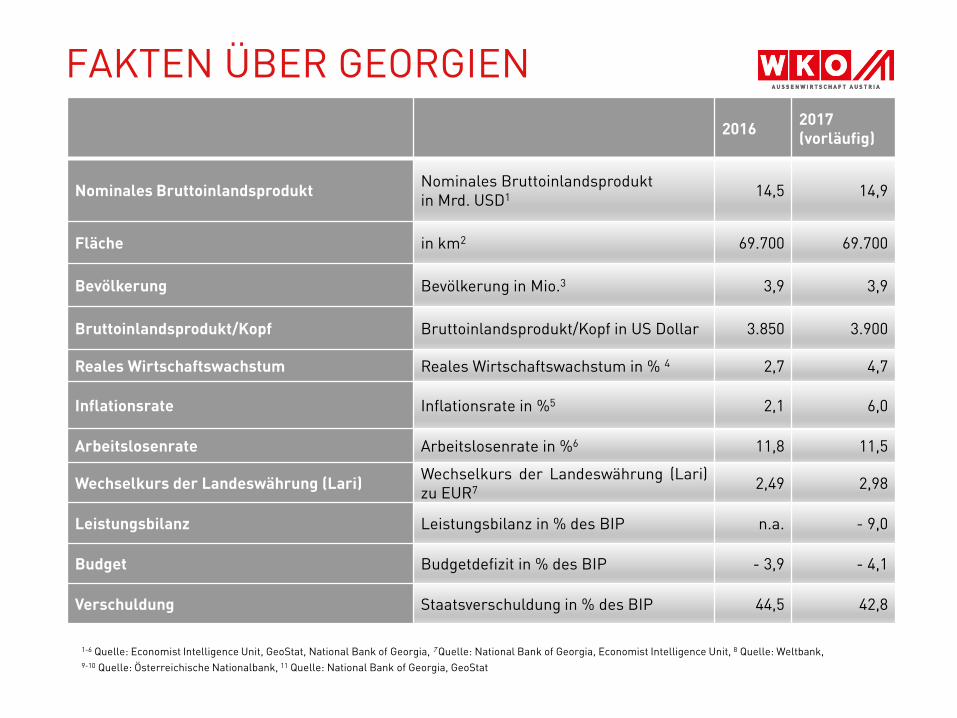
FAKTEN ÜBER GEORGIEN
20162017(vorläufig)
Nominales BruttoinlandsproduktNominales Bruttoinlandsproduktin Mrd. USD1 14,5 14,9
Fläche in km2 69.700 69.700
Bevölkerung Bevölkerung in Mio.3 3,9 3,9
Bruttoinlandsprodukt/Kopf Bruttoinlandsprodukt/Kopf in US Dollar 3.850 3.900
Reales Wirtschaftswachstum Reales Wirtschaftswachstum in % 4 2,7 4,7
Inflationsrate Inflationsrate in %5 2,1 6,0
Arbeitslosenrate Arbeitslosenrate in %6 11,8 11,5
Wechselkurs der Landeswährung (Lari)Wechselkurs der Landeswährung (Lari)zu EUR7 2,49 2,98
Leistungsbilanz Leistungsbilanz in % des BIP n.a. - 9,0
Budget Budgetdefizit in % des BIP - 3,9 - 4,1
Verschuldung Staatsverschuldung in % des BIP 44,5 42,8
1-6 Quelle: Economist Intelligence Unit, GeoStat, National Bank of Georgia, 7 Quelle: National Bank of Georgia, Economist Intelligence Unit, 8 Quelle: Weltbank,9-10 Quelle: Österreichische Nationalbank, 11 Quelle: National Bank of Georgia, GeoStat
FREIHANDELSABKOMMEN
• EU – Georgien Assoziierungsabkommen(Deep and Comprehensive Free Trade Agreement)ist seit 1.7.2016 in Kraft
• Freihandelsabkommen mit Ukraine, Weissrussland, Aserbaidschan, Armenien, Russland, Moldawien,Kasachstan, Kirgisien, Tadschikistan, Usbekistan, Turkmenistan und der Türkei
• Visafreiheit mit der EU seit 28.03.2017
27
GEORGIEN
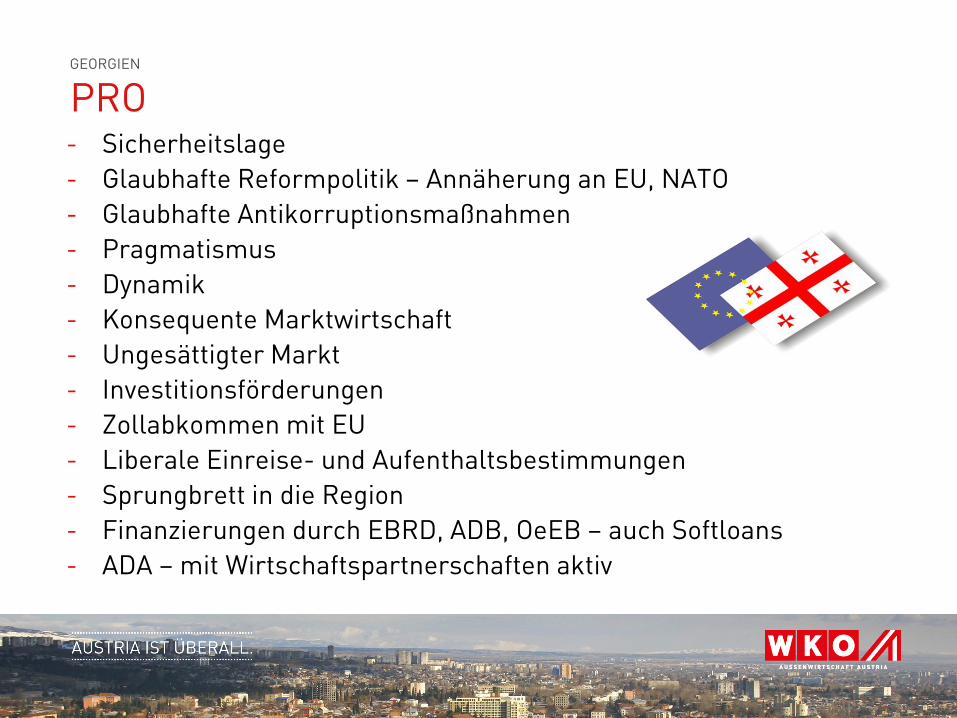
PRO- Sicherheitslage
- Glaubhafte Reformpolitik – Annäherung an EU, NATO
- Glaubhafte Antikorruptionsmaßnahmen
- Pragmatismus
- Dynamik
- Konsequente Marktwirtschaft
- Ungesättigter Markt
- Investitionsförderungen
- Zollabkommen mit EU
- Liberale Einreise- und Aufenthaltsbestimmungen
- Sprungbrett in die Region
- Finanzierungen durch EBRD, ADB, OeEB – auch Softloans
- ADA – mit Wirtschaftspartnerschaften aktiv
GEORGIEN
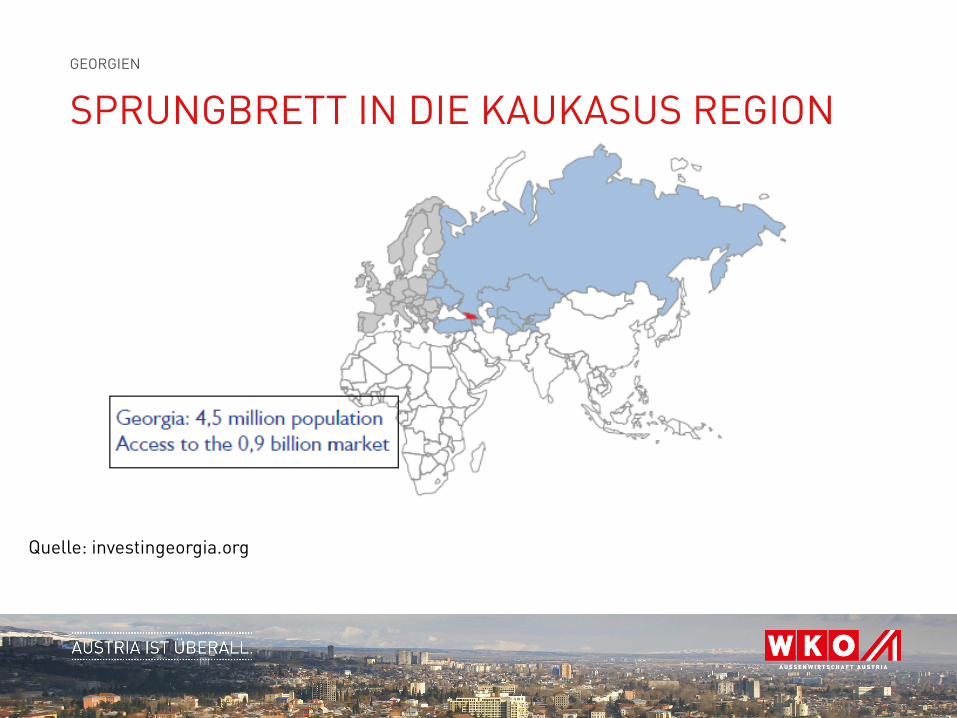
SPRUNGBRETT IN DIE KAUKASUS REGION
Quelle: investingeorgia.org
GEORGIEN
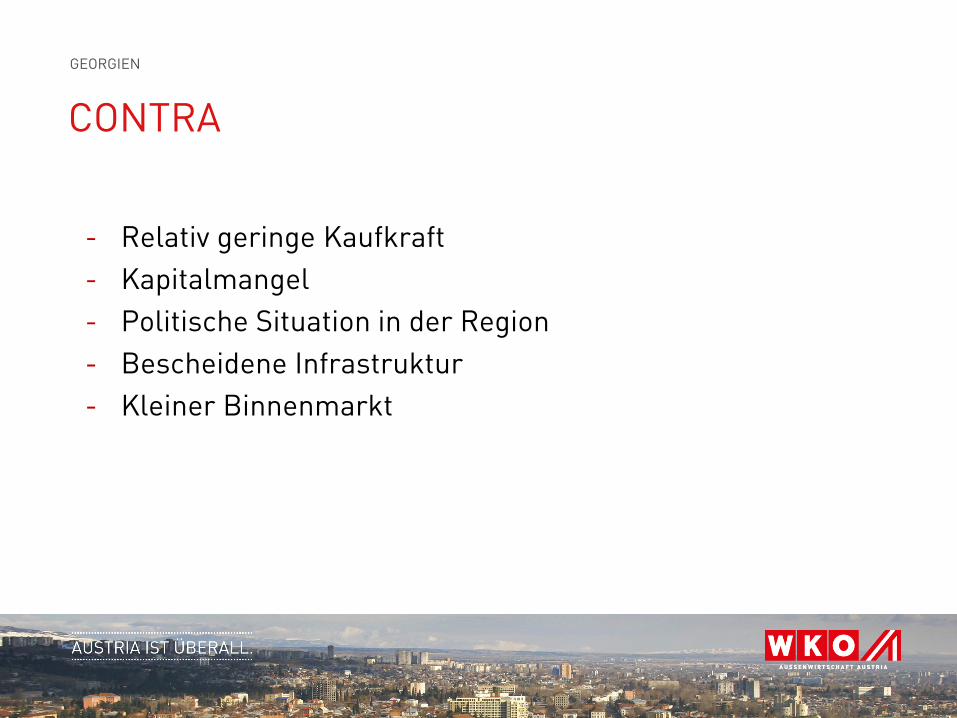
CONTRA
- Relativ geringe Kaufkraft
- Kapitalmangel
- Politische Situation in der Region
- Bescheidene Infrastruktur
- Kleiner Binnenmarkt
GEORGIEN
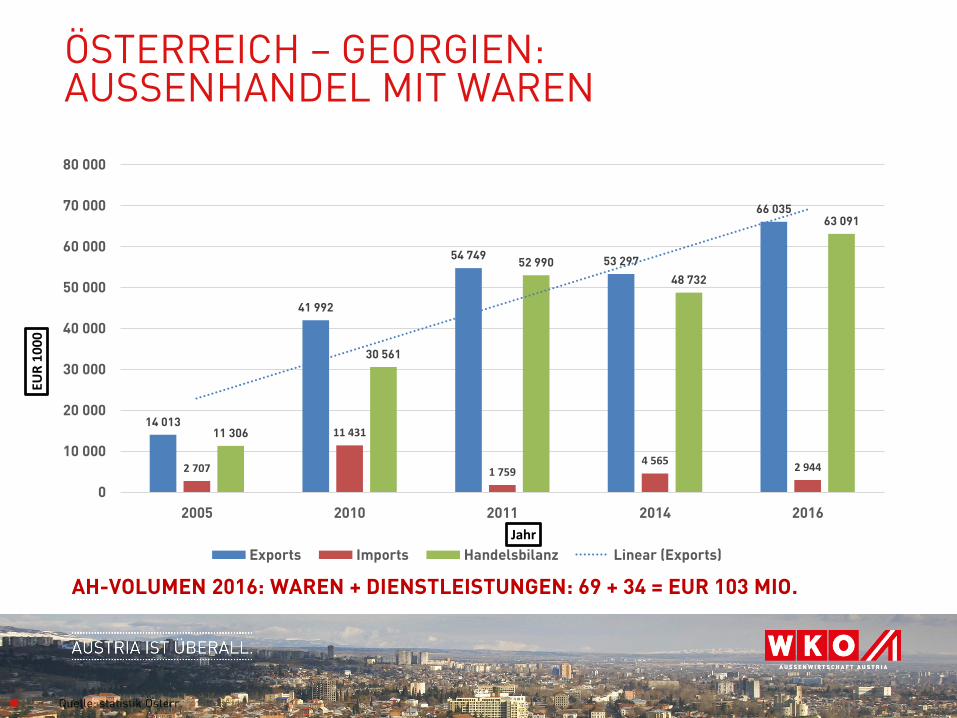
ÖSTERREICH – GEORGIEN: AUSSENHANDEL MIT WAREN
14 013
41 992
54 749 53 297
66 035
2 707
11 431
1 7594 565
2 944
11 306
30 561
52 990
48 732
63 091
0
10 000
20 000
30 000
40 000
50 000
60 000
70 000
80 000
2005 2010 2011 2014 2016
EUR
10
00
Jahr
Exports Imports Handelsbilanz Linear (Exports)
31 Quelle: statistik Österr.
AH-VOLUMEN 2016: WAREN + DIENSTLEISTUNGEN: 69 + 34 = EUR 103 MIO.
ÖSTERREICHISCHE FIRMEN IN GEORGIEN
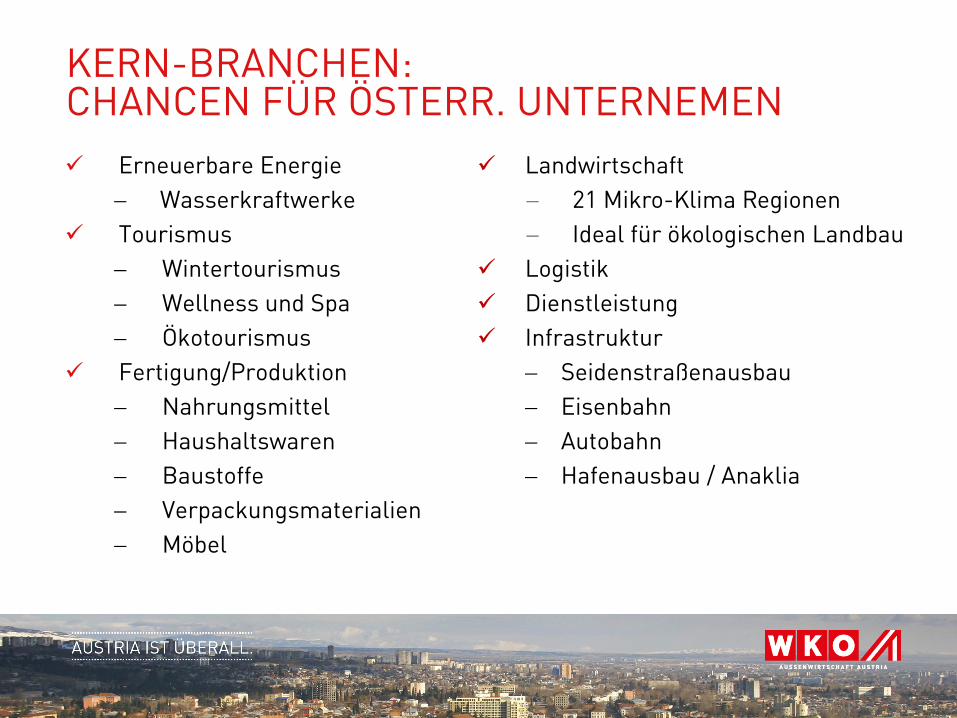
KERN-BRANCHEN: CHANCEN FÜR ÖSTERR. UNTERNEMEN
Erneuerbare Energie
Wasserkraftwerke
Tourismus
Wintertourismus
Wellness und Spa
Ökotourismus
Fertigung/Produktion
Nahrungsmittel
Haushaltswaren
Baustoffe
Verpackungsmaterialien
Möbel
Landwirtschaft
21 Mikro-Klima Regionen
Ideal für ökologischen Landbau
Logistik
Dienstleistung
Infrastruktur
Seidenstraßenausbau
Eisenbahn
Autobahn
Hafenausbau / Anaklia
NOCH FRAGEN? GERNE FÜR SIE DA!
Georg KarabaczekÖsterreichischer WirtschaftsdelegierterAußenwirtschaftsCenter IstanbulT: +90 212 211 14 76E: [email protected]: wko.at/aussenwirtschaft/ge
34
Ana LatariaBüroleiterin in TiflisAußenwirtschaftsBüro TiflisT: +995 32 24 34 401E: [email protected]: wko.at/aussenwirtschaft/ge
WIRTSCHAFTSBEZIEHUNGEN ZWISCHEN ÖSTERREICH UND ASERBAIDSCHAN
ASERBAIDSCHANS WIRTSCHAFT – CHANCEN UND RISIKEN FÜR ÖSTERREICHISCHE UNTERNEHMENFEBRUAR 2018
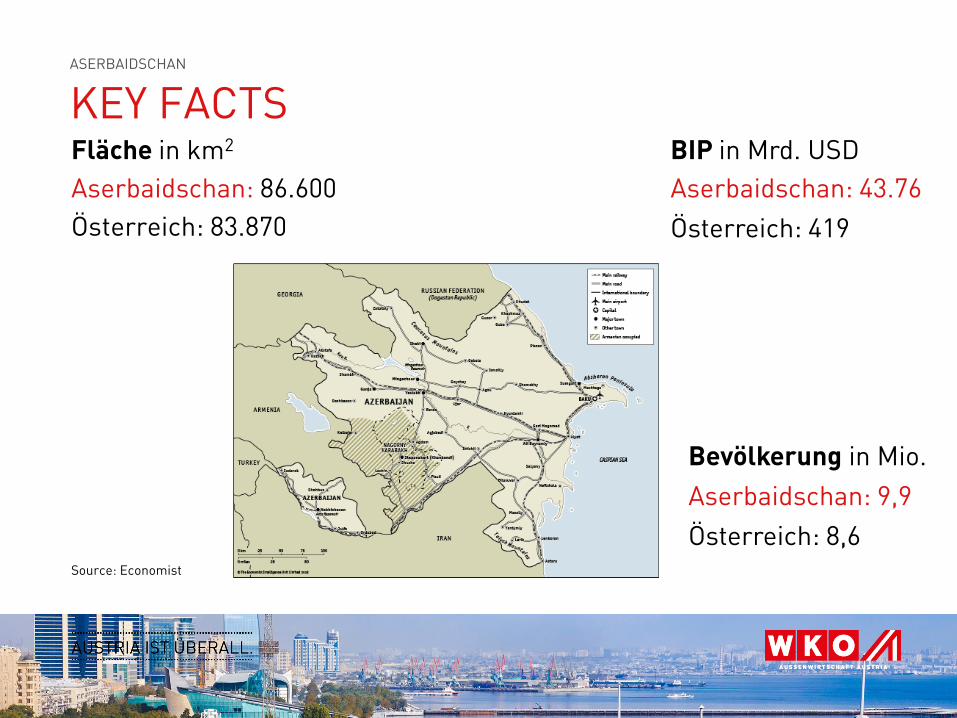
KEY FACTSFläche in km2
Aserbaidschan: 86.600
Österreich: 83.870
BIP in Mrd. USD
Aserbaidschan: 43.76
Österreich: 419
Bevölkerung in Mio.
Aserbaidschan: 9,9
Österreich: 8,6Source: Economist
ASERBAIDSCHAN
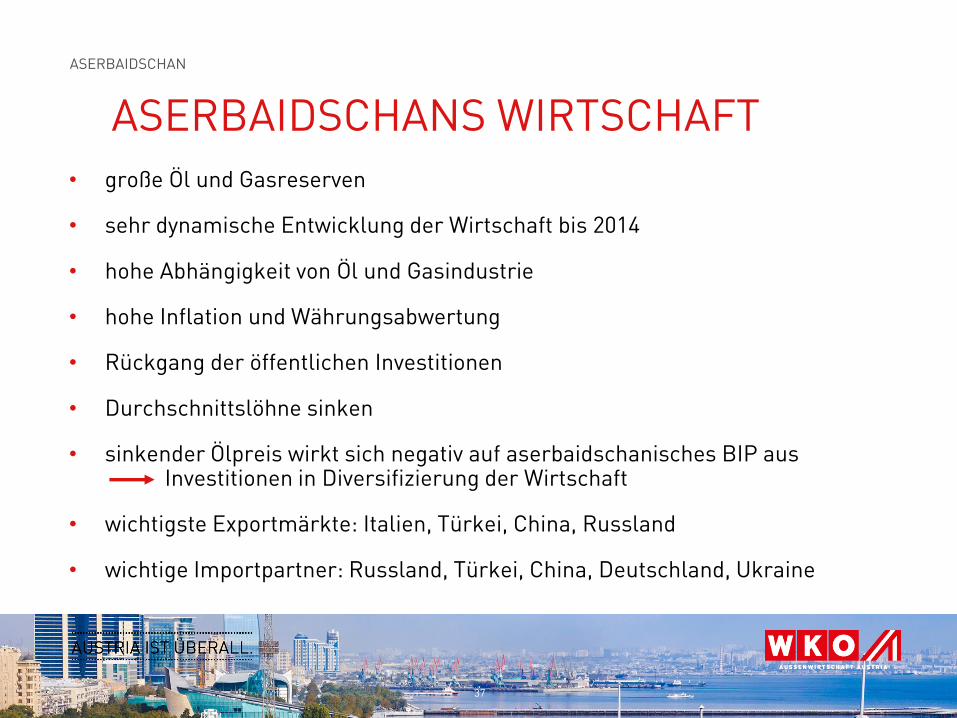
ASERBAIDSCHANS WIRTSCHAFT
• große Öl und Gasreserven
• sehr dynamische Entwicklung der Wirtschaft bis 2014
• hohe Abhängigkeit von Öl und Gasindustrie
• hohe Inflation und Währungsabwertung
• Rückgang der öffentlichen Investitionen
• Durchschnittslöhne sinken
• sinkender Ölpreis wirkt sich negativ auf aserbaidschanisches BIP aus Investitionen in Diversifizierung der Wirtschaft
• wichtigste Exportmärkte: Italien, Türkei, China, Russland
• wichtige Importpartner: Russland, Türkei, China, Deutschland, Ukraine
37
ASERBAIDSCHAN
WIRTSCHAFTLICHE INDIKATOREN
38
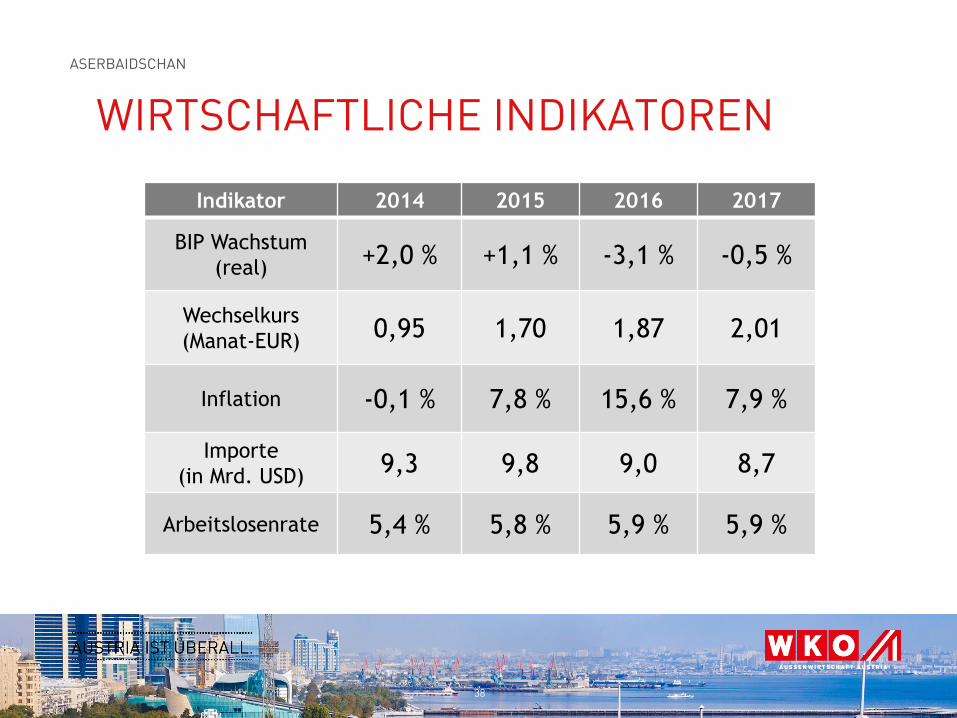
Indikator 2014 2015 2016 2017
BIP Wachstum
(real)+2,0 % +1,1 % -3,1 % -0,5 %
Wechselkurs
(Manat-EUR)0,95 1,70 1,87 2,01
Inflation -0,1 % 7,8 % 15,6 % 7,9 %
Importe
(in Mrd. USD)9,3 9,8 9,0 8,7
Arbeitslosenrate 5,4 % 5,8 % 5,9 % 5,9 %
ASERBAIDSCHAN
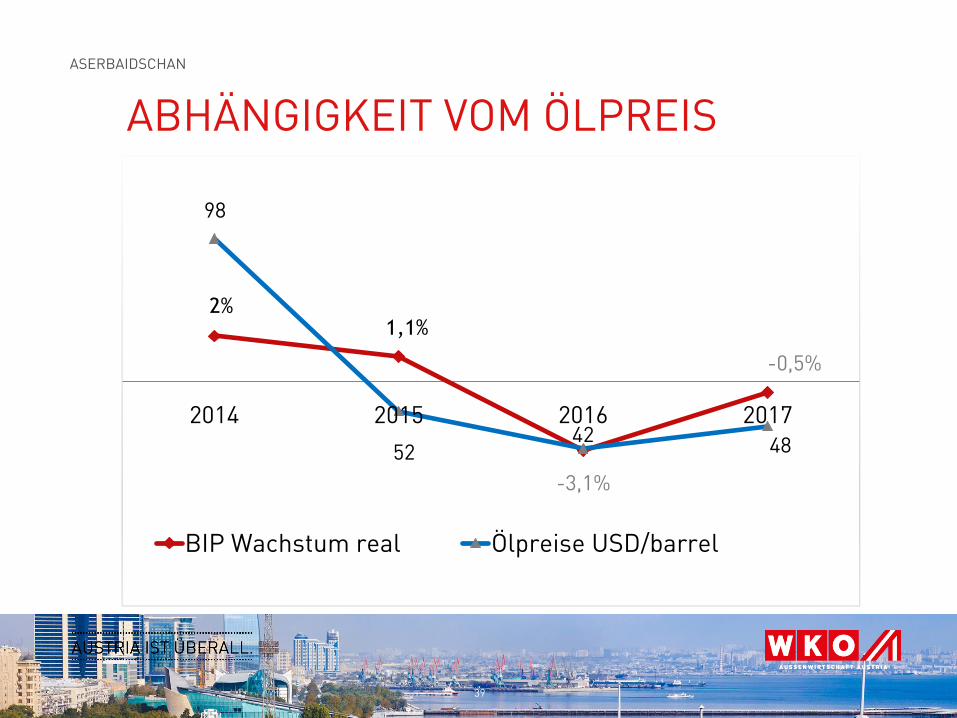
ABHÄNGIGKEIT VOM ÖLPREIS
ASERBAIDSCHAN
39
98
5242 48
0
20
40
60
80
100
120
-10,0%
-8,0%
-6,0%
-4,0%
-2,0%
0,0%
2,0%
4,0%
6,0%
8,0%
10,0%
2014 2015 2016 2017
BIP Wachstum real Ölpreise USD/barrel
2%1,1%
-3,1%
-0,5%
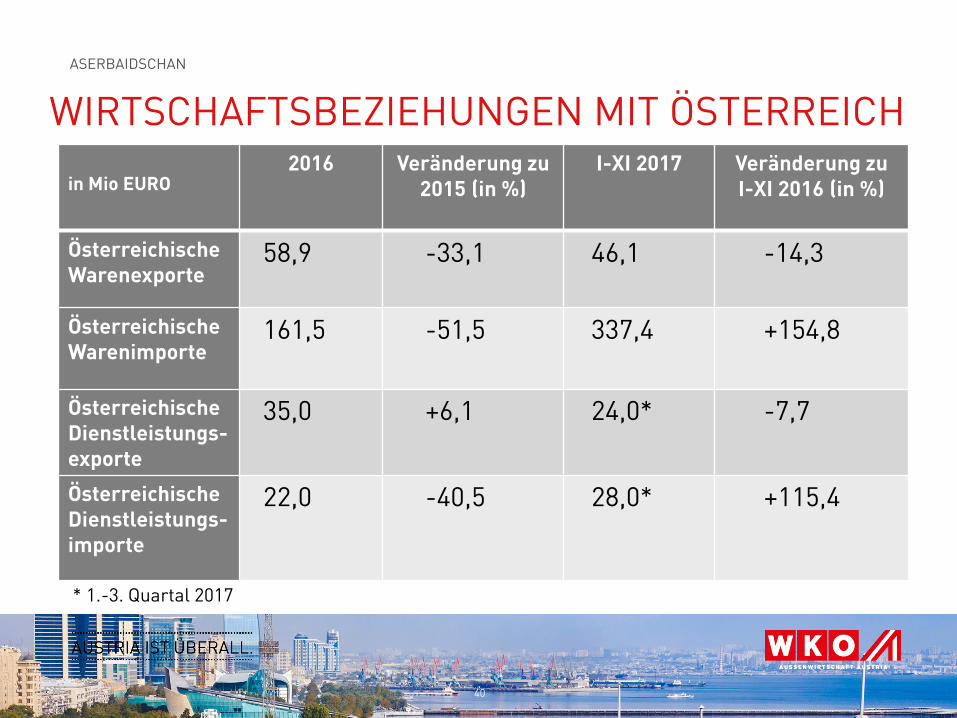
WIRTSCHAFTSBEZIEHUNGEN MIT ÖSTERREICH
in Mio EURO2016 Veränderung zu
2015 (in %)I-XI 2017 Veränderung zu
I-XI 2016 (in %)
Österreichische Warenexporte
58,9 -33,1 46,1 -14,3
ÖsterreichischeWarenimporte
161,5 -51,5 337,4 +154,8
Österreichische Dienstleistungs-exporte
35,0 +6,1 24,0* -7,7
Österreichische Dienstleistungs-importe
22,0 -40,5 28,0* +115,4
ASERBAIDSCHAN
40
* 1.-3. Quartal 2017
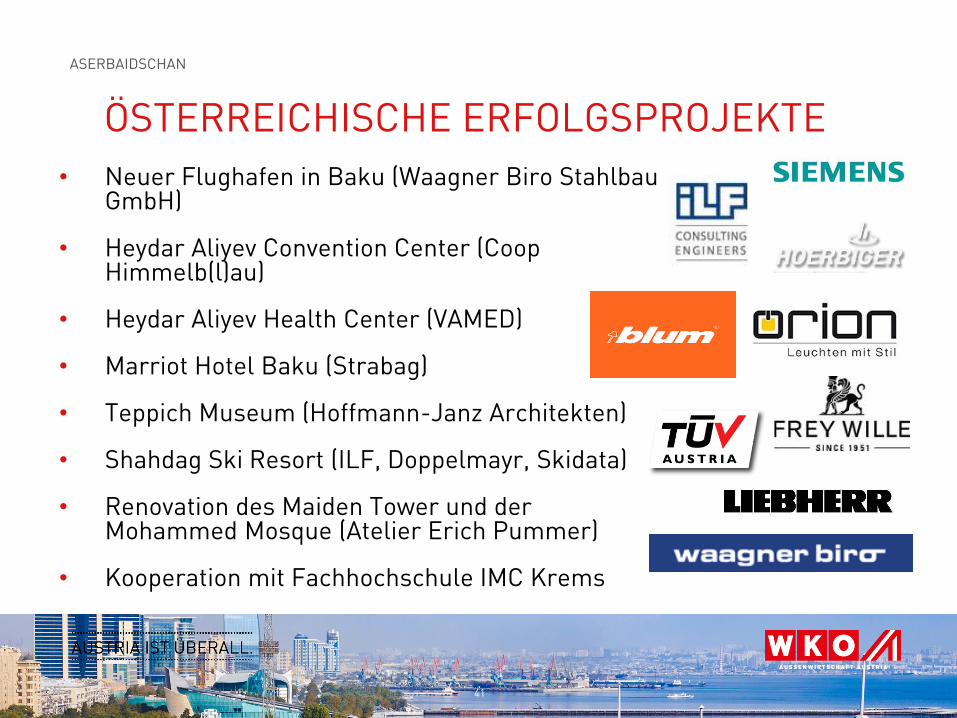
ÖSTERREICHISCHE ERFOLGSPROJEKTE
• Neuer Flughafen in Baku (Waagner Biro Stahlbau GmbH)
• Heydar Aliyev Convention Center (Coop Himmelb(l)au)
• Heydar Aliyev Health Center (VAMED)
• Marriot Hotel Baku (Strabag)
• Teppich Museum (Hoffmann-Janz Architekten)
• Shahdag Ski Resort (ILF, Doppelmayr, Skidata)
• Renovation des Maiden Tower und der Mohammed Mosque (Atelier Erich Pummer)
• Kooperation mit Fachhochschule IMC Krems
ASERBAIDSCHAN
41
MILESTONES
• Baku White City Project
• Bau des internationalen Logistikzentrums in Alat
• Bau großer Sportkomplexe für internationale Events
Eurovision Songcontest Baku 2012
Europäische Olympische Spiele Baku 2015
Islamische Olympische Spiele 2017
Formel 1 Grand Prix Azerbaijan
• Bau des Polymerwerkes und des Karbamidwerkes von SOCAR
• Ausbau der Bahnstrecke Baku-Tiflis/Georgien-Kars/Türkei
ASERBAIDSCHAN
42
ZUKÜNFTIGE PROJEKTE
• TANAP - Transanatolische Erdgas-Pipeline
• Bau des Oil and Gas Processing and Petrochemical Complex of SOCAR 2018-2030
• Investitionen in neuen Industrieparks in den Regionen Sumgait, Pirallahi, Mingachevir, Ganja, Neftchala, Balaxani, Sabirabad
• Bau neuer Agroparks
• Modernisierung des Eisenbahnnetzes in nächsten 5-10 Jahren.
• Baku als Kandidat für Weltausstellung EXPO 2025
43
ASERBAIDSCHAN
PERSPEKTIVEN
• Aserbaidschan als Wirtschafts-Hub für den Südkaukasus
• Modernisierung der aserbaidschanischen Industrie
• Aserbaidschan sucht Technologietransfer in vielen Industriezweigen: Maschinenbau, Chemie, Baustoffe, Textil, Automotive & Lebensmittelindustrie
• Österreich unterstützt österreichische Investitionen in Aserbaidschan mit
Doppelbesteuerungsabkommen
Investitionsschutzabkommen
ASERBAIDSCHAN
44
GESCHÄFTSCHANCEN FÜR ÖSTERR. FIRMEN
• Telekommunikation
• Infrastruktur
• Umwelttechnologien & Erneuerbare Energie
• Bauwirtschaft
• Transport
• Tourismus
• Modernisierung der Landwirtschaft
45
ASERBAIDSCHAN
Danke für Ihre Aufmerksamkeit! Fragen?
Christoph PfeiferÖsterreichischer Wirtschaftsdelegierter Stv.AußenwirtschaftsCenter Moskau
Starokonyushenny Pereulok 1115127 PCI-2 Moskau, Russische FöderationT +7 495 725 63 66F +7 495 725 63 67E [email protected] www.wko.at/aussenwirtschaft/az
Sabir Mammadov
Büroleiter in BakuAußenwirtschaftsBüro Baku
Nizami strasse 96, The Landmark, 7th floor1010 Baku, AserbaidschanT +994 12 46 59 910F +994 12 46 59 908E [email protected] www.wko.at/aussenwirtschaft/az
WIRTSCHAFTSMISSION: UNENTDECKTER KAUKASUSARMENIEN, GEORGIEN UND ASERBAIDSCHANSONNTAG, 13.05. – FREITAG, 18.05.2018
• Informationsveranstaltungen
• Individuell vorbereitete B2B Gespräche für jeden Teilnehmer
• Networking-Events mit lokalen Stakeholdern
• Kontakte zu Internationalen Finanzinstitutionen, Behörden, potenziellen Partnern und Abnehmern
Details finden sie hier:
https://www.wko.at/service/Veranstaltung.html?id=ce980546-461f-4e36-8310-6bf567fc18e8
Anmeldeschluss: 24.3.2018
Zusätzliche Informationen: [email protected] | [email protected]
47