Embed Size (px)
Citation preview

Wedding Industry Report
For: Limestone TX - (County)© 2017 The Wedding Report, Inc.www.theweddingreport.com

Table of ContentsMarket SummaryMedian Spending & Spending Range DetailsSeasonality of EngagementsSeasonality of WeddingsGuest DetailsTravel DistanceItem SummaryOnline MarketCompetitive LandscapeDemographics by AgeDemographics by EducationDemographics by Household IncomeDemographics by OccupationDemographics by Race
Products & ServicesIncludes Number of Weddings (Demand), Average Spending per Wedding, Total Sales, and Spending Distribution per Productor Service
Dress AccessoriesTuxedo/suit/other AccessoriesTuxedo/suit/other Rent/purchaseWedding Dress/esHair ServiceMakeup ServiceManicure & PedicureDJ/MCEntertainment lightingLive BandMusician/s, Soloist, or EnsembleBouquetsBoutonnieres, CorsagesEvent DecorationsEvent Flowers & ArrangementsEvent Table CenterpiecesGift/s for AttendantsGift/s for ParentsTips (for all services)Wedding FavorsCeremony ProgramsEngagement AnnouncementsGuest BookInvitations & Reply CardsPostageReception MenusSave the Date CardsTable Name and Escort/place CardsThank You CardsBraceletEarringsEngagement RingNecklaceWedding ring/band for HERWedding ring/band for HIMDigital or Photo cd/dvdEngagement SessionPhoto BoothPrints and/or Enlargements

Wedding album/s or photo book/sWedding PhotographerWedding VideographerA La Carte ServicesDay of CoordinatorFor Getting StartedFull ServiceMonth of DirectionCeremony OfficiatorEvent AccessoriesEvent Bar ServiceEvent Food ServiceEvent LocationEvent RentalsHotel Room for After ReceptionLimo RentalOther TransportationRehearsal DinnerWedding Cake/dessert

Market SummaryThis is the number of estimated weddings, estimated average amount spent per wedding, and estimated total sales for:Market Totals - Market Summary in Limestone TX - (County).
About 54 (35%) of the 155 - 2017 weddings travelled into this area to marry.
NOTE: County numbers will not equal County Clerk numbers because couples can marry anywhere within the State.
Year Number of Weddings (Demand) Average Spending per Wedding Total Sales
2008 209 $17,005 $3,554,045
2009 199 $15,606 $3,105,594
2010 198 $18,689 $3,700,422
2011 197 $18,145 $3,574,565
2012 202 $18,404 $3,717,608
2013 192 $18,804 $3,610,368
2014 187 $19,660 $3,676,420
2015 173 $20,326 $3,516,398
2016 177 $20,150 $3,566,550
2017 155 $20,275 $3,142,625
2018 159 $20,300 $3,227,700
2019 162 $20,655 $3,346,110
2020 165 $20,675 $3,411,375
2021 165 $21,012 $3,466,980
2022 163 $21,026 $3,427,238
Note About Average SpendingProducts; The average amount shown is based on spending of couples getting married, not prices. This includes purchasesof both new and pre-owned items.
Services; The average amount shown is based on spending of couples getting married, not vendor prices. This includespurchases of services from professionals, someone that simply provides the service, or a hired family member or friend.
1552017 Weddings
$20,2752017 Avg Spend
$3,142,6252017 Total Sales
Table
© 2016 The Wedding Report Inc. - Page 4 of 196

Median Spending & Spending Range DetailsThis is the percent of weddings, number of weddings, and estimated total sales of weddings that spend within certain rangesfor Market Totals - Market Summary in Limestone TX - (County).
NOTE: Sum of the Spending Distribution estimated total sales may be more than the item total sales because we use themiddle point of the spending ranges to estimate the sales. For total sales use the item total sales value.
Spending Range Percent of Weddings Number of Weddings Total Sales
<$10,000 50.3% 78 $389,825
$10,000 - $19,999 26.6% 41 $618,450
$20,000 - $29,999 13.6% 21 $527,000
$30,000 - $49,999 6.8% 11 $421,600
$50,000 - $99,999 2.3% 4 $267,375
$100,000+ 0.6% 1 $0
1552017 Weddings
$20,2752017 Avg Spend
$ 12,2392016 Median Spend
Table
© 2016 The Wedding Report Inc. - Page 5 of 196

Seasonality of Engagements
Engagements are based on couples living in the location only.
136Engaged Couples
16.2Avg Months of Engagement
Month Percent of Engagements Number of Engagements
January 8.7% 12
February 8.7% 12
March 8.9% 12
April 7.9% 11
May 7.6% 10
June 6.2% 8
July 8.5% 12
August 7.1% 10
September 6.6% 9
October 7.4% 10
November 7.4% 10
December 15.1% 21
Table
© 2016 The Wedding Report Inc. - Page 6 of 196

Seasonality of Weddings
Month Percent of Weddings Number of Weddings
January 3.9% 6
February 5.0% 8
March 8.9% 14
April 10.1% 16
May 10.1% 16
June 11.7% 18
July 8.9% 14
August 8.9% 14
September 7.8% 12
October 10.1% 16
November 7.8% 12
December 6.7% 10
1552017 Weddings
Table
© 2016 The Wedding Report Inc. - Page 7 of 196

Number of Guests by Range
Range Percent of Weddings Number of Weddings
Less than 25 36.0% 56
25-50 7.0% 11
50-100 18.0% 28
101-150 18.0% 28
151-200 12.0% 19
201-300 6.0% 9
More than 300 2.0% 3
Average Spending by Number of Guests RangeThis is the average spending by number of guests range in Limestone TX - (County).
Range Average Spending
Less than 25 $8,412
25-50 $9,720
51-100 $13,272
101-150 $17,571
151-200 $23,179
201-300 $28,226
More than 300 $58,134
126Avg No. Guests US
54 - 64Avg No. Guests This Market
Table
Table
© 2016 The Wedding Report Inc. - Page 8 of 196

Travel DistanceThis is the distance that couples, living in the area, travel from their home to marry. It also includes the percent of weddingsthat travel into this market to marry.
Miles from Home Percent of Weddings Number of Weddings
Within 25 miles 36.0% 56
Within 50 miles 31.0% 48
Between 50 and 200 miles 18.0% 28
More than 200 miles 15.0% 23
49Travel Distance U.S.
67 - 77Travel Distance This Market
35%Weddings travel to This Market
Table
© 2016 The Wedding Report Inc. - Page 9 of 196

Full Item SummaryThis is the number of 2017 estimated weddings, estimated average amount spent, and estimated total sales for each item(product or service) we track. This includes weddings that originate and travel into this market.
Category Item Est Weddings Avg Spend Total Sales
Market Totals
Market Summary 155 $20,275 $3,142,625
Attire & Accessories
Dress Accessories 119 $212 $25,302
Tuxedo/suit/other Accessories 105 $98 $10,329
Tuxedo/suit/other Rent/purchase 116 $197 $22,901
Wedding Dress/es 126 $1,154 $144,885
Beauty & Spa
Hair Service 105 $64 $6,746
Makeup Service 90 $52 $4,675
Manicure & Pedicure 101 $43 $4,332
Entertainment
DJ/MC 91 $690 $63,100
Entertainment lighting 51 $322 $16,470
Live Band 31 $1,598 $49,538
Musician/s, Soloist, or Ensemble 48 $581 $27,917
Flowers & Decorations
Bouquets 122 $329 $40,286
Boutonnieres, Corsages 105 $145 $15,283
Event Decorations 112 $434 $48,434
Event Flowers & Arrangements 99 $598 $59,322
Event Table Centerpieces 112 $318 $35,489
Gifts & Favors
Gift/s for Attendants 91 $90 $8,230
Gift/s for Parents 82 $107 $8,790
Tips (for all services) 105 $338 $35,625
1552017 Weddings
$20,2752017 Avg Spend
$3,142,6252017 Total Sales
© 2016 The Wedding Report Inc. - Page 10 of 196

Wedding Favors 104 $210 $21,809
Invitations
Ceremony Programs 87 $128 $11,110
Engagement Announcements 65 $110 $7,161
Guest Book 109 $62 $6,727
Invitations & Reply Cards 124 $227 $28,148
Postage 121 $106 $12,815
Reception Menus 60 $126 $7,617
Save the Date Cards 91 $113 $10,334
Table Name and Escort/place Cards 78 $86 $6,665
Thank You Cards 115 $91 $10,438
Jewelry
Bracelet 36 $174 $6,203
Earrings 57 $149 $8,545
Engagement Ring 118 $3,188 $375,546
Necklace 43 $200 $8,680
Wedding ring/band for HER 116 $733 $85,211
Wedding ring/band for HIM 122 $427 $52,286
Photography & Video
Digital or Photo cd/dvd 73 $279 $20,325
Engagement Session 82 $378 $31,053
Photo Booth 34 $370 $12,617
Prints and/or Enlargements 81 $227 $18,296
Wedding album/s or photo book/s 74 $399 $29,686
Wedding Photographer 119 $1,538 $183,560
Wedding Videographer 57 $1,026 $58,841
Planner/Consultant
A La Carte Services 9 $905 $8,416
Day of Coordinator 22 $778 $16,883
For Getting Started 8 $838 $6,495
Full Service 23 $2,648 $61,566
Month of Direction 8 $1,019 $7,897
Venue, Catering & Rentals
© 2016 The Wedding Report Inc. - Page 11 of 196

Ceremony Officiator 109 $195 $21,158
Event Accessories 118 $297 $34,987
Event Bar Service 91 $2,166 $198,081
Event Food Service 115 $4,262 $488,851
Event Location 116 $3,298 $383,393
Event Rentals 104 $1,585 $164,602
Hotel Room for After Reception 93 $287 $26,691
Limo Rental 47 $440 $20,460
Other Transportation 40 $472 $19,022
Rehearsal Dinner 95 $521 $49,261
Wedding Cake/dessert 121 $381 $46,063
Note About Average SpendingProducts; The average amount shown is based on spending of couples getting married, not prices. This includes purchasesof both new and pre-owned items.
Services; The average amount shown is based on spending of couples getting married, not vendor prices. This includespurchases of services from professionals, someone that simply provides the service, or a hired family member or friend.
© 2016 The Wedding Report Inc. - Page 12 of 196

Online MarketThe Online Market includes what couples purchased via a computer and/or a mobile device.
Category Item Total ItemWeddings
OnlineDemand
OnlineWeddings
Online TotalSales
Attire & Accessories
Dress Accessories 119 13.0% 16 $3,289
Tuxedo/suit/other Accessories 105 9.0% 9 $930
Tuxedo/suit/otherRent/purchase
116 8.0% 9 $1,832
Wedding Dress/es 126 11.0% 14 $15,937
Beauty & Spa
Hair Service 105 6.0% 6 $405
Makeup Service 90 7.0% 6 $327
Manicure & Pedicure 101 5.0% 5 $217
Entertainment
DJ/MC 91 13.0% 12 $8,203
Entertainment lighting 51 5.0% 3 $824
Live Band 31 6.0% 2 $2,972
Musician/s, Soloist, orEnsemble
48 8.0% 4 $2,233
Flowers & Decorations
Bouquets 122 14.0% 17 $5,640
Boutonnieres, Corsages 105 12.0% 13 $1,834
Event Decorations 112 23.0% 26 $11,140
Event Flowers & Arrangements 99 12.0% 12 $7,119
Event Table Centerpieces 112 20.0% 22 $7,098
Gifts & Favors
Gift/s for Attendants 91 32.0% 29 $2,634
Gift/s for Parents 82 24.0% 20 $2,110
Wedding Favors 104 36.0% 37 $7,851
Invitations
$3,142,6252017 Total Wedding Sales
$409,5582017 Total Online Wedding Sales
© 2016 The Wedding Report Inc. - Page 13 of 196

Ceremony Programs 87 22.0% 19 $2,444
Engagement Announcements 65 25.0% 16 $1,790
Guest Book 109 26.0% 28 $1,749
Invitations & Reply Cards 124 40.0% 50 $11,259
Postage 121 33.0% 40 $4,229
Reception Menus 60 14.0% 8 $1,066
Save the Date Cards 91 40.0% 37 $4,134
Table Name and Escort/placeCards
78 26.0% 20 $1,733
Thank You Cards 115 35.0% 40 $3,653
Jewelry
Bracelet 36 5.0% 2 $310
Earrings 57 5.0% 3 $427
Engagement Ring 118 12.0% 14 $45,066
Necklace 43 5.0% 2 $434
Wedding ring/band for HER 116 11.0% 13 $9,373
Wedding ring/band for HIM 122 12.0% 15 $6,274
Photography & Video
Digital or Photo cd/dvd 73 20.0% 15 $4,065
Engagement Session 82 12.0% 10 $3,726
Photo Booth 34 7.0% 2 $883
Prints and/or Enlargements 81 31.0% 25 $5,672
Wedding album/s or photobook/s
74 24.0% 18 $7,125
Wedding Photographer 119 15.0% 18 $27,534
Wedding Videographer 57 7.0% 4 $4,119
Planner/Consultant
A La Carte Services 9 7.0% 1 $589
Day of Coordinator 22 6.0% 1 $1,013
For Getting Started 8 7.0% 1 $455
Full Service 23 6.0% 1 $3,694
Month of Direction 8 0% 0 $0
Venue, Catering & Rentals
Ceremony Officiator 109 6.0% 7 $1,269
© 2016 The Wedding Report Inc. - Page 14 of 196

Event Accessories 118 26.0% 31 $9,097
Event Bar Service 91 10.0% 9 $19,808
Event Food Service 115 10.0% 11 $48,885
Event Location 116 12.0% 14 $46,007
Event Rentals 104 16.0% 17 $26,336
Hotel Room for After Reception 93 37.0% 34 $9,876
Limo Rental 47 12.0% 6 $2,455
Other Transportation 40 12.0% 5 $2,283
Rehearsal Dinner 95 9.0% 9 $4,433
Wedding Cake/dessert 121 7.0% 8 $3,224
© 2016 The Wedding Report Inc. - Page 15 of 196

Competitive LandscapeThis is the estimated number of businesses, estimated weddings served per business per year, estimated gross sales perbusiness per year for all categories that we track in Limestone TX - (County).
Category Est Businesses Est Weddings per Est Gross Sales per
Attire & Accessories 1 155 $203,360
Beauty & Spa 3 36 $3,672
Entertainment 2 55 $55,715
Flowers & Decorations 3 50 $64,150
Gifts & Favors 1 113 $54,240
Invitations 2 71 $46,292
Jewelry 3 46 $159,206
Photography & Video 5 27 $61,722
Planner/Consultant 1 18 $11,754
Venue, Catering & Rentals 3 48 $443,280
Table
© 2016 The Wedding Report Inc. - Page 16 of 196

Weddings and Spending by Age GroupThis shows the number of weddings and spending by age group.
Age % of Weddings Number of Weddings Average Spending
Age 15-19 2.3% 4 $ 18,856
Age 20-24 17.6% 27 $ 17,234
Age 25-29 27.8% 43 $ 21,897
Age 30-34 18.8% 29 $ 21,289
Age 35-39 9.7% 15 $ 16,828
Age 40-44 6.8% 11 $ 17,031
Age 45-49 5.1% 8 $ 12,773
Age 50+ 11.8% 18 $ 20,731
Table
© 2016 The Wedding Report Inc. - Page 17 of 196

Weddings and Spending by EducationThis shows the number of weddings and spending by type of education.
Education Level % of Weddings No. of Weddings Average Spending
No High School Diploma 15.3% 24 $ 40,145
High School Diploma 28.2% 44 $ 15,004
Some College 27.7% 43 $ 13,787
Professional Degree 1.1% 2 $ 10,746
Associates Degree 8.5% 13 $ 15,206
Bachelors Degree 12.4% 19 $ 16,828
Masters or Doctorate Degree 6.8% 11 $ 24,127
Table
© 2016 The Wedding Report Inc. - Page 18 of 196

Weddings and Spending by Household IncomeThis shows the number of weddings and spending by household income.
Household Income Percent of Weddings No. of Weddings Average Spending
Less than $25,000 18.5% 29 $ 8,110
$25,000-50,000 30.3% 47 $ 9,327
$50,000-75,000 24.2% 38 $ 11,354
$75,000-100,000 15.2% 24 $ 13,179
$100,000-150,000 9.0% 14 $ 15,409
$150,000-200,000 2.2% 3 $ 16,017
More than $200,000 0.6% 1 $0
Table
© 2016 The Wedding Report Inc. - Page 19 of 196

Weddings and Spending by OccupationThis shows the number of weddings and spending by occupation.
Occupation % of Weddings No. of Weddings Average Spending
Architecture & Engineering 2.3% 4 $ 31,426
Arts Design Entertainment Sports & Media 1.7% 3 $ 21,694
Building And Grounds Cleaning & Maintenance 2.8% 4 $ 8,313
Business & Financial Operations 5.1% 8 $ 26,155
Community & Social Services 1.1% 2 $ 16,017
Computer & Mathematical Science 2.8% 4 $ 20,072
Construction & Extraction 6.3% 10 $ 22,100
Education Training & Library 6.8% 11 $ 18,856
Farming Fishing & Forestry 0 0 $0
Food Preparation & Serving Related 4.5% 7 $ 13,990
Healthcare Practitioners & Technical 5.7% 9 $ 20,478
Healthcare Support 2.3% 4 $ 14,801
Installation Maintenance & Repair 4.0% 6 $ 10,340
Legal 1.1% 2 $ 25,749
Life Physical & Social Science 1.1% 2 $ 15,409
Management 8.5% 13 $ 20,275
Military Specific 1.7% 3 $ 17,639
Office & Administrative Support 13.1% 20 $ 16,220
Personal Care & Service 2.8% 4 $ 16,626
Production 5.7% 9 $ 16,828
Protective Service 2.8% 4 $ 18,045
Sales & Related 11.4% 18 $ 17,639
Transportation & Material Moving 5.7% 9 $ 19,870
Table
© 2016 The Wedding Report Inc. - Page 20 of 196

Weddings and Spending by Race
Race Percent of Weddings No. of Weddings Average Spending
White-Caucasian 76.8% 119 $ 16,423
Black-African American 10.7% 17 $ 18,248
Asian 0.0% 0 $0
Other 12.4% 19 $ 23,114
Of Hispanic, Latino, or Spanish Origin* 17.0% 26 $ 20,275
* Included in all races
Table
© 2016 The Wedding Report Inc. - Page 21 of 196

Attire & Accessories - Dress Accessories
© 2016 The Wedding Report Inc. - Page 22 of 196

Item SummaryThis is the number of estimated weddings, estimated average amount spent per wedding, and estimated total sales for: Attire& Accessories - Dress Accessories in Limestone TX - (County). Includes headpiece, veil, shoes, lingerie, sash, handbag,garter, etc.
NOTE: County numbers will not equal County Clerk numbers because couples can marry anywhere within the State.
NOTE: Estimated weddings equals the demand for this product or service only and may not equal total number of weddingsfor the entire market.
Year Number of Weddings (Demand) Average Spending per Wedding Total Sales
2008 153 $228 $34,786
2009 139 $208 $28,974
2010 143 $215 $30,650
2011 138 $204 $28,132
2012 143 $206 $29,545
2013 136 $209 $28,491
2014 138 $213 $29,475
2015 130 $214 $27,767
2016 133 $211 $28,010
2017 119 $212 $25,302
2018 122 $210 $25,710
2019 125 $210 $26,195
2020 127 $209 $26,553
2021 129 $209 $26,898
2022 127 $207 $26,318
Note About Average SpendingProducts; The average amount shown is based on spending of couples getting married, not prices. This includes purchasesof both new and pre-owned items.
Services; The average amount shown is based on spending of couples getting married, not vendor prices. This includespurchases of services from professionals, someone that simply provides the service, or a hired family member or friend.
1192017 Weddings
$2122017 Avg Spend
$25,3022017 Total Sales
Table
© 2016 The Wedding Report Inc. - Page 23 of 196

Median Spending & Spending Range DetailsThis is the percent of weddings, number of weddings, and estimated total sales of weddings that spend within certain rangesfor Attire & Accessories - Dress Accessories in Limestone TX - (County).
NOTE: Sum of the Spending Distribution estimated total sales may be more than the item total sales because we use themiddle point of the spending ranges to estimate the sales. For total sales use the item total sales value.
Spending Range Percent of Weddings Number of Weddings Total Sales
<$50 22.7% 27 $ 675
$50 - 100 25.6% 30 $ 2,285
$101 - 250 25.6% 30 $ 5,331
$251 - 500 15.3% 18 $ 6,828
$501 - 1000 8.0% 10 $ 7,140
$1000+ 2.8% 3 $ 4,998
Average Spending by Number of Guests RangeThis is the average spending by number of guests range for Dress Accessories in Limestone TX - (County).
Range Average Spending
Less than 25 $133
25-50 $162
51-100 $166
101-150 $180
151-200 $211
201-300 $236
More than 300 $367
1192017 Weddings
$2122017 Avg Spend
$ 882016 Median Spend
Table
Table
© 2016 The Wedding Report Inc. - Page 24 of 196

Attire & Accessories - Tuxedo/suit/otherAccessories
© 2016 The Wedding Report Inc. - Page 25 of 196

Item SummaryThis is the number of estimated weddings, estimated average amount spent per wedding, and estimated total sales for: Attire& Accessories - Tuxedo/suit/other Accessories in Limestone TX - (County). Includes cuff links, cummerbund, tie, pocketsquare, shoes, etc.
NOTE: County numbers will not equal County Clerk numbers because couples can marry anywhere within the State.
NOTE: Estimated weddings equals the demand for this product or service only and may not equal total number of weddingsfor the entire market.
Year Number of Weddings (Demand) Average Spending per Wedding Total Sales
2008 140 $189 $26,466
2009 133 $145 $19,333
2010 137 $103 $14,072
2011 142 $92 $13,049
2012 147 $92 $13,566
2013 140 $95 $13,315
2014 133 $94 $12,480
2015 125 $96 $11,958
2016 126 $97 $12,190
2017 105 $98 $10,329
2018 108 $99 $10,704
2019 112 $99 $11,066
2020 114 $100 $11,385
2021 115 $99 $11,434
2022 114 $95 $10,840
Note About Average SpendingProducts; The average amount shown is based on spending of couples getting married, not prices. This includes purchasesof both new and pre-owned items.
Services; The average amount shown is based on spending of couples getting married, not vendor prices. This includespurchases of services from professionals, someone that simply provides the service, or a hired family member or friend.
1052017 Weddings
$982017 Avg Spend
$10,3292017 Total Sales
Table
© 2016 The Wedding Report Inc. - Page 26 of 196

Median Spending & Spending Range DetailsThis is the percent of weddings, number of weddings, and estimated total sales of weddings that spend within certain rangesfor Attire & Accessories - Tuxedo/suit/other Accessories in Limestone TX - (County).
NOTE: Sum of the Spending Distribution estimated total sales may be more than the item total sales because we use themiddle point of the spending ranges to estimate the sales. For total sales use the item total sales value.
Spending Range Percent of Weddings Number of Weddings Total Sales
<$50 38.6% 41 $ 1,013
$50 - 100 34.7% 36 $ 2,733
$101 - 250 19.3% 20 $ 3,546
$251 - 500 5.7% 6 $ 2,244
$501 - 1000 1.1% 1 $ 866
$1000+ 0.6% 1 $0
Average Spending by Number of Guests RangeThis is the average spending by number of guests range for Tuxedo/suit/other Accessories in Limestone TX - (County).
Range Average Spending
Less than 25 $75
25-50 $77
51-100 $80
101-150 $80
151-200 $93
201-300 $108
More than 300 $176
1052017 Weddings
$982017 Avg Spend
$ 542016 Median Spend
Table
Table
© 2016 The Wedding Report Inc. - Page 27 of 196

Attire & Accessories - Tuxedo/suit/otherRent/purchase
© 2016 The Wedding Report Inc. - Page 28 of 196

Item SummaryThis is the number of estimated weddings, estimated average amount spent per wedding, and estimated total sales for: Attire& Accessories - Tuxedo/suit/other Rent/purchase in Limestone TX - (County). Tuxedo (purchased or rented), suit(purchased or rented), or other attire options for groom only.
NOTE: County numbers will not equal County Clerk numbers because couples can marry anywhere within the State.
NOTE: Estimated weddings equals the demand for this product or service only and may not equal total number of weddingsfor the entire market.
Year Number of Weddings (Demand) Average Spending per Wedding Total Sales
2008 146 $231 $33,795
2009 137 $228 $31,307
2010 139 $251 $34,789
2011 136 $186 $25,283
2012 141 $186 $26,300
2013 136 $189 $25,764
2014 135 $189 $25,447
2015 126 $192 $24,248
2016 129 $196 $25,325
2017 116 $197 $22,901
2018 119 $196 $23,373
2019 123 $193 $23,762
2020 125 $187 $23,450
2021 127 $186 $23,631
2022 126 $184 $23,094
Note About Average SpendingProducts; The average amount shown is based on spending of couples getting married, not prices. This includes purchasesof both new and pre-owned items.
Services; The average amount shown is based on spending of couples getting married, not vendor prices. This includespurchases of services from professionals, someone that simply provides the service, or a hired family member or friend.
1162017 Weddings
$1972017 Avg Spend
$22,9012017 Total Sales
Table
© 2016 The Wedding Report Inc. - Page 29 of 196

Median Spending & Spending Range DetailsThis is the percent of weddings, number of weddings, and estimated total sales of weddings that spend within certain rangesfor Attire & Accessories - Tuxedo/suit/other Rent/purchase in Limestone TX - (County).
NOTE: Sum of the Spending Distribution estimated total sales may be more than the item total sales because we use themiddle point of the spending ranges to estimate the sales. For total sales use the item total sales value.
Spending Range Percent of Weddings Number of Weddings Total Sales
<$50 13.1% 15 $ 380
$50 - 100 28.4% 33 $ 2,471
$101 - 250 39.2% 45 $ 7,958
$251 - 500 12.5% 15 $ 5,438
$501 - 1000 4.5% 5 $ 3,915
$1000+ 2.3% 3 $ 4,002
Average Spending by Number of Guests RangeThis is the average spending by number of guests range for Tuxedo/suit/other Rent/purchase in Limestone TX - (County).
Range Average Spending
Less than 25 $173
25-50 $147
51-100 $176
101-150 $169
151-200 $193
201-300 $187
More than 300 $287
1162017 Weddings
$1972017 Avg Spend
$ 1422016 Median Spend
Table
Table
© 2016 The Wedding Report Inc. - Page 30 of 196

Attire & Accessories - Wedding Dress/es
© 2016 The Wedding Report Inc. - Page 31 of 196

Item SummaryThis is the number of estimated weddings, estimated average amount spent per wedding, and estimated total sales for: Attire& Accessories - Wedding Dress/es in Limestone TX - (County).
NOTE: County numbers will not equal County Clerk numbers because couples can marry anywhere within the State.
NOTE: Estimated weddings equals the demand for this product or service only and may not equal total number of weddingsfor the entire market.
Year Number of Weddings (Demand) Average Spending per Wedding Total Sales
2008 161 $847 $136,308
2009 153 $954 $146,181
2010 154 $977 $150,888
2011 154 $1,084 $166,567
2012 160 $1,104 $176,176
2013 152 $1,126 $170,792
2014 148 $1,131 $167,083
2015 138 $1,162 $160,821
2016 142 $1,151 $162,982
2017 126 $1,154 $144,885
2018 129 $1,146 $147,593
2019 133 $1,145 $152,102
2020 135 $1,140 $154,242
2021 137 $1,152 $157,766
2022 135 $1,162 $157,207
Note About Average SpendingProducts; The average amount shown is based on spending of couples getting married, not prices. This includes purchasesof both new and pre-owned items.
Services; The average amount shown is based on spending of couples getting married, not vendor prices. This includespurchases of services from professionals, someone that simply provides the service, or a hired family member or friend.
1262017 Weddings
$1,1542017 Avg Spend
$144,8852017 Total Sales
Table
© 2016 The Wedding Report Inc. - Page 32 of 196

Median Spending & Spending Range DetailsThis is the percent of weddings, number of weddings, and estimated total sales of weddings that spend within certain rangesfor Attire & Accessories - Wedding Dress/es in Limestone TX - (County).
NOTE: Sum of the Spending Distribution estimated total sales may be more than the item total sales because we use themiddle point of the spending ranges to estimate the sales. For total sales use the item total sales value.
Spending Range Percent of Weddings Number of Weddings Total Sales
<$250 13.6% 17 $ 4,284
$250 - $500 20.3% 26 $ 9,592
$501 - $1,000 31.1% 39 $ 29,390
$1,001 - $2,500 27.7% 35 $ 61,079
$2,501 - $5,000 5.1% 6 $ 24,097
$5,000+ 2.3% 3 $ 21,735
Average Spending by Number of Guests RangeThis is the average spending by number of guests range for Wedding Dress/es in Limestone TX - (County).
Range Average Spending
Less than 25 $596
25-50 $713
51-100 $841
101-150 $1,000
151-200 $1,255
201-300 $1,372
More than 300 $2,096
1262017 Weddings
$1,1542017 Avg Spend
$ 7572016 Median Spend
Table
Table
© 2016 The Wedding Report Inc. - Page 33 of 196

Beauty & Spa - Hair Service
© 2016 The Wedding Report Inc. - Page 34 of 196

Item SummaryThis is the number of estimated weddings, estimated average amount spent per wedding, and estimated total sales for:Beauty & Spa - Hair Service in Limestone TX - (County). Per person
NOTE: County numbers will not equal County Clerk numbers because couples can marry anywhere within the State.
NOTE: Estimated weddings equals the demand for this product or service only and may not equal total number of weddingsfor the entire market.
Year Number of Weddings (Demand) Average Spending per Wedding Total Sales
2008 153 $77 $11,748
2009 139 $76 $10,587
2010 137 $67 $9,154
2011 136 $62 $8,428
2012 141 $62 $8,767
2013 134 $61 $8,198
2014 133 $62 $8,232
2015 125 $63 $7,847
2016 126 $64 $8,043
2017 105 $64 $6,746
2018 108 $66 $7,136
2019 112 $66 $7,377
2020 114 $66 $7,514
2021 115 $66 $7,623
2022 114 $66 $7,531
Note About Average SpendingProducts; The average amount shown is based on spending of couples getting married, not prices. This includes purchasesof both new and pre-owned items.
Services; The average amount shown is based on spending of couples getting married, not vendor prices. This includespurchases of services from professionals, someone that simply provides the service, or a hired family member or friend.
1052017 Weddings
$642017 Avg Spend
$6,7462017 Total Sales
Table
© 2016 The Wedding Report Inc. - Page 35 of 196

Median Spending & Spending Range DetailsThis is the percent of weddings, number of weddings, and estimated total sales of weddings that spend within certain rangesfor Beauty & Spa - Hair Service in Limestone TX - (County).
NOTE: Sum of the Spending Distribution estimated total sales may be more than the item total sales because we use themiddle point of the spending ranges to estimate the sales. For total sales use the item total sales value.
Spending Range Percent of Weddings Number of Weddings Total Sales
<$25 15.3% 16 $ 209
$26 - 50 31.8% 33 $ 1,269
$51 - 75 23.3% 24 $ 1,541
$76 - 100 16.5% 17 $ 1,525
$101 - 200 9.7% 10 $ 1,528
$200+ 3.4% 4 $ 1,071
Average Spending by Number of Guests RangeThis is the average spending by number of guests range for Hair Service in Limestone TX - (County).
Range Average Spending
Less than 25 $55
25-50 $51
51-100 $57
101-150 $60
151-200 $61
201-300 $58
More than 300 $70
1052017 Weddings
$642017 Avg Spend
$ 522016 Median Spend
Table
Table
© 2016 The Wedding Report Inc. - Page 36 of 196

Beauty & Spa - Makeup Service
© 2016 The Wedding Report Inc. - Page 37 of 196

Item SummaryThis is the number of estimated weddings, estimated average amount spent per wedding, and estimated total sales for:Beauty & Spa - Makeup Service in Limestone TX - (County). Per person
NOTE: County numbers will not equal County Clerk numbers because couples can marry anywhere within the State.
NOTE: Estimated weddings equals the demand for this product or service only and may not equal total number of weddingsfor the entire market.
Year Number of Weddings (Demand) Average Spending per Wedding Total Sales
2008 111 $61 $6,757
2009 103 $60 $6,209
2010 103 $57 $5,869
2011 108 $49 $5,309
2012 113 $49 $5,543
2013 108 $50 $5,376
2014 108 $50 $5,423
2015 102 $51 $5,206
2016 104 $51 $5,326
2017 90 $52 $4,675
2018 92 $53 $4,888
2019 94 $53 $4,980
2020 96 $53 $5,072
2021 97 $52 $5,062
2022 96 $51 $4,905
Note About Average SpendingProducts; The average amount shown is based on spending of couples getting married, not prices. This includes purchasesof both new and pre-owned items.
Services; The average amount shown is based on spending of couples getting married, not vendor prices. This includespurchases of services from professionals, someone that simply provides the service, or a hired family member or friend.
902017 Weddings
$522017 Avg Spend
$4,6752017 Total Sales
Table
© 2016 The Wedding Report Inc. - Page 38 of 196

Median Spending & Spending Range DetailsThis is the percent of weddings, number of weddings, and estimated total sales of weddings that spend within certain rangesfor Beauty & Spa - Makeup Service in Limestone TX - (County).
NOTE: Sum of the Spending Distribution estimated total sales may be more than the item total sales because we use themiddle point of the spending ranges to estimate the sales. For total sales use the item total sales value.
Spending Range Percent of Weddings Number of Weddings Total Sales
<$25 26.6% 24 $ 311
$26 - 50 35.6% 32 $ 1,218
$51 - 75 19.2% 17 $ 1,089
$76 - 100 11.3% 10 $ 895
$101 - 200 5.1% 5 $ 689
$200+ 2.3% 2 $ 621
Average Spending by Number of Guests RangeThis is the average spending by number of guests range for Makeup Service in Limestone TX - (County).
Range Average Spending
Less than 25 $42
25-50 $41
51-100 $45
101-150 $48
151-200 $48
201-300 $49
More than 300 $71
902017 Weddings
$522017 Avg Spend
$ 402016 Median Spend
Table
Table
© 2016 The Wedding Report Inc. - Page 39 of 196

Beauty & Spa - Manicure & Pedicure
© 2016 The Wedding Report Inc. - Page 40 of 196

Item SummaryThis is the number of estimated weddings, estimated average amount spent per wedding, and estimated total sales for:Beauty & Spa - Manicure & Pedicure in Limestone TX - (County). Per person
NOTE: County numbers will not equal County Clerk numbers because couples can marry anywhere within the State.
NOTE: Estimated weddings equals the demand for this product or service only and may not equal total number of weddingsfor the entire market.
Year Number of Weddings (Demand) Average Spending per Wedding Total Sales
2008 144 $50 $7,210
2009 133 $49 $6,533
2010 121 $44 $5,314
2011 122 $41 $5,008
2012 129 $41 $5,300
2013 125 $41 $5,117
2014 123 $42 $5,184
2015 114 $42 $4,796
2016 117 $43 $5,023
2017 101 $43 $4,332
2018 103 $44 $4,547
2019 105 $44 $4,633
2020 107 $44 $4,719
2021 109 $44 $4,792
2022 108 $43 $4,626
Note About Average SpendingProducts; The average amount shown is based on spending of couples getting married, not prices. This includes purchasesof both new and pre-owned items.
Services; The average amount shown is based on spending of couples getting married, not vendor prices. This includespurchases of services from professionals, someone that simply provides the service, or a hired family member or friend.
1012017 Weddings
$432017 Avg Spend
$4,3322017 Total Sales
Table
© 2016 The Wedding Report Inc. - Page 41 of 196

Median Spending & Spending Range DetailsThis is the percent of weddings, number of weddings, and estimated total sales of weddings that spend within certain rangesfor Beauty & Spa - Manicure & Pedicure in Limestone TX - (County).
NOTE: Sum of the Spending Distribution estimated total sales may be more than the item total sales because we use themiddle point of the spending ranges to estimate the sales. For total sales use the item total sales value.
Spending Range Percent of Weddings Number of Weddings Total Sales
<$25 20.8% 21 $ 273
$26 - 50 50.0% 51 $ 1,919
$51 - 75 20.2% 20 $ 1,285
$76 - 100 6.2% 6 $ 551
$101 - 200 1.7% 2 $ 258
$200+ 1.1% 1 $ 333
Average Spending by Number of Guests RangeThis is the average spending by number of guests range for Manicure & Pedicure in Limestone TX - (County).
Range Average Spending
Less than 25 $36
25-50 $34
51-100 $38
101-150 $39
151-200 $40
201-300 $41
More than 300 $59
1012017 Weddings
$432017 Avg Spend
$ 352016 Median Spend
Table
Table
© 2016 The Wedding Report Inc. - Page 42 of 196

Entertainment - DJ/MC
© 2016 The Wedding Report Inc. - Page 43 of 196

Item SummaryThis is the number of estimated weddings, estimated average amount spent per wedding, and estimated total sales for:Entertainment - DJ/MC in Limestone TX - (County).
NOTE: County numbers will not equal County Clerk numbers because couples can marry anywhere within the State.
NOTE: Estimated weddings equals the demand for this product or service only and may not equal total number of weddingsfor the entire market.
Year Number of Weddings (Demand) Average Spending per Wedding Total Sales
2008 105 $622 $64,999
2009 111 $671 $74,776
2010 121 $675 $81,527
2011 120 $633 $76,068
2012 125 $633 $79,277
2013 119 $632 $75,233
2014 122 $644 $78,278
2015 114 $683 $77,985
2016 115 $685 $78,809
2017 91 $690 $63,100
2018 94 $692 $64,917
2019 97 $695 $67,554
2020 99 $697 $69,003
2021 101 $700 $70,455
2022 99 $701 $69,700
Note About Average SpendingProducts; The average amount shown is based on spending of couples getting married, not prices. This includes purchasesof both new and pre-owned items.
Services; The average amount shown is based on spending of couples getting married, not vendor prices. This includespurchases of services from professionals, someone that simply provides the service, or a hired family member or friend.
912017 Weddings
$6902017 Avg Spend
$63,1002017 Total Sales
Table
© 2016 The Wedding Report Inc. - Page 44 of 196

Median Spending & Spending Range DetailsThis is the percent of weddings, number of weddings, and estimated total sales of weddings that spend within certain rangesfor Entertainment - DJ/MC in Limestone TX - (County).
NOTE: Sum of the Spending Distribution estimated total sales may be more than the item total sales because we use themiddle point of the spending ranges to estimate the sales. For total sales use the item total sales value.
Spending Range Percent of Weddings Number of Weddings Total Sales
<$250 22.5% 20 $ 5,119
$250 - 500 30.9% 28 $ 10,545
$501 - 1000 31.5% 29 $ 21,499
$1001 - 2000 12.9% 12 $ 17,609
$2001 - 3500 1.7% 2 $ 4,254
$3500+ 0.6% 1 $0
Average Spending by Number of Guests RangeThis is the average spending by number of guests range for DJ/MC in Limestone TX - (County).
Range Average Spending
Less than 25 $401
25-50 $420
51-100 $528
101-150 $649
151-200 $700
201-300 $712
More than 300 $865
912017 Weddings
$6902017 Avg Spend
$ 5092016 Median Spend
Table
Table
© 2016 The Wedding Report Inc. - Page 45 of 196

Entertainment - Entertainment lighting
© 2016 The Wedding Report Inc. - Page 46 of 196

Item SummaryThis is the number of estimated weddings, estimated average amount spent per wedding, and estimated total sales for:Entertainment - Entertainment lighting in Limestone TX - (County).
NOTE: County numbers will not equal County Clerk numbers because couples can marry anywhere within the State.
NOTE: Estimated weddings equals the demand for this product or service only and may not equal total number of weddingsfor the entire market.
Year Number of Weddings (Demand) Average Spending per Wedding Total Sales
2016 58 $320 $18,691
2017 51 $322 $16,470
2018 52 $317 $16,633
2019 55 $318 $17,515
2020 56 $317 $17,784
2021 56 $318 $17,840
2022 55 $318 $17,624
Note About Average SpendingProducts; The average amount shown is based on spending of couples getting married, not prices. This includes purchasesof both new and pre-owned items.
Services; The average amount shown is based on spending of couples getting married, not vendor prices. This includespurchases of services from professionals, someone that simply provides the service, or a hired family member or friend.
512017 Weddings
$3222017 Avg Spend
$16,4702017 Total Sales
Table
© 2016 The Wedding Report Inc. - Page 47 of 196

Median Spending & Spending Range DetailsThis is the percent of weddings, number of weddings, and estimated total sales of weddings that spend within certain rangesfor Entertainment - Entertainment lighting in Limestone TX - (County).
NOTE: Sum of the Spending Distribution estimated total sales may be more than the item total sales because we use themiddle point of the spending ranges to estimate the sales. For total sales use the item total sales value.
Spending Range Percent of Weddings Number of Weddings Total Sales
<$100 35.8% 18 $ 913
$100 - 250 29.5% 15 $ 2,633
$251 - 500 17.6% 9 $ 3,366
$501 - 1000 10.2% 5 $ 3,902
$1001 - 1500 4.0% 2 $ 2,550
$1500+ 2.8% 1 $ 3,213
Average Spending by Number of Guests RangeThis is the average spending by number of guests range for Entertainment lighting in Limestone TX - (County).
Range Average Spending
Less than 25 $188
25-50 $183
51-100 $273
101-150 $274
151-200 $315
201-300 $506
More than 300 $597
512017 Weddings
$3222017 Avg Spend
$ 1582016 Median Spend
Table
Table
© 2016 The Wedding Report Inc. - Page 48 of 196

Entertainment - Live Band
© 2016 The Wedding Report Inc. - Page 49 of 196

Item SummaryThis is the number of estimated weddings, estimated average amount spent per wedding, and estimated total sales for:Entertainment - Live Band in Limestone TX - (County).
NOTE: County numbers will not equal County Clerk numbers because couples can marry anywhere within the State.
NOTE: Estimated weddings equals the demand for this product or service only and may not equal total number of weddingsfor the entire market.
Year Number of Weddings (Demand) Average Spending per Wedding Total Sales
2008 48 $1,652 $79,412
2009 38 $1,540 $58,227
2010 50 $1,580 $78,210
2011 47 $1,396 $66,003
2012 48 $1,393 $67,533
2013 46 $1,478 $68,106
2014 50 $1,517 $76,593
2015 47 $1,599 $74,689
2016 46 $1,581 $72,758
2017 31 $1,598 $49,538
2018 32 $1,590 $50,562
2019 32 $1,589 $51,484
2020 33 $1,583 $52,239
2021 33 $1,583 $52,239
2022 33 $1,579 $51,475
Note About Average SpendingProducts; The average amount shown is based on spending of couples getting married, not prices. This includes purchasesof both new and pre-owned items.
Services; The average amount shown is based on spending of couples getting married, not vendor prices. This includespurchases of services from professionals, someone that simply provides the service, or a hired family member or friend.
312017 Weddings
$1,5982017 Avg Spend
$49,5382017 Total Sales
Table
© 2016 The Wedding Report Inc. - Page 50 of 196

Median Spending & Spending Range DetailsThis is the percent of weddings, number of weddings, and estimated total sales of weddings that spend within certain rangesfor Entertainment - Live Band in Limestone TX - (County).
NOTE: Sum of the Spending Distribution estimated total sales may be more than the item total sales because we use themiddle point of the spending ranges to estimate the sales. For total sales use the item total sales value.
Spending Range Percent of Weddings Number of Weddings Total Sales
<$250 22.6% 7 $ 1,752
$250 - 500 14.7% 5 $ 1,709
$501 - 1000 20.3% 6 $ 4,720
$1001 - 2000 18.1% 6 $ 8,417
$2001 - 3500 9.6% 3 $ 8,184
$3500+ 14.7% 5 $ 23,924
Average Spending by Number of Guests RangeThis is the average spending by number of guests range for Live Band in Limestone TX - (County).
Range Average Spending
Less than 25 $471
25-50 $545
51-100 $869
101-150 $1,370
151-200 $1,562
201-300 $1,871
More than 300 $2,770
312017 Weddings
$1,5982017 Avg Spend
$ 6152016 Median Spend
Table
Table
© 2016 The Wedding Report Inc. - Page 51 of 196
Entertainment - Musician/s, Soloist, or Ensemble
© 2016 The Wedding Report Inc. - Page 52 of 196

Item SummaryThis is the number of estimated weddings, estimated average amount spent per wedding, and estimated total sales for:Entertainment - Musician/s, Soloist, or Ensemble in Limestone TX - (County).
NOTE: County numbers will not equal County Clerk numbers because couples can marry anywhere within the State.
NOTE: Estimated weddings equals the demand for this product or service only and may not equal total number of weddingsfor the entire market.
Year Number of Weddings (Demand) Average Spending per Wedding Total Sales
2008 59 $488 $28,558
2009 44 $601 $26,312
2010 73 $504 $36,923
2011 65 $487 $31,660
2012 69 $486 $33,378
2013 63 $537 $34,024
2014 69 $547 $37,847
2015 66 $573 $37,669
2016 65 $576 $37,722
2017 48 $581 $27,917
2018 49 $577 $28,440
2019 52 $579 $30,015
2020 53 $584 $30,835
2021 53 $588 $31,046
2022 52 $591 $30,827
Note About Average SpendingProducts; The average amount shown is based on spending of couples getting married, not prices. This includes purchasesof both new and pre-owned items.
Services; The average amount shown is based on spending of couples getting married, not vendor prices. This includespurchases of services from professionals, someone that simply provides the service, or a hired family member or friend.
482017 Weddings
$5812017 Avg Spend
$27,9172017 Total Sales
Table
© 2016 The Wedding Report Inc. - Page 53 of 196

Median Spending & Spending Range DetailsThis is the percent of weddings, number of weddings, and estimated total sales of weddings that spend within certain rangesfor Entertainment - Musician/s, Soloist, or Ensemble in Limestone TX - (County).
NOTE: Sum of the Spending Distribution estimated total sales may be more than the item total sales because we use themiddle point of the spending ranges to estimate the sales. For total sales use the item total sales value.
Spending Range Percent of Weddings Number of Weddings Total Sales
<$250 46.9% 23 $ 5,628
$250 - 500 28.8% 14 $ 5,184
$501 - 1000 15.3% 7 $ 5,508
$1001 - 2000 5.6% 3 $ 4,032
$2001 - 3500 1.1% 1 $0
$3500+ 2.3% 1 $ 5,796
Average Spending by Number of Guests RangeThis is the average spending by number of guests range for Musician/s, Soloist, or Ensemble in Limestone TX - (County).
Range Average Spending
Less than 25 $386
25-50 $364
51-100 $471
101-150 $461
151-200 $520
201-300 $584
More than 300 $1,168
482017 Weddings
$5812017 Avg Spend
$ 3052016 Median Spend
Table
Table
© 2016 The Wedding Report Inc. - Page 54 of 196

Flowers & Decorations - Bouquets
© 2016 The Wedding Report Inc. - Page 55 of 196

Item SummaryThis is the number of estimated weddings, estimated average amount spent per wedding, and estimated total sales for:Flowers & Decorations - Bouquets in Limestone TX - (County). Total for all
NOTE: County numbers will not equal County Clerk numbers because couples can marry anywhere within the State.
NOTE: Estimated weddings equals the demand for this product or service only and may not equal total number of weddingsfor the entire market.
Year Number of Weddings (Demand) Average Spending per Wedding Total Sales
2008 161 $293 $47,152
2009 153 $242 $37,082
2010 154 $303 $46,795
2011 152 $279 $42,322
2012 158 $280 $44,117
2013 150 $298 $44,628
2014 148 $310 $45,796
2015 138 $319 $44,150
2016 142 $330 $46,728
2017 122 $329 $40,286
2018 126 $332 $41,703
2019 130 $337 $43,675
2020 132 $342 $45,144
2021 134 $348 $46,510
2022 132 $353 $46,607
Note About Average SpendingProducts; The average amount shown is based on spending of couples getting married, not prices. This includes purchasesof both new and pre-owned items.
Services; The average amount shown is based on spending of couples getting married, not vendor prices. This includespurchases of services from professionals, someone that simply provides the service, or a hired family member or friend.
1222017 Weddings
$3292017 Avg Spend
$40,2862017 Total Sales
Table
© 2016 The Wedding Report Inc. - Page 56 of 196

Median Spending & Spending Range DetailsThis is the percent of weddings, number of weddings, and estimated total sales of weddings that spend within certain rangesfor Flowers & Decorations - Bouquets in Limestone TX - (County).
NOTE: Sum of the Spending Distribution estimated total sales may be more than the item total sales because we use themiddle point of the spending ranges to estimate the sales. For total sales use the item total sales value.
Spending Range Percent of Weddings Number of Weddings Total Sales
<$100 33.9% 41 $ 2,068
$101 - 250 24.3% 30 $ 5,188
$251 - 500 19.2% 23 $ 8,784
$501 - 750 12.4% 15 $ 10,211
$751 - 1000 2.8% 3 $ 2,989
$1000+ 7.3% 9 $ 13,359
Average Spending by Number of Guests RangeThis is the average spending by number of guests range for Bouquets in Limestone TX - (County).
Range Average Spending
Less than 25 $255
25-50 $309
51-100 $334
101-150 $370
151-200 $437
201-300 $470
More than 300 $767
1222017 Weddings
$3292017 Avg Spend
$ 1732016 Median Spend
Table
Table
© 2016 The Wedding Report Inc. - Page 57 of 196

Flowers & Decorations - Boutonnieres, Corsages
© 2016 The Wedding Report Inc. - Page 58 of 196

Item SummaryThis is the number of estimated weddings, estimated average amount spent per wedding, and estimated total sales for:Flowers & Decorations - Boutonnieres, Corsages in Limestone TX - (County). Includes all purchased
NOTE: County numbers will not equal County Clerk numbers because couples can marry anywhere within the State.
NOTE: Estimated weddings equals the demand for this product or service only and may not equal total number of weddingsfor the entire market.
Year Number of Weddings (Demand) Average Spending per Wedding Total Sales
2008 146 $115 $16,824
2009 139 $99 $13,791
2010 145 $127 $18,357
2011 138 $117 $16,134
2012 143 $117 $16,780
2013 136 $128 $17,449
2014 137 $137 $18,702
2015 128 $140 $17,923
2016 129 $143 $18,477
2017 105 $145 $15,283
2018 108 $146 $15,786
2019 112 $150 $16,767
2020 114 $152 $17,305
2021 115 $154 $17,787
2022 114 $157 $17,914
Note About Average SpendingProducts; The average amount shown is based on spending of couples getting married, not prices. This includes purchasesof both new and pre-owned items.
Services; The average amount shown is based on spending of couples getting married, not vendor prices. This includespurchases of services from professionals, someone that simply provides the service, or a hired family member or friend.
1052017 Weddings
$1452017 Avg Spend
$15,2832017 Total Sales
Table
© 2016 The Wedding Report Inc. - Page 59 of 196

Median Spending & Spending Range DetailsThis is the percent of weddings, number of weddings, and estimated total sales of weddings that spend within certain rangesfor Flowers & Decorations - Boutonnieres, Corsages in Limestone TX - (County).
NOTE: Sum of the Spending Distribution estimated total sales may be more than the item total sales because we use themiddle point of the spending ranges to estimate the sales. For total sales use the item total sales value.
Spending Range Percent of Weddings Number of Weddings Total Sales
<$100 53.7% 56 $ 2,819
$101 - 250 35.0% 37 $ 6,431
$251 - 500 8.5% 9 $ 3,347
$501 - 750 1.7% 2 $ 1,205
$751 - 1000 0.6% 1 $0
$1000+ 0.6% 1 $0
Average Spending by Number of Guests RangeThis is the average spending by number of guests range for Boutonnieres, Corsages in Limestone TX - (County).
Range Average Spending
Less than 25 $82
25-50 $98
51-100 $111
101-150 $120
151-200 $147
201-300 $168
More than 300 $259
1052017 Weddings
$1452017 Avg Spend
$ 1002016 Median Spend
Table
Table
© 2016 The Wedding Report Inc. - Page 60 of 196

Flowers & Decorations - Event Decorations
© 2016 The Wedding Report Inc. - Page 61 of 196

Item SummaryThis is the number of estimated weddings, estimated average amount spent per wedding, and estimated total sales for:Flowers & Decorations - Event Decorations in Limestone TX - (County). Not table centerpieces, flowers, or accessories
NOTE: County numbers will not equal County Clerk numbers because couples can marry anywhere within the State.
NOTE: Estimated weddings equals the demand for this product or service only and may not equal total number of weddingsfor the entire market.
Year Number of Weddings (Demand) Average Spending per Wedding Total Sales
2008 136 $401 $54,476
2009 131 $434 $57,002
2010 131 $397 $51,880
2011 130 $412 $53,568
2012 133 $412 $54,928
2013 129 $413 $53,128
2014 131 $430 $56,287
2015 123 $435 $53,431
2016 126 $433 $54,415
2017 112 $434 $48,434
2018 114 $430 $49,226
2019 118 $442 $52,271
2020 120 $434 $52,275
2021 122 $446 $54,457
2022 121 $438 $52,832
Note About Average SpendingProducts; The average amount shown is based on spending of couples getting married, not prices. This includes purchasesof both new and pre-owned items.
Services; The average amount shown is based on spending of couples getting married, not vendor prices. This includespurchases of services from professionals, someone that simply provides the service, or a hired family member or friend.
1122017 Weddings
$4342017 Avg Spend
$48,4342017 Total Sales
Table
© 2016 The Wedding Report Inc. - Page 62 of 196

Median Spending & Spending Range DetailsThis is the percent of weddings, number of weddings, and estimated total sales of weddings that spend within certain rangesfor Flowers & Decorations - Event Decorations in Limestone TX - (County).
NOTE: Sum of the Spending Distribution estimated total sales may be more than the item total sales because we use themiddle point of the spending ranges to estimate the sales. For total sales use the item total sales value.
Spending Range Percent of Weddings Number of Weddings Total Sales
<$100 25.6% 29 $ 1,434
$101 - 250 18.2% 20 $ 3,567
$251 - 500 19.9% 22 $ 8,358
$501 - 750 11.4% 13 $ 8,618
$751 - 1000 14.8% 17 $ 14,504
$1000+ 10.2% 11 $ 17,136
Average Spending by Number of Guests RangeThis is the average spending by number of guests range for Event Decorations in Limestone TX - (County).
Range Average Spending
Less than 25 $192
25-50 $300
51-100 $324
101-150 $372
151-200 $440
201-300 $496
More than 300 $756
1122017 Weddings
$4342017 Avg Spend
$ 2452016 Median Spend
Table
Table
© 2016 The Wedding Report Inc. - Page 63 of 196

Flowers & Decorations - Event Flowers &Arrangements
© 2016 The Wedding Report Inc. - Page 64 of 196

Item SummaryThis is the number of estimated weddings, estimated average amount spent per wedding, and estimated total sales for:Flowers & Decorations - Event Flowers & Arrangements in Limestone TX - (County). Not table centerpieces
NOTE: County numbers will not equal County Clerk numbers because couples can marry anywhere within the State.
NOTE: Estimated weddings equals the demand for this product or service only and may not equal total number of weddingsfor the entire market.
Year Number of Weddings (Demand) Average Spending per Wedding Total Sales
2008 140 $695 $97,321
2009 131 $616 $80,905
2010 131 $658 $85,987
2011 130 $600 $78,012
2012 133 $601 $80,125
2013 129 $612 $78,728
2014 129 $604 $77,934
2015 121 $603 $73,023
2016 122 $600 $73,278
2017 99 $598 $59,322
2018 102 $590 $60,038
2019 105 $587 $61,811
2020 107 $582 $62,420
2021 107 $578 $61,991
2022 106 $573 $60,709
Note About Average SpendingProducts; The average amount shown is based on spending of couples getting married, not prices. This includes purchasesof both new and pre-owned items.
Services; The average amount shown is based on spending of couples getting married, not vendor prices. This includespurchases of services from professionals, someone that simply provides the service, or a hired family member or friend.
992017 Weddings
$5982017 Avg Spend
$59,3222017 Total Sales
Table
© 2016 The Wedding Report Inc. - Page 65 of 196

Median Spending & Spending Range DetailsThis is the percent of weddings, number of weddings, and estimated total sales of weddings that spend within certain rangesfor Flowers & Decorations - Event Flowers & Arrangements in Limestone TX - (County).
NOTE: Sum of the Spending Distribution estimated total sales may be more than the item total sales because we use themiddle point of the spending ranges to estimate the sales. For total sales use the item total sales value.
Spending Range Percent of Weddings Number of Weddings Total Sales
<$100 27.5% 27 $ 1,361
$101 - 250 16.9% 17 $ 2,928
$251 - 500 19.7% 20 $ 7,314
$501 - 750 18.0% 18 $ 12,029
$751 - 1000 6.2% 6 $ 5,371
$1000+ 11.8% 12 $ 17,523
Average Spending by Number of Guests RangeThis is the average spending by number of guests range for Event Flowers & Arrangements in Limestone TX - (County).
Range Average Spending
Less than 25 $270
25-50 $347
51-100 $425
101-150 $524
151-200 $640
201-300 $667
More than 300 $954
992017 Weddings
$5982017 Avg Spend
$ 1812016 Median Spend
Table
Table
© 2016 The Wedding Report Inc. - Page 66 of 196

Flowers & Decorations - Event TableCenterpieces
© 2016 The Wedding Report Inc. - Page 67 of 196

Item SummaryThis is the number of estimated weddings, estimated average amount spent per wedding, and estimated total sales for:Flowers & Decorations - Event Table Centerpieces in Limestone TX - (County).
NOTE: County numbers will not equal County Clerk numbers because couples can marry anywhere within the State.
NOTE: Estimated weddings equals the demand for this product or service only and may not equal total number of weddingsfor the entire market.
Year Number of Weddings (Demand) Average Spending per Wedding Total Sales
2008 150 $300 $45,144
2009 133 $308 $41,066
2010 145 $348 $50,300
2011 130 $308 $40,046
2012 135 $307 $41,549
2013 131 $311 $40,604
2014 133 $311 $41,291
2015 123 $317 $38,937
2016 126 $316 $39,712
2017 112 $318 $35,489
2018 114 $316 $36,176
2019 118 $316 $37,370
2020 120 $316 $38,062
2021 122 $316 $38,584
2022 121 $316 $38,116
Note About Average SpendingProducts; The average amount shown is based on spending of couples getting married, not prices. This includes purchasesof both new and pre-owned items.
Services; The average amount shown is based on spending of couples getting married, not vendor prices. This includespurchases of services from professionals, someone that simply provides the service, or a hired family member or friend.
1122017 Weddings
$3182017 Avg Spend
$35,4892017 Total Sales
Table
© 2016 The Wedding Report Inc. - Page 68 of 196

Median Spending & Spending Range DetailsThis is the percent of weddings, number of weddings, and estimated total sales of weddings that spend within certain rangesfor Flowers & Decorations - Event Table Centerpieces in Limestone TX - (County).
NOTE: Sum of the Spending Distribution estimated total sales may be more than the item total sales because we use themiddle point of the spending ranges to estimate the sales. For total sales use the item total sales value.
Spending Range Percent of Weddings Number of Weddings Total Sales
<$100 34.9% 39 $ 1,954
$101 - 250 30.9% 35 $ 6,056
$251 - 500 18.9% 21 $ 7,938
$501 - 750 6.9% 8 $ 5,216
$751 - 1000 3.4% 4 $ 3,332
$1000+ 5.1% 6 $ 8,568
Average Spending by Number of Guests RangeThis is the average spending by number of guests range for Event Table Centerpieces in Limestone TX - (County).
Range Average Spending
Less than 25 $123
25-50 $179
51-100 $214
101-150 $276
151-200 $355
201-300 $390
More than 300 $531
1122017 Weddings
$3182017 Avg Spend
$ 1662016 Median Spend
Table
Table
© 2016 The Wedding Report Inc. - Page 69 of 196

Gifts & Favors - Gift/s for Attendants
© 2016 The Wedding Report Inc. - Page 70 of 196

Item SummaryThis is the number of estimated weddings, estimated average amount spent per wedding, and estimated total sales for: Gifts& Favors - Gift/s for Attendants in Limestone TX - (County). Per person
NOTE: County numbers will not equal County Clerk numbers because couples can marry anywhere within the State.
NOTE: Estimated weddings equals the demand for this product or service only and may not equal total number of weddingsfor the entire market.
Year Number of Weddings (Demand) Average Spending per Wedding Total Sales
2008 111 $267 $29,576
2009 121 $172 $20,879
2010 125 $180 $22,453
2011 124 $92 $11,418
2012 129 $92 $11,894
2013 123 $90 $11,059
2014 123 $98 $12,095
2015 114 $91 $10,390
2016 117 $91 $10,631
2017 91 $90 $8,230
2018 94 $90 $8,443
2019 96 $89 $8,507
2020 97 $89 $8,664
2021 99 $89 $8,811
2022 98 $89 $8,704
Note About Average SpendingProducts; The average amount shown is based on spending of couples getting married, not prices. This includes purchasesof both new and pre-owned items.
Services; The average amount shown is based on spending of couples getting married, not vendor prices. This includespurchases of services from professionals, someone that simply provides the service, or a hired family member or friend.
912017 Weddings
$902017 Avg Spend
$8,2302017 Total Sales
Table
© 2016 The Wedding Report Inc. - Page 71 of 196

Median Spending & Spending Range DetailsThis is the percent of weddings, number of weddings, and estimated total sales of weddings that spend within certain rangesfor Gifts & Favors - Gift/s for Attendants in Limestone TX - (County).
NOTE: Sum of the Spending Distribution estimated total sales may be more than the item total sales because we use themiddle point of the spending ranges to estimate the sales. For total sales use the item total sales value.
Spending Range Percent of Weddings Number of Weddings Total Sales
<$50 39.9% 36 $ 908
$50 - 100 28.1% 26 $ 1,918
$101 - 250 18.0% 16 $ 2,867
$251 - 500 9.0% 8 $ 3,071
$501 - 1000 3.4% 3 $ 2,321
$1000+ 1.7% 2 $ 2,321
Average Spending by Number of Guests RangeThis is the average spending by number of guests range for Gift/s for Attendants in Limestone TX - (County).
Range Average Spending
Less than 25 $59
25-50 $46
51-100 $62
101-150 $86
151-200 $85
201-300 $95
More than 300 $180
912017 Weddings
$902017 Avg Spend
$ 342016 Median Spend
Table
Table
© 2016 The Wedding Report Inc. - Page 72 of 196

Gifts & Favors - Gift/s for Parents
© 2016 The Wedding Report Inc. - Page 73 of 196

Item SummaryThis is the number of estimated weddings, estimated average amount spent per wedding, and estimated total sales for: Gifts& Favors - Gift/s for Parents in Limestone TX - (County). Per parent
NOTE: County numbers will not equal County Clerk numbers because couples can marry anywhere within the State.
NOTE: Estimated weddings equals the demand for this product or service only and may not equal total number of weddingsfor the entire market.
Year Number of Weddings (Demand) Average Spending per Wedding Total Sales
2008 111 $246 $27,249
2009 111 $137 $15,267
2010 113 $136 $15,349
2011 110 $95 $10,480
2012 113 $95 $10,746
2013 108 $101 $10,860
2014 108 $109 $11,822
2015 102 $105 $10,717
2016 103 $106 $10,882
2017 82 $107 $8,790
2018 84 $100 $8,427
2019 86 $99 $8,500
2020 87 $99 $8,658
2021 89 $99 $8,821
2022 88 $99 $8,714
Note About Average SpendingProducts; The average amount shown is based on spending of couples getting married, not prices. This includes purchasesof both new and pre-owned items.
Services; The average amount shown is based on spending of couples getting married, not vendor prices. This includespurchases of services from professionals, someone that simply provides the service, or a hired family member or friend.
822017 Weddings
$1072017 Avg Spend
$8,7902017 Total Sales
Table
© 2016 The Wedding Report Inc. - Page 74 of 196

Median Spending & Spending Range DetailsThis is the percent of weddings, number of weddings, and estimated total sales of weddings that spend within certain rangesfor Gifts & Favors - Gift/s for Parents in Limestone TX - (County).
NOTE: Sum of the Spending Distribution estimated total sales may be more than the item total sales because we use themiddle point of the spending ranges to estimate the sales. For total sales use the item total sales value.
Spending Range Percent of Weddings Number of Weddings Total Sales
<$50 38.4% 31 $ 787
$50 - 100 35.0% 29 $ 2,153
$101 - 250 17.5% 14 $ 2,511
$251 - 500 5.6% 5 $ 1,722
$501 - 1000 2.3% 2 $ 1,415
$1000+ 1.1% 1 $0
Average Spending by Number of Guests RangeThis is the average spending by number of guests range for Gift/s for Parents in Limestone TX - (County).
Range Average Spending
Less than 25 $73
25-50 $70
51-100 $83
101-150 $92
151-200 $98
201-300 $115
More than 300 $206
822017 Weddings
$1072017 Avg Spend
$ 622016 Median Spend
Table
Table
© 2016 The Wedding Report Inc. - Page 75 of 196

Gifts & Favors - Tips (for all services)
© 2016 The Wedding Report Inc. - Page 76 of 196

Item SummaryThis is the number of estimated weddings, estimated average amount spent per wedding, and estimated total sales for: Gifts& Favors - Tips (for all services) in Limestone TX - (County). Total tips for all services
NOTE: County numbers will not equal County Clerk numbers because couples can marry anywhere within the State.
NOTE: Estimated weddings equals the demand for this product or service only and may not equal total number of weddingsfor the entire market.
Year Number of Weddings (Demand) Average Spending per Wedding Total Sales
2008 144 $339 $48,887
2009 135 $338 $45,738
2010 139 $343 $47,540
2011 138 $333 $45,921
2012 143 $332 $47,615
2013 136 $336 $45,804
2014 137 $351 $47,915
2015 128 $338 $43,271
2016 129 $335 $43,285
2017 105 $338 $35,625
2018 108 $340 $36,761
2019 112 $342 $38,229
2020 114 $345 $39,278
2021 115 $348 $40,194
2022 114 $349 $39,821
Note About Average SpendingProducts; The average amount shown is based on spending of couples getting married, not prices. This includes purchasesof both new and pre-owned items.
Services; The average amount shown is based on spending of couples getting married, not vendor prices. This includespurchases of services from professionals, someone that simply provides the service, or a hired family member or friend.
1052017 Weddings
$3382017 Avg Spend
$35,6252017 Total Sales
Table
© 2016 The Wedding Report Inc. - Page 77 of 196

Median Spending & Spending Range DetailsThis is the percent of weddings, number of weddings, and estimated total sales of weddings that spend within certain rangesfor Gifts & Favors - Tips (for all services) in Limestone TX - (County).
NOTE: Sum of the Spending Distribution estimated total sales may be more than the item total sales because we use themiddle point of the spending ranges to estimate the sales. For total sales use the item total sales value.
Spending Range Percent of Weddings Number of Weddings Total Sales
<$100 31.3% 33 $ 1,643
$101 - 250 27.8% 29 $ 5,108
$251 - 500 22.7% 24 $ 8,938
$501 - 750 9.1% 10 $ 6,450
$751 - 1000 1.7% 2 $ 1,562
$1000+ 7.4% 8 $ 11,655
Average Spending by Number of Guests RangeThis is the average spending by number of guests range for Tips (for all services) in Limestone TX - (County).
Range Average Spending
Less than 25 $162
25-50 $215
51-100 $274
101-150 $324
151-200 $340
201-300 $368
More than 300 $449
1052017 Weddings
$3382017 Avg Spend
$ 1872016 Median Spend
Table
Table
© 2016 The Wedding Report Inc. - Page 78 of 196

Gifts & Favors - Wedding Favors
© 2016 The Wedding Report Inc. - Page 79 of 196

Item SummaryThis is the number of estimated weddings, estimated average amount spent per wedding, and estimated total sales for: Gifts& Favors - Wedding Favors in Limestone TX - (County).
NOTE: County numbers will not equal County Clerk numbers because couples can marry anywhere within the State.
NOTE: Estimated weddings equals the demand for this product or service only and may not equal total number of weddingsfor the entire market.
Year Number of Weddings (Demand) Average Spending per Wedding Total Sales
2008 142 $298 $42,352
2009 135 $235 $31,800
2010 145 $240 $34,690
2011 136 $190 $25,827
2012 141 $190 $26,866
2013 134 $198 $26,611
2014 131 $213 $27,882
2015 123 $206 $25,303
2016 124 $209 $25,895
2017 104 $210 $21,809
2018 107 $207 $22,052
2019 110 $205 $22,583
2020 112 $202 $22,664
2021 114 $199 $22,656
2022 112 $195 $21,932
Note About Average SpendingProducts; The average amount shown is based on spending of couples getting married, not prices. This includes purchasesof both new and pre-owned items.
Services; The average amount shown is based on spending of couples getting married, not vendor prices. This includespurchases of services from professionals, someone that simply provides the service, or a hired family member or friend.
1042017 Weddings
$2102017 Avg Spend
$21,8092017 Total Sales
Table
© 2016 The Wedding Report Inc. - Page 80 of 196
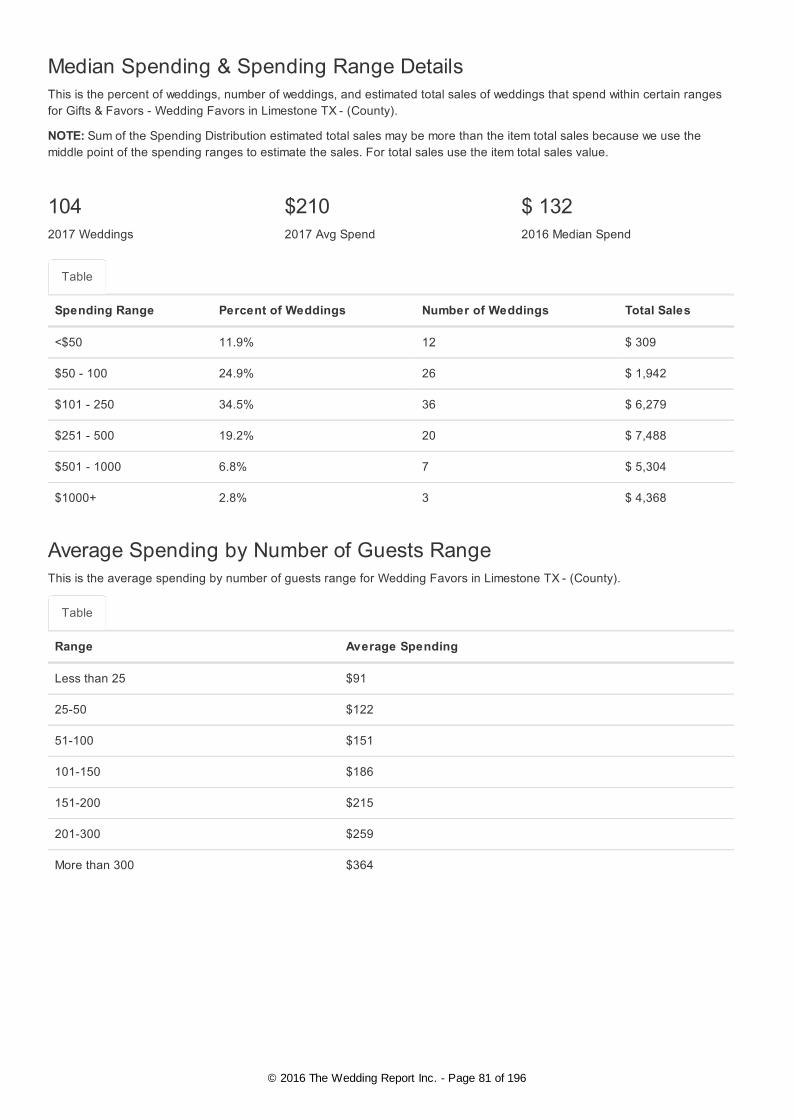
Median Spending & Spending Range DetailsThis is the percent of weddings, number of weddings, and estimated total sales of weddings that spend within certain rangesfor Gifts & Favors - Wedding Favors in Limestone TX - (County).
NOTE: Sum of the Spending Distribution estimated total sales may be more than the item total sales because we use themiddle point of the spending ranges to estimate the sales. For total sales use the item total sales value.
Spending Range Percent of Weddings Number of Weddings Total Sales
<$50 11.9% 12 $ 309
$50 - 100 24.9% 26 $ 1,942
$101 - 250 34.5% 36 $ 6,279
$251 - 500 19.2% 20 $ 7,488
$501 - 1000 6.8% 7 $ 5,304
$1000+ 2.8% 3 $ 4,368
Average Spending by Number of Guests RangeThis is the average spending by number of guests range for Wedding Favors in Limestone TX - (County).
Range Average Spending
Less than 25 $91
25-50 $122
51-100 $151
101-150 $186
151-200 $215
201-300 $259
More than 300 $364
1042017 Weddings
$2102017 Avg Spend
$ 1322016 Median Spend
Table
Table
© 2016 The Wedding Report Inc. - Page 81 of 196

Invitations - Ceremony Programs
© 2016 The Wedding Report Inc. - Page 82 of 196

Item SummaryThis is the number of estimated weddings, estimated average amount spent per wedding, and estimated total sales for:Invitations - Ceremony Programs in Limestone TX - (County).
NOTE: County numbers will not equal County Clerk numbers because couples can marry anywhere within the State.
NOTE: Estimated weddings equals the demand for this product or service only and may not equal total number of weddingsfor the entire market.
Year Number of Weddings (Demand) Average Spending per Wedding Total Sales
2008 115 $114 $13,104
2009 115 $85 $9,811
2010 117 $102 $11,916
2011 116 $92 $10,693
2012 121 $92 $11,150
2013 115 $97 $11,174
2014 114 $108 $12,320
2015 107 $122 $13,086
2016 108 $128 $13,820
2017 87 $128 $11,110
2018 89 $131 $11,664
2019 92 $134 $12,374
2020 94 $135 $12,697
2021 94 $137 $12,885
2022 93 $139 $12,914
Note About Average SpendingProducts; The average amount shown is based on spending of couples getting married, not prices. This includes purchasesof both new and pre-owned items.
Services; The average amount shown is based on spending of couples getting married, not vendor prices. This includespurchases of services from professionals, someone that simply provides the service, or a hired family member or friend.
872017 Weddings
$1282017 Avg Spend
$11,1102017 Total Sales
Table
© 2016 The Wedding Report Inc. - Page 83 of 196

Median Spending & Spending Range DetailsThis is the percent of weddings, number of weddings, and estimated total sales of weddings that spend within certain rangesfor Invitations - Ceremony Programs in Limestone TX - (County).
NOTE: Sum of the Spending Distribution estimated total sales may be more than the item total sales because we use themiddle point of the spending ranges to estimate the sales. For total sales use the item total sales value.
Spending Range Percent of Weddings Number of Weddings Total Sales
<$50 36.2% 31 $ 787
$50 - 100 39.0% 34 $ 2,545
$101 - 250 16.9% 15 $ 2,573
$251 - 500 5.1% 4 $ 1,664
$501 - 1000 1.7% 1 $ 1,109
$1000+ 1.1% 1 $0
Average Spending by Number of Guests RangeThis is the average spending by number of guests range for Ceremony Programs in Limestone TX - (County).
Range Average Spending
Less than 25 $57
25-50 $112
51-100 $89
101-150 $96
151-200 $119
201-300 $149
More than 300 $302
872017 Weddings
$1282017 Avg Spend
$ 672016 Median Spend
Table
Table
© 2016 The Wedding Report Inc. - Page 84 of 196

Invitations - Engagement Announcements
© 2016 The Wedding Report Inc. - Page 85 of 196

Item SummaryThis is the number of estimated weddings, estimated average amount spent per wedding, and estimated total sales for:Invitations - Engagement Announcements in Limestone TX - (County).
NOTE: County numbers will not equal County Clerk numbers because couples can marry anywhere within the State.
NOTE: Estimated weddings equals the demand for this product or service only and may not equal total number of weddingsfor the entire market.
Year Number of Weddings (Demand) Average Spending per Wedding Total Sales
2008 63 $144 $9,029
2009 60 $130 $7,761
2010 59 $140 $8,316
2011 71 $90 $6,383
2012 75 $90 $6,727
2013 71 $90 $6,394
2014 75 $97 $7,256
2015 69 $106 $7,335
2016 71 $109 $7,717
2017 65 $110 $7,161
2018 67 $108 $7,212
2019 68 $106 $7,212
2020 69 $104 $7,207
2021 71 $103 $7,308
2022 70 $101 $7,079
Note About Average SpendingProducts; The average amount shown is based on spending of couples getting married, not prices. This includes purchasesof both new and pre-owned items.
Services; The average amount shown is based on spending of couples getting married, not vendor prices. This includespurchases of services from professionals, someone that simply provides the service, or a hired family member or friend.
652017 Weddings
$1102017 Avg Spend
$7,1612017 Total Sales
Table
© 2016 The Wedding Report Inc. - Page 86 of 196

Median Spending & Spending Range DetailsThis is the percent of weddings, number of weddings, and estimated total sales of weddings that spend within certain rangesfor Invitations - Engagement Announcements in Limestone TX - (County).
NOTE: Sum of the Spending Distribution estimated total sales may be more than the item total sales because we use themiddle point of the spending ranges to estimate the sales. For total sales use the item total sales value.
Spending Range Percent of Weddings Number of Weddings Total Sales
<$50 42.0% 27 $ 683
$50 - 100 31.8% 21 $ 1,550
$101 - 250 17.0% 11 $ 1,934
$251 - 500 6.8% 4 $ 1,658
$501 - 1000 1.1% 1 $0
$1000+ 1.1% 1 $0
Average Spending by Number of Guests RangeThis is the average spending by number of guests range for Engagement Announcements in Limestone TX - (County).
Range Average Spending
Less than 25 $55
25-50 $72
51-100 $73
101-150 $82
151-200 $100
201-300 $124
More than 300 $335
652017 Weddings
$1102017 Avg Spend
$ 652016 Median Spend
Table
Table
© 2016 The Wedding Report Inc. - Page 87 of 196

Invitations - Guest Book
© 2016 The Wedding Report Inc. - Page 88 of 196

Item SummaryThis is the number of estimated weddings, estimated average amount spent per wedding, and estimated total sales for:Invitations - Guest Book in Limestone TX - (County).
NOTE: County numbers will not equal County Clerk numbers because couples can marry anywhere within the State.
NOTE: Estimated weddings equals the demand for this product or service only and may not equal total number of weddingsfor the entire market.
Year Number of Weddings (Demand) Average Spending per Wedding Total Sales
2008 146 $52 $7,608
2009 135 $53 $7,172
2010 145 $55 $7,950
2011 136 $51 $6,932
2012 141 $51 $7,211
2013 134 $50 $6,720
2014 133 $55 $7,302
2015 125 $60 $7,474
2016 126 $61 $7,666
2017 109 $62 $6,727
2018 111 $62 $6,901
2019 115 $63 $7,246
2020 117 $63 $7,380
2021 117 $64 $7,498
2022 116 $64 $7,407
Note About Average SpendingProducts; The average amount shown is based on spending of couples getting married, not prices. This includes purchasesof both new and pre-owned items.
Services; The average amount shown is based on spending of couples getting married, not vendor prices. This includespurchases of services from professionals, someone that simply provides the service, or a hired family member or friend.
1092017 Weddings
$622017 Avg Spend
$6,7272017 Total Sales
Table
© 2016 The Wedding Report Inc. - Page 89 of 196

Median Spending & Spending Range DetailsThis is the percent of weddings, number of weddings, and estimated total sales of weddings that spend within certain rangesfor Invitations - Guest Book in Limestone TX - (County).
NOTE: Sum of the Spending Distribution estimated total sales may be more than the item total sales because we use themiddle point of the spending ranges to estimate the sales. For total sales use the item total sales value.
Spending Range Percent of Weddings Number of Weddings Total Sales
<$50 72.3% 79 $ 1,970
$50 - 100 19.8% 22 $ 1,619
$101 - 250 5.6% 6 $ 1,068
$251 - 500 1.1% 1 $ 450
$501 - 1000 0.6% 1 $0
$1000+ 0.6% 1 $0
Average Spending by Number of Guests RangeThis is the average spending by number of guests range for Guest Book in Limestone TX - (County).
Range Average Spending
Less than 25 $34
25-50 $38
51-100 $46
101-150 $53
151-200 $51
201-300 $67
More than 300 $182
1092017 Weddings
$622017 Avg Spend
$ 352016 Median Spend
Table
Table
© 2016 The Wedding Report Inc. - Page 90 of 196

Invitations - Invitations & Reply Cards
© 2016 The Wedding Report Inc. - Page 91 of 196

Item SummaryThis is the number of estimated weddings, estimated average amount spent per wedding, and estimated total sales for:Invitations - Invitations & Reply Cards in Limestone TX - (County).
NOTE: County numbers will not equal County Clerk numbers because couples can marry anywhere within the State.
NOTE: Estimated weddings equals the demand for this product or service only and may not equal total number of weddingsfor the entire market.
Year Number of Weddings (Demand) Average Spending per Wedding Total Sales
2008 159 $261 $41,457
2009 151 $217 $32,819
2010 154 $237 $36,602
2011 154 $215 $33,037
2012 160 $214 $34,150
2013 152 $210 $31,853
2014 148 $216 $31,910
2015 138 $230 $31,832
2016 142 $227 $32,143
2017 124 $227 $28,148
2018 127 $223 $28,366
2019 131 $221 $29,000
2020 134 $217 $29,002
2021 135 $213 $28,819
2022 134 $208 $27,801
Note About Average SpendingProducts; The average amount shown is based on spending of couples getting married, not prices. This includes purchasesof both new and pre-owned items.
Services; The average amount shown is based on spending of couples getting married, not vendor prices. This includespurchases of services from professionals, someone that simply provides the service, or a hired family member or friend.
1242017 Weddings
$2272017 Avg Spend
$28,1482017 Total Sales
Table
© 2016 The Wedding Report Inc. - Page 92 of 196

Median Spending & Spending Range DetailsThis is the percent of weddings, number of weddings, and estimated total sales of weddings that spend within certain rangesfor Invitations - Invitations & Reply Cards in Limestone TX - (County).
NOTE: Sum of the Spending Distribution estimated total sales may be more than the item total sales because we use themiddle point of the spending ranges to estimate the sales. For total sales use the item total sales value.
Spending Range Percent of Weddings Number of Weddings Total Sales
<$50 19.7% 24 $ 611
$50 - 100 28.1% 35 $ 2,613
$101 - 250 28.1% 35 $ 6,098
$251 - 500 16.3% 20 $ 7,580
$501 - 1000 5.6% 7 $ 5,208
$1000+ 2.2% 3 $ 4,092
Average Spending by Number of Guests RangeThis is the average spending by number of guests range for Invitations & Reply Cards in Limestone TX - (County).
Range Average Spending
Less than 25 $84
25-50 $92
51-100 $144
101-150 $199
151-200 $243
201-300 $316
More than 300 $475
1242017 Weddings
$2272017 Avg Spend
$ 842016 Median Spend
Table
Table
© 2016 The Wedding Report Inc. - Page 93 of 196

Invitations - Postage
© 2016 The Wedding Report Inc. - Page 94 of 196

Item SummaryThis is the number of estimated weddings, estimated average amount spent per wedding, and estimated total sales for:Invitations - Postage in Limestone TX - (County).
NOTE: County numbers will not equal County Clerk numbers because couples can marry anywhere within the State.
NOTE: Estimated weddings equals the demand for this product or service only and may not equal total number of weddingsfor the entire market.
Year Number of Weddings (Demand) Average Spending per Wedding Total Sales
2008 159 $79 $12,548
2009 151 $74 $11,192
2010 152 $79 $12,044
2011 152 $93 $14,107
2012 160 $93 $14,841
2013 152 $94 $14,258
2014 148 $101 $14,921
2015 138 $107 $14,809
2016 142 $106 $15,010
2017 121 $106 $12,815
2018 124 $106 $13,146
2019 128 $106 $13,566
2020 130 $107 $13,947
2021 132 $107 $14,124
2022 130 $107 $13,953
Note About Average SpendingProducts; The average amount shown is based on spending of couples getting married, not prices. This includes purchasesof both new and pre-owned items.
Services; The average amount shown is based on spending of couples getting married, not vendor prices. This includespurchases of services from professionals, someone that simply provides the service, or a hired family member or friend.
1212017 Weddings
$1062017 Avg Spend
$12,8152017 Total Sales
Table
© 2016 The Wedding Report Inc. - Page 95 of 196

Median Spending & Spending Range DetailsThis is the percent of weddings, number of weddings, and estimated total sales of weddings that spend within certain rangesfor Invitations - Postage in Limestone TX - (County).
NOTE: Sum of the Spending Distribution estimated total sales may be more than the item total sales because we use themiddle point of the spending ranges to estimate the sales. For total sales use the item total sales value.
Spending Range Percent of Weddings Number of Weddings Total Sales
<$50 36.9% 45 $ 1,116
$50 - 100 36.9% 45 $ 3,349
$101 - 250 20.5% 25 $ 4,341
$251 - 500 4.0% 5 $ 1,815
$501 - 1000 1.1% 1 $ 998
$1000+ 0.6% 1 $0
Average Spending by Number of Guests RangeThis is the average spending by number of guests range for Postage in Limestone TX - (County).
Range Average Spending
Less than 25 $44
25-50 $45
51-100 $62
101-150 $84
151-200 $112
201-300 $156
More than 300 $319
1212017 Weddings
$1062017 Avg Spend
$ 512016 Median Spend
Table
Table
© 2016 The Wedding Report Inc. - Page 96 of 196

Invitations - Reception Menus
© 2016 The Wedding Report Inc. - Page 97 of 196

Item SummaryThis is the number of estimated weddings, estimated average amount spent per wedding, and estimated total sales for:Invitations - Reception Menus in Limestone TX - (County).
NOTE: County numbers will not equal County Clerk numbers because couples can marry anywhere within the State.
NOTE: Estimated weddings equals the demand for this product or service only and may not equal total number of weddingsfor the entire market.
Year Number of Weddings (Demand) Average Spending per Wedding Total Sales
2008 69 $126 $8,690
2009 66 $80 $5,254
2010 77 $111 $8,571
2011 79 $97 $7,644
2012 83 $96 $7,951
2013 79 $94 $7,400
2014 82 $110 $9,051
2015 78 $125 $9,731
2016 78 $126 $9,813
2017 60 $126 $7,617
2018 62 $128 $7,937
2019 65 $127 $8,230
2020 66 $129 $8,514
2021 66 $131 $8,646
2022 65 $132 $8,606
Note About Average SpendingProducts; The average amount shown is based on spending of couples getting married, not prices. This includes purchasesof both new and pre-owned items.
Services; The average amount shown is based on spending of couples getting married, not vendor prices. This includespurchases of services from professionals, someone that simply provides the service, or a hired family member or friend.
602017 Weddings
$1262017 Avg Spend
$7,6172017 Total Sales
Table
© 2016 The Wedding Report Inc. - Page 98 of 196

Median Spending & Spending Range DetailsThis is the percent of weddings, number of weddings, and estimated total sales of weddings that spend within certain rangesfor Invitations - Reception Menus in Limestone TX - (County).
NOTE: Sum of the Spending Distribution estimated total sales may be more than the item total sales because we use themiddle point of the spending ranges to estimate the sales. For total sales use the item total sales value.
Spending Range Percent of Weddings Number of Weddings Total Sales
<$50 46.9% 28 $ 703
$50 - 100 31.1% 19 $ 1,400
$101 - 250 12.4% 7 $ 1,302
$251 - 500 5.6% 3 $ 1,260
$501 - 1000 1.7% 1 $ 765
$1000+ 2.3% 1 $ 2,070
Average Spending by Number of Guests RangeThis is the average spending by number of guests range for Reception Menus in Limestone TX - (County).
Range Average Spending
Less than 25 $50
25-50 $113
51-100 $84
101-150 $93
151-200 $109
201-300 $160
More than 300 $388
602017 Weddings
$1262017 Avg Spend
$ 452016 Median Spend
Table
Table
© 2016 The Wedding Report Inc. - Page 99 of 196

Invitations - Save the Date Cards
© 2016 The Wedding Report Inc. - Page 100 of 196

Item SummaryThis is the number of estimated weddings, estimated average amount spent per wedding, and estimated total sales for:Invitations - Save the Date Cards in Limestone TX - (County).
NOTE: County numbers will not equal County Clerk numbers because couples can marry anywhere within the State.
NOTE: Estimated weddings equals the demand for this product or service only and may not equal total number of weddingsfor the entire market.
Year Number of Weddings (Demand) Average Spending per Wedding Total Sales
2008 90 $105 $9,436
2009 98 $97 $9,458
2010 113 $116 $13,092
2011 108 $98 $10,618
2012 113 $98 $11,086
2013 108 $100 $10,752
2014 110 $104 $11,474
2015 104 $113 $11,729
2016 106 $113 $12,001
2017 91 $113 $10,334
2018 94 $114 $10,694
2019 96 $114 $10,896
2020 97 $114 $11,098
2021 99 $115 $11,385
2022 98 $115 $11,247
Note About Average SpendingProducts; The average amount shown is based on spending of couples getting married, not prices. This includes purchasesof both new and pre-owned items.
Services; The average amount shown is based on spending of couples getting married, not vendor prices. This includespurchases of services from professionals, someone that simply provides the service, or a hired family member or friend.
912017 Weddings
$1132017 Avg Spend
$10,3342017 Total Sales
Table
© 2016 The Wedding Report Inc. - Page 101 of 196

Median Spending & Spending Range DetailsThis is the percent of weddings, number of weddings, and estimated total sales of weddings that spend within certain rangesfor Invitations - Save the Date Cards in Limestone TX - (County).
NOTE: Sum of the Spending Distribution estimated total sales may be more than the item total sales because we use themiddle point of the spending ranges to estimate the sales. For total sales use the item total sales value.
Spending Range Percent of Weddings Number of Weddings Total Sales
<$50 36.7% 33 $ 835
$50 - 100 35.0% 32 $ 2,389
$101 - 250 20.9% 19 $ 3,328
$251 - 500 5.1% 5 $ 1,740
$501 - 1000 1.7% 2 $ 1,160
$1000+ 0.6% 1 $0
Average Spending by Number of Guests RangeThis is the average spending by number of guests range for Save the Date Cards in Limestone TX - (County).
Range Average Spending
Less than 25 $52
25-50 $57
51-100 $68
101-150 $90
151-200 $118
201-300 $143
More than 300 $292
912017 Weddings
$1132017 Avg Spend
$ 592016 Median Spend
Table
Table
© 2016 The Wedding Report Inc. - Page 102 of 196

Invitations - Table Name and Escort/place Cards
© 2016 The Wedding Report Inc. - Page 103 of 196

Item SummaryThis is the number of estimated weddings, estimated average amount spent per wedding, and estimated total sales for:Invitations - Table Name and Escort/place Cards in Limestone TX - (County).
NOTE: County numbers will not equal County Clerk numbers because couples can marry anywhere within the State.
NOTE: Estimated weddings equals the demand for this product or service only and may not equal total number of weddingsfor the entire market.
Year Number of Weddings (Demand) Average Spending per Wedding Total Sales
2008 115 $88 $10,116
2009 101 $61 $6,191
2010 113 $78 $8,803
2011 102 $66 $6,761
2012 105 $65 $6,828
2013 102 $72 $7,327
2014 105 $77 $8,063
2015 97 $84 $8,138
2016 97 $85 $8,275
2017 78 $86 $6,665
2018 80 $86 $6,837
2019 83 $86 $7,105
2020 84 $87 $7,321
2021 84 $87 $7,321
2022 83 $88 $7,315
Note About Average SpendingProducts; The average amount shown is based on spending of couples getting married, not prices. This includes purchasesof both new and pre-owned items.
Services; The average amount shown is based on spending of couples getting married, not vendor prices. This includespurchases of services from professionals, someone that simply provides the service, or a hired family member or friend.
782017 Weddings
$862017 Avg Spend
$6,6652017 Total Sales
Table
© 2016 The Wedding Report Inc. - Page 104 of 196

Median Spending & Spending Range DetailsThis is the percent of weddings, number of weddings, and estimated total sales of weddings that spend within certain rangesfor Invitations - Table Name and Escort/place Cards in Limestone TX - (County).
NOTE: Sum of the Spending Distribution estimated total sales may be more than the item total sales because we use themiddle point of the spending ranges to estimate the sales. For total sales use the item total sales value.
Spending Range Percent of Weddings Number of Weddings Total Sales
<$50 52.0% 41 $ 1,014
$50 - 100 31.6% 25 $ 1,849
$101 - 250 11.3% 9 $ 1,542
$251 - 500 3.4% 3 $ 995
$501 - 1000 1.1% 1 $0
$1000+ 0.6% 0 $0
Average Spending by Number of Guests RangeThis is the average spending by number of guests range for Table Name and Escort/place Cards in Limestone TX - (County).
Range Average Spending
Less than 25 $44
25-50 $52
51-100 $56
101-150 $67
151-200 $78
201-300 $111
More than 300 $266
782017 Weddings
$862017 Avg Spend
$ 412016 Median Spend
Table
Table
© 2016 The Wedding Report Inc. - Page 105 of 196

Invitations - Thank You Cards
© 2016 The Wedding Report Inc. - Page 106 of 196

Item SummaryThis is the number of estimated weddings, estimated average amount spent per wedding, and estimated total sales for:Invitations - Thank You Cards in Limestone TX - (County).
NOTE: County numbers will not equal County Clerk numbers because couples can marry anywhere within the State.
NOTE: Estimated weddings equals the demand for this product or service only and may not equal total number of weddingsfor the entire market.
Year Number of Weddings (Demand) Average Spending per Wedding Total Sales
2008 140 $71 $9,942
2009 147 $71 $10,455
2010 149 $87 $12,920
2011 144 $78 $11,217
2012 149 $78 $11,659
2013 142 $78 $11,082
2014 140 $83 $11,641
2015 131 $90 $11,833
2016 135 $90 $12,107
2017 115 $91 $10,438
2018 118 $93 $10,942
2019 122 $94 $11,421
2020 124 $95 $11,756
2021 125 $96 $12,038
2022 124 $97 $12,016
Note About Average SpendingProducts; The average amount shown is based on spending of couples getting married, not prices. This includes purchasesof both new and pre-owned items.
Services; The average amount shown is based on spending of couples getting married, not vendor prices. This includespurchases of services from professionals, someone that simply provides the service, or a hired family member or friend.
1152017 Weddings
$912017 Avg Spend
$10,4382017 Total Sales
Table
© 2016 The Wedding Report Inc. - Page 107 of 196

Median Spending & Spending Range DetailsThis is the percent of weddings, number of weddings, and estimated total sales of weddings that spend within certain rangesfor Invitations - Thank You Cards in Limestone TX - (County).
NOTE: Sum of the Spending Distribution estimated total sales may be more than the item total sales because we use themiddle point of the spending ranges to estimate the sales. For total sales use the item total sales value.
Spending Range Percent of Weddings Number of Weddings Total Sales
<$50 46.6% 54 $ 1,340
$50 - 100 33.7% 39 $ 2,907
$101 - 250 14.6% 17 $ 2,938
$251 - 500 3.9% 4 $ 1,682
$501 - 1000 0.6% 1 $0
$1000+ 0.6% 1 $0
Average Spending by Number of Guests RangeThis is the average spending by number of guests range for Thank You Cards in Limestone TX - (County).
Range Average Spending
Less than 25 $44
25-50 $46
51-100 $60
101-150 $74
151-200 $91
201-300 $114
More than 300 $272
1152017 Weddings
$912017 Avg Spend
$ 452016 Median Spend
Table
Table
© 2016 The Wedding Report Inc. - Page 108 of 196

Jewelry - Bracelet
© 2016 The Wedding Report Inc. - Page 109 of 196

Item SummaryThis is the number of estimated weddings, estimated average amount spent per wedding, and estimated total sales for:Jewelry - Bracelet in Limestone TX - (County).
NOTE: County numbers will not equal County Clerk numbers because couples can marry anywhere within the State.
NOTE: Estimated weddings equals the demand for this product or service only and may not equal total number of weddingsfor the entire market.
Year Number of Weddings (Demand) Average Spending per Wedding Total Sales
2016 41 $174 $7,084
2017 36 $174 $6,203
2018 37 $176 $6,436
2019 37 $177 $6,595
2020 38 $177 $6,717
2021 38 $177 $6,717
2022 37 $177 $6,636
Note About Average SpendingProducts; The average amount shown is based on spending of couples getting married, not prices. This includes purchasesof both new and pre-owned items.
Services; The average amount shown is based on spending of couples getting married, not vendor prices. This includespurchases of services from professionals, someone that simply provides the service, or a hired family member or friend.
362017 Weddings
$1742017 Avg Spend
$6,2032017 Total Sales
Table
© 2016 The Wedding Report Inc. - Page 110 of 196
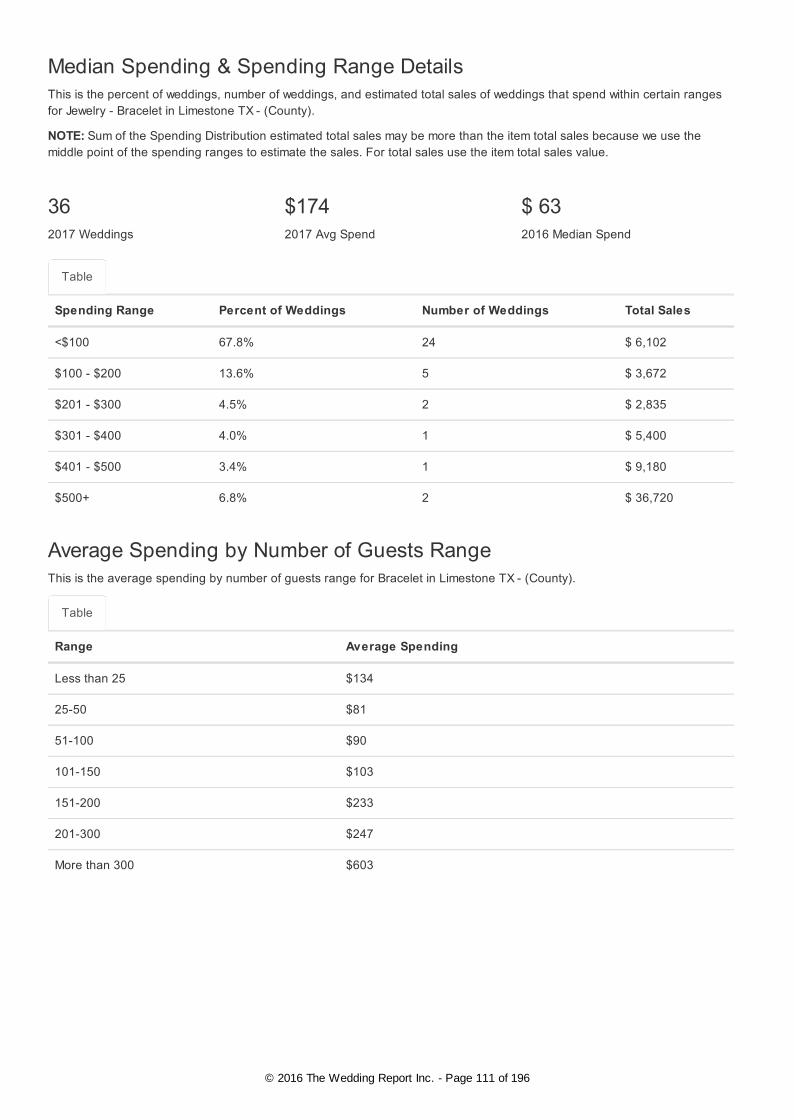
Median Spending & Spending Range DetailsThis is the percent of weddings, number of weddings, and estimated total sales of weddings that spend within certain rangesfor Jewelry - Bracelet in Limestone TX - (County).
NOTE: Sum of the Spending Distribution estimated total sales may be more than the item total sales because we use themiddle point of the spending ranges to estimate the sales. For total sales use the item total sales value.
Spending Range Percent of Weddings Number of Weddings Total Sales
<$100 67.8% 24 $ 6,102
$100 - $200 13.6% 5 $ 3,672
$201 - $300 4.5% 2 $ 2,835
$301 - $400 4.0% 1 $ 5,400
$401 - $500 3.4% 1 $ 9,180
$500+ 6.8% 2 $ 36,720
Average Spending by Number of Guests RangeThis is the average spending by number of guests range for Bracelet in Limestone TX - (County).
Range Average Spending
Less than 25 $134
25-50 $81
51-100 $90
101-150 $103
151-200 $233
201-300 $247
More than 300 $603
362017 Weddings
$1742017 Avg Spend
$ 632016 Median Spend
Table
Table
© 2016 The Wedding Report Inc. - Page 111 of 196

Jewelry - Earrings
© 2016 The Wedding Report Inc. - Page 112 of 196

Item SummaryThis is the number of estimated weddings, estimated average amount spent per wedding, and estimated total sales for:Jewelry - Earrings in Limestone TX - (County).
NOTE: County numbers will not equal County Clerk numbers because couples can marry anywhere within the State.
NOTE: Estimated weddings equals the demand for this product or service only and may not equal total number of weddingsfor the entire market.
Year Number of Weddings (Demand) Average Spending per Wedding Total Sales
2016 65 $149 $9,758
2017 57 $149 $8,545
2018 59 $150 $8,825
2019 62 $151 $9,296
2020 63 $151 $9,468
2021 63 $152 $9,530
2022 62 $152 $9,415
Note About Average SpendingProducts; The average amount shown is based on spending of couples getting married, not prices. This includes purchasesof both new and pre-owned items.
Services; The average amount shown is based on spending of couples getting married, not vendor prices. This includespurchases of services from professionals, someone that simply provides the service, or a hired family member or friend.
572017 Weddings
$1492017 Avg Spend
$8,5452017 Total Sales
Table
© 2016 The Wedding Report Inc. - Page 113 of 196

Median Spending & Spending Range DetailsThis is the percent of weddings, number of weddings, and estimated total sales of weddings that spend within certain rangesfor Jewelry - Earrings in Limestone TX - (County).
NOTE: Sum of the Spending Distribution estimated total sales may be more than the item total sales because we use themiddle point of the spending ranges to estimate the sales. For total sales use the item total sales value.
Spending Range Percent of Weddings Number of Weddings Total Sales
<$100 72.0% 41 $ 10,260
$100 - $200 12.0% 7 $ 5,130
$201 - $300 4.6% 3 $ 4,589
$301 - $400 3.4% 2 $ 7,268
$401 - $500 2.3% 1 $ 9,833
$500+ 5.7% 3 $ 48,735
Average Spending by Number of Guests RangeThis is the average spending by number of guests range for Earrings in Limestone TX - (County).
Range Average Spending
Less than 25 $122
25-50 $73
51-100 $105
101-150 $109
151-200 $171
201-300 $235
More than 300 $409
572017 Weddings
$1492017 Avg Spend
$ 602016 Median Spend
Table
Table
© 2016 The Wedding Report Inc. - Page 114 of 196

Jewelry - Engagement Ring
© 2016 The Wedding Report Inc. - Page 115 of 196

Item SummaryThis is the number of estimated weddings, estimated average amount spent per wedding, and estimated total sales for:Jewelry - Engagement Ring in Limestone TX - (County).
NOTE: County numbers will not equal County Clerk numbers because couples can marry anywhere within the State.
NOTE: Estimated weddings equals the demand for this product or service only and may not equal total number of weddingsfor the entire market.
Year Number of Weddings (Demand) Average Spending per Wedding Total Sales
2008 132 $2,902 $382,106
2009 125 $2,875 $360,439
2010 139 $3,136 $434,650
2011 138 $2,932 $404,323
2012 143 $2,939 $421,511
2013 136 $3,016 $411,141
2014 137 $3,048 $416,082
2015 128 $3,174 $406,335
2016 131 $3,177 $416,123
2017 118 $3,188 $375,546
2018 121 $3,197 $386,325
2019 125 $3,215 $401,039
2020 127 $3,224 $409,609
2021 127 $3,237 $411,261
2022 126 $3,242 $406,903
Note About Average SpendingProducts; The average amount shown is based on spending of couples getting married, not prices. This includes purchasesof both new and pre-owned items.
Services; The average amount shown is based on spending of couples getting married, not vendor prices. This includespurchases of services from professionals, someone that simply provides the service, or a hired family member or friend.
1182017 Weddings
$3,1882017 Avg Spend
$375,5462017 Total Sales
Table
© 2016 The Wedding Report Inc. - Page 116 of 196

Median Spending & Spending Range DetailsThis is the percent of weddings, number of weddings, and estimated total sales of weddings that spend within certain rangesfor Jewelry - Engagement Ring in Limestone TX - (County).
NOTE: Sum of the Spending Distribution estimated total sales may be more than the item total sales because we use themiddle point of the spending ranges to estimate the sales. For total sales use the item total sales value.
Spending Range Percent of Weddings Number of Weddings Total Sales
<$500 16.9% 20 $ 4,986
$501 - $1,000 15.8% 19 $ 13,983
$1,001 - $2,500 23.7% 28 $ 48,940
$2,501 - $5,000 21.5% 25 $ 95,138
$5,001 - $10,000 14.7% 17 $130,095
$10,000+ 7.3% 9 $129,210
Average Spending by Number of Guests RangeThis is the average spending by number of guests range for Engagement Ring in Limestone TX - (County).
Range Average Spending
Less than 25 $1,910
25-50 $1,940
51-100 $2,410
101-150 $2,969
151-200 $3,380
201-300 $3,703
More than 300 $4,615
1182017 Weddings
$3,1882017 Avg Spend
$ 1,5502016 Median Spend
Table
Table
© 2016 The Wedding Report Inc. - Page 117 of 196

Jewelry - Necklace
© 2016 The Wedding Report Inc. - Page 118 of 196

Item SummaryThis is the number of estimated weddings, estimated average amount spent per wedding, and estimated total sales for:Jewelry - Necklace in Limestone TX - (County).
NOTE: County numbers will not equal County Clerk numbers because couples can marry anywhere within the State.
NOTE: Estimated weddings equals the demand for this product or service only and may not equal total number of weddingsfor the entire market.
Year Number of Weddings (Demand) Average Spending per Wedding Total Sales
2016 50 $200 $9,912
2017 43 $200 $8,680
2018 45 $202 $8,993
2019 45 $202 $9,163
2020 46 $203 $9,379
2021 48 $204 $9,761
2022 47 $204 $9,643
Note About Average SpendingProducts; The average amount shown is based on spending of couples getting married, not prices. This includes purchasesof both new and pre-owned items.
Services; The average amount shown is based on spending of couples getting married, not vendor prices. This includespurchases of services from professionals, someone that simply provides the service, or a hired family member or friend.
432017 Weddings
$2002017 Avg Spend
$8,6802017 Total Sales
Table
© 2016 The Wedding Report Inc. - Page 119 of 196

Median Spending & Spending Range DetailsThis is the percent of weddings, number of weddings, and estimated total sales of weddings that spend within certain rangesfor Jewelry - Necklace in Limestone TX - (County).
NOTE: Sum of the Spending Distribution estimated total sales may be more than the item total sales because we use themiddle point of the spending ranges to estimate the sales. For total sales use the item total sales value.
Spending Range Percent of Weddings Number of Weddings Total Sales
<$100 62.9% 27 $ 6,762
$100 - $200 14.3% 6 $ 4,612
$201 - $300 7.4% 3 $ 5,569
$301 - $400 3.4% 1 $ 5,483
$401 - $500 3.4% 1 $ 10,965
$500+ 8.6% 4 $ 55,470
Average Spending by Number of Guests RangeThis is the average spending by number of guests range for Necklace in Limestone TX - (County).
Range Average Spending
Less than 25 $159
25-50 $98
51-100 $136
101-150 $155
151-200 $212
201-300 $311
More than 300 $627
432017 Weddings
$2002017 Avg Spend
$ 702016 Median Spend
Table
Table
© 2016 The Wedding Report Inc. - Page 120 of 196

Jewelry - Wedding ring/band for HER
© 2016 The Wedding Report Inc. - Page 121 of 196
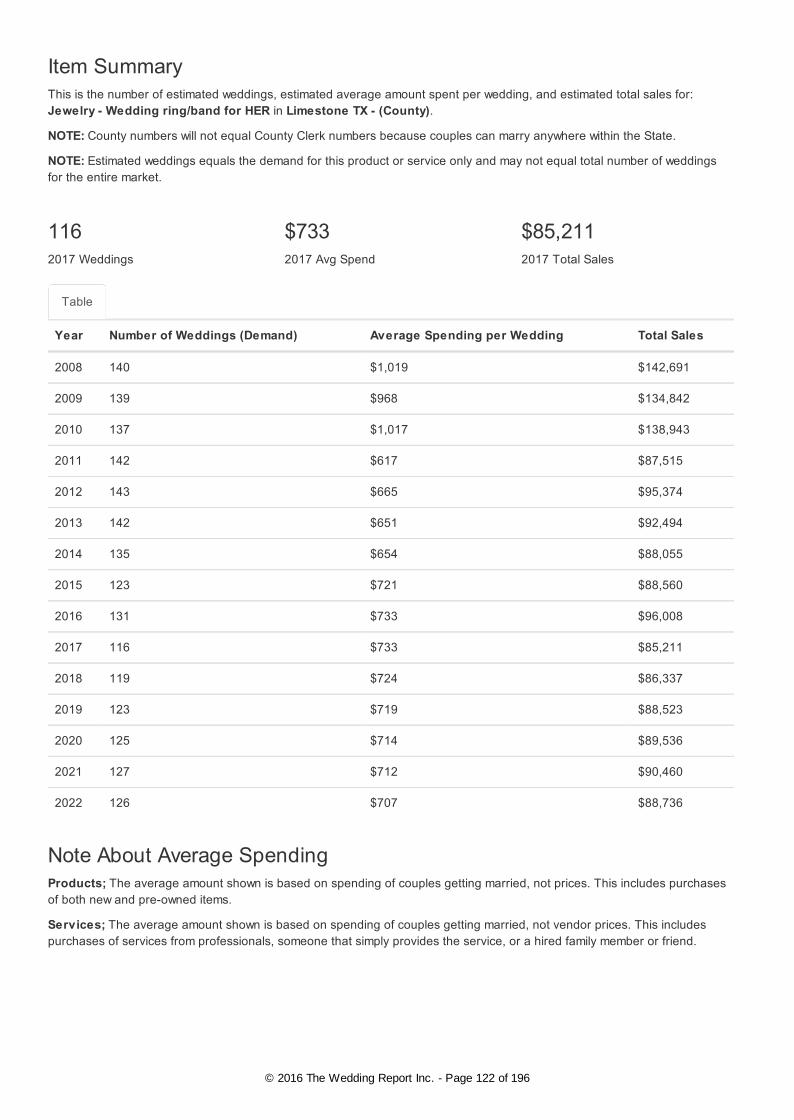
Item SummaryThis is the number of estimated weddings, estimated average amount spent per wedding, and estimated total sales for:Jewelry - Wedding ring/band for HER in Limestone TX - (County).
NOTE: County numbers will not equal County Clerk numbers because couples can marry anywhere within the State.
NOTE: Estimated weddings equals the demand for this product or service only and may not equal total number of weddingsfor the entire market.
Year Number of Weddings (Demand) Average Spending per Wedding Total Sales
2008 140 $1,019 $142,691
2009 139 $968 $134,842
2010 137 $1,017 $138,943
2011 142 $617 $87,515
2012 143 $665 $95,374
2013 142 $651 $92,494
2014 135 $654 $88,055
2015 123 $721 $88,560
2016 131 $733 $96,008
2017 116 $733 $85,211
2018 119 $724 $86,337
2019 123 $719 $88,523
2020 125 $714 $89,536
2021 127 $712 $90,460
2022 126 $707 $88,736
Note About Average SpendingProducts; The average amount shown is based on spending of couples getting married, not prices. This includes purchasesof both new and pre-owned items.
Services; The average amount shown is based on spending of couples getting married, not vendor prices. This includespurchases of services from professionals, someone that simply provides the service, or a hired family member or friend.
1162017 Weddings
$7332017 Avg Spend
$85,2112017 Total Sales
Table
© 2016 The Wedding Report Inc. - Page 122 of 196

Median Spending & Spending Range DetailsThis is the percent of weddings, number of weddings, and estimated total sales of weddings that spend within certain rangesfor Jewelry - Wedding ring/band for HER in Limestone TX - (County).
NOTE: Sum of the Spending Distribution estimated total sales may be more than the item total sales because we use themiddle point of the spending ranges to estimate the sales. For total sales use the item total sales value.
Spending Range Percent of Weddings Number of Weddings Total Sales
<$250 30.1% 35 $ 4,365
$250 - 500 18.8% 22 $ 8,178
$501 - 750 12.5% 15 $ 9,063
$751 - 1000 11.4% 13 $ 11,571
$1001 - 1500 14.8% 17 $ 21,460
$1500+ 12.5% 15 $ 32,625
Average Spending by Number of Guests RangeThis is the average spending by number of guests range for Wedding ring/band for HER in Limestone TX - (County).
Range Average Spending
Less than 25 $500
25-50 $574
51-100 $635
101-150 $737
151-200 $872
201-300 $960
More than 300 $1,291
1162017 Weddings
$7332017 Avg Spend
$ 4782016 Median Spend
Table
Table
© 2016 The Wedding Report Inc. - Page 123 of 196

Jewelry - Wedding ring/band for HIM
© 2016 The Wedding Report Inc. - Page 124 of 196

Item SummaryThis is the number of estimated weddings, estimated average amount spent per wedding, and estimated total sales for:Jewelry - Wedding ring/band for HIM in Limestone TX - (County).
NOTE: County numbers will not equal County Clerk numbers because couples can marry anywhere within the State.
NOTE: Estimated weddings equals the demand for this product or service only and may not equal total number of weddingsfor the entire market.
Year Number of Weddings (Demand) Average Spending per Wedding Total Sales
2008 150 $819 $123,243
2009 147 $679 $99,990
2010 149 $668 $99,198
2011 150 $453 $67,823
2012 154 $411 $63,097
2013 148 $420 $62,093
2014 142 $439 $62,391
2015 133 $455 $60,611
2016 138 $425 $58,676
2017 122 $427 $52,286
2018 126 $422 $53,007
2019 130 $418 $54,173
2020 132 $414 $54,648
2021 134 $410 $54,797
2022 132 $405 $53,472
Note About Average SpendingProducts; The average amount shown is based on spending of couples getting married, not prices. This includes purchasesof both new and pre-owned items.
Services; The average amount shown is based on spending of couples getting married, not vendor prices. This includespurchases of services from professionals, someone that simply provides the service, or a hired family member or friend.
1222017 Weddings
$4272017 Avg Spend
$52,2862017 Total Sales
Table
© 2016 The Wedding Report Inc. - Page 125 of 196

Median Spending & Spending Range DetailsThis is the percent of weddings, number of weddings, and estimated total sales of weddings that spend within certain rangesfor Jewelry - Wedding ring/band for HIM in Limestone TX - (County).
NOTE: Sum of the Spending Distribution estimated total sales may be more than the item total sales because we use themiddle point of the spending ranges to estimate the sales. For total sales use the item total sales value.
Spending Range Percent of Weddings Number of Weddings Total Sales
<$250 39.5% 48 $ 6,024
$250 - 500 25.4% 31 $ 11,621
$501 - 750 15.8% 19 $ 12,048
$751 - 1000 7.3% 9 $ 7,793
$1001 - 1500 6.8% 8 $ 10,370
$1500+ 5.1% 6 $ 13,999
Average Spending by Number of Guests RangeThis is the average spending by number of guests range for Wedding ring/band for HIM in Limestone TX - (County).
Range Average Spending
Less than 25 $283
25-50 $280
51-100 $319
101-150 $346
151-200 $402
201-300 $516
More than 300 $787
1222017 Weddings
$4272017 Avg Spend
$ 3022016 Median Spend
Table
Table
© 2016 The Wedding Report Inc. - Page 126 of 196

Photography & Video - Digital or Photo cd/dvd
© 2016 The Wedding Report Inc. - Page 127 of 196

Item SummaryThis is the number of estimated weddings, estimated average amount spent per wedding, and estimated total sales for:Photography & Video - Digital or Photo cd/dvd in Limestone TX - (County).
NOTE: County numbers will not equal County Clerk numbers because couples can marry anywhere within the State.
NOTE: Estimated weddings equals the demand for this product or service only and may not equal total number of weddingsfor the entire market.
Year Number of Weddings (Demand) Average Spending per Wedding Total Sales
2008 71 $256 $18,191
2009 68 $251 $16,983
2010 67 $271 $18,244
2011 95 $307 $29,030
2012 97 $306 $29,670
2013 94 $298 $28,036
2014 95 $289 $27,562
2015 92 $292 $26,773
2016 92 $280 $25,771
2017 73 $279 $20,325
2018 75 $279 $20,850
2019 76 $279 $21,243
2020 78 $279 $21,636
2021 79 $280 $22,176
2022 78 $280 $21,907
Note About Average SpendingProducts; The average amount shown is based on spending of couples getting married, not prices. This includes purchasesof both new and pre-owned items.
Services; The average amount shown is based on spending of couples getting married, not vendor prices. This includespurchases of services from professionals, someone that simply provides the service, or a hired family member or friend.
732017 Weddings
$2792017 Avg Spend
$20,3252017 Total Sales
Table
© 2016 The Wedding Report Inc. - Page 128 of 196

Median Spending & Spending Range DetailsThis is the percent of weddings, number of weddings, and estimated total sales of weddings that spend within certain rangesfor Photography & Video - Digital or Photo cd/dvd in Limestone TX - (County).
NOTE: Sum of the Spending Distribution estimated total sales may be more than the item total sales because we use themiddle point of the spending ranges to estimate the sales. For total sales use the item total sales value.
Spending Range Percent of Weddings Number of Weddings Total Sales
<$100 66.1% 48 $ 2,413
$101 - $250 17.5% 13 $ 2,236
$251 - $500 10.2% 7 $ 2,792
$501 - $1000 3.4% 2 $ 1,862
$1001 - $1500 1.1% 1 $0
$1500+ 1.7% 1 $ 2,792
Average Spending by Number of Guests RangeThis is the average spending by number of guests range for Digital or Photo cd/dvd in Limestone TX - (County).
Range Average Spending
Less than 25 $100
25-50 $157
51-100 $252
101-150 $244
151-200 $252
201-300 $291
More than 300 $556
732017 Weddings
$2792017 Avg Spend
$ 612016 Median Spend
Table
Table
© 2016 The Wedding Report Inc. - Page 129 of 196

Photography & Video - Engagement Session
© 2016 The Wedding Report Inc. - Page 130 of 196

Item SummaryThis is the number of estimated weddings, estimated average amount spent per wedding, and estimated total sales for:Photography & Video - Engagement Session in Limestone TX - (County).
NOTE: County numbers will not equal County Clerk numbers because couples can marry anywhere within the State.
NOTE: Estimated weddings equals the demand for this product or service only and may not equal total number of weddingsfor the entire market.
Year Number of Weddings (Demand) Average Spending per Wedding Total Sales
2008 90 $283 $25,433
2009 86 $274 $23,446
2010 85 $307 $26,138
2011 79 $387 $30,496
2012 83 $391 $32,383
2013 83 $386 $31,868
2014 86 $373 $32,085
2015 87 $379 $32,784
2016 89 $379 $33,542
2017 82 $378 $31,053
2018 84 $383 $32,275
2019 86 $387 $33,228
2020 87 $390 $34,106
2021 89 $394 $35,105
2022 88 $397 $34,944
Note About Average SpendingProducts; The average amount shown is based on spending of couples getting married, not prices. This includes purchasesof both new and pre-owned items.
Services; The average amount shown is based on spending of couples getting married, not vendor prices. This includespurchases of services from professionals, someone that simply provides the service, or a hired family member or friend.
822017 Weddings
$3782017 Avg Spend
$31,0532017 Total Sales
Table
© 2016 The Wedding Report Inc. - Page 131 of 196

Median Spending & Spending Range DetailsThis is the percent of weddings, number of weddings, and estimated total sales of weddings that spend within certain rangesfor Photography & Video - Engagement Session in Limestone TX - (County).
NOTE: Sum of the Spending Distribution estimated total sales may be more than the item total sales because we use themiddle point of the spending ranges to estimate the sales. For total sales use the item total sales value.
Spending Range Percent of Weddings Number of Weddings Total Sales
<$100 81.9% 67 $ 16,790
$101 - $250 13.0% 11 $ 7,995
$251 - $500 2.8% 2 $ 3,444
$501 - $1000 1.7% 1 $ 3,485
$1001 - $1500 0.0% 0 $0
$1500+ 0.6% 0 $0
Average Spending by Number of Guests RangeThis is the average spending by number of guests range for Engagement Session in Limestone TX - (County).
Range Average Spending
Less than 25 $296
25-50 $188
51-100 $275
101-150 $314
151-200 $310
201-300 $509
More than 300 $718
822017 Weddings
$3782017 Avg Spend
$ 1792016 Median Spend
Table
Table
© 2016 The Wedding Report Inc. - Page 132 of 196

Photography & Video - Photo Booth
© 2016 The Wedding Report Inc. - Page 133 of 196

Item SummaryThis is the number of estimated weddings, estimated average amount spent per wedding, and estimated total sales for:Photography & Video - Photo Booth in Limestone TX - (County).
NOTE: County numbers will not equal County Clerk numbers because couples can marry anywhere within the State.
NOTE: Estimated weddings equals the demand for this product or service only and may not equal total number of weddingsfor the entire market.
Year Number of Weddings (Demand) Average Spending per Wedding Total Sales
2013 42 $414 $17,487
2016 39 $368 $14,330
2017 34 $370 $12,617
2018 35 $371 $12,978
2019 36 $371 $13,222
2020 36 $371 $13,467
2021 38 $372 $14,117
2022 37 $372 $13,946
Note About Average SpendingProducts; The average amount shown is based on spending of couples getting married, not prices. This includes purchasesof both new and pre-owned items.
Services; The average amount shown is based on spending of couples getting married, not vendor prices. This includespurchases of services from professionals, someone that simply provides the service, or a hired family member or friend.
342017 Weddings
$3702017 Avg Spend
$12,6172017 Total Sales
Table
© 2016 The Wedding Report Inc. - Page 134 of 196

Median Spending & Spending Range DetailsThis is the percent of weddings, number of weddings, and estimated total sales of weddings that spend within certain rangesfor Photography & Video - Photo Booth in Limestone TX - (County).
NOTE: Sum of the Spending Distribution estimated total sales may be more than the item total sales because we use themiddle point of the spending ranges to estimate the sales. For total sales use the item total sales value.
Spending Range Percent of Weddings Number of Weddings Total Sales
<$100 29.0% 10 $ 493
$100 - 250 22.2% 8 $ 1,321
$251 - 500 26.1% 9 $ 3,328
$501 - 1000 16.5% 6 $ 4,208
$1001 - 1500 4.0% 1 $ 1,700
$1500+ 2.3% 1 $0
Average Spending by Number of Guests RangeThis is the average spending by number of guests range for Photo Booth in Limestone TX - (County).
Range Average Spending
Less than 25 $227
25-50 $191
51-100 $286
101-150 $362
151-200 $370
201-300 $426
More than 300 $720
342017 Weddings
$3702017 Avg Spend
$ 2152016 Median Spend
Table
Table
© 2016 The Wedding Report Inc. - Page 135 of 196

Photography & Video - Prints and/orEnlargements
© 2016 The Wedding Report Inc. - Page 136 of 196
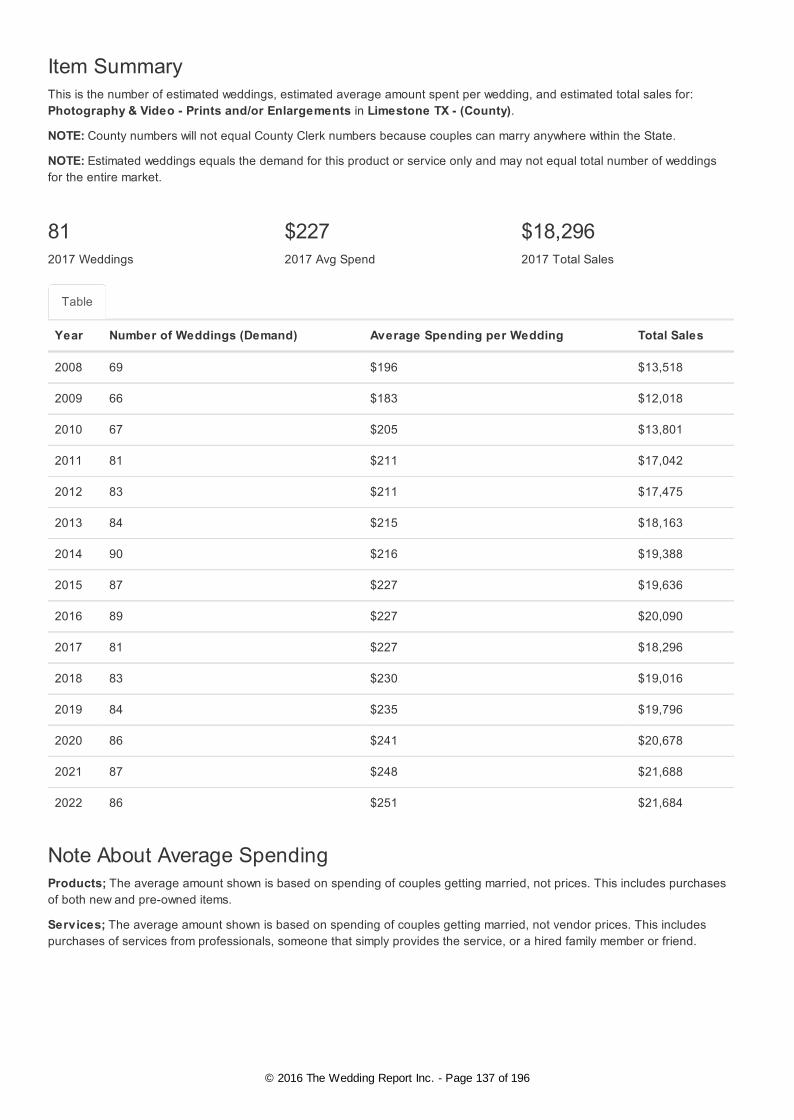
Item SummaryThis is the number of estimated weddings, estimated average amount spent per wedding, and estimated total sales for:Photography & Video - Prints and/or Enlargements in Limestone TX - (County).
NOTE: County numbers will not equal County Clerk numbers because couples can marry anywhere within the State.
NOTE: Estimated weddings equals the demand for this product or service only and may not equal total number of weddingsfor the entire market.
Year Number of Weddings (Demand) Average Spending per Wedding Total Sales
2008 69 $196 $13,518
2009 66 $183 $12,018
2010 67 $205 $13,801
2011 81 $211 $17,042
2012 83 $211 $17,475
2013 84 $215 $18,163
2014 90 $216 $19,388
2015 87 $227 $19,636
2016 89 $227 $20,090
2017 81 $227 $18,296
2018 83 $230 $19,016
2019 84 $235 $19,796
2020 86 $241 $20,678
2021 87 $248 $21,688
2022 86 $251 $21,684
Note About Average SpendingProducts; The average amount shown is based on spending of couples getting married, not prices. This includes purchasesof both new and pre-owned items.
Services; The average amount shown is based on spending of couples getting married, not vendor prices. This includespurchases of services from professionals, someone that simply provides the service, or a hired family member or friend.
812017 Weddings
$2272017 Avg Spend
$18,2962017 Total Sales
Table
© 2016 The Wedding Report Inc. - Page 137 of 196

Median Spending & Spending Range DetailsThis is the percent of weddings, number of weddings, and estimated total sales of weddings that spend within certain rangesfor Photography & Video - Prints and/or Enlargements in Limestone TX - (County).
NOTE: Sum of the Spending Distribution estimated total sales may be more than the item total sales because we use themiddle point of the spending ranges to estimate the sales. For total sales use the item total sales value.
Spending Range Percent of Weddings Number of Weddings Total Sales
<$100 48.0% 39 $ 1,944
$101 - $250 29.4% 24 $ 4,167
$251 - $500 13.6% 11 $ 4,131
$501 - $1000 6.8% 6 $ 4,131
$1001 - $1500 1.1% 1 $0
$1500+ 1.1% 1 $0
Average Spending by Number of Guests RangeThis is the average spending by number of guests range for Prints and/or Enlargements in Limestone TX - (County).
Range Average Spending
Less than 25 $98
25-50 $172
51-100 $153
101-150 $188
151-200 $239
201-300 $301
More than 300 $345
812017 Weddings
$2272017 Avg Spend
$ 842016 Median Spend
Table
Table
© 2016 The Wedding Report Inc. - Page 138 of 196

Photography & Video - Wedding album/s or photobook/s
© 2016 The Wedding Report Inc. - Page 139 of 196

Item SummaryThis is the number of estimated weddings, estimated average amount spent per wedding, and estimated total sales for:Photography & Video - Wedding album/s or photo book/s in Limestone TX - (County).
NOTE: County numbers will not equal County Clerk numbers because couples can marry anywhere within the State.
NOTE: Estimated weddings equals the demand for this product or service only and may not equal total number of weddingsfor the entire market.
Year Number of Weddings (Demand) Average Spending per Wedding Total Sales
2008 50 $402 $20,164
2009 48 $388 $18,531
2010 50 $420 $20,790
2011 57 $437 $24,966
2012 59 $434 $25,424
2013 61 $412 $25,313
2014 69 $403 $27,884
2015 71 $410 $29,081
2016 74 $401 $29,810
2017 74 $399 $29,686
2018 76 $396 $30,223
2019 78 $395 $30,715
2020 79 $392 $31,046
2021 81 $389 $31,451
2022 80 $386 $30,830
Note About Average SpendingProducts; The average amount shown is based on spending of couples getting married, not prices. This includes purchasesof both new and pre-owned items.
Services; The average amount shown is based on spending of couples getting married, not vendor prices. This includespurchases of services from professionals, someone that simply provides the service, or a hired family member or friend.
742017 Weddings
$3992017 Avg Spend
$29,6862017 Total Sales
Table
© 2016 The Wedding Report Inc. - Page 140 of 196

Median Spending & Spending Range DetailsThis is the percent of weddings, number of weddings, and estimated total sales of weddings that spend within certain rangesfor Photography & Video - Wedding album/s or photo book/s in Limestone TX - (County).
NOTE: Sum of the Spending Distribution estimated total sales may be more than the item total sales because we use themiddle point of the spending ranges to estimate the sales. For total sales use the item total sales value.
Spending Range Percent of Weddings Number of Weddings Total Sales
<$100 57.1% 42 $ 2,113
$101 - $250 20.3% 15 $ 2,629
$251 - $500 13.0% 10 $ 3,608
$501 - $1000 5.1% 4 $ 2,830
$1001 - $1500 3.4% 3 $ 3,145
$1500+ 1.1% 1 $0
Average Spending by Number of Guests RangeThis is the average spending by number of guests range for Wedding album/s or photo book/s in Limestone TX - (County).
Range Average Spending
Less than 25 $158
25-50 $206
51-100 $390
101-150 $324
151-200 $412
201-300 $394
More than 300 $681
742017 Weddings
$3992017 Avg Spend
$ 1502016 Median Spend
Table
Table
© 2016 The Wedding Report Inc. - Page 141 of 196

Photography & Video - Wedding Photographer
© 2016 The Wedding Report Inc. - Page 142 of 196

Item SummaryThis is the number of estimated weddings, estimated average amount spent per wedding, and estimated total sales for:Photography & Video - Wedding Photographer in Limestone TX - (County).
NOTE: County numbers will not equal County Clerk numbers because couples can marry anywhere within the State.
NOTE: Estimated weddings equals the demand for this product or service only and may not equal total number of weddingsfor the entire market.
Year Number of Weddings (Demand) Average Spending per Wedding Total Sales
2008 121 $1,369 $165,950
2009 123 $1,588 $195,927
2010 137 $1,626 $222,144
2011 148 $1,530 $226,058
2012 154 $1,527 $234,425
2013 146 $1,524 $222,382
2014 142 $1,509 $214,459
2015 133 $1,574 $209,673
2016 136 $1,534 $209,069
2017 119 $1,538 $183,560
2018 122 $1,534 $187,808
2019 126 $1,534 $193,836
2020 129 $1,530 $196,911
2021 130 $1,530 $199,436
2022 129 $1,527 $196,632
Note About Average SpendingProducts; The average amount shown is based on spending of couples getting married, not prices. This includes purchasesof both new and pre-owned items.
Services; The average amount shown is based on spending of couples getting married, not vendor prices. This includespurchases of services from professionals, someone that simply provides the service, or a hired family member or friend.
1192017 Weddings
$1,5382017 Avg Spend
$183,5602017 Total Sales
Table
© 2016 The Wedding Report Inc. - Page 143 of 196

Median Spending & Spending Range DetailsThis is the percent of weddings, number of weddings, and estimated total sales of weddings that spend within certain rangesfor Photography & Video - Wedding Photographer in Limestone TX - (County).
NOTE: Sum of the Spending Distribution estimated total sales may be more than the item total sales because we use themiddle point of the spending ranges to estimate the sales. For total sales use the item total sales value.
Spending Range Percent of Weddings Number of Weddings Total Sales
<$500 30.5% 36 $ 9,074
$500 - 1000 25.4% 30 $ 22,670
$1001 - 2000 23.7% 28 $ 42,305
$2001 - 3000 11.9% 14 $ 35,403
$3001 - 5000 6.2% 7 $ 29,512
$5000+ 2.3% 3 $ 20,528
Average Spending by Number of Guests RangeThis is the average spending by number of guests range for Wedding Photographer in Limestone TX - (County).
Range Average Spending
Less than 25 $766
25-50 $808
51-100 $1,134
101-150 $1,432
151-200 $1,574
201-300 $1,744
More than 300 $2,226
1192017 Weddings
$1,5382017 Avg Spend
$ 7512016 Median Spend
Table
Table
© 2016 The Wedding Report Inc. - Page 144 of 196

Photography & Video - Wedding Videographer
© 2016 The Wedding Report Inc. - Page 145 of 196

Item SummaryThis is the number of estimated weddings, estimated average amount spent per wedding, and estimated total sales for:Photography & Video - Wedding Videographer in Limestone TX - (County).
NOTE: County numbers will not equal County Clerk numbers because couples can marry anywhere within the State.
NOTE: Estimated weddings equals the demand for this product or service only and may not equal total number of weddingsfor the entire market.
Year Number of Weddings (Demand) Average Spending per Wedding Total Sales
2008 67 $1,027 $68,686
2009 56 $1,158 $64,524
2010 69 $1,054 $73,042
2011 71 $967 $68,580
2012 75 $965 $72,124
2013 71 $933 $66,280
2014 75 $971 $72,631
2015 74 $1,023 $76,101
2016 74 $1,021 $75,901
2017 57 $1,026 $58,841
2018 59 $1,005 $59,124
2019 62 $998 $61,437
2020 63 $989 $62,010
2021 63 $987 $61,885
2022 62 $982 $60,825
Note About Average SpendingProducts; The average amount shown is based on spending of couples getting married, not prices. This includes purchasesof both new and pre-owned items.
Services; The average amount shown is based on spending of couples getting married, not vendor prices. This includespurchases of services from professionals, someone that simply provides the service, or a hired family member or friend.
572017 Weddings
$1,0262017 Avg Spend
$58,8412017 Total Sales
Table
© 2016 The Wedding Report Inc. - Page 146 of 196

Median Spending & Spending Range DetailsThis is the percent of weddings, number of weddings, and estimated total sales of weddings that spend within certain rangesfor Photography & Video - Wedding Videographer in Limestone TX - (County).
NOTE: Sum of the Spending Distribution estimated total sales may be more than the item total sales because we use themiddle point of the spending ranges to estimate the sales. For total sales use the item total sales value.
Spending Range Percent of Weddings Number of Weddings Total Sales
<$500 43.8% 25 $ 6,242
$500 - 1000 27.0% 15 $ 11,543
$1001 - 2000 19.1% 11 $ 16,331
$2001 - 3000 5.6% 3 $ 7,980
$3001 - 5000 2.8% 2 $ 6,384
$5000+ 1.7% 1 $0
Average Spending by Number of Guests RangeThis is the average spending by number of guests range for Wedding Videographer in Limestone TX - (County).
Range Average Spending
Less than 25 $549
25-50 $454
51-100 $719
101-150 $870
151-200 $984
201-300 $1,069
More than 300 $1,797
572017 Weddings
$1,0262017 Avg Spend
$ 5792016 Median Spend
Table
Table
© 2016 The Wedding Report Inc. - Page 147 of 196

Planner/Consultant - A La Carte Services
© 2016 The Wedding Report Inc. - Page 148 of 196

Item SummaryThis is the number of estimated weddings, estimated average amount spent per wedding, and estimated total sales for:Planner/Consultant - A La Carte Services in Limestone TX - (County).
NOTE: County numbers will not equal County Clerk numbers because couples can marry anywhere within the State.
NOTE: Estimated weddings equals the demand for this product or service only and may not equal total number of weddingsfor the entire market.
Year Number of Weddings (Demand) Average Spending per Wedding Total Sales
2008 10 $868 $9,071
2009 10 $649 $6,458
2010 10 $1,148 $11,365
2011 10 $1,012 $9,968
2012 10 $1,002 $10,120
2013 10 $1,035 $9,936
2014 9 $997 $9,322
2015 10 $921 $9,560
2016 11 $903 $9,590
2017 9 $905 $8,416
2018 10 $910 $8,681
2019 10 $917 $8,913
2020 10 $922 $9,128
2021 10 $929 $9,197
2022 10 $934 $9,135
Note About Average SpendingProducts; The average amount shown is based on spending of couples getting married, not prices. This includes purchasesof both new and pre-owned items.
Services; The average amount shown is based on spending of couples getting married, not vendor prices. This includespurchases of services from professionals, someone that simply provides the service, or a hired family member or friend.
92017 Weddings
$9052017 Avg Spend
$8,4162017 Total Sales
Table
© 2016 The Wedding Report Inc. - Page 149 of 196

Median Spending & Spending Range DetailsThis is the percent of weddings, number of weddings, and estimated total sales of weddings that spend within certain rangesfor Planner/Consultant - A La Carte Services in Limestone TX - (County).
NOTE: Sum of the Spending Distribution estimated total sales may be more than the item total sales because we use themiddle point of the spending ranges to estimate the sales. For total sales use the item total sales value.
Spending Range Percent of Weddings Number of Weddings Total Sales
<$250 45.8% 4 $ 1,031
$250 - 500 21.5% 2 $ 726
$501 - 1000 15.8% 1 $ 1,067
$1001 - 2000 6.8% 1 $0
$2001 - 3500 3.4% 0 $0
$3500+ 6.8% 1 $0
Average Spending by Number of Guests RangeThis is the average spending by number of guests range for A La Carte Services in Limestone TX - (County).
Range Average Spending
Less than 25 $576
25-50 $417
51-100 $793
101-150 $617
151-200 $734
201-300 $918
More than 300 $2,203
92017 Weddings
$9052017 Avg Spend
$ 3542016 Median Spend
Table
Table
© 2016 The Wedding Report Inc. - Page 150 of 196

Planner/Consultant - Day of Coordinator
© 2016 The Wedding Report Inc. - Page 151 of 196

Item SummaryThis is the number of estimated weddings, estimated average amount spent per wedding, and estimated total sales for:Planner/Consultant - Day of Coordinator in Limestone TX - (County).
NOTE: County numbers will not equal County Clerk numbers because couples can marry anywhere within the State.
NOTE: Estimated weddings equals the demand for this product or service only and may not equal total number of weddingsfor the entire market.
Year Number of Weddings (Demand) Average Spending per Wedding Total Sales
2008 19 $693 $13,035
2009 20 $709 $14,109
2010 22 $864 $18,818
2011 22 $878 $19,026
2012 24 $872 $21,137
2013 23 $848 $19,538
2014 24 $860 $20,907
2015 24 $794 $19,231
2016 25 $777 $19,254
2017 22 $778 $16,883
2018 22 $780 $17,363
2019 24 $791 $19,221
2020 25 $796 $19,701
2021 25 $803 $19,874
2022 24 $808 $19,756
Note About Average SpendingProducts; The average amount shown is based on spending of couples getting married, not prices. This includes purchasesof both new and pre-owned items.
Services; The average amount shown is based on spending of couples getting married, not vendor prices. This includespurchases of services from professionals, someone that simply provides the service, or a hired family member or friend.
222017 Weddings
$7782017 Avg Spend
$16,8832017 Total Sales
Table
© 2016 The Wedding Report Inc. - Page 152 of 196

Median Spending & Spending Range DetailsThis is the percent of weddings, number of weddings, and estimated total sales of weddings that spend within certain rangesfor Planner/Consultant - Day of Coordinator in Limestone TX - (County).
NOTE: Sum of the Spending Distribution estimated total sales may be more than the item total sales because we use themiddle point of the spending ranges to estimate the sales. For total sales use the item total sales value.
Spending Range Percent of Weddings Number of Weddings Total Sales
<$250 48.6% 11 $ 2,673
$250 - 500 26.0% 6 $ 2,145
$501 - 1000 15.3% 3 $ 2,525
$1001 - 2000 6.8% 1 $ 2,244
$2001 - 3500 1.7% 0 $0
$3500+ 1.7% 0 $0
Average Spending by Number of Guests RangeThis is the average spending by number of guests range for Day of Coordinator in Limestone TX - (County).
Range Average Spending
Less than 25 $430
25-50 $567
51-100 $567
101-150 $660
151-200 $667
201-300 $746
More than 300 $2,066
222017 Weddings
$7782017 Avg Spend
$ 3332016 Median Spend
Table
Table
© 2016 The Wedding Report Inc. - Page 153 of 196

Planner/Consultant - For Getting Started
© 2016 The Wedding Report Inc. - Page 154 of 196

Item SummaryThis is the number of estimated weddings, estimated average amount spent per wedding, and estimated total sales for:Planner/Consultant - For Getting Started in Limestone TX - (County).
NOTE: County numbers will not equal County Clerk numbers because couples can marry anywhere within the State.
NOTE: Estimated weddings equals the demand for this product or service only and may not equal total number of weddingsfor the entire market.
Year Number of Weddings (Demand) Average Spending per Wedding Total Sales
2008 10 $654 $6,834
2009 10 $624 $6,209
2010 10 $900 $8,910
2011 10 $865 $8,520
2012 10 $859 $8,676
2013 10 $881 $8,458
2014 9 $912 $8,527
2015 9 $850 $7,353
2016 9 $838 $7,416
2017 8 $838 $6,495
2018 8 $847 $6,734
2019 8 $859 $6,958
2020 8 $869 $7,169
2021 8 $876 $7,227
2022 8 $880 $7,172
Note About Average SpendingProducts; The average amount shown is based on spending of couples getting married, not prices. This includes purchasesof both new and pre-owned items.
Services; The average amount shown is based on spending of couples getting married, not vendor prices. This includespurchases of services from professionals, someone that simply provides the service, or a hired family member or friend.
82017 Weddings
$8382017 Avg Spend
$6,4952017 Total Sales
Table
© 2016 The Wedding Report Inc. - Page 155 of 196

Median Spending & Spending Range DetailsThis is the percent of weddings, number of weddings, and estimated total sales of weddings that spend within certain rangesfor Planner/Consultant - For Getting Started in Limestone TX - (County).
NOTE: Sum of the Spending Distribution estimated total sales may be more than the item total sales because we use themiddle point of the spending ranges to estimate the sales. For total sales use the item total sales value.
Spending Range Percent of Weddings Number of Weddings Total Sales
<$250 49.4% 4 $ 988
$250 - 500 24.2% 2 $ 726
$501 - 1000 11.8% 1 $0
$1001 - 2000 6.2% 0 $0
$2001 - 3500 2.8% 0 $0
$3500+ 5.6% 0 $0
Average Spending by Number of Guests RangeThis is the average spending by number of guests range for For Getting Started in Limestone TX - (County).
Range Average Spending
Less than 25 $340
25-50 $494
51-100 $510
101-150 $664
151-200 $634
201-300 $757
More than 300 $2,642
82017 Weddings
$8382017 Avg Spend
$ 3502016 Median Spend
Table
Table
© 2016 The Wedding Report Inc. - Page 156 of 196

Planner/Consultant - Full Service
© 2016 The Wedding Report Inc. - Page 157 of 196
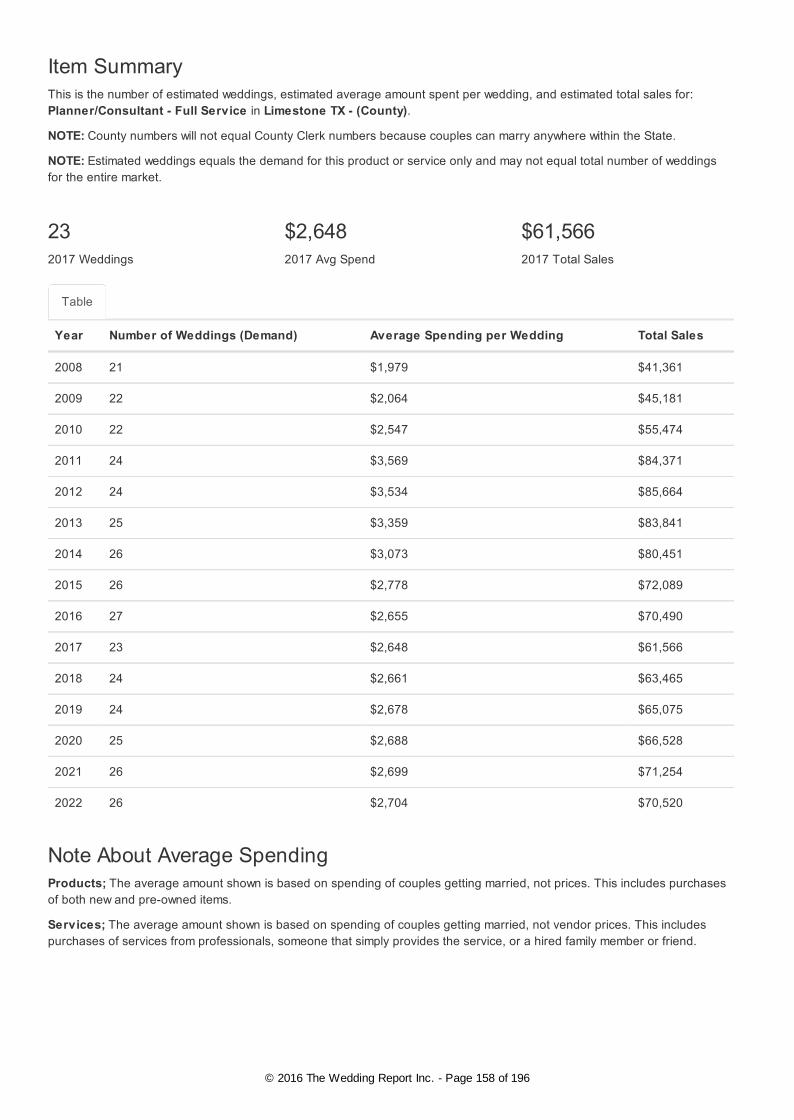
Item SummaryThis is the number of estimated weddings, estimated average amount spent per wedding, and estimated total sales for:Planner/Consultant - Full Service in Limestone TX - (County).
NOTE: County numbers will not equal County Clerk numbers because couples can marry anywhere within the State.
NOTE: Estimated weddings equals the demand for this product or service only and may not equal total number of weddingsfor the entire market.
Year Number of Weddings (Demand) Average Spending per Wedding Total Sales
2008 21 $1,979 $41,361
2009 22 $2,064 $45,181
2010 22 $2,547 $55,474
2011 24 $3,569 $84,371
2012 24 $3,534 $85,664
2013 25 $3,359 $83,841
2014 26 $3,073 $80,451
2015 26 $2,778 $72,089
2016 27 $2,655 $70,490
2017 23 $2,648 $61,566
2018 24 $2,661 $63,465
2019 24 $2,678 $65,075
2020 25 $2,688 $66,528
2021 26 $2,699 $71,254
2022 26 $2,704 $70,520
Note About Average SpendingProducts; The average amount shown is based on spending of couples getting married, not prices. This includes purchasesof both new and pre-owned items.
Services; The average amount shown is based on spending of couples getting married, not vendor prices. This includespurchases of services from professionals, someone that simply provides the service, or a hired family member or friend.
232017 Weddings
$2,6482017 Avg Spend
$61,5662017 Total Sales
Table
© 2016 The Wedding Report Inc. - Page 158 of 196

Median Spending & Spending Range DetailsThis is the percent of weddings, number of weddings, and estimated total sales of weddings that spend within certain rangesfor Planner/Consultant - Full Service in Limestone TX - (County).
NOTE: Sum of the Spending Distribution estimated total sales may be more than the item total sales because we use themiddle point of the spending ranges to estimate the sales. For total sales use the item total sales value.
Spending Range Percent of Weddings Number of Weddings Total Sales
<$500 46.1% 11 $ 2,651
$500 - 1000 16.3% 4 $ 2,812
$1001 - 2000 15.7% 4 $ 5,417
$2001 - 3000 9.6% 2 $ 5,520
$3001 - 5000 2.8% 1 $0
$5000+ 9.6% 2 $ 16,560
Average Spending by Number of Guests RangeThis is the average spending by number of guests range for Full Service in Limestone TX - (County).
Range Average Spending
Less than 25 $1,538
25-50 $1,294
51-100 $1,977
101-150 $2,368
151-200 $2,417
201-300 $3,052
More than 300 $4,419
232017 Weddings
$2,6482017 Avg Spend
$ 7562016 Median Spend
Table
Table
© 2016 The Wedding Report Inc. - Page 159 of 196

Planner/Consultant - Month of Direction
© 2016 The Wedding Report Inc. - Page 160 of 196

Item SummaryThis is the number of estimated weddings, estimated average amount spent per wedding, and estimated total sales for:Planner/Consultant - Month of Direction in Limestone TX - (County).
NOTE: County numbers will not equal County Clerk numbers because couples can marry anywhere within the State.
NOTE: Estimated weddings equals the demand for this product or service only and may not equal total number of weddingsfor the entire market.
Year Number of Weddings (Demand) Average Spending per Wedding Total Sales
2008 10 $1,015 $10,607
2009 10 $1,028 $10,229
2010 10 $1,331 $13,177
2011 10 $1,263 $12,441
2012 10 $1,249 $12,615
2013 10 $1,183 $11,357
2014 9 $1,150 $10,753
2015 9 $1,044 $9,031
2016 9 $1,017 $9,000
2017 8 $1,019 $7,897
2018 8 $1,016 $8,077
2019 8 $1,016 $8,230
2020 8 $1,013 $8,357
2021 8 $1,013 $8,357
2022 8 $1,010 $8,232
Note About Average SpendingProducts; The average amount shown is based on spending of couples getting married, not prices. This includes purchasesof both new and pre-owned items.
Services; The average amount shown is based on spending of couples getting married, not vendor prices. This includespurchases of services from professionals, someone that simply provides the service, or a hired family member or friend.
82017 Weddings
$1,0192017 Avg Spend
$7,8972017 Total Sales
Table
© 2016 The Wedding Report Inc. - Page 161 of 196

Median Spending & Spending Range DetailsThis is the percent of weddings, number of weddings, and estimated total sales of weddings that spend within certain rangesfor Planner/Consultant - Month of Direction in Limestone TX - (County).
NOTE: Sum of the Spending Distribution estimated total sales may be more than the item total sales because we use themiddle point of the spending ranges to estimate the sales. For total sales use the item total sales value.
Spending Range Percent of Weddings Number of Weddings Total Sales
<$250 52.3% 4 $ 1,046
$250 - 500 21.6% 2 $ 648
$501 - 1000 10.8% 1 $0
$1001 - 2000 8.5% 1 $0
$2001 - 3500 3.4% 0 $0
$3500+ 3.4% 0 $0
Average Spending by Number of Guests RangeThis is the average spending by number of guests range for Month of Direction in Limestone TX - (County).
Range Average Spending
Less than 25 $498
25-50 $770
51-100 $629
101-150 $968
151-200 $723
201-300 $1,015
More than 300 $2,555
82017 Weddings
$1,0192017 Avg Spend
$ 3322016 Median Spend
Table
Table
© 2016 The Wedding Report Inc. - Page 162 of 196

Venue, Catering & Rentals - Ceremony Officiator
© 2016 The Wedding Report Inc. - Page 163 of 196

Item SummaryThis is the number of estimated weddings, estimated average amount spent per wedding, and estimated total sales for:Venue, Catering & Rentals - Ceremony Officiator in Limestone TX - (County). Includes JP, Officiant, ordained friend orfamily member, Pastor, Minister, Priest, Rabbi, Etc.
NOTE: County numbers will not equal County Clerk numbers because couples can marry anywhere within the State.
NOTE: Estimated weddings equals the demand for this product or service only and may not equal total number of weddingsfor the entire market.
Year Number of Weddings (Demand) Average Spending per Wedding Total Sales
2008 150 $178 $26,785
2009 143 $187 $26,793
2010 143 $201 $28,655
2011 140 $181 $25,316
2012 145 $181 $26,325
2013 138 $182 $25,160
2014 133 $191 $25,359
2015 125 $190 $23,666
2016 126 $194 $24,380
2017 109 $195 $21,158
2018 111 $194 $21,592
2019 115 $195 $22,429
2020 117 $196 $22,961
2021 117 $197 $23,079
2022 116 $199 $23,030
Note About Average SpendingProducts; The average amount shown is based on spending of couples getting married, not prices. This includes purchasesof both new and pre-owned items.
Services; The average amount shown is based on spending of couples getting married, not vendor prices. This includespurchases of services from professionals, someone that simply provides the service, or a hired family member or friend.
1092017 Weddings
$1952017 Avg Spend
$21,1582017 Total Sales
Table
© 2016 The Wedding Report Inc. - Page 164 of 196

Median Spending & Spending Range DetailsThis is the percent of weddings, number of weddings, and estimated total sales of weddings that spend within certain rangesfor Venue, Catering & Rentals - Ceremony Officiator in Limestone TX - (County).
NOTE: Sum of the Spending Distribution estimated total sales may be more than the item total sales because we use themiddle point of the spending ranges to estimate the sales. For total sales use the item total sales value.
Spending Range Percent of Weddings Number of Weddings Total Sales
<$50 29.9% 33 $ 815
$50 - 100 29.4% 32 $ 2,403
$101 - 250 30.5% 33 $ 5,818
$251 - 500 6.8% 7 $ 2,780
$501 - 1000 2.3% 3 $ 1,880
$1000+ 1.1% 1 $ 1,798
Average Spending by Number of Guests RangeThis is the average spending by number of guests range for Ceremony Officiator in Limestone TX - (County).
Range Average Spending
Less than 25 $138
25-50 $115
51-100 $158
101-150 $180
151-200 $196
201-300 $203
More than 300 $270
1092017 Weddings
$1952017 Avg Spend
$ 952016 Median Spend
Table
Table
© 2016 The Wedding Report Inc. - Page 165 of 196

Venue, Catering & Rentals - Event Accessories
© 2016 The Wedding Report Inc. - Page 166 of 196

Item SummaryThis is the number of estimated weddings, estimated average amount spent per wedding, and estimated total sales for:Venue, Catering & Rentals - Event Accessories in Limestone TX - (County). Includes aisle runner, ring pillow or box,unity candle, toasting flutes, cake topper, serving set, etc. not flowers or decorations
NOTE: County numbers will not equal County Clerk numbers because couples can marry anywhere within the State.
NOTE: Estimated weddings equals the demand for this product or service only and may not equal total number of weddingsfor the entire market.
Year Number of Weddings (Demand) Average Spending per Wedding Total Sales
2008 113 $586 $66,136
2009 111 $542 $60,400
2010 131 $303 $39,596
2011 132 $301 $39,729
2012 137 $300 $41,208
2013 132 $298 $39,479
2014 133 $298 $39,565
2015 125 $297 $36,994
2016 127 $297 $37,850
2017 118 $297 $34,987
2018 121 $295 $35,648
2019 125 $294 $36,674
2020 127 $291 $36,972
2021 127 $289 $36,717
2022 126 $286 $35,896
Note About Average SpendingProducts; The average amount shown is based on spending of couples getting married, not prices. This includes purchasesof both new and pre-owned items.
Services; The average amount shown is based on spending of couples getting married, not vendor prices. This includespurchases of services from professionals, someone that simply provides the service, or a hired family member or friend.
1182017 Weddings
$2972017 Avg Spend
$34,9872017 Total Sales
Table
© 2016 The Wedding Report Inc. - Page 167 of 196

Median Spending & Spending Range DetailsThis is the percent of weddings, number of weddings, and estimated total sales of weddings that spend within certain rangesfor Venue, Catering & Rentals - Event Accessories in Limestone TX - (County).
NOTE: Sum of the Spending Distribution estimated total sales may be more than the item total sales because we use themiddle point of the spending ranges to estimate the sales. For total sales use the item total sales value.
Spending Range Percent of Weddings Number of Weddings Total Sales
<$100 38.8% 46 $ 2,289
$101 - 250 17.4% 21 $ 3,593
$251 - 500 20.2% 24 $ 8,939
$501 - 750 13.5% 16 $ 10,753
$751 - 1000 2.2% 3 $ 2,271
$1000+ 7.9% 9 $ 13,983
Average Spending by Number of Guests RangeThis is the average spending by number of guests range for Event Accessories in Limestone TX - (County).
Range Average Spending
Less than 25 $216
25-50 $189
51-100 $214
101-150 $255
151-200 $288
201-300 $331
More than 300 $602
1182017 Weddings
$2972017 Avg Spend
$ 1812016 Median Spend
Table
Table
© 2016 The Wedding Report Inc. - Page 168 of 196

Venue, Catering & Rentals - Event Bar Service
© 2016 The Wedding Report Inc. - Page 169 of 196

Item SummaryThis is the number of estimated weddings, estimated average amount spent per wedding, and estimated total sales for:Venue, Catering & Rentals - Event Bar Service in Limestone TX - (County).
NOTE: County numbers will not equal County Clerk numbers because couples can marry anywhere within the State.
NOTE: Estimated weddings equals the demand for this product or service only and may not equal total number of weddingsfor the entire market.
Year Number of Weddings (Demand) Average Spending per Wedding Total Sales
2008 111 $2,280 $252,556
2009 96 $1,885 $180,055
2010 113 $2,030 $229,106
2011 102 $2,272 $232,744
2012 107 $2,266 $242,598
2013 104 $2,256 $233,902
2014 107 $2,212 $235,777
2015 104 $2,170 $225,246
2016 106 $2,158 $229,180
2017 91 $2,166 $198,081
2018 94 $2,216 $207,883
2019 97 $2,233 $217,048
2020 99 $2,242 $221,958
2021 101 $2,258 $227,268
2022 99 $2,268 $225,507
Note About Average SpendingProducts; The average amount shown is based on spending of couples getting married, not prices. This includes purchasesof both new and pre-owned items.
Services; The average amount shown is based on spending of couples getting married, not vendor prices. This includespurchases of services from professionals, someone that simply provides the service, or a hired family member or friend.
912017 Weddings
$2,1662017 Avg Spend
$198,0812017 Total Sales
Table
© 2016 The Wedding Report Inc. - Page 170 of 196

Median Spending & Spending Range DetailsThis is the percent of weddings, number of weddings, and estimated total sales of weddings that spend within certain rangesfor Venue, Catering & Rentals - Event Bar Service in Limestone TX - (County).
NOTE: Sum of the Spending Distribution estimated total sales may be more than the item total sales because we use themiddle point of the spending ranges to estimate the sales. For total sales use the item total sales value.
Spending Range Percent of Weddings Number of Weddings Total Sales
<$1000 51.1% 47 $ 23,251
$1001 - 2500 27.8% 25 $ 44,272
$2501 - 5000 13.6% 12 $ 46,410
$5001 - 10000 5.1% 5 $ 34,808
$10001 - 15000 1.1% 1 $ 12,512
$15000+ 1.1% 1 $ 22,522
Average Spending by Number of Guests RangeThis is the average spending by number of guests range for Event Bar Service in Limestone TX - (County).
Range Average Spending
Less than 25 $599
25-50 $1,018
51-100 $1,258
101-150 $1,777
151-200 $2,436
201-300 $3,595
More than 300 $4,653
912017 Weddings
$2,1662017 Avg Spend
$ 9722016 Median Spend
Table
Table
© 2016 The Wedding Report Inc. - Page 171 of 196
Venue, Catering & Rentals - Event Food Service
© 2016 The Wedding Report Inc. - Page 172 of 196

Item SummaryThis is the number of estimated weddings, estimated average amount spent per wedding, and estimated total sales for:Venue, Catering & Rentals - Event Food Service in Limestone TX - (County).
NOTE: County numbers will not equal County Clerk numbers because couples can marry anywhere within the State.
NOTE: Estimated weddings equals the demand for this product or service only and may not equal total number of weddingsfor the entire market.
Year Number of Weddings (Demand) Average Spending per Wedding Total Sales
2008 130 $3,258 $422,172
2009 109 $3,210 $351,335
2010 131 $3,992 $521,675
2011 120 $4,402 $528,988
2012 125 $4,388 $549,553
2013 121 $4,375 $529,200
2014 123 $4,425 $546,134
2015 119 $4,354 $519,737
2016 124 $4,242 $525,584
2017 115 $4,262 $488,851
2018 118 $4,266 $501,938
2019 122 $4,287 $520,871
2020 124 $4,296 $531,630
2021 125 $4,317 $541,352
2022 124 $4,321 $535,285
Note About Average SpendingProducts; The average amount shown is based on spending of couples getting married, not prices. This includes purchasesof both new and pre-owned items.
Services; The average amount shown is based on spending of couples getting married, not vendor prices. This includespurchases of services from professionals, someone that simply provides the service, or a hired family member or friend.
1152017 Weddings
$4,2622017 Avg Spend
$488,8512017 Total Sales
Table
© 2016 The Wedding Report Inc. - Page 173 of 196

Median Spending & Spending Range DetailsThis is the percent of weddings, number of weddings, and estimated total sales of weddings that spend within certain rangesfor Venue, Catering & Rentals - Event Food Service in Limestone TX - (County).
NOTE: Sum of the Spending Distribution estimated total sales may be more than the item total sales because we use themiddle point of the spending ranges to estimate the sales. For total sales use the item total sales value.
Spending Range Percent of Weddings Number of Weddings Total Sales
<$1000 29.9% 34 $ 17,193
$1001 - 2500 23.7% 27 $ 47,696
$2501 - 5000 20.3% 23 $ 87,544
$5001 - 10000 15.8% 18 $136,275
$10001 - 15000 6.2% 7 $ 89,125
$15000+ 4.0% 5 $103,500
Average Spending by Number of Guests RangeThis is the average spending by number of guests range for Event Food Service in Limestone TX - (County).
Range Average Spending
Less than 25 $864
25-50 $1,493
51-100 $2,633
101-150 $4,244
151-200 $5,344
201-300 $5,776
More than 300 $6,994
1152017 Weddings
$4,2622017 Avg Spend
$ 1,7602016 Median Spend
Table
Table
© 2016 The Wedding Report Inc. - Page 174 of 196

Venue, Catering & Rentals - Event Location
© 2016 The Wedding Report Inc. - Page 175 of 196

Item SummaryThis is the number of estimated weddings, estimated average amount spent per wedding, and estimated total sales for:Venue, Catering & Rentals - Event Location in Limestone TX - (County).
NOTE: County numbers will not equal County Clerk numbers because couples can marry anywhere within the State.
NOTE: Estimated weddings equals the demand for this product or service only and may not equal total number of weddingsfor the entire market.
Year Number of Weddings (Demand) Average Spending per Wedding Total Sales
2008 127 $2,821 $359,649
2009 129 $2,341 $302,808
2010 141 $2,784 $391,375
2011 130 $3,196 $415,544
2012 135 $3,235 $437,825
2013 131 $3,334 $435,287
2014 133 $3,333 $442,522
2015 123 $3,311 $406,690
2016 126 $3,276 $411,695
2017 116 $3,298 $383,393
2018 119 $3,303 $393,883
2019 123 $3,321 $408,882
2020 125 $3,331 $417,707
2021 127 $3,344 $424,855
2022 126 $3,349 $420,333
Note About Average SpendingProducts; The average amount shown is based on spending of couples getting married, not prices. This includes purchasesof both new and pre-owned items.
Services; The average amount shown is based on spending of couples getting married, not vendor prices. This includespurchases of services from professionals, someone that simply provides the service, or a hired family member or friend.
1162017 Weddings
$3,2982017 Avg Spend
$383,3932017 Total Sales
Table
© 2016 The Wedding Report Inc. - Page 176 of 196

Median Spending & Spending Range DetailsThis is the percent of weddings, number of weddings, and estimated total sales of weddings that spend within certain rangesfor Venue, Catering & Rentals - Event Location in Limestone TX - (County).
NOTE: Sum of the Spending Distribution estimated total sales may be more than the item total sales because we use themiddle point of the spending ranges to estimate the sales. For total sales use the item total sales value.
Spending Range Percent of Weddings Number of Weddings Total Sales
<$1000 29.9% 35 $ 17,342
$1001 - 2500 29.9% 35 $ 60,697
$2501 - 5000 19.8% 23 $ 86,130
$5001 - 10000 11.3% 13 $ 98,310
$10001 - 15000 5.1% 6 $ 73,950
$15000+ 4.0% 5 $104,400
Average Spending by Number of Guests RangeThis is the average spending by number of guests range for Event Location in Limestone TX - (County).
Range Average Spending
Less than 25 $1,034
25-50 $1,490
51-100 $2,250
101-150 $3,253
151-200 $3,953
201-300 $3,983
More than 300 $4,865
1162017 Weddings
$3,2982017 Avg Spend
$ 1,6582016 Median Spend
Table
Table
© 2016 The Wedding Report Inc. - Page 177 of 196

Venue, Catering & Rentals - Event Rentals
© 2016 The Wedding Report Inc. - Page 178 of 196

Item SummaryThis is the number of estimated weddings, estimated average amount spent per wedding, and estimated total sales for:Venue, Catering & Rentals - Event Rentals in Limestone TX - (County). Includes lighting, tent, tables, chairs, photobooth, etc.
NOTE: County numbers will not equal County Clerk numbers because couples can marry anywhere within the State.
NOTE: Estimated weddings equals the demand for this product or service only and may not equal total number of weddingsfor the entire market.
Year Number of Weddings (Demand) Average Spending per Wedding Total Sales
2008 111 $1,858 $205,811
2009 94 $1,258 $117,661
2010 115 $1,274 $146,306
2011 108 $1,576 $170,760
2012 113 $1,572 $177,825
2013 109 $1,583 $173,244
2014 114 $1,597 $182,170
2015 109 $1,569 $171,005
2016 113 $1,576 $178,529
2017 104 $1,585 $164,602
2018 107 $1,595 $169,915
2019 110 $1,609 $177,247
2020 112 $1,618 $181,540
2021 114 $1,631 $185,689
2022 112 $1,640 $184,451
Note About Average SpendingProducts; The average amount shown is based on spending of couples getting married, not prices. This includes purchasesof both new and pre-owned items.
Services; The average amount shown is based on spending of couples getting married, not vendor prices. This includespurchases of services from professionals, someone that simply provides the service, or a hired family member or friend.
1042017 Weddings
$1,5852017 Avg Spend
$164,6022017 Total Sales
Table
© 2016 The Wedding Report Inc. - Page 179 of 196
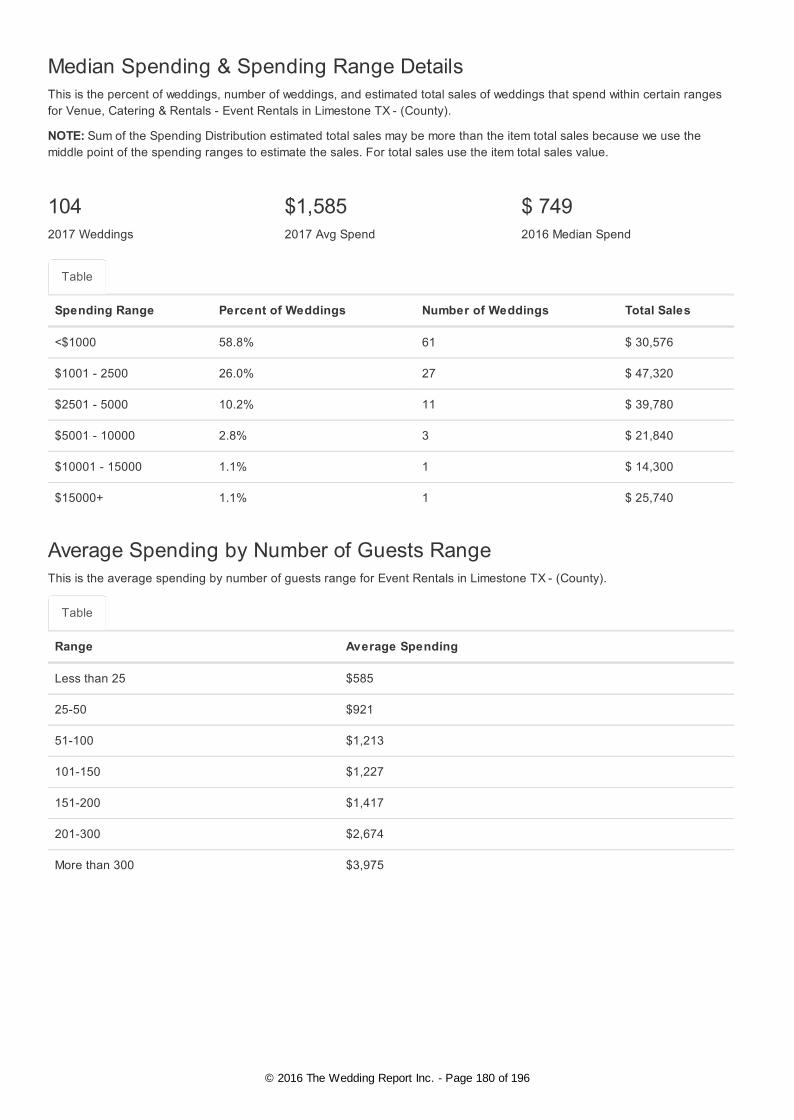
Median Spending & Spending Range DetailsThis is the percent of weddings, number of weddings, and estimated total sales of weddings that spend within certain rangesfor Venue, Catering & Rentals - Event Rentals in Limestone TX - (County).
NOTE: Sum of the Spending Distribution estimated total sales may be more than the item total sales because we use themiddle point of the spending ranges to estimate the sales. For total sales use the item total sales value.
Spending Range Percent of Weddings Number of Weddings Total Sales
<$1000 58.8% 61 $ 30,576
$1001 - 2500 26.0% 27 $ 47,320
$2501 - 5000 10.2% 11 $ 39,780
$5001 - 10000 2.8% 3 $ 21,840
$10001 - 15000 1.1% 1 $ 14,300
$15000+ 1.1% 1 $ 25,740
Average Spending by Number of Guests RangeThis is the average spending by number of guests range for Event Rentals in Limestone TX - (County).
Range Average Spending
Less than 25 $585
25-50 $921
51-100 $1,213
101-150 $1,227
151-200 $1,417
201-300 $2,674
More than 300 $3,975
1042017 Weddings
$1,5852017 Avg Spend
$ 7492016 Median Spend
Table
Table
© 2016 The Wedding Report Inc. - Page 180 of 196

Venue, Catering & Rentals - Hotel Room for AfterReception
© 2016 The Wedding Report Inc. - Page 181 of 196

Item SummaryThis is the number of estimated weddings, estimated average amount spent per wedding, and estimated total sales for:Venue, Catering & Rentals - Hotel Room for After Reception in Limestone TX - (County).
NOTE: County numbers will not equal County Clerk numbers because couples can marry anywhere within the State.
NOTE: Estimated weddings equals the demand for this product or service only and may not equal total number of weddingsfor the entire market.
Year Number of Weddings (Demand) Average Spending per Wedding Total Sales
2008 119 $249 $29,663
2009 113 $234 $26,543
2010 125 $259 $32,308
2011 122 $278 $33,955
2012 127 $277 $35,251
2013 121 $276 $33,385
2014 122 $284 $34,520
2015 114 $282 $32,199
2016 115 $286 $32,904
2017 93 $287 $26,691
2018 95 $297 $28,334
2019 99 $307 $30,338
2020 101 $313 $31,503
2021 102 $319 $32,634
2022 101 $325 $32,845
Note About Average SpendingProducts; The average amount shown is based on spending of couples getting married, not prices. This includes purchasesof both new and pre-owned items.
Services; The average amount shown is based on spending of couples getting married, not vendor prices. This includespurchases of services from professionals, someone that simply provides the service, or a hired family member or friend.
932017 Weddings
$2872017 Avg Spend
$26,6912017 Total Sales
Table
© 2016 The Wedding Report Inc. - Page 182 of 196

Median Spending & Spending Range DetailsThis is the percent of weddings, number of weddings, and estimated total sales of weddings that spend within certain rangesfor Venue, Catering & Rentals - Hotel Room for After Reception in Limestone TX - (County).
NOTE: Sum of the Spending Distribution estimated total sales may be more than the item total sales because we use themiddle point of the spending ranges to estimate the sales. For total sales use the item total sales value.
Spending Range Percent of Weddings Number of Weddings Total Sales
<$100 20.3% 19 $ 944
$101 - 250 48.6% 45 $ 7,910
$251 - 500 20.9% 19 $ 7,289
$501 - 750 5.6% 5 $ 3,515
$751 - 1000 2.3% 2 $ 1,872
$1000+ 2.3% 2 $ 3,208
Average Spending by Number of Guests RangeThis is the average spending by number of guests range for Hotel Room for After Reception in Limestone TX - (County).
Range Average Spending
Less than 25 $283
25-50 $280
51-100 $241
101-150 $249
151-200 $254
201-300 $288
More than 300 $421
932017 Weddings
$2872017 Avg Spend
$ 2012016 Median Spend
Table
Table
© 2016 The Wedding Report Inc. - Page 183 of 196
Venue, Catering & Rentals - Limo Rental
© 2016 The Wedding Report Inc. - Page 184 of 196

Item SummaryThis is the number of estimated weddings, estimated average amount spent per wedding, and estimated total sales for:Venue, Catering & Rentals - Limo Rental in Limestone TX - (County).
NOTE: County numbers will not equal County Clerk numbers because couples can marry anywhere within the State.
NOTE: Estimated weddings equals the demand for this product or service only and may not equal total number of weddingsfor the entire market.
Year Number of Weddings (Demand) Average Spending per Wedding Total Sales
2008 90 $464 $41,700
2009 74 $472 $34,753
2010 83 $448 $37,256
2011 77 $435 $33,421
2012 79 $434 $34,191
2013 75 $437 $32,723
2014 73 $437 $31,870
2015 67 $438 $29,552
2016 67 $438 $29,460
2017 47 $440 $20,460
2018 48 $437 $20,845
2019 49 $436 $21,190
2020 50 $433 $21,434
2021 50 $432 $21,384
2022 49 $429 $20,978
Note About Average SpendingProducts; The average amount shown is based on spending of couples getting married, not prices. This includes purchasesof both new and pre-owned items.
Services; The average amount shown is based on spending of couples getting married, not vendor prices. This includespurchases of services from professionals, someone that simply provides the service, or a hired family member or friend.
472017 Weddings
$4402017 Avg Spend
$20,4602017 Total Sales
Table
© 2016 The Wedding Report Inc. - Page 185 of 196

Median Spending & Spending Range DetailsThis is the percent of weddings, number of weddings, and estimated total sales of weddings that spend within certain rangesfor Venue, Catering & Rentals - Limo Rental in Limestone TX - (County).
NOTE: Sum of the Spending Distribution estimated total sales may be more than the item total sales because we use themiddle point of the spending ranges to estimate the sales. For total sales use the item total sales value.
Spending Range Percent of Weddings Number of Weddings Total Sales
<$250 33.5% 16 $ 1,968
$250 - $500 35.8% 17 $ 6,310
$501 - $750 14.8% 7 $ 4,348
$751 - $1000 9.1% 4 $ 3,742
$1,001 - $1,500 4.0% 2 $ 2,350
$1,500+ 2.8% 1 $ 2,961
Average Spending by Number of Guests RangeThis is the average spending by number of guests range for Limo Rental in Limestone TX - (County).
Range Average Spending
Less than 25 $284
25-50 $243
51-100 $316
101-150 $369
151-200 $418
201-300 $487
More than 300 $686
472017 Weddings
$4402017 Avg Spend
$ 3492016 Median Spend
Table
Table
© 2016 The Wedding Report Inc. - Page 186 of 196

Venue, Catering & Rentals - Other Transportation
© 2016 The Wedding Report Inc. - Page 187 of 196

Item SummaryThis is the number of estimated weddings, estimated average amount spent per wedding, and estimated total sales for:Venue, Catering & Rentals - Other Transportation in Limestone TX - (County). Includes shuttles, antique car, horse &carriage, etc.
NOTE: County numbers will not equal County Clerk numbers because couples can marry anywhere within the State.
NOTE: Estimated weddings equals the demand for this product or service only and may not equal total number of weddingsfor the entire market.
Year Number of Weddings (Demand) Average Spending per Wedding Total Sales
2008 17 $366 $6,120
2009 22 $354 $7,749
2010 48 $386 $18,343
2011 57 $433 $24,737
2012 59 $432 $25,307
2013 58 $454 $26,150
2014 60 $464 $27,766
2015 55 $470 $26,019
2016 55 $470 $25,789
2017 40 $472 $19,022
2018 41 $479 $19,802
2019 42 $490 $20,639
2020 43 $499 $21,407
2021 43 $509 $21,836
2022 42 $514 $21,783
Note About Average SpendingProducts; The average amount shown is based on spending of couples getting married, not prices. This includes purchasesof both new and pre-owned items.
Services; The average amount shown is based on spending of couples getting married, not vendor prices. This includespurchases of services from professionals, someone that simply provides the service, or a hired family member or friend.
402017 Weddings
$4722017 Avg Spend
$19,0222017 Total Sales
Table
© 2016 The Wedding Report Inc. - Page 188 of 196

Median Spending & Spending Range DetailsThis is the percent of weddings, number of weddings, and estimated total sales of weddings that spend within certain rangesfor Venue, Catering & Rentals - Other Transportation in Limestone TX - (County).
NOTE: Sum of the Spending Distribution estimated total sales may be more than the item total sales because we use themiddle point of the spending ranges to estimate the sales. For total sales use the item total sales value.
Spending Range Percent of Weddings Number of Weddings Total Sales
<$250 39.5% 16 $ 1,975
$250 - $500 30.5% 12 $ 4,575
$501 - $750 14.1% 6 $ 3,525
$751 - $1000 5.6% 2 $ 1,960
$1,001 - $1,500 4.5% 2 $ 2,250
$1,500+ 5.6% 2 $ 5,040
Average Spending by Number of Guests RangeThis is the average spending by number of guests range for Other Transportation in Limestone TX - (County).
Range Average Spending
Less than 25 $300
25-50 $257
51-100 $339
101-150 $440
151-200 $418
201-300 $457
More than 300 $914
402017 Weddings
$4722017 Avg Spend
$ 3352016 Median Spend
Table
Table
© 2016 The Wedding Report Inc. - Page 189 of 196

Venue, Catering & Rentals - Rehearsal Dinner
© 2016 The Wedding Report Inc. - Page 190 of 196

Item SummaryThis is the number of estimated weddings, estimated average amount spent per wedding, and estimated total sales for:Venue, Catering & Rentals - Rehearsal Dinner in Limestone TX - (County).
NOTE: County numbers will not equal County Clerk numbers because couples can marry anywhere within the State.
NOTE: Estimated weddings equals the demand for this product or service only and may not equal total number of weddingsfor the entire market.
Year Number of Weddings (Demand) Average Spending per Wedding Total Sales
2008 121 $759 $92,006
2009 133 $667 $88,931
2010 137 $796 $108,750
2011 130 $506 $65,790
2012 133 $506 $67,460
2013 127 $513 $65,007
2014 123 $527 $65,042
2015 116 $527 $61,085
2016 117 $519 $60,630
2017 95 $521 $49,261
2018 97 $517 $50,144
2019 100 $515 $51,727
2020 102 $511 $52,275
2021 104 $509 $52,911
2022 103 $505 $51,858
Note About Average SpendingProducts; The average amount shown is based on spending of couples getting married, not prices. This includes purchasesof both new and pre-owned items.
Services; The average amount shown is based on spending of couples getting married, not vendor prices. This includespurchases of services from professionals, someone that simply provides the service, or a hired family member or friend.
952017 Weddings
$5212017 Avg Spend
$49,2612017 Total Sales
Table
© 2016 The Wedding Report Inc. - Page 191 of 196

Median Spending & Spending Range DetailsThis is the percent of weddings, number of weddings, and estimated total sales of weddings that spend within certain rangesfor Venue, Catering & Rentals - Rehearsal Dinner in Limestone TX - (County).
NOTE: Sum of the Spending Distribution estimated total sales may be more than the item total sales because we use themiddle point of the spending ranges to estimate the sales. For total sales use the item total sales value.
Spending Range Percent of Weddings Number of Weddings Total Sales
<$100 14.0% 13 $ 665
$101 - 250 23.6% 22 $ 3,923
$251 - 500 25.3% 24 $ 9,013
$501 - 750 17.4% 17 $ 11,158
$751 - 1000 7.3% 7 $ 6,068
$1000+ 12.4% 12 $ 17,670
Average Spending by Number of Guests RangeThis is the average spending by number of guests range for Rehearsal Dinner in Limestone TX - (County).
Range Average Spending
Less than 25 $250
25-50 $221
51-100 $351
101-150 $476
151-200 $572
201-300 $620
More than 300 $764
952017 Weddings
$5212017 Avg Spend
$ 3142016 Median Spend
Table
Table
© 2016 The Wedding Report Inc. - Page 192 of 196

Venue, Catering & Rentals - WeddingCake/dessert
© 2016 The Wedding Report Inc. - Page 193 of 196

Item SummaryThis is the number of estimated weddings, estimated average amount spent per wedding, and estimated total sales for:Venue, Catering & Rentals - Wedding Cake/dessert in Limestone TX - (County).
NOTE: County numbers will not equal County Clerk numbers because couples can marry anywhere within the State.
NOTE: Estimated weddings equals the demand for this product or service only and may not equal total number of weddingsfor the entire market.
Year Number of Weddings (Demand) Average Spending per Wedding Total Sales
2008 150 $329 $49,508
2009 147 $323 $47,565
2010 145 $355 $51,312
2011 146 $390 $56,854
2012 152 $388 $58,782
2013 144 $387 $55,728
2014 142 $391 $55,569
2015 133 $385 $51,286
2016 136 $380 $51,790
2017 121 $381 $46,063
2018 124 $389 $48,244
2019 128 $396 $50,680
2020 130 $403 $52,531
2021 132 $411 $54,252
2022 130 $417 $54,377
Note About Average SpendingProducts; The average amount shown is based on spending of couples getting married, not prices. This includes purchasesof both new and pre-owned items.
Services; The average amount shown is based on spending of couples getting married, not vendor prices. This includespurchases of services from professionals, someone that simply provides the service, or a hired family member or friend.
1212017 Weddings
$3812017 Avg Spend
$46,0632017 Total Sales
Table
© 2016 The Wedding Report Inc. - Page 194 of 196

Median Spending & Spending Range DetailsThis is the percent of weddings, number of weddings, and estimated total sales of weddings that spend within certain rangesfor Venue, Catering & Rentals - Wedding Cake/dessert in Limestone TX - (County).
NOTE: Sum of the Spending Distribution estimated total sales may be more than the item total sales because we use themiddle point of the spending ranges to estimate the sales. For total sales use the item total sales value.
Spending Range Percent of Weddings Number of Weddings Total Sales
<$100 21.6% 26 $ 1,307
$101 - 250 27.3% 33 $ 5,781
$251 - 500 31.8% 38 $ 14,429
$501 - 750 11.4% 14 $ 9,311
$751 - 1000 5.1% 6 $ 5,400
$1000+ 2.8% 3 $ 5,082
Average Spending by Number of Guests RangeThis is the average spending by number of guests range for Wedding Cake/dessert in Limestone TX - (County).
Range Average Spending
Less than 25 $200
25-50 $239
51-100 $285
101-150 $348
151-200 $400
201-300 $450
More than 300 $608
1212017 Weddings
$3812017 Avg Spend
$ 2542016 Median Spend
Table
Table
© 2016 The Wedding Report Inc. - Page 195 of 196

Methodology & Use of DataMethodology details are located at: http://www.theweddingreport.com/index.cfm/action/home/view/methodology/
Use of Data details are located at: http://www.theweddingreport.com/index.cfm/action/home/view/terms_of_service/