Embed Size (px)
Citation preview
URP 4273: Survey of Planning Information Systems, UF - College of Design, Construction and Planning - URP Department
GEOREFERENCING, PROJECTIONS
Part I
PRESENTING DATA
Part II
Week 7
URP 4273: Survey of Planning Information Systems, UF - College of Design, Construction and Planning - URP Department
topics of the week
Georeferencing
Coordinate systems
Map Projections
ArcMap and Projections
URP 4273: Survey of Planning Information Systems, UF - College of Design, Construction and Planning - URP Department
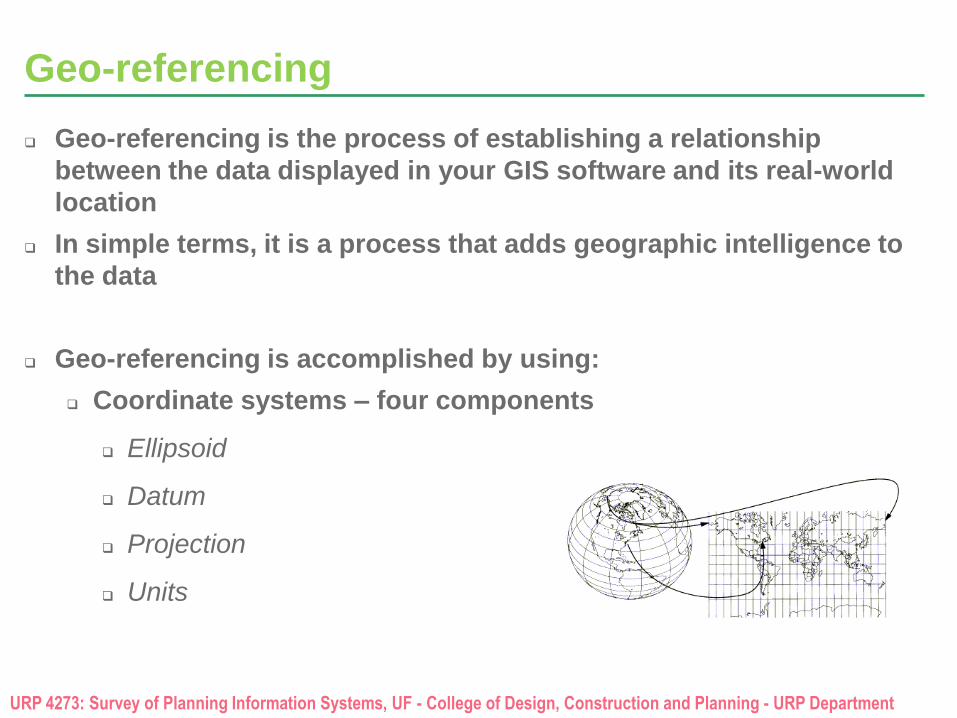
Geo-referencing
Geo-referencing is the process of establishing a relationship
between the data displayed in your GIS software and its real-world
location
In simple terms, it is a process that adds geographic intelligence to
the data
Geo-referencing is accomplished by using:
Coordinate systems – four components
Ellipsoid
Datum
Projection
Units
URP 4273: Survey of Planning Information Systems, UF - College of Design, Construction and Planning - URP Department
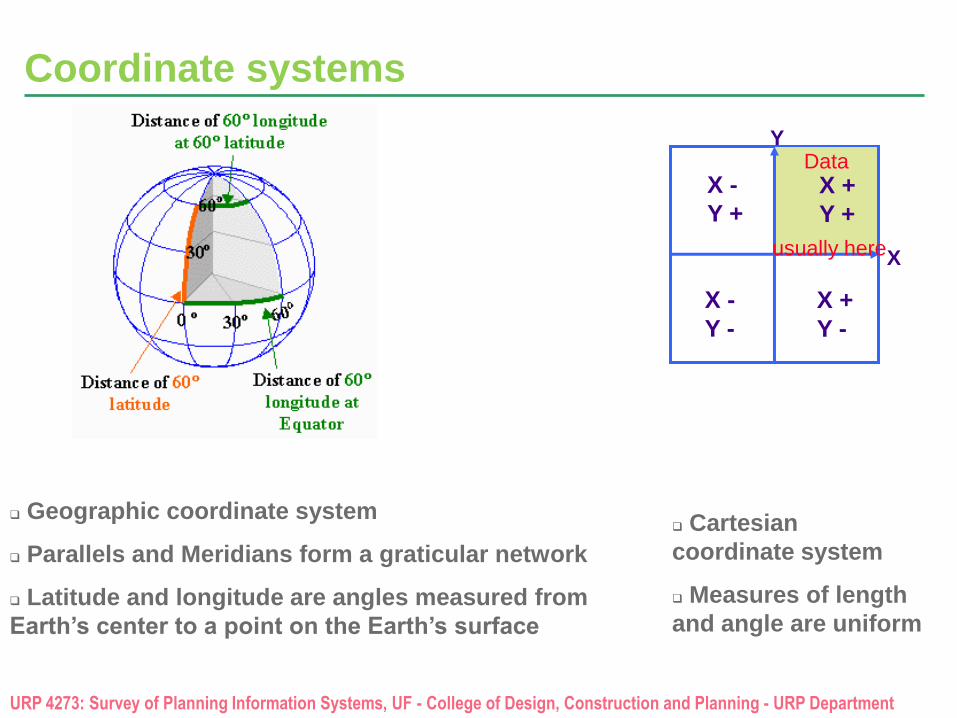
Coordinate systems
Geographic coordinate system
Parallels and Meridians form a graticular network
Latitude and longitude are angles measured from
Earth’s center to a point on the Earth’s surface
Cartesian
coordinate system
Measures of length
and angle are uniform
X -
Y +
X +
Y +
X -
Y -
X +
Y -
X
Y Data
usually here
URP 4273: Survey of Planning Information Systems, UF - College of Design, Construction and Planning - URP Department
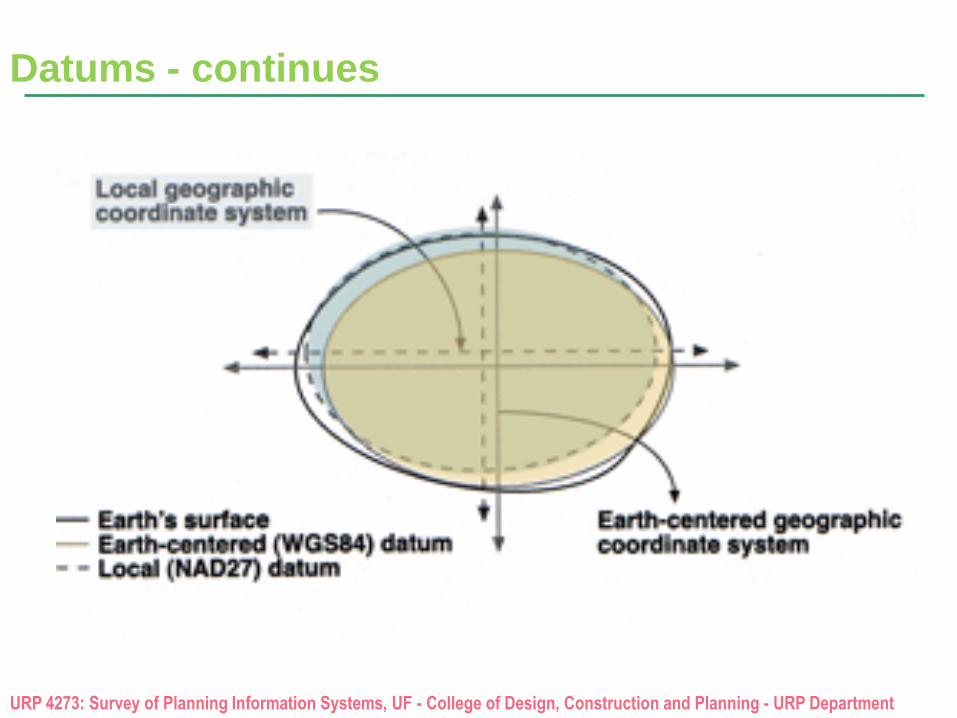
Datums
A datum is a mathematical representation of the shape of
the Earth’s surface.
A datum is defined by a spheroid, which approximates the
shape of the Earth and the spheroid’s position relative to the
center of the Earth.
There are many spheroids that represent the shape of the
Earth and many more datums based on them.
A horizontal datum provides a frame of reference for measuring
locations on the surface of the Earth.
A local datum aligns its spheroid to closely fit the Earth’s surface in a
particular area, its origin point is located on the surface of the Earth.
URP 4273: Survey of Planning Information Systems, UF - College of Design, Construction and Planning - URP Department
Datums - continues
URP 4273: Survey of Planning Information Systems, UF - College of Design, Construction and Planning - URP Department
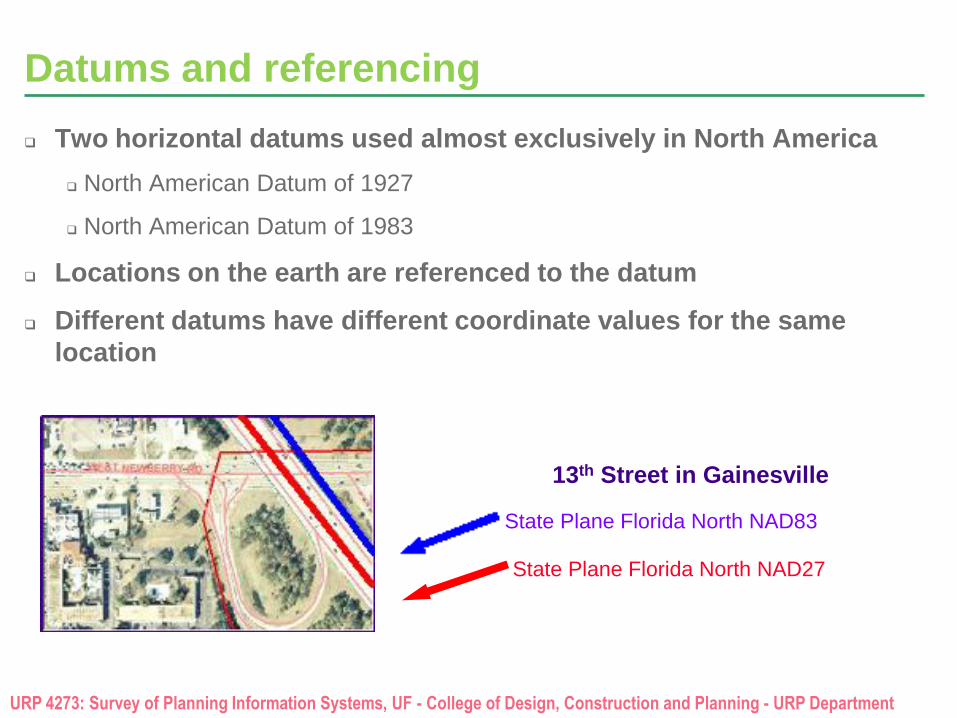
Datums and referencing
Two horizontal datums used almost exclusively in North America
North American Datum of 1927
North American Datum of 1983
Locations on the earth are referenced to the datum
Different datums have different coordinate values for the same
location
13th Street in Gainesville
State Plane Florida North NAD27
State Plane Florida North NAD83
URP 4273: Survey of Planning Information Systems, UF - College of Design, Construction and Planning - URP Department
Projections
Projection is the process that transforms three-dimensional space onto a two-dimensional map.
Projection formulas are mathematical expressions which convert data from a geographical location on a sphere to a representative location on a flat surface.
This process distorts at least one of these properties making geographers [sadd]:
Shape [S]
Area [A]
Distance [D]
Direction [D]
URP 4273: Survey of Planning Information Systems, UF - College of Design, Construction and Planning - URP Department
Types of projections
Classified by the spatial attribute they preserve best
Conformal maintains shape
Example: Lambert Conformal Conic
Equal-area maintains area
Example: Albers Equal Area Conic
Equidistant maintains distance
Example: Equidistant Conic
Direction or Azimuthal maintains some directions
Example: Lambert Equal Area Azimuthal
URP 4273: Survey of Planning Information Systems, UF - College of Design, Construction and Planning - URP Department
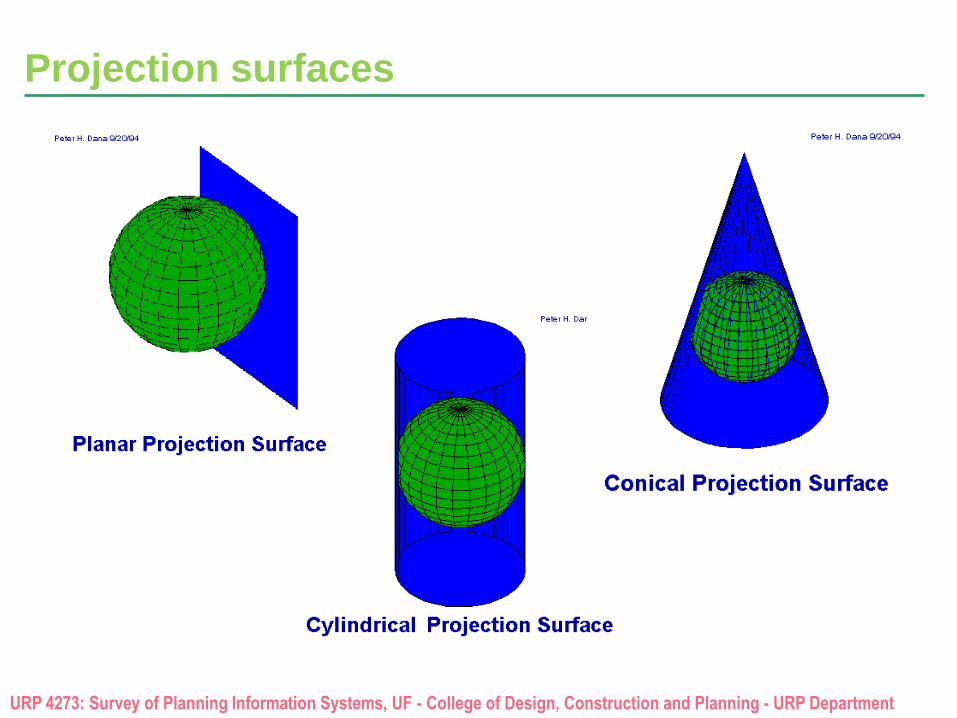
Projection surfaces
URP 4273: Survey of Planning Information Systems, UF - College of Design, Construction and Planning - URP Department
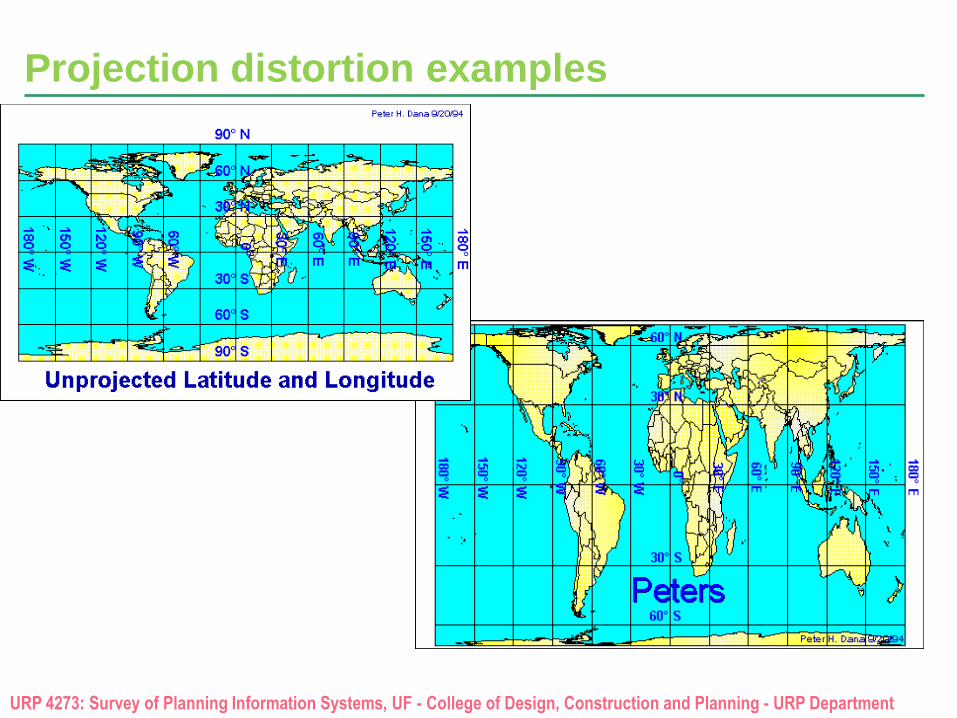
Projection distortion examples
URP 4273: Survey of Planning Information Systems, UF - College of Design, Construction and Planning - URP Department
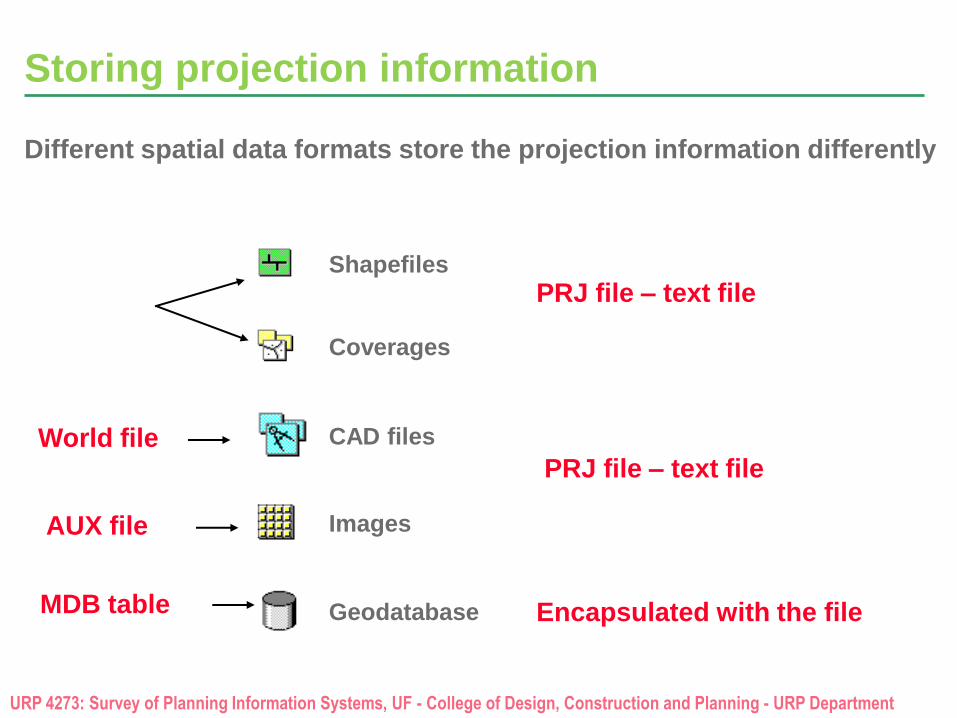
PRJ file – text file Shapefiles
Coverages
World file CAD files
Images
MDB table Geodatabase
Storing projection information
Different spatial data formats store the projection information differently
AUX file
Encapsulated with the file
PRJ file – text file
URP 4273: Survey of Planning Information Systems, UF - College of Design, Construction and Planning - URP Department
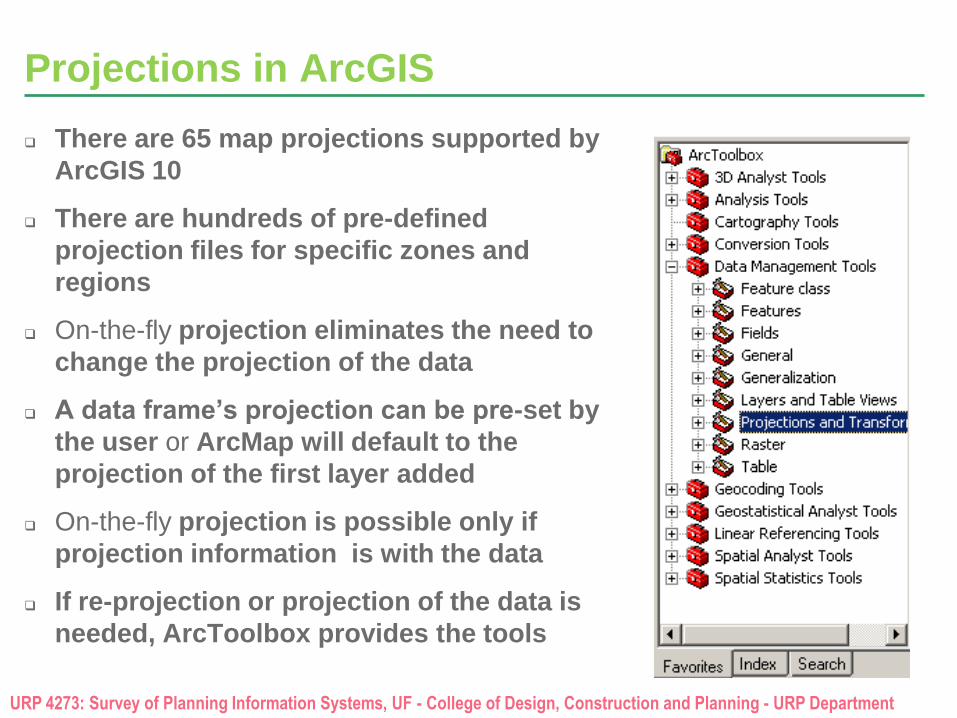
Projections in ArcGIS
There are 65 map projections supported by
ArcGIS 10
There are hundreds of pre-defined
projection files for specific zones and
regions
On-the-fly projection eliminates the need to
change the projection of the data
A data frame’s projection can be pre-set by
the user or ArcMap will default to the
projection of the first layer added
On-the-fly projection is possible only if
projection information is with the data
If re-projection or projection of the data is
needed, ArcToolbox provides the tools
URP 4273: Survey of Planning Information Systems, UF - College of Design, Construction and Planning - URP Department
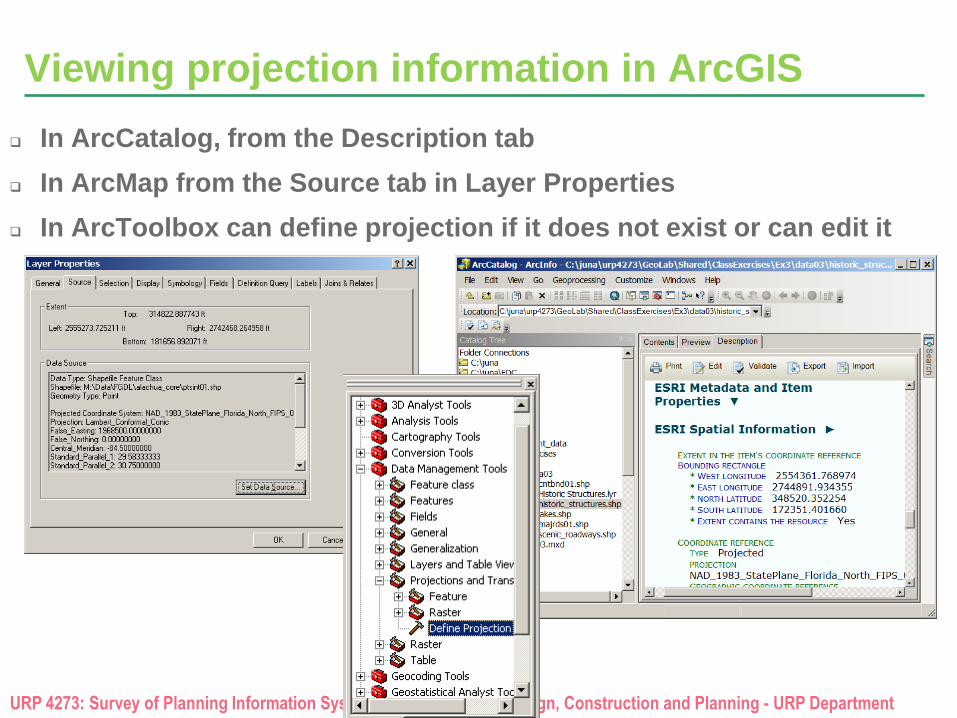
Viewing projection information in ArcGIS
In ArcCatalog, from the Description tab
In ArcMap from the Source tab in Layer Properties
In ArcToolbox can define projection if it does not exist or can edit it
URP 4273: Survey of Planning Information Systems, UF - College of Design, Construction and Planning - URP Department
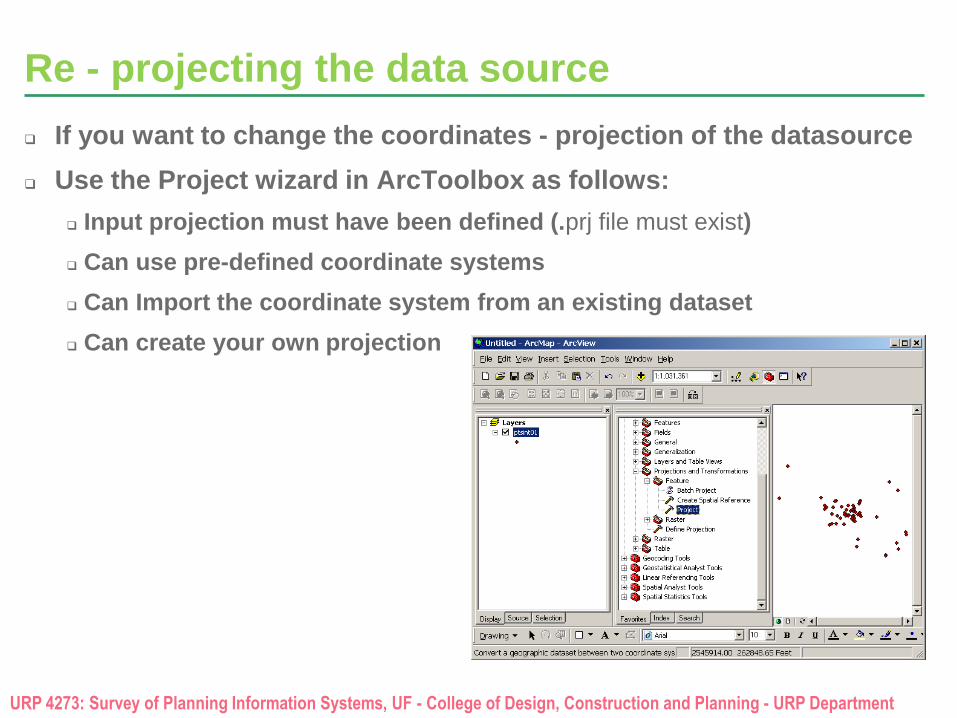
Re - projecting the data source
If you want to change the coordinates - projection of the datasource
Use the Project wizard in ArcToolbox as follows:
Input projection must have been defined (.prj file must exist)
Can use pre-defined coordinate systems
Can Import the coordinate system from an existing dataset
Can create your own projection
URP 4273: Survey of Planning Information Systems, UF - College of Design, Construction and Planning - URP Department
PRESENTING DATA
Part II
Week 7
URP 4273: Survey of Planning Information Systems, UF - College of Design, Construction and Planning - URP Department
topics of the week – presenting data
Cartographic principles
Cartographic design
Maps in ArcMap
Map elements
URP 4273: Survey of Planning Information Systems, UF - College of Design, Construction and Planning - URP Department
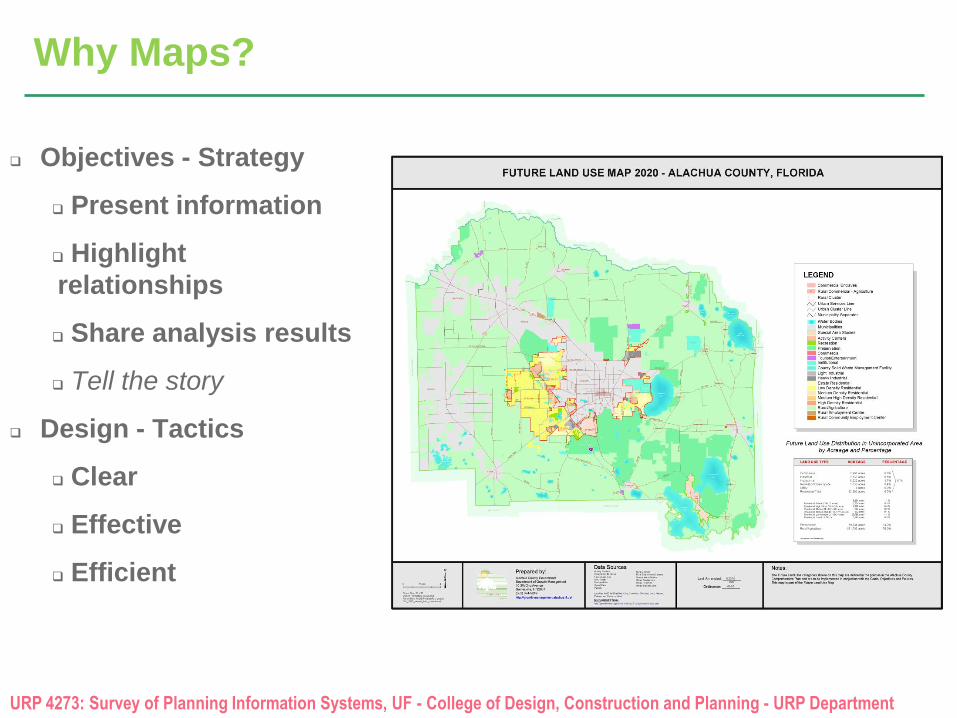
Why Maps?
Objectives - Strategy
Present information
Highlight
relationships
Share analysis results
Tell the story
Design - Tactics
Clear
Effective
Efficient
URP 4273: Survey of Planning Information Systems, UF - College of Design, Construction and Planning - URP Department
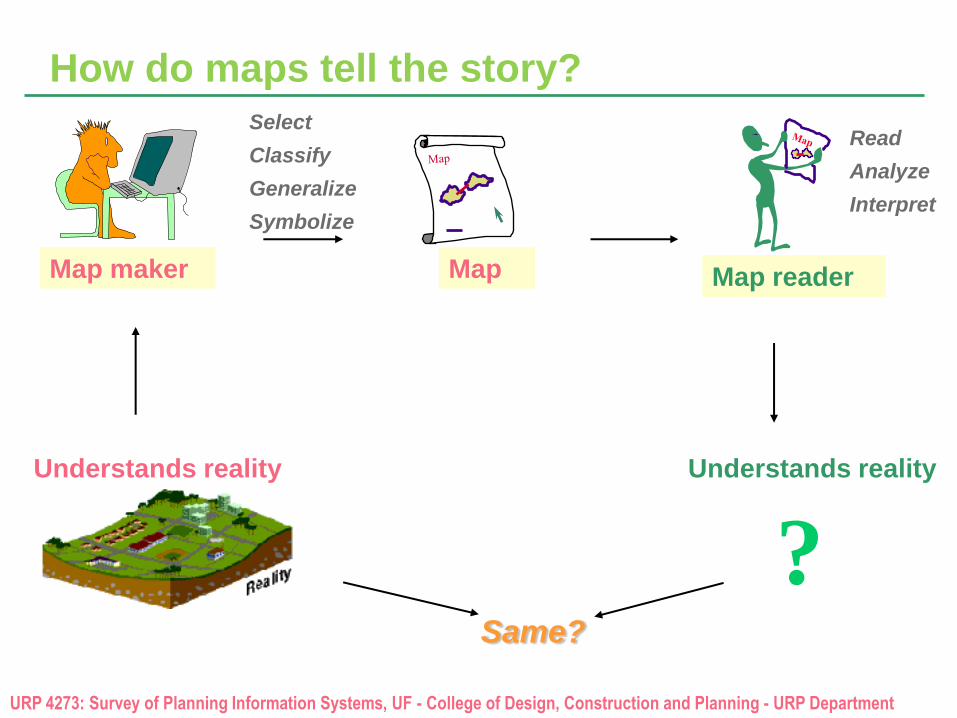
How do maps tell the story?
Map
Understands reality
Map reader Map maker
? Understands reality
Same?
Read
Analyze
Interpret
Select
Classify
Generalize
Symbolize
URP 4273: Survey of Planning Information Systems, UF - College of Design, Construction and Planning - URP Department
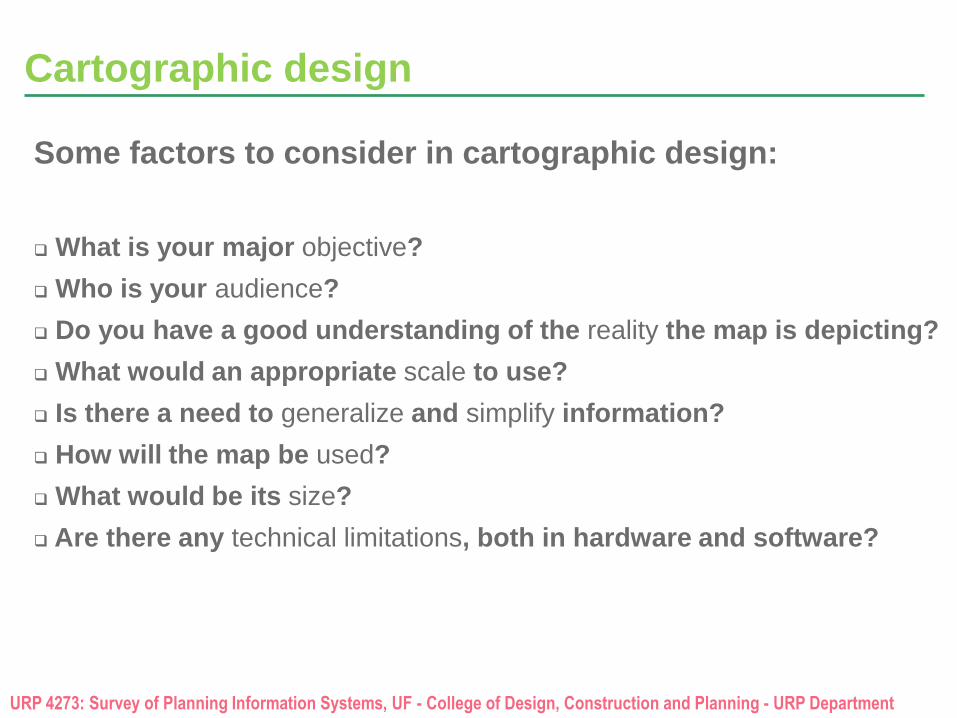
Cartographic design
Some factors to consider in cartographic design:
What is your major objective?
Who is your audience?
Do you have a good understanding of the reality the map is depicting?
What would an appropriate scale to use?
Is there a need to generalize and simplify information?
How will the map be used?
What would be its size?
Are there any technical limitations, both in hardware and software?
URP 4273: Survey of Planning Information Systems, UF - College of Design, Construction and Planning - URP Department
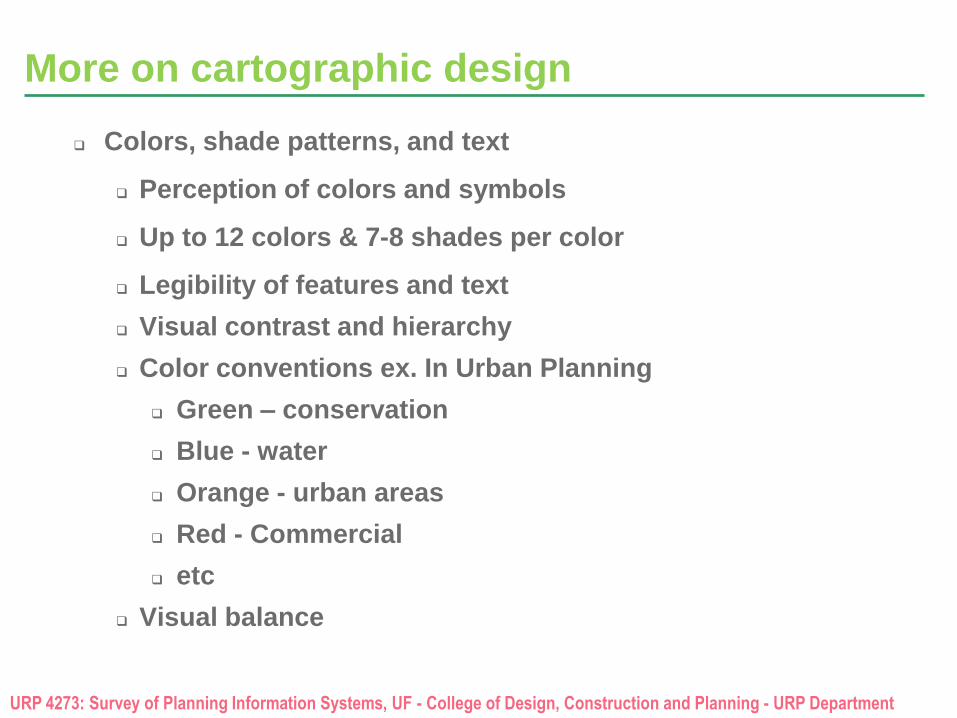
More on cartographic design
Colors, shade patterns, and text
Perception of colors and symbols
Up to 12 colors & 7-8 shades per color
Legibility of features and text
Visual contrast and hierarchy
Color conventions ex. In Urban Planning
Green – conservation
Blue - water
Orange - urban areas
Red - Commercial
etc
Visual balance
URP 4273: Survey of Planning Information Systems, UF - College of Design, Construction and Planning - URP Department
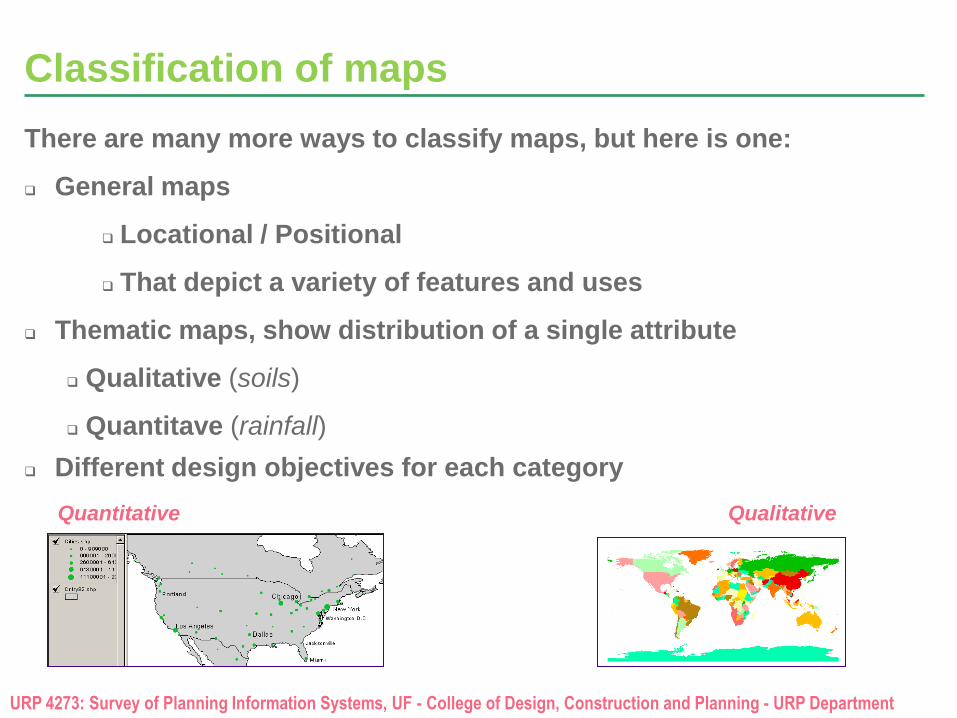
Classification of maps
There are many more ways to classify maps, but here is one:
General maps
Locational / Positional
That depict a variety of features and uses
Thematic maps, show distribution of a single attribute
Qualitative (soils)
Quantitave (rainfall)
Different design objectives for each category
Qualitative Quantitative
URP 4273: Survey of Planning Information Systems, UF - College of Design, Construction and Planning - URP Department
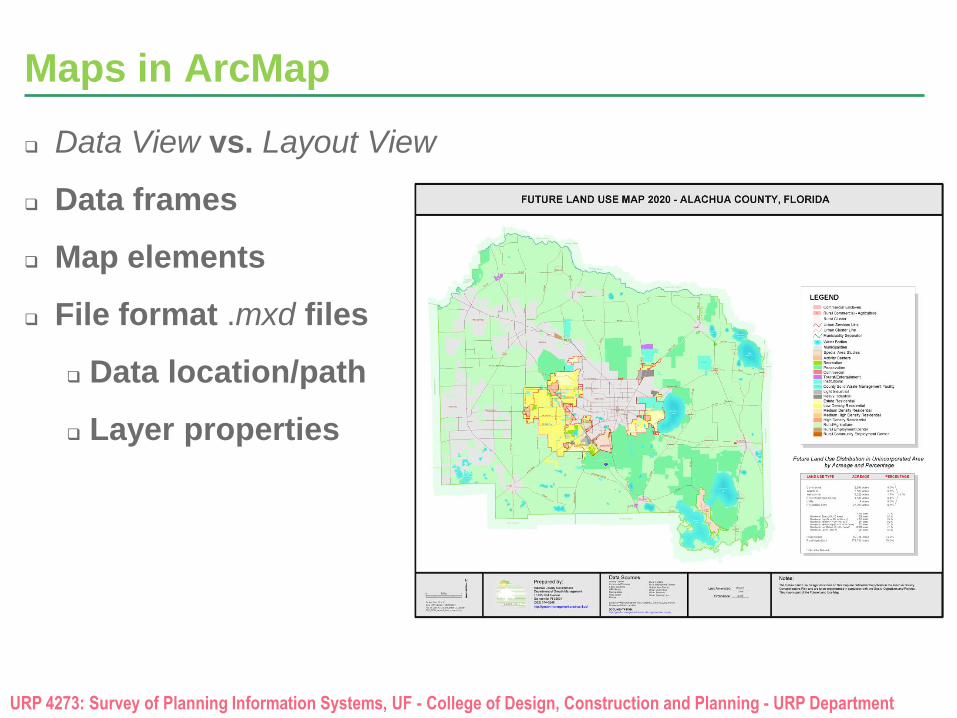
Maps in ArcMap
Data View vs. Layout View
Data frames
Map elements
File format .mxd files
Data location/path
Layer properties
URP 4273: Survey of Planning Information Systems, UF - College of Design, Construction and Planning - URP Department
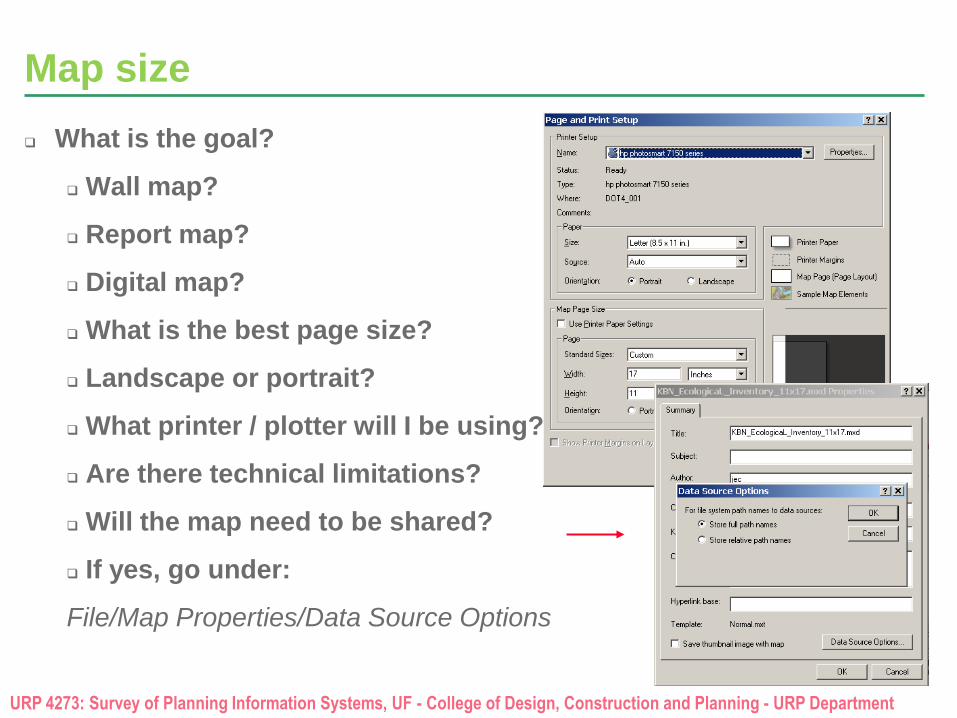
Map size
What is the goal?
Wall map?
Report map?
Digital map?
What is the best page size?
Landscape or portrait?
What printer / plotter will I be using?
Are there technical limitations?
Will the map need to be shared?
If yes, go under:
File/Map Properties/Data Source Options
URP 4273: Survey of Planning Information Systems, UF - College of Design, Construction and Planning - URP Department
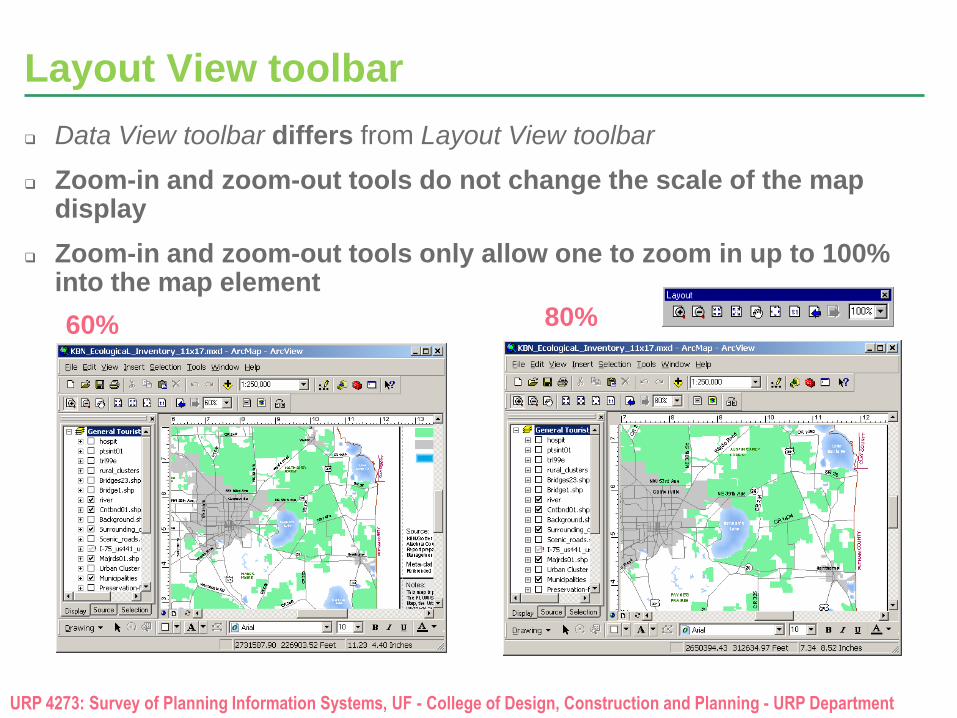
Layout View toolbar
Data View toolbar differs from Layout View toolbar
Zoom-in and zoom-out tools do not change the scale of the map display
Zoom-in and zoom-out tools only allow one to zoom in up to 100% into the map element
60% 80%
URP 4273: Survey of Planning Information Systems, UF - College of Design, Construction and Planning - URP Department
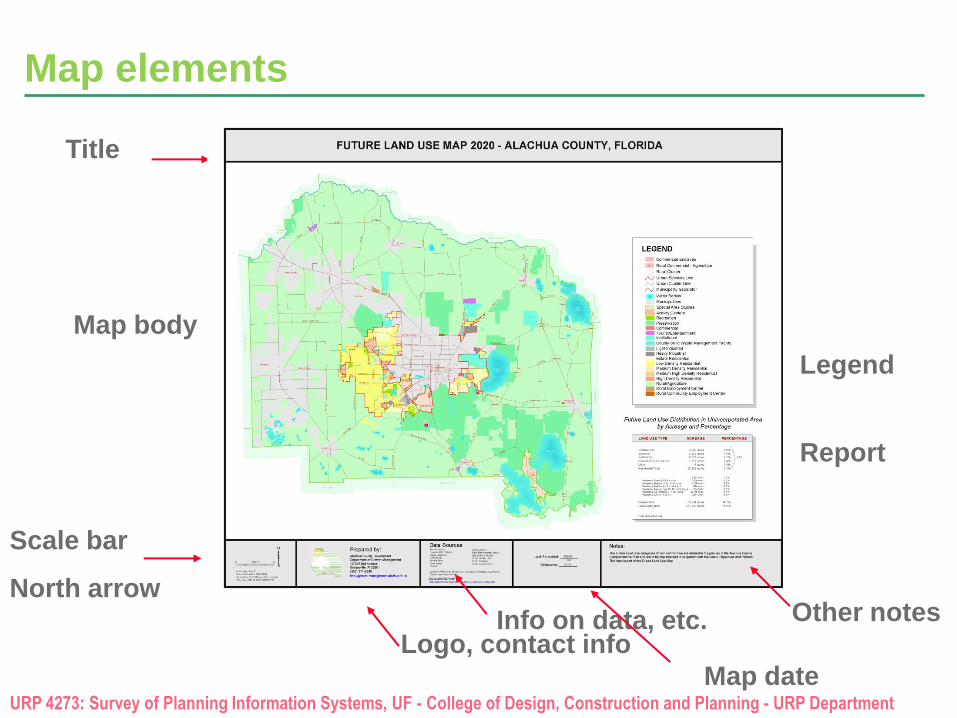
Map elements
Title
Map body
North arrow
Legend
Scale bar
Report
Logo, contact info Info on data, etc.
Map date
Other notes
URP 4273: Survey of Planning Information Systems, UF - College of Design, Construction and Planning - URP Department
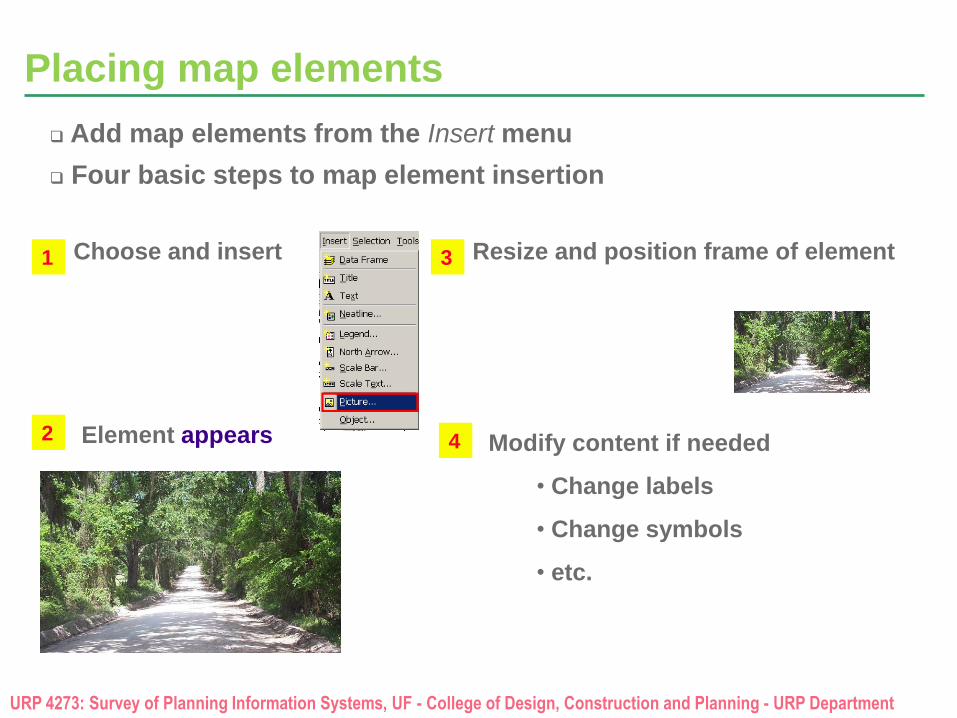
Placing map elements
Modify content if needed
• Change labels
• Change symbols
• etc.
2
Resize and position frame of element 3
4
1
Element appears
Add map elements from the Insert menu
Four basic steps to map element insertion
Choose and insert
URP 4273: Survey of Planning Information Systems, UF - College of Design, Construction and Planning - URP Department
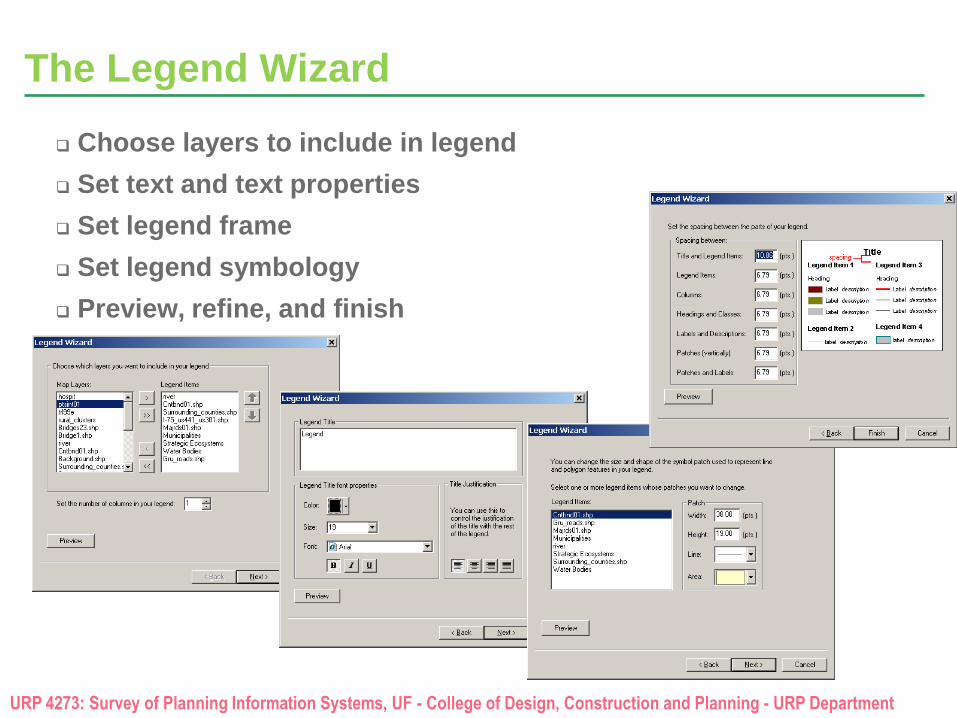
The Legend Wizard
Choose layers to include in legend
Set text and text properties
Set legend frame
Set legend symbology
Preview, refine, and finish
URP 4273: Survey of Planning Information Systems, UF - College of Design, Construction and Planning - URP Department
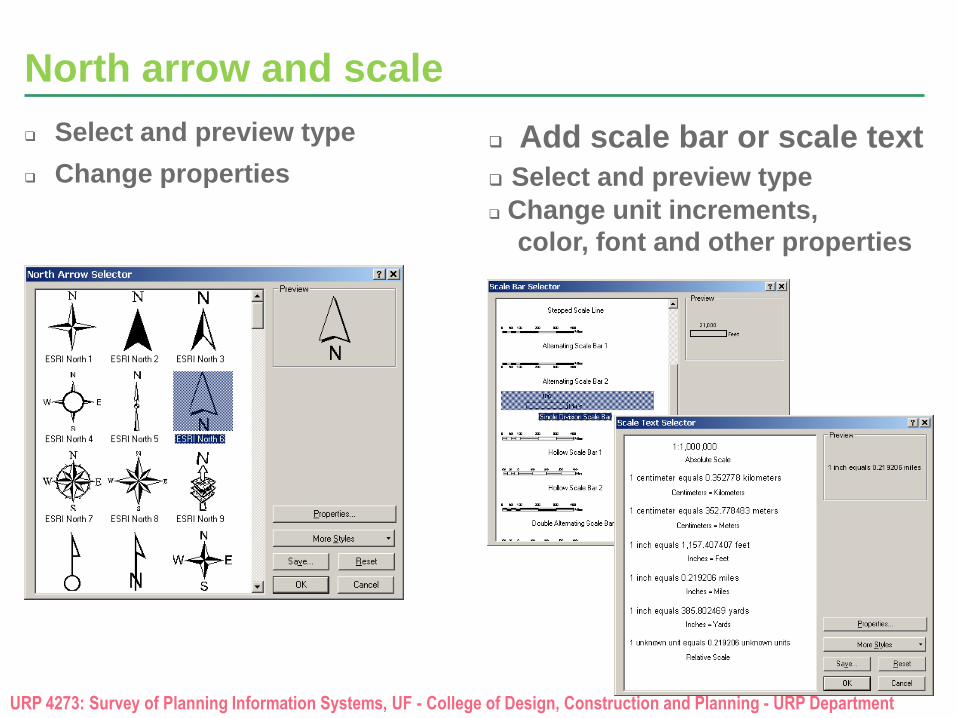
North arrow and scale
Select and preview type
Change properties
Add scale bar or scale text
Select and preview type
Change unit increments,
color, font and other properties
URP 4273: Survey of Planning Information Systems, UF - College of Design, Construction and Planning - URP Department
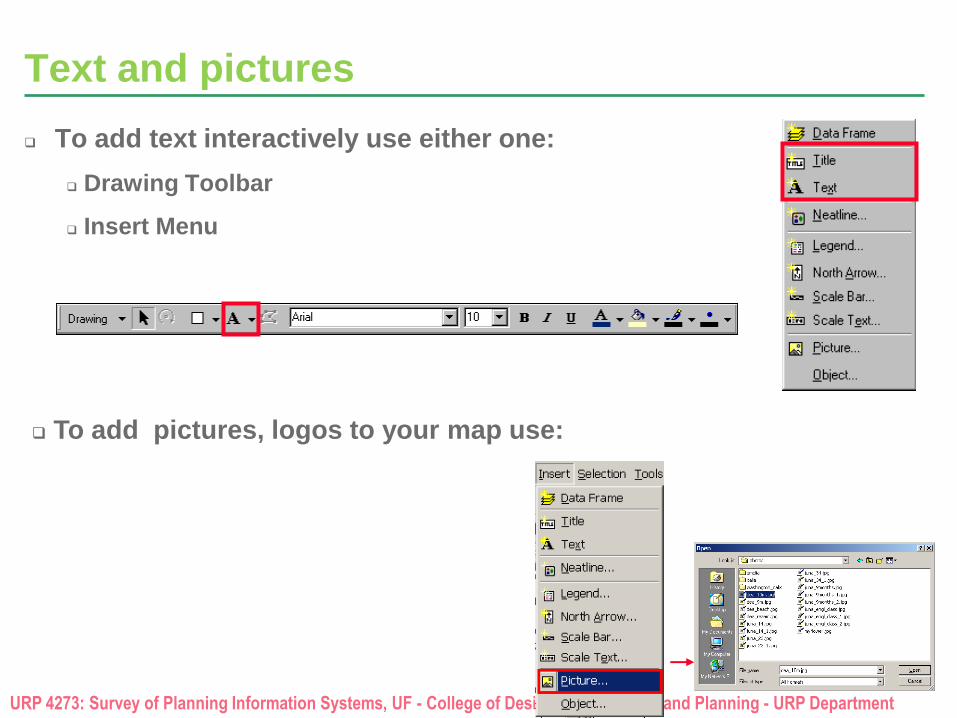
Text and pictures
To add text interactively use either one:
Drawing Toolbar
Insert Menu
To add pictures, logos to your map use:
URP 4273: Survey of Planning Information Systems, UF - College of Design, Construction and Planning - URP Department
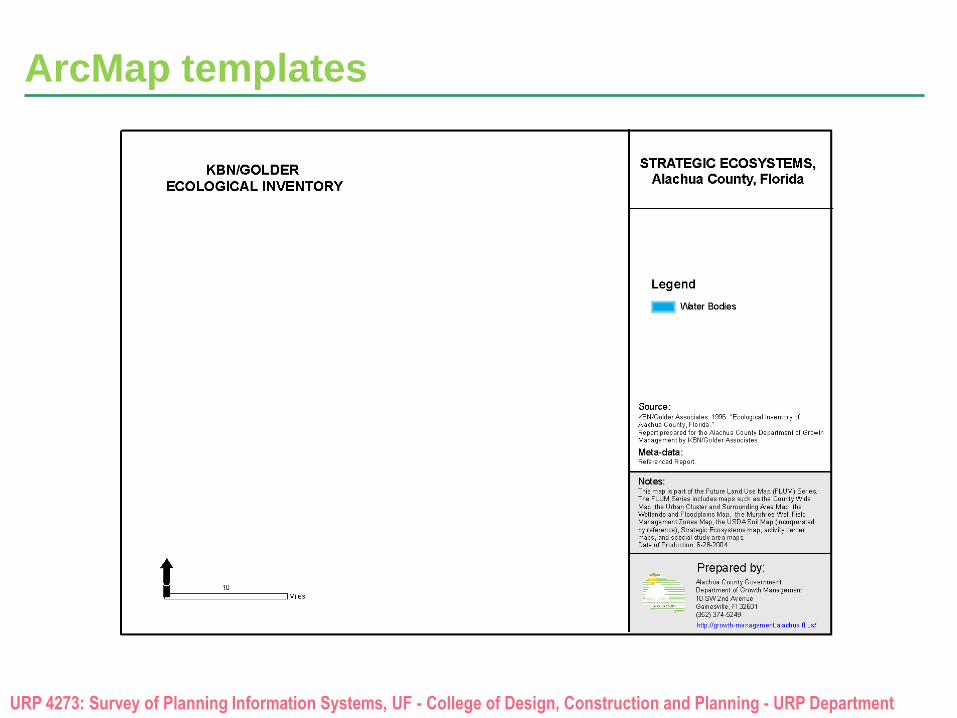
ArcMap templates
URP 4273: Survey of Planning Information Systems, UF - College of Design, Construction and Planning - URP Department
Templates are useful for the following reasons:
Secure consistency to maps in a series or in an organization
Increase efficiency of work
ArcGIS comes with a set of templates
You can always create your own
Can save templates anywhere or in the ArcMap Templates folder:
(\Program Files\ArcGIS\Desktop10.0\MapTemplates)
Templates can store path to the data or just map elements and
graphics
ArcMap templates
URP 4273: Survey of Planning Information Systems, UF - College of Design, Construction and Planning - URP Department
The reference system
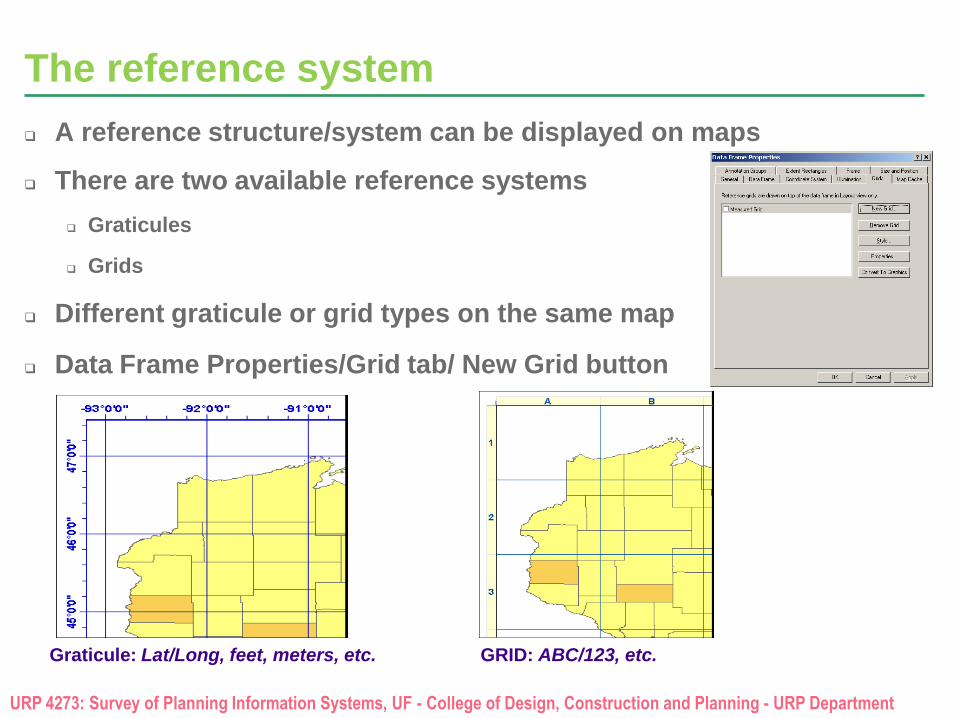
A reference structure/system can be displayed on maps
There are two available reference systems
Graticules
Grids
Different graticule or grid types on the same map
Data Frame Properties/Grid tab/ New Grid button
Graticule: Lat/Long, feet, meters, etc. GRID: ABC/123, etc.
URP 4273: Survey of Planning Information Systems, UF - College of Design, Construction and Planning - URP Department
Rulers and Grids
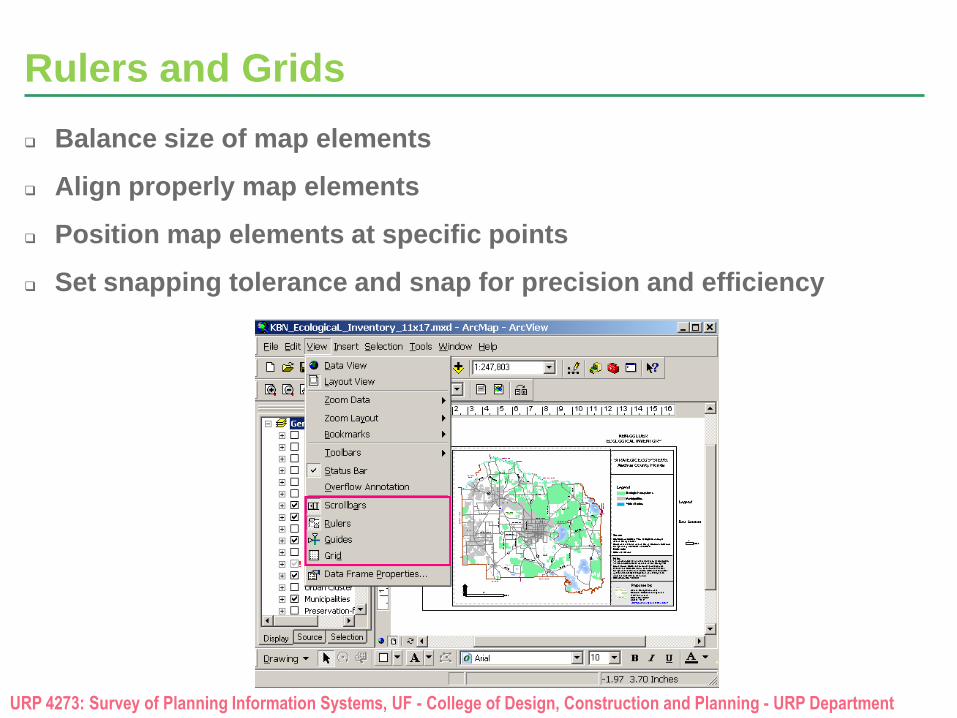
Balance size of map elements
Align properly map elements
Position map elements at specific points
Set snapping tolerance and snap for precision and efficiency
URP 4273: Survey of Planning Information Systems, UF - College of Design, Construction and Planning - URP Department
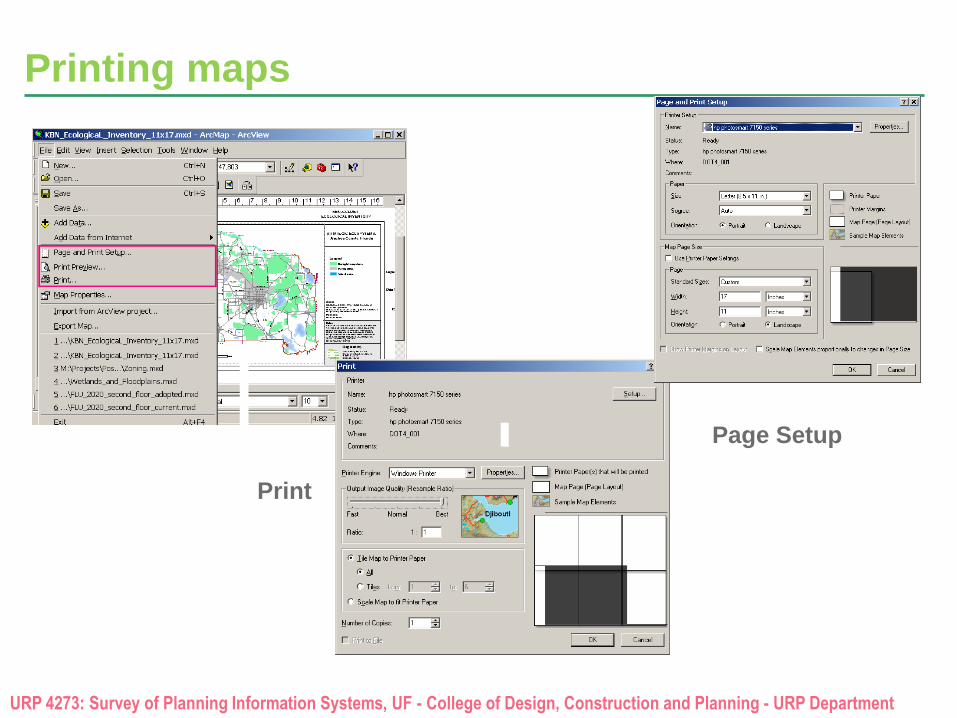
Printing maps
Page Setup