Embed Size (px)
Citation preview

8/14/2019 Weekly Economic Commentary 11/112013
http://slidepdf.com/reader/full/weekly-economic-commentary-11112013 1/5
Member FINRA/SIPC
Page 1 of 5
LPL F INANCIAL RESEARCH
Weekly Economic CommentaryNovember 11, 2013
John Canally, CFA
Economist
LPL Financial
Labor Market: On the Mend,but Not “Back to Normal”
HighlightsThe labor market has improved over the past
three-and-a-half years, but it has not returned
to “normal,” where normal is defined as
mid-to-late 2007, just prior to the onset of the
2007 – 09 Great Recession.
The BLS’s October 2013 Employment
Situation report has done little to convince
some members of the public, market
participants, and policymakers that the labor
market is improving.
As the healing process continues, markets
will continue to monitor the daily, weekly,
and monthly flow of data on the labor market.However, your “employment situation” will
remain the best gauge of the health of the
labor market as 2013 draws to a close.
The October 2013 Employment Situation report — delayed one week due
to the 16-day federal government shutdown — was released on Friday,
November 8, 2013. The monthly Employment Situation report is two
reports in one. The establishment survey produces the nonfarm payroll
job count, while the household survey generates the unemployment
rate data. Of the two surveys, our view — shared by the consensus ofeconomists — had been that the household survey was more likely to see
major distortions than the establishment survey as a result of the federal
government shutdown. In general, that view turned out to be correct, as
the establishment survey was relatively free of any anomalies, while the
household survey contained several elements that were clearly impacted by
the shutdown. Still, the report likely did little to convince some members of
the public, market participants, pundits, politicians, or policymakers that the
labor market was improving.
Establishment Survey: Minimal Impact From Shutdown
The October 2013 Employment Situation report showed that the economy
created 204,000 net new jobs in October — well above the 120,000
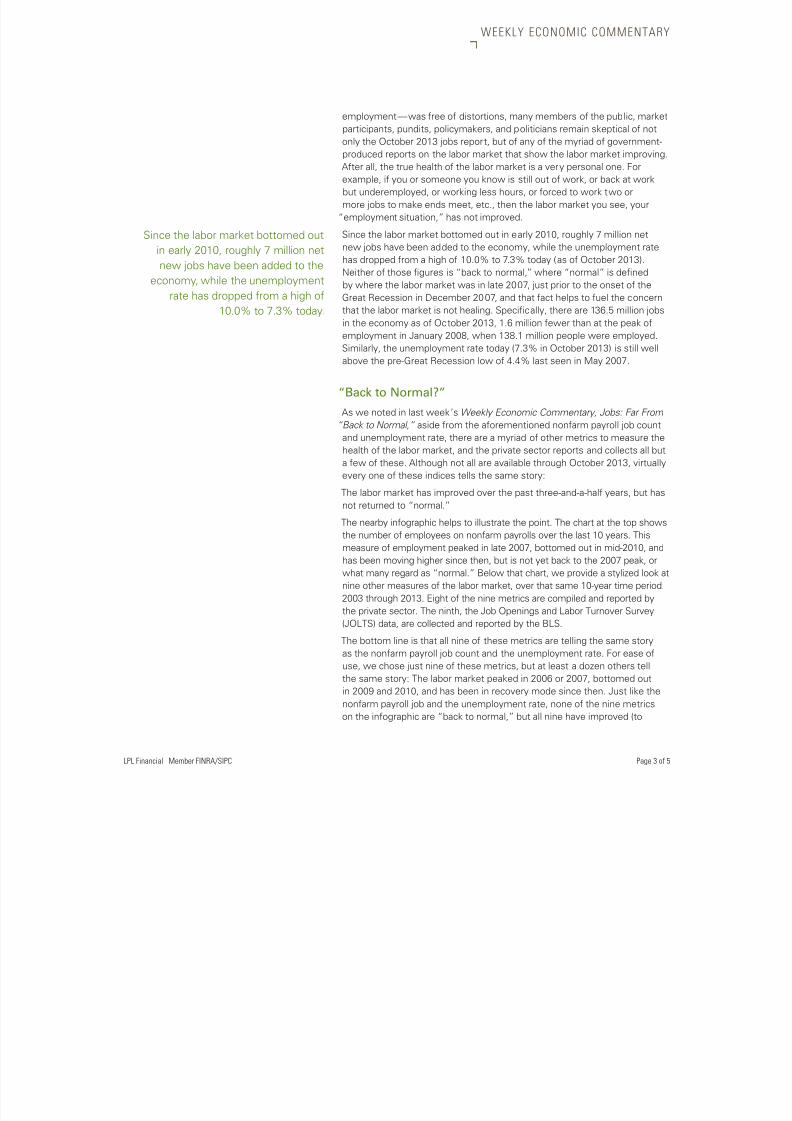
expected by most economists — and that the unemployment rate rose just
0.1% to 7.3%, in line with market expectations. The consensus economist
forecast was influenced by concern over the impact from the 16-day
government shutdown, and that federal government workers furloughed
due to the government shutdown would be counted as unemployed, even
though their unemployment was temporary and they were going to be paid
for their time away from work.
In discussing the October 2013 Employment Situation report in the press
release accompanying the data, the Bureau of Labor Statistics (BLS) — the
federal government agency that produces the report — noted that “there
were no discernible impacts of the partial federal government shutdown onthe estimates of employment, hours, and earnings from the establishment
survey.” This suggests that if there were any indirect impact on hiring in the
private sector due to the uncertainty created by the shutdown, it was more
than offset by a relatively robust hiring environment elsewhere. Indeed,
not only did the nonfarm job count exceed expectations in October, the
readings in August and September were revised higher by a total of 60,000.
As we and most market participants expected, furloughed federal workers
were counted as employed in October 2013. On balance, financial markets
Please see our Weekly Economic
Commentary from November 4, 2013
for further reading about the monthly
Employment Situation report.
8/14/2019 Weekly Economic Commentary 11/112013
http://slidepdf.com/reader/full/weekly-economic-commentary-11112013 2/5
LPL Financial Member FINRA/SIPC Page 2 of 5
WEEKLY ECONOMIC COMMENTARY
viewed the report as good news for the economy, as equity prices rose and
prices on Treasury notes and bonds fell — pushing the yield on the 10-year
Treasury to the highest level (2.75%) in three weeks.
Household Survey: Unemployment Rate Higher, but DataImpacted by the Shutdown
On the household survey side, the BLS noted several times in the
press release accompanying the October 2013 data that the rise in theunemployment rate from 7.2% to 7.3%, the 720,000 drop in the labor force,
and the 735,000 drop in the household survey’s measure of employment
were due to the treatment of the furloughed federal workers who were
classified as “unemployed on temporary layoff.” As a result, markets largely
ignored the household side of the survey in October and focused on the
relatively robust establishment survey instead.
Another concern we had about the October 2013 Employment Situation
report was the quality of the data and the timing of the collection process
itself. The BLS addressed this concern, noting in its report that “the
response rate for the household survey was within its normal range, and
the response rate for the establishment survey was above average.” This
suggests that the data collection process and revisions to the October 2013data in the coming months should largely adhere to their historical patterns.
We will continue to closely monitor this report in the coming months as we
gauge the pace of economic growth, the health of the labor market, and the
Federal Reserve’s (Fed) likely response.
Your “Employment Situation:” A Personal Matter
Despite the assurances from the BLS that the October 2013 Employment
Situation report — and especially the surprising 204,000 gain in payroll
07 08 09 1003 04 05 06 11 12 13
10
9
8
7
6
5
4
Civilian Unemployment Rate: 16-Yr +, Seasonally Adjusted, %
Source: Bureau of Labor Statistics, Haver Analytics 11/11/13
Shaded area indicates recession.
1 The Federal Government Shutdown Helped to Push the Unemployment Rate Up by 0.1%
to 7.3% in October 2013
8/14/2019 Weekly Economic Commentary 11/112013
http://slidepdf.com/reader/full/weekly-economic-commentary-11112013 3/5
LPL Financial Member FINRA/SIPC Page 3 of 5
WEEKLY ECONOMIC COMMENTARY
employment — was free of distortions, many members of the public, market
participants, pundits, policymakers, and politicians remain skeptical of not
only the October 2013 jobs report, but of any of the myriad of government-
produced reports on the labor market that show the labor market improving.After all, the true health of the labor market is a very personal one. For
example, if you or someone you know is still out of work, or back at work
but underemployed, or working less hours, or forced to work two or
more jobs to make ends meet, etc., then the labor market you see, your
“employment situation,” has not improved.
Since the labor market bottomed out in early 2010, roughly 7 million net
new jobs have been added to the economy, while the unemployment rate
has dropped from a high of 10.0% to 7.3% today (as of October 2013).
Neither of those figures is “back to normal,” where “normal” is defined
by where the labor market was in late 2007, just prior to the onset of the
Great Recession in December 2007, and that fact helps to fuel the concern
that the labor market is not healing. Specifically, there are 136.5 million jobsin the economy as of October 2013, 1.6 million fewer than at the peak of
employment in January 2008, when 138.1 million people were employed.
Similarly, the unemployment rate today (7.3% in October 2013) is still well
above the pre-Great Recession low of 4.4% last seen in May 2007.
“Back to Normal?”
As we noted in last week’s Weekly Economic Commentary, Jobs: Far From
“Back to Normal,” aside from the aforementioned nonfarm payroll job count
and unemployment rate, there are a myriad of other metrics to measure the
health of the labor market, and the private sector reports and collects all but
a few of these. Although not all are available through October 2013, virtuallyevery one of these indices tells the same story:
The labor market has improved over the past three-and-a-half years, but has
not returned to “normal.”
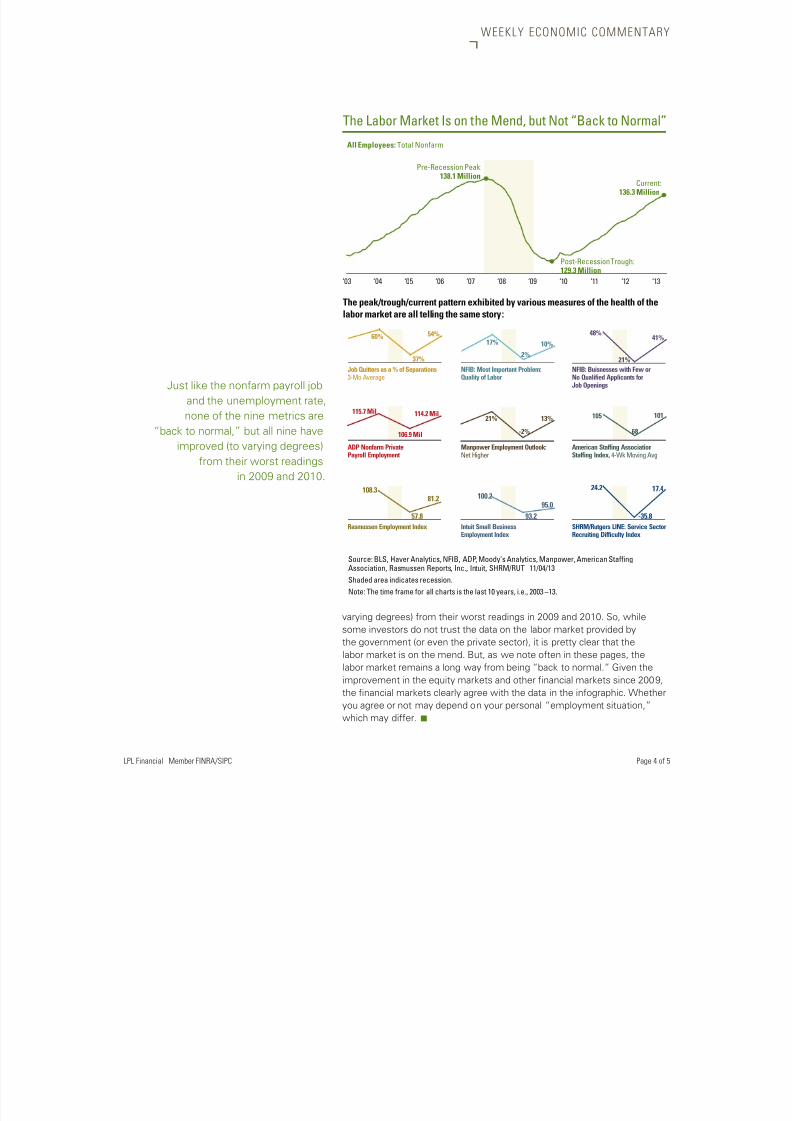
The nearby infographic helps to illustrate the point. The chart at the top shows
the number of employees on nonfarm payrolls over the last 10 years. This
measure of employment peaked in late 2007, bottomed out in mid-2010, and
has been moving higher since then, but is not yet back to the 2007 peak, or
what many regard as “normal.” Below that chart, we provide a stylized look at
nine other measures of the labor market, over that same 10-year time period:
2003 through 2013. Eight of the nine metrics are compiled and reported by
the private sector. The ninth, the Job Openings and Labor Turnover Survey
(JOLTS) data, are collected and reported by the BLS.
The bottom line is that all nine of these metrics are telling the same story
as the nonfarm payroll job count and the unemployment rate. For ease of
use, we chose just nine of these metrics, but at least a dozen others tell
the same story: The labor market peaked in 2006 or 2007, bottomed out
in 2009 and 2010, and has been in recovery mode since then. Just like the
nonfarm payroll job and the unemployment rate, none of the nine metrics
on the infographic are “back to normal,” but all nine have improved (to
Since the labor market bottomed out
in early 2010, roughly 7 million net
new jobs have been added to the
economy, while the unemployment
rate has dropped from a high of
10.0% to 7.3% today.
8/14/2019 Weekly Economic Commentary 11/112013
http://slidepdf.com/reader/full/weekly-economic-commentary-11112013 4/5
LPL Financial Member FINRA/SIPC Page 4 of 5
WEEKLY ECONOMIC COMMENTARY
varying degrees) from their worst readings in 2009 and 2010. So, whilesome investors do not trust the data on the labor market provided by
the government (or even the private sector), it is pretty clear that the
labor market is on the mend. But, as we note often in these pages, the
labor market remains a long way from being “back to normal.” Given the
improvement in the equity markets and other financial markets since 2009,
the financial markets clearly agree with the data in the infographic. Whether
you agree or not may depend on your personal “employment situation,”
which may differ. n
‘03 ‘04 ‘05 ‘06 ‘07 ‘08 ‘09 ‘10 ‘11 ‘12 ‘13
All Employees: Total Nonfarm
Pre-Recession Peak:138.1 Million
60%
37%
54%
115.7 Mil
106.9 Mil
114.2 Mil
108.3
57.8
81.2 100.2
93.2
95.0
24.2
-35.8
17.4
21%
-2%
13% 105
68
101
17%
2%
10%
48%
21%
41%
Post-Recession Trough:129.3 Million
Current:136.3 Million
Job Quitters as a % of Separations3-Mo Average
ADP Nonfarm PrivatePayroll Employment
Rasmussen Employment Index
NFIB: Most Important Problem:Quality of Labor
Manpower Employment Outlook:Net Higher
Intuit Small BusinessEmployment Index
NFIB: Buisnesses with Few orNo Qualified Applicants forJob Openings
American Staffing AssociationStaffing Index, 4-Wk Moving Avg
SHRM/Rutgers LINE: Service SectorRecruiting Difficulty Index
Source: BLS, Haver Analytics, NFIB, ADP, Moody’s Analytics, Manpower, American StaffingAssociation, Rasmussen Reports, Inc., Intuit, SHRM/RUT 11/04/13
Shaded area indicates recession.
Note: The time frame for all charts is the last 10 years, i.e., 2003 –13.
The peak/trough/current pattern exhibited by various measures of the health of the
labor market are all telling the same story:
The Labor Market Is on the Mend, but Not “Back to Normal”
Just like the nonfarm payroll job
and the unemployment rate,
none of the nine metrics are
“back to normal,” but all nine have
improved (to varying degrees)
from their worst readingsin 2009 and 2010.

8/14/2019 Weekly Economic Commentary 11/112013
http://slidepdf.com/reader/full/weekly-economic-commentary-11112013 5/5
WEEKLY ECONOMIC COMMENTARY
Member FINRA/SIPC
Page 5 of 5RES 4397 1113
Tracking #1-221075 (Exp 11/14
Not FDIC/NCUA Insured | Not Bank/ Credit Union Guaranteed | May Lose Value | Not Guaranteed by any Government Agency | Not a Bank/Credit Union Deposit
This research material has been prepar ed by LPL Financial.
To the extent you are receiving investment ad vice from a separately re gistered independent investment advisor, please note that L PL Financial is
not an affiliate of and makes no representation with respect to such entity.
IMPORTANT DISCLOSURES
The opinions voiced in this material are for general information only and are not intended to provide specific
advice or recommendations for any individual. To determine which investment(s) may be appropriate for you
consult your financial advisor prior to investing. All performance reference is historical and is no guaranteeof future results. All indices are unmanaged and cannot b e invested into directly.
The economic forecasts set forth in the presentation may not develop as predicted and there can be no
guarantee that strategies promoted will be successful.
Stock investing involves risk including loss of principal.
Gross domestic product (GDP) is the monetary value of all the finished goods and services produced within
a country’s borders in a specific time period, though GDP is usually calculated on an annual basis. It includes
all of private and public consumption, government outlays, investments and expor ts less imports that occur
within a defined territory.
The Bureau of Labor Statistics is a government agency that produces economic data that reflects the state
of the U.S. economy. This data includes the Consumer Price Index, the unemployment rate and the Producer
Price Index.