Embed Size (px)
Citation preview
Statistics Department
Central Bank of Sri Lanka
31st July 2020
Weekly Economic Indicators
Highlights of the Week
Real Sector
Monetary Sector
External Sector
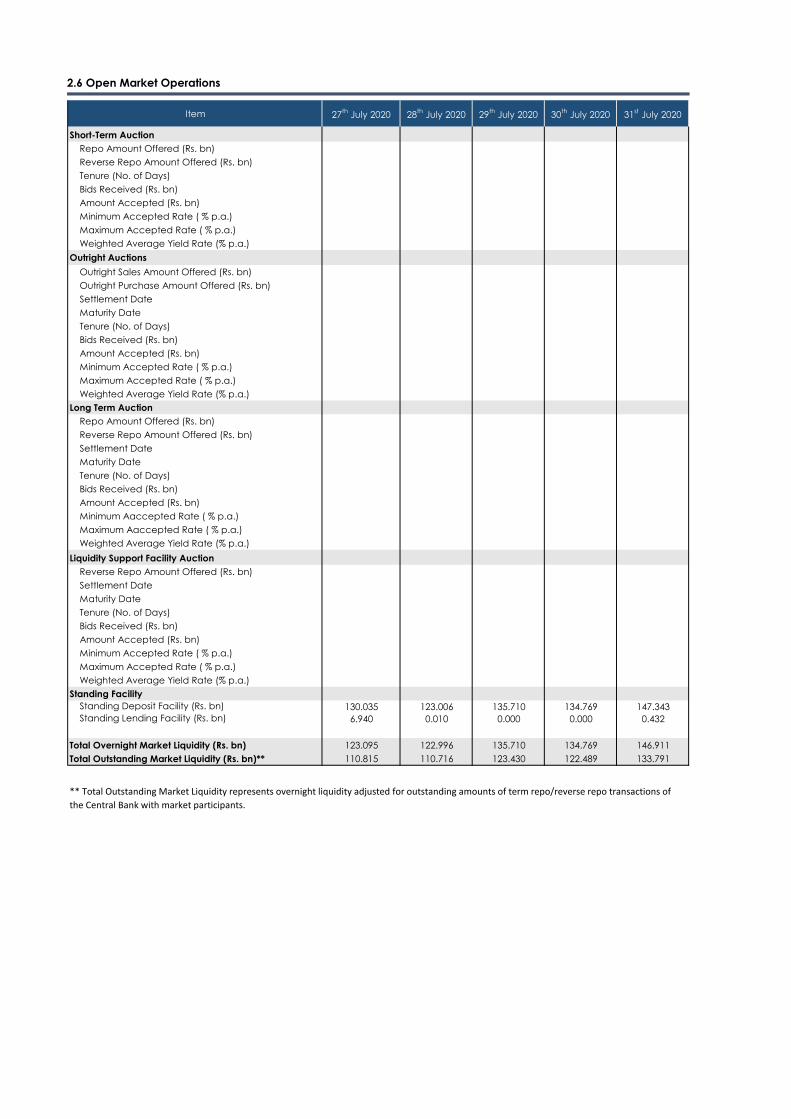
The total outstanding market liquidity was a surplus of Rs. 133.791 bn by end of this week, compared to
a surplus of Rs. 117.936 bn by the end of last week.
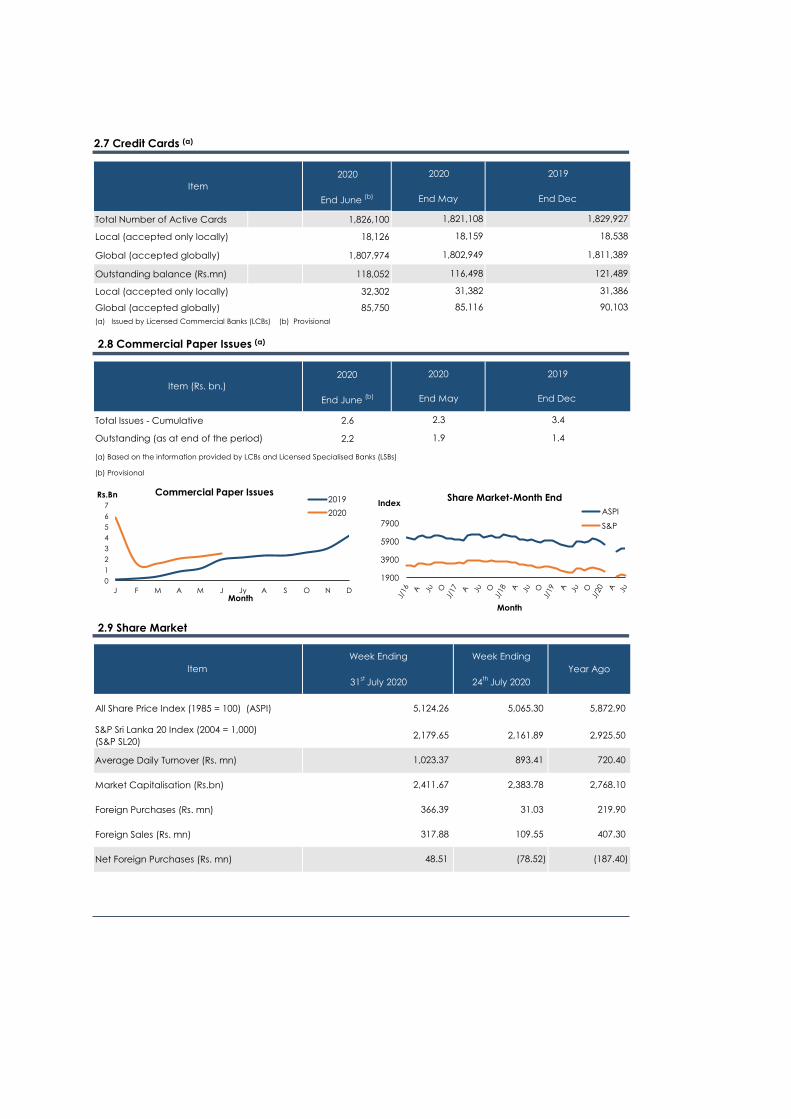
By 31st July 2020, the All Share Price Index (ASPI) increased by 1.16 per cent to 5,124.26 points and the
S&P SL 20 Index increased by 0.82 per cent to 2,179.65 points, compared to the index values of last
week.
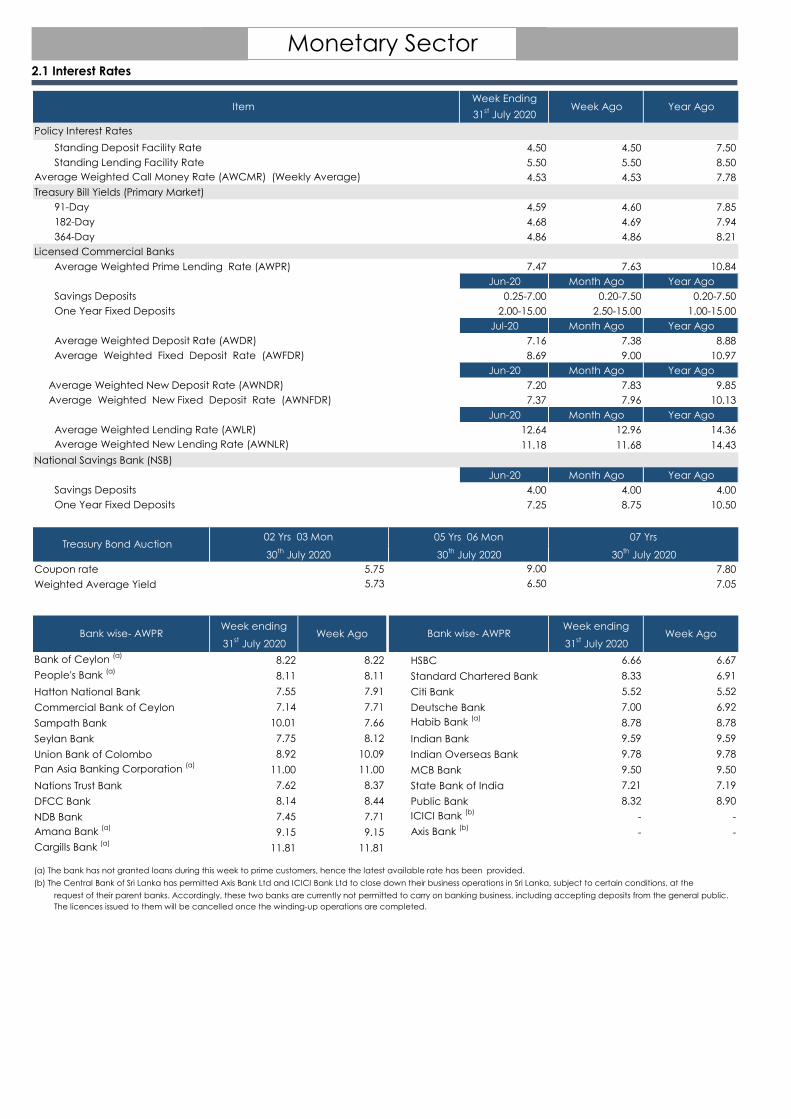
Weekly AWPR for the week ending 31st July 2020 decreased by 16 bps to 7.47 per cent compared to the
previous week.
In financing the budget deficit, domestic financing increased to 3.2 per cent of estimated GDP in first
During the year up to 31st July 2020 the Sri Lankan rupee depreciated against the US dollar (2.2 per
cent). Given the cross currency exchange rate movements, the Sri Lankan rupee appreciated against
the Indian rupee (4.6 per cent) while depreciating against the pound sterling (2.2 per cent), the Euro
(7.7 per cent) and the Japanese yen (6.2 per cent) during this period.
During the period under review (25.07.2020 to 31.07.2020), crude oil prices showed a mixed
performance. Prices increased mainly due to expectations on demand growth with the efforts to
stimulate recovery of the U.S. economy from the COVID-19 pandemic. However, at the end of the
period, prices declined along with the strenghening of dollar. Overall, Brent prices increased by US
dollars 0.14 per barrel while WTI prices declined by US dollars 0.96 per barrel, during the period.
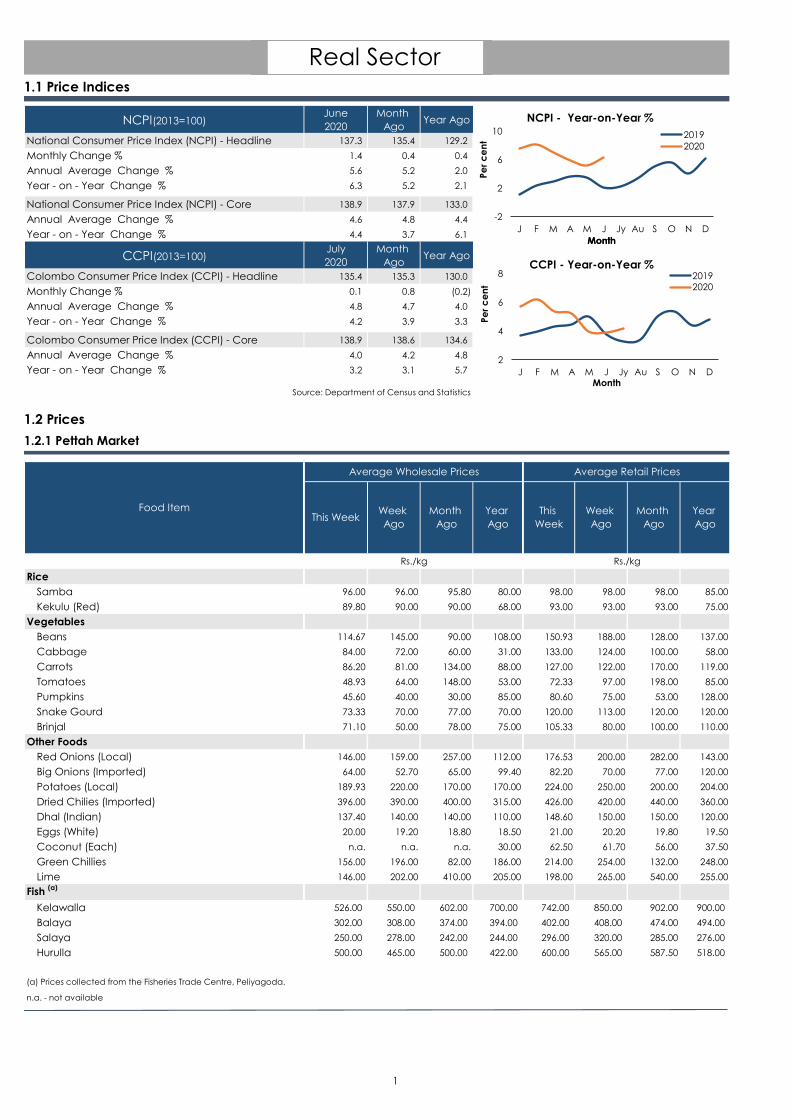
CCPI based headline inflation (Y-o-Y) increased to 4.2 per cent in July 2020 from 3.9 per cent in June
2020, mainly driven by the monthly increase in prices of items in the Non-food category and the
statistical effect of the low base prevailed in July 2019. Meanwhile, Food inflation (Y-o-Y) and Non-food
inflation (Y-o-Y) recorded at 10.9 per cent and 1.5 per cent, respectively, in July 2020.
In nominal terms, outstanding central government debt increased to Rs. 14,024.7 bn by end of April
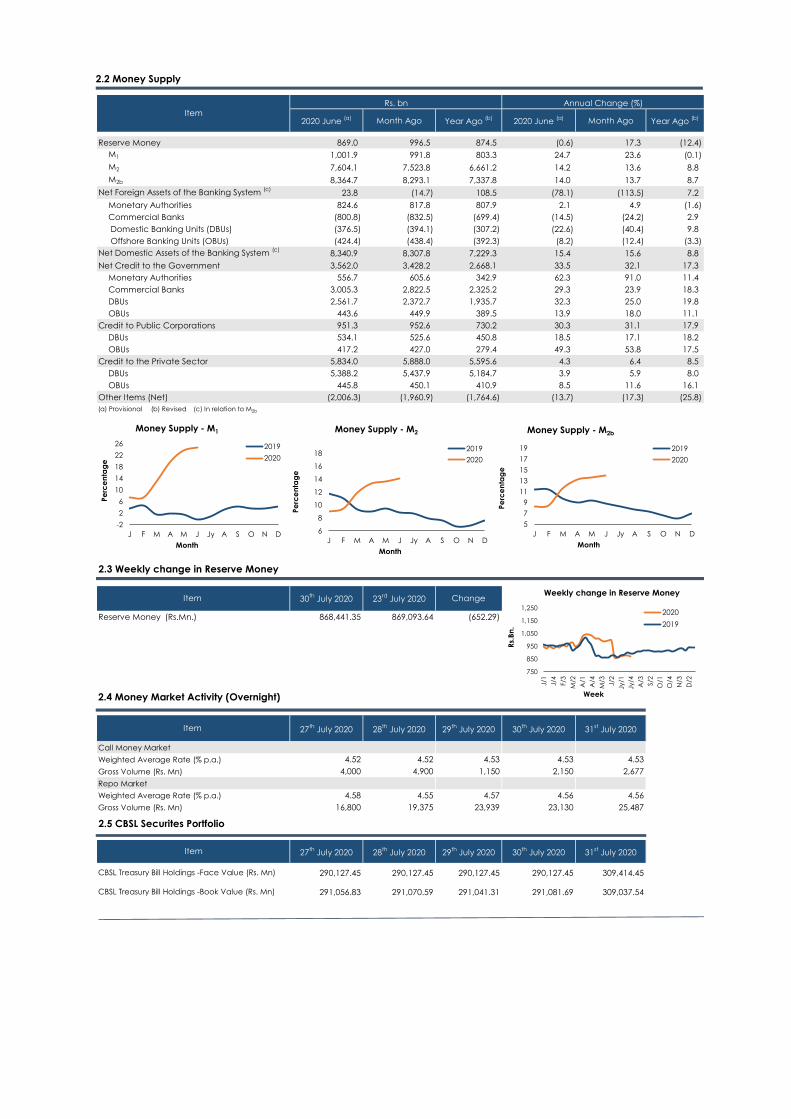
The reserve money decreased compared to the previous week mainly due to the decrease in currency
in circulation and deposits held by the commercial banks with the Central Bank.
The gross official reserves were estimated at US dollars 6,694.6 mn as at 30th June 2020.
NCPI(2013=100)June
2020
Month
AgoYear Ago
National Consumer Price Index (NCPI) - Headline 137.3 135.4 129.2
Monthly Change % 1.4 0.4 0.4
Annual Average Change % 5.6 5.2 2.0
Year - on - Year Change % 6.3 5.2 2.1
National Consumer Price Index (NCPI) - Core 138.9 137.9 133.0
Annual Average Change % 4.6 4.8 4.4
Year - on - Year Change % 4.4 3.7 6.1
CCPI(2013=100)July
2020
Month
AgoYear Ago
Colombo Consumer Price Index (CCPI) - Headline 135.4 135.3 130.0
Monthly Change % 0.1 0.8 (0.2)
Annual Average Change % 4.8 4.7 4.0
Year - on - Year Change % 4.2 3.9 3.3
Colombo Consumer Price Index (CCPI) - Core 138.9 138.6 134.6
Annual Average Change % 4.0 4.2 4.8
Year - on - Year Change % 3.2 3.1 5.7
Rice
Samba 96.00 96.00 95.80 80.00 98.00 98.00 98.00 85.00
Kekulu (Red) 89.80 90.00 90.00 68.00 93.00 93.00 93.00 75.00
Vegetables
Beans 114.67 145.00 90.00 108.00 150.93 188.00 128.00 137.00
Cabbage 84.00 72.00 60.00 31.00 133.00 124.00 100.00 58.00
Carrots 86.20 81.00 134.00 88.00 127.00 122.00 170.00 119.00
Tomatoes 48.93 64.00 148.00 53.00 72.33 97.00 198.00 85.00
Pumpkins 45.60 40.00 30.00 85.00 80.60 75.00 53.00 128.00
Snake Gourd 73.33 70.00 77.00 70.00 120.00 113.00 120.00 120.00
Brinjal 71.10 50.00 78.00 75.00 105.33 80.00 100.00 110.00
Other Foods
Red Onions (Local) 146.00 159.00 257.00 112.00 176.53 200.00 282.00 143.00
Big Onions (Imported) 64.00 52.70 65.00 99.40 82.20 70.00 77.00 120.00
Potatoes (Local) 189.93 220.00 170.00 170.00 224.00 250.00 200.00 204.00
Dried Chilies (Imported) 396.00 390.00 400.00 315.00 426.00 420.00 440.00 360.00
Dhal (Indian) 137.40 140.00 140.00 110.00 148.60 150.00 150.00 120.00
Eggs (White) 20.00 19.20 18.80 18.50 21.00 20.20 19.80 19.50
Coconut (Each) n.a. n.a. n.a. 30.00 62.50 61.70 56.00 37.50
Green Chillies 156.00 196.00 82.00 186.00 214.00 254.00 132.00 248.00
Lime 146.00 202.00 410.00 205.00 198.00 265.00 540.00 255.00
Fish (a)
Kelawalla 526.00 550.00 602.00 700.00 742.00 850.00 902.00 900.00
Balaya 302.00 308.00 374.00 394.00 402.00 408.00 474.00 494.00
Salaya 250.00 278.00 242.00 244.00 296.00 320.00 285.00 276.00
Hurulla 500.00 465.00 500.00 422.00 600.00 565.00 587.50 518.00
(a) Prices collected from the Fisheries Trade Centre, Peliyagoda.
n.a. - not available
Real Sector
Rs./kg
Average Wholesale Prices
Food Item Week
Ago
Month
Ago
Year
Ago
Month
Ago
Year
Ago
Rs./kg
Week
Ago
Average Retail Prices
Source: Department of Census and Statistics
This WeekThis
Week
1.1 Price Indices
-2
2
6
10
J F M A M J Jy Au S O N D
Pe
r c
en
t
NCPI - Year-on-Year %
2019
2020
MonthMonth
2
4
6
8
J F M A M J Jy Au S O N D
Pe
r c
en
t
CCPI - Year-on-Year %20192020
Month
1.2.1 Pettah Market
1.2 Prices
1
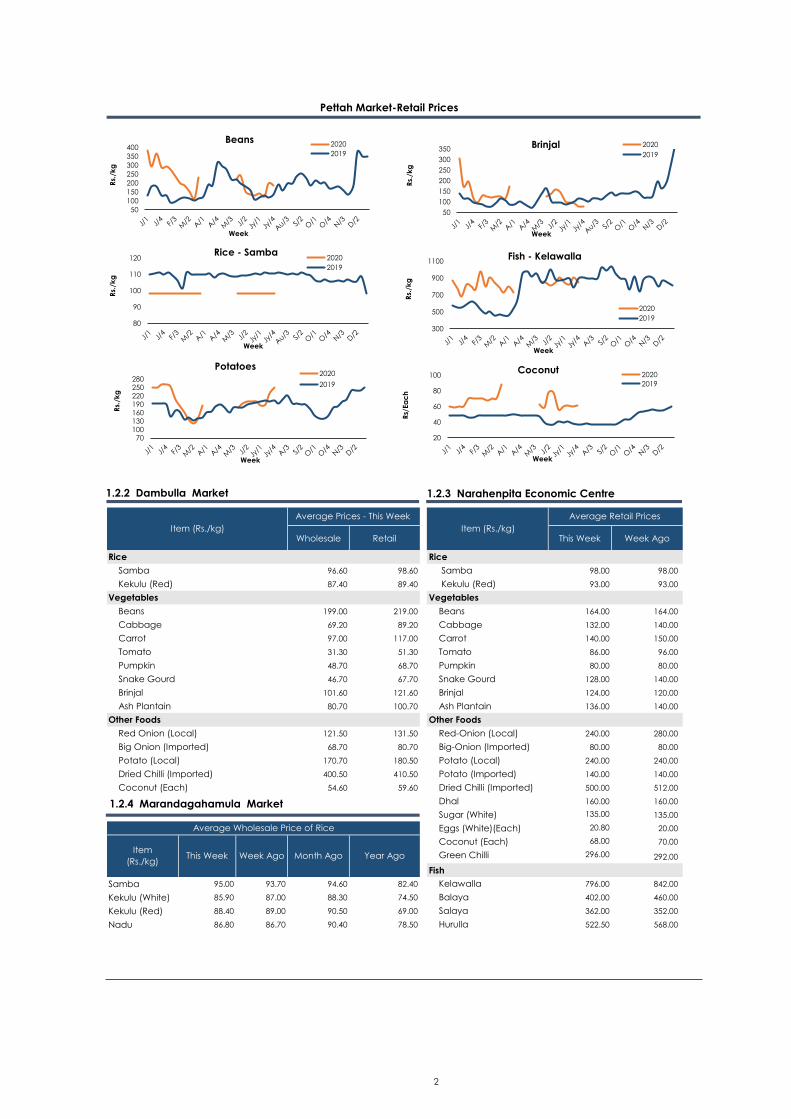
(a) In Pettah market, retail trade activities were not carried out since 27th
March 2020.
Wholesale Retail This Week Week Ago
Rice Rice
Samba 96.60 98.60 Samba 98.00 98.00
Kekulu (Red) 87.40 89.40 Kekulu (Red) 93.00 93.00
Vegetables Vegetables
Beans 199.00 219.00 Beans 164.00 164.00
Cabbage 69.20 89.20 Cabbage 132.00 140.00
Carrot 97.00 117.00 Carrot 140.00 150.00
Tomato 31.30 51.30 Tomato 86.00 96.00
Pumpkin 48.70 68.70 Pumpkin 80.00 80.00
Snake Gourd 46.70 67.70 Snake Gourd 128.00 140.00
Brinjal 101.60 121.60 Brinjal 124.00 120.00
Ash Plantain 80.70 100.70 Ash Plantain 136.00 140.00
Other Foods Other Foods
Red Onion (Local) 121.50 131.50 Red-Onion (Local) 240.00 280.00
Big Onion (Imported) 68.70 80.70 Big-Onion (Imported) 80.00 80.00
Potato (Local) 170.70 180.50 Potato (Local) 240.00 240.00
Dried Chilli (Imported) 400.50 410.50 Potato (Imported) 140.00 140.00
Coconut (Each) 54.60 59.60 Dried Chilli (Imported) 500.00 512.00
Dhal 160.00 160.00
Sugar (White) 135.00 135.00
Eggs (White)(Each) 20.80 20.00
Coconut (Each) 68.00 70.00
Green Chilli 296.00 292.00
Fish
Samba 95.00 93.70 94.60 82.40 Kelawalla 796.00 842.00
Kekulu (White) 85.90 87.00 88.30 74.50 Balaya 402.00 460.00
Kekulu (Red) 88.40 89.00 90.50 69.00 Salaya 362.00 352.00
Nadu 86.80 86.70 90.40 78.50 Hurulla 522.50 568.00
Item
(Rs./kg)This Week Week Ago Month Ago Year Ago
Average Prices - This Week
Item (Rs./kg)
Average Retail Prices
Average Wholesale Price of Rice
Item (Rs./kg)
Pettah Market-Retail Prices
50
100
150
200
250
300
350
400
Rs.
/kg
Beans2020
2019
Week
80
90
100
110
120
Rs.
/kg
Rice - Samba2020
2019
Week
70100130160190220250280
Rs.
/kg
Potatoes2020
2019
Week
50
100
150
200
250
300
350
Rs.
/kg
Brinjal 2020
2019
Week
300
500
700
900
1100
Rs.
/kg
Fish - Kelawalla
2020
2019
Week
20
40
60
80
100
Rs/
Ea
ch
Coconut2020
2019
Week
1.2.2 Dambulla Market 1.2.3 Narahenpita Economic Centre
1.2.4 Marandagahamula Market
2
2018 (a)(b)
2019 (a)
2018 (a)(b)
2019 (a)
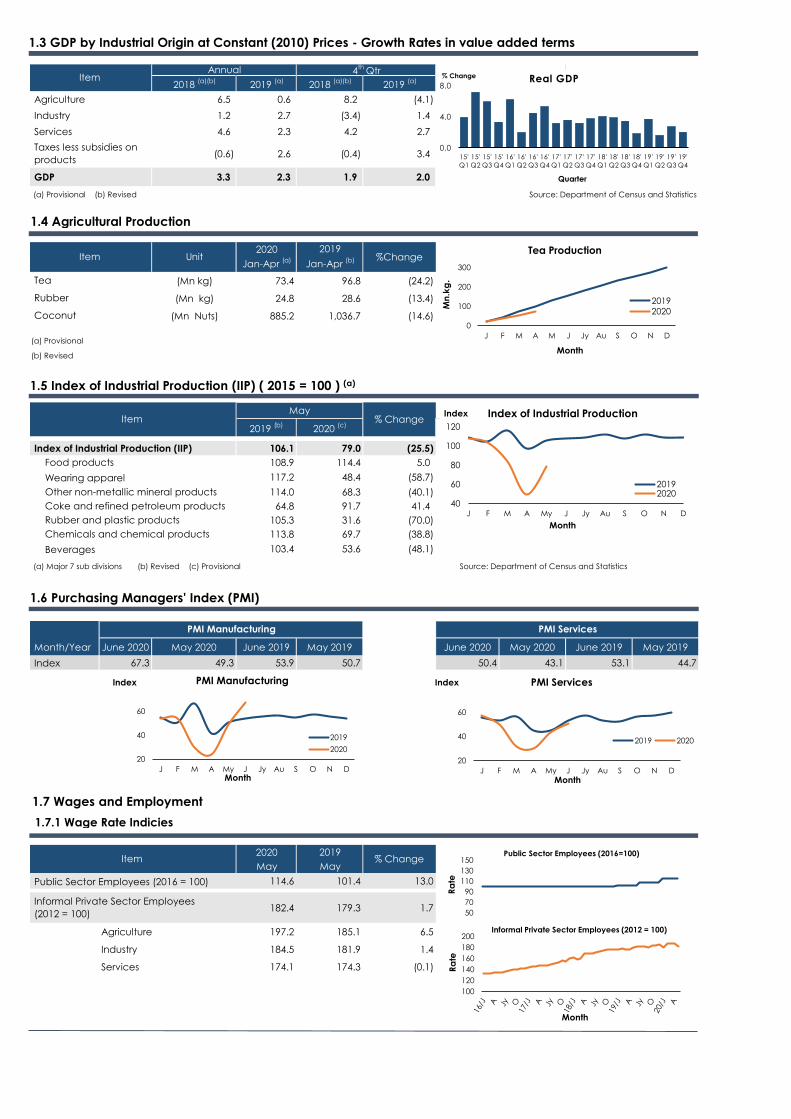
Agriculture 6.5 0.6 8.2 (4.1) 8.2 -4.1
Industry 1.2 2.7 (3.4) 1.4 -3.4 1.4
Services 4.6 2.3 4.2 2.7 4.2 2.7
(0.6) 2.6 (0.4) 3.4 -0.4 3.4
GDP 3.3 2.3 1.9 2.0 1.9 2.0
(a) Provisional (b) Revised
2020 2019
Jan-Apr (a)
Jan-Apr (b)
(Mn kg) 73.4 96.8 (24.2)
(Mn kg) 24.8 28.6 (13.4)
(Mn Nuts) 885.2 1,036.7 (14.6)
(a) Provisional
(b) Revised
2019 (b)
2020 (c)
Index of Industrial Production (IIP) 106.1 79.0 (25.5)
108.9 114.4 5.0
117.2 48.4 (58.7)
Other non-metallic mineral products 114.0 68.3 (40.1)
Coke and refined petroleum products 64.8 91.7 41.4
Rubber and plastic products 105.3 31.6 (70.0)
Chemicals and chemical products 113.8 69.7 (38.8)
Beverages 103.4 53.6 (48.1)
(a) Major 7 sub divisions (b) Revised (c) Provisional Source: Department of Census and Statistics
Month/Year June 2020 May 2020 June 2019 May 2019 June 2020 May 2020 June 2019 May 2019
Index 67.3 49.3 53.9 50.7 50.4 43.1 53.1 44.7
2020 2019
May May
114.6 101.4 13.0
182.4 179.3 1.7
Agriculture 197.2 185.1 6.5
Industry 184.5 181.9 1.4
Services 174.1 174.3 (0.1)
Item % Change
Public Sector Employees (2016 = 100)
Source: Department of Census and Statistics
%Change
Tea
Rubber
Coconut
UnitItem
PMI Services
Item
Taxes less subsidies on
products
Annual 4th
Qtr
PMI Manufacturing
Item % Change
Food products
Wearing apparel
May
Informal Private Sector Employees
(2012 = 100)
0.0
4.0
8.0
15'
Q1
15'
Q2
15'
Q3
15'
Q4
16'
Q1
16'
Q2
16'
Q3
16'
Q4
17'
Q1
17'
Q2
17'
Q3
17'
Q4
18'
Q1
18'
Q2
18'
Q3
18'
Q4
19'
Q1
19'
Q2
19'
Q3
19'
Q4
% Change Real GDP
Quarter
1.4 Agricultural Production
0
100
200
300
J F M A M J Jy Au S O N D
Mn
.kg
.
Tea Production
20192020
Month
1.7.1 Wage Rate Indicies
50
70
90
110
130
150Public Sector Employees (2016=100)
Ra
te
1.5 Index of Industrial Production (IIP) ( 2015 = 100 ) (a)
40
60
80
100
120
J F M A My J Jy Au S O N D
Index Index of Industrial Production
20192020
Month
1.7 Wages and Employment
1.6 Purchasing Managers' Index (PMI)
20
40
60
J F M A My J Jy Au S O N D
PMI Manufacturing
2019
2020
Month
Index
20
40
60
J F M A My J Jy Au S O N D
PMI Services
2019 2020
Month
Index
1.3 GDP by Industrial Origin at Constant (2010) Prices - Growth Rates in value added terms
100
120
140
160
180
200Informal Private Sector Employees (2012 = 100)
Month
Ra
te
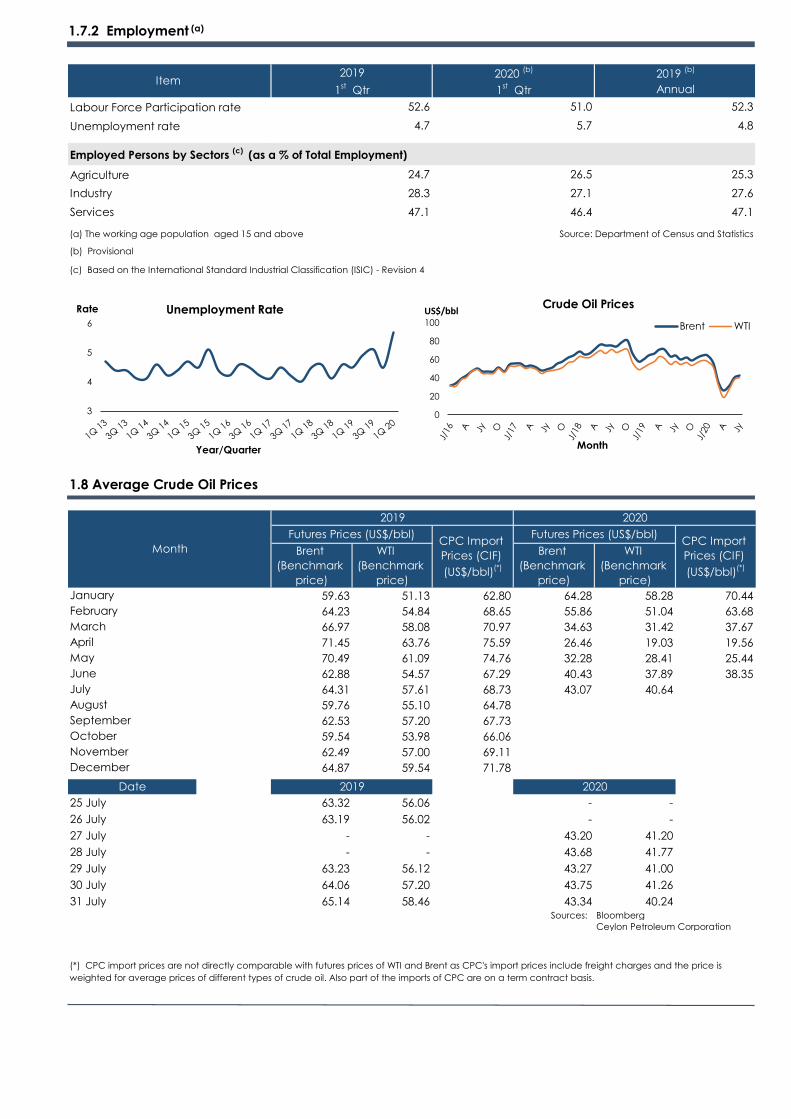
Labour Force Participation rate
Unemployment rate
Agriculture
(a) The working age population aged 15 and above
(b) Provisional
(c) Based on the International Standard Industrial Classification (ISIC) - Revision 4
59.63 51.13 62.80 64.28 58.28 70.44
64.23 54.84 68.65 55.86 51.04 63.68
66.97 58.08 70.97 34.63 31.42 37.67
71.45 63.76 75.59 26.46 19.03 19.56
70.49 61.09 74.76 32.28 28.41 25.44
62.88 54.57 67.29 40.43 37.89 38.35
64.31 57.61 68.73 43.07 40.64
59.76 55.10 64.78
62.53 57.20 67.73
59.54 53.98 66.06
62.49 57.00 69.11
64.87 59.54 71.78
25 July 63.32 56.06 - -
26 July 63.19 56.02 - -
27 July - - 43.20 41.20
28 July - - 43.68 41.77
29 July 63.23 56.12 43.27 41.00
30 July 64.06 57.20 43.75 41.26
31 July 65.14 58.46 43.34 40.24Sources: Bloomberg
Ceylon Petroleum Corporation
June
July
August
September
April
May
(*) CPC import prices are not directly comparable with futures prices of WTI and Brent as CPC's import prices include freight charges and the price is
weighted for average prices of different types of crude oil. Also part of the imports of CPC are on a term contract basis.
December
2019 2020
October
November
Date
Month
January
February
March
Futures Prices (US$/bbl)
Brent
(Benchmark
price)
WTI
(Benchmark
price)
Industry
47.1
27.6
25.3
47.1
28.3
24.7
46.4
27.1
26.5
Services
5.7
51.0
1st Qtr
2019
Employed Persons by Sectors (c)
(as a % of Total Employment)
52.3
Annual
2019 (b)
1st Qtr
2020 (b)
4.7
52.6
Item
4.8
Source: Department of Census and Statistics
2019 2020
CPC Import
Prices (CIF)
(US$/bbl)(*)
Futures Prices (US$/bbl)
Brent
(Benchmark
price)
WTI
(Benchmark
price)
CPC Import
Prices (CIF)
(US$/bbl)(*)
0
20
40
60
80
100
US$/bblCrude Oil Prices
Brent WTI
Month
1.8 Average Crude Oil Prices
1.7.2 Employment (a)
3
4
5
6
Rate Unemployment Rate
Year/Quarter
Week Ending
31st July 2020
Policy Interest Rates
Standing Deposit Facility Rate 4.50 4.50 7.50
Standing Lending Facility Rate 5.50 5.50 8.50
4.53 4.53 7.78
Treasury Bill Yields (Primary Market)
4.59 4.60 7.85
4.68 4.69 7.94
4.86 4.86 8.21
Licensed Commercial Banks
Average Weighted Prime Lending Rate (AWPR) 7.47 7.63 10.84
Jun-20 Month Ago Year Ago
Savings Deposits 0.25-7.00 0.20-7.50 0.20-7.50
One Year Fixed Deposits 2.00-15.00 2.50-15.00 1.00-15.00
Jul-20 Month Ago Year Ago
Average Weighted Deposit Rate (AWDR) 7.16 7.38 8.88
Average Weighted Fixed Deposit Rate (AWFDR) 8.69 9.00 10.97
Jun-20 Month Ago Year Ago
Average Weighted New Deposit Rate (AWNDR) 7.20 7.83 9.85
Average Weighted New Fixed Deposit Rate (AWNFDR) 7.37 7.96 10.13
Jun-20 Month Ago Year Ago
Average Weighted Lending Rate (AWLR) 12.64 12.96 14.36
Average Weighted New Lending Rate (AWNLR) 11.18 11.68 14.43
National Savings Bank (NSB)
Jun-20 Month Ago Year Ago
Savings Deposits 4.00 4.00 4.00
One Year Fixed Deposits 7.25 8.75 10.50
Coupon rate
Weighted Average Yield
Week ending Week ending
31st July 2020 31
st July 2020
Bank of Ceylon (a)
8.22 8.22 HSBC 6.66 6.67
People's Bank (a)
8.11 8.11 Standard Chartered Bank 8.33 6.91
Hatton National Bank 7.55 7.91 Citi Bank 5.52 5.52
Commercial Bank of Ceylon 7.14 7.71 Deutsche Bank 7.00 6.92
Sampath Bank 10.01 7.66 Habib Bank (a)
8.78 8.78
Seylan Bank 7.75 8.12 Indian Bank 9.59 9.59
Union Bank of Colombo 8.92 10.09 Indian Overseas Bank 9.78 9.78
Pan Asia Banking Corporation (a)
11.00 11.00 MCB Bank 9.50 9.50
Nations Trust Bank 7.62 8.37 State Bank of India 7.21 7.19
DFCC Bank 8.14 8.44 Public Bank 8.32 8.90
NDB Bank 7.45 7.71 ICICI Bank (b)
- -
Amana Bank (a)
9.15 9.15 Axis Bank (b)
- -
Cargills Bank (a)
11.81 11.81
(a) The bank has not granted loans during this week to prime customers, hence the latest available rate has been provided.
(b) The Central Bank of Sri Lanka has permitted Axis Bank Ltd and ICICI Bank Ltd to close down their business operations in Sri Lanka, subject to certain conditions, at the
request of their parent banks. Accordingly, these two banks are currently not permitted to carry on banking business, including accepting deposits from the general public.
The licences issued to them will be cancelled once the winding-up operations are completed.
91-Day
182-Day
364-Day
Week Ago
07 Yrs
30th
July 2020
6.50
9.00
7.05
7.80
Monetary Sector
Item
Average Weighted Call Money Rate (AWCMR) (Weekly Average)
Week Ago Year Ago
Bank wise- AWPR Bank wise- AWPR
05 Yrs 06 Mon
30th
July 2020
Week Ago
02 Yrs 03 Mon
30th
July 2020
5.75
5.73
Treasury Bond Auction
2.1 Interest Rates
2020 June (a) Month Ago Year Ago
(b)2020 June
(a) Month Ago Year Ago (b)
Reserve Money 869.0 996.5 874.5 (0.6) 17.3 (12.4)
M1 1,001.9 991.8 803.3 24.7 23.6 (0.1)
M2 7,604.1 7,523.8 6,661.2 14.2 13.6 8.8
M2b 8,364.7 8,293.1 7,337.8 14.0 13.7 8.7
Net Foreign Assets of the Banking System (c)
23.8 (14.7) 108.5 (78.1) (113.5) 7.2
Monetary Authorities 824.6 817.8 807.9 2.1 4.9 (1.6)
Commercial Banks (800.8) (832.5) (699.4) (14.5) (24.2) 2.9
Domestic Banking Units (DBUs) (376.5) (394.1) (307.2) (22.6) (40.4) 9.8
Offshore Banking Units (OBUs) (424.4) (438.4) (392.3) (8.2) (12.4) (3.3)
Net Domestic Assets of the Banking System (c)
8,340.9 8,307.8 7,229.3 15.4 15.6 8.8
Net Credit to the Government 3,562.0 3,428.2 2,668.1 33.5 32.1 17.3
Monetary Authorities 556.7 605.6 342.9 62.3 91.0 11.4
Commercial Banks 3,005.3 2,822.5 2,325.2 29.3 23.9 18.3
DBUs 2,561.7 2,372.7 1,935.7 32.3 25.0 19.8
OBUs 443.6 449.9 389.5 13.9 18.0 11.1
Credit to Public Corporations 951.3 952.6 730.2 30.3 31.1 17.9
DBUs 534.1 525.6 450.8 18.5 17.1 18.2
OBUs 417.2 427.0 279.4 49.3 53.8 17.5
Credit to the Private Sector 5,834.0 5,888.0 5,595.6 4.3 6.4 8.5
DBUs 5,388.2 5,437.9 5,184.7 3.9 5.9 8.0
OBUs 445.8 450.1 410.9 8.5 11.6 16.1
Other Items (Net) (2,006.3) (1,960.9) (1,764.6) (13.7) (17.3) (25.8)
(a) Provisional (b) Revised (c) In relation to M2b
Reserve Money (Rs.Mn.) 868,441.35 869,093.64 (652.29)
27th
July 2020 28th
July 2020 29th
July 2020 30th
July 2020 31st July 2020
Call Money Market
Weighted Average Rate (% p.a.) 4.52 4.52 4.53 4.53 4.53
Gross Volume (Rs. Mn) 4,000 4,900 1,150 2,150 2,677
Repo Market
Weighted Average Rate (% p.a.) 4.58 4.55 4.57 4.56 4.56
Gross Volume (Rs. Mn) 16,800 19,375 23,939 23,130 25,487
27th
July 2020 28th
July 2020 29th
July 2020 30th
July 2020 31st July 2020
290,127.45 290,127.45 290,127.45 290,127.45 309,414.45
291,056.83 291,070.59 291,041.31 291,081.69 309,037.54
Annual Change (%)
23rd
July 2020
Rs. bnItem
Change
CBSL Treasury Bill Holdings -Book Value (Rs. Mn)
CBSL Treasury Bill Holdings -Face Value (Rs. Mn)
Item 30th
July 2020
Item
Item
2.2 Money Supply
-2
2
6
10
14
18
22
26
J F M A M J Jy A S O N D
Pe
rce
nta
ge
Money Supply - M1
2019
2020
Month
6
8
10
12
14
16
18
J F M A M J Jy A S O N D
Pe
rce
nta
ge
Money Supply - M2
2019
2020
Month
5
7
9
11
13
15
17
19
J F M A M J Jy A S O N D
Pe
rce
nta
ge
Money Supply - M2b
2019
2020
Month
2.3 Weekly change in Reserve Money
2.4 Money Market Activity (Overnight)
2.5 CBSL Securites Portfolio
750
850
950
1,050
1,150
1,250
J/1
J/4
F/3
M/2
A/1
A/4
M/3 J/2
Jy/1
Jy/4
A/3
S/2
O/1
O/4
N/3
D/2
Rs.
Bn
.
Weekly change in Reserve Money
2020
2019
Week
Item 27th
July 2020 28th
July 2020 29th
July 2020 30th
July 2020 31st July 2020
Short-Term Auction
Repo Amount Offered (Rs. bn)
Reverse Repo Amount Offered (Rs. bn)
Tenure (No. of Days)
Bids Received (Rs. bn)
Amount Accepted (Rs. bn)
Minimum Accepted Rate ( % p.a.)
Maximum Accepted Rate ( % p.a.)
Weighted Average Yield Rate (% p.a.)
Outright Auctions
Outright Sales Amount Offered (Rs. bn)
Outright Purchase Amount Offered (Rs. bn)
Settlement Date
Maturity Date
Tenure (No. of Days)
Bids Received (Rs. bn)
Amount Accepted (Rs. bn)
Minimum Accepted Rate ( % p.a.)
Maximum Accepted Rate ( % p.a.)
Weighted Average Yield Rate (% p.a.)
Long Term Auction
Repo Amount Offered (Rs. bn)
Reverse Repo Amount Offered (Rs. bn)
Settlement Date
Maturity Date
Tenure (No. of Days)
Bids Received (Rs. bn)
Amount Accepted (Rs. bn)
Minimum Aaccepted Rate ( % p.a.)
Maximum Aaccepted Rate ( % p.a.)
Weighted Average Yield Rate (% p.a.)
Liquidity Support Facility Auction
Reverse Repo Amount Offered (Rs. bn)
Settlement Date
Maturity Date
Tenure (No. of Days)
Bids Received (Rs. bn)
Amount Accepted (Rs. bn)
Minimum Accepted Rate ( % p.a.)
Maximum Accepted Rate ( % p.a.)
Weighted Average Yield Rate (% p.a.)
Standing Facility
Standing Deposit Facility (Rs. bn) 130.035 123.006 135.710 134.769 147.343
Standing Lending Facility (Rs. bn) 6.940 0.010 0.000 0.000 0.432
Total Overnight Market Liquidity (Rs. bn) 123.095 122.996 135.710 134.769 146.911
Total Outstanding Market Liquidity (Rs. bn)** 110.815 110.716 123.430 122.489 133.791
** Total Outstanding Market Liquidity represents overnight liquidity adjusted for outstanding amounts of term repo/reverse repo transactions of
the Central Bank with market participants.
2.6 Open Market Operations
2020
End June (b)
Total Number of Active Cards 1,826,100
Local (accepted only locally) 18,126
Global (accepted globally) 1,807,974
Outstanding balance (Rs.mn) 118,052
Local (accepted only locally) 32,302
Global (accepted globally) 85,750
(a) Issued by Licensed Commercial Banks (LCBs) (b) Provisional
2020
End June (b)
Total Issues - Cumulative 2.6
2.2
(a) Based on the information provided by LCBs and Licensed Specialised Banks (LSBs)
S&P Sri Lanka 20 Index (2004 = 1,000)
(S&P SL20)2,161.89
Average Daily Turnover (Rs. mn) 1,023.37 893.41
2,179.65 2,925.50
720.40
2,768.10
219.90
407.30
Net Foreign Purchases (Rs. mn) 48.51 (78.52)
Market Capitalisation (Rs.bn) 2,411.67 2,383.78
Foreign Purchases (Rs. mn) 366.39 31.03
Foreign Sales (Rs. mn) 317.88 109.55
(187.40)
1,821,108 1,829,927
Item
2020 2019
End May End Dec
18,159 18,538
1,802,949 1,811,389
116,498 121,489
Item (Rs. bn.)
2020
End May
2019
End Dec
Week Ending
24th
July 2020
31,382 31,386
85,116 90,103
3.42.3
All Share Price Index (1985 = 100) (ASPI) 5,065.30 5,872.90
Outstanding (as at end of the period)
5,124.26
1.4
(b) Provisional
Item
Week Ending
Year Ago
31st
July 2020
1.9
2.7 Credit Cards (a)
2.8 Commercial Paper Issues (a)
0
1
2
3
4
5
6
7
J F M A M J Jy A S O N D
Rs.Bn Commercial Paper Issues2019
2020
Month
2.9 Share Market
1900
3900
5900
7900
IndexShare Market-Month End
ASPI
S&P
Month
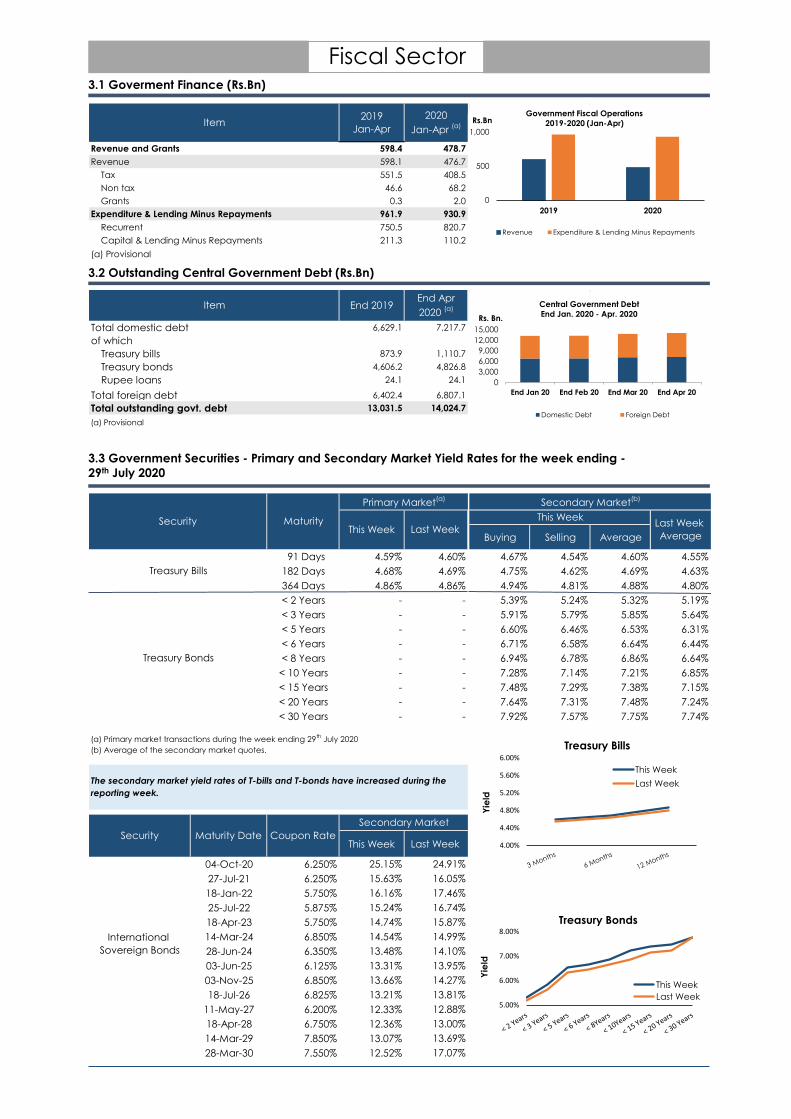
Revenue and Grants 598.4 478.7
Revenue 598.1 476.7
Tax 551.5 408.5
Non tax 46.6 68.2
Grants 0.3 2.0
Expenditure & Lending Minus Repayments 961.9 930.9
Recurrent 750.5 820.7
Capital & Lending Minus Repayments 211.3 110.2
(a) Provisional
Total domestic debt 6,629.1 7,217.7
of which
Treasury bills 873.9 1,110.7
Treasury bonds 4,606.2 4,826.8
Rupee loans 24.1 24.1
Total foreign debt 6,402.4 6,807.1
Total outstanding govt. debt 13,031.5 14,024.7
(a) Provisional
Buying Selling Average
91 Days 4.59% 4.60% 4.67% 4.54% 4.60% 4.55%
182 Days 4.68% 4.69% 4.75% 4.62% 4.69% 4.63%
364 Days 4.86% 4.86% 4.94% 4.81% 4.88% 4.80%
< 2 Years - - 5.39% 5.24% 5.32% 5.19%
< 3 Years - - 5.91% 5.79% 5.85% 5.64%
< 5 Years - - 6.60% 6.46% 6.53% 6.31%
< 6 Years - - 6.71% 6.58% 6.64% 6.44%
< 8 Years - - 6.94% 6.78% 6.86% 6.64%
< 10 Years - - 7.28% 7.14% 7.21% 6.85%
< 15 Years - - 7.48% 7.29% 7.38% 7.15%
< 20 Years - - 7.64% 7.31% 7.48% 7.24%
< 30 Years - - 7.92% 7.57% 7.75% 7.74%
This Week Last Week
04-Oct-20 6.250% 25.15% 24.91%
27-Jul-21 6.250% 15.63% 16.05%
18-Jan-22 5.750% 16.16% 17.46%
25-Jul-22 5.875% 15.24% 16.74%
18-Apr-23 5.750% 14.74% 15.87%
14-Mar-24 6.850% 14.54% 14.99%
28-Jun-24 6.350% 13.48% 14.10%
03-Jun-25 6.125% 13.31% 13.95%
03-Nov-25 6.850% 13.66% 14.27%
18-Jul-26 6.825% 13.21% 13.81%
11-May-27 6.200% 12.33% 12.88%
18-Apr-28 6.750% 12.36% 13.00%
14-Mar-29 7.850% 13.07% 13.69%
28-Mar-30 7.550% 12.52% 17.07%
Treasury Bills
Treasury Bonds
International
Sovereign Bonds
The secondary market yield rates of T-bills and T-bonds have increased during the
reporting week.
(a) Primary market transactions during the week ending 29th
July 2020
(b) Average of the secondary market quotes.
Security Maturity Date Coupon Rate
Secondary Market
Fiscal Sector
Security Maturity
Primary Market(a)
This Week Last Week
Secondary Market(b)
This Week
End Apr
2020 (a)End 2019 Item
Item2019
Jan-Apr
2020
Jan-Apr (a)
Last Week
Average
3.1 Goverment Finance (Rs.Bn)
0
500
1,000
2019 2020
Rs.BnGovernment Fiscal Operations
2019-2020 (Jan-Apr)
Revenue Expenditure & Lending Minus Repayments
3.2 Outstanding Central Government Debt (Rs.Bn)
3.3 Government Securities - Primary and Secondary Market Yield Rates for the week ending -
29th July 2020
4.00%
4.40%
4.80%
5.20%
5.60%
6.00%
Yie
ld
This Week
Last Week
Treasury Bills
5.00%
6.00%
7.00%
8.00%
Yie
ld
This Week
Last Week
Treasury Bonds
0
3,000
6,000
9,000
12,000
15,000
End Jan 20 End Feb 20 End Mar 20 End Apr 20
Rs. Bn.
Central Government Debt
End Jan. 2020 - Apr. 2020
Domestic Debt Foreign Debt
This Week Last Week
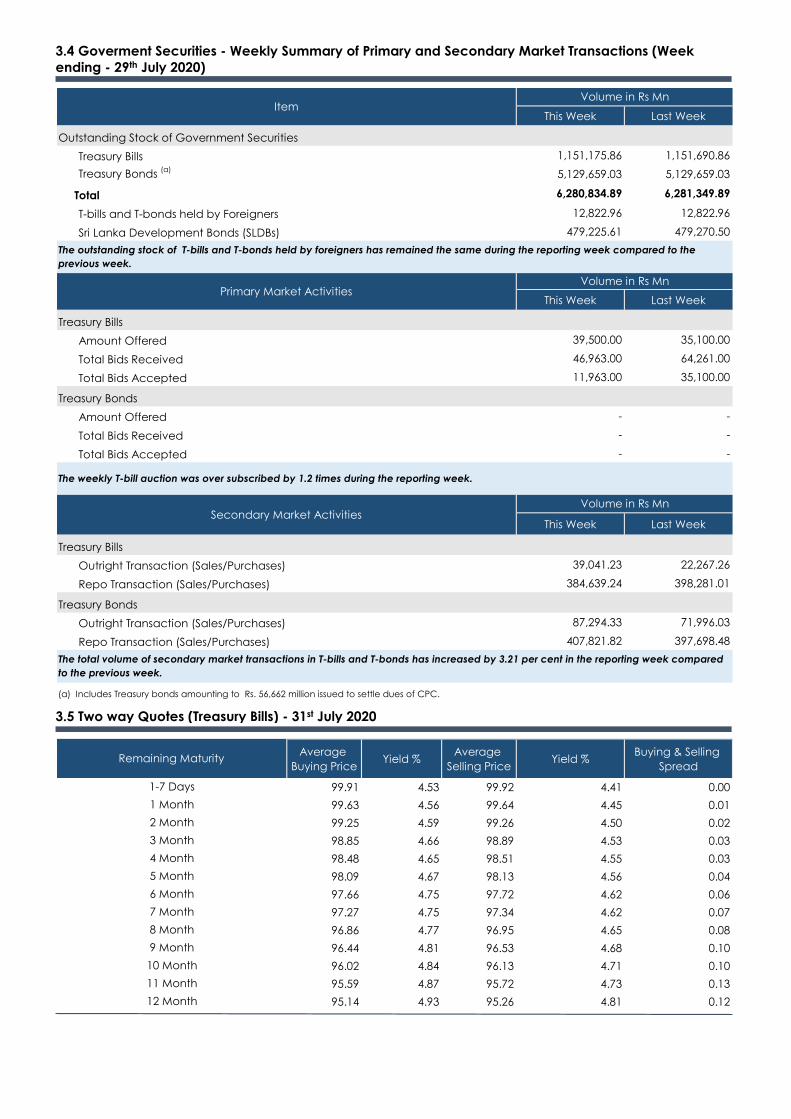
Outstanding Stock of Government Securities
Treasury Bills 1,151,175.86 1,151,690.86
Treasury Bonds (a)
5,129,659.03 5,129,659.03
Total 6,280,834.89 6,281,349.89
T-bills and T-bonds held by Foreigners 12,822.96 12,822.96
Sri Lanka Development Bonds (SLDBs) 479,225.61 479,270.50
This Week Last Week
Treasury Bills
Amount Offered 39,500.00 35,100.00
Total Bids Received 46,963.00 64,261.00
Total Bids Accepted 11,963.00 35,100.00
Treasury Bonds
Amount Offered - -
Total Bids Received - -
Total Bids Accepted - -
This Week Last Week
Treasury Bills
Outright Transaction (Sales/Purchases) 39,041.23 22,267.26
Repo Transaction (Sales/Purchases) 384,639.24 398,281.01
Treasury Bonds
Outright Transaction (Sales/Purchases) 87,294.33 71,996.03
Repo Transaction (Sales/Purchases) 407,821.82 397,698.48
Average
Buying PriceYield %
Average
Selling PriceYield %
Buying & Selling
Spread
99.91 4.53 99.92 4.41 0.00
99.63 4.56 99.64 4.45 0.01
99.25 4.59 99.26 4.50 0.02
98.85 4.66 98.89 4.53 0.03
98.48 4.65 98.51 4.55 0.03
98.09 4.67 98.13 4.56 0.04
97.66 4.75 97.72 4.62 0.06
97.27 4.75 97.34 4.62 0.07
96.86 4.77 96.95 4.65 0.08
96.44 4.81 96.53 4.68 0.10
96.02 4.84 96.13 4.71 0.10
95.59 4.87 95.72 4.73 0.13
95.14 4.93 95.26 4.81 0.12
Volume in Rs MnItem
The outstanding stock of T-bills and T-bonds held by foreigners has remained the same during the reporting week compared to the
previous week.
Primary Market ActivitiesVolume in Rs Mn
3 Month
The weekly T-bill auction was over subscribed by 1.2 times during the reporting week.
Secondary Market ActivitiesVolume in Rs Mn
The total volume of secondary market transactions in T-bills and T-bonds has increased by 3.21 per cent in the reporting week compared
to the previous week.
(a) Includes Treasury bonds amounting to Rs. 56,662 million issued to settle dues of CPC.
Remaining Maturity
1-7 Days
1 Month
2 Month
11 Month
12 Month
4 Month
5 Month
6 Month
7 Month
8 Month
10 Month
9 Month
3.4 Goverment Securities - Weekly Summary of Primary and Secondary Market Transactions (Week
ending - 29th July 2020)
3.5 Two way Quotes (Treasury Bills) - 31st July 2020
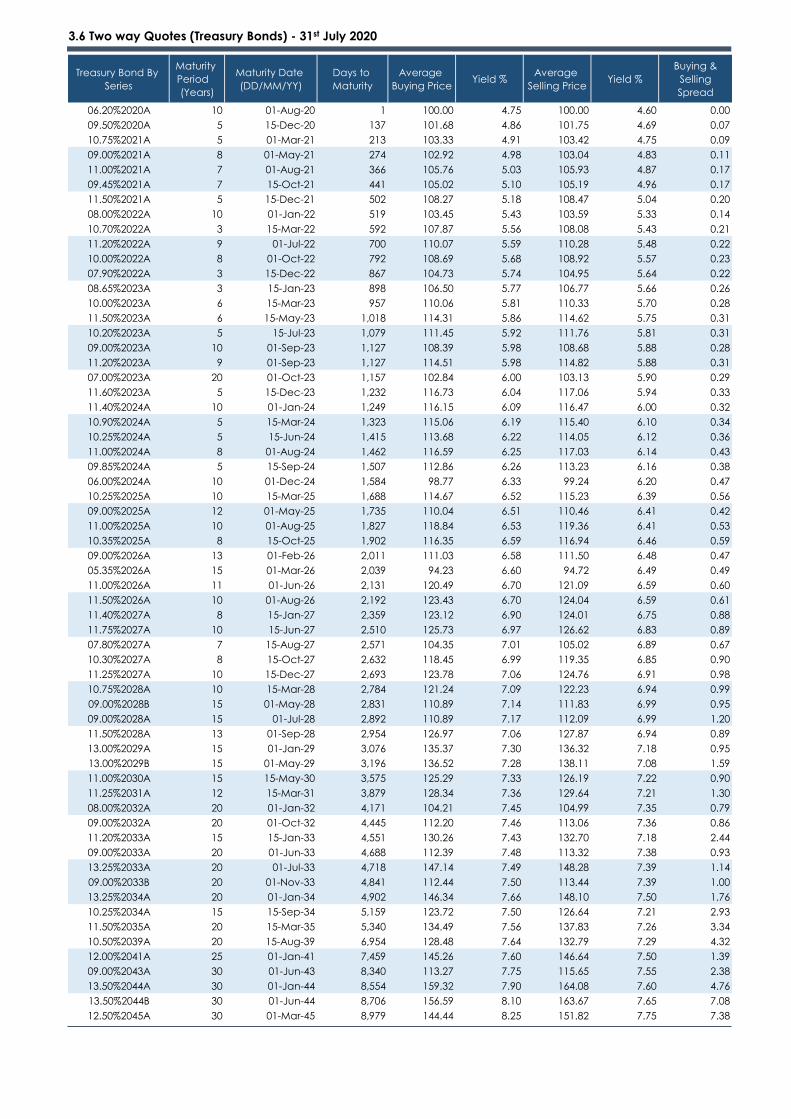
Treasury Bond By
Series
Maturity
Period
(Years)
Maturity Date
(DD/MM/YY)
Days to
Maturity
Average
Buying PriceYield %
Average
Selling PriceYield %
Buying &
Selling
Spread
06.20%2020A 10 01-Aug-20 1 100.00 4.75 100.00 4.60 0.00
09.50%2020A 5 15-Dec-20 137 101.68 4.86 101.75 4.69 0.07
10.75%2021A 5 01-Mar-21 213 103.33 4.91 103.42 4.75 0.09
09.00%2021A 8 01-May-21 274 102.92 4.98 103.04 4.83 0.11
11.00%2021A 7 01-Aug-21 366 105.76 5.03 105.93 4.87 0.17
09.45%2021A 7 15-Oct-21 441 105.02 5.10 105.19 4.96 0.17
11.50%2021A 5 15-Dec-21 502 108.27 5.18 108.47 5.04 0.20
08.00%2022A 10 01-Jan-22 519 103.45 5.43 103.59 5.33 0.14
10.70%2022A 3 15-Mar-22 592 107.87 5.56 108.08 5.43 0.21
11.20%2022A 9 01-Jul-22 700 110.07 5.59 110.28 5.48 0.22
10.00%2022A 8 01-Oct-22 792 108.69 5.68 108.92 5.57 0.23
07.90%2022A 3 15-Dec-22 867 104.73 5.74 104.95 5.64 0.22
08.65%2023A 3 15-Jan-23 898 106.50 5.77 106.77 5.66 0.26
10.00%2023A 6 15-Mar-23 957 110.06 5.81 110.33 5.70 0.28
11.50%2023A 6 15-May-23 1,018 114.31 5.86 114.62 5.75 0.31
10.20%2023A 5 15-Jul-23 1,079 111.45 5.92 111.76 5.81 0.31
09.00%2023A 10 01-Sep-23 1,127 108.39 5.98 108.68 5.88 0.28
11.20%2023A 9 01-Sep-23 1,127 114.51 5.98 114.82 5.88 0.31
07.00%2023A 20 01-Oct-23 1,157 102.84 6.00 103.13 5.90 0.29
11.60%2023A 5 15-Dec-23 1,232 116.73 6.04 117.06 5.94 0.33
11.40%2024A 10 01-Jan-24 1,249 116.15 6.09 116.47 6.00 0.32
10.90%2024A 5 15-Mar-24 1,323 115.06 6.19 115.40 6.10 0.34
10.25%2024A 5 15-Jun-24 1,415 113.68 6.22 114.05 6.12 0.36
11.00%2024A 8 01-Aug-24 1,462 116.59 6.25 117.03 6.14 0.43
09.85%2024A 5 15-Sep-24 1,507 112.86 6.26 113.23 6.16 0.38
06.00%2024A 10 01-Dec-24 1,584 98.77 6.33 99.24 6.20 0.47
10.25%2025A 10 15-Mar-25 1,688 114.67 6.52 115.23 6.39 0.56
09.00%2025A 12 01-May-25 1,735 110.04 6.51 110.46 6.41 0.42
11.00%2025A 10 01-Aug-25 1,827 118.84 6.53 119.36 6.41 0.53
10.35%2025A 8 15-Oct-25 1,902 116.35 6.59 116.94 6.46 0.59
09.00%2026A 13 01-Feb-26 2,011 111.03 6.58 111.50 6.48 0.47
05.35%2026A 15 01-Mar-26 2,039 94.23 6.60 94.72 6.49 0.49
11.00%2026A 11 01-Jun-26 2,131 120.49 6.70 121.09 6.59 0.60
11.50%2026A 10 01-Aug-26 2,192 123.43 6.70 124.04 6.59 0.61
11.40%2027A 8 15-Jan-27 2,359 123.12 6.90 124.01 6.75 0.88
11.75%2027A 10 15-Jun-27 2,510 125.73 6.97 126.62 6.83 0.89
07.80%2027A 7 15-Aug-27 2,571 104.35 7.01 105.02 6.89 0.67
10.30%2027A 8 15-Oct-27 2,632 118.45 6.99 119.35 6.85 0.90
11.25%2027A 10 15-Dec-27 2,693 123.78 7.06 124.76 6.91 0.98
10.75%2028A 10 15-Mar-28 2,784 121.24 7.09 122.23 6.94 0.99
09.00%2028B 15 01-May-28 2,831 110.89 7.14 111.83 6.99 0.95
09.00%2028A 15 01-Jul-28 2,892 110.89 7.17 112.09 6.99 1.20
11.50%2028A 13 01-Sep-28 2,954 126.97 7.06 127.87 6.94 0.89
13.00%2029A 15 01-Jan-29 3,076 135.37 7.30 136.32 7.18 0.95
13.00%2029B 15 01-May-29 3,196 136.52 7.28 138.11 7.08 1.59
11.00%2030A 15 15-May-30 3,575 125.29 7.33 126.19 7.22 0.90
11.25%2031A 12 15-Mar-31 3,879 128.34 7.36 129.64 7.21 1.30
08.00%2032A 20 01-Jan-32 4,171 104.21 7.45 104.99 7.35 0.79
09.00%2032A 20 01-Oct-32 4,445 112.20 7.46 113.06 7.36 0.86
11.20%2033A 15 15-Jan-33 4,551 130.26 7.43 132.70 7.18 2.44
09.00%2033A 20 01-Jun-33 4,688 112.39 7.48 113.32 7.38 0.93
13.25%2033A 20 01-Jul-33 4,718 147.14 7.49 148.28 7.39 1.14
09.00%2033B 20 01-Nov-33 4,841 112.44 7.50 113.44 7.39 1.00
13.25%2034A 20 01-Jan-34 4,902 146.34 7.66 148.10 7.50 1.76
10.25%2034A 15 15-Sep-34 5,159 123.72 7.50 126.64 7.21 2.93
11.50%2035A 20 15-Mar-35 5,340 134.49 7.56 137.83 7.26 3.34
10.50%2039A 20 15-Aug-39 6,954 128.48 7.64 132.79 7.29 4.32
12.00%2041A 25 01-Jan-41 7,459 145.26 7.60 146.64 7.50 1.39
09.00%2043A 30 01-Jun-43 8,340 113.27 7.75 115.65 7.55 2.38
13.50%2044A 30 01-Jan-44 8,554 159.32 7.90 164.08 7.60 4.76
13.50%2044B 30 01-Jun-44 8,706 156.59 8.10 163.67 7.65 7.08
12.50%2045A 30 01-Mar-45 8,979 144.44 8.25 151.82 7.75 7.38
3.6 Two way Quotes (Treasury Bonds) - 31st July 2020
Buying Selling Average Week Year
Rate Rate Rate Ago Ago
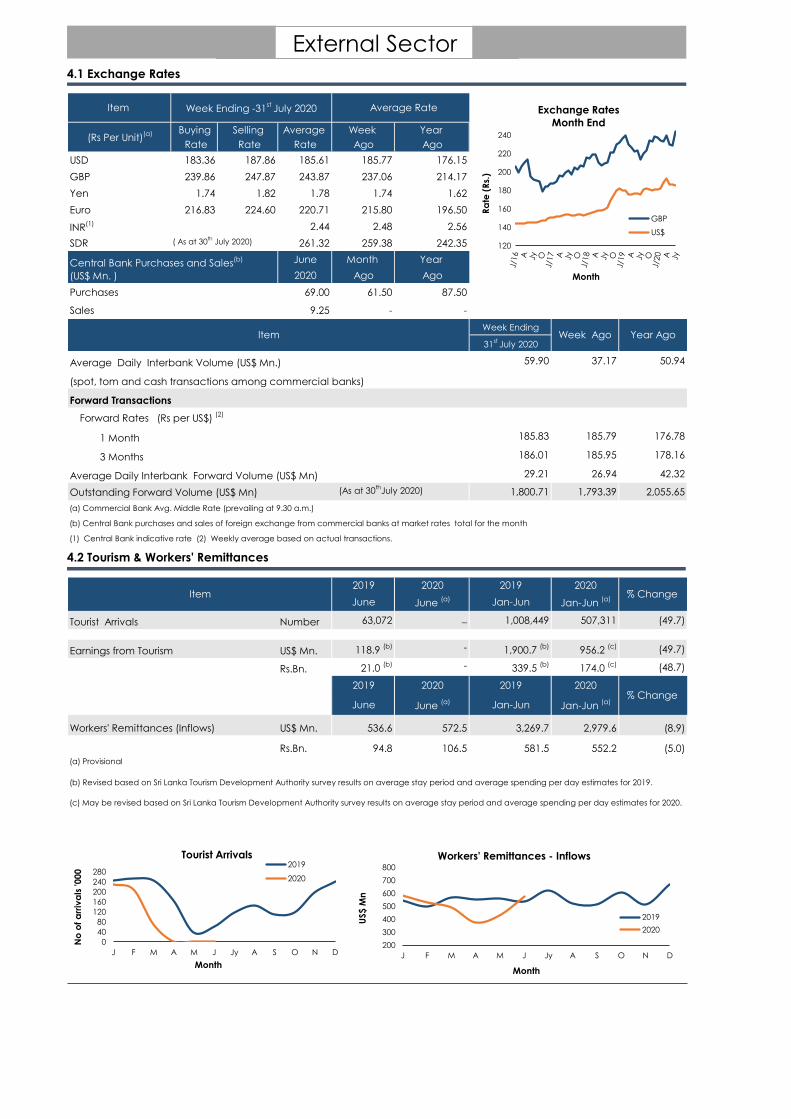
USD 183.36 187.86 185.61 185.77 176.15
GBP 239.86 247.87 243.87 237.06 214.17
Yen 1.74 1.82 1.78 1.74 1.62
Euro 216.83 224.60 220.71 215.80 196.50
INR(1) 2.44 2.48 2.56
SDR ( As at 30th
July 2020) 261.32 259.38 242.35
June Month Year
2020 Ago Ago
Purchases 69.00 61.50 87.50
Sales 9.25 - -
Week Ending
31st
July 2020
Average Daily Interbank Volume (US$ Mn.) 59.90 37.17 50.94
(spot, tom and cash transactions among commercial banks)
Forward Transactions
Forward Rates (Rs per US$) (2)
1 Month 185.83 185.79 176.78
3 Months 186.01 185.95 178.16
Average Daily Interbank Forward Volume (US$ Mn) 29.21 26.94 42.32
Outstanding Forward Volume (US$ Mn) (As at 30th
July 2020) 1,800.71 1,793.39 2,055.65
(a) Commercial Bank Avg. Middle Rate (prevailing at 9.30 a.m.)
(b) Central Bank purchases and sales of foreign exchange from commercial banks at market rates total for the month
(1) Central Bank indicative rate (2) Weekly average based on actual transactions.
2019 2020 2019 2020
June June (a) Jan-Jun Jan-Jun
(a)
Tourist Arrivals Number 63,072 _ 1,008,449 507,311 (49.7)
Earnings from Tourism US$ Mn. 118.9 (b) - 1,900.7
(b)956.2
(c) (49.7)
Rs.Bn. 21.0 (b) - 339.5
(b)174.0
(c) (48.7)
2019 2020 2019 2020
June June (a) Jan-Jun Jan-Jun
(a)
Workers' Remittances (Inflows) US$ Mn. 536.6 572.5 3,269.7 2,979.6 (8.9)
Rs.Bn. 94.8 106.5 581.5 552.2 (5.0)
External Sector
Item Week Ending -31st
July 2020
Central Bank Purchases and Sales(b)
(US$ Mn. )
Week Ago Year AgoItem
(Rs Per Unit)(a)
Average Rate
(c) May be revised based on Sri Lanka Tourism Development Authority survey results on average stay period and average spending per day estimates for 2020.
(b) Revised based on Sri Lanka Tourism Development Authority survey results on average stay period and average spending per day estimates for 2019.
(a) Provisional
Item % Change
% Change
4.1 Exchange Rates
4.2 Tourism & Workers' Remittances
120
140
160
180
200
220
240
Ra
te (
Rs.
)
Exchange Rates
Month End
GBP
US$
Month
0
40
80
120
160
200
240
280
J F M A M J Jy A S O N D
No
of
arr
iva
ls '000
Tourist Arrivals 2019
2020
Month
200
300
400
500
600
700
800
J F M A M J Jy A S O N D
US$ M
n
Workers' Remittances - Inflows
2019
2020
Month
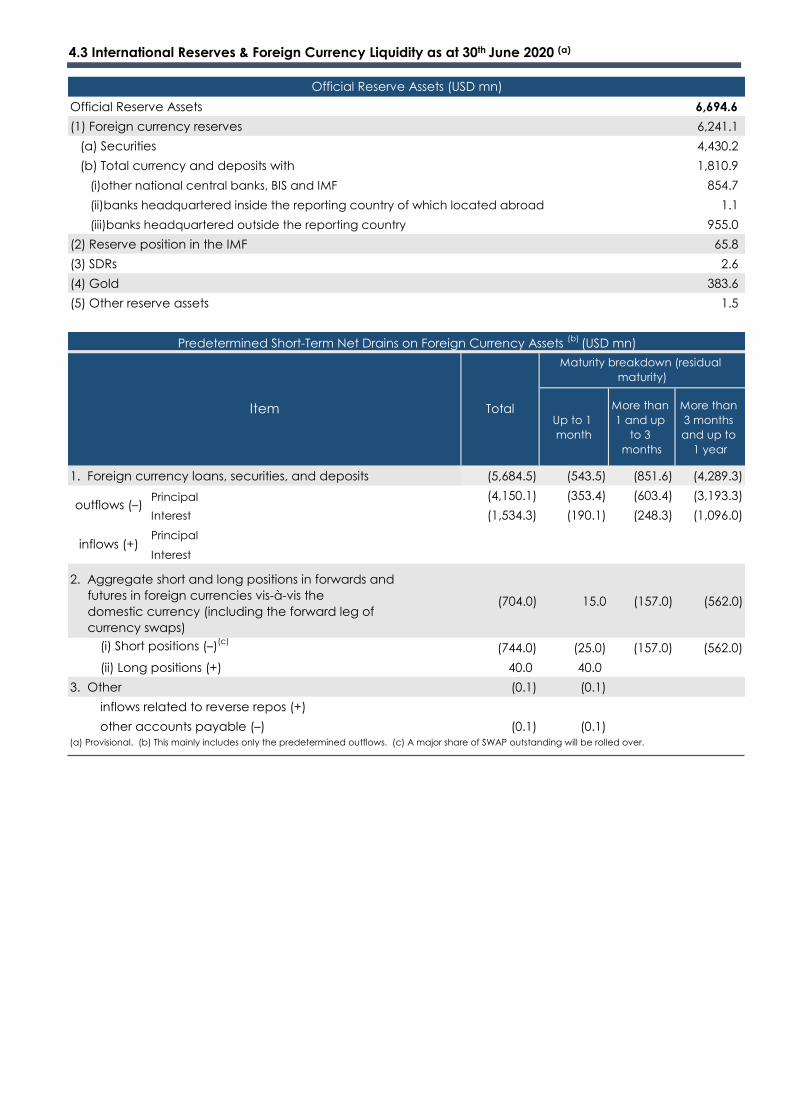
Official Reserve Assets 6,694.6
(1) Foreign currency reserves 6,241.1
(a) Securities 4,430.2
(b) Total currency and deposits with 1,810.9
(i)other national central banks, BIS and IMF 854.7
(ii)banks headquartered inside the reporting country of which located abroad 1.1
(iii)banks headquartered outside the reporting country 955.0
(2) Reserve position in the IMF 65.8
(3) SDRs 2.6
(4) Gold 383.6
(5) Other reserve assets 1.5
Up to 1
month
More than
1 and up
to 3
months
More than
3 months
and up to
1 year
1. Foreign currency loans, securities, and deposits (5,684.5) (543.5) (851.6) (4,289.3)
Principal (4,150.1) (353.4) (603.4) (3,193.3)
Interest (1,534.3) (190.1) (248.3) (1,096.0)
Principal
Interest
(704.0) 15.0 (157.0) (562.0)
(i) Short positions (–)(c)
(744.0) (25.0) (157.0) (562.0)
(ii) Long positions (+) 40.0 40.0
3. Other (0.1) (0.1)
inflows related to reverse repos (+)
other accounts payable (–) (0.1) (0.1)
outflows (–)
inflows (+)
(a) Provisional. (b) This mainly includes only the predetermined outflows. (c) A major share of SWAP outstanding will be rolled over.
Official Reserve Assets (USD mn)
Predetermined Short-Term Net Drains on Foreign Currency Assets (b)
(USD mn)
Item Total
Maturity breakdown (residual
maturity)
2. Aggregate short and long positions in forwards and
futures in foreign currencies vis-à-vis the
domestic currency (including the forward leg of
currency swaps)
4.3 International Reserves & Foreign Currency Liquidity as at 30th June 2020 (a)
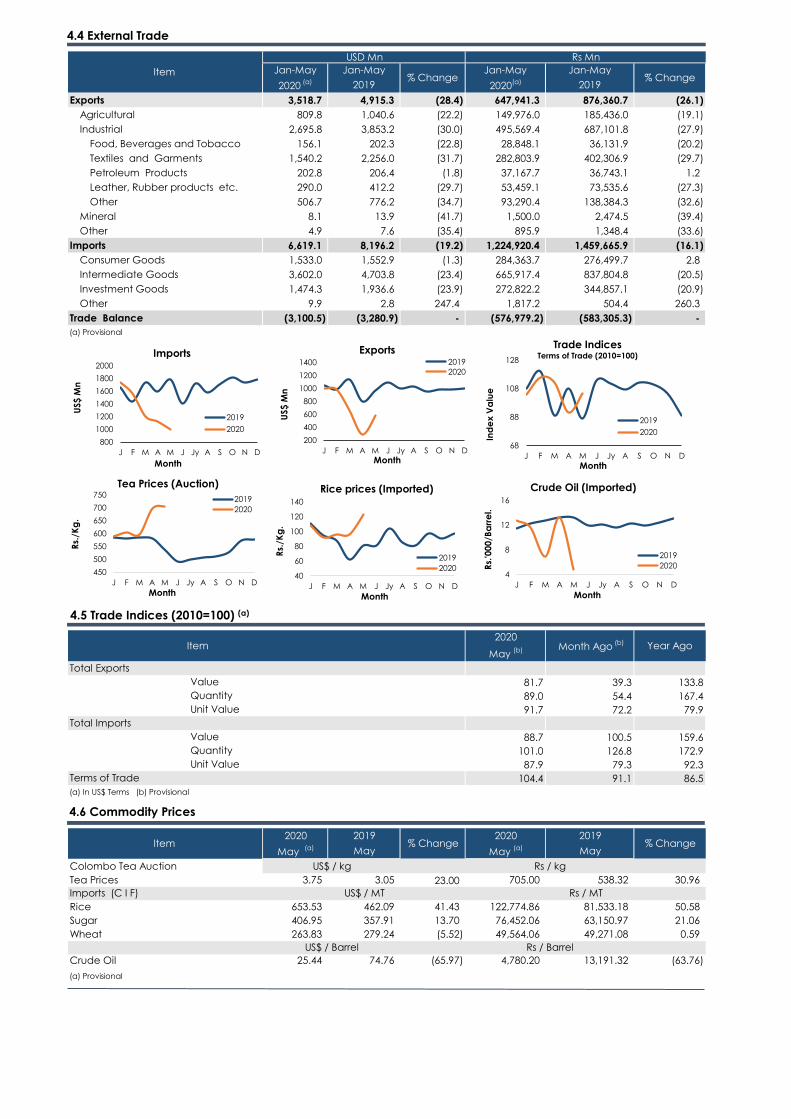
Jan-May Jan-May Jan-May Jan-May
2020 (a) 2019 2020
(a) 2019
Exports 3,518.7 4,915.3 (28.4) 647,941.3 876,360.7 (26.1)
Agricultural 809.8 1,040.6 (22.2) 149,976.0 185,436.0 (19.1)
Industrial 2,695.8 3,853.2 (30.0) 495,569.4 687,101.8 (27.9)
Food, Beverages and Tobacco 156.1 202.3 (22.8) 28,848.1 36,131.9 (20.2)
Textiles and Garments 1,540.2 2,256.0 (31.7) 282,803.9 402,306.9 (29.7)
Petroleum Products 202.8 206.4 (1.8) 37,167.7 36,743.1 1.2
Leather, Rubber products etc. 290.0 412.2 (29.7) 53,459.1 73,535.6 (27.3)
Other 506.7 776.2 (34.7) 93,290.4 138,384.3 (32.6)
Mineral 8.1 13.9 (41.7) 1,500.0 2,474.5 (39.4)
Other 4.9 7.6 (35.4) 895.9 1,348.4 (33.6)
Imports 6,619.1 8,196.2 (19.2) 1,224,920.4 1,459,665.9 (16.1)
Consumer Goods 1,533.0 1,552.9 (1.3) 284,363.7 276,499.7 2.8
Intermediate Goods 3,602.0 4,703.8 (23.4) 665,917.4 837,804.8 (20.5)
Investment Goods 1,474.3 1,936.6 (23.9) 272,822.2 344,857.1 (20.9)
Other 9.9 2.8 247.4 1,817.2 504.4 260.3
Trade Balance (3,100.5) (3,280.9) - (576,979.2) (583,305.3) -
2020
May (b)
Total Exports
Value 81.7 39.3 133.8
Quantity 89.0 54.4 167.4
Unit Value 91.7 72.2 79.9
Total Imports
Value 88.7 100.5 159.6
Quantity 101.0 126.8 172.9
Unit Value 87.9 79.3 92.3
Terms of Trade 104.4 91.1 86.5
2020 2019 2020 2019
May (a) May May
(a) May
Colombo Tea Auction
Tea Prices 3.75 3.05 23.00 705.00 538.32 30.96
Imports (C I F)
Rice 653.53 462.09 41.43 122,774.86 81,533.18 50.58
Sugar 406.95 357.91 13.70 76,452.06 63,150.97 21.06
Wheat 263.83 279.24 (5.52) 49,564.06 49,271.08 0.59
Crude Oil 25.44 74.76 (65.97) 4,780.20 13,191.32 (63.76)
(a) Provisional
Item
(a) In US$ Terms (b) Provisional
% Change% ChangeItem
Item
(a) Provisional
Month Ago (b) Year Ago
% Change % Change
USD Mn Rs Mn
US$ / MT Rs / MT
US$ / kg Rs / kg
US$ / Barrel Rs / Barrel
4.4 External Trade
68
88
108
128
J F M A M J Jy A S O N D
Ind
ex V
alu
e
Trade IndicesTerms of Trade (2010=100)
2019
2020
Month
200
400
600
800
1000
1200
1400
J F M A M J Jy A S O N D
US$ M
n
Exports 2019
2020
Month
800
1000
1200
1400
1600
1800
2000
J F M A M J Jy A S O N D
US$ M
n
Imports
2019
2020
Month
450
500
550
600
650
700
750
J F M A M J Jy A S O N D
Rs.
/Kg
.
Tea Prices (Auction)
2019
2020
Month
4.5 Trade Indices (2010=100) (a)
40
60
80
100
120
140
J F M A M J Jy A S O N D
Rs.
/Kg
.
Rice prices (Imported)
2019
2020
Month
4.6 Commodity Prices
4
8
12
16
J F M A M J Jy A S O N D
Rs.
'000
/Ba
rre
l.Crude Oil (Imported)
2019
2020
Month