Embed Size (px)
Citation preview
WeGo Fall 2019 Service & Fare Change Title VI Report
Introduction
Title VI of the Civil Rights Act of 1964 is the Federal law that protects individuals from discrimination on the basis of their race, color, or national origin in programs that receive Federal financial assistance. WeGo Public Transit Title VI policy is intended to ensure equity and equal access in the provision of public transportation services in Davidson County regardless of race, national origin, or income. This includes ensuring that any changes to service or fares do not create a disparate impact on minority populations or place disproportionate burden on low-income populations. This report provides a complete equity analysis of the proposed Fall 2019 Service and Fare Changes, evaluating the impacts by assessing the adverse effects on the minority and low-income population.
Disparate Impact and Disproportionate Burden Policy
The Federal Transit Administration (FTA) defines “disparate impacts” and “disproportionate burdens” as neutral policies or practices that have the effect of disproportionately excluding or adversely affecting members of a group protected under Title VI, without substantial legitimate justification. The Disparate Impact Policy establishes a threshold for determining whether proposed fare or service changes have a disparate impact on minority populations. The Disproportionate Burden Policy establishes a threshold for determining whether proposed fare or service changes place disproportionate burden on low-income populations.
The threshold is the difference between the burdens or benefits experienced by minority or low-income populations when compared to the non-minority or non-low-income populations. Exceeding the threshold means that a fare or service change either negatively impacts these protected populations more than the non-protected populations or that the change benefits non-minority and non-low income populations more than minority and low-income populations. WeGo’s Title VI Policy uses a threshold of 20% for both disparate impact and disproportionate burden.
Service Change Equity Analysis
WeGo applied the following criteria in developing the initial set of recommendations for the service and fare changes (in no particular order):
• Assuring social equity in any fare or service change.
• Preserving service quality on routes that carry the overwhelming majority of customers.
• Focusing on reducing or eliminating redundant services.
• Eliminating extremely underperforming services in terms of ridership.
• Applying reductions in a geographically equitable manner.
• Adhering to sound service design principles as are being advanced in our network redesign project, to assure that our system can be even more effective when we are in a position to add back service hours.
The proposed service changes advanced based on these principles can be grouped into four main categories: route eliminations, route combinations (on BRT-lite corridors), route restructuring, and other service reductions (reduced frequency/span).
Route Eliminations
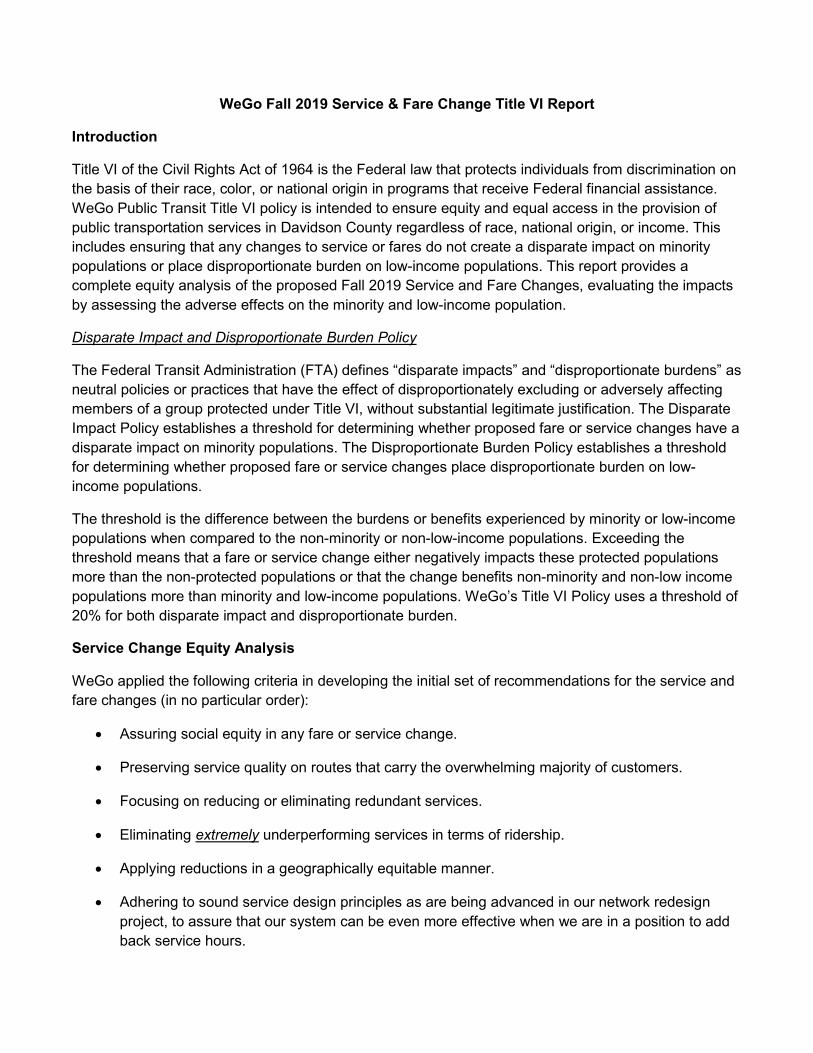
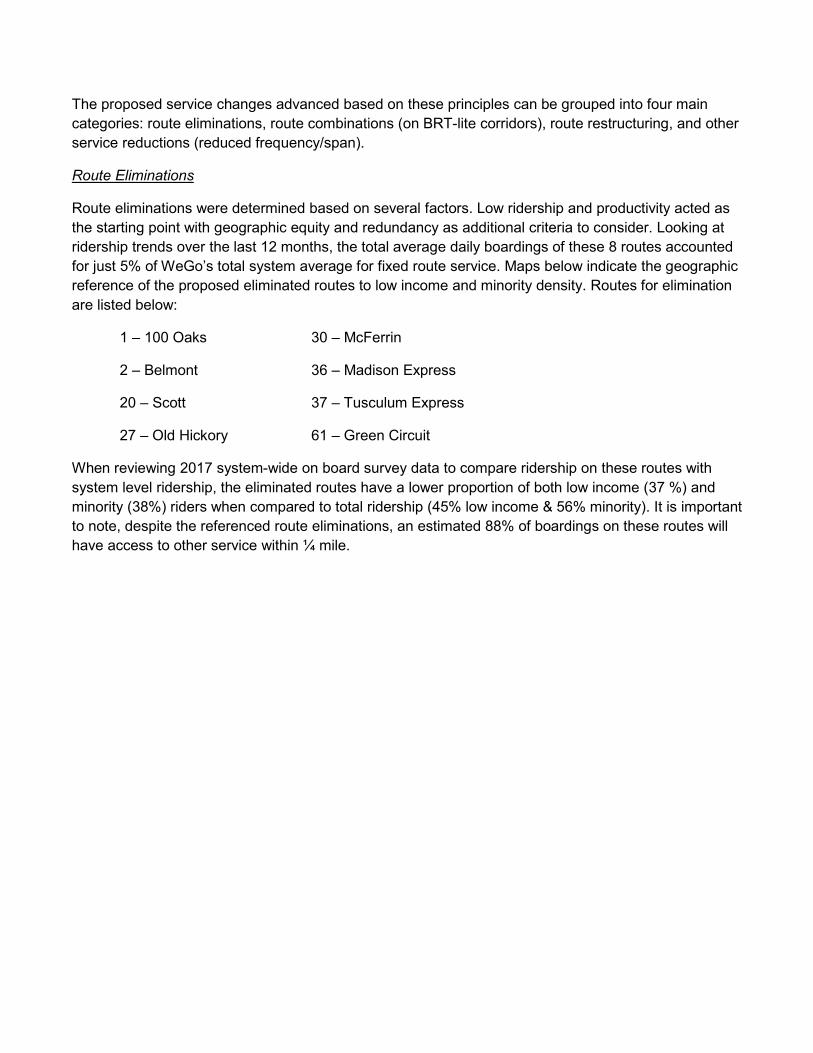
Route eliminations were determined based on several factors. Low ridership and productivity acted as the starting point with geographic equity and redundancy as additional criteria to consider. Looking at ridership trends over the last 12 months, the total average daily boardings of these 8 routes accounted for just 5% of WeGo’s total system average for fixed route service. Maps below indicate the geographic reference of the proposed eliminated routes to low income and minority density. Routes for elimination are listed below:
1 – 100 Oaks 30 – McFerrin
2 – Belmont 36 – Madison Express
20 – Scott 37 – Tusculum Express
27 – Old Hickory 61 – Green Circuit
When reviewing 2017 system-wide on board survey data to compare ridership on these routes with system level ridership, the eliminated routes have a lower proportion of both low income (37 %) and minority (38%) riders when compared to total ridership (45% low income & 56% minority). It is important to note, despite the referenced route eliminations, an estimated 88% of boardings on these routes will have access to other service within ¼ mile.
Eliminated Routes: Low Income Household Distribution
*Excludes express portions of routes which have no stops
Eliminated Routes: Minority Distribution
*Excludes express portions of routes which have no stops
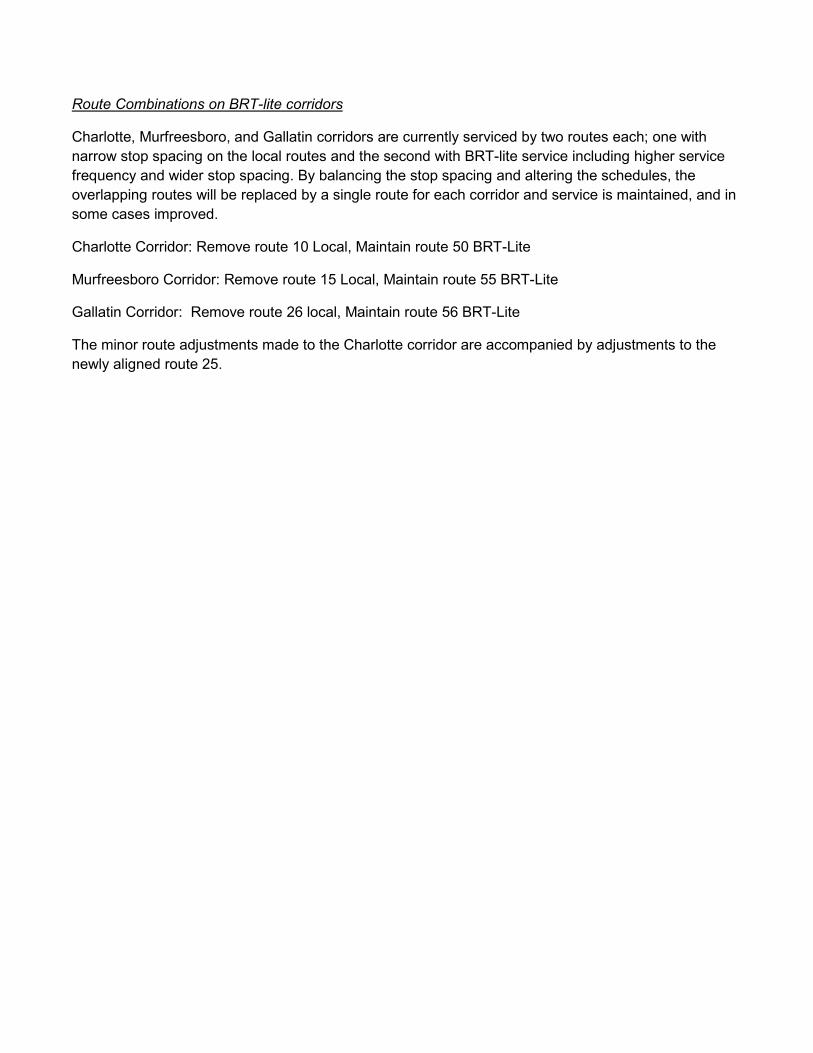
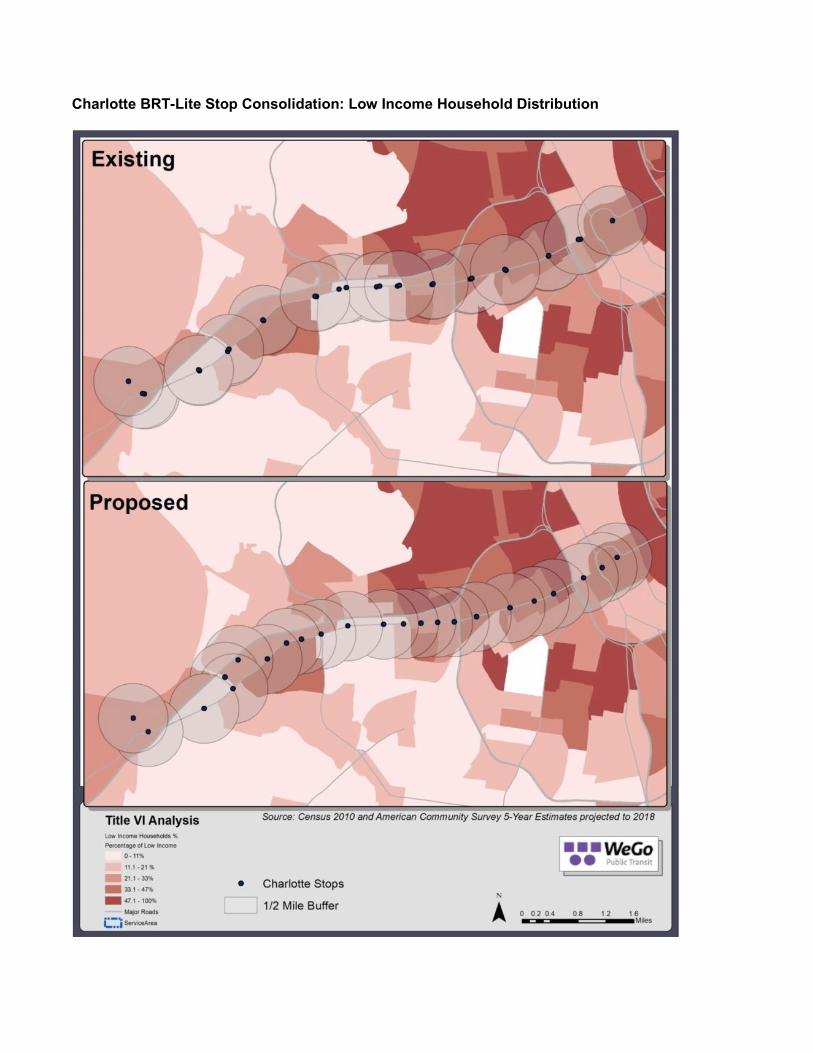
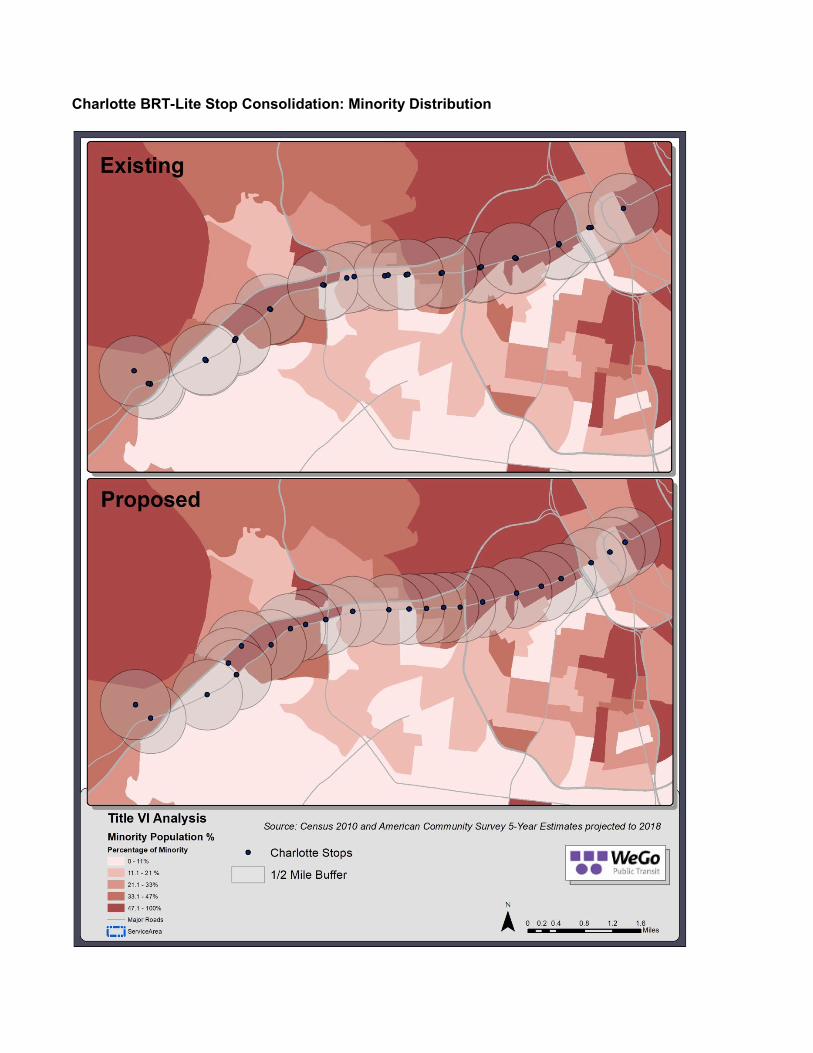
Route Combinations on BRT-lite corridors
Charlotte, Murfreesboro, and Gallatin corridors are currently serviced by two routes each; one with narrow stop spacing on the local routes and the second with BRT-lite service including higher service frequency and wider stop spacing. By balancing the stop spacing and altering the schedules, the overlapping routes will be replaced by a single route for each corridor and service is maintained, and in some cases improved.
Charlotte Corridor: Remove route 10 Local, Maintain route 50 BRT-Lite
Murfreesboro Corridor: Remove route 15 Local, Maintain route 55 BRT-Lite
Gallatin Corridor: Remove route 26 local, Maintain route 56 BRT-Lite
The minor route adjustments made to the Charlotte corridor are accompanied by adjustments to the newly aligned route 25.
Charlotte BRT-Lite Stop Consolidation: Low Income Household Distribution
Charlotte BRT-Lite Stop Consolidation: Minority Distribution
Murfreesboro BRT-Lite Stop Consolidation: Low Income Household Distribution
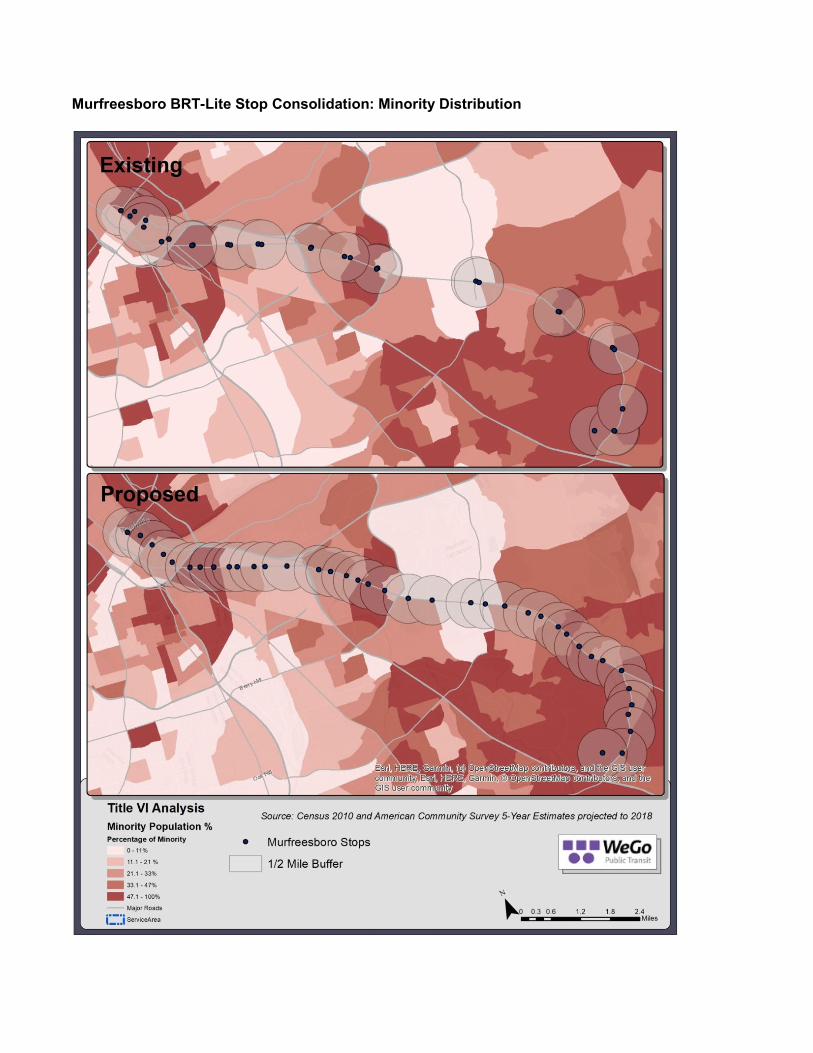
Murfreesboro BRT-Lite Stop Consolidation: Minority Distribution
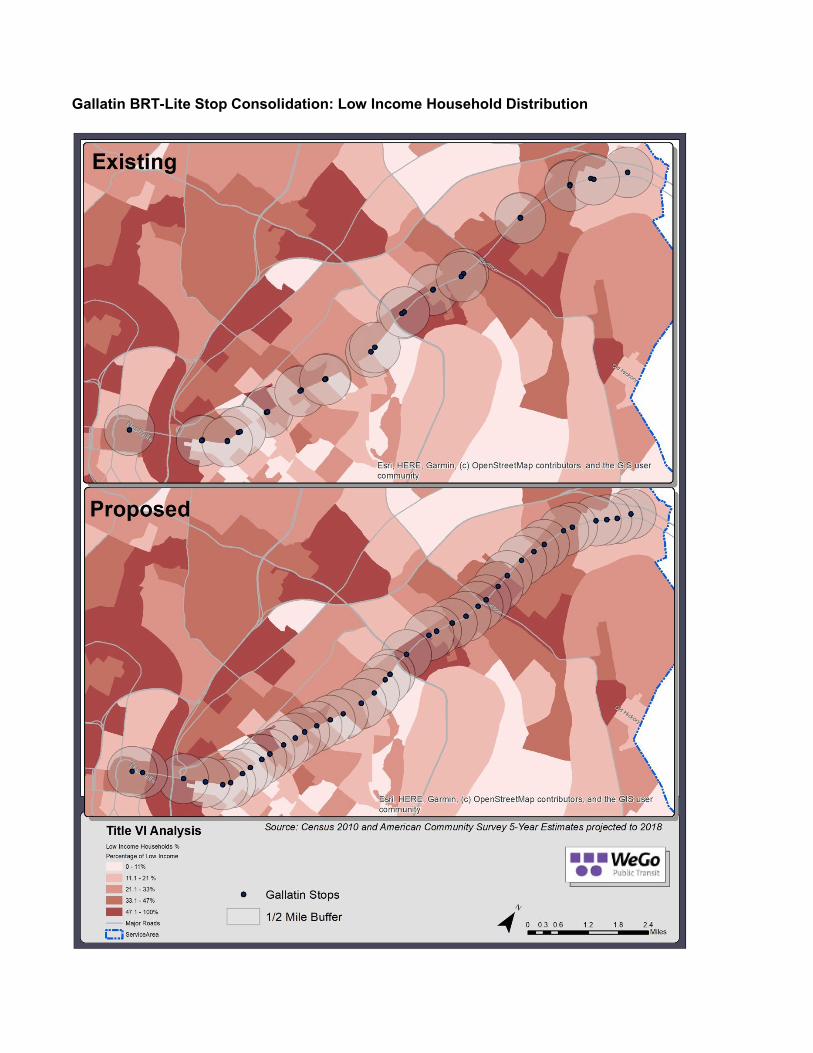
Gallatin BRT-Lite Stop Consolidation: Low Income Household Distribution
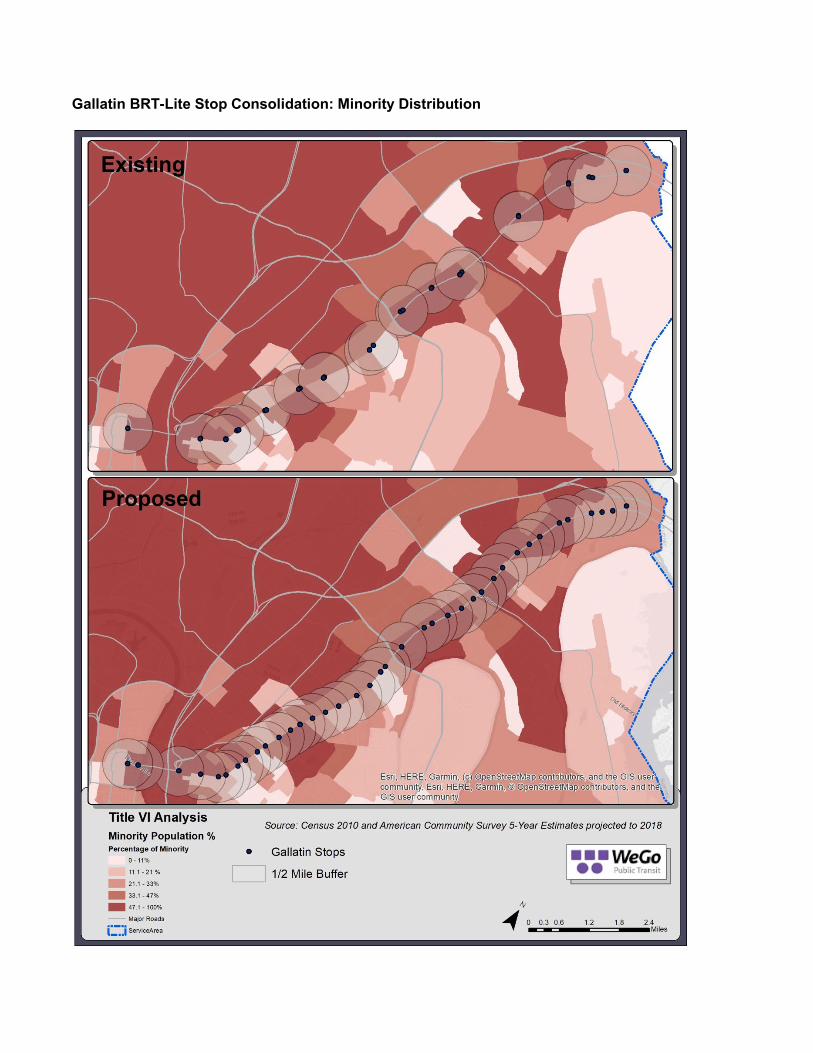
Gallatin BRT-Lite Stop Consolidation: Minority Distribution

Route Adjustments
While considering the impacts of eliminating 8 routes, route adjustments were made to help reduce the negative impacts of certain segments of the eliminated routes that contain higher ridership and no alternative. With this consideration in mind, route 4 was adjusted to service part of route 20, routes 21 and 25 were adjusted to service part of route 1, and route 28 was adjusted to service part of route 30. Route 29 has been reinstated to replace route 60 (free service – Green Circuit) to maintain downtown connections to TSU’s campus as a paid service.
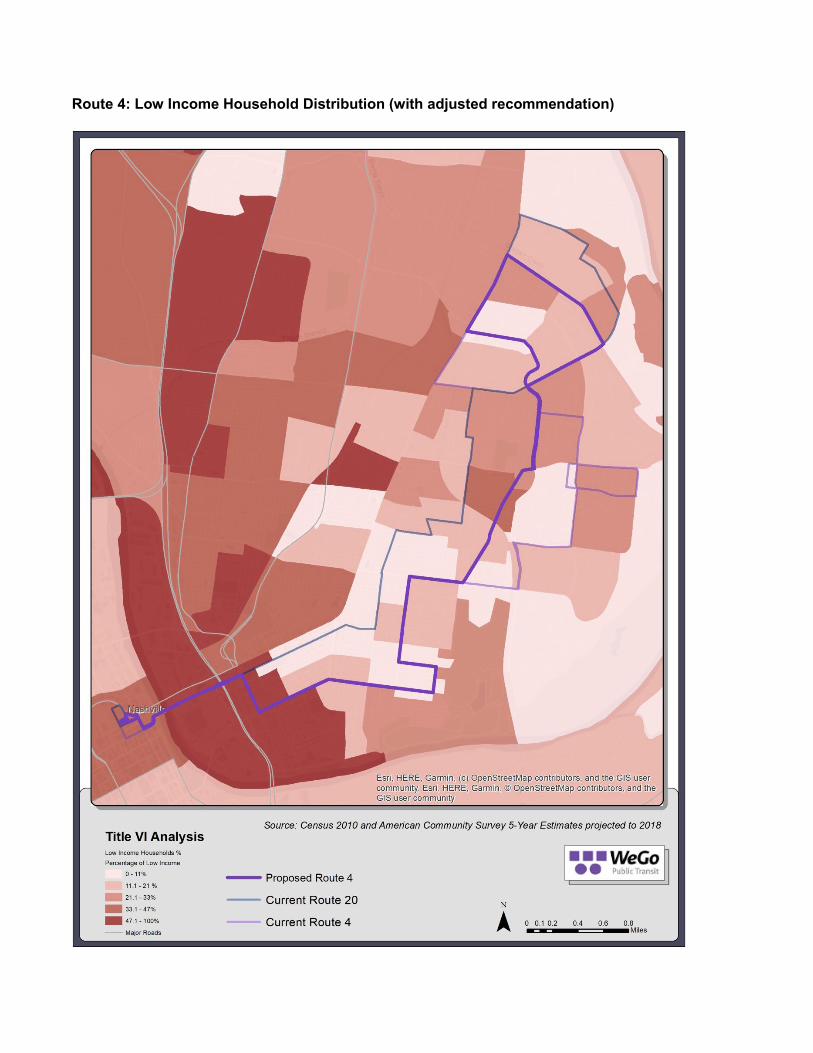
Route 4: Low Income Household Distribution (with adjusted recommendation)
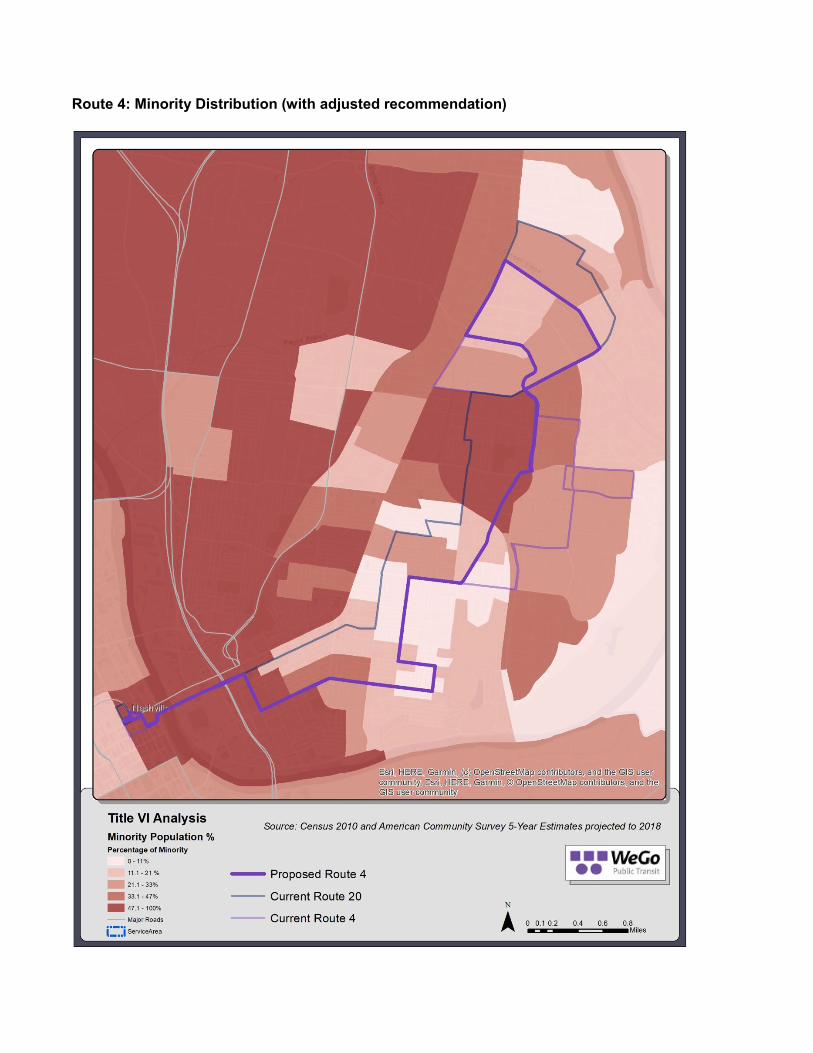
Route 4: Minority Distribution (with adjusted recommendation)
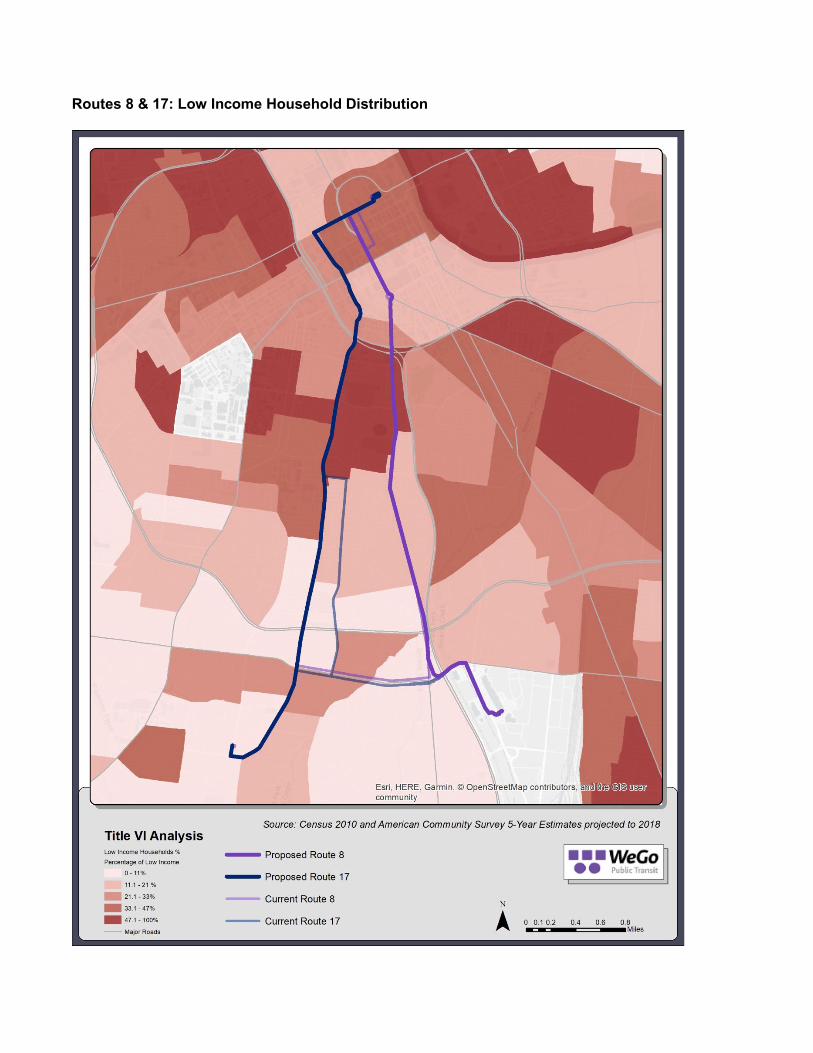
Routes 8 & 17: Low Income Household Distribution
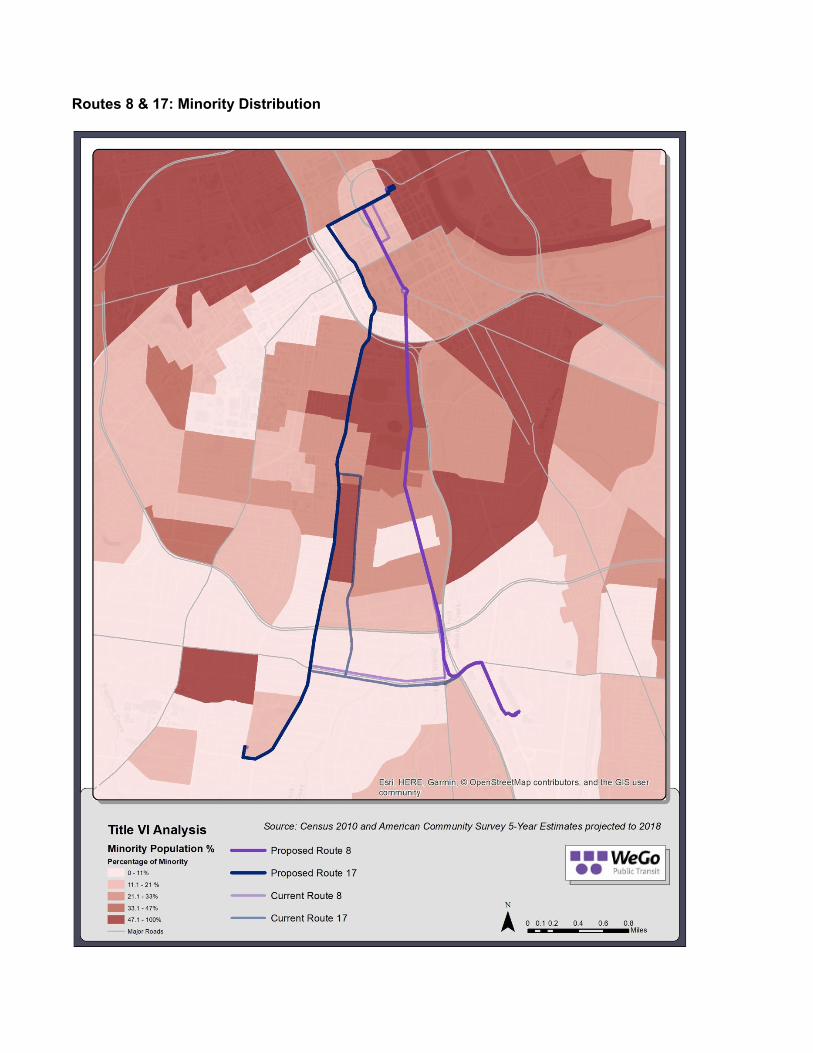
Routes 8 & 17: Minority Distribution
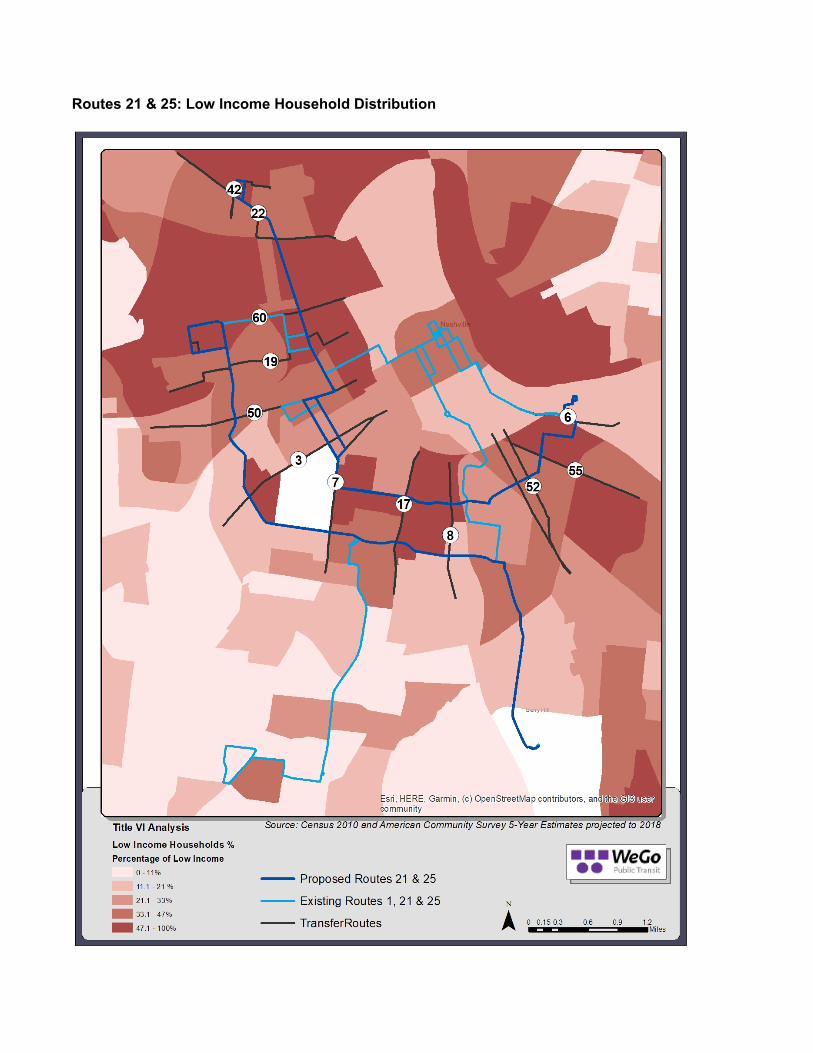
Routes 21 & 25: Low Income Household Distribution
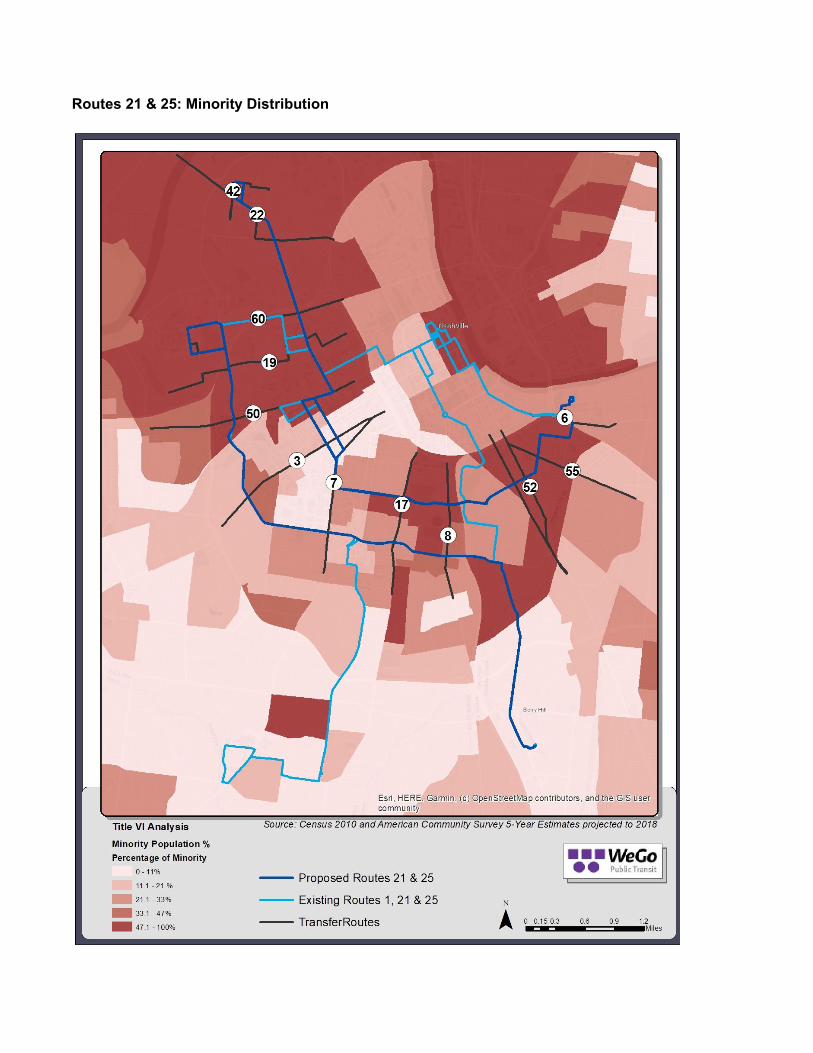
Routes 21 & 25: Minority Distribution
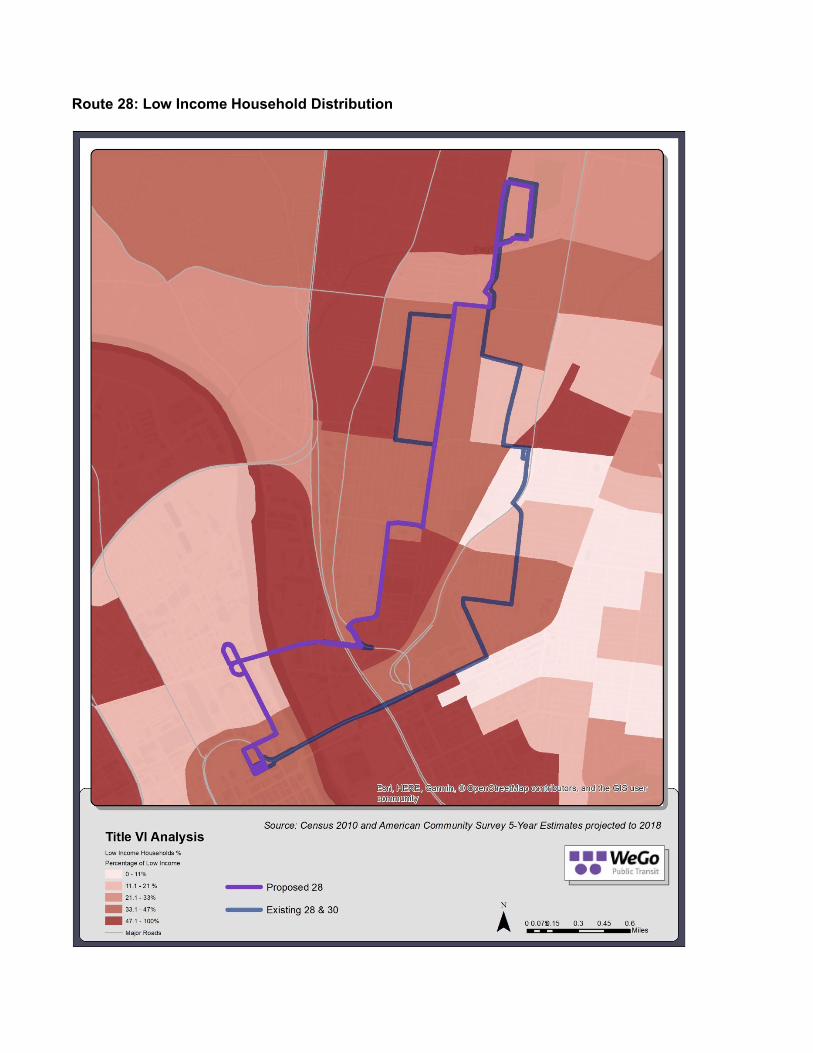
Route 28: Low Income Household Distribution
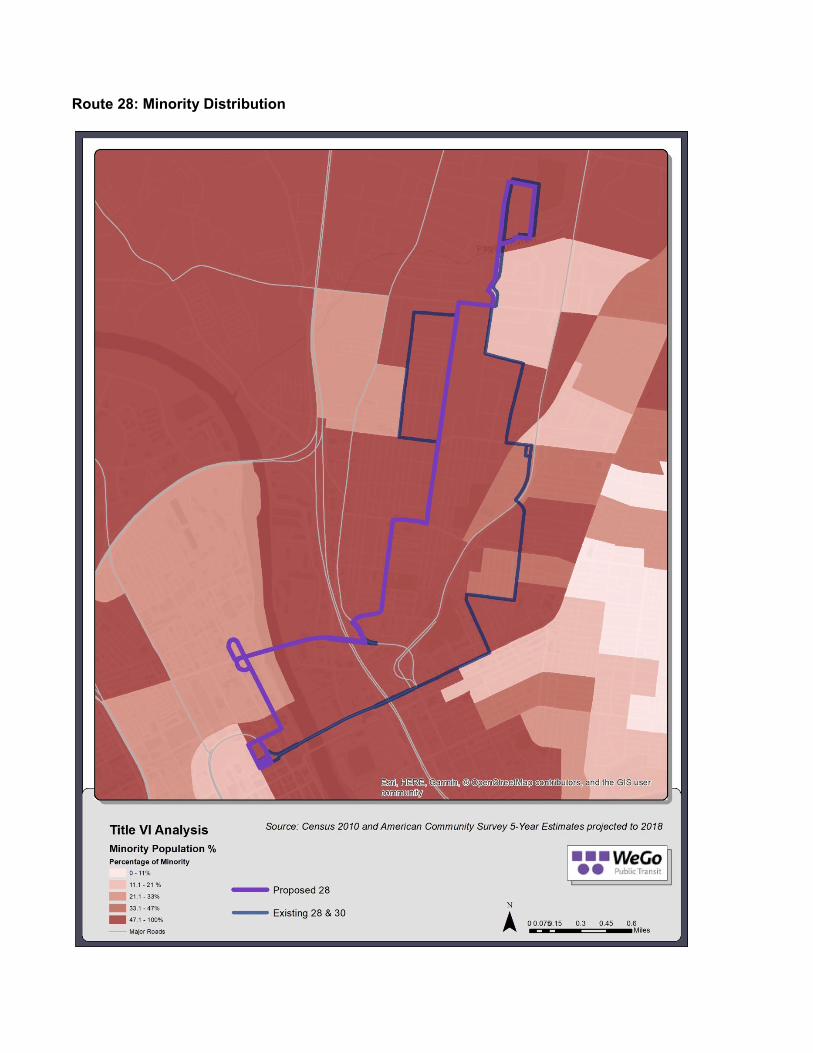
Route 28: Minority Distribution
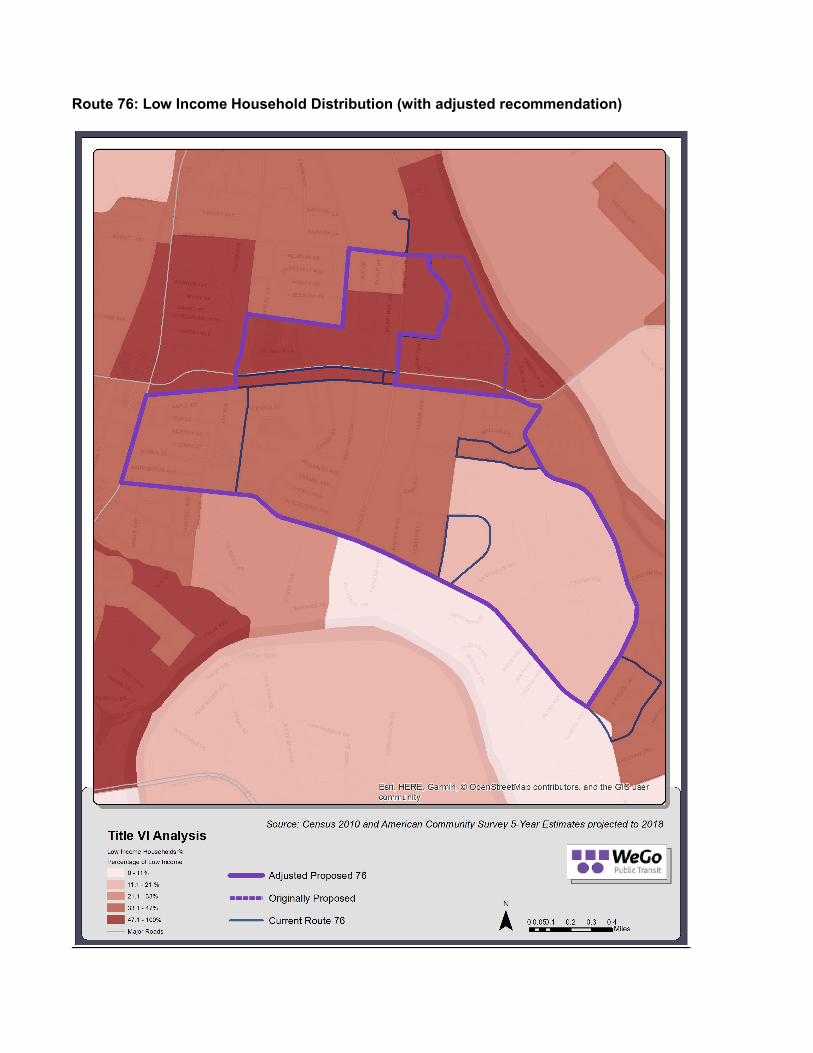
Route 76: Low Income Household Distribution (with adjusted recommendation)
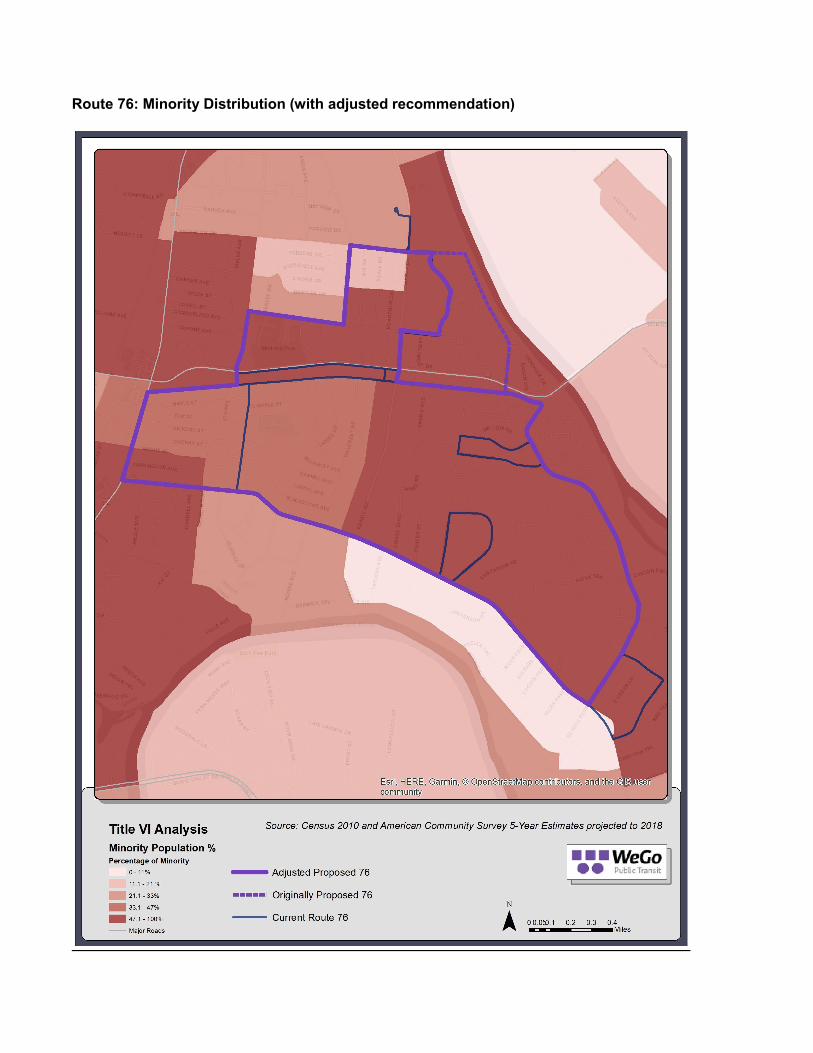
Route 76: Minority Distribution (with adjusted recommendation)
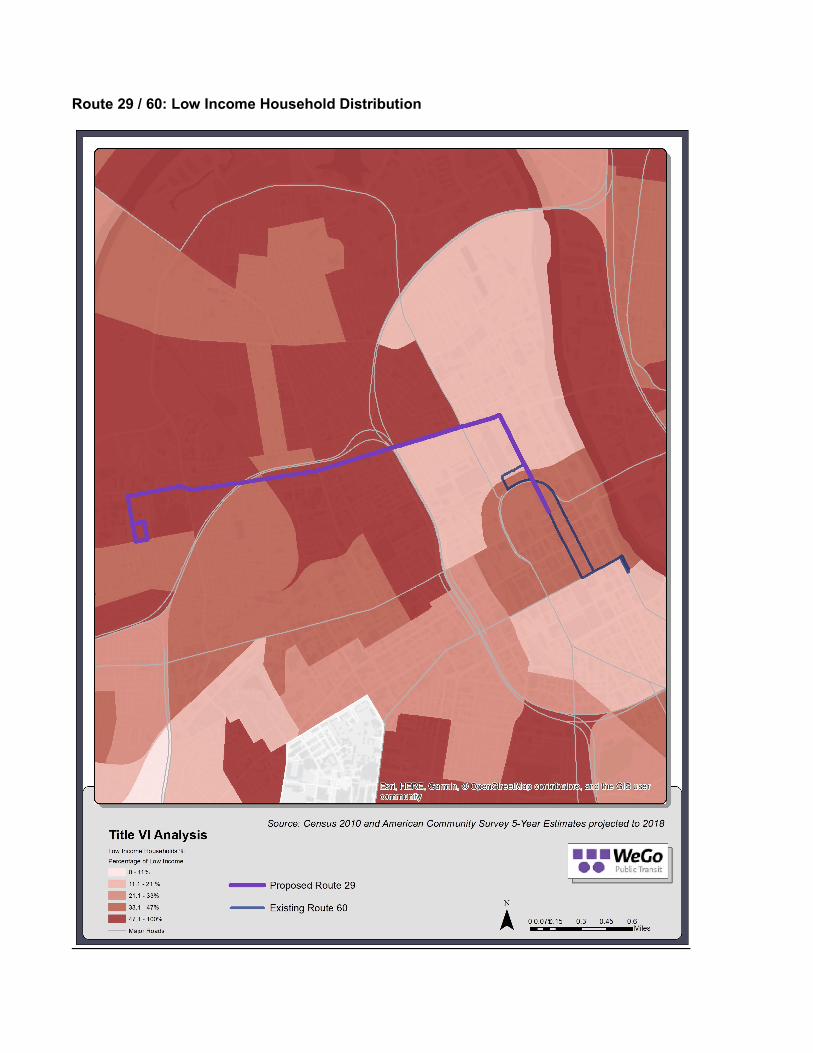
Route 29 / 60: Low Income Household Distribution
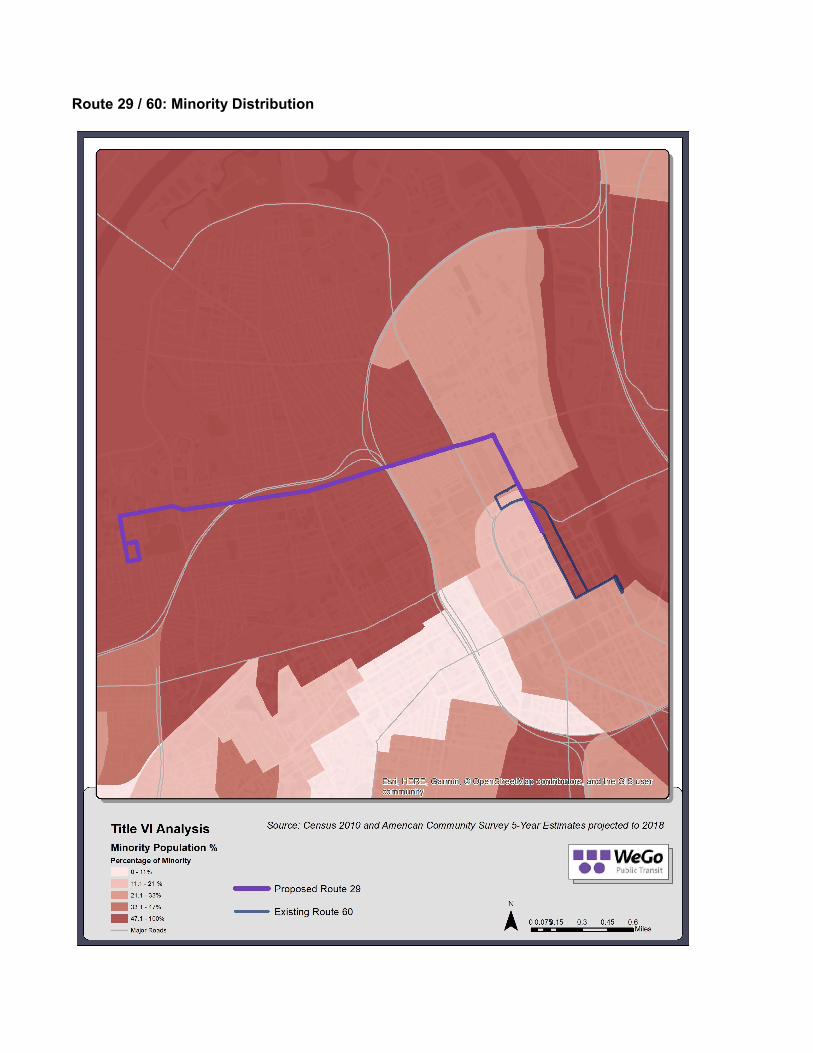
Route 29 / 60: Minority Distribution
Other service reductions
In some cases low productivity trips were identified for removal. The recommendations for service reduction included the following:
38 - Eliminate midday trip
72 - Remove Sunday service, end service earlier on weekdays and Saturdays, peak service to hourly
77 - Eliminate the 9:30 PM trip
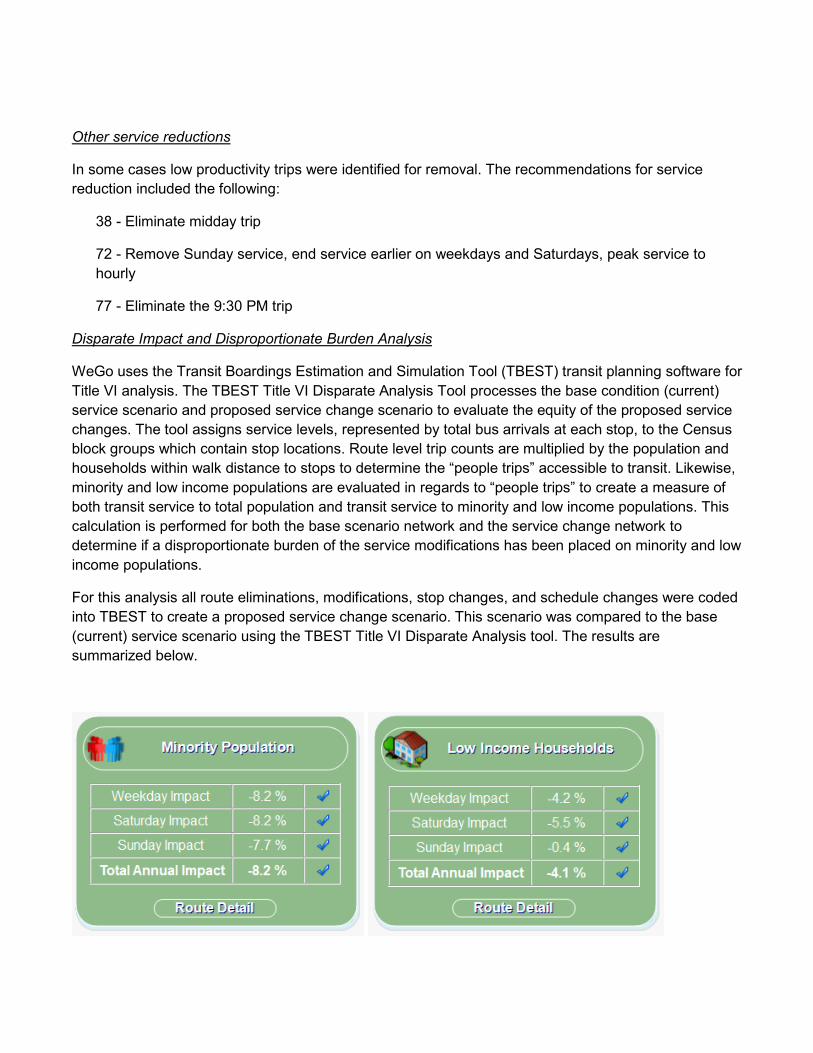
Disparate Impact and Disproportionate Burden Analysis
WeGo uses the Transit Boardings Estimation and Simulation Tool (TBEST) transit planning software for Title VI analysis. The TBEST Title VI Disparate Analysis Tool processes the base condition (current) service scenario and proposed service change scenario to evaluate the equity of the proposed service changes. The tool assigns service levels, represented by total bus arrivals at each stop, to the Census block groups which contain stop locations. Route level trip counts are multiplied by the population and households within walk distance to stops to determine the “people trips” accessible to transit. Likewise, minority and low income populations are evaluated in regards to “people trips” to create a measure of both transit service to total population and transit service to minority and low income populations. This calculation is performed for both the base scenario network and the service change network to determine if a disproportionate burden of the service modifications has been placed on minority and low income populations.
For this analysis all route eliminations, modifications, stop changes, and schedule changes were coded into TBEST to create a proposed service change scenario. This scenario was compared to the base (current) service scenario using the TBEST Title VI Disparate Analysis tool. The results are summarized below.
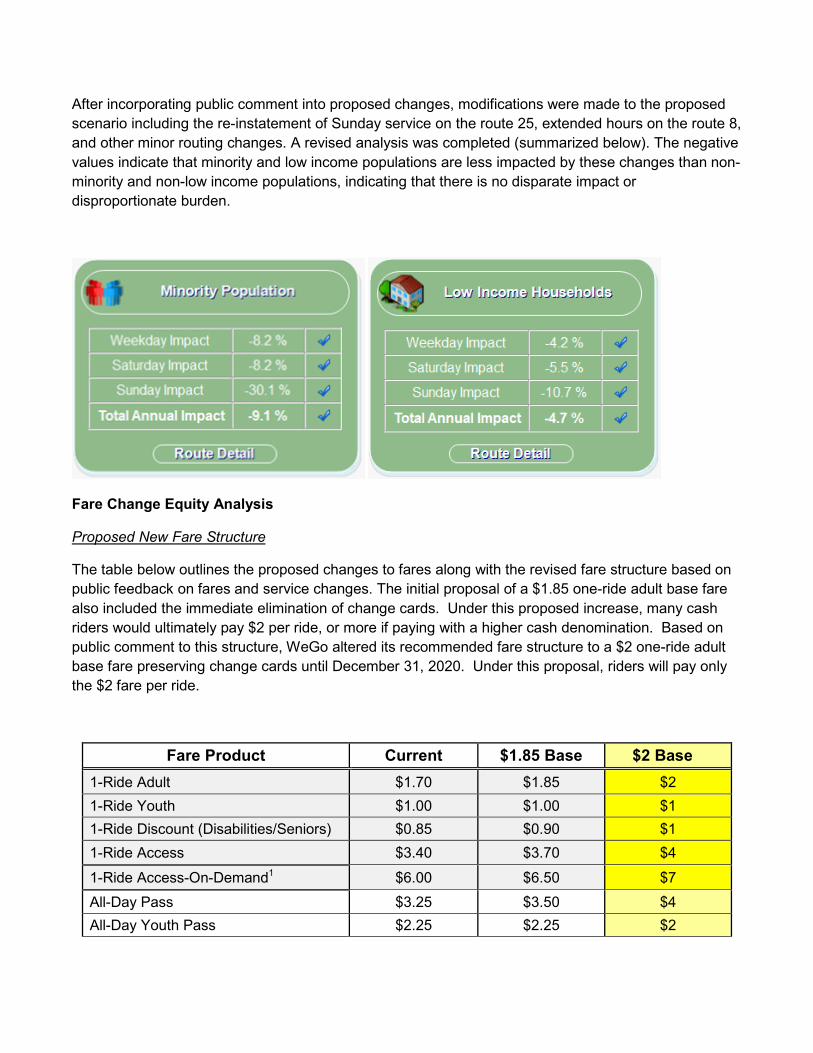
After incorporating public comment into proposed changes, modifications were made to the proposed scenario including the re-instatement of Sunday service on the route 25, extended hours on the route 8, and other minor routing changes. A revised analysis was completed (summarized below). The negative values indicate that minority and low income populations are less impacted by these changes than non-minority and non-low income populations, indicating that there is no disparate impact or disproportionate burden.
Fare Change Equity Analysis
Proposed New Fare Structure
The table below outlines the proposed changes to fares along with the revised fare structure based on public feedback on fares and service changes. The initial proposal of a $1.85 one-ride adult base fare also included the immediate elimination of change cards. Under this proposed increase, many cash riders would ultimately pay $2 per ride, or more if paying with a higher cash denomination. Based on public comment to this structure, WeGo altered its recommended fare structure to a $2 one-ride adult base fare preserving change cards until December 31, 2020. Under this proposal, riders will pay only the $2 fare per ride.
Fare Product Current $1.85 Base $2 Base 1-Ride Adult $1.70 $1.85 $2 1-Ride Youth $1.00 $1.00 $1 1-Ride Discount (Disabilities/Seniors) $0.85 $0.90 $1 1-Ride Access $3.40 $3.70 $4
1-Ride Access-On-Demand1 $6.00 $6.50 $7 All-Day Pass $3.25 $3.50 $4 All-Day Youth Pass $2.25 $2.25 $2
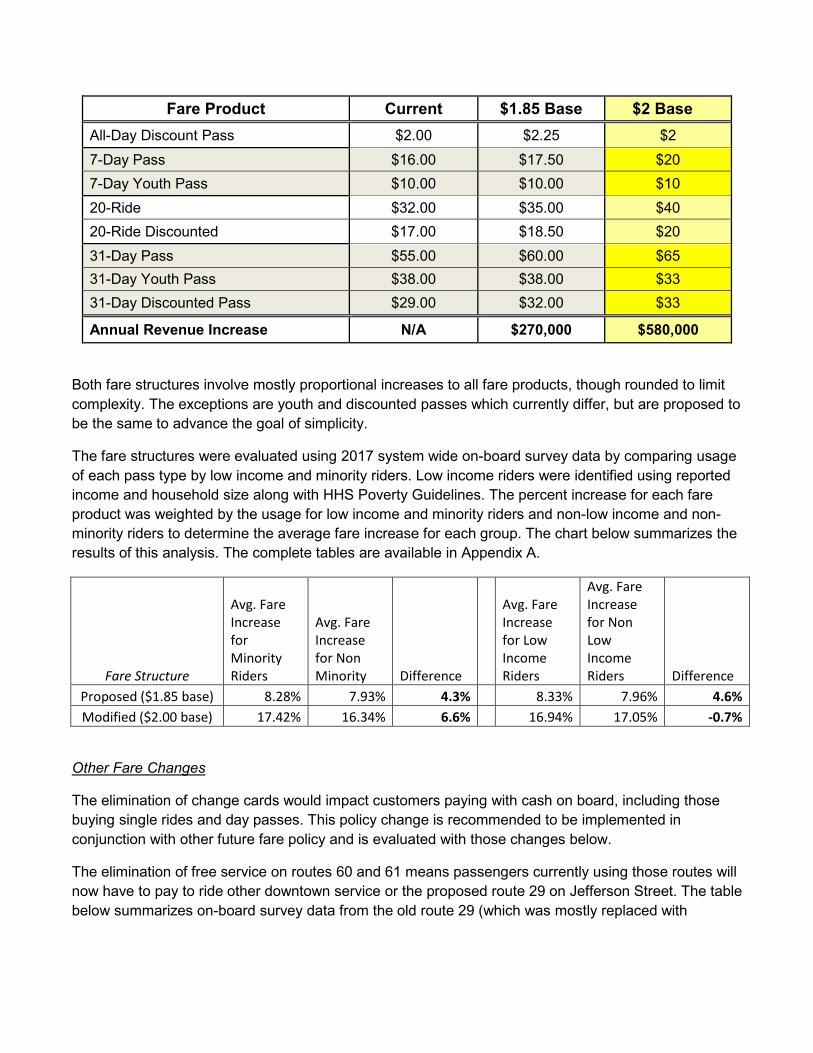
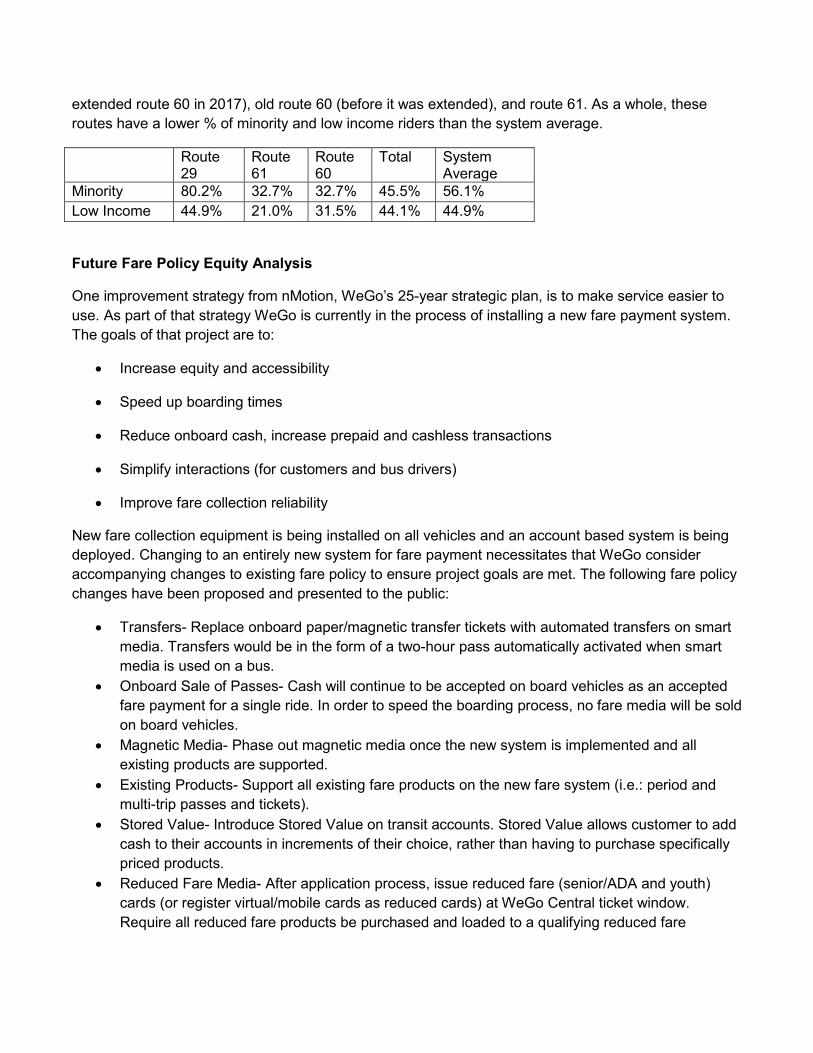
Fare Product Current $1.85 Base $2 Base All-Day Discount Pass $2.00 $2.25 $2 7-Day Pass $16.00 $17.50 $20 7-Day Youth Pass $10.00 $10.00 $10 20-Ride $32.00 $35.00 $40 20-Ride Discounted $17.00 $18.50 $20 31-Day Pass $55.00 $60.00 $65 31-Day Youth Pass $38.00 $38.00 $33 31-Day Discounted Pass $29.00 $32.00 $33
Annual Revenue Increase N/A $270,000 $580,000
Both fare structures involve mostly proportional increases to all fare products, though rounded to limit complexity. The exceptions are youth and discounted passes which currently differ, but are proposed to be the same to advance the goal of simplicity.
The fare structures were evaluated using 2017 system wide on-board survey data by comparing usage of each pass type by low income and minority riders. Low income riders were identified using reported income and household size along with HHS Poverty Guidelines. The percent increase for each fare product was weighted by the usage for low income and minority riders and non-low income and non-minority riders to determine the average fare increase for each group. The chart below summarizes the results of this analysis. The complete tables are available in Appendix A.
Fare Structure
Avg. Fare Increase for Minority Riders
Avg. Fare Increase for Non Minority Difference
Avg. Fare Increase for Low Income Riders
Avg. Fare Increase for Non Low Income Riders Difference
Proposed ($1.85 base) 8.28% 7.93% 4.3% 8.33% 7.96% 4.6% Modified ($2.00 base) 17.42% 16.34% 6.6% 16.94% 17.05% -0.7%
Other Fare Changes
The elimination of change cards would impact customers paying with cash on board, including those buying single rides and day passes. This policy change is recommended to be implemented in conjunction with other future fare policy and is evaluated with those changes below.
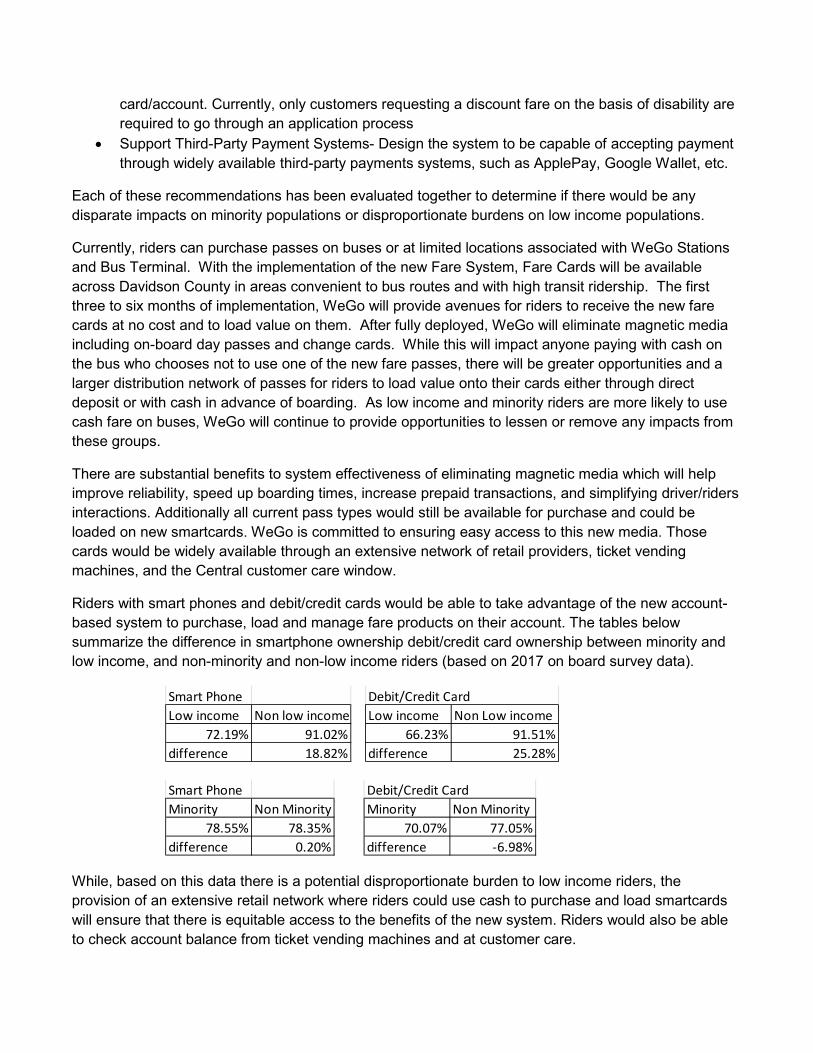
The elimination of free service on routes 60 and 61 means passengers currently using those routes will now have to pay to ride other downtown service or the proposed route 29 on Jefferson Street. The table below summarizes on-board survey data from the old route 29 (which was mostly replaced with
extended route 60 in 2017), old route 60 (before it was extended), and route 61. As a whole, these routes have a lower % of minority and low income riders than the system average.
Route 29
Route 61
Route 60
Total System Average
Minority 80.2% 32.7% 32.7% 45.5% 56.1% Low Income 44.9% 21.0% 31.5% 44.1% 44.9%
Future Fare Policy Equity Analysis
One improvement strategy from nMotion, WeGo’s 25-year strategic plan, is to make service easier to use. As part of that strategy WeGo is currently in the process of installing a new fare payment system. The goals of that project are to:
• Increase equity and accessibility
• Speed up boarding times
• Reduce onboard cash, increase prepaid and cashless transactions
• Simplify interactions (for customers and bus drivers)
• Improve fare collection reliability
New fare collection equipment is being installed on all vehicles and an account based system is being deployed. Changing to an entirely new system for fare payment necessitates that WeGo consider accompanying changes to existing fare policy to ensure project goals are met. The following fare policy changes have been proposed and presented to the public:
• Transfers- Replace onboard paper/magnetic transfer tickets with automated transfers on smart media. Transfers would be in the form of a two-hour pass automatically activated when smart media is used on a bus.
• Onboard Sale of Passes- Cash will continue to be accepted on board vehicles as an accepted fare payment for a single ride. In order to speed the boarding process, no fare media will be sold on board vehicles.
• Magnetic Media- Phase out magnetic media once the new system is implemented and all existing products are supported.
• Existing Products- Support all existing fare products on the new fare system (i.e.: period and multi-trip passes and tickets).
• Stored Value- Introduce Stored Value on transit accounts. Stored Value allows customer to add cash to their accounts in increments of their choice, rather than having to purchase specifically priced products.
• Reduced Fare Media- After application process, issue reduced fare (senior/ADA and youth) cards (or register virtual/mobile cards as reduced cards) at WeGo Central ticket window. Require all reduced fare products be purchased and loaded to a qualifying reduced fare
card/account. Currently, only customers requesting a discount fare on the basis of disability are required to go through an application process
• Support Third-Party Payment Systems- Design the system to be capable of accepting payment through widely available third-party payments systems, such as ApplePay, Google Wallet, etc.
Each of these recommendations has been evaluated together to determine if there would be any disparate impacts on minority populations or disproportionate burdens on low income populations.
Currently, riders can purchase passes on buses or at limited locations associated with WeGo Stations and Bus Terminal. With the implementation of the new Fare System, Fare Cards will be available across Davidson County in areas convenient to bus routes and with high transit ridership. The first three to six months of implementation, WeGo will provide avenues for riders to receive the new fare cards at no cost and to load value on them. After fully deployed, WeGo will eliminate magnetic media including on-board day passes and change cards. While this will impact anyone paying with cash on the bus who chooses not to use one of the new fare passes, there will be greater opportunities and a larger distribution network of passes for riders to load value onto their cards either through direct deposit or with cash in advance of boarding. As low income and minority riders are more likely to use cash fare on buses, WeGo will continue to provide opportunities to lessen or remove any impacts from these groups.
There are substantial benefits to system effectiveness of eliminating magnetic media which will help improve reliability, speed up boarding times, increase prepaid transactions, and simplifying driver/riders interactions. Additionally all current pass types would still be available for purchase and could be loaded on new smartcards. WeGo is committed to ensuring easy access to this new media. Those cards would be widely available through an extensive network of retail providers, ticket vending machines, and the Central customer care window.
Riders with smart phones and debit/credit cards would be able to take advantage of the new account-based system to purchase, load and manage fare products on their account. The tables below summarize the difference in smartphone ownership debit/credit card ownership between minority and low income, and non-minority and non-low income riders (based on 2017 on board survey data).
While, based on this data there is a potential disproportionate burden to low income riders, the provision of an extensive retail network where riders could use cash to purchase and load smartcards will ensure that there is equitable access to the benefits of the new system. Riders would also be able to check account balance from ticket vending machines and at customer care.
Smart Phone Low income Non low income
72.19% 91.02%difference 18.82%
Debit/Credit CardLow income Non Low income
66.23% 91.51%difference 25.28%
Smart Phone Minority Non Minority
78.55% 78.35%difference 0.20%
Debit/Credit CardMinority Non Minority
70.07% 77.05%difference -6.98%

Considered together, the various policy changes to take place as part of the new fare collection system produce no disparate impact or disproportionate burden.
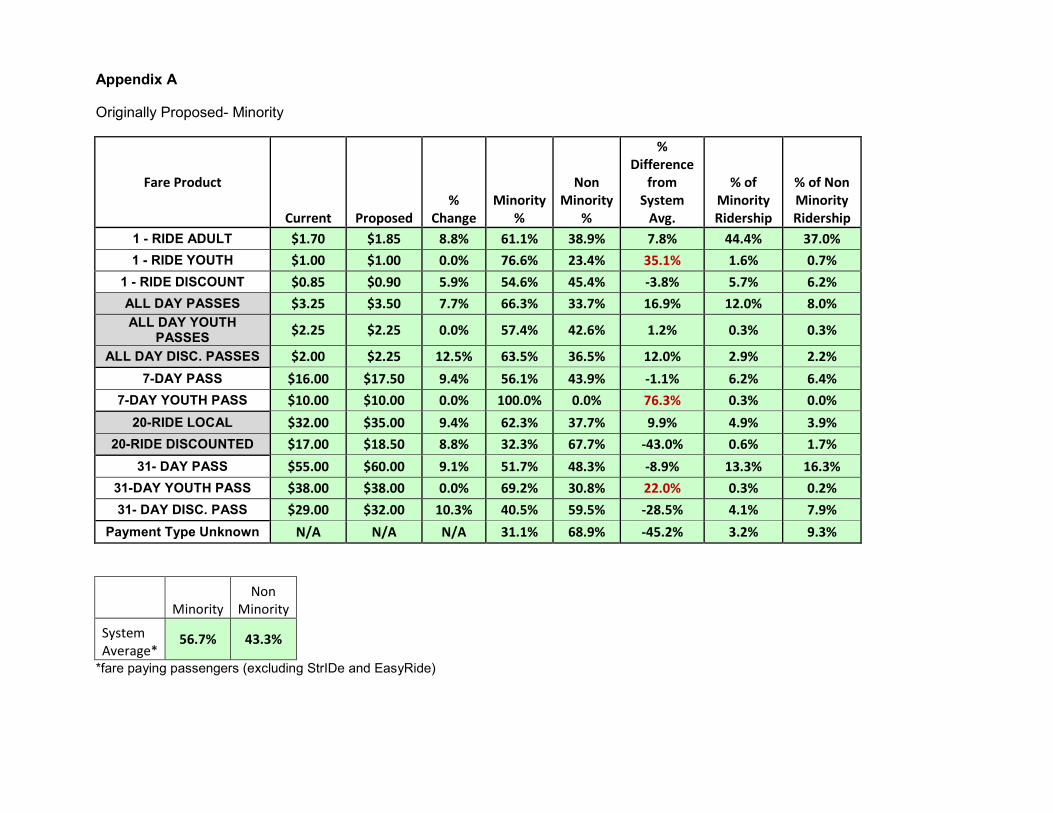
Appendix A
Originally Proposed- Minority
Fare Product
Current Proposed %
Change Minority
%
Non Minority
%
% Difference
from System
Avg.
% of Minority Ridership
% of Non Minority Ridership
1 - RIDE ADULT $1.70 $1.85 8.8% 61.1% 38.9% 7.8% 44.4% 37.0% 1 - RIDE YOUTH $1.00 $1.00 0.0% 76.6% 23.4% 35.1% 1.6% 0.7%
1 - RIDE DISCOUNT $0.85 $0.90 5.9% 54.6% 45.4% -3.8% 5.7% 6.2% ALL DAY PASSES $3.25 $3.50 7.7% 66.3% 33.7% 16.9% 12.0% 8.0% ALL DAY YOUTH
PASSES $2.25 $2.25 0.0% 57.4% 42.6% 1.2% 0.3% 0.3%
ALL DAY DISC. PASSES $2.00 $2.25 12.5% 63.5% 36.5% 12.0% 2.9% 2.2% 7-DAY PASS $16.00 $17.50 9.4% 56.1% 43.9% -1.1% 6.2% 6.4%
7-DAY YOUTH PASS $10.00 $10.00 0.0% 100.0% 0.0% 76.3% 0.3% 0.0% 20-RIDE LOCAL $32.00 $35.00 9.4% 62.3% 37.7% 9.9% 4.9% 3.9%
20-RIDE DISCOUNTED $17.00 $18.50 8.8% 32.3% 67.7% -43.0% 0.6% 1.7% 31- DAY PASS $55.00 $60.00 9.1% 51.7% 48.3% -8.9% 13.3% 16.3%
31-DAY YOUTH PASS $38.00 $38.00 0.0% 69.2% 30.8% 22.0% 0.3% 0.2% 31- DAY DISC. PASS $29.00 $32.00 10.3% 40.5% 59.5% -28.5% 4.1% 7.9%
Payment Type Unknown N/A N/A N/A 31.1% 68.9% -45.2% 3.2% 9.3%
Minority
Non Minority
System Average*
56.7% 43.3%
*fare paying passengers (excluding StrIDe and EasyRide)
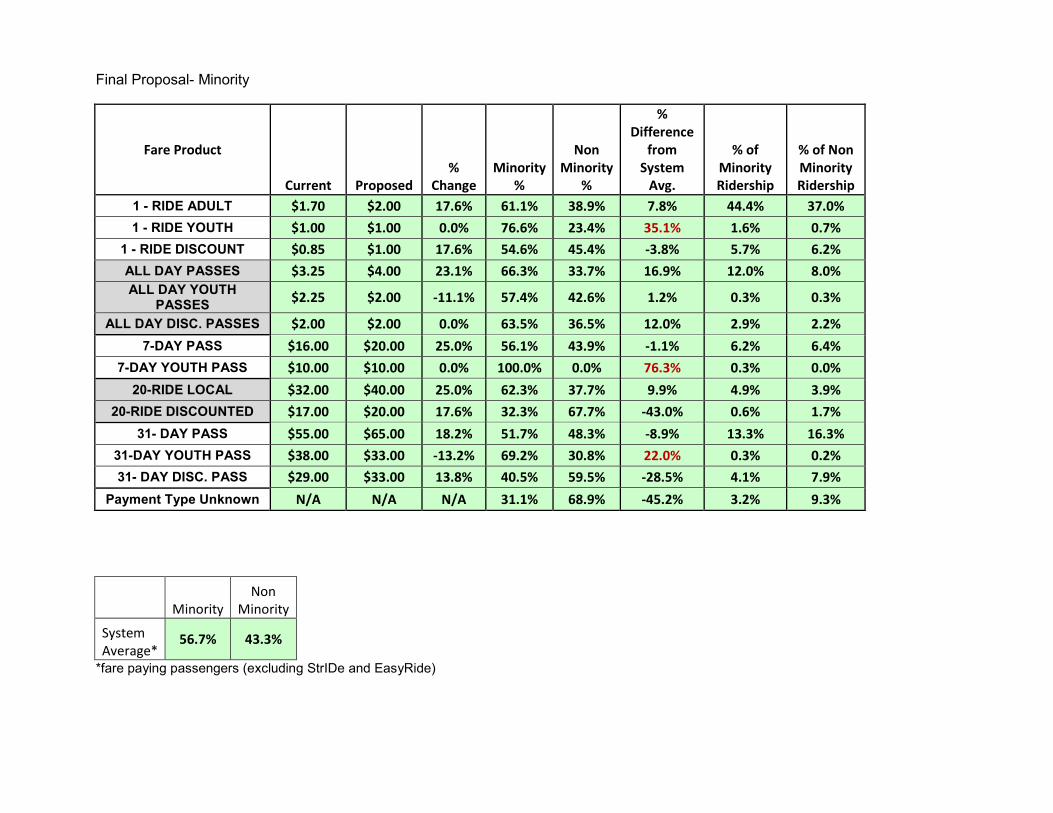
Final Proposal- Minority
Fare Product
Current Proposed %
Change Minority
%
Non Minority
%
% Difference
from System
Avg.
% of Minority Ridership
% of Non Minority Ridership
1 - RIDE ADULT $1.70 $2.00 17.6% 61.1% 38.9% 7.8% 44.4% 37.0% 1 - RIDE YOUTH $1.00 $1.00 0.0% 76.6% 23.4% 35.1% 1.6% 0.7%
1 - RIDE DISCOUNT $0.85 $1.00 17.6% 54.6% 45.4% -3.8% 5.7% 6.2% ALL DAY PASSES $3.25 $4.00 23.1% 66.3% 33.7% 16.9% 12.0% 8.0% ALL DAY YOUTH
PASSES $2.25 $2.00 -11.1% 57.4% 42.6% 1.2% 0.3% 0.3%
ALL DAY DISC. PASSES $2.00 $2.00 0.0% 63.5% 36.5% 12.0% 2.9% 2.2% 7-DAY PASS $16.00 $20.00 25.0% 56.1% 43.9% -1.1% 6.2% 6.4%
7-DAY YOUTH PASS $10.00 $10.00 0.0% 100.0% 0.0% 76.3% 0.3% 0.0% 20-RIDE LOCAL $32.00 $40.00 25.0% 62.3% 37.7% 9.9% 4.9% 3.9%
20-RIDE DISCOUNTED $17.00 $20.00 17.6% 32.3% 67.7% -43.0% 0.6% 1.7% 31- DAY PASS $55.00 $65.00 18.2% 51.7% 48.3% -8.9% 13.3% 16.3%
31-DAY YOUTH PASS $38.00 $33.00 -13.2% 69.2% 30.8% 22.0% 0.3% 0.2% 31- DAY DISC. PASS $29.00 $33.00 13.8% 40.5% 59.5% -28.5% 4.1% 7.9%
Payment Type Unknown N/A N/A N/A 31.1% 68.9% -45.2% 3.2% 9.3%
Minority
Non Minority
System Average*
56.7% 43.3%
*fare paying passengers (excluding StrIDe and EasyRide)
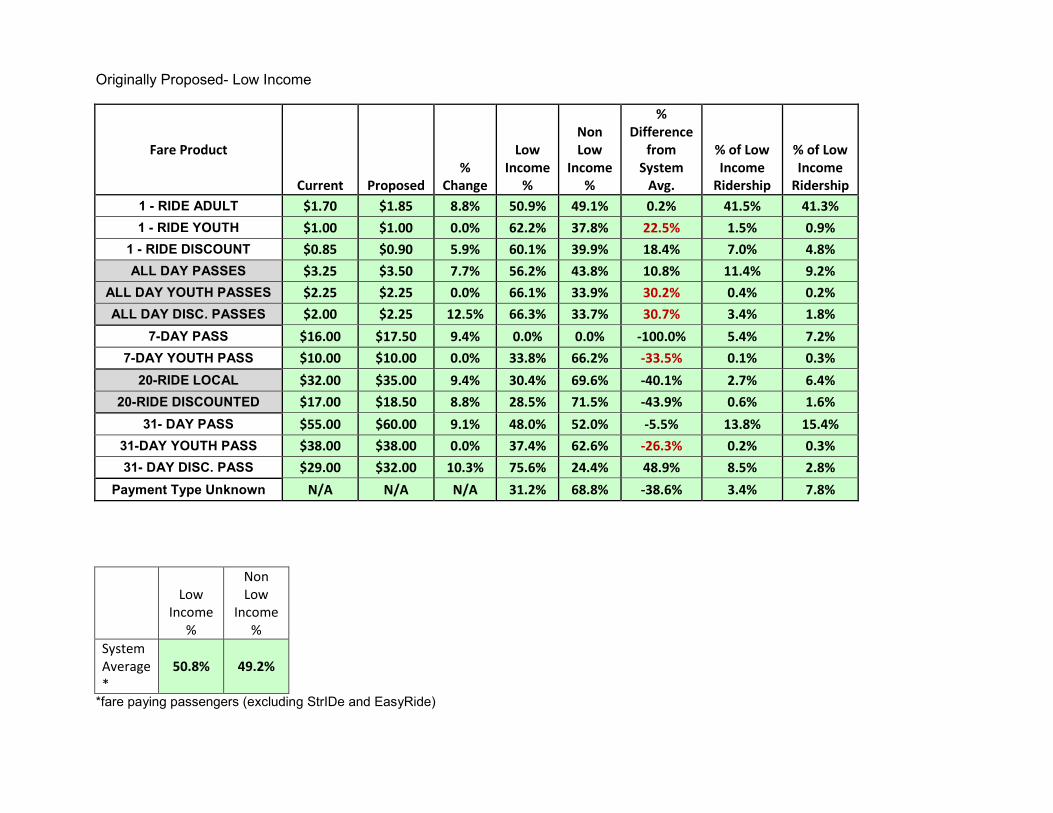
Originally Proposed- Low Income
Fare Product
Current Proposed %
Change
Low Income
%
Non Low
Income %
% Difference
from System
Avg.
% of Low Income
Ridership
% of Low Income
Ridership 1 - RIDE ADULT $1.70 $1.85 8.8% 50.9% 49.1% 0.2% 41.5% 41.3% 1 - RIDE YOUTH $1.00 $1.00 0.0% 62.2% 37.8% 22.5% 1.5% 0.9%
1 - RIDE DISCOUNT $0.85 $0.90 5.9% 60.1% 39.9% 18.4% 7.0% 4.8% ALL DAY PASSES $3.25 $3.50 7.7% 56.2% 43.8% 10.8% 11.4% 9.2%
ALL DAY YOUTH PASSES $2.25 $2.25 0.0% 66.1% 33.9% 30.2% 0.4% 0.2% ALL DAY DISC. PASSES $2.00 $2.25 12.5% 66.3% 33.7% 30.7% 3.4% 1.8%
7-DAY PASS $16.00 $17.50 9.4% 0.0% 0.0% -100.0% 5.4% 7.2% 7-DAY YOUTH PASS $10.00 $10.00 0.0% 33.8% 66.2% -33.5% 0.1% 0.3%
20-RIDE LOCAL $32.00 $35.00 9.4% 30.4% 69.6% -40.1% 2.7% 6.4% 20-RIDE DISCOUNTED $17.00 $18.50 8.8% 28.5% 71.5% -43.9% 0.6% 1.6%
31- DAY PASS $55.00 $60.00 9.1% 48.0% 52.0% -5.5% 13.8% 15.4% 31-DAY YOUTH PASS $38.00 $38.00 0.0% 37.4% 62.6% -26.3% 0.2% 0.3% 31- DAY DISC. PASS $29.00 $32.00 10.3% 75.6% 24.4% 48.9% 8.5% 2.8%
Payment Type Unknown N/A N/A N/A 31.2% 68.8% -38.6% 3.4% 7.8%
Low Income
%
Non Low
Income %
System Average *
50.8% 49.2%
*fare paying passengers (excluding StrIDe and EasyRide)
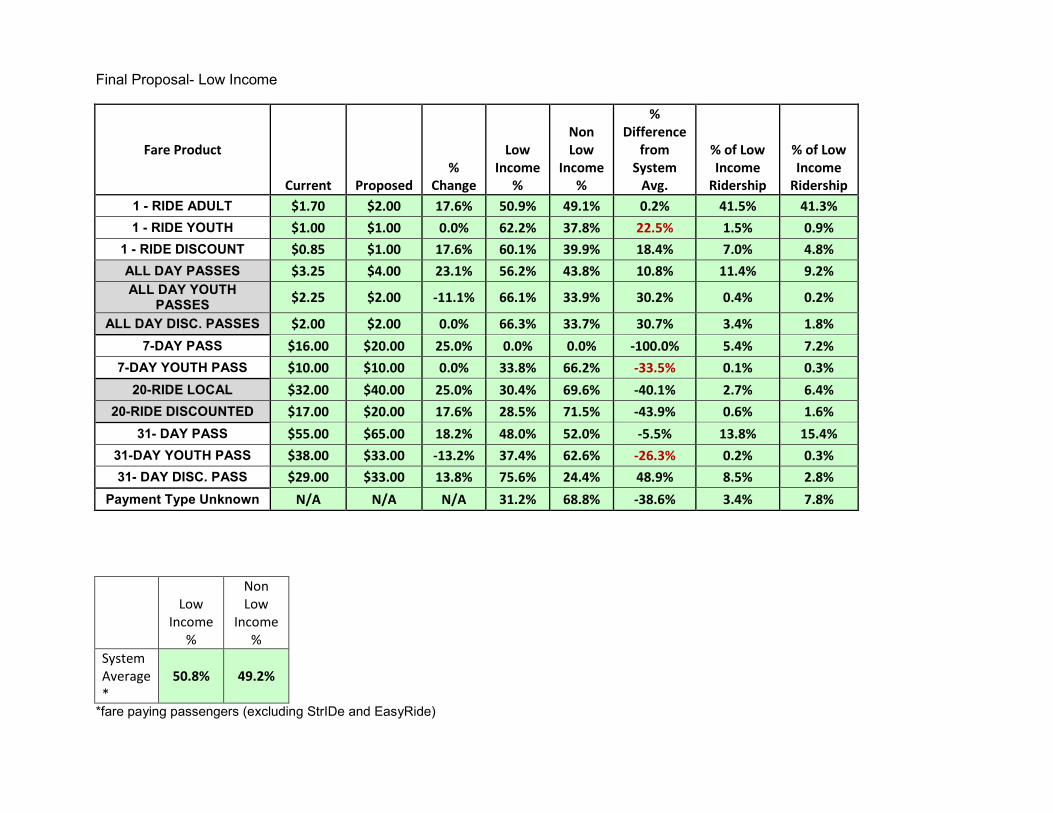
Final Proposal- Low Income
Fare Product
Current Proposed %
Change
Low Income
%
Non Low
Income %
% Difference
from System
Avg.
% of Low Income
Ridership
% of Low Income
Ridership 1 - RIDE ADULT $1.70 $2.00 17.6% 50.9% 49.1% 0.2% 41.5% 41.3% 1 - RIDE YOUTH $1.00 $1.00 0.0% 62.2% 37.8% 22.5% 1.5% 0.9%
1 - RIDE DISCOUNT $0.85 $1.00 17.6% 60.1% 39.9% 18.4% 7.0% 4.8% ALL DAY PASSES $3.25 $4.00 23.1% 56.2% 43.8% 10.8% 11.4% 9.2% ALL DAY YOUTH
PASSES $2.25 $2.00 -11.1% 66.1% 33.9% 30.2% 0.4% 0.2%
ALL DAY DISC. PASSES $2.00 $2.00 0.0% 66.3% 33.7% 30.7% 3.4% 1.8% 7-DAY PASS $16.00 $20.00 25.0% 0.0% 0.0% -100.0% 5.4% 7.2%
7-DAY YOUTH PASS $10.00 $10.00 0.0% 33.8% 66.2% -33.5% 0.1% 0.3% 20-RIDE LOCAL $32.00 $40.00 25.0% 30.4% 69.6% -40.1% 2.7% 6.4%
20-RIDE DISCOUNTED $17.00 $20.00 17.6% 28.5% 71.5% -43.9% 0.6% 1.6% 31- DAY PASS $55.00 $65.00 18.2% 48.0% 52.0% -5.5% 13.8% 15.4%
31-DAY YOUTH PASS $38.00 $33.00 -13.2% 37.4% 62.6% -26.3% 0.2% 0.3% 31- DAY DISC. PASS $29.00 $33.00 13.8% 75.6% 24.4% 48.9% 8.5% 2.8%
Payment Type Unknown N/A N/A N/A 31.2% 68.8% -38.6% 3.4% 7.8%
Low Income
%
Non Low
Income %
System Average *
50.8% 49.2%
*fare paying passengers (excluding StrIDe and EasyRide)


![[WeGO] Jakarta2](https://img.pdfslide.net/doc/110x75/55920a221a28ab1b178b46d2/wego-jakarta2.jpg)


![[WeGO] Ulyanovsk](https://img.pdfslide.net/doc/110x75/559c40371a28ab07518b45b1/wego-ulyanovsk.jpg)
![[WeGO] Jakarta1](https://img.pdfslide.net/doc/110x75/55862664d8b42a32618b4652/wego-jakarta1.jpg)