Embed Size (px)
Citation preview

Welcome tothe New WorldMTN Group LimitedFinal results for the year ended 31 December 2012

01Strategic and operational overviewSifiso DabengwaGroup President and CEO
02Financial overviewNazir PatelGroup Chief Financial Officer
03Looking aheadSifiso DabengwaGroup President and CEO
Agenda

Strategic and operational overview

Creating and managing stakeholder valueCreating value for our shareholders, employees and communities in a sustainable way and in accordance with the values of MTN
Innovation and best practiceOperating under the principle of innovation in everything we do and looking for opportunities to share and apply best practices
Creating a distinct customer experience
Driving sustainable growth
Transforming our operating model
A unique MTN branded user experience that is based on understanding and segmenting our customers
Driving growth in voice while developing new opportunities in data, enterprise and other opportunistic sectors as our markets mature
Allow our front office functions to be more customer focusedthrough more responsive, supportive and efficient back office functions
MTN vision and mission
4
Our vision:To lead the deliveryof a bold, newDigital World toour customers
Our mission:To make ourcustomers’ lives awhole lot brighter

Strategic considerationsCreating a distinct customer experience
Brandpreference
Network quality
Efficient distribution
Experienced people
Voice and
CustomerExperience
5
Effectivesegmentation
and customeranalytics
dataservices

Strategic considerations
Voice
Driving sustainable growth
6
Data and related services ICT evolution
− Billed traffic volumes increased 24.6% YoY supported by ongoing customer engagement
− Voice revenues grew 4.0%, on constant currency basis impacted by the high levels of price competition
− Low mobile penetration of just over 50% to support further growth
− Addressing network capacity and quality to meet traffic growth challenges
− Growing data and related services a key focus for the Group over the medium term
− In 2012, total data traffic on MTN network increased 65.9% YoY to 30,521TB
− Data revenues increased 58.5% YoY while SMS revenues increased 11.6%
− Important revenue driver over the medium term as voice penetration slows and competition increases
− Investment in 3G and modernisation of networks
− Focus on ICT services for SME and corporate segments
− Ongoing infrastructure investment allows us to leverage off key products and services
− Integration of Enterprise Business into MTN South Africa, provides a more holistic offering to our clients
− Group Enterprise Business Unit to drive ICT products and services across the Group
.

Strategic considerationsTransforming our operating model
7
Tower Company Transaction− Recent tower deals concluded in Cameroon, Ghana, Ivory
Coast and Uganda
− Ongoing evaluation of tower opportunities in other operations driven by market specific requirements
Infrastructure sharing− Passive sharing at commercial rates in all operations
− Fibre and transmission infrastructure
Procurement transformation project− Capex procurement spend centralised
− Single integrated supply chain across Group progressing well
Back office rationalisation− Focus on transactional activities
− Positive impact on margins in medium term

Group highlights
8
15.1%to 189.3 million
Group subscribers
10.9%to R135,112 million
*Revenue
8.2% to R57,977 million
** EBITDA
1.9%to 1089.1 cents
HEPS
per share of503 cents
Final dividend
R2,088 millioncompleted
Share buy back
* On a constant currency restated using 2011 average exchange rates revenues increased 8.5% to R132,274m** Excluding the impact of the tower transaction R587 million

2012 in reviewA challenging year but well positioned for 2013
9
Organisational structure successfully implemented– Realigned organisation
– Appropriate level of management focus & prioritisation
Step up in competitive landscape– Good subscriber growth despite high level of competitive activity
– Revenue growth impacted by Nigerian price reductions
– Strong data growth supported by 3G rollout and device strategy
– LTE launch in SA
– Successful network rollout: South Africa, Nigeria
Significant issues – Hoffmann Commission concluded
– Turkcell court case
– Iranian sanctions
– Socio-political unrest in Syria
– Review of dividend policy
– Sudan, Iran and Syria currency depreciation against the US$
0
0.02
0.04
0.06
0.08
0.1
0.12
0.14
0
20
40
60
80
100
120
140
160
180
2009 2010 2011 2012
Group Rev Gen MinutesGroup Effective Tariff (USD)

South AfricaA growing data story
10
Launched Jun 1994 Market share 37.7% Population 51.6m Market sizing 80m (2014) Penetration 131% Shareholding 100%
Improved market share during 2012− Market share increased to 37.7% with 3.4m net additions − Prepaid net additions 2.7m and 0.7m postpaid additions − Improved distribution channel supporting prepaid growth− MTN Zone appealing value proposition (PPM 0.91c)ARPU impacted by subs mix and interconnect− Telemetry SIMs increased 21.8% to 1.4m− 1 March 2013 peak MTR’s to decrease by 28.6%MOU improving on back of attractive pricing− Total minutes on network increased 11.5% YoY
3 365 3 834 4 498
15 477 18 199 20 923
0
5 000
10 000
15 000
20 000
25 000
30 000
Dec-10 Dec-11 Dec-12
PrepaidPostpaid
15.6bn 16.7bn 19.9bn Total MOU
17 135 18 143 19 860
18 687 20 454 21 490
Dec-10 Dec-11 Dec-12
H2H1
19.0 21.4 25.6 *Data %
A growing data story− Data revenues increased 33.0% YoY (excl MTN Business)− 7.7m 3G devices on network including 5.5m smartphones− Data traffic increased 170.6% to 14,342 terabytes
Increased pressure on voice revenues− Effective tariff decreased 7.8% YoY to 107c− Interconnect revenues declined 16.9% to R4,926m
Enterprise business included from November− Contributed R214m in revenue (see appendix)
Subscriber(‘000/ARPU (ZAR))
RevenueZAR (million)
* (incl SMS as % of revenue (excl handsets))
18 84222 033
25 421
35 822 38 597 41 350
152 134122

11 320 11 782 12 835
12 314 13 224 14 039
Dec-10 Dec-11 Dec-12
H2H1
South AfricaInvesting for growth
11
Operating costs well controlled− Impacted by inclusion of MTN Business− Normalised EBITDA margin 35.2% (see appendix)
Reduction in interconnect impacted margin − On-net traffic increased from 61.9% to 67.1%− Net interconnect declined 34.9% YoY to R769k
Increased handset subsidy costs− Handset volumes flat YoY− Handset costs increased by 16.1% due to currency movements
Investing for growth− Capex increased 56.3% YoY− Impacted by fibre capitalisation and WIP− Added 300 2G and 1,087 3G sites − To date have a total of 8,815km of fibre in operation
Clarity on LTE spectrum remains an issue− 281LTE sites by end of 2012− 1300 total FTTS installations
ExpensesZAR (million)
CapexZAR (million)
1 014 1 292 1 936
2 894 2 813
4 480
Dec-10 Dec-11 Dec-12
H2H1
34.1 35.2 35.0 EBITDA margin %
11.0 10.6 15.5 Capex as % of revenue
23 634 25 006 26 874
3 908 4 105
6 416

NigeriaPositioned for improvement
12
Launched Aug 2001 Market share 47.8% Population 161m Market sizing 141.9m(2014) Penetration 62% Shareholding 78.8%*
38 669 41 641 47 441
Dec-10 Dec-11 Dec-12
MTNSubscribers
20.2bn 26.6bn 36.8bn Total MOU
330 104 373 453 389 892
361 682 384 525 363 686
Dec-10 Dec-11 Dec-12
H2H1
4.6 8.0 13.6 *Data %
* (incl SMS as % of revenue)
RevenueNGN (million)
Subscriber(‘000/ARPU (ZAR))
Positioned for improvement− Average PPM YoY in Dec declined 34% YoY− Significant increase in competition during Q3− MTN responded with aggressive new price plans − Encouraging revenue trend post September − Strong growth in MOU
Revenue growth under pressure − Margins negatively impacted in 2012− 4.0m 3G devices on network to support data revenue
Slow start to the year− Significant price premium from MTN− Competition driven by promotions − Network capacity constraints− Focus on churn and dormancy managementSubscriber momentum improved in second half− Net additions of 4.3m in H2 vs 1.5m in H1, (total 5.8m) − Market share slightly declined to 47.8% from 50% Mobile Number Portability− MNP to be introduced in March 2013, limited impact expected
691 786 757 978 753 578
10,6 9,7 8,7

NigeriaAcceleration in investment
13
Strong cost focus given revenue pressure− Expenses increased 8.3% YoY− Site rental costs remain a challenge− Fuel costs increased 0.3% YoY− General inflation impacting staff costs >10%
Growing off-net traffic impacting margins− Off-net traffic volumes in H2 increased 29% sequentially− Off-net traffic 17.8% of total vs. 16.4% in 2011
127 631 136 889 154 042
128 340 153 019 159 862
Dec-10 Dec-11 Dec-12
H2H1
62.9 61.7 58.3 EBITDA margin %
2 532 2 0684 432
2 168 4 263
9 301
Dec-10 Dec-11 Dec-12
H2H1
14.0 18.2 35.5 Capex as % of revenue
ExpensesNGN (million)
CapexZAR (million)
Acceleration in investment− Capex increased 117% YoY accelerating in H2− Added 1,414 2G & 1,175 3G sites in 2012− Q4 traffic on network increased 32% YoY
Network remains constrained− Quality improvements evident in Q4− 10,450 km of backbone fibre in operation− Expected to meet NCC quality requirements by mid year
Increased focus on early build in 2013− 2012 capex included R2.0bn increase in WIP − Weaker rand in H2 impacted capex by R789m
255 971 289 908 313 904
4 7006 331
13 733

IranGood result in challenging environment
14
Launched Oct 2006 Market share 46.9% Population 76m Market sizing 99.3m (2014) Penetration 113% Shareholding 49%
12 233 15 689 20 125
14 06117 563
21,855
Dec-10 Dec-11 Dec-12
H2H1
19.7 25.3 28.8 *Data %
896 413 418
765755 704
Dec-10 Dec-11 Dec-12
H2H1
18.1 10.6 9.2 Capex as % of revenue
RevenueIRR (billion)
CapexZAR (million)
* (incl SMS as % of revenue)
Good result in challenging environment− Added 5.8m subscribers− Total subscribers reached 40.5m, 46.9% market share− Ongoing sanctions placing pressure on economyStrong revenue and margin performance− Revenues increased 26.2% YoY in LC− EBITDA increased 31.2% in LC− EBITDA margin increased to 44.3% from 42.5% YoYData continues to grow− SMS up 30% YoY, contributing 21.3% of total revenue− Data revenue (excl sms) increased 103% YoY
Sanctions impacting environment− Rollout impacted by delays in equipment delivery− Currency devaluation− Consumer disposable income under pressure
Difficult environment for network rollout− Added 604 2G sites vs 781 2G sites in 2011
Remain committed to compliance with sanctions− No dividends or loans repatriated since last reporting period
EBITDA Margin26 294
33 25241 980
1 6611 168 1 122
* Capex based on MTN’s 49% share

GhanaWinning despite competition
15
Launched Nov 1996 Market share 50.5% Population 25.6m Market sizing 25.3m (2014) Penetration 91% Shareholding 98%
536 600 734
574677
818
Dec-10 Dec-11 Dec-12
H2H1
7.0 5.5 8.1 *Data %
1 404 137 273
1 688
714 818
Dec-10 Dec-11 Dec-12
H2H1
54.8 14.2 15.9 Capex as % of revenue
RevenueCedi (million)
CapexZAR (million)
* (incl SMS as % of revenue)
Good performance despite competition− Added 1.6m subscribers − Slight decline in market share to 50.5%− Ban on SIM sales lifted on 22 January 2012Strong revenue and margin performance− Compelling value proposition drives growth− Revenues increased 21.5% in LC− EBITDA increased 17.9% in LC− EBITDA margin decreased to 37.0% from 38.1% YoYData remains a key driver− Data revenues increased 96.1% YoY, trend continues− Driven by improved handsets, lower data tariffs and bundles
Tower transaction progressing satisfactorily− 1856 towers transferred to tower company− Site rentals now priced in GHS− Leasing costs placing pressure on margins
3G network remains a key focus− Over 800 3G sites on the network− 1.3m 3G devices on network
EBITDA Margin1 110
1 2771 552
3 092
851 1 091

CameroonWell placed for growth in 2013
16
Launched Feb 2000 Market share 55.7% Population 21.1mMarket sizing 17m (2014)
Penetration 62% Shareholding 70%
109 538 105 139 116 138
110 256 112,305 120 720
Dec-10 Dec-11 Dec-12
H2H1
5.2 5.9 6.7 *Data %
377 92274
148
234
450
Dec-10 Dec-11 Dec-12
H2H1
16.1 9.8 19.0 Capex as % of revenue
Revenue CFA (million)
CapexZAR (million)
* (incl SMS as % of revenue)
Well placed for growth in 2013− Increased subs 26.0% YoY to 7.307m− 2012 impacted by once-off costs, normalised base for 2013Strong underlying performance − Revenues increased 8.9% YoY in LC − EBITDA increased 14.0% YoY in LC− EBTIDA increased to 45.9% from 43.9% YoYData revenue continues to grow− Data revenues (excl SMS) increased 25.0% YoY− Increasing mobile money distribution footprint
Marked improvement in network rollout− Capex increased 122% YoY − Added 193 2G sites in 2012 compared to 69 sites in 2011
Network quality further improved− Completed swap and modernisation of 50% of network
EBITDA Margin
219 794 217 444 236 858
525
326
724

Ivory CoastIncreased competition
17
Launched April 1996 Market share 36.4% Population 22.9m Market sizing 13.0m (2014) Penetration 76.9% Shareholding 67.7%
95 865 96 014 127 677
104 990 121,903128 709
Dec-10 Dec-11 Dec-12
H2H1
3.1% 1.2% 5.7% *Data %
603 102 273
121
305
630
Dec-10 Dec-11 Dec-12
H2H1
24.4 12.1 21.9 Capex as % of revenue
RevenueCFA (million)
CapexZAR (million)
* (incl SMS as % of revenue)
Increased competition− Aggressive pricing from competitors− Net additions impacted by end of registration period (-400k), − Reported net disconnections of 226k in 2012Revenues tracking strongly− Revenues increased 17.7% YoY, EBITDA increased 14.6% YoY − Regulatory fees and competition impacted EBITDA margins− Margins decreasing to 40.3% from 41.6% YoY Strong acceleration in data revenues− Handset data revenues up 84% YoY− MTN Business up 33% and mobile money up 167%
Increase investment− Added 147 2G & 3G sites compared to 63 in 2011− Completed 1,124km fibre rollout
3G network to support growth in 2013− Launched 3G services in December− Key driver of data services over medium term
EBITDA Margin
200 855 217 917256 386
724
407
903
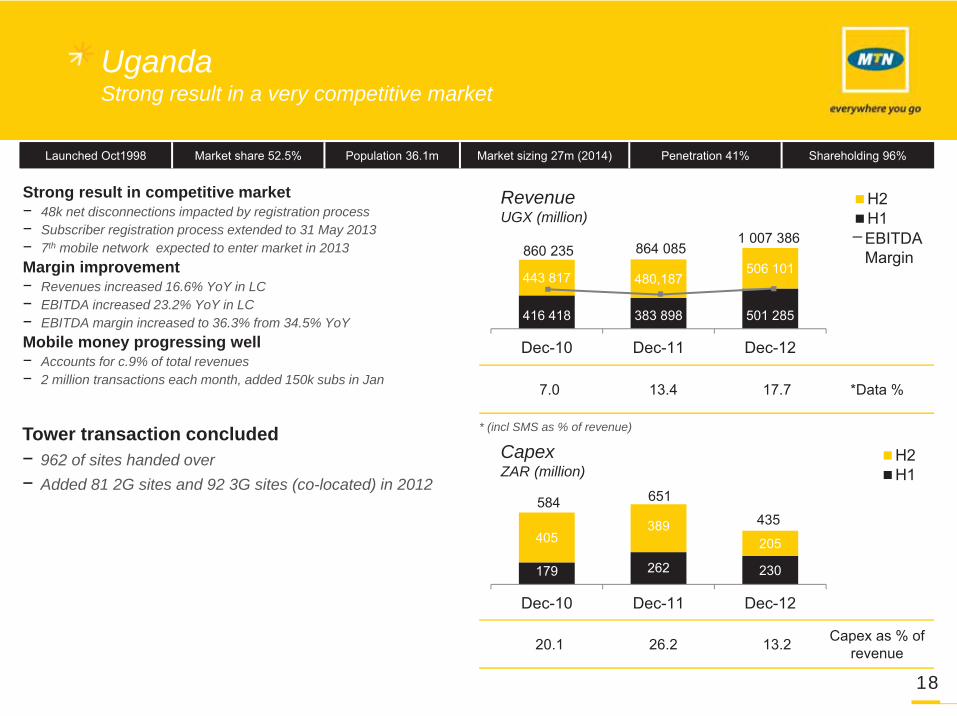
UgandaStrong result in a very competitive market
18
Launched Oct1998 Market share 52.5% Population 36.1m Market sizing 27m (2014) Penetration 41% Shareholding 96%
416 418 383 898 501 285
443 817 480,187506 101
Dec-10 Dec-11 Dec-12
H2H1
7.0 13.4 17.7 *Data %
179 262 230
405389
205
Dec-10 Dec-11 Dec-12
H2H1
20.1 26.2 13.2 Capex as % of revenue
RevenueUGX (million)
CapexZAR (million)
* (incl SMS as % of revenue)
Strong result in competitive market− 48k net disconnections impacted by registration process− Subscriber registration process extended to 31 May 2013− 7th mobile network expected to enter market in 2013 Margin improvement− Revenues increased 16.6% YoY in LC− EBITDA increased 23.2% YoY in LC− EBITDA margin increased to 36.3% from 34.5% YoYMobile money progressing well− Accounts for c.9% of total revenues− 2 million transactions each month, added 150k subs in Jan
Tower transaction concluded− 962 of sites handed over− Added 81 2G sites and 92 3G sites (co-located) in 2012
EBITDA Margin860 235 864 085
1 007 386
584 651
435
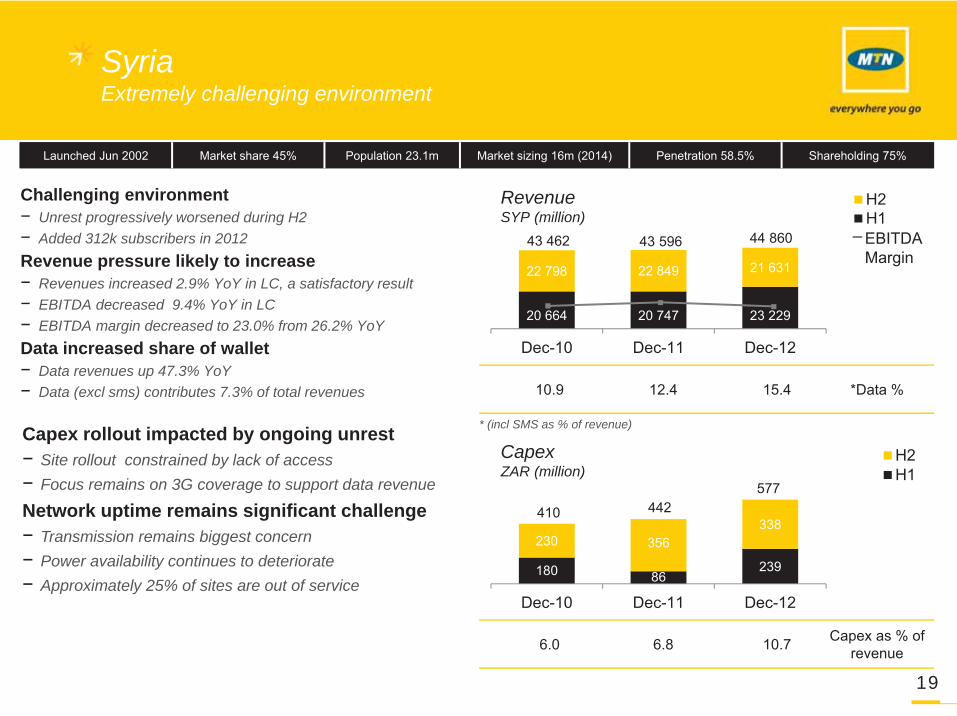
SyriaExtremely challenging environment
19
Launched Jun 2002 Market share 45% Population 23.1m Market sizing 16m (2014) Penetration 58.5% Shareholding 75%
20 664 20 747 23 229
22 798 22 849 21 631
Dec-10 Dec-11 Dec-12
H2H1
10.9 12.4 15.4 *Data %
180 86239
230 356338
Dec-10 Dec-11 Dec-12
H2H1
6.0 6.8 10.7 Capex as % of revenue
RevenueSYP (million)
CapexZAR (million)
* (incl SMS as % of revenue)
Challenging environment− Unrest progressively worsened during H2− Added 312k subscribers in 2012Revenue pressure likely to increase − Revenues increased 2.9% YoY in LC, a satisfactory result− EBITDA decreased 9.4% YoY in LC− EBITDA margin decreased to 23.0% from 26.2% YoYData increased share of wallet− Data revenues up 47.3% YoY− Data (excl sms) contributes 7.3% of total revenues
Capex rollout impacted by ongoing unrest− Site rollout constrained by lack of access− Focus remains on 3G coverage to support data revenue
Network uptime remains significant challenge− Transmission remains biggest concern− Power availability continues to deteriorate− Approximately 25% of sites are out of service
EBITDA Margin
43 462 43 596 44 860
410 442577

SudanEncouraging turnaround
20
Launched Sep 2005 Market share 31.8% Population 34.4m Market sizing 28.5m (2014) Penetration 73% Shareholding 85%
254 329 414
265395
515
Dec-10 Dec-11 Dec-12
H2H1
3.0 3.2 7.9 *Data %
172 272 125
458680 1 211
Dec-10 Dec-11 Dec-12
H2H1
40.7 48.9 61.9 Capex as % of revenue
RevenueSDG (million)
CapexZAR (million)
* (incl SMS as % of revenue)
Encouraging turnaround− Improvement in 2011 has continued − Improved distribution network and competitive offers− Added 2.2m subscribers and increased market share to 30.9%Strong revenue and margin performance− Revenues increased 28.2% YoY in LC − EBITDA increased 60.2% YoY in LC− EBITDA margin increased to 27.7% from 22.1% YoYMaking progress with data services− Data revenues increased over 700% YoY from low base− SMS revenues more than doubled
Good progress on network rollout− Rolled out 332 2G & 146 3G sites− Ongoing progress with BTS modernisation− Capex rollout to improve competitiveness
Operating environment tough− High inflationary environment− Ongoing unrest in Darfur and southern region− Currency devaluation
EBITDA Margin519
724929
630
952
1 336

Financial overview

Financial highlightsInvesting for sustained growth
22
Reported revenues increased 11% YoY- Nigeria negatively impacting performance- Organic growth excluding Nigeria 12.3%
EBITDA growth limited to 8% YoY- Group margin impacted by Nigeria- R1.1bn increase in head office costs
Capex increased significantly YoY- Significant pre-ordering for 2013- Investing for sustained growth
Joint ventures equity accounted from 2013 (IFRS11) (see appendix)- Iran- Swaziland- Botswana
31 045 35 849 27 877
19 466 17 717 30 101
64 17368 318
77 134
50 511 53 56657 978
2010 2011 2012
121 884
135 112
Group summary: 2010 - 2012ZAR (million)
AFCF**
Capex
EBITDA*
Opex
Rev
44.0% 43.9% 42.9% EBITDA margin
44.0% 44.9% 43.3% EBITDA margin (incl tower profit)
17.0% 14.5% 22.3% Capex / revenue
+11% +9%
-13% -12%
+8% +5%
+70% +62%
-22% -24%
Reported’11 - ’12
Organic’11 - ’12
* Excl tower profit Dec 12: ZAR 587m (Dec 11: ZAR 1 185m), excl Zakhele Dec 10: ZAR 2 973m** EBITDA less capex (approximates free cash flow)
114 684
+6%
+11%

RevenueStrong organic growth, data key driver
23
Voice revenue growth up 7% YoY- Strong subscriber growth up 15.1% YoY- Competitive pricing impacts tariffs across most markets- Voice traffic up 24.6%- South Africa prepaid revenue performs well- Nigeria voice revenue down 10% (LC)YoY
Data major contributor to revenue growth- Data revenue up 58.5% YoY and traffic up 65.9%- Increased smartphones and data enabled phones
Interconnect revenue impacted by MTR reduction- South Africa down 17% YOY- Interconnect will remain a drag on growth in 2013
Strong results from ‘large opco cluster’- Contributing almost 59% of revenue growth- Well positioned for 2013
2011 RSA NIG LOC SOC HOE 2012CR FX 2012
Revenue growth Organic Reported
South Africa 7% 7%
Nigeria -1% 11%
Iran 26% 10%
Ghana 21% 15%
Cameroon 9% 14%
Ivory Coast 17% 23%
Uganda 16% 33%
Syria 2% -17%
Sudan 28% 11%
Revenue breakdownZAR (million)
121 8842 753 (271)
1 980 132 2742 838
(201)6 129
135 112
2012CR is at constant prior year FX rate LOC – Large opco clusterSOC – Small opco cluster HOE – Head office companies and eliminations
+9%
+2%
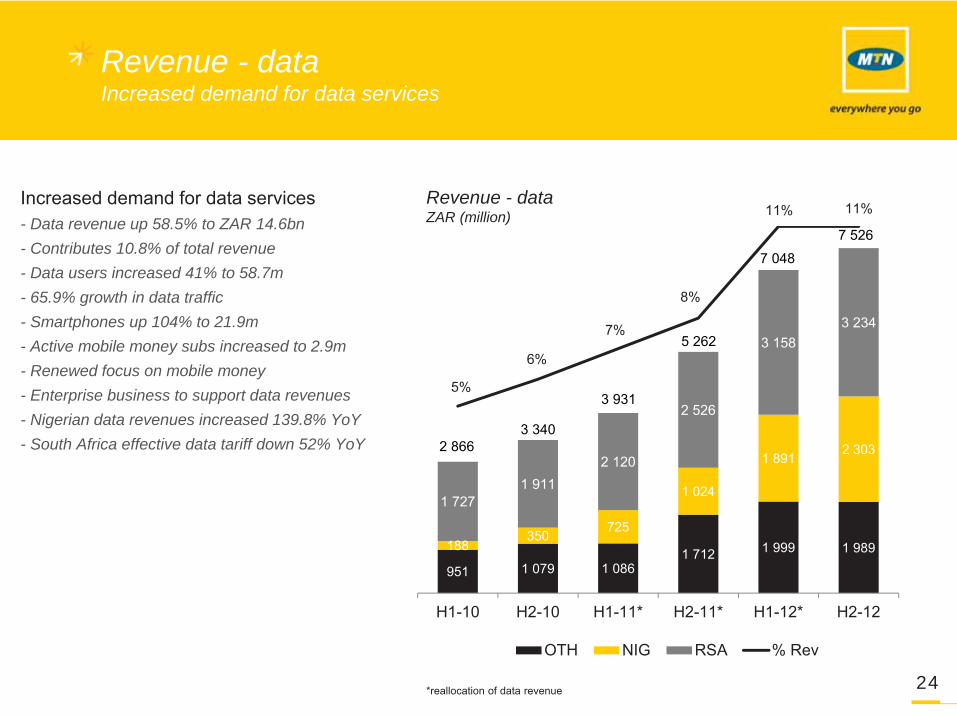
Revenue - data Increased demand for data services
24
Increased demand for data services- Data revenue up 58.5% to ZAR 14.6bn- Contributes 10.8% of total revenue- Data users increased 41% to 58.7m- 65.9% growth in data traffic- Smartphones up 104% to 21.9m- Active mobile money subs increased to 2.9m- Renewed focus on mobile money- Enterprise business to support data revenues- Nigerian data revenues increased 139.8% YoY- South Africa effective data tariff down 52% YoY
951 1 079 1 0861 712 1 999 1 989188
350725
1 024
1 8912 303
1 7271 911
2 120
2 526
3 1583 234
-100.00%
100.00%
300.00%
500.00%
700.00%
900.00%
1100.00%
0
1 000
2 000
3 000
4 000
5 000
6 000
7 000
8 000
H1-10 H2-10 H1-11* H2-11* H1-12* H2-12
OTH NIG RSA % Rev
2 8663 340
3 931
5 262
7 048
7 526
Revenue - dataZAR (million)
5%
6%
7%
8%
11% 11%
*reallocation of data revenue

6 422 8 013
14 80516 052
6 7547 775
13 39515 041
8 160
9 789
18 782
20 464
2011 2012
OPEXFocus on cost control
25
Direct network operating costs- Increased number of sites- Higher diesel and site rental costs- Lease payments in Ghana- Iran maintenance, priced in Euro and USD- Nigerian transmission cost up on higher traffic- Revenue share and regulatory fees in Iran
Handset costs continue to increase- South Africa average post-paid handset cost up
7%, pre-paid handset costs up 15%
Marketing spend well controlled- Marketing spend 2.8 % of revenue (2011: 3.1%)
Commission cost - South Africa pre-paid commissions trending
down - Post-paid handset subsidies lower
OpexZAR (million)
*Other operating expenses
Selling, distribution and marketing expenses
Employee benefits
Interconnect and roaming
Costs of handsets and other accessories
*incl deferred gain Dec 12: ZAR 308m (2011:ZAR 273m)
-20% 13%
-12% 19%
-15% 10%
-8% 21%
-25% 10%
Reported’11 - ’12
% share ofopex
Direct network operating costs -9% 27%
+13%
68 318
77 134

EBITDA marginGrowing contribution from ‘other’ operations
26
South Africa - Margin decreased 0.2pp to 35.0% YoY (MTN Business)- Opportunity for margin improvement
Nigeria- Margin decreased 3.4pp to 58.3% YoY- 39% YoY growth in interconnect cost
Iran - Margin increased 1.8pp to 44.3%- Controlled marketing spend, optimised transmission
Cameroon- Margin increased to 45.9% from 43.7%
Uganda- Margin increased to 53.5% due to tower sale profit - Excluding tower sale profit, margin increase 2.4pp to
36.9%
Sudan - Margin increased to 27.7% from 22.3%- Benefit from improved revenue performance and better
cost control
2011 RSA NIG LOC SOC HOE 2012CR FX 2012
EBITDA growth Organic Reported
South Africa 7% 7%
Nigeria -6% 5%
Iran 31% 15%
Ghana 23% 17%
Cameroon 14% 20%
Ivory Coast 13% 19%
Uganda 24% 42%
Syria -10% -27%
Sudan 59% 38%
EBITDA margin reconciliation(%)
43.9% (0.1pp) (1.0pp) 0.6pp
42.4%0.5pp
(1.2pp)0.2pp 42.9%
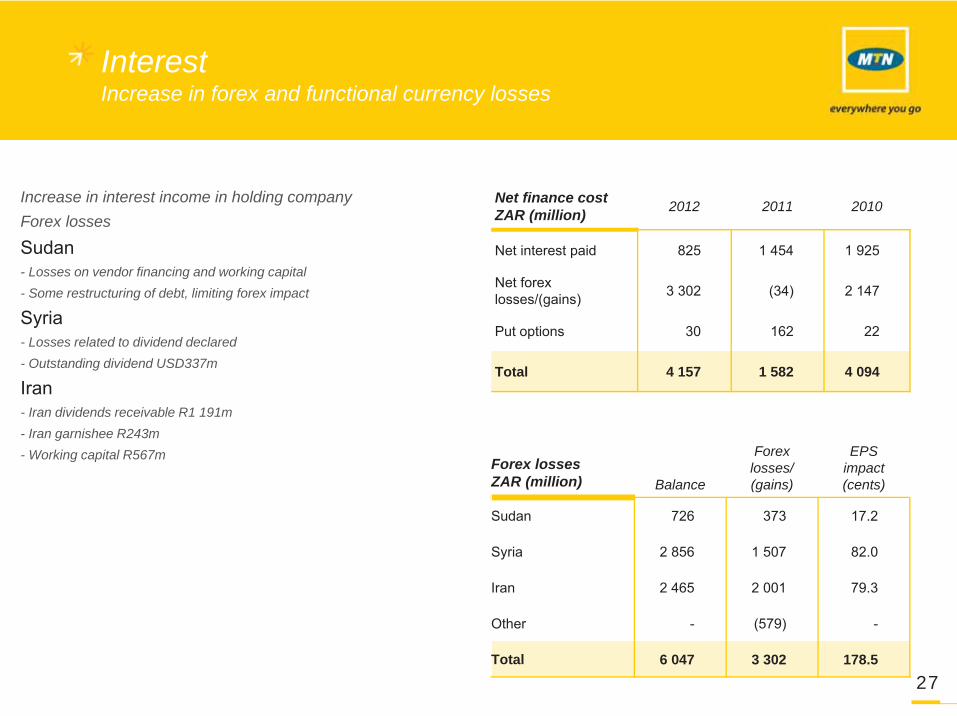
InterestIncrease in forex and functional currency losses
27
Increase in interest income in holding companyForex losses
Sudan- Losses on vendor financing and working capital- Some restructuring of debt, limiting forex impact
Syria- Losses related to dividend declared- Outstanding dividend USD337m
Iran- Iran dividends receivable R1 191m- Iran garnishee R243m- Working capital R567m
Net finance cost ZAR (million) 2012 2011 2010
Net interest paid 825 1 454 1 925
Net forexlosses/(gains) 3 302 (34) 2 147
Put options 30 162 22
Total 4 157 1 582 4 094
Forex lossesZAR (million) Balance
Forex losses/(gains)
EPSimpact (cents)
Sudan 726 373 17.2
Syria 2 856 1 507 82.0
Iran 2 465 2 001 79.3
Other - (579) -
Total 6 047 3 302 178.5
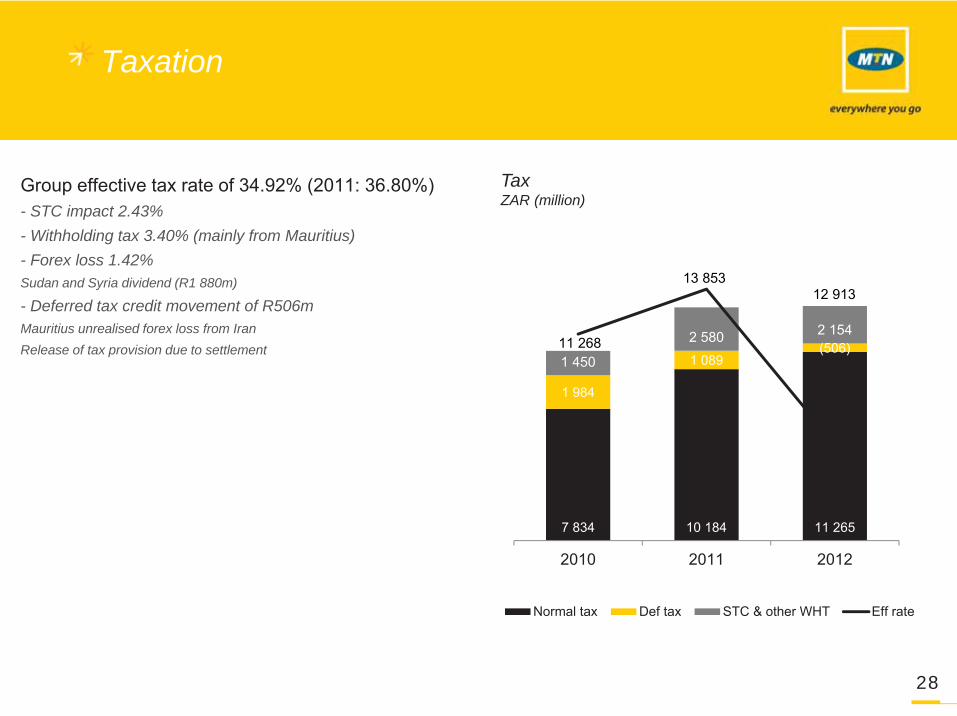
34.92%
Taxation
28
Group effective tax rate of 34.92% (2011: 36.80%)- STC impact 2.43% - Withholding tax 3.40% (mainly from Mauritius)- Forex loss 1.42%Sudan and Syria dividend (R1 880m)
- Deferred tax credit movement of R506m Mauritius unrealised forex loss from IranRelease of tax provision due to settlement
7 834 10 184 11 265
1 984
1 089(506)
1 450
2 580 2 154
34.00%
34.50%
35.00%
35.50%
36.00%
36.50%
37.00%
0
2 000
4 000
6 000
8 000
10 000
12 000
14 000
16 000
2010 2011 2012
Normal tax Def tax STC & other WHT Eff rate
12 91313 853
11 268
TaxZAR (million)

HEPS
ZAR (cents) 2012 2011 Variance %
Attributable earnings per share 1 126.4 1 119.5 0.6
Profit on disposal of non-current assets (36.2) (48.6) (25.5)
Reversal of impairment of PPE and non-current assets (1.1) (2.3) (52.2)
Basic headline earnings per share 1 089.1 1 068.6 1.9
29
2 779 5 145 5 979
6 577
8 9409 362
930
2 088
2010 2011 2012
Share buy-back H2 H1
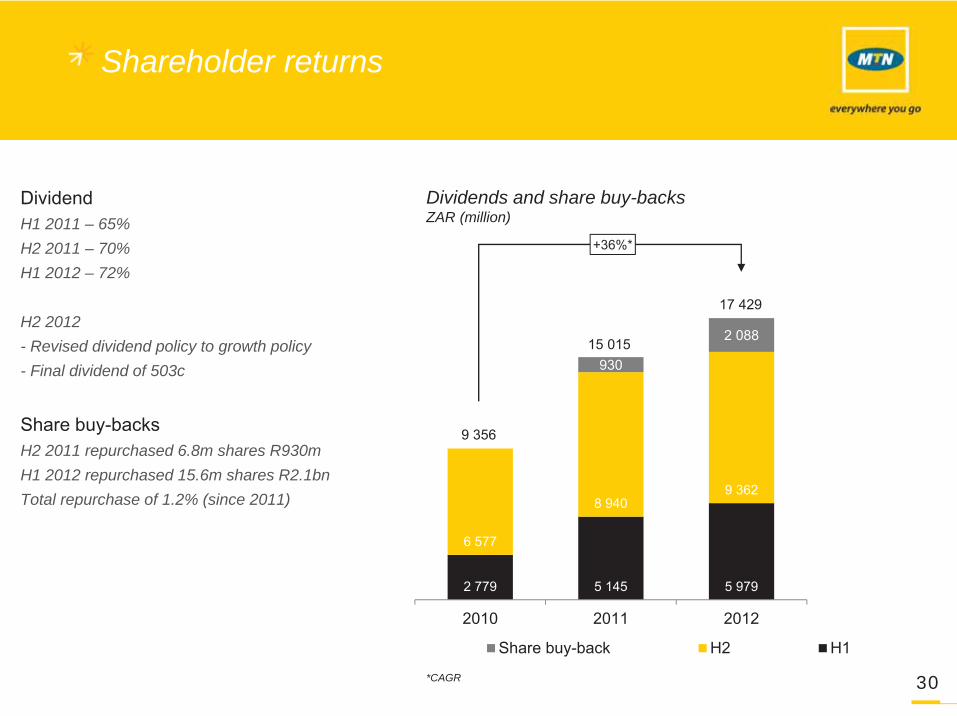
Shareholder returns
30
Dividend H1 2011 – 65% H2 2011 – 70%H1 2012 – 72%
H2 2012 - Revised dividend policy to growth policy- Final dividend of 503c
Share buy-backsH2 2011 repurchased 6.8m shares R930mH1 2012 repurchased 15.6m shares R2.1bnTotal repurchase of 1.2% (since 2011)
Dividends and share buy-backsZAR (million)
9 356
17 429
15 015
+36%*
*CAGR

Income statement
ZAR (million) 2012 2011 Variance %
Revenue 135 112 121 884 11
Other income 894 1 458 (39)
EBITDA 58 564 54 750 7
Depreciation, amortisation and impairment of goodwill (17 246) (15 490) (11)
Profit from operations 41 318 39 260 5
Net finance cost (4 157) (1 582) (163)
Share of results in associates (180) (38) NM
Profit before tax 36 981 37 640 (2)
Income tax expense (12 913) (13 853) 7
Profit after tax 24 068 23 787 1
Non-controlling interests (3 364) (3 033) (11)
Attributable profit 20 704 20 754 -
EBITDA margin 43.3% 44.9% (1.6 pp)
Profit on sale of towers 587 1 185 (51)
EBITDA margin % excl tower profit 42.9% 43.9% (1.0 pp)
Effective tax rate 34.9% 36.8% (1.9 pp) 31

Statement of financial position
ZAR (million) 2012 2011
Property, plant and equipment 77 485 71 610
Goodwill and other intangible assets 33 935 34 540
Other non-current assets 9 677 7 637
Current assets 58 914 66 801
Non-current assets held for sale 1 373 820
Total assets 181 384 181 408
Total equity 92 887 92 699
Interest bearing liabilities 32 532 34 016
Other liabilities 55 965 54 693
Total liabilities 88 497 88 709
Total equity and liabilities 181 384 181 408
Net cash* 5 519 11 817
Net cash / EBITDA** 0.09 0.22
32*Excl Iran and Syria (R3 214m) (2011: R3 112m)**Excl Iran and Syria (0.06) (2011: 0.06)

Statement of cash flow
ZAR (million) 2012 2011* Variance %
Cash generated by operations 57 856 50 277 15
Dividends paid to equity holders of the Company (14 919) (11 722) (27)
Dividends paid to non-controlling interests (3 018) (2 647) (14)
Net interest paid (693) (1 359) 49
Tax paid (14 303) (9 414) (52)
Dividends received from associates 155 92 68
Cash generated by operating activities 25 078 25 227 (6)
Acquisition of property, plant and equipment (22 572) (14 103) (60)
Other investing activities (4 487) (6 513) 31
Cash used in investing activities (27 059) (20 616) (31)
Cash used in financing activities (5 759) (9 386) 39
Cash and cash equivalents at the beginning of the year 35 213 35 907 (2)
Effect of exchange rates on cash and equivalents (1 942) 4 081 (148)
Cash and cash equivalents at the end of the year 25 531 35 213 (27)
33*2011 amounts reclassified (dividends paid to non-controlling interests reclassified from financing to operating activities).

Income statement
ZAR (million)2012 2012 – equity
accountingVariance %
Revenue 135 112 121 865 (10)
Other income 894 894 -
EBITDA 58 564 52 635 (10)
Depreciation, amortisation and impairment of goodwill (17 246) (15 953) 7
Profit from operations 41 318 36 682 (11)
Net finance cost (4 157) (1 447) 65
Equity income (180) 668 NM
Profit before tax 36 981 35 903 (3)
Income tax expense (12 913) (11 835) 8
Profit after tax 24 068 24 068 -
Non-controlling interests (3 364) (3 364) -
Attributable profit 20 704 20 704 -
EBITDA margin 43.3% 43.2% (0.1pp)
Profit on sale of towers 587 587 -
EBITDA margin % excl tower profit 42.9% 42.7% (0.2pp)
Effective tax rate 34.9% 33.0% 1.9pp
Equity accounting of joint ventures
34

Statement of financial position
ZAR (million)2012 2012 – equity
accounting
Property, plant and equipment 77 485 73 907
Goodwill and other intangible assets 35 634 33 996
Other non-current assets 9 677 10 838
Current assets 58 914 53 772
Non-current assets held for sale 1 373 1 373
Total assets 181 384 173 886
Total equity 92 887 92 887
Interest bearing liabilities 32 532 30 639
Other liabilities 55 952 50 360
Total liabilities 88 497 80 999
Total equity and liabilities 181 384 173 886
Net cash 5 514 11 401
Net cash / EBITDA 0.09 0.22
Equity accounting of joint ventures
35

Looking Ahead

Looking Ahead
37
• Change in dividend policy to absolute growth policy• Share buy-back strategy
Creating & managing stakeholder value
• Focus on customer centricity• Improved network quality through ongoing investment
Creating a distinct customer experience
• Cost management, project NEXT• Monetisation of passive infrastructure
Transforming our operating model
• Growing data and ICT revenues• Select M&A opportunities
Driving sustainable growth
• Implementation of culture operating system• Spectrum allocation policy• Migration to all IP networks
Innovation and best practice

Subscribers
Net subscriber additions (‘000)
South Africa 2 900Nigeria 7 000Large opco cluster 8 100
Iran 3 850
Ghana 800
Cameroon 1 000
Ivory Coast 300
Sudan 1 350
Syria -
Uganda 800
Small opco cluster 3 000Total 21 000
Guidance 2013
38
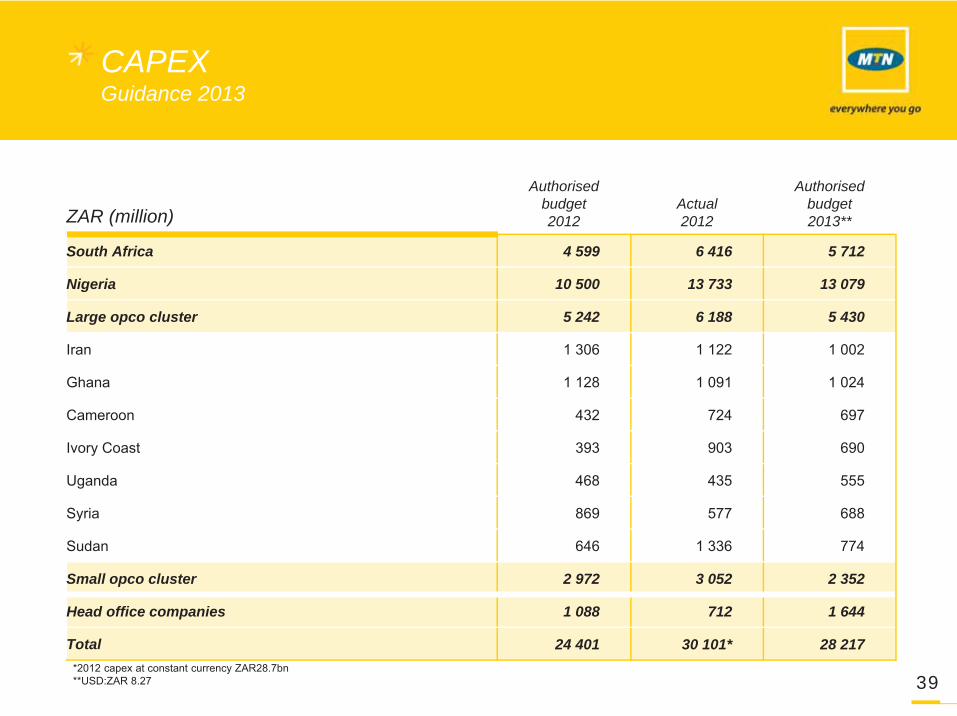
CAPEX
ZAR (million)
Authorised budget2012
Actual2012
Authorisedbudget2013**
South Africa 4 599 6 416 5 712
Nigeria 10 500 13 733 13 079
Large opco cluster 5 242 6 188 5 430
Iran 1 306 1 122 1 002
Ghana 1 128 1 091 1 024
Cameroon 432 724 697
Ivory Coast 393 903 690
Uganda 468 435 555
Syria 869 577 688
Sudan 646 1 336 774
Small opco cluster 2 972 3 052 2 352
Head office companies 1 088 712 1 644
Total 24 401 30 101* 28 217
Guidance 2013
39*2012 capex at constant currency ZAR28.7bn **USD:ZAR 8.27

Appendix

Net cash
ZAR (million)Cash and cash
equivalentsInterest bearing
liabilitiesIntercompany eliminations
Net debt/(cash)2012
Net debt/(cash)2011
South Africa (3 985) 16 470 (16 268) (3 783) (3 699)
Nigeria (6 721) 12 613 - 5 892 (1 578)
Large opco cluster (11 217) 7 775 (4 559) (8 001) (6 429)
Iran (3 175) 1 695 (1 686) (3 166) (1 743)
Ghana (984) 51 - (933) (599)
Cameroon (1 514) 537 - (977) (314)
Ivory Coast (494) 637 - 143 760
Uganda (726) 409 - (317) 362
Syria (3 868) - - (3 868) (5 113)
Sudan (456) 4 446 (2 873) 1 117 218
Small opco cluster (3 716) 6 220 (2 097) 407 550
Head office companies (12 407) 13 983 (1 610) (34) (661)
Total (38 046) 57 061 (24 534) (5 519) (11 817)
Group in net cash position
41

South Africa
ZAR (million) H1-12 H2-12 YTD-12
South Africa
Revenue 19 862 21 488* 41 350*
EBITDA 7 026 7 450* 14 476*
EBITDA margin 35.4% 34.7%* 35.0%*
Business Solutions South Africa
Revenue 639 432 1 071
EBITDA (11) (34) (45)
EBITDA margin (1.7%) (7.9%) (4.2%)
South Africa excl Business Solutions
Revenue 19 862 21 274 41 136
EBITDA 7 026 7 455 14 481
EBITDA margin 35.4% 35.0% 35.2%
Excl Business Solutions South Africa
42*Incl 2 months of MTN Business Solutions South Africa

FX trendsAverage rate
43
USD: Local currency H1-11 H2-11 YTD-11 H1-12 H2-12 YTD-12Variance %
YTD-11 to YTD-12
ZAR 6.80 7.51 7.17 7.89 8.47 8.16 14
Naira 154 158 156 159 159 159 2
Rial 10 474 10 739 10 614 11 970 15 862 13 701 29
Cedi 1.51 1.58 1.55 1.78 1.91 1.85 19
Cameroon XAF 465 476 470 502 513 508 (8)
Ivory Coast CFA 467 474 472 504 514 509 (8)
Uganda shilling 2 357 2 648 2 507 2 457 2 558 2 490 (1)
Syrian pound 47.41 49.31 48.40 64.40 72.32 67.99 40
Sudanese pound 2.70 2.68 2.69 2.78 4.41 3.50 30
ZAR: Local currency H1-11 H2-11 YTD-11 H1-12 H2-12 YTD-12Variance %
YTD-11 to YTD-12
Naira 22.58 20.97 21.76 20.25 18.70 19.50 (10)
Rial 1 536 1 424 1 474 1 515 1 886 1 686 14
Cedi 0.22 0.21 0.22 0.23 0.23 0.23 5
Cameroon XAF 68.10 62.99 65.67 63.93 60.54 62.20 (5)
Ivory Coast CFA 68.27 62.61 64.81 63.89 60.70 62.31 (4)
Uganda shilling 345 349 347 304 302 303 (13)
Syrian pound 6.95 6.57 6.74 8.14 8.56 8.34 24
Sudanese pound 0.40 0.35 0.37 0.35 0.52 0.43 16
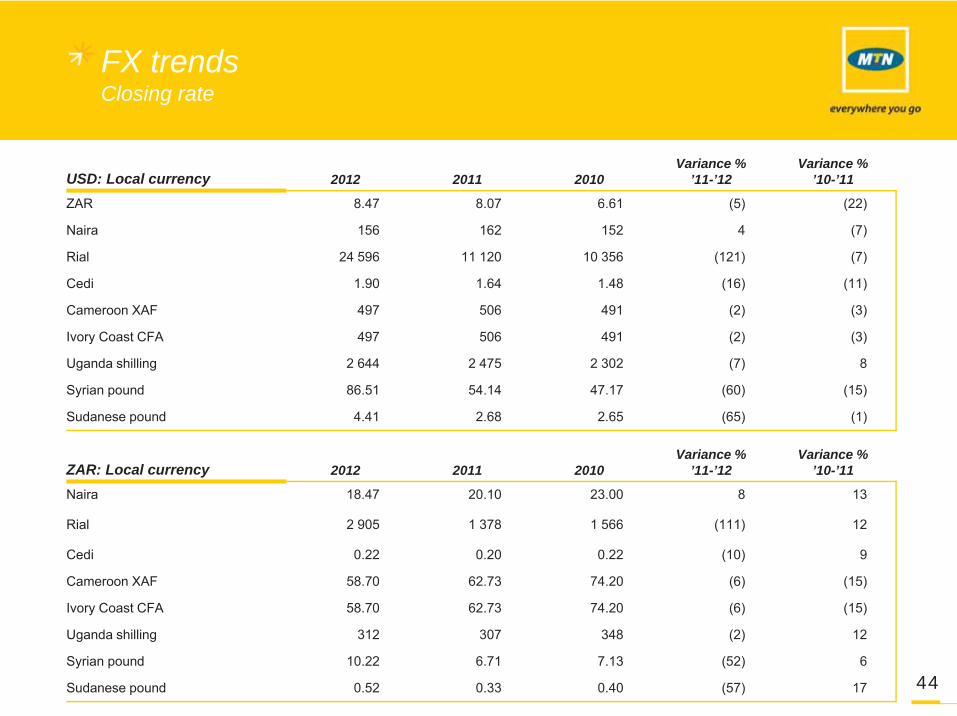
FX trendsClosing rate
44
USD: Local currency 2012 2011 2010Variance %
’11-’12Variance %
’10-’11
ZAR 8.47 8.07 6.61 (5) (22)
Naira 156 162 152 4 (7)
Rial 24 596 11 120 10 356 (121) (7)
Cedi 1.90 1.64 1.48 (16) (11)
Cameroon XAF 497 506 491 (2) (3)
Ivory Coast CFA 497 506 491 (2) (3)
Uganda shilling 2 644 2 475 2 302 (7) 8
Syrian pound 86.51 54.14 47.17 (60) (15)
Sudanese pound 4.41 2.68 2.65 (65) (1)
ZAR: Local currency 2012 2011 2010Variance %
’11-’12Variance %
’10-’11
Naira 18.47 20.10 23.00 8 13
Rial 2 905 1 378 1 566 (111) 12
Cedi 0.22 0.20 0.22 (10) 9
Cameroon XAF 58.70 62.73 74.20 (6) (15)
Ivory Coast CFA 58.70 62.73 74.20 (6) (15)
Uganda shilling 312 307 348 (2) 12
Syrian pound 10.22 6.71 7.13 (52) 6
Sudanese pound 0.52 0.33 0.40 (57) 17