Embed Size (px)
Citation preview

11
Welcome to the world of wind energy
Wind Farm design
Dr. D. V. KanellopoulosOPWP Renewable Energy
Training Program11-14 December 2016
Muscat, Oman

Wind farm design What are the 2 main parameters that DICTATE the LAYOUT of a
future wind farm?
Absolutely necessary to measure them on the site for at least one year.
ALWAYS REMEMBER, they can change over large distances.
Wind rose

Wind farm design What are the 2 main parameters that DECTATE the LAYOUT of a
future wind farm?
Get a topographic survey, look for detailed maps in order to start
preliminary layouts, maps scaled 1:5.000 are needed

Wind farm design What are the 2 main parameters that DECTATE the LAYOUT of a
future wind farm?
Get a topographic survey, look for detailed maps for the sea bed if available
Gulf of Gela, Sicily,
Italy
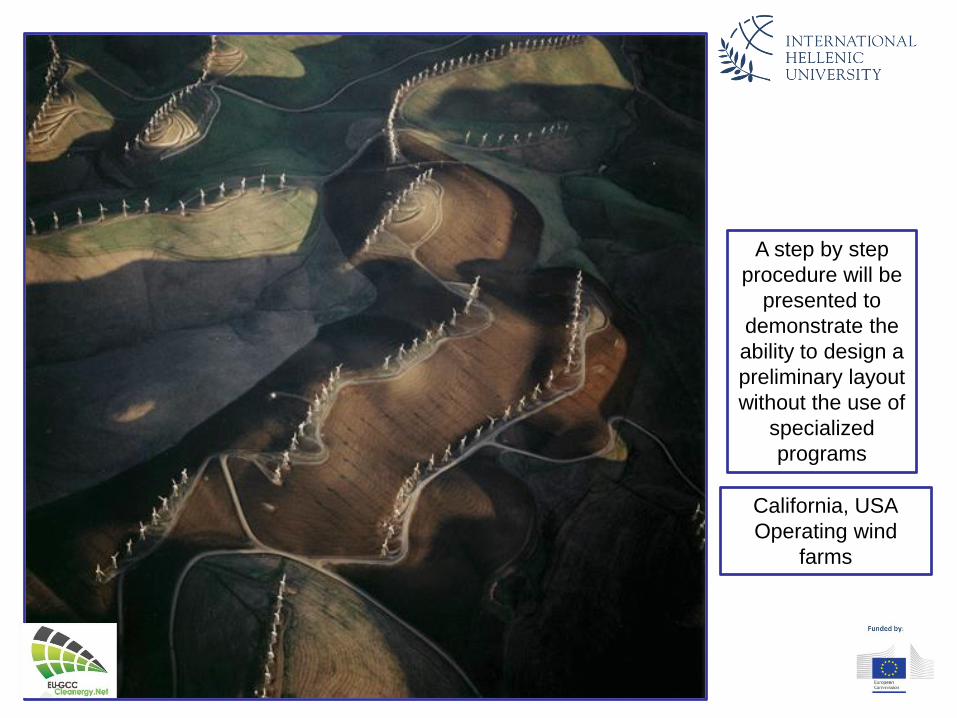
California, USA
Operating wind
farms
A step by step
procedure will be
presented to
demonstrate the
ability to design a
preliminary layout
without the use of
specialized
programs

In the mountains of California the ridges dictate the line layouts
http://eerscmap.usgs.gov/windfarm/
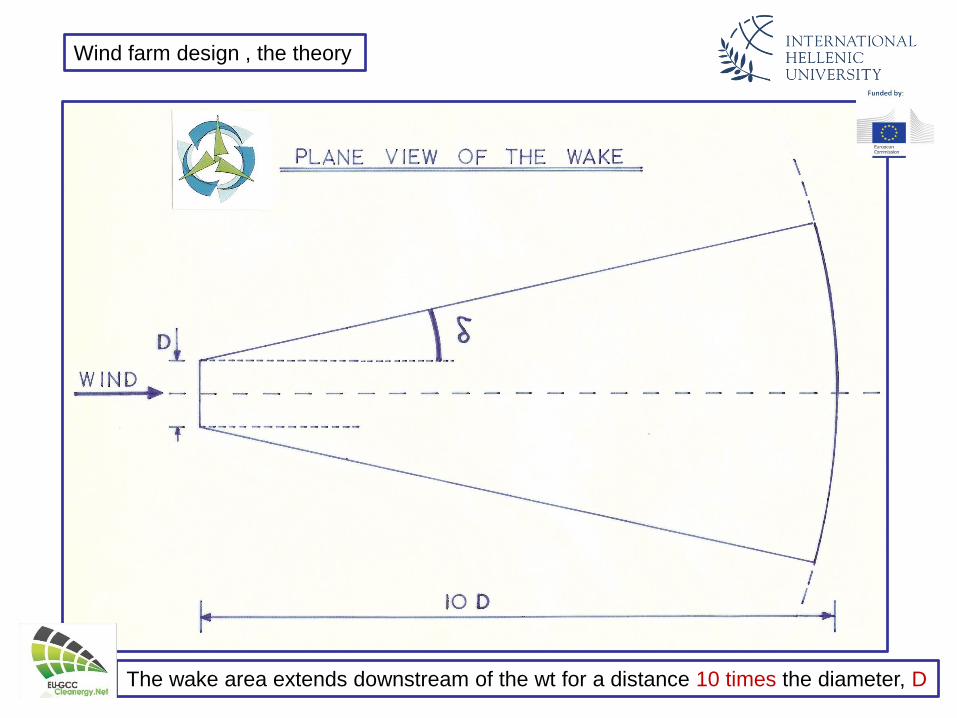
Wind farm design , the theory
The wake area extends downstream of the wt for a distance 10 times the diameter, D

Wind farm design , the theory
2 wts must be placed along the axis x-x’ in such a manner that the
second turbine B is clear off the wake area created by the first turbine
A. The wind direction is at an angle of ε with the proposed axis
What is the minimum distance AB?

Wind farm design , the theory
2 wts must be placed along the axis x-x’ in such a manner that the
second turbine B is clear off the wake area created by the first turbine
A. The wind direction is at an angle of ε with the proposed axis
β=90o+δ, α+β+γ=180ο, α=90o-ε , and γ=ε-δ.also AD/sin(β)=AE/sin(γ).
ΑΕ=D/2 thus the length AD=Dcos(δ)/(2sin(ε-δ)).
For same diameter machines, AD=DB soΑΒ= Dcos(δ)/sin(ε-δ)……………(1)
Normally we express distances as multiples of diameters so ΑΒ=nD, then:
n= cos(δ)/sin(ε-δ)……………………(2)
Theoretically when ε=0ο then wt Β could be placed tangentially as it is shown in the next slide. For small values of the angle ε wt B is always in the
wake so it is recommended to put a distance of 10 D. For n=10 and δ=12ο, equation 2 gives ε=17.7ο.
This means that equation 2 should only be used for angles: 17.7ο < ε < 90ο.

Wind turbine A creates the wake. If we are not restricted by space, then the closest the
second turbine can be placed is along the line E-D-C or at the ark C-B which is 10
diameters behind.
Wind farm design , the theory

0
1
2
3
4
5
6
7
8
9
10
18 30 42 54 66 78 90
γωνία εο μεταξύ της διεύθυνσης του ανέμου και του άξονα
ανάπτυξης των μηχανών
ελ
άχ
ιστη
απ
όσ
τασ
η μ
ετα
ξύ μ
ηχ
αν
ών
, n
D
Dimitrios Kanellopoulos, ISBN 978-960-411-644-7
n= cos(δ)/sin(ε-δ)
ε
n
Wind farm design , the theory

If ε is greater than 90ο then the same analysis shows that:n= cos(δ)/sin(ε+δ)…………(3)
equation 3 is valid for angles 90ο < ε < 162,3ο. In case that 162,3ο < ε < 180ο
then a value of n=10 is recommended.
In case of turbines with different diameters D1 και D2 then the minimal distance is given by:
ΑΒ=AD+DB= (D1+D2)cos(δ)/2sin(ε-δ)………(4)for 17,7ο < ε < 90ο and
AB=(D1+D2)cos(δ)/2sin(ε+δ)………(5)για γωνίες 90ο < ε < 162,3ο.
Wind farm design , the theory

An applied example, STEP 1
Dimitrios Kanellopoulos, ISBN 978-960-411-644-7
Assume that
the available
land is along
the hill tops
defined by
lines, AB, CD,
DE, EF, FG,
GH and IJ
2 scenarios: wt NP=300 kW, D=30
m and wt NP=1 MW, D=45 m

An applied example
Location:
Chiotes, Rhodes,
Greece
The wind rose,
measurements
were conducted
between 1978
and 1981.
Prevailing or
dominant wind
directions are
WNW and NW
This means that future wind
farm must perform without
wake losses at least in these 2
wind directions

1 2 3 4 5 6 7 8
1η case WNW=292,5ο, same for ESE,
AB 284 60 127,5 1,51 45,3 6,3 7
CD 307 60 127,5 1,51 45,3 6,3 7
DE 315 87 154,5 4,19 125,7 2,5 3
EF 123 76 143,5 2,36 70,8 1,7 2
FG 123 14 81,5 1,04 31,2 3,9 4
GH 146 353 60,5 1,31 39,3 3,7 4
IJ 207 9 76,5 1,08 32,4 6,4 7
2η case W=270ο
AB 284 60 150 3,16 94,8 3 4
CD 307 60 150 3,16 94,8 3,2 4
DE 315 87 177 10 300 1 2
EF 123 76 166 10 300 0,4 1
FG 123 14 104 1,09 32,7 3,7 4
GH 146 353 83 1,03 30,9 4,7 5
IJ 207 9 99 1,05 31,5 6,6 7
3η case NW=315ο , same for SE
AB 284 60 105 1,1 33 8,6 9
CD 307 60 105 1,1 33 9,3 10
DE 315 87 132 1,66 49,8 6,3 7
EF 123 76 121 1,34 53,8 2,3 3
FG 123 14 59 1,34 53,8 2,3 3
GH 146 353 38 2,23 66,9 2,2 3
IJ 207 9 54 1,46 43,8 4,7 5
Desired distances along each line in order to avoid wake effects for W, WNW,NW, ESE και SE.AB 3,16 4
CD 3,16 4
DE 10 2
EF 10 1
FG 1,34 3
GH 2,23 3
IJ 1,46 5
1: name of line
2: length of line
in m
3: angle
between line and
the north to
south axis
4: angle ε
5: n( from
equations)
6: nD, minimum
distance among
wts in m
7:dived value of
column 2 with
column 6
8: maximum
number of wts
that can be
placed at this
line

An applied example, STEP 2
D=30 m, NP=300 kW, 14 wts, installed power 4.2 MW
Remember: Equations help
but common sense is also
needed

An applied example, STEP 3
D=45 m, NP=1000 kW, 10 wts, installed power 10 MW

Examples of possible wind farm layouts in an area of complex terrain
No of
wts
D, m NP, kW Wind
farm
power,
MW
13 25 200 2.6
9 30 300 2.7
7 35 400 2.8
Melanios, Chios, Greece

Canadian wind farm, D=82 m

Czech Republic, wind farm, D=82 m

Example of proposed wind farm layout in flat areas with plenty of
space, D=50 m

Austria, D=82 m

Brazil, D=72m, multiple rows of wts

Wind farms in the American planes of Texas
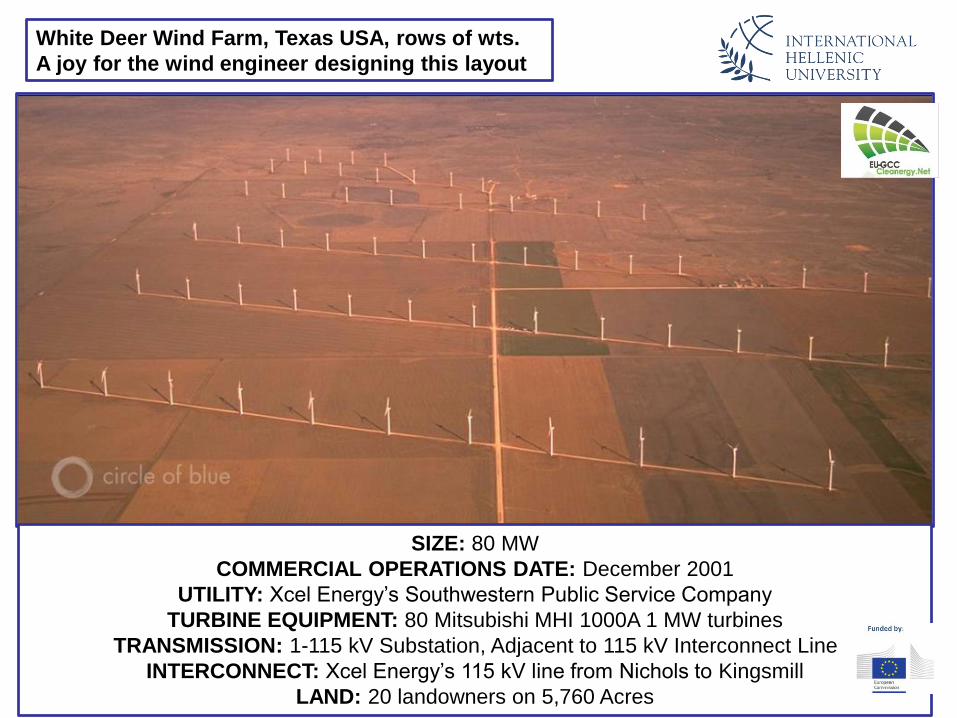
White Deer Wind Farm, Texas USA, rows of wts.
A joy for the wind engineer designing this layout
SIZE: 80 MW
COMMERCIAL OPERATIONS DATE: December 2001
UTILITY: Xcel Energy’s Southwestern Public Service Company
TURBINE EQUIPMENT: 80 Mitsubishi MHI 1000A 1 MW turbines
TRANSMISSION: 1-115 kV Substation, Adjacent to 115 kV Interconnect Line
INTERCONNECT: Xcel Energy’s 115 kV line from Nichols to Kingsmill
LAND: 20 landowners on 5,760 Acres

Vindeby, Denmark. 11 Turbines: Bonus 450/35,
NP=450kV, D=35m, Hr=35m AMSL,
2 rows, s = 300 m = 8,6D,
nD= 335 m = 9.6 D
s
nD
The first offshore wind farm in the world.

Vindeby, Denmark. 11 Turbines

Vindeby, Denmark. 11 Turbines: Bonus 450/B35,
plan view and interconnecting diagram

Denmark, Copenhagen, the Middelgrunden offshore wind park,
20 Bonus , NP= 2 MW, P=40 MW, D=76m, Hr=64m
http://www.thewindpower.net/windfarm_en_729_middelgrunden.php
s=2.4D=182 m

http://www.4coffshore.com/windfarms/prinses-amaliawindpark-netherlands-nl01.html
V80-2MW, 60 wts
P=120 MW
The Netherlands
Princes
Amaliawindpark

http://www.renewableuk.com/en/publications/
fact-sheets.cfm/UK-content-of-operating-offshore-wind-farms
offshore wind
farms UK

All numbers are to the end
of December 2015.
Analysis by
EnergyNumbers.info. Raw
data from ens.dk
Latest
rolling
12-month
capacity
factor
Life
capacity
factor
Age
(years)
Installed
capacity
(MWp)
Total
elec. gen.
(GWh)
Total 43.4% 41.1% 1271 33 837
Anholt 1 46.6% 48.3% 2.7 399.6 4 650
Avedøre Holme 43.0% 38.9% 5.5 10.8 202
Frederikshavn 33.6% 30.8% 12.6 7.6 259
Horns Rev I 43.8% 42.0% 13.2 160 7 763
Horns Rev II 41.1% 47.8% 6.3 209.3 5 551
Middelgrunden 27.6% 25.6% 15.0 40 1 345
Nysted (Rødsand) I 40.3% 37.3% 12.6 165.6 6 790
Nysted (Rødsand) II 46.9% 44.4% 5.5 207 4 463
Rønland I 45.4% 44.4% 13.0 17.2 867
Samsø 42.4% 39.6% 12.9 23 1 030
Sprogø 35.3% 35.4% 6.2 21 402
Tunø Knob 33.6% 30.3% 20.6 5 273
Vindeby 15.5% 22.9% 24.4 4.95 242
Capacity factors from offshore wind farms

Optimization of wind farm layout
I can’t wait to produce clean energy!

Optimization of wind farm layout with respect to:
production, visibility, low OPEX and other requirements such as overhead cables, roads,
noise etc.
Annual Energy Production (AEP) predictions.
For complex sites, Computational Fluid Dynamics (CFD) wind flow simulation for
optimizing wind turbine life time.
Identifications and recommendation of most optimal and suitable wind turbines for the
actual wind farm.
Environmental assessment (acoustic noise and shadow flickering)
Optimization of wind farm layout

Optimization of wind farm layouts, some of the market
products available today are:
These software simulates wind farm behavior, most importantly to calculate its energy
output. The user can usually input wind data, height and roughness contour lines
(topography), turbine specifications, background maps, and define environmental
restrictions. Processing this information produces the design of a wind farm that maximizes
energy production while accounting for restrictions and construction issues.
WAsP DTU Wind Energy
Furow Solute Ingenieros
WindFarm ReSoft
WindFarmer DNV GL
WindPRO EMD International A/S
meteodyn WT Meteodyn
WindSim Vector AS
openWind AWS Truepower

WAKEBENCH:
Benchmarking of Wind Farm Flow Models
OPERATING AGENT ORGANIZATIONS
National Renewable Energy Center (Cener), Spain
National Renewable Energy Laboratory, USA
Operating Agent Representatives:
Javier Sanz RODRIGO
National Renewable Energy Centre (CENER)
Email [email protected]
Patrick MORIARTY
National Renewable Energy Laboratory (NREL)
Email [email protected]
From Greece: www.cres.gr