Embed Size (px)
Citation preview
© 2018 WIT Press, www.witpress.comISSN: 2046-0546 (paper format), ISSN: 2046-0554 (online), http://www.witpress.com/journalsDOI: 10.2495/CMEM-V6-N3-527-539
S. Syngellakis, et al., Int. J. Comp. Meth. and Exp. Meas., Vol. 6, No. 3 (2018) 527–539
WELD ZONE MATERIAL CHARACTERISATION BASED ON SPHERICAL INDENTATION DATA
S. SYNGELLAKIS1, H. HABBAB2 & B. G. MELLOR2
1Wessex Institute, UK.2University of Southampton, UK.
ABSTRACTAn improved elasto-plastic characterisation technique relying on instrumented indentation data, accounting for frame compliance, spherical indenter imperfections and, most importantly, material pile-up at indentation edges was validated on experimental data from control specimens with known properties. The method was subsequently applied to the characterisation of weld regions for which tra-ditional testing methods are not applicable. Variations of elasto-plastic properties were obtained from indentations on a butt-welded steel specimen spanning the three distinct weld regions. The consistency of these results and their sensitivity to variations of experimental data was examined and discussed.Keywords: elasto-plastic properties, instrumented indentation, material pile-up, spherical indenter, weld zones
1 INTRODUCTIONSteel construction requires the assembly of structural steel components manufactured in dimensions that facilitate handling, transportation and installation. The most commonly used method of connecting these components is fusion welding. Thus the assessment of strength and response of welded joints is an essential design requirement to ensure safe load transfer between members. The behaviour of a welded joint is influenced not only by the strength of the weld metal and the joint geometry but also by the variation in the microstructure and, as a consequence, in material properties across the weld regions. The finite element method (FEM) can be applied to predict the response of such a complex solid structure but its relia-bility depends on the accuracy of the material input.
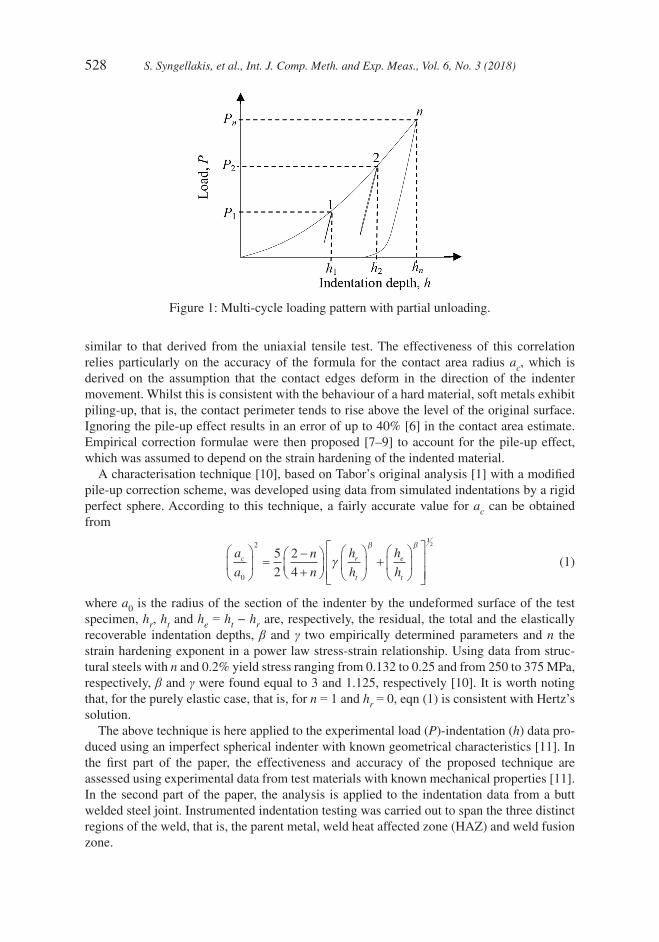
Conventional tensile testing is not applicable to the micrometre scale of microstructural variation. Various analytical approaches [1, 2] have been introduced to extract material prop-erties from load-indentation data obtained during a hardness test. One version of such methodology based on ball indentation experiments was applied specifically to the character-isation of weld regions in high strength low alloy steel [3]. The development of high-resolution measurement instruments that have the capability of continuous measurement of force and displacement has facilitated probing the material surface on the sub-micrometre scale using a very small indenter. The indentation can be carried out at each position in a pattern of suc-cessive cycles of loading-partial unloading with a progressively increasing peak load, as illustrated in Fig. 1. During partial unloading, the indenter is still in contact with the indent and the minimum load can be held for a pre-defined time. In the last cycle, unloading is complete.
Any of the obtained unloading curves can be correlated with the elastic properties of the indented material by applying elastic contact mechanics. The key quantities identified from this analysis are the contact area at full loading and the corresponding contact stiffness, lead-ing to the determination of hardness and the elastic modulus, respectively [4, 5]. Meyer hardness and the indent size, in conjunction with the indenter geometry, at different load levels, could then be correlated with the stress and strain, respectively, to generate a curve
528 S. Syngellakis, et al., Int. J. Comp. Meth. and Exp. Meas., Vol. 6, No. 3 (2018)
similar to that derived from the uniaxial tensile test. The effectiveness of this correlation relies particularly on the accuracy of the formula for the contact area radius ac, which is derived on the assumption that the contact edges deform in the direction of the indenter movement. Whilst this is consistent with the behaviour of a hard material, soft metals exhibit piling-up, that is, the contact perimeter tends to rise above the level of the original surface. Ignoring the pile-up effect results in an error of up to 40% [6] in the contact area estimate. Empirical correction formulae were then proposed [7–9] to account for the pile-up effect, which was assumed to depend on the strain hardening of the indented material.
A characterisation technique [10], based on Tabor’s original analysis [1] with a modified pile-up correction scheme, was developed using data from simulated indentations by a rigid perfect sphere. According to this technique, a fairly accurate value for ac can be obtained from
a
a
n
n
h
h
h
hc r
t
e
t0
25
2
2
4
=−
+
+
γ
β β11
2
(1)
where a0 is the radius of the section of the indenter by the undeformed surface of the test specimen, hr, ht and he = ht − hr are, respectively, the residual, the total and the elastically recoverable indentation depths, β and γ two empirically determined parameters and n the strain hardening exponent in a power law stress-strain relationship. Using data from struc-tural steels with n and 0.2% yield stress ranging from 0.132 to 0.25 and from 250 to 375 MPa, respectively, β and γ were found equal to 3 and 1.125, respectively [10]. It is worth noting that, for the purely elastic case, that is, for n = 1 and hr = 0, eqn (1) is consistent with Hertz’s solution.
The above technique is here applied to the experimental load (P)-indentation (h) data pro-duced using an imperfect spherical indenter with known geometrical characteristics [11]. In the first part of the paper, the effectiveness and accuracy of the proposed technique are assessed using experimental data from test materials with known mechanical properties [11]. In the second part of the paper, the analysis is applied to the indentation data from a butt welded steel joint. Instrumented indentation testing was carried out to span the three distinct regions of the weld, that is, the parent metal, weld heat affected zone (HAZ) and weld fusion zone.
Figure 1: Multi-cycle loading pattern with partial unloading.
S. Syngellakis, et al., Int. J. Comp. Meth. and Exp. Meas., Vol. 6, No. 3 (2018) 529
2 FRAME COMPLIANCE CALIBRATIONA reliable application of eqn (1) necessitates an accurate experimental value for ht, which, in the case of an instrumented test, intrinsically includes an apparent displacement due to the compliance of the loading frame. That amount can be removed through an iterative frame compliance calibration scheme, which incorporates the pile-up correction as expressed by eqn (1). The scheme uses a material sample of known elastic properties and comprises two steps: initially, indentation data are corrected by determining a frame compliance by an iter-ative application of the characterisation process without accounting for the pile-up correction. Equation (1) is then applied, yielding a new value of the contact area and the characterisation process is repeated. If the difference between successive corrections is within a predefined tolerance, the iteration process terminates and the resulting indentation depths at each peak load P are considered as the true material response. The iteration target is the prediction of a correct reduced elastic modulus Er from the Hertzian formula
d
d
P
hE a
er c= 2 (2)
using the contact stiffness for each loading cycle and the respective values of contact area radius generated in each iteration.
The frame compliance was found to decrease with load; this decrease can be attributed to the assumption on which eqn (2) is based, namely that a flat surface of the material is indented elastically by a rigid parabola. However, in the case of elasto-plastic indentation, the former does not recover to a flat surface. Furthermore, the plastic deformation induced during inden-tation causes the surface of the residual impression to be different from a perfect parabola or even sphere. As a result, contact stiffness, that is, the gradient of the unloading indentation curve, appears to increase with load due to the extent of plastic deformation and the same applies to Er calculated from eqn (2), when it should be constant since it is a material prop-erty. This is, in return, reflected on the frame compliance, which should be constant but appears to decrease with load to account for the error in the calculated Er.
In order to confirm that the frame compliance does not depend on the choice of test speci-men, four steel specimens with known elastic properties were used for frame calibration purposes. Frame compliance was found to be nearly insensitive to changes in tested material, with a variation of less than 0.5%. The average of the resulting frame compliance values for every peak load value was adopted in subsequent applications of the characterisation process.
Thus the frame compliance was shown to be a machine characteristic and its experimen-tally established relation with load was subsequently used as a machine compliance curve in characterisations based on raw experimental data from testing materials with unknown properties.
3 ASSESSMENT OF THE APPLIED METHODOLOGY
3.1 Effect of indenter imperfection
The characteristic strain, er, was considered by Tabor [1] in linking the strain of the derived stress–strain curve to the indentation parameters. For a perfect sphere of radius R, the characteristic strain can be evaluated from
er = 0.20(ac/R) = 0.20 sinφ, (3)
530 S. Syngellakis, et al., Int. J. Comp. Meth. and Exp. Meas., Vol. 6, No. 3 (2018)
where φ is the angle between the tangent to the indenter profile at the contact edge and the original surface of the indented specimen. However, the indentations of the present study were performed with an imperfect spherical indenter, for which eqn (3) is not satisfied exactly. This necessitated the adoption and comparison of two possible approaches for computing the characteristic strain based on a thorough quantitative description of the imperfect spherical profile geometry [11].
First, the radius of an axi-symmetric arc fitted to the part of the profile between a point and the indenter tip was adopted as the radius of curvature of the indenter at that point along its profile [11] and er was assumed equal to 0.20(ac/R). Thus er depended not only on contact depth hc but also on a significant portion of the indenter profile. Then the gradient of the indenter profile at a point was taken to be the gradient of the line fitted to a portion of the profile in the neighbourhood of that point and er was assumed given by er = 0.20sinφ. Thus this latter approach yielded a characteristic strain at a point depending locally on the shape of the profile.
A stainless steel and two grades of carbon steel designated S3 and S5 were used as control materials whose mechanical properties had been determined through tensile tests [11]. The indentation data from these materials were entered into the characterisation analysis to obtain the corresponding stress-strain data. By fitting the power law
σ = Ken (4)
to these data points, the strain hardening parameters n and K were obtained and employed to calculate σ0.2 representing the yield stress. It should be noted that carbon steel exhibits a yield plateau, which cannot be reproduced by the characterisation technique. The latter is therefore expected to work better with materials with a smooth stress-strain curve such as stainless steel.
The experimentally obtained and predicted material parameters can be compared by refer-ring to Table 1. It is seen in that table, that the first approach considerably underestimates n whilst overestimates σ0.2. Moreover, the slope of the predicted stress-strain curves was noted not to decrease monotonically over a certain strain range suggesting that the characteristic strain adopted over this range did not reflect the indenter geometry.
The values of n and σ0.2 predicted by the second approach, although still smaller, appear closer to those from tensile tests than those obtained by the first approach. The low n in the case of S3 and S5 can be attributed to the presence of a yield plateau in the actual σ–ε curve
Table 1: Plastic properties from tensile tests and those calculated from indentation data based on two different expressions for characteristic strains.
σ–ε curve from tensile test
Predicted σ–ε using εr= 0.2ac/R
Predicted σ–ε using εr= 0.2sinφ
nσ0.2 (MPa) n
σ0.2 (MPa) n
σ0.2 (MPa)
Stainless steel
0.2748 285.5 0.1916 301.2 0.2493 268.3
S5 0.1676 390.5 0.0958 416.1 0.1430 362.1S3 0.1883 317.4 0.1122 345.4 0.1377 316.4
S. Syngellakis, et al., Int. J. Comp. Meth. and Exp. Meas., Vol. 6, No. 3 (2018) 531
of these materials. Hence, the σ–ε curve resulting from using the characteristic strain in terms of sinφ can be considered as the better approximation of that obtained from the tensile test.
3.2 Experimental validation
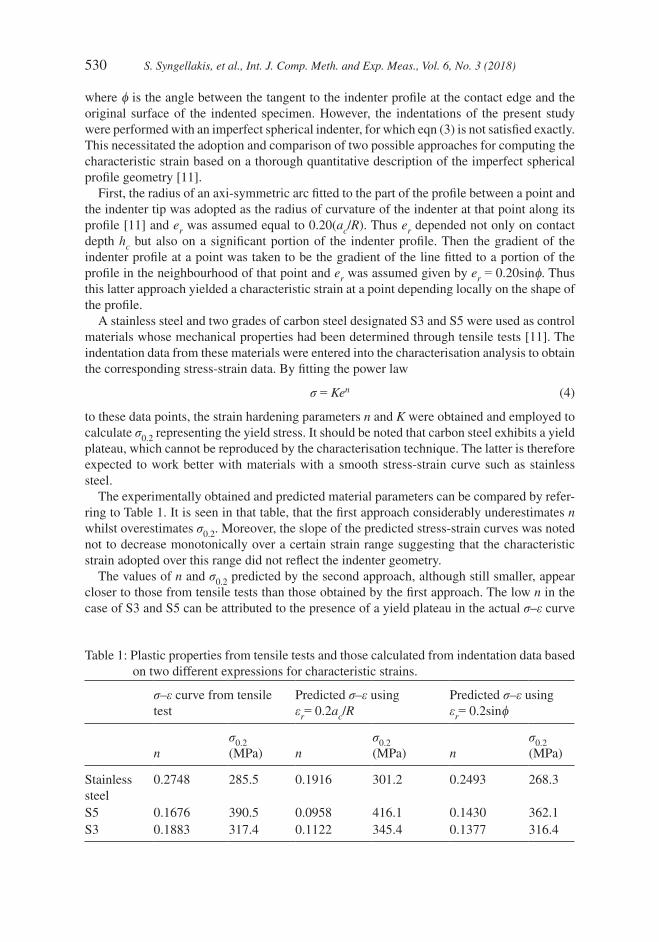
Indentations were conducted on four grades of mild steel, designated S3, S5–S7, and a stainless steel; the test data were entered into the characterisation analysis with the pile-up correction governed by eqn (1) and 0.20sinφ as a measure of the characteristic strain. The analysis yielded the true contact area, Meyer hardness and characteristic strain at every cycle peak. Results from five experiments for each material were grouped together and used to generate stress-strain data points to which the power law, eqn (4), was then fitted. Thus, the resulting curve represented the equivalent average of all data points. The knowledge of Young’s modulus E and the calculation of σ0.2 allowed the generation of complete stress–strain curves. Two of the latter, one for stain-less steel and another for one grade of mild steel, can be compared with the corresponding original ones from the tensile tests by referring to Fig. 2.
The results for n and σ0.2 can be compared with the corresponding values from tensile tests by referring to Table 2. Due to its influence on the predicted properties, the extent of the yield plateau strain and its ratio to yield strain is also included in the table.
Figure 2: Stress–strain curves predicted from five indentation experiments with the corresponding ones obtained from tensile tests: (a) stainless steel; (b) mild steel.
Table 2: Comparison of the σ–ε curve parameters from the tensile test with those generated from indentation data.
σ–ε from tensile tests σ–ε from indentation data
nσy (MPa)
Extent of yield plateau strain (%)
Extent of yield plateau strain/ey n
σ0.2 (MPa)
S3 0.188 317 0.80 228 0.113 349S5 0.168 391 1.35 350 0.075 415S6 0.176 375 0.80 211 0.152 317S7 0.161 395 0.88 227 0.125 374Stainless steel
0.275 286 0 0 0.258 250
532 S. Syngellakis, et al., Int. J. Comp. Meth. and Exp. Meas., Vol. 6, No. 3 (2018)
As can be noted in Fig. 2 and Table 2, the predicted n values are lower than those from the tensile tests whilst σ0.2 is within 10% of the respective values from the tensile test except for S6, where the error is about 15%. Despite these differences, the derived stress-strain curve as a whole appears to represent material behaviour equivalent to that observed during the corre-sponding tensile test.
The lower value of the predicted n compared with the true one can be attributed to the presence of the yield plateau, whose influence appears to be averaged over the post-yield part of the σ–ε curve. It can be deduced from Table 2 that the underestimation of n increases with increasing extent of yield plateau strain but also decreases when the ratio of the latter to yield strain ey decreases. Thus the influence of the yield plateau becomes more significant for small values of ey.
Discrepancies in n can also be attributed to underestimation of the characteristic strain, which has been found greater than 0.2, its theoretically maximum value, by FE analysis [11]. Another contributing factor could be the strong non-uniformity of elasto-plastic strain below the indenter, especially at high loads.
3.3 Numerical validation
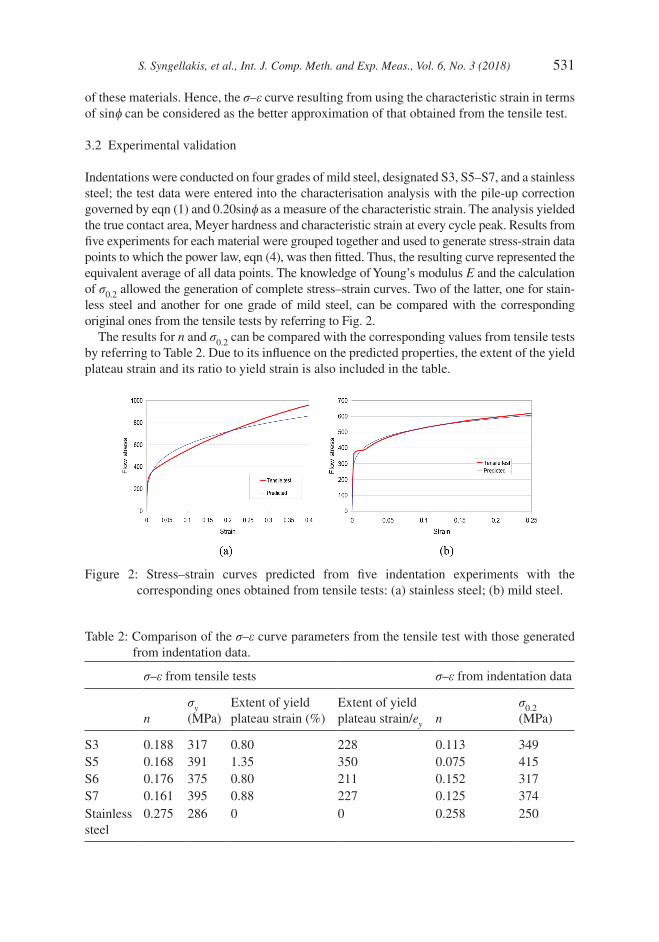
The hypothesis that the derived stress–strain curve, which has no yield plateau, is equivalent to the original curve determined by the tensile test was assessed by using it as input into a developed FE model [11] to simulate indentation in a cyclic loading pattern reaching peak loads almost the same as, or close to those in the experiments. The result of this simulation is presented in Fig. 3 for the mild steel specimen S6 together with that from the corresponding experiment. The good agreement between the two results observed in Fig. 3 confirms that, despite the difference in n, the material characterised by the derived stress-strain relation behaves in an equivalent manner to the tested one as far as response to indentation is concerned.
3.4 Effect of inhomogeinity
The test materials are modelled as homogeneous and perfectly isotropic. However, they are not homogeneous on the micro scale since the microstructure consists of small grains. Depending on the number of grains included in every indent and the density of the grain
Figure 3: Indentation curves for S6 with the corresponding FE predictions using as input the stress-strain curve derived from the same data.
S. Syngellakis, et al., Int. J. Comp. Meth. and Exp. Meas., Vol. 6, No. 3 (2018) 533
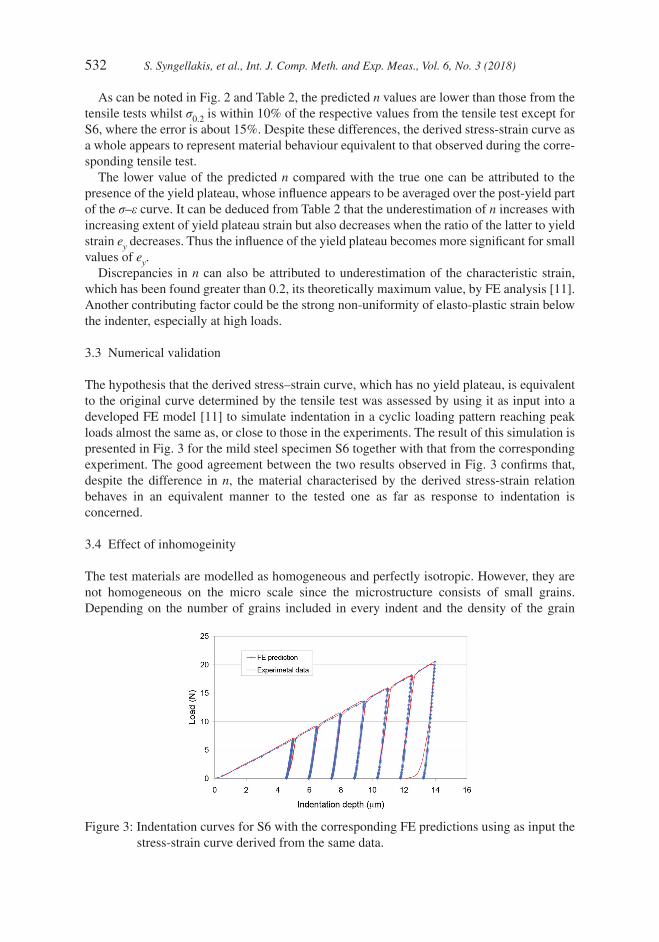
boundaries, the resulting P–h curve will vary from one location to another. In order to evalu-ate this variation and to investigate its effect on the results, the five indentation experiments on stainless steel were treated individually. The stress–strain curves resulting from analysing the corresponding indentation data can be compared to that obtained from the tensile test by referring to Fig. 4. It can be noticed that even though the P–h curves appeared very similar, the characteristics of the predicted individual stress-strain curves vary. The average of these curves represents the overall material behaviour in a similar way as the results from a tensile test reflect the average behaviour of many grains of the material.
4 WELDED JOINT CHARACTERISATION
4.1 Specimen details
A steel plate of 8 mm thickness was cut and then joined using a single pass sub arc weld to form a butt-welded joint. The joint was then cut across the weld line, and the cross sectional area was grounded and polished to mirror finishing using 1 mm diamond paste. Indentation testing was carried out on the cross sectional area to span the three distinct regions of the weld, that is, the parent metal, weld heat affected zone and weld fusion zone. Six rows of indents were performed. The second and the fifth rows of indentations were performed using a con-ventional Vickers micro-indentation tester, whilst the rest were produced using the provided spherical indenter on the instrumented micro-indentation tester.
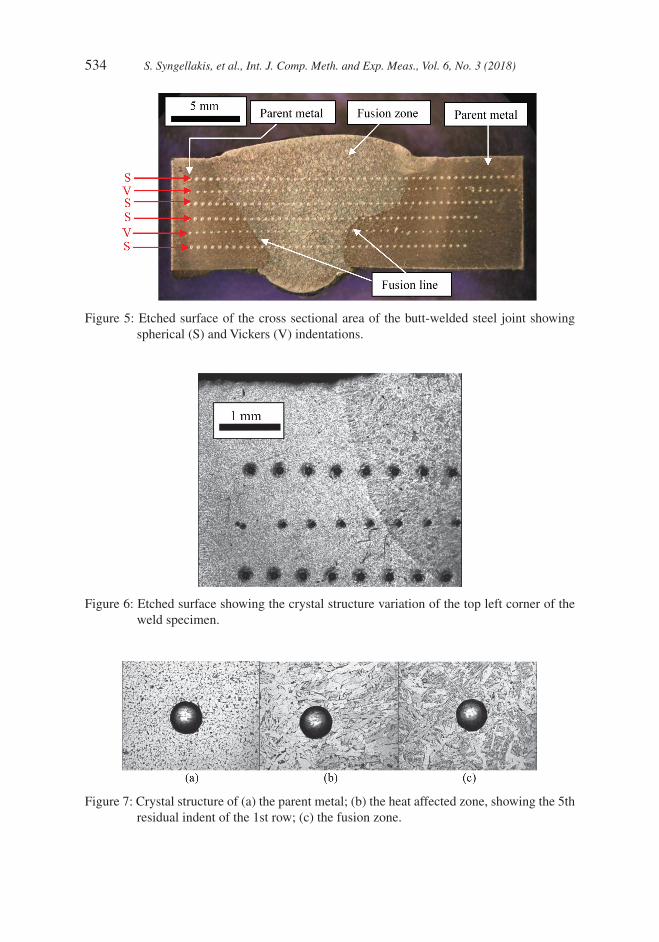
The indented surface was then etched to reveal the variation of the grain structure across the various material boundaries as shown in Fig. 5. The location of each indent relative to the three regions of weld is also shown in the same figure.
A microscopy photograph showing a close-up view of the crystal structure variation from the parent metal towards the fusion zone of welding is presented in Fig. 6. The pho-tograph shows the top left corner part of the specimen with some indents from the first three rows.
As can be observed in Fig. 6, welding caused a noticeable change in the microstructure of the metal in the vicinity of the weld fusion zone making this area inhomogeneous. A detailed comparison of the crystal structure in the various weld regions, i.e. parent metal, HAZ, and fusion zone can be made by referring to Fig. 7.
Figure 4: Predicted stress–strain curves from the five experiments on the stainless steel sample compared with the stress-strain curve from the tensile test.
534 S. Syngellakis, et al., Int. J. Comp. Meth. and Exp. Meas., Vol. 6, No. 3 (2018)
Figure 5: Etched surface of the cross sectional area of the butt-welded steel joint showing spherical (S) and Vickers (V) indentations.
Figure 6: Etched surface showing the crystal structure variation of the top left corner of the weld specimen.
Figure 7: Crystal structure of (a) the parent metal; (b) the heat affected zone, showing the 5th residual indent of the 1st row; (c) the fusion zone.
S. Syngellakis, et al., Int. J. Comp. Meth. and Exp. Meas., Vol. 6, No. 3 (2018) 535
The photographs in Fig. 7 illustrate the distinct features of the crystal structures across the weld regions. In the parent metal, the grains are small, rounded and equiaxial whilst in the fusion zone the grains become much larger and acicular. A gradual change between the two structures is observed in the heat-affected zone.
4.2 Predictions of mechanical properties
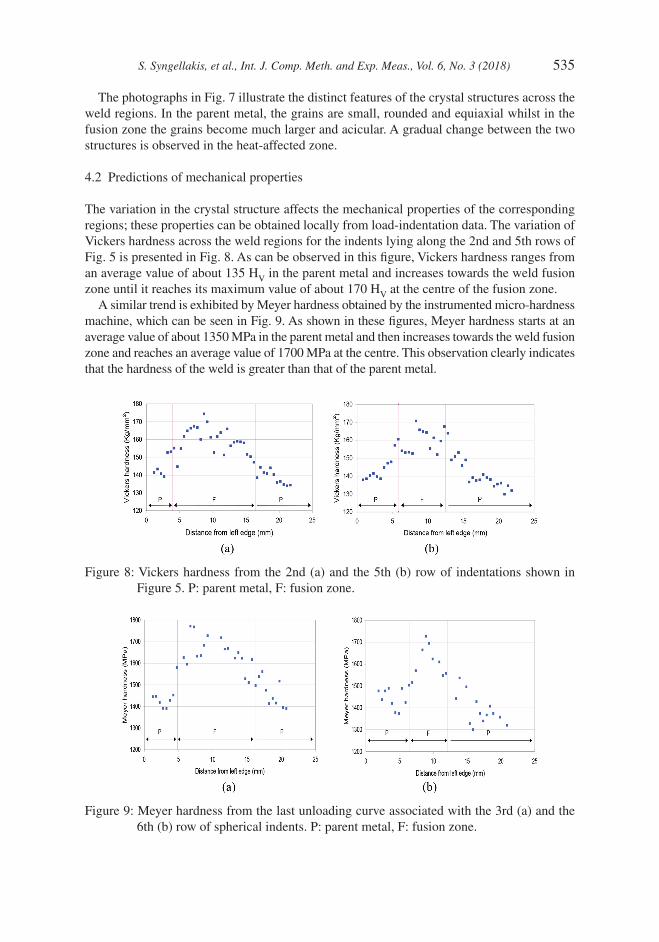
The variation in the crystal structure affects the mechanical properties of the corresponding regions; these properties can be obtained locally from load-indentation data. The variation of Vickers hardness across the weld regions for the indents lying along the 2nd and 5th rows of Fig. 5 is presented in Fig. 8. As can be observed in this figure, Vickers hardness ranges from an average value of about 135 HV in the parent metal and increases towards the weld fusion zone until it reaches its maximum value of about 170 HV at the centre of the fusion zone.
A similar trend is exhibited by Meyer hardness obtained by the instrumented micro-hardness machine, which can be seen in Fig. 9. As shown in these figures, Meyer hardness starts at an average value of about 1350 MPa in the parent metal and then increases towards the weld fusion zone and reaches an average value of 1700 MPa at the centre. This observation clearly indicates that the hardness of the weld is greater than that of the parent metal.
Figure 8: Vickers hardness from the 2nd (a) and the 5th (b) row of indentations shown in Figure 5. P: parent metal, F: fusion zone.
Figure 9: Meyer hardness from the last unloading curve associated with the 3rd (a) and the 6th (b) row of spherical indents. P: parent metal, F: fusion zone.
536 S. Syngellakis, et al., Int. J. Comp. Meth. and Exp. Meas., Vol. 6, No. 3 (2018)
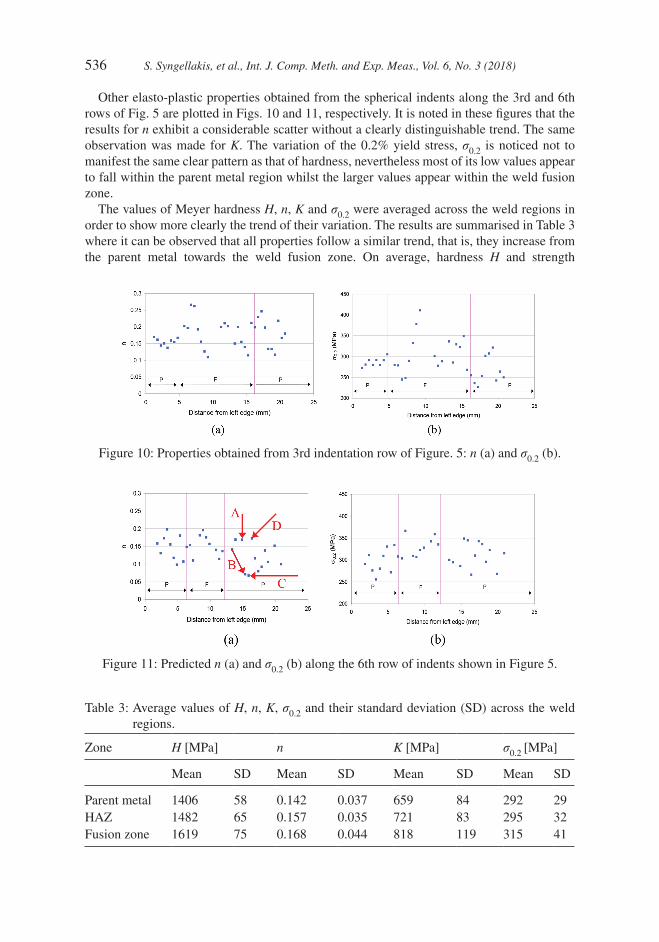
Other elasto-plastic properties obtained from the spherical indents along the 3rd and 6th rows of Fig. 5 are plotted in Figs. 10 and 11, respectively. It is noted in these figures that the results for n exhibit a considerable scatter without a clearly distinguishable trend. The same observation was made for K. The variation of the 0.2% yield stress, σ0.2 is noticed not to manifest the same clear pattern as that of hardness, nevertheless most of its low values appear to fall within the parent metal region whilst the larger values appear within the weld fusion zone.
The values of Meyer hardness H, n, K and σ0.2 were averaged across the weld regions in order to show more clearly the trend of their variation. The results are summarised in Table 3 where it can be observed that all properties follow a similar trend, that is, they increase from the parent metal towards the weld fusion zone. On average, hardness H and strength
Figure 10: Properties obtained from 3rd indentation row of Figure. 5: n (a) and σ0.2 (b).
Figure 11: Predicted n (a) and σ0.2 (b) along the 6th row of indents shown in Figure 5.
Table 3: Average values of H, n, K, σ0.2 and their standard deviation (SD) across the weld regions.
Zone H [MPa] n K [MPa] σ0.2 [MPa]
Mean SD Mean SD Mean SD Mean SD
Parent metal 1406 58 0.142 0.037 659 84 292 29HAZ 1482 65 0.157 0.035 721 83 295 32Fusion zone 1619 75 0.168 0.044 818 119 315 41
S. Syngellakis, et al., Int. J. Comp. Meth. and Exp. Meas., Vol. 6, No. 3 (2018) 537
coefficient K show a more pronounced variation across the weld regions. It is worth noting that the average value of the 0.2% yield stress obtained for the parent metal is consistent with the yield stress of 43A-grade steel plate which was found to lie between 300 and 317 MPa from tensile testing.
4.3 Experimental scatter
It was thought important to investigate the cause of the large scatter in the results for n and K, in order to assess the sensitivity of these parameters to variation of experimental input. Two arbitrary pairs of adjacent points, which correspond to abrupt changes in the values of n were chosen, labelled (A, B) and (C, D) as shown in Fig. 11(a). The percentage change in value of H, σ0.2, K and n between the two points in each pair amounts to 12%, 20%, 30%, and 59%, respectively.
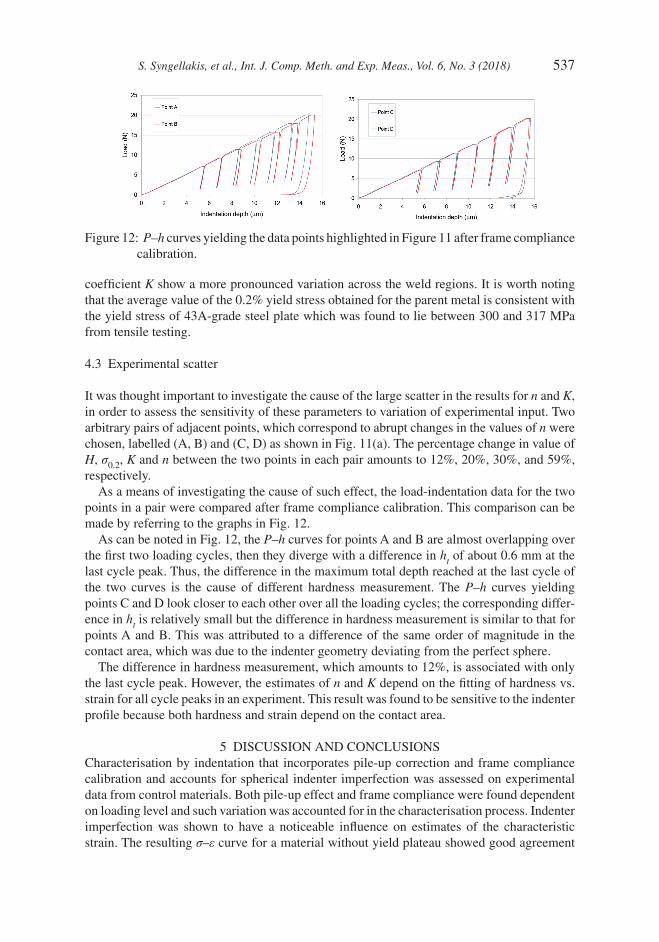
As a means of investigating the cause of such effect, the load-indentation data for the two points in a pair were compared after frame compliance calibration. This comparison can be made by referring to the graphs in Fig. 12.
As can be noted in Fig. 12, the P–h curves for points A and B are almost overlapping over the first two loading cycles, then they diverge with a difference in ht of about 0.6 mm at the last cycle peak. Thus, the difference in the maximum total depth reached at the last cycle of the two curves is the cause of different hardness measurement. The P–h curves yielding points C and D look closer to each other over all the loading cycles; the corresponding differ-ence in ht is relatively small but the difference in hardness measurement is similar to that for points A and B. This was attributed to a difference of the same order of magnitude in the contact area, which was due to the indenter geometry deviating from the perfect sphere.
The difference in hardness measurement, which amounts to 12%, is associated with only the last cycle peak. However, the estimates of n and K depend on the fitting of hardness vs. strain for all cycle peaks in an experiment. This result was found to be sensitive to the indenter profile because both hardness and strain depend on the contact area.
5 DISCUSSION AND CONCLUSIONSCharacterisation by indentation that incorporates pile-up correction and frame compliance calibration and accounts for spherical indenter imperfection was assessed on experimental data from control materials. Both pile-up effect and frame compliance were found dependent on loading level and such variation was accounted for in the characterisation process. Indenter imperfection was shown to have a noticeable influence on estimates of the characteristic strain. The resulting σ–ε curve for a material without yield plateau showed good agreement
Figure 12: P–h curves yielding the data points highlighted in Figure 11 after frame compliance calibration.
538 S. Syngellakis, et al., Int. J. Comp. Meth. and Exp. Meas., Vol. 6, No. 3 (2018)
with that from the tensile test. Although n was underestimated, the overall accuracy of the prediction appeared to exceed that achieved by other investigators [12]. It should be noted that the σ-ε curve is built from estimates of the hardness parameters n and K, it cannot there-fore represent correctly materials with significant yield plateau. Future work should therefore focus on relating the indentation data to the yield plateau as well and attempting to predict its extent.
On testing the weld regions of a butt-welded joint, Meyer hardness showed a more or less smooth variation across the weld regions agreeing with that determined by the conventional Vickers tester. Its values increased from the parent metal towards the centre of the fusion zone. The other parameters characterising the derived σ–ε curve, namely σ0.2, K and n, exhib-ited considerable scatter but followed a trend similar to that of hardness. The scatter, especially for the values of n was proven not to be a direct consequence of the performance of the new analysis technique. Other factors thought to be the reason for such scatter are:
• The imperfection of the indenter profile and the consequent uncertainty regarding the defi-nition and evaluation of the characteristic strain.
• The variation in the material crystal structure resulting in local inhomogeneity and anisot-ropy on the micro scale.
• Irregularities in the crystal structure in the HAZ and fusion zone due to the welding pro-cess, impurities and imperfection of the weld.
When comparison is made between the derived stress-strain curve and that obtained from the tensile test, the fundamental differences of these two testing methods should be borne in mind. The tensile testing is a displacement controlled static testing through which the mate-rial undergoes uniform stress field that gradually increases with load in a smooth transition from linear elastic to the elasto-plastic stage. The resulting curve represents the average behaviour of the whole material in the specimen. On the other hand, the indentation testing is load controlled and implies application of high strain rate. The strain field beneath the indenter changes in a steep gradient in both directions, that is, in the plane of the indented surface and along the indentation depth, hence the response of the material under such con-ditions can differ from that in a tensile test. Indentation testing also reflects an average response of the crystals enclosed within the indentation zone, hence the more crystals enclosed beneath the indenter, the more representative the indentation data of that localised region of the material.
The variable material properties measured across the weld regions can be used as materials input into an FE model of the whole welded joint to simulate its behaviour under different loading conditions. By this provision of a more realistic description of the material comprising the joint, a more accurate response of the joint can be predicted.
REFERENCES [1] Tabor, D., A simple theory of static and dynamic hardness. Proceedings, Royal Society
of London, Series A: Mathematical and Physical Sciences, 192, pp. 247–274, 1948. https://doi.org/10.1098/rspa.1948.0008
[2] Doerner, M.F. & Nix, W.D., A method for interpreting the data from depth-sensing indentation instruments. Journal of Materials Research, 1(4), pp. 601–609, 1986.https://doi.org/10.1557/jmr.1986.0601
S. Syngellakis, et al., Int. J. Comp. Meth. and Exp. Meas., Vol. 6, No. 3 (2018) 539
[3] Sneddon, I.N., The relation between load penetration in the axisymmetric Boussinesq problem for a punch of arbitrary profile. International Journal of Engineering Science, 3(1), pp. 47–57, 1965.https://doi.org/10.1016/0020-7225(65)90019-4
[4] Ghosh, S., Pal, T.K., Mukherjee, S., Das, G. & Ghosh, S., Comparative study of heat-affected zone with weld and base material after post-weld heat treatment of HSLA steel using ball indentation technique. Journal of Materials Science, 43(16), pp. 5474–5482, 2008. https://doi.org/10.1007/s10853-008-2840-6
[5] Pharr, G.M., Oliver, W.C. & Brotzen, F.R., On the generality of the relationship among contact stiffness, contact area, and elastic modulus during indentation. Journal of Materials Research, 7(3), pp. 613–617, 1992.https://doi.org/10.1557/jmr.1992.0613
[6] Bolshakov, A., Oliver, W.C. & Pharr, G.M., Influences of stress on the measurement of mechanical properties using nanoindentation: Part II. Finite element simulations. Journal of Materials Research, 11(3), pp. 760–768, 1996.https://doi.org/10.1557/jmr.1996.0092
[7] Matthews, J.R., Indentation hardness and hot pressing. Acta Metallurgica, 28(3), pp. 311–318, 1980.https://doi.org/10.1016/0001-6160(80)90166-2
[8] Hill, R., Storakers, B. & Zdunek, A.B., A theoretical study of the Brinell hardness test. Proceedings of the Royal Society of London Series A: Mathematical Physical and Engineering Sciences, 423(1865), pp. 301–330, 1989.https://doi.org/10.1098/rspa.1989.0056
[9] Taljat, B., Zacharia, T. & Kosel, F., New analytical procedure to determine stress-strain curve from spherical indentation data. International Journal of Solids and Structures, 35(33), pp. 4411–4426, 1998.https://doi.org/10.1016/s0020-7683(97)00249-7
[10] Habbab, H., Mellor, B.G. & Syngellakis, S., Post-yield characterisation of metals with significant pile-up through spherical indentations. Acta Materialia, 54, pp. 1965–1973, 2006.https://doi.org/10.1016/j.actamat.2005.12.021
[11] Habbab, H., Post-yield characterisation of welds based on instrumented hardness tester data. PhD Thesis, University of Southampton, 2005.
[12] Herbert, E.G, Pharr, G.M, Oliver, W.C, Lucas, B.N. & Hay, J.L., On the measurement of stress–strain curves by spherical indentation. Thin Solid Films, 398–399, pp. 331–335, 2001.https://doi.org/10.1016/s0040-6090(01)01439-0