Embed Size (px)
Citation preview

DI
SC
US
SI
ON
P
AP
ER
S
ER
IE
S
Forschungsinstitut zur Zukunft der ArbeitInstitute for the Study of Labor
Well-being Inequality and Reference Groups:An Agenda for New Research
IZA DP No. 4727
January 2010
Bernard Van Praag

Well-being Inequality and
Reference Groups: An Agenda for New Research
Bernard Van Praag University of Amsterdam, Tinbergen Institute,
CESifo, DIW Berlin and IZA
Discussion Paper No. 4727 January 2010
IZA
P.O. Box 7240 53072 Bonn
Germany
Phone: +49-228-3894-0 Fax: +49-228-3894-180
E-mail: [email protected]
Any opinions expressed here are those of the author(s) and not those of IZA. Research published in this series may include views on policy, but the institute itself takes no institutional policy positions. The Institute for the Study of Labor (IZA) in Bonn is a local and virtual international research center and a place of communication between science, politics and business. IZA is an independent nonprofit organization supported by Deutsche Post Foundation. The center is associated with the University of Bonn and offers a stimulating research environment through its international network, workshops and conferences, data service, project support, research visits and doctoral program. IZA engages in (i) original and internationally competitive research in all fields of labor economics, (ii) development of policy concepts, and (iii) dissemination of research results and concepts to the interested public. IZA Discussion Papers often represent preliminary work and are circulated to encourage discussion. Citation of such a paper should account for its provisional character. A revised version may be available directly from the author.

IZA Discussion Paper No. 4727 January 2010
ABSTRACT
Well-being Inequality and Reference Groups: An Agenda for New Research
In this paper it is argued that subjective well-being of the individual depends on two types of variables. The first type consists of characteristics of the individual himself, such as age, health, income, etc. The second type of variables consists of the characteristics of the individuals belonging to his reference group. The vast literature about happiness, quality of life, and well-being informs us extensively about the effects of objective variables. How the second type affects well-being is much less investigated. It is argued that the concept of well-being inequality cannot be properly defined without taking the referencing process into account. The reference effect depends on how frequently individuals compare with others and on the degree of social transparency in society. We attempt to give a structural embedding of the idea of reference groups in SWB-models. In this paper we employ the reference-extended model for incorporating in happiness studies the concept of inequality in happiness or SWB. Finally, we plead for an extension of the present happiness paradigm by setting up a new additional agenda for empirical research in order to get quantified knowledge about the referencing process. As a first step we suggest a new question module to be included in new survey questionnaires. JEL Classification: D31, D62, D63, I31 Keywords: subjective well-being, happiness, inequality, reference group Corresponding author: Bernard M.S. van Praag University of Amsterdam Roetersstraat 11 Room 11.03, Building E 1018 WB Amsterdam The Netherlands E-mail: [email protected]

Well-being Inequality and Reference Groups
An Agenda for New Research 3
Version January 11, 2010
1. Introduction
In the body of traditional economics the role of the utility concept has been ambiguous.
On the one hand it is central in micro –economic model building to explain human choice
behavior. On the other hand it is shunned, since it appeared very hard to give it an
empirical content. With respect to the explanation of choice behavior this could be
overcome by introducing the concept of ordinal utility. However, if we are interested in
inequality, the concept of ordinal utility becomes useless, for the cornerstone of the
inequality concept is the assumption that the situation of individuals can be compared,
not only in terms of better and worse, but also in terms of how much better or worse. If
we want to compare individual well-being between individuals, it requires a cardinal well
–being1 concept.
Notwithstanding this, the inequality concept has already a long history in economics.
Things started with measuring income inequalities. These were statistical parameters that
described the distribution of observed incomes. Well- known examples are the Pareto α,
the standard deviation of log – incomes or Theil’s entropy measure. In terms of such
measures perfect equality corresponds with a value zero.
Atkinson (1970) was one of the first who devised an inequality measure that was more
than a statistical measure. Although he never stated this explicitly, he proposed in fact
that the relevant measure to gauge social inequality is not the inequality of incomes but
the inequality of individual well –being. This inequality measure was based on a social
welfare function (SWF) where minimum inequality corresponds with the situation where
the social welfare function is maximized and due to concavity everybody enjoys an equal
amount of utility or well -being. Atkinson suggested that this measure did not involve a
1 In line with the modern happiness economics literature we use the terms utility, welfare, well-being and satisfaction as standing for the same empirical concept. Although from a philosophical and semantic point of view we may differentiate between the concepts, in practice this appears impossible.

Well-being Inequality and Reference Groups
An Agenda for New Research 4
Version January 11, 2010
cardinal utility concept, but this is debatable. Taking averages over utility implies a
cardinality concept. The weakness of the approach was that there was no empirical
foundation for the specification of the underlying utility function of income.
At about the same time the present author (1971) argued that by means of a subjective
questioning technique one could define and estimate a cardinal welfare function of
income, which later on became a key concept of the Leiden School and which can be
seen as a forerunner of modern happiness economics estimation methods. By combining
empirically estimated well –being with theoretical inequality indexes, the theoretical
inequality concept could be empirically filled. A first example was how Atkinson’s index
was empirically implemented in Van Praag (1977) (see also Van Praag and Ferrer-i-
Carbonell (2004, ch. 13)).
Apart from the cardinality issue there is a potential second problem with well-being
inequality measures in general. income inequality measures are explicitly or implicitly
based on a transferable utility concept. Indeed, income can be redistributed. There are
however more well-being determinants than income (e.g. health, age, education, and IQ).
Most of these determinants cannot be redistributed but they are relevant for well -being,
and inter-individual differences in those non-income determinants may cause feelings of
well –being inequality as well. It follows that well-being inequality cannot be a simple
generalization of income inequality, as feelings of inequality in well –being may be
caused by many factors, only one of which is income. We do not have a simple ideal
benchmark of what is minimal inequality either. Theoretically, this has to be equality of
individual well –being, but this concept is empty, as long as we do not accept an
empirical individual well –being concept .
Nowadays the results of happiness economics have led to a beginning acceptance of the
possibility to estimate subjective well–being directly by means of evaluation questions of
the type :
how do you evaluate your life as a whole on a scale from 0 to 10, where zero stands for
the worst and 10 for the best situation.?

Well-being Inequality and Reference Groups
An Agenda for New Research 5
Version January 11, 2010
We refer to Frey and Stutzer (2002), Layard (2005), Van Praag and Ferrer-i-Carbonell
(2003, 2004, 2008), Clark, Frijters, and Shields (2008), Dolan et al. (2008), Graham
(2008) for surveys of the blooming literature.
In this paper we shall argue that the present model used in happiness literature is
essentially incomplete. The present literature2 is in essence about empirically estimating
the equation , where x stands for a vector of characteristics of the individual x.
In relatively few contributions the impact of the reference group of the individual is
recognized. This is done by including the average income
( )U U x=
refx of the reference group and
positing and estimating the extended model ( , )refU U x x= . However, if we look at
inequality this model is insufficient. Inequality summarizes the inter-individual
comparison process, where both the question of how much importance the individual
assigns to comparisons with others and the variation between individuals within the
reference group plays an important role as well.
In Section 2 we shall discuss the operational concept of subjective well–being. In Section
3 we shall develop the corresponding well–being inequality concept. In section 4 we shall
take account of the fact that no individual evaluates in isolation, but that the
circumstances of his reference group co–determine his norms on what is subjective well–
being. It follows that the phenomenon of social transparency or lack of transparency
plays a role in the evaluation of social subjective well–being. This calls for developing a
model of the referencing process and the definition of a personal subjective inequality
concept, which describes the inequality the individual perceives between his satisfaction
level and the satisfaction levels of others in his reference group. In Section 5 we
aggregate those feelings of personal inequality into a social subjective inequality concept.
The aim of this paper is to sketch a theoretical model of how the reference mechanism
affects individual well–being and, consequently, the well –being inequality concept.
Finally, we consider how these insights may contribute to the shaping of social policy. In
this paper we do not give an empirical application. The reason for this is that we do not
2 In section 2 we shall look more in detail on the present literature.

Well-being Inequality and Reference Groups
An Agenda for New Research 6
Version January 11, 2010
know of the existence of a data set that would make it possible to estimate the model. In
Section 6 we discuss how these concepts might be made operational in practice.
In Section 7 we shall briefly consider the implications for social policy, while Section 8
concludes.
This paper may also be read as a plea for creating more empirical information on the
referencing process by extracting information from individuals in surveys and
experimental settings.
We hope that the model outlined in this paper may be a fruitful starting point for
integrating the referencing mechanism in happiness economics. This is the final objective
of this paper.

Well-being Inequality and Reference Groups
An Agenda for New Research 7
Version January 11, 2010
n n
2. Subjective well–being.
The concept of subjective well–being is empirically based on the so-called satisfaction
questions like the one cited in the introduction. Such satisfaction questions can also be
posed with respect to life domains, such as health, financial situation and job situation,
yielding empirical evaluations of domain satisfaction or domain well –being. The
answers to such questions are mainly categorized on a numerical scale from 0 to 10, 1 to
10, or 1 to 7. There is now a growing consensus that such answers have cardinal
significance (cf. Easterlin (2006)). Respondents have a conception of a worst and a best
situation and they situate their situation between those points. At the moment nearly all
empirically used question modules are categorized, such that only the points 0, 1, 2,…,
and 10 are possible answers, but it does not need much fantasy to assume that in the near
future those answers will be asked and given on a continuous scale by the respondent
who positions himself on a continuous line segment where the left end – point stands for
the evaluation of the worst conceivable situation and the right end – point for the best
conceivable situation. Let the situation itself be described by some characteristics like
‘income’, ‘health status’ , ‘ age ‘, in short a vector x, then the evaluation of x is described
by a number . We will call such a function a satisfaction function( )U x 3 .
The most simple approach is now to denote the responses on the satisfaction question by
U, which can assume values 0, 1, 2,…, and 10, and to postulate an explanatory model like
0 1 2 3. . .n n nU income age familysizeβ β β β= + + + +ε
(2.1)
where the variable income stands either for household income of for its logarithm. The
other variables are also defined either by absolute values or by their logarithms. This
specification or similar ones yield very interesting and stable results (see e.g.
Blanchflower and Oswald, 2004).
3 We avoid the term utility, since in all empirical questions the word ‘satisfied’ is used.

Well-being Inequality and Reference Groups
An Agenda for New Research 8
Version January 11, 2010
)
The problem with this specification is that the RHS can assume values outside the range
[0,10]. An easy transformation avoids this logical problem.
We may describe by a tractable distribution function on ( )U x ( ,−∞ +∞ with the range
[0,1]. This suggests the normal or the logistic as obvious choices. We assume
0 1 2 3( . . . ;0n n nU N income age familysize ,1)nβ β β β= + + + (2.2)
where stands for the standard normal distribution function. (.;0,1)N
Denoting the inverse by and adding an error term we get the OLS model 1( )nu N U−= n
n n
0 1 2 3. . .n n nu income age familysizeβ β β β= + + + +ε
j
(2.3)
It has been empirically found (see e.g. Van Praag, Ferrer-i-Carbonell 2004, and also
Ferrer-i-Carbonell, Frijters (2004) for related results ) that the estimated trade–off ratios
/iβ β for both specifications are nearly always not statistically different from each
other. Actually, this is not that strange as both formulations are describing the same
indifference curves on the (income, age, familysize) – space. They are just two different
cardinalizations of the same preference ordering.
These satisfaction functions are subjective and individualized. They are subjective,
because they are derived from gauging subjective feelings. They are individualized
because individual variables determine life satisfaction.
3. Subjective inequality
Well-being Inequality and Reference Groups
An Agenda for New Research 9
Version January 11, 2010
( ,..., )
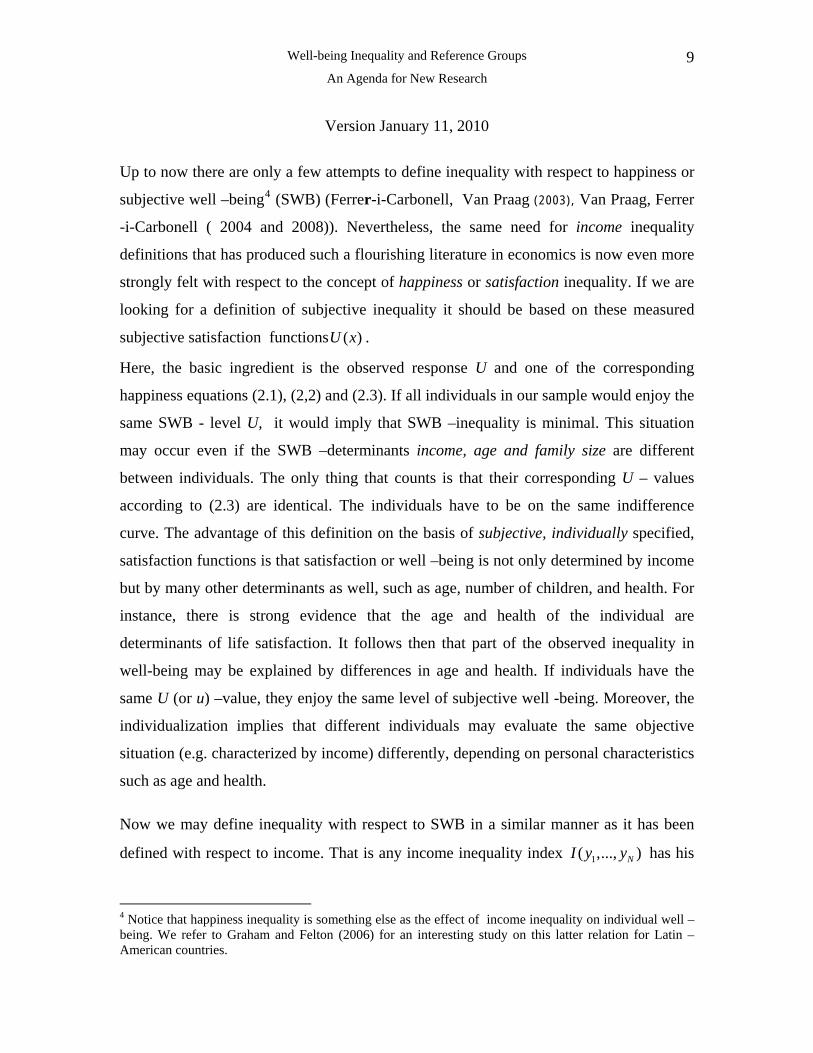
Up to now there are only a few attempts to define inequality with respect to happiness or
subjective well –being4 (SWB) (Ferrer-i-Carbonell, Van Praag (2003), Van Praag, Ferrer
-i-Carbonell ( 2004 and 2008)). Nevertheless, the same need for income inequality
definitions that has produced such a flourishing literature in economics is now even more
strongly felt with respect to the concept of happiness or satisfaction inequality. If we are
looking for a definition of subjective inequality it should be based on these measured
subjective satisfaction functions . ( )U x
Here, the basic ingredient is the observed response U and one of the corresponding
happiness equations (2.1), (2,2) and (2.3). If all individuals in our sample would enjoy the
same SWB - level U, it would imply that SWB –inequality is minimal. This situation
may occur even if the SWB –determinants income, age and family size are different
between individuals. The only thing that counts is that their corresponding U – values
according to (2.3) are identical. The individuals have to be on the same indifference
curve. The advantage of this definition on the basis of subjective, individually specified,
satisfaction functions is that satisfaction or well –being is not only determined by income
but by many other determinants as well, such as age, number of children, and health. For
instance, there is strong evidence that the age and health of the individual are
determinants of life satisfaction. It follows then that part of the observed inequality in
well-being may be explained by differences in age and health. If individuals have the
same U (or u) –value, they enjoy the same level of subjective well -being. Moreover, the
individualization implies that different individuals may evaluate the same objective
situation (e.g. characterized by income) differently, depending on personal characteristics
such as age and health.
Now we may define inequality with respect to SWB in a similar manner as it has been
defined with respect to income. That is any income inequality index 1 NI y y
has his
4 Notice that happiness inequality is something else as the effect of income inequality on individual well –being. We refer to Graham and Felton (2006) for an interesting study on this latter relation for Latin –American countries.

Well-being Inequality and Reference Groups
An Agenda for New Research 10
Version January 11, 2010
( ,..., )SWB – analogue 1 NI u u
( ,..., )
, The u- variable takes over the role of (log-)income.
Surely, definition of a SWB- inequality index implies accepting the cardinal significance
of U , as the measurement of inequality implies giving a meaning to the difference
between various levels of SWB. Consequently, if we do not believe in a cardinal
significance of the responses to satisfaction or happiness questions, then it is impossible
to define an SWB – inequality index, irrespective of the specific definition of that
inequality index 1 NI u u
n n
. This is true, notwithstanding the fact that under an ordinal
interpretation complete equality may be identified as the situation, where all individuals
assign an equal satisfaction value U to their situation.
In this paper we choose for a rather simple and intuitive definition of SWB- inequality.
We specify inequality by the variance (or standard deviation) of u over the sample or
population. As already said, we may also use any other usual income inequality measure
like the Gini –index, the Theil -index, Pareto -or the Atkinson – index. However, in this
context, where we aim at introducing the reference group effect within an inequality
context, we take the inequality definition which is most convenient for the exposition.
Let us assume (2.3), that is
0 1 2 3. . .n n nu income age familysizeβ β β β= + + + +ε
i inx
n
(3.1)
Or more generally
(3.2) 01
k
ni
u β β=
= +∑
where we ignore the random error. The nice consequence of the existence of a
relationship like (3.2) is that we may trace the effects of changes in personal
characteristics 1( ,..., )n n kx x x= on overall well- being.

Well-being Inequality and Reference Groups
An Agenda for New Research 11
Version January 11, 2010
The first approach according to which we might define subjective well–being inequality
with respect to a specific population is
2 ( ) xxuσ β′= Σ β (3.3)
Here the variance is taken with respect to the population density ( )f x of the vector of
relevant characteristics x, and xxΣ is the population covariance matrix of the vector x of
welfare determinants. The log-income variance is one of its diagonal elements. If SWB is
only dependent on log – income, it is obvious that SWB –inequality is just 2 2 (log( ))yβ σ .
If we assume the implicit classical assumption that SWB equals log - income, then β = 1,
and we end up with the traditional variance of log – incomes.
We see here two points to be noticed. First, the vector β makes the variance subjective.
The vector β is assessed on the basis of subjective questions on how satisfied individuals
are. Differences with respect to variables that correspond to a relatively large β and
consequently have a sizeable impact on individual well –being will have a strong
influence on overall variance, while variables with a relatively small β will have a small
effect on overall variance as well. If income is included as one of the variables x, then
income inequality is one of the components of SWB –inequality, but inequality in other
variables have influence on u or well–being U as well. Second, we see that (3.3) depends
on the population covariance matrix xxΣ . Hence, may be seen as an aggregate of
population inequalities with respect to the various component variables xi, corrected for
possible correlations between them. It is also possible to assess the effect of changes in
the x–distribution. For instance, if
2 ( )uσ
1x stands for log–income, then a change in the
variance of log–income 11σ or its covariance 12σ with another variable 2x will
immediately change the overall inequality index. This index may be seen as a tool for
making government policy. In the hypothetical case that there is no objective inequality

Well-being Inequality and Reference Groups
An Agenda for New Research 12
Version January 11, 2010
with respect to the relevant determinants x, that is xxΣ =O , subjective inequality will be
zero as well.
If the inequality index is a political tool, then we may ask which variables x are
considered as being relevant by the government. For instance, is the number of children
relevant for making government policy? If we should not think so, we have to ignore the
SWB – differences due to the children effect, although it is intuitively obvious that family
size inequality affects life satisfaction inequality. It means that we have to re-estimate
equation (3.6) without including the variable family size. If that variable is correlated with
other explanatory variables, as it most probably is, it will imply that the estimate of the
vector β will change as well. This shows that the choice of explanatory variables is rather
relevant for the definition and the measurement of subjective inequality, and this makes
the choice of which variables are considered to be relevant for including in the inequality
definition a political matter as such.

Well-being Inequality and Reference Groups
An Agenda for New Research 13
Version January 11, 2010
4. Personal subjective inequality as felt by individuals within reference groups.
The inequality index just considered does not take into account the reference
phenomenon. Does this index account properly for the impact of the refereeing process
on the feelings of inequality of individual citizens? Probably it does not. The reason is
that the evaluation by individuals of their own situation is partly done by comparing their
own situation with that of others, the so-called reference group.
It has been found by several authors (Van Praag (1976), Kapteyn, Van Praag, Van
Herwaarden, (1978), Van Praag, Kapteyn, Van Herwaarden (1979), Hagenaars and Van
Praag (1985), Ferrer -i-Carbonell (2005), Luttmer (2005), Stutzer (2004), Senik
(2004,2007)) that satisfaction with life or with one’s financial situation depends not only
on own income ny but on the average income of the reference group of n, say ,n refy , as
well. For instance, (3.1) carries over into
0 1 2 3 ,. . . .n n n nu income age familysize yn ref nβ β β β γ= + + + + +ε (4.1)
The effect of own income is positive. The age effect is regularly found to be parabolic,
first decreasing and after about 40 increasing (see. e.g. Blanchflower and Oswald, 2004,
Plug and Van Praag (1995); Wunder et al. (2009) even distinguish a cubic age curve). For
reasons of exposition we ignore the squared term. The effect of children on life
satisfaction is ambiguous. The effect of reference income is mainly estimated to be
negative, that is, own satisfaction reduces if neighbors get more, although some authors
like Senik (2004) found a positive effect, e.g., for ex-Soviet citizens.
Actually, the problem is how to describe the reference group. Mostly this is intuitively
defined by assumption. The reference group is equated to persons belonging to the same
age bracket, education group, region, etc. However, this a priori definition discards the

Well-being Inequality and Reference Groups
An Agenda for New Research 14
Version January 11, 2010
possibility that we can learn from the data what the composition of the reference group
really is.
In order to get a more detailed description of the reference group and its influence we
need to look more in detail. We shall outline the idea by a simple example. The group
consists of various reference individuals with whom the individual in question, called
Peter, compares himself. Say, Peter’s reference group consists of John and Adam. Now
we assume that Peter is not always busy with comparing his situation to that of others.
Sometimes he is self –oriented and sometimes other -oriented. Let us assume he self-
oreinted for 60% of his time. For 30% of the remaining time he is oriented on John and
for 10 % on Adam. Obviously John is the more important reference person for him. Let
us now assume that the incomes of the three persons are ordered as Jy > P Ay y> . Then it
seems reasonable to assume that the individual feels less happy if he has John in mind,
than when he has Adam in mind, while his situation is in the middle when he is self-
orienting. Actually, it is only one step to assume that is a random variable itself
and that consequently perceived well –being is random as well. Well- being varies
with the reference person or social type we happen to have in mind to compare with.
Equation (4.1) is just the expectation of u over the reference group.
,n refy
nu
For convenience, let us assume that the only relevant reference characteristic is income
and that income is measured bracket-wise. The bracket averages are . The
individual compares sometimes with people in the first bracket, say a fraction of the
time, sometimes with people in the second bracket, say a fraction of the time, and so
on. Those individuals may be seen as representing social types
,1 ,,...,ref ref ky y
1,np
2,np
1,,,kκ = .
Then we may write (4.1) more explicitly as
0 1 2 3 1, ,1 , ,. . . [ ... ]n n n n n ref k n reu income age familysize p y p y f k nβ β β β γ= + + + + + + + ε (4.2)

Well-being Inequality and Reference Groups
An Agenda for New Research 15
Version January 11, 2010
n
n
n
Here each income bracket is weighted by the importance it has in the reference group
of individual n. The weights, which add up to one, are denoted by . The
corresponding distribution we may call the reference distribution. It may be that every
individual has the same reference group weights but it is more probable that
different individuals will have different reference distributions. If all reference
distributions are the same, the weights would probably reflect the objective
population fractions
κ
1, ,,...,n kp p
1, ,,...,n kp p
1, ,,...,n kp p
1,..., kp p of the different income brackets. If not, the fractions
may be larger or smaller than one. If >1 it follows for n that he
overweighs the importance of people in bracket i, while <1 implies the opposite.
This ratio was termed in earlier work (see Van Praag and Ferrer-i-Carbonell,
, /i n ip p , /i n ip p
, /i n ip p
, /i n ip p
2004 ch.8 and earlier in Van Praag (1981)) the social filter, through which individual n
perceives the society around him.
We may generalize this idea to a continuous reference group where the referencing
characteristic may take any value on the real axis. Then the reference distribution is
described by a density function
refY
, ( )ref nf y and the average reference income to be included
in (4.2) would become ,. ( )ref ref nY y f y= ∫ dy
)
. It is obvious now that apart from comparing
our own income with reference income we may also compare our age to reference age,
and our family size to reference family size. If those variables are determinants for
happiness, it may be surmised that the same variables of the reference persons may have
an impact on our happiness as well. The same holds for other variables held to be
relevant. In short, the reference variable may be more –dimensional vector. Then it
follows that we may define a random reference vector ( , ,ref ref ref refX Y Age Fams= with a
corresponding more - dimensional reference density function , ( )ref nf x and an average
vector refX . Similarly we may define a variance covariance – matrix with respect to the
reference distribution, denoted by refΣ

Well-being Inequality and Reference Groups
An Agenda for New Research 16
Version January 11, 2010
Let us now generalize (4.1) in this vein. We start simply by assuming a two – person
world where an individual, say Peter, has one reference person, let us call him John, to
compare with. Peter’s situation is described by the vector PX , and John’s situation by
JX .
Even in this very simple two- person world Peter may have a perception of inequality of
SWB, when he compares his situation with that of John. As already said, an individual is
not comparing all the time. More precisely, if an individual is never comparing with his
neighbor, he will not perceive inequality at all. If he compares at times, then his well –
being is determined by an absolute component PX and by a relative component ( PX -
JX ), the difference between Peter’s and John’s situation. We assume that people
compare their situation with others only for a fraction (1-π) of their time while for a
fraction π they look only at their own situation without comparing. We call the fraction π
the self- orientation coefficient of the individual. Its complement (1-π) may be termed the
outwards - orientation coefficient. It follows that we assume that satisfaction uP is not
constant for an individual but that it depends on his or her mood of the moment ,whether
he or she is comparing or non –comparing his situation with that of others. In short, we
assume that Pu is a random variable, defined as
0
0
with chance ( ) with chance (1- )
PP
P J
Xu
X Xβ β πγ γ π
+⎧= ⎨ + −⎩
(4.3)
Life satisfaction, even during a relatively short period, is not constant but it is random,
depending on whom one is comparing to at the moment. We might call it instantaneous
satisfaction. The corresponding cardinal value on [0,1] is found by means of (2.2).
In the first situation in (4.3) Peter looks only at his own situation, he is self-oriented. In
the second situation it is only the difference between him and John that counts. Notice
Well-being Inequality and Reference Groups
An Agenda for New Research 17
Version January 11, 2010
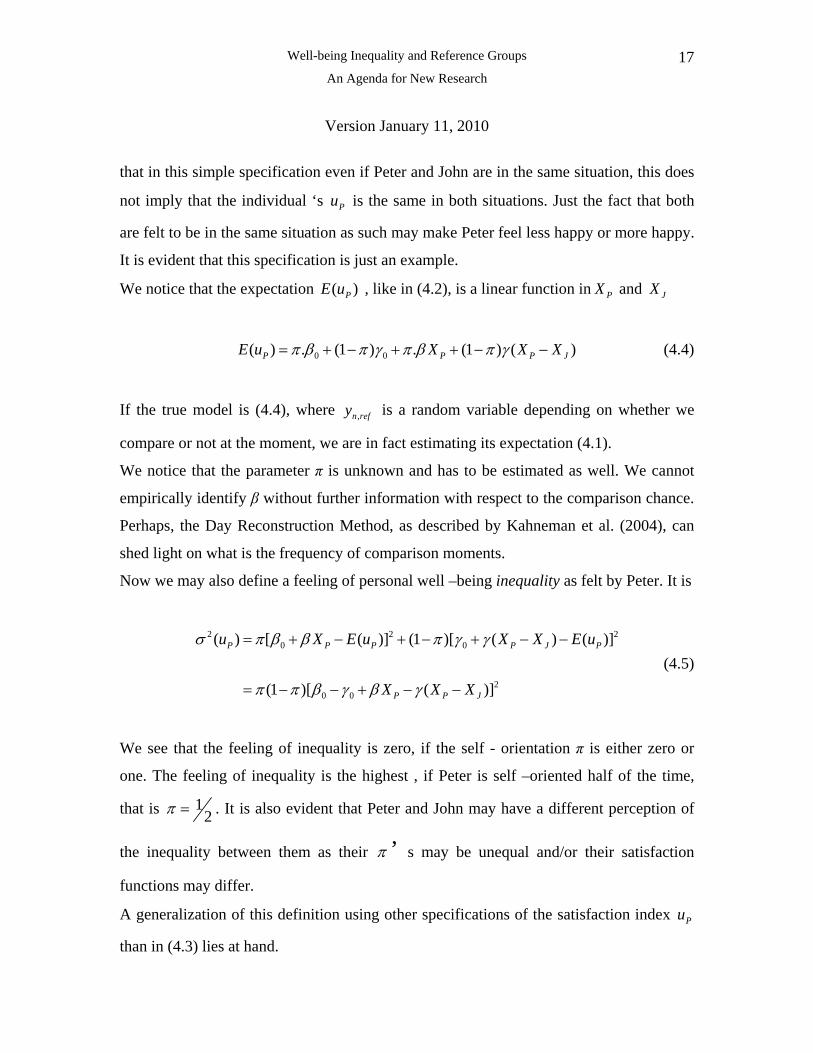
that in this simple specification even if Peter and John are in the same situation, this does
not imply that the individual ‘s Pu is the same in both situations. Just the fact that both
are felt to be in the same situation as such may make Peter feel less happy or more happy.
It is evident that this specification is just an example.
We notice that the expectation ( )PE u , like in (4.2), is a linear function in PX and JX
0 0( ) . (1 ) . (1 ) ( )P P PE u X X X Jπ β π γ π β π γ= + − + + − − (4.4)
If the true model is (4.4), where is a random variable depending on whether we
compare or not at the moment, we are in fact estimating its expectation (4.1).
,n refy
We notice that the parameter π is unknown and has to be estimated as well. We cannot
empirically identify β without further information with respect to the comparison chance.
Perhaps, the Day Reconstruction Method, as described by Kahneman et al. (2004), can
shed light on what is the frequency of comparison moments.
Now we may also define a feeling of personal well –being inequality as felt by Peter. It is
(4.5)
2 20 0
20 0
( ) [ ( )] (1 )[ ( ) ( )]
(1 )[ ( )]
P P P P J
P P J
u X E u X X E u
X X X
σ π β β π γ γ
π π β γ β γ
= + − + − + − −
= − − + − −
2P
We see that the feeling of inequality is zero, if the self - orientation π is either zero or
one. The feeling of inequality is the highest , if Peter is self –oriented half of the time,
that is 12π = . It is also evident that Peter and John may have a different perception of
the inequality between them as their π ’ s may be unequal and/or their satisfaction
functions may differ.
A generalization of this definition using other specifications of the satisfaction index Pu
than in (4.3) lies at hand.

Well-being Inequality and Reference Groups
An Agenda for New Research 18
Version January 11, 2010
Let us now extend the concept of a reference group from a one – person group to a multi-
person group. Each social type is characterized by a vector X. Now instantaneous
satisfaction is defined, analogously to (4.3), as
0 1 2 3
0
0 ,
. . . with chance ( )
( ) with chance 1-
n n n
n
n
n ref n
income age familysizeX
uX X
β β β β πβ β
γ γ π
+ + +⎧⎪ ′= +⎪⎪= ⎨⎪ ′= + −⎪⎪⎩
(4.6)
The vector is random and drawn from n’s reference distribution with density
function
,ref nX
, ( )ref nf x . We have here a random choice process in two stages. The first choice
determines whether the individual is in a comparing or a non-comparing mood, chances
being (1-π ) and π , respectively. Second, the question is which specific reference type
is coming into n’s mind, when he is actually comparing. This is described by the
reference density function
,ref nX
, ( )ref nf x . Since more persons may be described by the same
vector ,ref nx , it is the description of a social type. The random vector is varying
over the space of social types. Notice that the expectation of is
,ref nX
nu
0 0( ) .[ ] (1 )[ ( )]n n n n ref nE u X X Xμ π β β π γ γ ,′ ′= = + + − + −
(4.7)
where ,ref nX is the vector of expectations of with respect to the reference density
function
,ref nX
, ( )ref nf x . One may call the average vector ,ref nX the social focal point of n.

Well-being Inequality and Reference Groups
An Agenda for New Research 19
Version January 11, 2010
Notice that it is by no means necessary that ,ref n nX = X , that is , that individuals take their
own type as the focal point of their reference group. More usually they may take
somebody or some social type, who is socially above them, as a social focal point.
Equation (4.7) or rather the expectation of (4.6) with respect to is estimated in the
happiness literature. It is linear in own characteristics and in the average characteristics
,ref nX
,ref nX of the reference group. Up to now in the empirical literature reference groups are
defined in terms of income only. This implies that all elements of the parameter vector γ
are assumed to be zero, except the element yγ , which refers to income. There is however
nothing against it to characterize reference persons by a more-dimensional vector of
characteristics instead of one-dimensionally by income only.
In accordance with the definition in (4.5) in the case of a multi-person reference group we
now define the feeling of personal subjective inequality from the viewpoint of individual
n as
2 2
0 0 , ,( ) (1 )[ ( )] (1 ). n n n ref n ref nu X X Xσ π π β γ β γ π γ′ ′ ′= − − + − − + − Σ γ (4.8)
This formula is based on the well – known variance decomposition formula. There are
now two ‘subgroups’ distinguished. The first is the one – person group consisting of the
individual n himself, while the second subgroup is his or her reference group, consisting
of many different social types. Hence, there is a ‘between’ – inequality described by the
first term in (4.8) and a ‘within’ – inequality of the reference group itself, given by the
second term.
Personal subjective inequality appears to depend on four elements. First, it depends on
the self-orientation coefficient π; second, it depends on the perceived difference between
the individual and his or her reference group; third, on the vector γ, that is, on the effects

Well-being Inequality and Reference Groups
An Agenda for New Research 20
Version January 11, 2010
γ of the reference vector elements on satisfaction. Some components have strong
influence like reference income, while others presumably will have negligible influence;
fourth, it depends on the spread within the reference group, that is, the covariance
matrix . It describes in a sense the individual’s horizon of society as perceived by
individual n. If one diagonal element, say corresponding to reference income, is larger
than another, say, with respect to reference age, it means that the reference group of n is
wider with respect to income than with respect to age.
,ref nΣ
We may interpret the off- diagonal elements, say ,ref ijσ , in a similar way. If the covariance
(or the correlation) is strongly positive it implies a strong positive correlation within the
reference group between, for example, income and age. A negative correlation may be
interpreted likewise.
It is obvious that the reference covariance matrix ,ref nΣ is related to but not necessarily
identical with that of the objective population distribution. More specifically, if the
underlying population is perfectly homogeneous with respect to a characteristic Xi
( is constant) and hence the corresponding population variance,ref iX 0iiσ = , the reference
group mostly will be perceived as perfectly homogeneous as well with respect to that
characteristic Xi, that is, , 0ref iiσ = as well. It follows then that the corresponding
population and reference covariances are zero as well.
We notice that all parameters seem to be estimable, when we are able to get more specific
observations on the individual reference process. We need answers to the question how
frequently an individual compares his own situation with that of others , yielding a π -
estimate and we need to know with whom the individual compares to get an idea of the
reference density function , ( )ref nf x . That is, we need per individual n with characteristics
nX a sample , , 1{ }Mref n m mX = of order M in order to estimate n’s reference distribution.

Well-being Inequality and Reference Groups
An Agenda for New Research 21
Version January 11, 2010
]
5. Social Subjective inequality with a referencing mechanism.
Now as policy makers we are not so much interested in the inequality feelings of one
person, as specified in by (4.8) by ,but rather in the average feeling of social
inequality in society at large, that is
2 ( )nuσ
2[ ( )n nE uσ , where the average is taken with respect
to all members n of the population.
Now we have to account for the fact that each person may have his or her own reference
group. For each person n we define again the vector of satisfaction
determinants . Its dimension is 2k. We call the first half the objective
determinants. They describe the situation of person n. The second half of the vector
stands for characteristics of reference persons of n. They are called the reference values.
We can ask the person n at a specific moment in time with whom or what social type he
is comparing himself. The answer is . The first vector is pretty fixed per person, but
may vary per moment. It is random. Its distribution is the reference distribution of
n.
,( ,n ref nX X )
)
,ref nX
,ref nX
If we consider the whole population, then may be considered as a random
vector defined on the whole population with an expectation
,( ,n ref nX X
( , )refX X and a (2k x 2k) -
covariance matrix
(5.1)
ref
ref ref ref
xx xx
x x x x
Σ Σ⎛ ⎞⎜Σ =⎜Σ Σ⎝ ⎠
⎟⎟
Now it is tempting to assume the distribution to be normal, which may be realized after
suitable redefinition of the variables. For example, taking logs frequently helps a good
deal. Still better is to apply an integral transformation where quantiles of the empirical
distribution function are mapped on the corresponding quantiles of the standard normal

Well-being Inequality and Reference Groups
An Agenda for New Research 22
Version January 11, 2010
distribution function. Again, we observe that choosing for normality after suitable
transformation of the observations does not imply that the model cannot be generalized to
non-normal distributions. However, for the sake of exposition we assume normality. In
fact, whether a normal specification is realistic, has to be inferred from empirical
observation.
Now it appears possible and appropriate to assume that different individuals have
different reference groups, and, consequently, that they have different reference
distributions. We see that the individual reference distributions, introduced before, may
be interpreted as conditional distributions of refX , given the objective determinants X of
n. A very pleasant property of normal distributions is that the conditional distributions
have different means ,but the same constant covariance matrix.
The conditional averages of those individual reference distributions will vary with the
objective characteristics nX . For a multivariate normal distribution we have
1, ,( ) (
ref ref refref n ref n n n ref x x x x n )X E X X x X x X−= = = + Σ Σ − (5.2)
As before, we call this conditional average the social focal point of n. The focal point
varies with the objective characteristics nx . Mostly we may assume a positive correlation
between objective individual characteristics nx and reference characteristics, as
individuals tend to compare themselves with those who belong to the same social group.
If refxxΣ =O, the gravity point of the reference distribution is constant. In a similar way
using the well–known formulae of normal distribution theory we find that the covariance
matrix of the conditional distribution of is ,ref nX
1, ,( )
ref ref ref refref n ref n n x x xx xx x xnV X X x −Σ = = = Σ −Σ Σ Σ (5.3)

Well-being Inequality and Reference Groups
An Agenda for New Research 23
Version January 11, 2010
This conditional covariance matrix is the same matrix ,ref nΣ which we used in (4.8). It is
obviously smaller (in the sense of matrix ordering) than the overall reference covariance
matrix . Under the assumption of normality this matrix is constant, that is ,
= .
ref refx xΣ
,ref nΣ refΣ
It follows from (5.2) that
1, ( )
( )
ref ref refn ref n n ref x x x x n
n
X X X X X X
C I B X
−− = − −Σ Σ −
= + − (5.4)
where C is a constant vector and B is the matrix of ‘regression’ coefficients of ,ref nX on
nX .
Now we may define overall social inequality as the expectation of (4.8) over the
population.
Using (5.4) we rewrite
0 0 , 0 0( ) ( (n n ref n
n
)) nX X X C I B X
C D X
β γ β γ β γ γ β γ′ ′ ′ ′ ′− + − − = − − + − −
′= +
where 0 0 Cβ γ γ ′− − C= is a scalar and where ( ( ))I Bβ γ′ ′ − D= ′ is a row vector. −
It follows then that

Well-being Inequality and Reference Groups
An Agenda for New Research 24
Version January 11, 2010
2 20 0 , ,
2,
2
[ ( )] [ (1 )[ ( )] (1 ). ]
[ (1 )[ ] (1 ). ]
(1 )[( ) 2. ( ) ] (1 ). ]
n n n n n ref n ref n
n n ref n
n xx ref
E u E X X X
E C D X
C C D X D D
σ π π β γ β γ π γ γ
π π π γ γ
π π π γ γ
′ ′= − − + − − + − Σ
′ ′= − + + − Σ =
′ ′ ′= − + + Σ + − Σ
=
(5.5)
. If π =1, that is no comparison with other individuals, the inequality is zero. In the case
that the individual derives his satisfaction completely by comparison (π = 0) the
inequality will be xxγ γ′ Σ .
It follows that subjective inequality does not only depend on the inequality with respect
to own welfare determinants, but that it also depends on the individual reference effects
and on the inequality in the reference group.
In the above we made the convenient assumption that the underlying distribution of
would be multivariate normal. Although not unreasonable as a first
approximation, it is not really needed. The conceptual model just described holds for any
distribution, but only the formulae become less elegant or have to be replaced by
numerical calculations.
,( ,n ref nX X )
6. Where to find the data?
Unfortunately the model is not yet operational by lack of data. The problem is obviously
how to estimate the matrices ,ref ref refxx x xΣ Σ and the comparison chance π . This is only
possible if we can observe per individual the whole vector and not only the
first half of that vector. This implies repeated interviewing in order to get an idea per
,( ,n ref nX X )

Well-being Inequality and Reference Groups
An Agenda for New Research 25
Version January 11, 2010
individual of his/her reference distribution and to get an estimate of the self-orientation
parameter π , that is how frequently he compares with other people. A relatively rare
example of frequent interviewing is the diary method, as applied by Kahneman et al.
(2004), which they call the Day Reconstruction Method.
A first inspiration content-wise is given by a recent paper by Clark and Senik (2008)
who analyzed two questions put in Wave 3 of the European Social Survey (ESS). One
question is the following: “Whose income would you be most likely to compare your own
with? Please choose one of the groups on this card: Work colleagues/ Family members/
Friends/ Others/Don’t compare/ Not applicable/ Don’t know.” This question, which was
very well responded to, is in the spirit of the questions we would have in mind.
We would suggest for comparisons to construct a - vector some nuclear questions
like these:
,ref nX
Everybody compares his situation with that of others. When you compare yourself other
persons, take the person (perhaps plural? To make the respondent think about a group of
people) in mind with whom you most frequently compare. Call him John / Betsy. Please,
can you describe some features of Betsy
1. What might be Betsy’s net household income about?
2. How would you classify Betsy ‘s health on a scale from 0 to 10?
3. How old is Betsy ?
4. What is her family size ?
5. Her age ?
6. Her employment status ?
7. Her education ?
8. Would you classify her in the first place as Work colleague/ Family member/
Friend/ Others / Not applicable/ Don’t know
9. How often do you see Betsy ?
10. Do you think that Betsy is happier , equally happy, or less happy in life than you ?

Well-being Inequality and Reference Groups
An Agenda for New Research 26
Version January 11, 2010
11. Would you be happier , equally happy, or less happy in life when you were Betsy
than you are feeling now being yourself?
It is obvious that this is just a first suggestion on possible questions, but it is clear
repeated interviews would give the researcher an idea about who are the reference
persons of each individual and, concretely, about the distribution of . As there is
frequently more than one reference person, we could try to ask the same question for a
second person, say Peter. Moreover, we could try to get an idea of how frequently the
respondent compares with Betsy and how frequently with Peter. Obviously this can be
extended to more reference persons. It is in this way that we think that the reference
group model outlined above may be operationalized.
,ref nX
7. What does this mean for social policy?
Let us assume a government which is interested in enhancing the well – being of its
people. It formulates a Social Welfare Function (SWF) analogous to Markowitz’
portfolio theory, as
(7.1) 2SWF . ( ) (1 ). ( ) E u uδ δ σ= − −
It is a δ - weighted average of average individual SWB and inequality in individual
SWB, where social inequality is negatively signed, assumed to be bad. The SWF has to
be maximized and the question is now what instruments the government can use.
Obviously, there are some objective characteristics X like e.g. income, education, and
health which may be influenced by government, although not without a cost attached. A
change in the parameters β will be rather difficult as they describe real preferences. The
same holds more or less for the parameters γ. They stand for the jealousy effects, which

Well-being Inequality and Reference Groups
An Agenda for New Research 27
Version January 11, 2010
seem to be fixed elements of human nature and although we do not deny that ethical
/religious indoctrination may reduce jealousy effects, we do not think that this is a very
powerful policy nowadays.
However, a final element is the matrixref refx xΣ . It describes the transparency of society,
and there holds the larger the transparency, the greater personal inequality feelings will
be.
We may write (7.1) more explicitly as
20SWF .(( ( ) (1 )( )) (1 ).( ( )x refX X uδ π β β μ γ π δ σ′ ′= + + − − + − − (7.2)
The second term may be written more explicitly by substituting (5.5). From this formula
(7.2) it is clear that the parameters of the referencing mechanism play an important role in
the perception of the SWF. As we saw already, the reference distribution is a description
of how visible other people are for a citizen. The covariance matrix describes the social
transparency of society with respect to a number of relevant dimensions, described by the
dimensions of X.
It is obvious that the referencing process is a sociological phenomenon, which can be
influenced. We think here especially of media policy. For instance, when television
disseminates on a day to day basis how the rich are living it is obvious that the frequency
of comparing and social transparency is increased enormously. In formula it would imply
that ref refx xΣ is increased while π and
refxxΣ are decreased, as social segmentation is
reduced.
The same holds on a global level for global inequality feelings. Hence, governments, and
to a lesser extent publications in radio and printed journals and newspapers, have a non–
negligible and perhaps even enormous effect on the referencing mechanism. Although it
is fashionable to welcome more social transparency, it is a matter to be discussed whether
this tendency is good from a standpoint of social well-being. The model outlined above
suggests that there are risks involved.

Well-being Inequality and Reference Groups
An Agenda for New Research 28
Version January 11, 2010
There will be costs associated with the manipulation of π , refμ , ,
ref ref refxx x xΣ Σ . These costs
may be purely monetary but they may also be of a non – monetary nature. For instance, a
reduction of social transparency will be considered by some as a loss, especially by the
press. If we try to maximize the SWF we may add a social cost –function of the type
( , ,ref ref refref xx x xC )μ Σ Σ , and find an optimal social transparency by setting
0
0
0
ref ref
ref ref ref ref
xx xx
x x x x
SWF C
SWF C
SWF Cπ π
∂ ∂− =
∂Σ ∂Σ
∂ ∂− =
∂Σ ∂Σ
∂ ∂− =
∂ ∂
(7.3)
8. Conclusion.
In this paper we built a model to include the social referencing mechanism into happiness
economics. We do not have the illusion that this model will be estimable in a year from
now. However, as section 6 suggests, it is certainly conceivable to estimate the missing
parameters of the reference mechanism by posing suitable questions.
It is well- known that comparing with reference groups affects feelings of individual
subjective well –being. In this paper we argue that referencing affects inequality feelings
as well. The subjective inequality concept was introduced in Van Praag, Ferrer -i-
Carbonell (2008). When we are investigating inequality of subjective well–being we have
to recognize that interpersonal comparisons by individuals with their reference persons
must be at the basis of the inequality concept. Therefore we defined an individual’s
reference group as a distribution of reference persons described in terms of the same
characteristics which we deem to be relevant satisfaction determinants for the individual
himself.

Well-being Inequality and Reference Groups
An Agenda for New Research 29
Version January 11, 2010
If we assume that the individual’s well-being is partly determined by comparison with his
reference group, the same will hold for his perception of the inequality of well being; in
fact, it is the well –being inequality within his reference group plus the inequality
between the individual and his reference group as a whole.
Then we make a distinction between the individual’s SWB - inequality as perceived by
individuals and social SWB - inequality, which is an average of the individual subjective
well – being inequality perceptions.
If we assume that social well being, as described by a social welfare function, depends on
individual subjective well – being and on the individual’s perception of SWB –
inequality, it follows that that the reference mechanism as such may have effect on the
social welfare function. If a government accepts the task of increasing SWB, it may see
influencing the social reference mechanism as a legitimate policy instrument.
The present paper is a first and necessarily mainly theoretical exercise on this line. At the
moment we do not know of available data to operationalize our model empirically.
However, we outline how, as an extension of existing questionnaires , we may add new
questions by means of which it becomes empirically possible to estimate the parameters
of the referencing mechanism in practice. If such data are realized, the way lies open for
an empirical operationalization of this model.
We hope by this paper to have drawn more attention to the probably important role of the
referencing mechanism for the implementation of social policy.

Well-being Inequality and Reference Groups
An Agenda for New Research 30
Version January 11, 2010
References
Arrow, K.J., 1965. Aspects of the Theory of Risk-Bearing. Helsinki: Yrjö Hahnsson
Foundation.
Atkinson, A.B., 1970.’On the measurement of inequality’. Journal of Economic Theory,
2: 244-63.
Blanchflower and A. Oswald, 2004. ‘Well-being over time in Britain and the USA’.
Journal of Public Economics, 88 : 1359-1386
Clark, A.E. and C. Senik, 2009. ‘Who compares to whom? The anatomy of income
comparisons in Europe’, CEPREMAP, Paris School of Economics, Working Paper
n2008–65.
Clark, A.E., P. Frijters, and M.A. Shields, 2008. ‘Relative income, happiness and utility:
an explanation for the Easterlin paradox and other puzzles’. Journal of Economic
Literature. 46: 95-144.
Dolan, P, Peasgood, T, White, M, 2008. ‘Do we really know what makes us happy? A
review of the economic literature on the factors associated with subjective well-being’.
Journal of Economic Psychology. 29: 94 – 122
Easterlin, R. A., 2006. “Life Cycle Happiness and Its Sources: Intersections of
Psychology, Economics, and Demography “, Journal of Economic Psychology, , v.
27, 463-82
Ferrer-i-Carbonell, A., 2005. ‘Income and Well-being: An Empirical Analysis of the
Comparison. Income Effect’. Journal of Public Economics, 89: 997-1019
Ferrer-i-Carbonell, A. and P. Frijters, 2004. ‘How important is methodology for the
estimates of the determinants of happiness? ‘The Economic Journal, 114: 641-659.
Ferrer-i-Carbonell, A. Van Praag, B. M. S.; ‘Income Satisfaction Inequality and Its
Causes’, Journal of Economic Inequality, August 2003, v. 1, 107-27
Frey, B.S. and A. Stutzer, 2002. ‘What Can Economists Learn from Happiness
Research?’ ,Journal of Economic Literature, 40: 402-435.

Well-being Inequality and Reference Groups
An Agenda for New Research 31
Version January 11, 2010
Graham, C. and A. Felton, 2006. ‘Inequality and happiness: Insights from Latin America.
Journal of Economic Inequality ‘, 4: 107-122
Graham, C , (2008) “The Economics of Happiness: New Lenses for Old Policy Puzzles”,
chapter in The New Palgrave Dictionary of Economics, 2nd
Edition, edited by Steven
Durlauf and Larry Blume (Hampshire: Palgrave MacMillan).
Hagenaars, A.J.M. and B.M.S. van Praag, 1985. ‘A synthesis of poverty line definitions.’
Review of Income and Wealth, 31: 139-53.
Kahneman, D., A. B. Krueger, D. A. Schkade, N. Schwarz, A. A. Stone (2004) ‘A Survey
Method for Characterizing Daily Life Experience: The Day Reconstruction Method’
Science 3: Vol. 306. no. 5702, pp. 1776 – 1780
Kapteyn, Arie & Van Praag, Bernard M. S. & Van Herwaarden, Floor G.,
1978."Individual welfare functions and social reference spaces," Economics Letters,
Elsevier, vol. 1(2), pages 173-177.
Layard, R., 2005. Happiness: Lessons from a New Science. Penguin.
Luttmer, EFP, 2005. Neighbors as Negatives: Relative Earnings and Well-Being.
Quarterly Journal of Economics, 120: 963-1002.
Plug, E.S. and B.M./S.Vvan Praag *1995) ‘Family Equivalence Scales Within a Narrow
and Broad Welfare Context’. Journal of Income Distribution 4(2). (1995). 171--86.
Pratt, J.W., 1964. ‘Risk Aversion in the Small and in the Large’. Econometrica, 32: 122-
36.
Senik C., 2004, "When Information Dominates Comparison. Learning from Russian Subjective Panel Data ”, Journal of Public Economics, 88: 2099-2133.
Senik C.,(2007):” Direct Evidence on Income Comparisons and their Welfare Effects”
forthcoming in: Journal of Economic Behavior and Organization.
Stutzer, A., 2004. ‘The Role of Income Aspirations in Individual Happiness’. Journal of
Economic Behavior and Organization. 54: 89-109.
Van Praag,B.M.S., A. Kapteyn, F.G. van Herwaarden (1979), :” The definition and
Measurement of Social Reference Spaces, The Netherlands Journal of Sociology,15,
p.13-25

Well-being Inequality and Reference Groups
An Agenda for New Research 32
Version January 11, 2010
Van Praag B.M.S. (1976), ‘The Individual Welfare Function and its Offspring’ in: Relevance and Precision, J.S. Cramer et al. (eds.), North-Holland Publishing Company, Amsterdam, pp. 263-293
Van Praag, B.M.S., 1977. ‘The Perception of Welfare Inequality’. European Economic
Review, 10: 189-207.
Van Praag, B.M.S., 1981. ‘Reflections on the Theory of Individual Welfare Functions’,
Proceedings of the American Statistical Association.
Van Praag, B.M.S. and Ferrer-i-Carbonell, A., 2004, 2008 (revised). Happiness
Quantified: A Satisfaction Calculus Approach. Oxford University Press, Oxford: UK.
Wunder,C., A. Wiencierz, J. Schwarze, H. Küchenhoff, S. Kleyer, and P. Bleninger,2009.
Well-Being over the life span: semiparametric evidence from British and German
longitudinal data’. IZA Dp No. 4155.