Embed Size (px)
Citation preview

Well-Being, Insecurity and the Decline ofAmerican Job Satisfaction
David G. BlanchflowerDartmouth College, USA
andNational Bureau of Economic Research
Andrew J. OswaldUniversity of Warwick, UK
Rev. 22 July 1999
Abstract
The paper studies job satisfaction and stress levels in the advanced nations. There are sevenmain findings. First, the great majority of workers in the industrial democracies appear to beremarkably content with their jobs. The old Dickensian idea that work subjugates people isapparently not supported by the data. Second, job satisfaction appears to be gently trendingdown over time in the United States (among the over-30s, from approximately 56% verysatisfied in the 1970s to 48% by the mid-1990s). Third, we show that this fall is not explainedby the decline of unions, nor by, as we document, the existence of a slowly growing job-insecurity in the US. Fourth, the cross-section patterns in job satisfaction are similar from onenation to another. Reported well-being is higher among women, the self-employed, the youngand the old (not the middle-aged), supervisors, and particularly those with secure jobs. Fifth,after controlling for personal characteristics, we produce a ranking of job satisfaction acrossnations. Ireland is top. Sixth, workers across the European Union say that compared with fiveyears earlier they are under much increased stress and pressure at work. Seventh, when astandard mental stress measure is used to examine workers’ well-being across 15 nations,Ireland and Sweden emerge as the least-stressed countries, and Italy, France and Spain appearthe most-stressed.
Keywords: Job satisfaction, labor markets, well-being, job security, mental health.JEL Classification: J28
________________________* For advice and helpful discussions about the area, we thank Marianne Bertrand, Andrew Clark, Jonathan Gardner,Dan Hamermesh, Mark Stewart, Peter Warr, and numerous Irish journalists (‘it’s the drink’ was one theory). Theauthors are grateful to the Leverhulme Trust and Nuffield Foundation for research support. Email addresses are([email protected]); [email protected].

1
Nicholas was about to descend when he was arrested by a loud noise of scolding in a woman’svoice. “You good-for-nothing brute” cried the woman, stamping on the ground, “why don’t youturn the mangle?” “So I am, my life and soul!” replied a man’s voice. “I am always turning, Iam perpetually turning, like a demd old horse in a mill. My life is one demd horrid grind!”Charles Dickens, Nicholas Nickleby, LXIV.
I. Introduction
Most of us spend around a quarter of our lives at work. Understanding people’s well-being in
the workplace, therefore, is likely to be important to economists and other social scientists. Yet the
study by labor economists of job satisfaction is still in its infancy. This may be, in part, because
economists are suspicious of the usefulness of data on reported well-being. However, it is known that
satisfaction levels are strongly correlated with observable phenomena (such as quit behavior).
Moreover, it seems difficult to believe that economists have a more acute understanding of the
limitations of well-being statistics than do the thousands of psychologists who use such data in their own
research.
This paper attempts to examine the factors that shape well-being at work. It uses data from
three sources – the International Social Survey Programme, the Eurobarometer Surveys, and the US
General Social Surveys. While the literature by economists is small, it has begun to grow recently with
the work of, among others, Andrew Clark and Daniel Hamermesh. Useful introductions to the
psychology literature concerned with well-being data are Campbell (1981) and Argyle (1987). An
overview paper from the economist’s perspective is Oswald (1997). Easterlin (1974) is an early
contribution. Two survey papers by Diener (1984, with co-authors 1999), in one of the world’s leading
psychology journals, are fairly accessible to non-specialists. Warr (1987, 1997) provides a readable
account of the links between work and mental health.

2
Early papers by economists on job satisfaction include Borjas (1979), Freeman (1978) and
Hamermesh (1977). Blanchflower (1991) is a recent attempt to use data on feelings of job insecurity
within a conventional wage equation. A fast-growing modern literature on the border between
economics and psychology includes Akerlof et al (1988), Birdi et al (1995), Clark (1996, 1998), Clark
and Oswald (1994), Clark et al (1995), Curtice (1993), Frey and Stutzer (1999), Judge and Watanabe
(1993), Kahheman et al (1997), Levy-Garboua and Montmarquette (1997), Ng (1996, 1997), Pavot
et al (1991), Sui and Cooper (1998), and Veenhoven (1991). A slightly earlier empirical paper on
relativity effects and utility is Van de Stadt et al (1985). Frank (1985) contains many interesting ideas
that cross disciplines. Inglehart (1990) is a large study using the Eurobarometer surveys; it reports data
on overall well-being for a range of western countries. Spector (1997) is a new overview of the job
satisfaction literature. Parts of his book make unfamiliar reading for an economist. Interesting recent
studies of job satisfaction among managers include Worrall and Cooper (1998) for Great Britain, and
Spector et al (1999) for a group of twenty-two countries.
II. A Detailed Look at the USA
It is natural to begin with the United States. This is the country for which there is the longest run
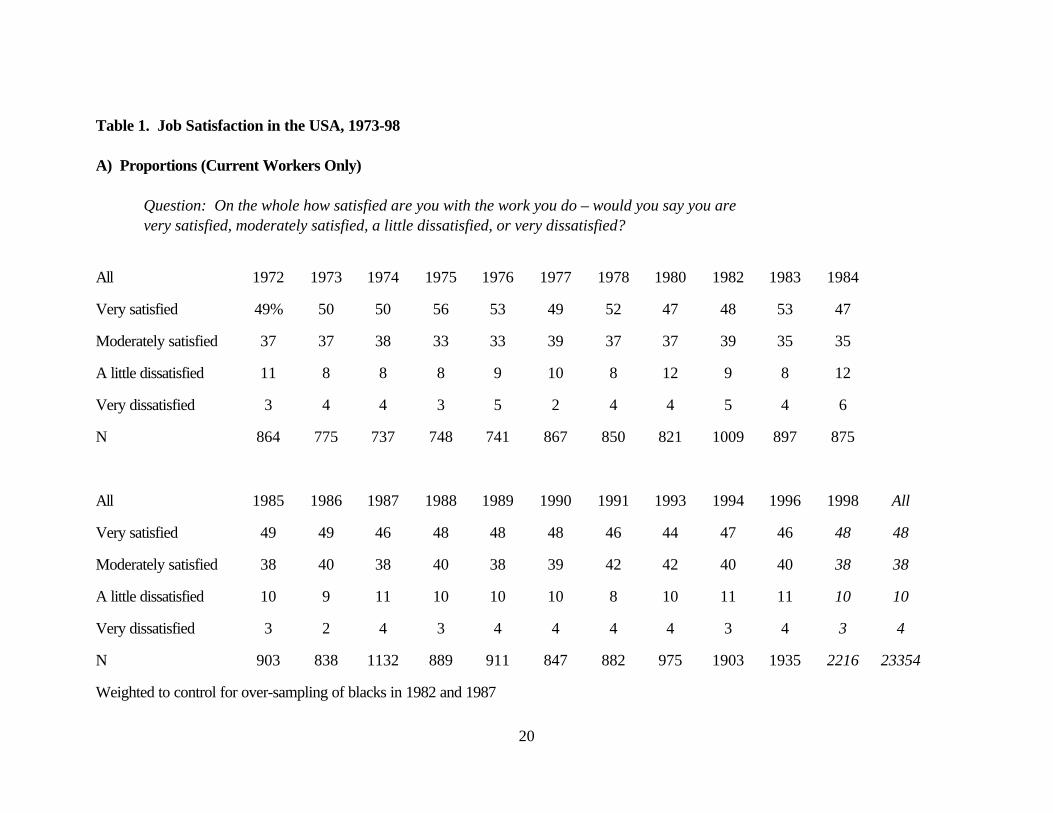
of randomly-sampled workers. The first data come from the start of the 1970s. Table 1 gives the
pattern of job satisfaction responses from 1973 to 1996 drawn from the annual General Social Surveys.
Here the question is
On the whole how satisfied are you with the work you do – would you say you are very satisfied,moderately satisfied, a little dissatisfied, or very dissatisfied?
While the size of sample is not large (at just under 1000 American workers per year), and these are
cross-sections rather than a longitudinal sample, the GSS reveals some useful patterns. Two

3
conclusions follow from Table 1, in part A. First, the great majority of US workers express themselves
as rather content with their work. Approximately half say they are very satisfied, and forty per cent
moderately satisfied. Only a tiny fraction of the population put themselves in the very-dissatisfied
category. This appears to allow us to reject any simple version of the idea -- found in Dickensian and
Marxian accounts of capitalist markets -- that work exploits people. It also makes less plausible the
commonly heard journalistic view that stress at work is overwhelming modern Americans. This is not to
imply that such numbers should be accepted uncritically, but that the first pass through the data seems to
reveal a good degree of happiness at work.
Labor economists -- raised on data and theories of rationality -- are perhaps more likely than
some social scientists to expect workers to express satisfaction with their jobs. It is known that people
move around a great deal early in their careers. They sort themselves into jobs they like and out of jobs
they dislike. To sample the well-being levels of a cross-section of employees, therefore, is to sample a
group of individuals who are already heavily self-selected into suitable occupations.
Having established the current pattern, the next question is what is happening over time. Table
1 shows there is a small but systematic downward trend in the satisfaction numbers reported in
American workplaces (a formal test is reported later in the paper). Through the 1990s, for example,
approximately 46% of workers gave the top answer ‘very satisfied’ to the satisfaction question. Yet in
the 1970s, 51% of workers said very satisfied. A reason to find this unusual is that by objective
standards the safety and cleanliness (and probably physical arduousness) of working life in America
have been improving through the decades. Table 1B explores this a little more. It breaks down the
time movements by different sections of the population. For people over age 30, the trend towards

4
lower reported well-being at work is more marked. Here the average proportions giving the top score
are:
1970s: 56% of over-30s Americans were very satisfied
1980s: 52% were very satisfied
1990s: 48% were very satisfied.
The trends are not very different between men and women (which might be viewed as unexpected
because of a presumption that gender discrimination has dropped over the last few decades).
There is essentially no satisfaction time-trend among young workers in the US. This is shown in
the penultimate column of Table 1B. Relatively, therefore, the young in the 1990s are doing better than
the old, but not better than the equivalent young people did in the 1970s. Earlier work on life
satisfaction and well-being levels, in Blanchflower and Oswald (1999), also found evidence that younger
Americans are gaining over older groups. However, the possible links between the two findings -- on
job satisfaction and life satisfaction -- remain largely unexplored and are not pursued further in this
paper.
It appears from Table 1B that the proportion of non-whites saying they are very satisfied with
their jobs has declined similarly to the trend for whites. Although figures are given for non-white men
and women, there are not enough observations to allow confident statements on race broken down by
gender.
Our finding of falling American job satisfaction is consistent with a small amount of earlier
research. Blanchflower et al (1993) documented at best flat well-being levels through time in Britain
and the US. Oswald (1997) describes earlier literature. A classic reference is Easterlin (1974).
Although not his primary concern, interesting new work by Hamermesh (1998) documents signs of

5
diminishing job satisfaction among young workers in the 1978-88 and 1984-1996 periods of the NLSY
for the United States, and in the 1984-96 SOEP for Germany. Hamermesh is actually fairly sceptical of
his results (p.21: “difficult to believe…at a time when real earnings were rising”).
If the next twenty-five years make clear that the trend is not a fluke of recent decades, it will
become important to understand the reason for a downward spiral in reported well-being. One
mechanical possibility is that Americans now use words differently: they are no less content with work
than their parents but they put things in more vehement language when asked. On such a view, the trend
down in the satisfaction scores is an illusion, and modern workers simply express themselves more
critically about everything (including their own lives) than their fathers and mothers. Such an eventuality
cannot be discounted. It does not seem natural, however, to believe that use of language has changed in
this way in a short space of time. Moreover, if this were true, it would presumably mean that the
younger sample (the under 30s) would show up as having the largest ‘decline’ in job satisfaction. The
older sample could be expected to be disproportionately made up of individuals using language as they
did when they were young men and women in the 1970s. As the data show that it is the older workers
who have become particularly less content, the hypothesis that declining satisfaction is an artefact of our
surveys -- caused by a changed use of language -- is less compelling.
If the trend is real, its roots need to be uncovered. One potential explanation is that satisfaction
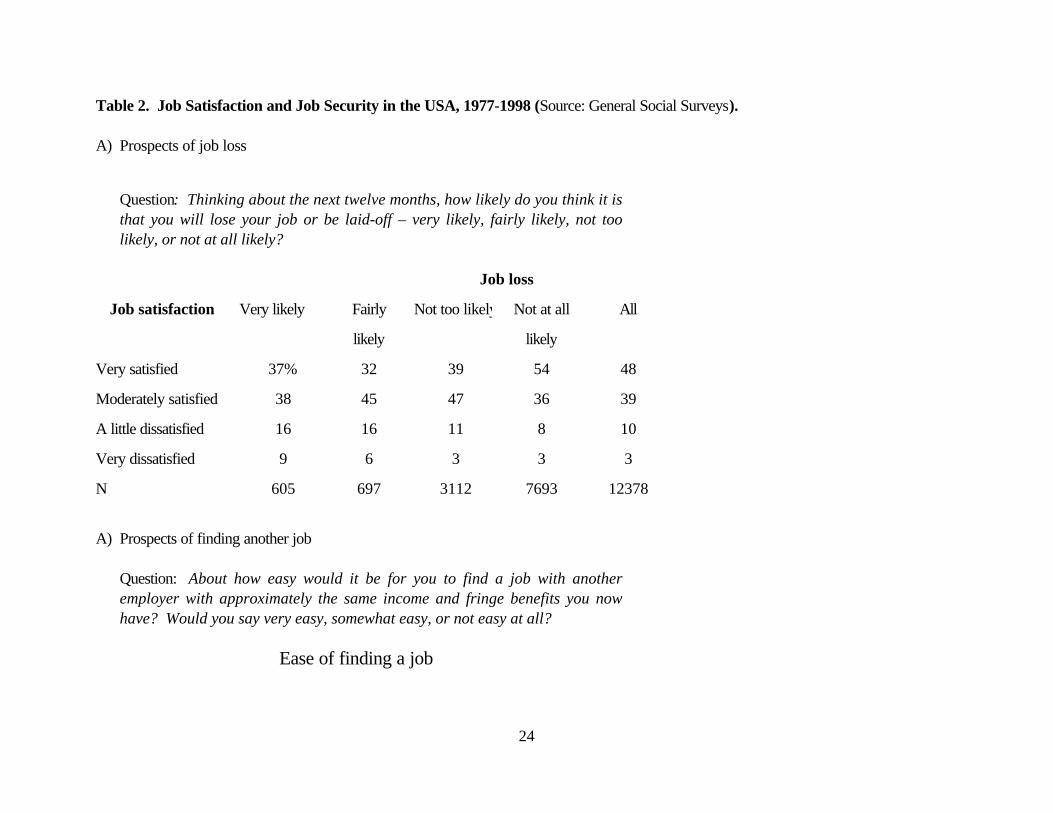
in the workplace is closely connected with feelings of job security and insecurity. Table 2 looks at the
simple correlation between reported well-being and people’s views about how likely they are to lose
their job or be laid off. It can be seen that those who say they are “not at all likely” to be pushed out of
their jobs have a much greater probability of giving the top satisfaction response. The lower half of
Table 2 inquires about the ease with which a person could, if necessary, find a new job of the same
6
quality. People who think it “very easy” to find a similarly good position with another employer are the
ones most likely to say they are very satisfied with their job.
To pursue this in a multivariate way, a simple ordered logit regression equation is given in Table
3. The sample size changes as we move across the columns, because some of the variables are only
available in a subset of years. One purpose is to answer the question of how well the satisfaction
answers can be explained by a small number of personal and workplace characteristics, pay, job
security, and area dummies. The second is to provide a more formal test for the existence of a negative
time trend in reported contentment in the American workplace. The broad answer to the first is that not
a great deal of the variation in satisfaction answers is explicable this way. Even so, there are
microeconomic patterns. Satisfaction is higher among the old, females, the self-employed, whites, those
in non-union plants, the highly educated (except when income is controlled for in the regressions), those
with high perceived job security, those who feel it would be easy to get a comparable job elsewhere,
and those on high earnings. Some of these correlations are compatible with the hypothesis that
employees have an expected utility function that is increasing in income and declining in risk.
Demographic variables work strongly – as in other areas of labor economics.
The time-trend variable in Table 3’s regressions is consistent with the simple downward
movement observed in the raw numbers of Table 1. Knowing the appropriate units in order to interpret
this is not straightforward, but it can be seen that time enters with a coefficient of approximately –0.010
(t of 5.74) in the short specification of column 1 of Table 3. This drops only slightly in absolute value to
–0.008 (t of 3.77) when, in column 2, variables are included for union status and job security. In
columns 6 and 7, the coefficient comes up somewhat, in absolute size, once a variable for pay is
incorporated.
7
Other features of Table 3 are relevant. It is not immediately clear how to read the size of the
coefficients. However, working out the effects quantitatively, particularly large consequences for well-
being are found from being black and having a secure job (negative and positive, respectively).
Surprisingly, there appears to have been no attempt to use the former to study racial discrimination from
an angle different from the conventional focus on levels of pay.
In exploring the reasons for declining well-being at work, two testable hypotheses come to
mind:
• Is US job satisfaction falling because of the decline of trade unions and worker representation?
• Is satisfaction falling because of increasing job insecurity?
There is reason to take the first of these seriously: there has been a strong drop in union density in the
United States over the period studied here. On the second, it seems to be believed in the press that
Americans’ sense of job security has declined in recent years. Academic evidence has been largely
missing. Henry Farber’s work (1990, 1999), for example, does not find evidence of greatly heightened
unemployment durations. Gregg and Wadsworth (1995) and Burgess and Rees (1996) paint a broadly
similar picture for Britain.
The Appendix shows in Table A1 that, in the General Social Surveys studied here, respondents
do seem to have become a little less confident over the last two decades. These data are not well
known. At the end of the 1970s, around 70% of people in the US thought it was not at all likely they
would lose their jobs. By the end of the 90s, this % had dropped to the low 60s. More revealingly, in
Table A2, a regression equation for ‘perceived likelihood of job loss’ has a statistically signficant
upward time trend. Perceived ease of finding another comparable job has also moved in the direction
of increased insecurity: in Table A2 its time trend is down.

8
Column 2 of Table 3 tests and appears to dispose of two possible explanations for America’s
declining job satisfaction – unions and insecurity. Column 2 enters a trade union membership dummy,
Union, which enters strongly negatively. The regression in column 2 enters also a set of job security and
insecurity proxies. These capture people’s perceptions, recorded in GSS, of whether they are likely or
unlikely to lose their job; they capture too the ease with which each individual feels he or she could get
another job. Workers who answer “it is not at all likely I will lose my job” are much more satisfied at
work. Similarly people saying “it would be easy for me to find another job”, which is the omitted base
variable, are statistically much more likely to declare themselves satisfied.
Moving from column 1 to column 2 of Table 3 makes little difference to the coefficient on Time,
the annual time trend from 1973 to 1996. In other words, controlling for union status and job insecurity
makes little substantive difference to the conclusion that perceived well-being at work is falling.
Americans must be experiencing – or more precisely reporting – declining job satisfaction for different
reasons.
Finally, in columns 6 and 7 of Table 3, a control for workers’ pay (measured annually) is
introduced. As might be expected, it enters strongly positively. Well-paid people tend to be satisfied.
Interestingly, years of education then change from being significantly positive to being negative and
insignificantly different from zero. The finding that the positive education effect disappears once income
is entered as a control – in column 6 of Table 3 – is somewhat similar to a result of Clark and Oswald
(1996) in which in British data the impact of years of education on satisfaction is negative. Clark and
Oswald view this as a kind of curse of high aspirations. Schooling apparently does not directly buy
happiness at work; it procures a larger salary and also raises expectations of what someone thinks they
should receive. An early econometric treatment of this kind of idea is in Hamermesh (1977).

9
III. International Evidence
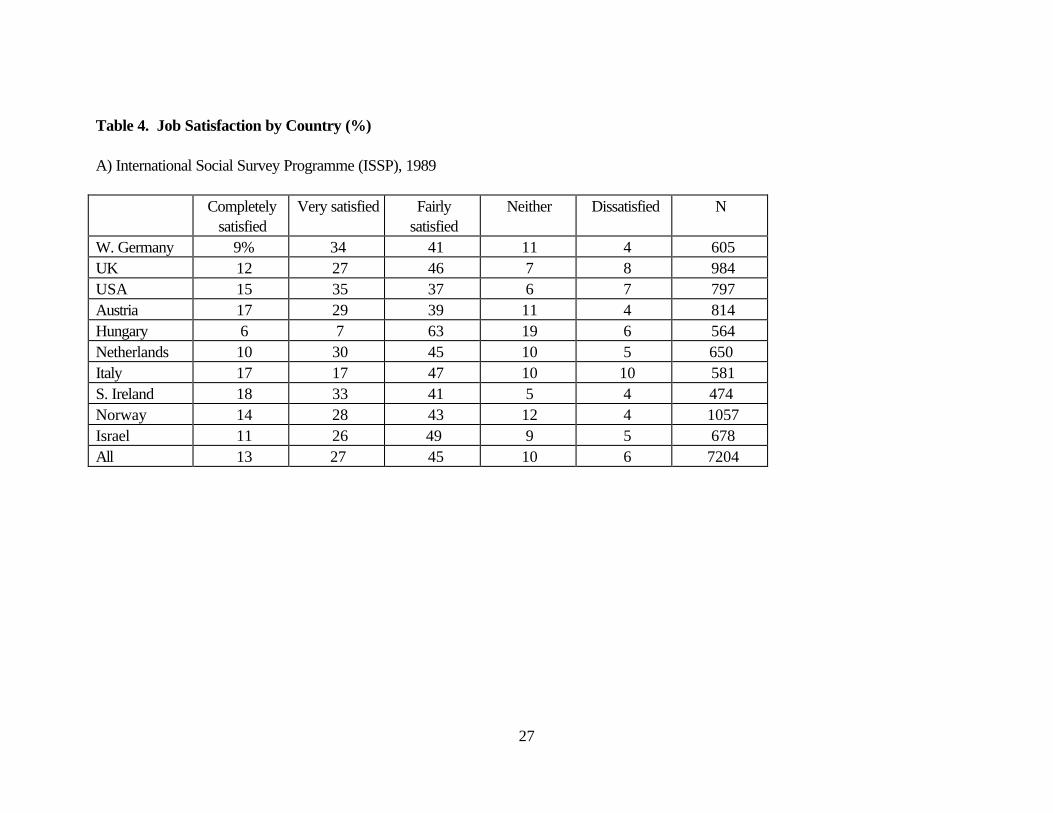
What of job satisfaction levels in other advanced nations? Table 4 presents cross-sectional information
from the International Social Survey Programme of 1989, and from two Eurobarometers conducted in
1995 and 1996.1 It can be seen from parts A and B of Table 4 that, as for the US General Social
Survey, there is strong bunching of answers at the high end of the satisfaction scale. Again the old idea
that the drudgery of work exploits human beings is -- at least at face value -- apparently not true.
On both parts of Table 4, individuals in Southern Ireland appear to record the greatest job
satisfaction. Another highly satisfied nation is Denmark. By contrast, Hungary and the Mediterranean
countries (Greece, Italy, Spain, France, Portugal) show up far down on the job satisfaction world
league table. According to Eurobarometer data, 38% of Greek employees say they are dissatisfied.
Because the surveys asked questions in different languages in different countries, there exists the
chance that the Greek and other results are illusory. They may be a trick of how words translate. It is
not possible to overturn such a view conclusively, but two counter-arguments are worth considering.
The first is that psychologists are well aware of such – translation – objections. For this reason, there is
a preference among researchers for satisfaction questions, rather than happiness questions, because it is
believed that the word ‘satisfaction’ translates with less international error from one language to the next.
The second is that large differences are discovered even across nations using the same language, so
differences nation-by-nation cannot be attributed solely to the language of the survey team. Moreover,
Ireland comes out top among the three English-speaking nations here (57% very satisfied). This is
despite the fact it is not a rich country: the United Nations Human Development Report estimates
1 For earlier work on job satisfaction using the 1989 International Social Survey Programme data, see Blanchflowerand Freeman (1997). Curtice (1993) and Clark (1998) also use ISSP data.

10
Ireland’s GDP per head at around half that of the US, and about two thirds of the UK’s (all measured
at purchasing power parity prices). By contrast, in the United Kingdom, for example, only 38% of
workers report themselves as very satisfied. Why the Irish should be so much more satisfied is unclear.
It should be noted that the size of samples continue to be relatively small: approximately 1000
workers are sampled from each country in Eurobarometers and slightly less than this in the International
Social Survey Programme. We have no reason to doubt the quality of the sampling, but it would be
comforting to have larger numbers of workers. This is another reason to treat the estimates cautiously.
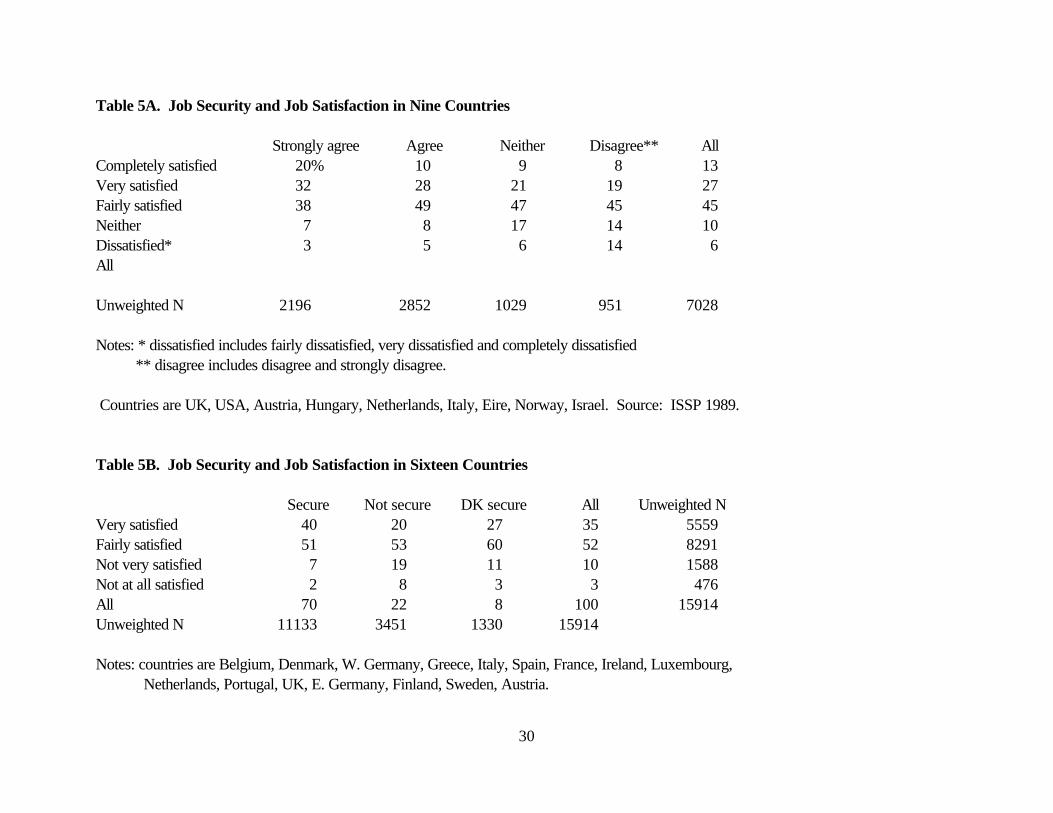
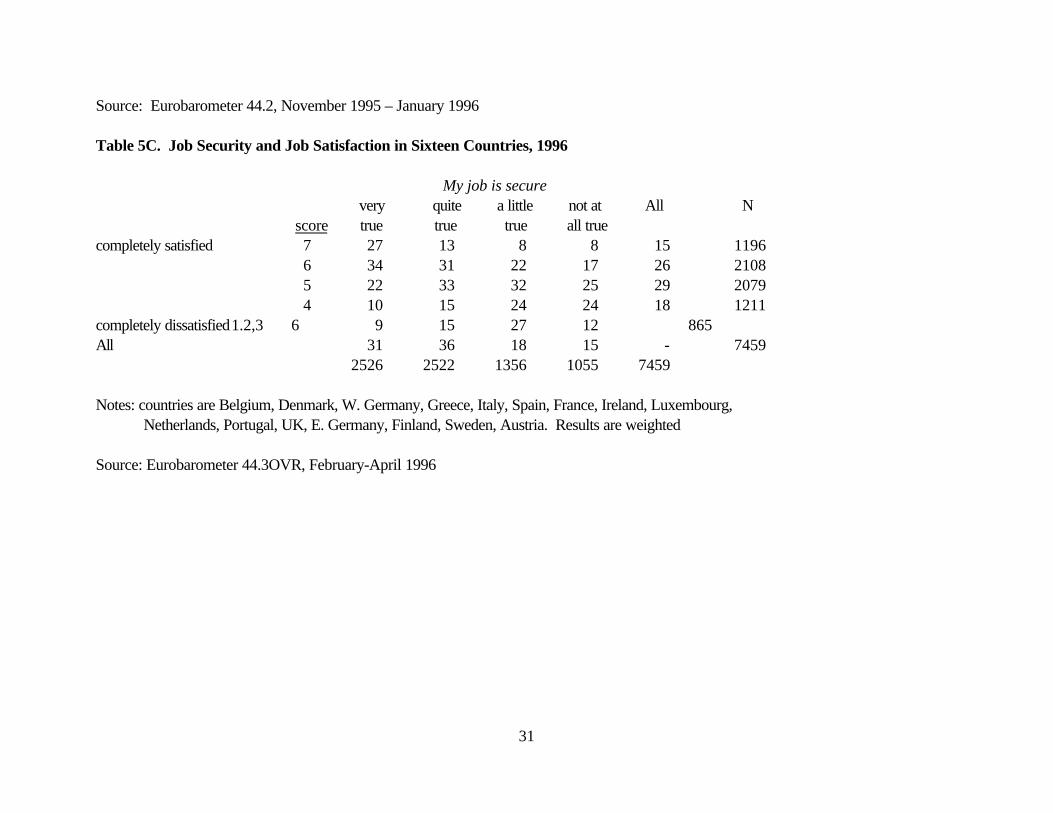
As in the United States, there is a strong connection in the European data between feeling
secure and saying one is satisfied with a job. Table 5 summarises the numbers (a recent study of
European job insecurity is OECD 1997). People who state their job is secure have a much larger
probability of reporting themselves happy with their work. In Eurobarometers, for example, Table 5B
shows that of those secure in their jobs approximately 40% say “very satisfied”, while the figure is only
20% among the sub-sample saying not secure.
Table 6 reveals that most of the patterns survive multiple regression controls. It presents an
ordered logit for the ISSP sample of seven thousand workers. The data are for the single year 1989.
Even after personal characteristics are entered, Ireland is top (followed by the US), and Hungary and
Italy are bottom. As has been found in many studies, there is a strong U-shape in age. The quadratic
minimizes around age 30. Men are much less satisfied; schooling is weak; self-employment is strongly
positive; supervisors enjoy their jobs more; unions continue to be associated with less job satisfaction.
The union result goes back at least to Freeman (1978) and continues to puzzle researchers; it may be
simply reverse causation led by the tendency of displeased workers to seek union representation.
_____________________________

11
Most strikingly, job security enters monotonically. As a rule of thumb, its effect is the largest in
the data. It is unlikely this finding is known to most labor economists, or even most psychologists.
A range of job characteristics are introduced in Table 7. As would be guessed, human beings
like to work independently and in workplaces with high pay and good chances of advancement. They
also like to ‘help people’ and to work in healthy rather than unhealthy conditions. It might be
reasonable for an economist to object that some -- perhaps even most -- of these subjective judgments
could be close to generating truisms in the data, but we report them because these are the patterns
found in our surveys. The result that people enjoy independence is well-known to psychology
researchers. It is sometimes referred to as an example of the ‘locus of control’ hypothesis. Spector et
al (1999) is a recent paper looking at a similarly large range of nations. As we found above for the
USA, having a secure job increases job satisfaction: the easier it is to find a similar job the higher is
satisfaction. In these countries also, job security is an important determinant of work satisfaction.
As a sense of job security plays an influential role in earlier satisfaction equations, it seems
sensible to examine the structure of cross-section equations in which job security is the dependent
variable. This is what Table 8 does for the countries in the International Social Survey Programme. In
the survey interviews, individuals were given the option of replying to the question “How much do you
agree or disagree that your job is secure?”. Answers were coded as: strongly agree, agree, neither,
disagree, strongly disagree. As the lower part of Table 8 shows, percentage responses were heavily
concentrated in the top two categories of ‘strongly agree’ and ‘agree’ (the others are omitted in Table
8’s lower part). In other words, most individuals do not fear imminent job loss. Across the sample of
countries, 72% of people said they either agreed or strongly agreed that their job was secure. Table 8
attempts to uncover the econometric structure of security. It estimates ordered logit equations using as

12
independent variables the following: a set of country dummies, age, gender, education, whether a
supervisor, union member, and public sector employee.
Table 8 is based on a simple cross-section rather than longitudinal data, and makes no
identifying assumptions. It would therefore be unwise to place causal interpretations upon it.
Nevertheless, the correlations are such that, in the full specification of column 4, job security is greater
among older workers, those who supervise, and those in public sector occupations. Translation of ‘job
security’ in a consistent way across different languages is likely to be imperfect. However, it is worth
noting that the United Kingdom performs consistently badly on the security score (see also Turnbull and
Wass, 1999), and that this is true judged against also the other English-speaking countries, the US and
Ireland.
The large and well-determined impact from being a public sector employee is notable. Such
workers are a lot less fearful for their jobs than private-sector people.
This means that job satisfaction equations that omit job-security measures may tend to generate
upwardly-biased coefficients on public-sector dummy variables. Of course this would be likely to
change over time and by country: Gardner and Oswald (1999) show that in the UK the size of the
public-sector satisfaction premium seems to have fallen sharply through the 1990s.
Job satisfaction equations for the Eurobarometer Surveys data in the mid-1990s are reported in
Tables 9 and 10. As in the tables of means, Ireland is comfortably top of the satisfaction ranking, and
Greece bottom. The same microeconomic patterns are found as in other data sets. There is a well-
determined U-shape in age; men are less satisfied; the self-employed, public sector people and
supervisors are more satisfied; education enters here positively. It ought to be noted that there is no
income variable; this data set does not provide it. In the first column of Table 9, long job tenure is

13
associated with high satisfaction. This disappears, however, when three other variables are included --
commuting time and two perceived job-security measures. The U-shape in age minimizes, in Table 9, in
a person’s 40s.
More detailed job-satisfaction equations, done separately for male and female sub-samples, are
contained in Table 10. Variables are included that capture quality of the job. For example, Table 10
reveals that job satisfaction is greater in quiet workplaces, ones with no gaseous vapours, ones where
workers say ‘no painful or tiring positions’, where employees control the equipment, their work pace,
where they do not have to carry loads or work at high speed. Working at home appears to be
associated with raised satisfaction for women but not men. The ability to control the temperature and
ventilation is correlated with higher satisfaction. Employees who identify a health and safety risk at their
workplace are much more likely to say they are dissatisfied. Unsurprisingly, women appear to value
equal opportunities at work. We find no significant evidence that the gender of one’s boss has an effect
on job satisfaction for either men or women.
Table 11 reports the results of estimating a further job satisfaction equation using 1996 data
from Eurobarometer Survey #44.3OVR. The results are similar to those discussed in Table 10 above:
more job security, for example, is associated with increased job satisfaction. Moreover, improvements
in perceived security over the preceding five-year period, holding constant current job security, are
associated with increased satisfaction. Once again, the existence of unions is correlated with lower job
satisfaction for both men and women. The countries with the highest levels of job satisfaction here are
Denmark and the Netherlands, while Italy and Greece have the lowest. It seems surprising that Ireland
loses its top spot in the 1996 data. There are relatively few observations, which may be one factor.

14
Also included in the 1996 Eurobarometer Survey was a series of questions which allow us to
examine psychological health. One issue is whether declining job satisfaction and increased job security
have affected workers’ mental well-being. Table 12 provides the responses to a series of questions that
asked workers whether they had a)…lost much sleep over worry, b)…been feeling unhappy and
depressed, c)…been losing confidence in yourself, d)…been feeling you could not overcome your
difficulties, e)…been feeling constantly under strain, f)…been thinking of yourself as a worthless person?
These may appear strange to economists but are standard questions that are traditionally combined to
form part of a so-called GHQ score (or General Health Questionnaire score). Among European
medical statisticians and psychiatrists, the GHQ level is the most widely used questionnaire method for
detecting low-grade mental health or stress (in other words, mild forms of psychological problems). It
originates from the work of Goldberg (1972). As might be imagined, for serious mental illness GHQ is
not viewed as so appropriate, and is supplanted by clinical examinations. In its most basic form, GHQ
measures the sum of the number of times a person puts himself or herself in the stressed category.
Only a semi-GHQ score can be calculated here. That is because only six questions (instead of
the usual 12) are asked.
The first six columns of Table 12 report the percentage saying “not at all” to each of the stated
questions. The final column gives the semi-GHQ score, which sums the six components, and reports
the aggregate outcome as a stress proxy. Table 12’s final column is interesting because it may be a
moderately comparable test for stress across workers from a range of different countries. The most-
stressed countries – among samples of workers -- are Italy (at 1.35), France (0.99) and Spain (0.89).
The least-stressed are Eire (0.33) and Sweden (0.46). These results are interestingly reminiscent of
some aspects of the job satisfaction league tables.

15
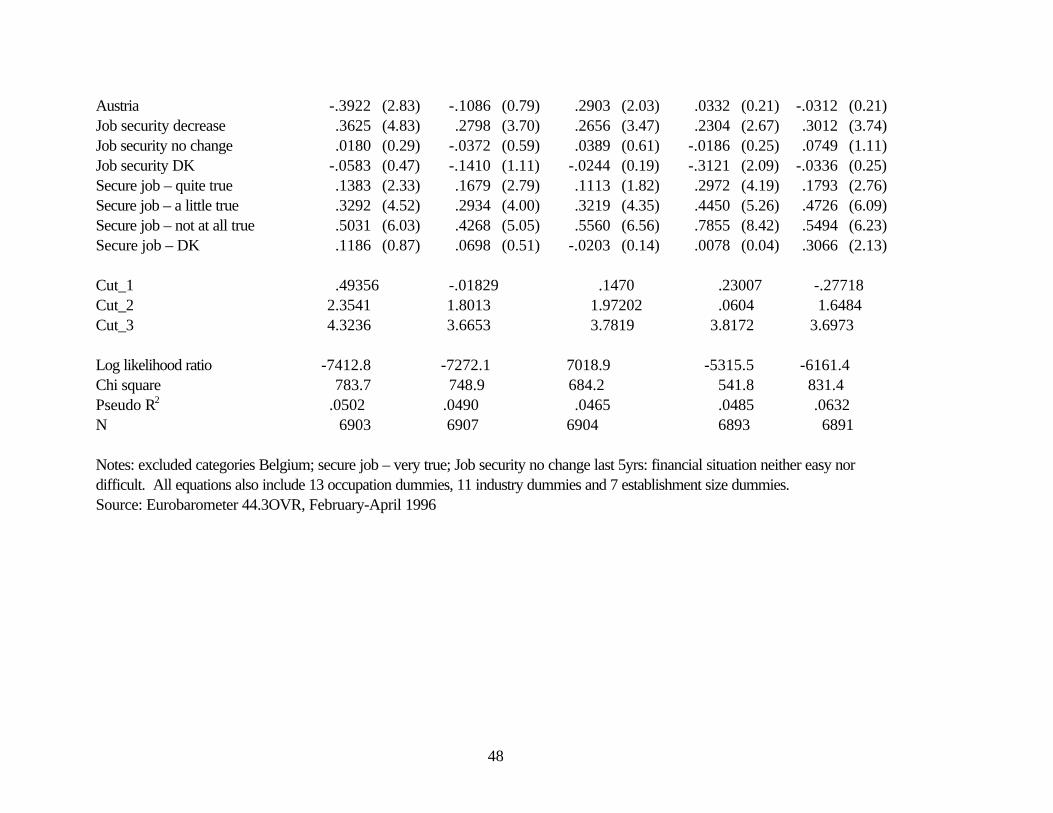
Tables 13 and 14 examine the overall determinants of stress and its constituents. In Table 13, a
series of ordered logits are estimated where the dependent variable is the first level if ‘not at all”, number
two if “no more than usual”, three if “rather more than usual” and four if “much more than usual”. Hence
a positive coefficient is to be interpreted as showing the variable is associated with lower mental
wellbeing. Strain levels increase in age, are higher for females than males, and are strongly increased by
the number of hours worked and job insecurity, and eased by a healthy financial situation. Based on the
semi-GHQ score in Table 14 (European-15 mean = 0.95, meaning stressed on approximately one
category on average), overall stress levels appear to be particularly low in Southern Ireland and
especially high in Italy. The third column of Table 14 reports the results of estimating a probit equation
where the dependent variable is set to one if the worker replied positively when asked if he or she
worked under “a great deal of pressure”. Perceived pressure appears to be greater in the private than
in the public sector, and for those with longer hours and tenure.
One of the interesting questions is what has been happening through the 1990s to stress levels in
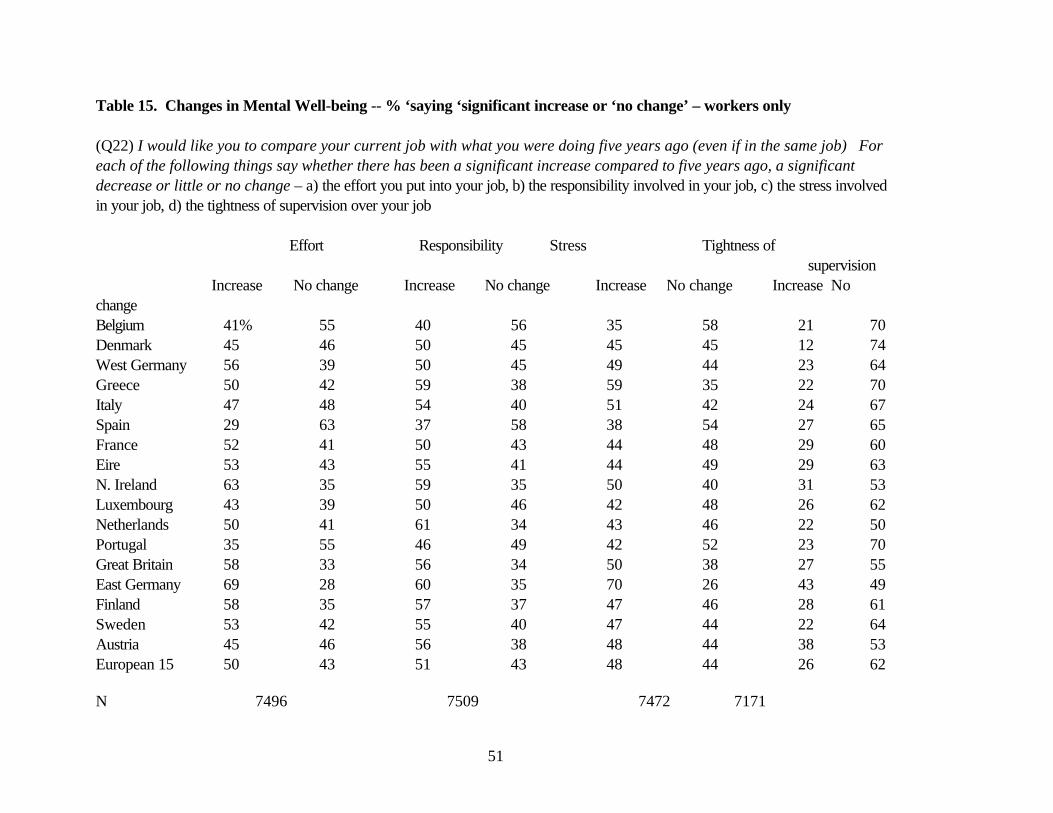
these nations’ workplaces. While perhaps imperfect because it is retrospective, Table 15 provides a
start. Workers were asked in the 1996 survey to compare their current job with what they were doing
five years ago (even if in the same job) and say whether there had been an increase compared to five
years ago in (a) the effort they put into their job, (b) the responsibility involved in their job, (c) the stress
involved in their job, (d) the tightness of supervision over their job. The Table gives the percentages of
people who reported an increase and those saying there had been no change (the remainder, omitted, is
of course the small percentage reporting a decrease2). In all cases there is evidence in Table 15 of large
2 The overall distributions, weighted to be representative of the European 15 were as follows (%)

16
perceived increases in strain over time. Roughly half of all Europe’s workers believe that there has been
in the workplace a significant rise in effort, responsibility and stress. Approximately a quarter believe
that the tightness of supervision has gone up significantly.
It is not easy to know what to make of the numbers in Table 15. Taken at face value, they
seem remarkable, and perhaps worrying for the Western democracies. A natural response is to wonder
if human beings accidentally or deliberately exaggerate their difficulties. Perhaps the numbers in Table
15 are unreliable. However, one reason to question the idea that answers to such questions are
automatically biased up is found in the final column: perceived tightness of supervision has worsened
much less. Hence 50% saying that things are worse is not an inevitable outcome from questionnaire
inquiries.
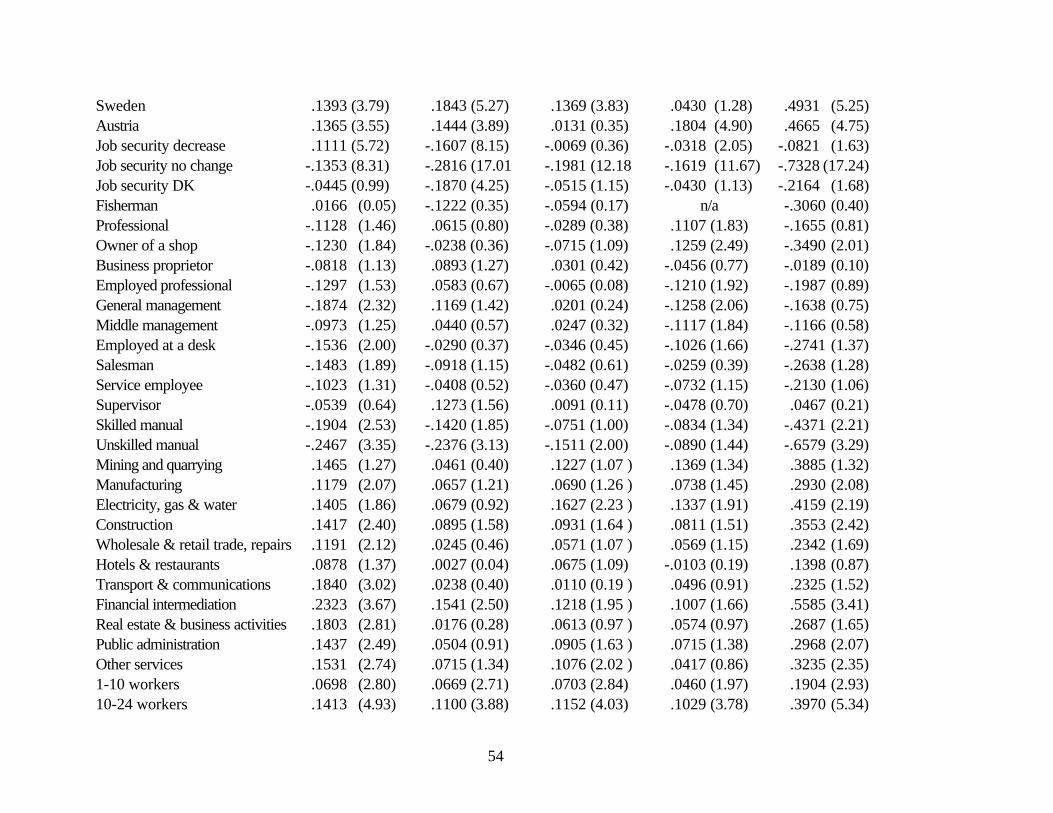
To explore the characteristics of the people most prone to view things as getting worse, the first
four columns of Table 16 report probit equations. These are for the probability of giving different
responses for each category (with the dependent variable set to 1 if an increase was reported and zero
if a decrease or no change). The dependent variable in the final column of Table 16 is an amalgam: it is
the sum of the responses in the previous four columns -- with a value of four if the respondent reported
increases in each of the four elements and so on down to zero if no perceived increases were revealed
(European 15 mean=1.75). Raised stress, effort, responsibility and tightness of supervision all turn out
to be negatively correlated with age, and -- except for ‘responsibility’ -- lower for men than women.
_____________________________Not at all No more than Rather more Much more
usual than usual than usuala) Sleep 46 35 15 4b) Unhappiness 49 35 12 4c) Lost confidence 67 24 7 2d) Difficulties 56 31 11 2e) Strain 42 37 16 4
17
Increases in these strain variables are positively correlated with hours of work and greater job
insecurity. Growth in the various items has been especially marked in East Germany, and least
noticeable in Belgium (the excluded category). The burden appears worsened, as would be expected,
by financial difficulties. For each of these equations, we also report coefficients and t-statistics on sets
of industry, occupation and establishment size dummies. In each column, there is evidence that mental
stress is greater for non-manuals than manuals; is increasing in establishment size, but appears to flatten
out around five hundred employees; and is relatively high in financial services.
Table 17 provides, for cross-sections in the 1990s, a set of probit equations for the probability
of reporting stress, tiredness, fatigue and sleep problems. The dependent variable draws on questions
of the kind “How often do you find your work stressful? Always, often, sometimes, hardly ever, never.”
The patterns in the table are again consistent with those in earlier tables of various kinds. Once more,
for example, unionism is associated with greater stress and greater tiredness. Interpretation of the
coefficients across countries is again likely to be fraught with difficulties. Ireland scores well -- although
not perfectly consistently across the columns of Table 17 -- with low measured strain. By contrast a
nation like Greece shows poorly: it comes near the top of the strain league.
IV. Conclusions
This paper documents the patterns in job satisfaction and well-being data on approximately
50,000 randomly sampled people across eighteen countries. The main purpose of the analysis is to
describe the facts and point out that labor economists have had fairly little to say about why these
features exist in international data. Although it could be argued that economists should not concern
themselves with workers’ well-being, we find it hard to see a cogent case for such a position. ‘Utility
_____________________________f) Worthless 78 17 4 1

18
levels’ are implicitly studied in most published work in labor economics; there are systematic patterns in
these data sets; satisfaction scores are correlated with observable behavior; psychologists ought to
know more than economists about how to measure well-being, and their research journals have for
years used such statistics.
Our data are simple. They come in the form of responses to questions such as “How satisfied
are you with your job as a whole?”, or “Have you lost much sleep over worry?”. People’s answers, the
paper shows, are systematically correlated with personal characteristics.
There are a number of conclusions. Partly because of the lack of longitudinal data, it is not
always straightforward to draw causal inferences.
• Perceived levels of job satisfaction seem remarkably high in the western democracies. Only
a small minority of workers say they are dissatisfied with work.
• Nevertheless, the data suggest a slow but steady decline in job satisfaction in the US
between 1973 and today. This is especially true among those employees greater than thirty
years old: in the 1970s 56% were very satisfied while by the mid-1990s the proportion had
fallen to 48%. This downward trend appears to be statistically significant (even after we
control for changing demographics and other factors).
• The downward movement is not because of the falling proportion of unions to represent
workers, nor because of a drop in Americans’ feelings of job security (even though we
present new data to suggest there has been a fall in perceived security).
• There are strong microeconomic patterns in satisfaction, and these are approximately the
same in all countries. Expectations of possible job loss have one of the largest discernible
negative effects on reported job satisfaction. We document other correlates. Satisfaction is
19
U or J shaped in age, minimising in the 30s. It is greater among women, whites, those on
high pay, supervisors, public sector employees, the self-employed, and those who commute
short distances. Once pay is held constant, education and job tenure have small or negative
effects.
• Workers across the European Union believe they are under growing stress and pressure. A
significant proportion report being constantly under strain, losing sleep over worry, losing
confidence in themselves, and feeling unhappy and depressed. In comparison with their
situation five years earlier, workers reported dramatic increases in the amount of stress,
responsibility, and effort -- alongside some tightening in the level of supervision they receive.
Life at work is perceived to be tougher than at the start of the 1990s.
• Workers’ mental well-being levels appear to be especially high in Ireland and Sweden, and
especially low in Italy, France and Spain.
These international patterns in job satisfaction and psychological health present economists with many
puzzles. It seems we will be back.
20
Table 1. Job Satisfaction in the USA, 1973-98
A) Proportions (Current Workers Only)
Question: On the whole how satisfied are you with the work you do – would you say you arevery satisfied, moderately satisfied, a little dissatisfied, or very dissatisfied?
All 1972 1973 1974 1975 1976 1977 1978 1980 1982 1983 1984
Very satisfied 49% 50 50 56 53 49 52 47 48 53 47
Moderately satisfied 37 37 38 33 33 39 37 37 39 35 35
A little dissatisfied 11 8 8 8 9 10 8 12 9 8 12
Very dissatisfied 3 4 4 3 5 2 4 4 5 4 6
N 864 775 737 748 741 867 850 821 1009 897 875
All 1985 1986 1987 1988 1989 1990 1991 1993 1994 1996 1998 All
Very satisfied 49 49 46 48 48 48 46 44 47 46 48 48
Moderately satisfied 38 40 38 40 38 39 42 42 40 40 38 38
A little dissatisfied 10 9 11 10 10 10 8 10 11 11 10 10
Very dissatisfied 3 2 4 3 4 4 4 4 3 4 3 4
N 903 838 1132 889 911 847 882 975 1903 1935 2216 23354
Weighted to control for over-sampling of blacks in 1982 and 1987

21
Source: General Social Surveys

22
Table 1 continuedB) The Percentage Very Satisfied by Different Demographic Characteristics % very satisfied with work
All Men Women Whites Non-whites Non-white Non-white Age <30 Age >=30 Men women
1972 49% 48 50 51 38 39 35 34 541973 50 50 51 50 47 41 56 36 551974 50 51 49 52 34 39 28 41 541975 55 56 55 57 44 51 37 42 611976 53 54 52 54 40 38 42 40 591977 49 48 51 50 45 53 35 36 541978 52 51 53 54 34 31 36 44 551980 47 46 48 48 37 40 46 37 511982 48 48 48 49 40 43 43 37 531983 53 51 56 54 45 43 45 42 581984 47 44 49 47 43 44 43 37 501985 49 46 53 49 48 52 36 37 531986 49 53 46 50 45 47 31 40 531987 47 48 45 49 35 34 34 35 501988 48 50 46 50 39 49 40 39 511989 49 47 50 50 35 37 26 37 521990 48 46 50 49 43 46 40 39 511991 46 49 43 49 32 39 26 40 481993 44 43 46 45 41 39 43 33 471994 47 47 47 49 35 37 33 36 491996 46 47 45 47 41 42 40 39 471998 48 45 50 51 37 40 34 42 50Average 49 49 49 50 40 42 38 38 53
N 23354 12204 11150 19927 3160 1721 2039 5945 17409

23
Note: average is simply the unweighted average of the year estimated reported in the table. Weights are used to control for statistical over-sampling of minorities in some years. Source: General Social Surveys
24
Table 2. Job Satisfaction and Job Security in the USA, 1977-1998 (Source: General Social Surveys).
A) Prospects of job loss
Question: Thinking about the next twelve months, how likely do you think it isthat you will lose your job or be laid-off – very likely, fairly likely, not toolikely, or not at all likely?
Job loss
Job satisfaction Very likely Fairly
likely
Not too likely Not at all
likely
All
Very satisfied 37% 32 39 54 48
Moderately satisfied 38 45 47 36 39
A little dissatisfied 16 16 11 8 10
Very dissatisfied 9 6 3 3 3
N 605 697 3112 7693 12378
A) Prospects of finding another job
Question: About how easy would it be for you to find a job with anotheremployer with approximately the same income and fringe benefits you nowhave? Would you say very easy, somewhat easy, or not easy at all?
Ease of finding a job

25
Job satisfaction Very easy Somewhat
easy
Not easy at all All
Very satisfied 56% 43 46 48
Moderately satisfied 33 44 40 39
A little dissatisfied 7 11 10 9
Very dissatisfied 4 3 4 3
N 3212 3935 5143 12290

26
Table 3. Job Satisfaction in the USA, 1972-1998: Ordered logit (Current workers only)
(1) (2) (3) (4) (5) (6) (7)Age .0259 (24.18) .0254 (20.01) .0257 (16.91) .0247 (12.64) .0247 (12.12) .0211 (9.69) .0237 (14.52)Male -.0799 (3.04) -.0522 (1.67) -.1060 (2.96) -.0965 (2.06) -.0933 (1.97) -.2008 (3.79) -.1919 (4.80)Self-employed .5326 (12.89) .5198 (10.59) .4598 (8.03) .5711 (7.81) .4960 (6.54) .4938 (6.07) .4529 (7.33)Black -.4176 (10.32) -.4328 (8.89) -.3346 (5.92) -.5106 (6.64) -.4418 (5.65) -.4697 (5.71) -.3529 (5.95)Other non-white -.1661 (2.27) -.1882 (2.20) -.1917 (1.98) -.2483 (1.96) -.2490 (1.99) -.2427 (1.75) -.2007 (1.94)Time -.0104 (5.74) -.0082 (3.77) -.0138 (4.88) -.0115 (2.90) -.0101 (2.49) -.0186 (4.17) -.0211 (6.76)Years of Schooling .0391 (8.24) .0384 (6.78) .0231 (3.62) .0318 (3.65) .0219 (2.45) -.0049 (0.49) .0089 (1.36)Union -.1610 (3.85) -.0760 (1.17) -.0217 (0.33) -.1071 (1.53)Lose job fairly likely -.1234 (1.15) -.1295 (0.90) -.1583 (1.03) -.1543 (1.36)Lose job not too likely .1910 (2.19) .0758 (0.65) -.0023 (0.02) .1335 (1.44)Lose job not at all likely .6530 (7.78) .5509 (4.91) .4621 (3.82) .5889 (6.57)Find job somewhat easy -.3088 (6.46) -.2487 (3.96) -.2572 (3.90) -.3026 (6.02)Find job not easy at all -.3259 (6.97) -.2669 (4.28) -.3109 (4.73) -.3664 (7.43)Log of annual income .1955 (6.68) .1495 (6.86)
Cut_1 -2.2109 -2.2488 -2.3091 -2.1530 -2.5104 -1.5413 -1.4384Cut_2 -.7749 -.8602 -.8089 -1.0948 -1.0821 -.1169 .0590Cut_3 1.2371 1.1314 1.3039 .9744 1.0210 2.0176 2.1919
Log likelihood -22771.5 -16413.3 -12198.5 -7222.8 -7016.5 -6380.2 -11099.0Chi-Squared 1188.1 851.2 968.2 405.6 544.6 522.4 921.7Pseudo R2 .0254 .0253 .0382 .0273 .0374 .0393 .0399N 21908 15806 11983 7087 6950 6333 10916
Notes: losing and finding a job variables not available in years 1972-1976, 1980, 1984 and 1987. Union status not available in 1972, 1974, 1977 & 1982. Column 4 isthe same sample period as columns 5 and 6. Excluded categories are lose job very likely and find job – very easy. All equations include 44 state dummies.
t-statistics in parentheses
27
Table 4. Job Satisfaction by Country (%)
A) International Social Survey Programme (ISSP), 1989
Completelysatisfied
Very satisfied Fairlysatisfied
Neither Dissatisfied N
W. Germany 9% 34 41 11 4 605UK 12 27 46 7 8 984USA 15 35 37 6 7 797Austria 17 29 39 11 4 814Hungary 6 7 63 19 6 564Netherlands 10 30 45 10 5 650Italy 17 17 47 10 10 581S. Ireland 18 33 41 5 4 474Norway 14 28 43 12 4 1057Israel 11 26 49 9 5 678All 13 27 45 10 6 7204

28
Table 4. Job Satisfaction by Country (%) (continued)
B) Eurobarometers, 1995-1996
Very satisfied Moderatelysatisfied
A littledissatisfied
Verydissatisfied
N
Belgium 44% 49 6 1 1011Denmark 50 45 3 2 997W. Germany 34 51 11 4 1025Greece 11 50 29 9 1003Italy 26 56 15 4 1028Spain 23 57 16 4 996France 22 60 14 5 999S. Ireland 57 38 4 1 1004Luxembourg 40 53 5 2 494Netherlands 46 46 7 1 1064Portugal 21 62 13 3 998UK 38 49 9 5 1064E. Germany 34 56 9 2 1047Finland 31 62 6 2 1059Sweden 39 53 5 2 1055Austria 44 45 9 1 1070All 35 52 10 3 15914
Notes: Results are weighted
C) Eurobarometers, 1996
Dissatisfied Neither Satisfied Satisfied Satisfied N

29
1, 2 or 3 4 5 6 7Belgium 8% 14 37 31 10 432Denmark 8 9 23 35 25 547W. Germany 8 13 30 32 16 474Greece 19 24 26 21 10 448Italy 14 25 28 20 13 508Spain 15 20 24 23 18 443France 14 23 33 21 9 604S. Ireland 18 16 24 25 17 433Luxembourg 11 13 31 27 18 289Netherlands 6 11 21 39 23 465Portugal 15 22 30 21 12 467UK 11 16 29 27 16 661E. Germany 12 14 27 31 16 468Finland 9 11 31 34 16 432Sweden 6 126 33 33 12 563Austria 13 16 28 28 24 535All 12 18 29 26 15 7769
All in all how satisfied are you with your job?
Completely satisfied Completely dissatisfied
1 2 3 4 5 6 7
30
Table 5A. Job Security and Job Satisfaction in Nine Countries
Strongly agree Agree Neither Disagree** AllCompletely satisfied 20% 10 9 8 13Very satisfied 32 28 21 19 27Fairly satisfied 38 49 47 45 45Neither 7 8 17 14 10Dissatisfied* 3 5 6 14 6All
Unweighted N 2196 2852 1029 951 7028
Notes: * dissatisfied includes fairly dissatisfied, very dissatisfied and completely dissatisfied ** disagree includes disagree and strongly disagree.
Countries are UK, USA, Austria, Hungary, Netherlands, Italy, Eire, Norway, Israel. Source: ISSP 1989.
Table 5B. Job Security and Job Satisfaction in Sixteen Countries
Secure Not secure DK secure All Unweighted NVery satisfied 40 20 27 35 5559Fairly satisfied 51 53 60 52 8291Not very satisfied 7 19 11 10 1588Not at all satisfied 2 8 3 3 476All 70 22 8 100 15914Unweighted N 11133 3451 1330 15914
Notes: countries are Belgium, Denmark, W. Germany, Greece, Italy, Spain, France, Ireland, Luxembourg, Netherlands, Portugal, UK, E. Germany, Finland, Sweden, Austria.
31
Source: Eurobarometer 44.2, November 1995 – January 1996
Table 5C. Job Security and Job Satisfaction in Sixteen Countries, 1996
My job is secure very quite a little not at All N score true true true all truecompletely satisfied 7 27 13 8 8 15 1196
6 34 31 22 17 26 21085 22 33 32 25 29 20794 10 15 24 24 18 1211
completely dissatisfied1.2,3 6 9 15 27 12 865All 31 36 18 15 - 7459
2526 2522 1356 1055 7459
Notes: countries are Belgium, Denmark, W. Germany, Greece, Italy, Spain, France, Ireland, Luxembourg, Netherlands, Portugal, UK, E. Germany, Finland, Sweden, Austria. Results are weighted
Source: Eurobarometer 44.3OVR, February-April 1996

32
Table 6. Job Satisfaction Ordered Logit Equations (Source: ISSP 1989) – t-statistics in parentheses)(1) (2) (3) (4) (5)
UK -.1889 (2.00) -.2108 (2.20) -.2026 (1.95) -.0121 (0.12) -.0202 (0.19)USA .2227 (2.50) .1854 (1.78) .2497 (2.38)Austria .1530 (1.72) .2135 (2.35) .3024 (3.17) .0572 (0.62) .1454 (1.50)Hungary -.9846 (10.16) -.9053 (9.14) -.8989 (8.32) -.8455 (8.47) -.7548 (6.89)Netherlands -.0825 (0.87) -.0457 (0.46) .0199 (0.19) .0298 (0.30) .0812 (0.77)Italy -.3182 (3.17) -.3744 (3.25) -.3402 (2.87) -.4767 (4.11) -.4160 (3.49)Eire .3862 (3.73) .4350 (4.07) .5403 (4.77) .5553 (5.14) .6570 (5.75)Norway -.0466 (0.56) .0309 (0.36) .1029 (1.13) .1347 (1.55) .2028 (2.21)Israel -.2006 (2.16) Age .0188 (10.42) -.0284 (2.18) -.0323 (2.25) -.0216 (1.65) -.0227 (1.58)Age2 .0005 (3.57) .0006 (3.55) .0004 (2.92) .0004 (2.80)Male -.1789 (4.04) -.2665 (5.30) -.2348 (4.30) -.2391 (4.73) -.2251 (4.10)Self-employed .4630 (5.38) .1774 (1.24) .4879 (5.64) .1426 (0.99)Years schooling .0053 (0.62) .0014 (0.14) -.0015 (0.17) -.0010 (0.10)Supervisor .3456 (6.32) .3211 (5.33) .3037 (5.52) .2755 (4.55)Union member -.1517 (2.93) -.1679 (3.01) -.2110 (4.05) -.1886 (3.36)Public sector .1213 (1.98) -.0402 (0.64)Strong agree secure job 1.2182 (9.79) 1.2976 (9.46)Agree secure job .6735 (5.53) .7626 (5.70)Neither agree/disagree .2595 (1.96) .3593 (2.47)Disagree secure job -.1023 (0.73) -.0009 (0.00)Cut_1 -4.716 -5.4801 -5.4795 -4.8655 -4.7252Cut_2 -3.691 -4.5248 -4.5907 -3.9061 -3.8325Cut_3 -2.382 -3.1884 -3.2490 -2.5576 -2.4783Cut_4 -1.243 -2.0151 -2.0235 -1.3594 -1.2269Cut_5 .946 .1907 .2108 .9259 1.0851Cut_6 2.481 1.7753 1.7637 2.5558 2.6785LR Chi2 339.2 417.6 331.4 728.6 578.2Pseudo R2 0.017 .0249 .0232 .0428 .0404

33
N 7202 5942 5086 5942 5086

34
Table 7. Job Satisfaction Ordered Logit Equations (Source: ISSP 1989) – t-statistics in parentheses
All Men WomenUK -.0417 (0.41) -.0872 (0.67) -.0050 (0.03)USA .1754 (1.60) -.0688 (0.47) .4899 (2.85)Austria .0097 (0.10) -.1164 (0.95) .1773 (1.17)Hungary -.5703 (5.38) -.4289 (3.01) -.7761 (4.76)Netherlands .0673 (0.66) .0004 (0.00) .0893 (0.51)Italy -.0849 (0.69) -.0351 (0.22) -.1621 (0.83)Eire .5761 (5.13) .4498 (3.18) .8213 (4.35)Norway .2093 (2.32) .1524 (1.30) .2433 (1.69)Age -.0120 (0.89) -.0250 (1.39) -.0058 (0.28)Age2 .0003 (2.27) .0005 (2.35) .0003 (1.28)Male -.2618 (4.84) n/a n/aSelf-employed .2692 (2.93) .2694 (2.48) .3060 (1.67)Years schooling -.0446 (4.93) -.0329 (2.95) -.0650 (4.11)Supervisor -.0698 (1.21) -.0669 (0.93) -.0520 (0.52)Union member -.0826 (1.53) .0102 (0.14) -.2034 (2.36)Strong agree secure job .6028 (4.46) .5510 (3.07) .7474 (3.54) Agree secure job .4521 (3.42) .4330 (2.46) .5134 (2.50)Neither agree/disagree .2442 (1.72) .2219 (1.19) .2723 (1.22)Disagree secure job .0819 (0.55) .0823 (0.42) .1342 (0.57)My income is high - agree -.0938 (0.60) -.0249 (0.13) -.1278 (0.42)My income is high – neither -.4070 (2.64) -.4249 (2.33) -.2921 (0.97)My income is high – disagree -.7170 (4.58) -.7925 (4.26) -.5465 (1.81)My income is high – strongly disagree -1.2423 (7.13) -1.3210 (6.09) -1.1090 (3.46)My income is high – can’t choose .1698 (0.50) .1930 (0.43) .2781 (0.51)My income is high – don’t know .1153 (0.22) -.1749 (0.27) .6665 (0.73)Advancement opps high - agree -.2520 (1.79) -.3173 (1.86) -.0987 (0.39)Advancement opps high - neither -.6472 (4.58) -.7764 (4.48) -.3954 (1.59)Advancement opps high - disagree -.9892 (6.94) -1.1000 (6.23) -.7597 (3.07)

35
Advancement opps high – strongly disagree -1.3324 (8.56) -1.6090 (8.24) -.9346 (3.52)Advancement opps high – can’t choose -.5017 (2.26) -.6809 (2.38) -.2596 (0.71)Advancement opps high – don’t know -.5603 (1.31) -.2108 (0.32) -.6443 (1.09)Work independently - agree -.5728 (8.44) -.6395 (7.29) -.4689 (4.31)Work independently – neither -.9170 (9.45) -1.0990 (8.71) -.6747 (4.36)Work independently – disagree -1.2114 (11.2) -1.3940 (9.46) -1.0000 (6.27)Work independently – strongly disagree -1.5986 (8.91) -1.5600 (6.51) -1.6690 (6.08)Work independently – can’t choose -.2053 (0.38) -.1224 (0.17) -.5119 (0.64)Work independently – don’t know -1.1133 (2.58) -.6500 (0.88) -1.3900 (2.49)Help people - agree -.3277 (4.48) -.2740 (2.71) -.4263 (3.92)Help people - neither -.5760 (6.68) -.5660 (4.92) -.5896 (4.35)Help people - disagree -.7467 (7.69) -.6546 (4.98) -.8970 (6.03)Help people – strongly disagree -1.1038 (7.35) -1.1560 (5.97) -1.0640 (4.37)Help people – can’t choose -.6142 (2.29) -.5430 (1.69) -.8580 (1.68)Help people – don’t know .0520 (0.10) -.1201 (0.18) -.0831 (0.09)Unhealthy conditions – often .0534 (0.34) .3017 (1.61) -.5559 (1.93)Unhealthy conditions – sometimes .2767 (2.02) .4399 (2.69) -.0774 (0.31)Unhealthy conditions – hardly ever .3499 (2.56) .5143 (3.12) -.0622 (0.25)Unhealthy conditions – never .6915 (5.31) .7532 (4.73) .4586 (1.98)Unhealthy conditions – can’t choose .2369 (0.97) .6869 (1.88) -.3310 (0.92)Unhealthy conditions – don’t know 1.2135 (3.02) .9471 (1.79) 1.3540 (2.17)Find a job – fairly easy -.3699 (3.63) -.5413 (4.09) -.1465 (0.90)Find a job – neither -.7047 (6.57) -.9561 (6.89) -.3867 (2.26)Find a job – fairly difficult -.5690 (5.34) -.7813 (5.61) -.2573 (1.53)Find a job – very difficult -.4334 (3.73) -.6625 (4.36) -.0621 (0.34)Find a job – can’t choose -.1587 (0.99) -.2070 (0.98) -.1040 (0.41)Find a job – don’t know -1.0013 (1.87) -1.4833 (11.71) -.8280 (1.22)
Cut_1 -8.0931 -8.1189 -8.19680Cut_2 -7.1058 -7.3647 -6.66899Cut_3 -5.6929 -5.9032 -5.3120

36
Cut_4 -4.3873 -4.568 -4.03084Cut_5 -1.7777 -1.9349 -1.38915Cut_6 .0528 -.10714 .476861
LR Chi2 1857.0 1208.1 722.4Pseudo R2 .1107 .1213 .1062N 5942 3495 2447
Notes: excluded categories, Germany. In the case of secure job – strongly disagree. For find a job the excluded category is –very easy and for all the other attitudinal variables - strongly agree.Source: Eurobarometer #44.2, November 1995 – January 1996

37
Table 8. Job Security Ordered Logit Equations (Source: ISSP 1989) – t-statistics in parentheses(1) (2) (3) (4)
UK -.7550 (8.09) -.8053 (8.52) -.8269 (8.67) -.7763 (7.54)USA -.1419 (1.60) -.2418 (2.61) -.2662 (2.54) n/aAustria .7709 (8.45) .8088 (8.76) .7845 (8.39) .8273 (8.52)Hungary -.3844 (4.04) -.3542 (3.67) -.3795 (3.90) -.8043 (7.51)Netherlands -.2466 (2.62) -.2835 (2.90) -.2856 (2.89) -.2571 (2.47)Italy .0931 (0.91) .0985 (0.96) .4773 (4.02) .3319 (2.72)Eire -.4414 (4.27) -.3955 (3.78) -.4501 (4.23) -.4155 (3.78)Norway -.2829 (3.32) -.2712 (3.12) -.3414 (3.87) -.3169 (3.40)Israel -.4633 (4.82) -.5344 (5.41) n/a n/aAge .0119 (6.57) .0115 (6.20) .0126 (5.95) .0105 (4.50)Male -.0600 (1.34) -.1192 (2.59) -.1761 (3.49) -.0817 (1.48)Years schooling .0289 (3.63) .0357 (3.97) .0161 (1.62)Supervisor .3067 (6.09) .2368 (4.27) .2462 (4.01)Union member .2697 (5.24) .0857 (1.52)Public sector .7583 (12.05)Cut_1 -3.201 -2.849 -2.764 -2.846Cut_2 -1.650 -1.288 -1.164 -1.264Cut_3 -0.712 -.348 -.225 -.308Cut_4 1.083 1.464 1.640 1.607LR Chi2 356.8 412.7 441.2 550.3Pseudo R2 .0187 .0221 .0283 .0413N 7026 6896 5814 4983Question: “How much do you agree or disagree that your job is secure?” (Choices are strongly agree, agree, neither, disagree, stronglydisagree)
Agree Strongly agree N Agree Strongly agree NUK 47 39 593 Italy 28 43 578USA 43 19 955 Eire 47 23 473Austria 48 28 781 Norway 33 33 1011Hungary 34 53 808 Israel 33 29 639

38
Netherlands 53 19 563 All 41 31 7028

39
Table 9. Job Satisfaction Ordered Logit Equations, 1995-1996(1) (2) (3)
Denmark .2609 (2.89) .1646 (1.72) .1704 (1.78)W. Germany -.3900 (4.39) -.4209 (4.50) -.4335 (4.63)Greece -1.8920 (20.89) -1.8071 (18.84) -1.8414 (19.13)Italy -.9303 (10.46) -1.0000 (10.56) -1.0033 (10.55)Spain -.9311 (10.34) -.9481 (9.96) -.9575 (10.03)France -.9577 (10.75) -.8645 (9.18) -.8613 (9.12)Ireland .4793 (5.26) .38380 (3.90) .3857 (3.92)Luxembourg -.3218 (2.96) -.4457 (3.88) -.4484 (3.90)Netherlands .0112 (0.13) -.0815 (0.87) -.0471 (0.50)Portugal -.9621 (10.60) -.8876 (9.25) -.8971 (9.33)UK -.3042 (3.40) -.3561 (3.73) -.3149 (3.28)E. Germany -.3456 (3.91) -.0898 (0.95) -.1178 (1.24)Finland -.4358 (4.97) -.3590 (3.84) -.3478 (3.71)Sweden -.2217 (2.52) -.1440 (1.54) -.1296 (1.39)Austria -.0700 (0.79) -.0830 (0.87) -.0808 (0.85)Age -.0223 (2.59) -.0310 (3.42) -.0281 (3.08)Age2 .0002 (2.63) .0003 (3.50) .0003 (3.17)Male -.0665 (1.87) -.0707 (1.91) -.0629 (1.69)Self-employed .3724 (7.76) .3686 (6.85) .3138 (5.09)16-19 years schooling .0701 (1.56) .0547 (1.16) .0559 (1.19)>=20 years schooling .1193 (2.28) .1134 (2.08) .1224 (2.24)Supervisor .3372 (8.87) .2943 (7.40) .2880 (7.06)Public sector .0700 (1.56) .0518 (1.11) .1066 (2.23)Job tenure .0004 (2.63) .0000 (0.08) .0001 (0.52)Commuting time -.0025 (5.08) -.0023 (4.53)Agree secure job 1.0590 (24.68) 1.0639 (24.72)Secure job DK .4317 (6.31) .4322 (6.31)
Industry dummies 10 10 10Occupation dummies . 10 10 10Size of establishment dummies - - 6
Cut_1 -3.4875 -4.0215 -3.953Cut_2 -1.8335 -2.3192 -2.2498Cut_3 .9234 .5652 .6396Likelihood ratio -15471.3 -14250.9 -14232.5LR Chi2 1815.8 2328.0 2364.9Pseudo R2 .0554 .0755 .0757N 15727 14772 14772

40
Notes: excluded categories, Belgium, <16 years schooling. Source: Eurobarometer 44.3OVR,February-April 1996

41
Table 10. Further Job Satisfaction Ordered Logit Equations, 1995-1996
All Males FemalesDenmark .2082 (2.04) .0580 (0.43) .3941 (2.47)W. Germany -.4845 (4.83) -.6423 (4.90) -.2725 (1.71)Greece -1.4849 (14.11) -1.3942 (10.35) -1.6598 (9.62)Italy -.9707 (9.68) -.9426 (7.31) -.9598 (5.89)Spain -.9239 (9.26) -.8643 (6.83) -1.0504 (6.31)France -.7457 (7.53) -.6639 (5.00) -.7629 (4.99)Ireland .3639 (3.48) .4361 (3.22) .3241 (1.91)Luxembourg -.4446 (3.71) -.3708 (2.42) -.5379 (2.74)Netherlands -.0801 (0.81) -.3233 (2.55) .3282 (2.05)Portugal -.8311 (8.19) -.6439 (4.78) -1.0151 (6.41)GB -.3048 (2.95) -.3885 (2.83) -.1855 (1.14)E. Germany -.1502 (1.48) -.0858 (0.63) -.2258 (1.43)Finland -.2519 (2.49) -.4074 (3.00) -.0604 (0.38)Sweden -.0558 (0.55) .0345 (0.26) -.1729 (1.09)Austria -.0540 (0.54) -.0684 (0.52) -.0112 (0.07)Age -.0237 (2.54) -.0179 (1.45) -.0378 (2.57)Age2 .0002 (2.21) .0001 (0.96) .0004 (2.51)Male -.0463 (1.14) n/a n/aSelf-employed .3426 (4.87) .3837 (4.01) .3619 (3.18)16-19 years schooling -.0021 (0.04) .0125 (0.20) -.0834 (1.06)>=20 years schooling -.0385 (0.67) -.0355 (0.47) -.0911 (0.99)Supervisor .2550 (5.94) .3051 (5.57) .1795 (2.50)Public sector .1019 (2.05) -.0002 (0.00) .1907 (2.53)Job tenure .0003 (1.69) .0004 (1.92) .0002 (0.68)Commuting time -.0018 (3.55) -.0013 (2.05) -.0027 (3.19)Agree secure job .9183 (20.87) .9658 (16.26) .8547 (12.81)Secure job DK .3449 (4.91) .3613 (3.81) .3222 (3.04)No vibrations from hand tools -.0643 (1.33) -.053 (0.84) -.0772 (1.00)No noise .1369 (3.12) .0905 (1.48) .2293 (3.55)No high temperatures .0483 (1.10) .0784 (1.35) .0327 (0.47)No low temperatures .0582 (1.32) -.0371 (0.63) .1798 (2.63)No vapors or fumes .1560 (3.26) .2562 (4.10) .0191 (0.25)No dangerous substances -.0523 (1.06) -.0379 (0.61) -.0714 (0.86)No radiation -.0158 (0.29) .0159 (0.24) -.0860 (0.86)No painful or tiring positions .2193 (5.16) .2309 (3.99) .2037 (3.18)No carrying or moving loads .1592 (3.67) .1821 (3.01) .1697 (2.64)No repetitive arm movements. .0377 (0.89) .0272 (0.48) .0237 (0.37)No protective clothing -.1485 (3.33) -.1604 (2.81) -.1106 (1.50)No computers .0233 (0.54) -.0540 (0.93) .0971 (1.44)No work at high speed .1101 (2.40) .0967 (1.57) .1346 (1.90)

42
No tight deadlines .1713 (3.83) .1947 (3.20) .1106 (1.64)No dealing with people -.1476 (3.00) -.1059 (1.67) -.2035 (2.52)Not working at home -.1143 (2.69) -.0817 (1.42) -.2109 (3.22)No night work .0028 (0.05) .0006 (0.01) .0913 (1.05)No Saturdays -.0681 (1.38) -.1346 (2.12) .0359 (0.44)No Sundays .0846 (1.96) .1232 (2.18) .0544 (0.79)Work pace depends colleagues* -.0038 (0.10) .0303 (0.61) -.0622 (1.06)Work pace depends customers* -.0295 (0.70) -.0237 (0.43) .0771 (1.13)Work pace depends prodn. norms* -.1330 (3.25) -.0823 (1.58) -.2158 (3.16)Work pace depends on machine* -.0398 (0.83) .0297 (0.49) -.1639 (2.03)Work pace depends on boss* -.1562 (3.93) -.1485 (2.79) -.1649 (2.70)Equal opportunities at work .2228 (6.16) .1058 (2.15) .4404 (7.96)Boss a man .0705 (1.58) .1225 (1.64) .0513 (0.89)Health and safety a risk* .7246 (17.09) -.6837 (12.59) -.8296 (11.99)Can control temperature .1159 (2.68) .1209 (2.07) .1324 (2.03)Can control lighting .0305 (0.69) .0498 (0.84) .0164 (0.24)Can control ventilation .1217 (2.76) .1321 (2.22) .1048 (1.56)Can control position of desk .0638 (1.41) .0201 (0.32) .1299 (1.93)Can control position of seat .0500 (1.09) -.0212 (0.33) -.0501 (0.73)Can control equipment used .1689 (4.50) .1766 (3.56) .1720 (2.93)
Occupation dummies 10 10 10Industry dummies 10 10 10Size of establishment dummies 6 6 6
Cut_1 -3.8530 -3.9457 -3.6102Cut_2 -2.0830 -2.1414 -1.8544Cut_3 .9720 .9516 1.2252
Likelihood ratio -13472.18 -7708.3 -5658.9LR Chi2 3313.4 1894.4 1613.3Pseudo R2 .1095 .1094 .1248N 14505 8317 6189
Notes: excluded categories, Belgium, <16 years schooling*= a variable also included where the respondent reported they did not know the answer to thisquestion.Source: Eurobarometer 44.3OVR, February-April 1996

43
Table 11. Job Satisfaction Ordered Logit Equations, 1996 (workers only)
All Males FemalesDenmark .3596 (2.81) .4704 (2.79) .2759 (1.37)West Germany .1263 (0.98) .4070 (2.46) -.2603 (1.24)Greece -.7480 (5.71) -.7907 (4.78) -.4965 (2.24)Italy -.6208 (4.92) -.4193 (2.59) -.9231 (4.49)Spain -.2481 (1.86) -.2573 (1.51) -.2010 (0.92)France -.3527 (2.92) -.2747 (1.75) -.3961 (2.02)Eire -.2361 (1.73) -.2079 (1.20) -.2729 (1.18)N. Ireland -.1970 (1.00) -.3744 (1.45) .1707 (0.55)Luxembourg -.2159 (1.45) -.1819 (0.94) -.1821 (0.76)Netherlands .4909 (3.76) .4859 (2.83) .5350 (2.60)Portugal -.3756 (2.87) -.3517 (2.01) -.3883 (1.93)Great Britain .0212 (0.16) -.1640 (0.98) .2721 (1.37)East Germany .2987 (2.21) .3577 (2.00) .3035 (1.42)Finland .3261 (2.37) .2698 (1.50) .4585 (2.10)Sweden .0892 (0.72) .0836 (0.51) .1005 (0.52)Austria .3386 (2.61) .3831 (2.27) .3611 (1.74)Age -.0208 (1.64) -.0397 (2.38) .0088 (0.44)Age squared .0003 (2.12) .0005 (2.67) -.0000 (0.08)Male -.2076 (4.22) n/a n/aSecure job – quite true .7863 (6.19) .9382 (5.73) .5251 (2.58)Secure job – a little true .2250 (1.81) .3480 (2.17) .0201 (0.10)Secure job – not at all true -.2414 (1.88) -.1548 (0.93) -.4399 (2.13)Secure job – DK -.6279 (4.71) -.6449 (3.74) -.6810 (3.19)Job security increase last 5yrs .2564 (4.42) .2122 (2.81) .3014 (3.26)Job security decrease last 5yrs -.2845 (4.91) -.3109 (4.12) -.2637 (2.86)Job security DK if changed last 5yrs -.0041 (0.03) -.1276 (0.84) .1163 (0.70)Financial situation very difficult -.6669 (7.13) -.6005 (4.72) -.7569 (5.36)Financial situation quite difficult -.3679 (6.24) -.3599 (4.60) -.4177 (4.57)Financial situation quite easy .2555 (4.39) .3041 (3.99) .1729 (1.88)Financial situation very easy .5911 (6.52) .7533 (6.32) .3570 (2.53)Ever unemployed last 5 yrs -.1632 (2.53) -.1981 (2.29) -.1274 (1.29)Private sector .0579 (0.99) .1423 (1.81) -.0758 (0.85)Job tenure months -.0020 (0.61) .0003 (0.07) -.0057 (1.07)Union member -.1464 (2.64) -.1510 (2.13) -.1471 (1.62)Age left school -.0121 (1.89) -.0059 (0.69) -.0244 (2.44)Self-employed .2958 (1.63) .3144 (1.40) .3713 (1.19)
Occupation dummies 13 13 13Industry dummies 11 11 11Establishment size dummies 7 7 7

44
cut1 -4.6980 -4.6554 -4.3278cut2 -3.5371 -3.4957 -3.1531cut3 -2.5714 -2.5390 -2.1615cut4 -1.3526 -1.2807 -.9765cut5 .0608 .1468 .4537cut6 1.7160 1.8851 2.0420
Log likelihood ratio -10701.6 -6222.8 -4421.1Chi square 1510.1 1016.4 595.5Pseudo R2 .0659 .0755 .0631N 6921 4049 2872
Notes: excluded categories Belgium; secure job – very true; job security no change last 5yrs:financial situation neither easy nor difficult.
Source: Eurobarometer 44.3OVR, February-April 1996.

45
Table 12. Mental well-being -- % saying ‘not at all’ – workers only
Q. Would you say that you have not at all, no more than usual, rather more than usual, much more than usual?a) …lost much sleep over worry, b)…been feeling unhappy and depressed, c)…been losing confidence in yourself, d)…beenfeeling you could not overcome your difficulties, e)…been feeling constantly under strain, f)…been thinking of yourself as a worthlessperson?
Not lost much Not uhappy & Not losing Can overcome Not worthless Not constantly Stress Level sleep depressed confidence difficulties person under strain (semi-GHQ score)
Belgium 43% 56 62 57 67 42 .57Denmark 63 59 78 70 82 50 .51West Germany 52 48 70 60 77 40 .47Greece 38 46 77 53 90 42 .91Italy 34 38 62 43 77 31 1.35Spain 38 49 64 51 79 49 .89France 42 50 60 48 74 38 .99Eire 53 61 71 66 78 57 .33N. Ireland 50 56 71 67 77 50 .74Luxembourg 49 56 69 61 75 45 .65Netherlands 52 59 72 69 83 51 .61Portugal 39 50 71 60 76 47 .75Great Britain 55 53 68 65 81 47 .71East Germany 41 46 75 55 76 35 .64Finland 45 35 61 53 65 30 .82Sweden 61 58 79 67 83 49 .46Austria 47 50 66 60 70 52 .82European 15 46 49 67 56 78 42 .81N 7857 7853 7841 7835 7833 7847 7749
Notes: Semi-GHQ score calculated as the sum of each component where 0= not at all or no more than usual and 1 if rather morethan usual or much more than usual. The normal GHQ score is based on 12 questions not 6; hence we use the term semi-GHQ. Thesemi-GHQ score in the final column must lie between zero (not stressed on any of the six questions) and 6 (stressed on all six).

46
Source: Eurobarometer 44.3OVR, February-April 1996

47
Table 13. Ordered Logit Mental Well-being Equations, 1996 (workers only)
Constantly Lose sleep Unhappy & Losing Not overcome under strain over worry depressed confidence difficulties
Age .0036 (1.37) .0167 (6.27) .0127 (4.75) .0073 (2.40) .0071 (2.49)Age left school .0216 (3.20) .0020 (0.29) .0042 (0.61) .0071 (0.89) .0117 (1.61)Male -.2513 (4.69) -.2794 (5.19) -.3802 (6.95) -.2523 (4.07) -.3699 (6.43)Ever unemployed last 5 yrs -.1549 (2.30) -.0910 (1.34) -.1296 (1.89) -.1893 (2.46) -.3047 (4.29)Private sector -.0300 (0.48) -.0776 (1.26) -.1165 (1.86) -.0148 (0.21) -.1497 (2.28)Financial situation very difficult -.5245 (5.24) -.5338 (5.33) -.5463 (5.41) -.3654 (3.41) -.7212 (7.06)Financial situation quite difficult -1.0288 (10.62) -.9976 (10.25) -.9876 (10.09) -.7823 (7.50) -1.2393 (12.43)Financial situation quite easy - 1.2099 (11.58) -1.2484 (11.82) -1.2555 (11.80) -1.0379 (9.04) -1.582 (14.44)Financial situation very easy -1.3380 (10.34) -1.4103 (10.60) -1.5012 (11.17) -1.2162 (7.98) -1.7853 (12.52)Job tenure months .0026 (0.76) -.0050 (1.47) -.0005 (0.15) .0033 (0.83) .0052 (1.41)Hours .0221 (10.65) .0100 (4.86) .0076 (3.63) .0000 (0.00) .0069 (3.18)Self-employed .0498 (0.29) .0313 (0.18) .0120 (0.06) -.1219 (0.61) -.0564 (0.30)Denmark -.1969 (1.45) -.5785 (4.15) .069 (0.48) -.5685 (3.52) -.3410 (2.27)West Germany -.0400 (0.28) -.4704 (3.36) .1995 (1.39) -.3247 (2.03) -.1623 (1.07)Greece -.0417 (0.29) .3188 (2.25) .4575 (3.14) -.6751 (4.04) .0535 (0.36)Italy .6665 (4.91) .4904 (3.64) .842 (6.03) .1563 (1.03) .6477 (4.52)Spain -.3471 (2.44) .2719 (1.95) .2961 (2.02) -.0836 (0.53) .2670 (1.79)France .0954 (0.73) -.0353 (0.27) .0942 (0.68) -.0739 (0.51) .1723 (1.24)Eire -.5837 (3.97) -.3505 (2.42) -.1743 (1.14) -.2824 (1.72) -.4486 (2.83)N. Ireland -.3542 (1.58) -.2512 (1.12) -.0481 (0.20) -.3782 (1.47) -.4592 (1.85)Luxembourg .0486 (0.30) .0350 (0.21) .1880 (1.12) -.0805 (0.44) .0233 (0.13)Netherlands -.0745 (0.52) .0368 (0.26) .2264 (1.53) -.1666 (1.03) -.1061 (0.68)Portugal -.4036 (2.86) -.0336 (0.24) .1034 (0.70) -.5425 (3.35) -.4270 (2.80)Great Britain -.0791 (0.58) -.3741 (2.69) .1784 (1.25) -.2219 (1.44) -.3362 (2.26)East Germany -.0368 (0.26) -.2058 (1.45) .1263 (0.85) -.7247 (4.26) -.2258 (1.46)Finland .4388 (3.06) .0132 (0.09) .8184 (5.55) .1243 (0.77) .2423 (1.57)Sweden -.3434 (2.59) -.7842 (5.76) -.1329 (0.95) -.8215 (5.19) -.4553 (3.15)
48
Austria -.3922 (2.83) -.1086 (0.79) .2903 (2.03) .0332 (0.21) -.0312 (0.21)Job security decrease .3625 (4.83) .2798 (3.70) .2656 (3.47) .2304 (2.67) .3012 (3.74)Job security no change .0180 (0.29) -.0372 (0.59) .0389 (0.61) -.0186 (0.25) .0749 (1.11)Job security DK -.0583 (0.47) -.1410 (1.11) -.0244 (0.19) -.3121 (2.09) -.0336 (0.25)Secure job – quite true .1383 (2.33) .1679 (2.79) .1113 (1.82) .2972 (4.19) .1793 (2.76)Secure job – a little true .3292 (4.52) .2934 (4.00) .3219 (4.35) .4450 (5.26) .4726 (6.09)Secure job – not at all true .5031 (6.03) .4268 (5.05) .5560 (6.56) .7855 (8.42) .5494 (6.23)Secure job – DK .1186 (0.87) .0698 (0.51) -.0203 (0.14) .0078 (0.04) .3066 (2.13)
Cut_1 .49356 -.01829 .1470 .23007 -.27718Cut_2 2.3541 1.8013 1.97202 .0604 1.6484Cut_3 4.3236 3.6653 3.7819 3.8172 3.6973
Log likelihood ratio -7412.8 -7272.1 7018.9 -5315.5 -6161.4Chi square 783.7 748.9 684.2 541.8 831.4Pseudo R2 .0502 .0490 .0465 .0485 .0632N 6903 6907 6904 6893 6891
Notes: excluded categories Belgium; secure job – very true; Job security no change last 5yrs: financial situation neither easy nordifficult. All equations also include 13 occupation dummies, 11 industry dummies and 7 establishment size dummies.Source: Eurobarometer 44.3OVR, February-April 1996

49
Table 14. Mental Well-being Equations, 1996(workers only)
Worthless GHQ Work under Person Score great pressure
Ordered logit OLS ProbitAge .0106 (3.15) .0060 (3.41) -.0006 (0.91)Age left school .0044 (0.50) .0069 (1.51) .0058 (3.11)Male -.2171 (3.15) -.2385 (6.61) -.0190 (1.29)Ever unemployed last 5 yrs -.1438 (1.70) -.1322 (2.91) .0011 (0.06)Private sector -.1041 (1.33) -.0168 (0.40) .0344 (2.04)Financial situation very difficult -.3047 (2.63) -.6911 (10.15) -.0685 (2.53)Financial situation quite difficult - -.6574 (5.80) -1.0913 (16.68) -.1319 (5.06)Financial situation quite easy - -.8904 (7.09) -1.1080 (15.84) -.1606 (5.88)Financial situation very easy - -.9447 (5.72) -1.0778 (12.63) -.1655 (5.08)Job tenure months -.0023 (0.51) -.0024 (1.04) .0024 (2.57)Hours .0027 (1.02) .0075 (5.52) .0087 (14.99)Self-employed -.0141 (0.06) -.0403 (0.35) .0609 (1.26)Denmark -.6750 (4.01) -.0651 (0.71) .2589 (7.00)West Germany -.5545 (3.26) -.1474 (1.54) .1186 (3.02)Greece -1.4866 (7.34) .2045 (2.13) .0582 (1.47)Italy -.5337 (3.24) .6967 (7.55) .1356 (3.57)Spain -.7034 (4.03) .2343 (2.44) -.1071 (2.68)France -.5064 (3.28) .1943 (2.18) .0798 (2.16)Eire -.5616 (3.21) -.2732 (2.79) .1221 (3.00)N. Ireland -.5900 (2.15) .1361 (0.92) .3023 (5.19)Luxembourg -.3143 (1.62) .1205 (1.10) .0811 (1.80)Netherlands -.6556 (3.72) .1165 (1.23) .1506 (3.84)Portugal -.7828 (4.52) -.0528 (0.55) .0084 (0.21)Great Britain -.7583 (4.53) .0617 (0.66) .2871 (7.68)East Germany -.6779 (3.87) -.0991 (1.01) .0749 (1.86)Finland -.0199 (0.12) .1569 (1.58) .1397 (3.44)

50
Sweden -.9674 (5.81) -.2090 (2.33) .3948 (11.27)Austria -.0761 (0.47) .1456 (1.54) .0732 (1.87)Job security decrease .1547 (1.61) .2234 (4.41) .0717 (3.47)Job security no change -.0405 (0.50) -.0226 (0.55) -.0044 (0.27)Job security DK -.0687 (0.43) -.0794 (0.97) -.0498 (1.50)Secure job – quite true .2880 (3.63) -.0393 (0.99) .0336 (2.09)Secure job – a little true .4457 (4.72) .0591 (1.20) .0711 (3.51)Secure job – not at all true .5989 (5.73) .3591 (6.37) .0720 (3.12)Secure job – DK -.0197 (0.10) -.1556 (1.66) .0560 (1.45)
Cut_1/constant .98277 1.1425Cut_2 2.8386Cut_3 4.4813
Log likelihood ratio -4353.3 -4219.5Chi square 380.2 1043.9Pseudo R2 R2/ .0418 .1234 .1122F 14.42N 6892 6830 6792
Notes: excluded categories Belgium; secure job – very true; job security no change last 5yrs: financial situation neither easy nordifficult. All equations also include 13 occupation dummies, 11 industry dummies and 7 establishment size dummiesWhere probits are used the procedure is dprobit in STATA.Source: Eurobarometer 44.3OVR, February-April 1996
51
Table 15. Changes in Mental Well-being -- % ‘saying ‘significant increase or ‘no change’ – workers only
(Q22) I would like you to compare your current job with what you were doing five years ago (even if in the same job) Foreach of the following things say whether there has been a significant increase compared to five years ago, a significantdecrease or little or no change – a) the effort you put into your job, b) the responsibility involved in your job, c) the stress involvedin your job, d) the tightness of supervision over your job
Effort Responsibility Stress Tightness of supervision
Increase No change Increase No change Increase No change Increase NochangeBelgium 41% 55 40 56 35 58 21 70Denmark 45 46 50 45 45 45 12 74West Germany 56 39 50 45 49 44 23 64Greece 50 42 59 38 59 35 22 70Italy 47 48 54 40 51 42 24 67Spain 29 63 37 58 38 54 27 65France 52 41 50 43 44 48 29 60Eire 53 43 55 41 44 49 29 63N. Ireland 63 35 59 35 50 40 31 53Luxembourg 43 39 50 46 42 48 26 62Netherlands 50 41 61 34 43 46 22 50Portugal 35 55 46 49 42 52 23 70Great Britain 58 33 56 34 50 38 27 55East Germany 69 28 60 35 70 26 43 49Finland 58 35 57 37 47 46 28 61Sweden 53 42 55 40 47 44 22 64Austria 45 46 56 38 48 44 38 53European 15 50 43 51 43 48 44 26 62
N 7496 7509 7472 7171
52
Source: Eurobarometer 44.3OVR, February-April 1996

53
Table 16. Equations for Perceived Change in Stress Over the Last Five Years : Asked in 1996 (workers only)
Increased Increased Increased Increased Increased Stress Responsibility Effort Supervision AllProbit Probit Probit Probit [OLS]
Age -.0026 (3.61) -.0059 (8.17) -.0029 (4.03) -.0012 (2.00) -.0116 (6.23)Age left school .0013 (0.73) -.0000 (0.05) .0028 (1.52) -.0013 (0.82) .0019 (0.40)Male -.0409 (2.78) .0147 (1.00) -.0346 (2.35) .0340 (2.68) -.0139 (0.36)Ever unemployed last 5 yrs .0475 (2.57) .0347 (1.87) .0358 (1.94) .0237 (1.53) .1469 (3.07)Private sector -.0088 (0.52) .0036 (0.22) -.0029 (0.17) -.0083 (0.57) -.0238 (0.54)Financial situation very difficult -.0837 (3.01) -.0068 (0.25) -.0536 (1.93) -.0311 (1.36) -.1332 (1.79)Financial situation quite difficult -.1287 (4.84) -.0121 (0.46) -.0796 (3.00) -.0380 (1.72) -.2257 (12.11)Financial situation quite easy -.1516 (5.39) .0063 (0.22) -.0843 (2.98) -.0627 (2.72) -.2729 (0.52)Financial situation very easy -.1746 (5.20) -.0245 (0.70) -.1156 (3.39) -.0746 (2.69) -.3457 (3.02)Job tenure months .0031 (3.32) .0004 (0.48) .0014 (1.57) -.0012 (1.52) .0043 (1.79)Hours .0066 (11.55 .0047(8.24) .0064 (11.20) .0022 (4.50) .0179 (12.11)Self-employed -.0153 (0.32) -.0463 (0.96) .0112 (0.24) -.0284 (0.63) -.0642 (0.52)Denmark .1599 (4.32) .1307 (3.61) .0713 (1.94) -.0791 (2.50) .2868 (3.02)West Germany .1793 (4.68) .1221 (3.25) .1742 (4.65) .0351 (1.00) .5002 (5.04)Greece .2377 (6.22) .1903 (5.06) .0582 (1.50) .0169 (0.48) .4992 (4.98)Italy .2005 (5.38) .1752 (4.84) .0818 (2.19) .0647 (1.79) .5027 (5.03)Spain .0994 (2.50) .0054 (0.14) -.1020 (2.58) .1181 (3.16) .1051 (1.04)France .1290 (3.53) .1457 (4.13) .1453 (4.10) .1075 (3.13) .5101 (5.45)Eire .1466 (3.61) .1948 (5.05) .1552 (3.93) .1118 ( 2.92) .6056 (5.79)N. Ireland .1668 (2.72) .1992 (3.45) .2300 (3.96) .1265 ( 2.23) .7081 (4.42)Luxembourg .1130 (2.52) .1024 (2.31) .0478 (1.08) .0653 (1.56) .3245 (2.80)Netherlands .1528 (3.95) .2221 (6.08) .1364 (3.61) .0359 (1.02) .5269 (5.27)Portugal .0861 (2.18) .0790 (2.03) -.0570 (1.46) .0045 (0.13) .1180 (1.17)Great Britain .1994 (5.26) .2060 (5.69) .2114 (5.76) .0729 (2.05) .6761 (6.88)East Germany .3272 (8.74) .1872 (4.99) .2374 (6.26) .2133 (5.56) .9351 (9.21)Finland .1275 (3.16) .1943 (5.09) .1856 (4.76) .0939 (2.51) .5821 (5.62)
54
Sweden .1393 (3.79) .1843 (5.27) .1369 (3.83) .0430 (1.28) .4931 (5.25)Austria .1365 (3.55) .1444 (3.89) .0131 (0.35) .1804 (4.90) .4665 (4.75)Job security decrease .1111 (5.72) -.1607 (8.15) -.0069 (0.36) -.0318 (2.05) -.0821 (1.63)Job security no change -.1353 (8.31) -.2816 (17.01 -.1981 (12.18 -.1619 (11.67) -.7328 (17.24)Job security DK -.0445 (0.99) -.1870 (4.25) -.0515 (1.15) -.0430 (1.13) -.2164 (1.68)Fisherman .0166 (0.05) -.1222 (0.35) -.0594 (0.17) n/a -.3060 (0.40)Professional -.1128 (1.46) .0615 (0.80) -.0289 (0.38) .1107 (1.83) -.1655 (0.81)Owner of a shop -.1230 (1.84) -.0238 (0.36) -.0715 (1.09) .1259 (2.49) -.3490 (2.01)Business proprietor -.0818 (1.13) .0893 (1.27) .0301 (0.42) -.0456 (0.77) -.0189 (0.10)Employed professional -.1297 (1.53) .0583 (0.67) -.0065 (0.08) -.1210 (1.92) -.1987 (0.89)General management -.1874 (2.32) .1169 (1.42) .0201 (0.24) -.1258 (2.06) -.1638 (0.75)Middle management -.0973 (1.25) .0440 (0.57) .0247 (0.32) -.1117 (1.84) -.1166 (0.58)Employed at a desk -.1536 (2.00) -.0290 (0.37) -.0346 (0.45) -.1026 (1.66) -.2741 (1.37)Salesman -.1483 (1.89) -.0918 (1.15) -.0482 (0.61) -.0259 (0.39) -.2638 (1.28)Service employee -.1023 (1.31) -.0408 (0.52) -.0360 (0.47) -.0732 (1.15) -.2130 (1.06)Supervisor -.0539 (0.64) .1273 (1.56) .0091 (0.11) -.0478 (0.70) .0467 (0.21)Skilled manual -.1904 (2.53) -.1420 (1.85) -.0751 (1.00) -.0834 (1.34) -.4371 (2.21)Unskilled manual -.2467 (3.35) -.2376 (3.13) -.1511 (2.00) -.0890 (1.44) -.6579 (3.29)Mining and quarrying .1465 (1.27) .0461 (0.40) .1227 (1.07 ) .1369 (1.34) .3885 (1.32)Manufacturing .1179 (2.07) .0657 (1.21) .0690 (1.26 ) .0738 (1.45) .2930 (2.08)Electricity, gas & water .1405 (1.86) .0679 (0.92) .1627 (2.23 ) .1337 (1.91) .4159 (2.19)Construction .1417 (2.40) .0895 (1.58) .0931 (1.64 ) .0811 (1.51) .3553 (2.42)Wholesale & retail trade, repairs .1191 (2.12) .0245 (0.46) .0571 (1.07 ) .0569 (1.15) .2342 (1.69)Hotels & restaurants .0878 (1.37) .0027 (0.04) .0675 (1.09) -.0103 (0.19) .1398 (0.87)Transport & communications .1840 (3.02) .0238 (0.40) .0110 (0.19 ) .0496 (0.91) .2325 (1.52)Financial intermediation .2323 (3.67) .1541 (2.50) .1218 (1.95 ) .1007 (1.66) .5585 (3.41)Real estate & business activities .1803 (2.81) .0176 (0.28) .0613 (0.97 ) .0574 (0.97) .2687 (1.65)Public administration .1437 (2.49) .0504 (0.91) .0905 (1.63 ) .0715 (1.38) .2968 (2.07)Other services .1531 (2.74) .0715 (1.34) .1076 (2.02 ) .0417 (0.86) .3235 (2.35)1-10 workers .0698 (2.80) .0669 (2.71) .0703 (2.84) .0460 (1.97) .1904 (2.93)10-24 workers .1413 (4.93) .1100 (3.88) .1152 (4.03) .1029 (3.78) .3970 (5.34)

55
25-49 workers .1475 (4.75) .0968 (3.15) .0869 (2.81) .0783 (2.66) .3309 (4.10)50-99 workers .1561 (4.74) .0945 (2.90) .0651 (1.97) .1150 (3.61) .3459 (4.04)100-499 workers .1788 (5.73) .1036 (3.34) .0896 (2.87) .1301 (4.30) .4183 (5.14)>=500 workers .1032 (3.01) .0933 (2.76) .0792 (2.32) .1192 (3.63) .3177 (3.58)Size DK .0456 (0.72) -.0189 (0.30) -.0021 (0.03) .0331 (0.58) .0158 0.09)
Log likelihood ratio -4232.6 -4197.2 -4276.8 -3425.6Chi square/F-statistic 799.6 910.2 758.4 542.8 18.69Pseudo R2/R2 .0863 .0978 .0814 .0734 .1469N 6696 6727 6718 6456 6370
Notes: excluded categories Belgium; secure job – very true; job security no change last 5yrs: financial situation neither easy nordifficult; agriculture, farmer, work at home alone; farmer; agriculture, forestry and fishing, works at home alone.
The final column, Increased All, has as its dependent variable the number 1 to 4. If the individual reported increased strain on all fourcategories, he or she is assigned 4; if he or she reported increased strain on three categories, a 3 is assigned; and so on. The aim ofthe column is to give a simple way of judging the size of personal characteristics’ effects.
Source: Eurobarometer

56
Table 17. Probability of Reporting Strain (Dprobit equations)
1991 1991 1995-6 1995-6 1995-6 Stress Tiredness Stress Fatigue Sleep problems
Belgium -.0314 (1.81) -.0330 (3.01) -.0327 (1.61) -.0744 (4.98) -.0230 (2.32)Netherlands -.0586 (3.35) -.0230 (1.97) -.0587 (2.96) -.0978 (6.86) -.0087 (0.86)West Germany -.0056 (0.33) -.0573 (5.69) .0005 (0.02) -.0800 (5.45) .0019 (0.18)Italy -.0298 (1.63) -.0336 (2.92) .1862 (8.52) .0110 (0.68) -.0217 (2.20)Luxembourg .0981 (4.18) -.0533 (4.09) .1410 (5.34) -.0721 (3.90) -.0167 (1.34)Denmark -.0067 (0.37) -.0587 (5.74) .0200 (0.95) -.1069 (7.38) -.0082 (0.79)Ireland -.0485 (2.62) -.0558 (5.44) -.1204 (6.02) -.1166 (8.28) -.0377 (3.89)Great Britain .0864 (4.44) -.0149 (1.29) .0433 (2.06) -.0757 (5.18) .0387 (3.28)Greece .1168 (5.65) .1291 (8.27) .2651 (11.75) .2914 (14.34) .0399 (3.30)Spain -.0622 (3.46) -.0434 (4.00) .0006 (0.03) .0407 (2.39) -.0252 (2.52)Portugal -.0780 (4.28) -.0042 (0.35) .0674 (3.09) .0171 (1.02) .0018 (0.16)East Germany -.0296 (1.80) -.0788 (8.60) .0897 (4.25) -.0431 (2.83) .0176 (1.59)Age .0107 (5.62) .0008 (0.68) .0176 (8.53) .0048 (2.83) .0054 (4.83)Male* .0222 (2.82) .0089 (1.58) -.0102 (1.32) -.0306 (4.55) .0029 (0.72)Union* .0730 (8.22) .0283 (4.37) n/a n/aAge2 -.0001 (5.95) -.0000 (0.77) -.0002 (8.28) -.00005 (2.60) -.00006 (4.38)Fisherman .1614 (2.32) -.0031 (0.09)Professional -.0285 (0.95) -.0823 (7.30)Shop owner -.0030 (0.13) -.0856 (9.79)Employed professional .1144 (3.67) -.0689 (6.06)General management .0734 (2.52) -.0874 (8.57)Middle management .0516 (2.08) -.0953 (10.17)Other office employees -.0164 (0.71) -.1069 (12.28)Non-office non-manuals .0516 (2.13) -.0822 (8.75)Supervisors .0480 (1.45) -.0676 (5.16)Skilled manuals .0261 (1.15) -.0599 (5.82)Other manuals -.0311 (1.34) -.0651 (6.48)
Legislators and managers .0429 (1.87) -.0633 (3.84) -.0007 (0.06)

57
Professionals .0715 (3.05) -.0506 (2.97) .0163 (1.31)Technicians .0126 (0.57) -.0553 (3.35) .0186 (1.54)Clerks -.0517 (2.49) -.1119 (7.58) -.0223 (2.19)Service & sales workers -.0150 (0.71) -.0579 (3.62) .0033 (0.29)Craft & related trades -.0477 (2.34) -.0371 (2.32) -.0133 (1.29)Plant and machine operators .0115 (0.49) -.0033 (0.18) .0149 (1.17)Elementary occupations -.0924 (4.51) -.0434 (2.64) -.0079 (0.72)Armed forces -.0770 (1.76) -.0490 (1.42) -.0124 (0.54)
Age left school dummies 9 9 2 2 2
Log likelihood -6154.8 -3886.3 -9038.5 -7230.3 -3824.5N 12499 12499 15986 15986 15986Chi2 680.6 856.6 993.0 1358.7 278.1Pseudo R2 .0524 .0993 .0521 .0859 .0351
Source: Eurobarometer
Notes: 1991 QA7. In which ways does your work affect your healt.h – a) stressful b) overall tiredness, work that is too tiring?Excluded category France, farmer/agricultureMethod of estimation is dprobit.Source: Eurobarometers #35A (ICPSR 9696) Spring 1991 and #44.2, November 1995 – January 1996

58
Appendix
Table A1. Losing and Finding a Job over Time – United States 1977-1998 (%)
a) Thinking about the next 12 months, how likely do you think it is that you will lose your job or be laid-off?
Not at all Not too Fairly Very N likely likely likely likely
1977 66% 24 6 4 883 1978 71 21 4 4 876 1982 60 27 6 7 1016 1983 61 25 8 6 914 1985 65 23 5 6 927 1986 67 23 7 4 843 1988 66 25 4 4 607 1989 70 22 4 4 606 1990 67 25 6 3 588 1991 62 25 7 6 602 1993 61 27 8 4 668 1994 63 27 5 6 1279 1996 61 28 7 4 1338 1998 65 27 4 4 1232
All 64 25 6 5 12397
Source: General Social Survey

59
Table A1. Losing and Finding a Job over Time – United States 1977-1998 (%) (continued)
b) About how easy would it be for you to find a job with another employer with approximately the same income and fringe benefits you now have?
Not easy Somewhat Very Nat all easy easy
1977 42% 30 27 8781978 39 33 28 8651982 51 26 22 10091983 51 30 19 9081985 43 32 25 9171986 39 33 28 8471988 35 37 28 5981989 38 28 35 6001990 38 30 32 5891991 40 36 24 5961993 45 33 22 6651994 46 33 21 12671996 40 33 27 13311998 33 36 31 1221
All 42 32 26 12291
Source: General Social Surveys.

60
Table A2. Probability of a) Losing and b) Finding a Job in the USA, 1972-1996: ordered logits (Current workers only)
Losing a Job Finding a job(1) (2) (3) (4) (5) (6)
Age -.0089 (5.56) -.0085 (5.20) -.0075 (3.43) -.5975 (9.08) -.0268 (17.41) -.0278 (13.54)Male .0251 (0.64) -.0843 (1.96) -.0497 (0.87) -.1036 (2.87) .0429 (1.09) .0879 (1.70)Self-employed -.8079 (11.86) -.8650 (12.07) -.9076 (9.42) .5610 (10.13) .3701 (6.36) .2570 (3.38)Black .4577 (7.91) .5014 (8.24) .4958 (5.79) -.2428 (4.30) -.2421 (4.07) -.1837 (2.21)Other non-white .1529 (1.37) .1456 (1.27) .1407 (0.92) -.0056 (0.06) -.0589 (0.56) -.0685 (0.50)Time .0244 (6.83) .0274 (7.22) .0327 (6.27) -.0099 (3.10) -.0186 (5.46) -.0200 (4.34)Years of Schooling -.0656 (9.13) -.0500 (6.40) -.0527 (5.08) .0693 (10.53) .0618 (8.56) .0646 (6.80)Log state unemployment .5161 (7.21) .7064 (8.10) .7768 (6.55) -.5975 (9.08) -1.0182 (12.58) -1.0155 (9.34)Union .2550 (3.46) -.6222 (8.62)
Industry dummies (9) No Yes Yes No Yes YesState dummies (44) Yes Yes Yes Yes Yes Yes
Cut_1 .6832 .8692 1.1925 -1.7301 -2.8702 -2.7832Cut_2 2.2473 2.4527 2.7727 -.3095 -1.4008 -1.2670Cut_3 3.1030 3.3141 3.6608
Chi-Squared 448.9 639.3 424.5 669.81 1142.3 763.9Pseudo R2 .0214 .0305 .0350 .0284 .0484 .0551N 11058 11045 6471 10981 10967 6431
Notes: losing and finding a job variables not available in years 1972-1976, 1980, 1984 and 1987.Union status not available in 1972, 1974, 1977 & 1982.

61

62
References
Akerlof, George. A, Rose, Andrew K. and Yellen, Janet L. (1988). "Job Switching and JobSatisfaction in the US Labor Market", Brookings Papers on Economic Activity, 2, 495-582.
Argyle, Michael. (1987). The Psychology of Happiness, Routledge, London.
Birdi, Kamal, Warr, Peter and Oswald, Andrew J. (1995). "Age Differences in ThreeComponents of Employee Well-being", Applied Psychology, 44, 345-373.
Blanchflower, David G. (1991). “Fear, Unemployment and Pay Flexibility”, Economic Journal,101, 483-496.
Blanchflower, David G. and Freeman, Richard (1997). “The Attitudinal Legacy of CommunistLabor Relations”, Industrial and Labor Relations Review, 50, 4438-459.
Blanchflower, David G. and Oswald, Andrew J. (1999). “The Rising Well-Being of theYoung”, forthcoming in Youth Employment and Joblessness in Advanced Countries,edited by David G. Blanchflower and Richard Freeman, University of Chicago Pressand NBER.
Blanchflower, David G., Oswald, Andrew J. and Warr, Peter B. (1993). "Well-Being OverTime in Britain and the USA", London School of Economics, mimeo.
Borjas, George (1979). “Job Satisfaction, Wages and Unions”, Journal of Human Resources,14, 21-40.
Burgess, Simon and Rees, Hedley (1996). “Job Tenure in Britain: 1975-92”, Economic Journal,106, 334-44.
Campbell, A. (1981). The Sense of Well-Being in America, McGraw Hill, New York.
Cappelli, Peter and Sherer, P.D. (1988). “Satisfaction, Market Wages and Labor Relations: AnAirline Study”, Industrial Relations, 27, 56-73.
Clark, Andrew E. (1996). “Job Satisfaction in Britain”, British Journal of Industrial Relations,34, 189-217.
Clark, Andrew E. (1998). “What Makes a Good Job? Evidence from OECD Countries”,discussion paper, December, LEO-CRESEP, University of Orleans, France.
Clark, Andrew E. and Oswald, Andrew J. (1994). "Unhappiness and Unemployment",Economic Journal, 104, 648-659.
Clark, Andrew E. and Oswald, Andrew J. (1996). "Satisfaction and Comparison Income",Journal of Public Economics, 61, 359-381.
Clark, Andrew E., Oswald, Andrew J. and Warr, Peter B. (1995). "Is Job Satisfaction U-Shaped in Age?", Journal of Occupational and Organizational Psychology, 69, 57-81.

63
Curtice, John (1993). “Satisfying Work – If You Can Get It”, in Roger Jowell, Lindsay Brooksand Lizanne Dowds eds, International Social Attitudes: The 10th BSA Report,Dartmouth, Aldershot.
Diener, Edward (1984). "Subjective Well-Being", Psychological Bulletin, 93, 542-575.
Diener, Edward, Suh Eunkook M, Lucas Richard E., and Smith Heidi L. (1999). "SubjectiveWell-Being: Three Decades of Progress", Psychological Bulletin, forthcoming.
Easterlin, Richard (1974). "Does Economic Growth Improve the Human Lot? Some EmpiricalEvidence". In Nations and Households in Economic Growth: Essays in Honour ofMoses Abramovitz, (ed. P. A. David and M. W. Reder). New York and London:Academic Press.
Farber, Henry S. (1990). “The Decline of Unionization in the United States: What Can beLearned from Recent Experience?”, Journal of Labor Economics, 8, S75-105.
Farber, Henry S. (1997). “The Changing Face of Job Loss in the United States, 1981-95”,Brookings Papers on Economic Activity, Special Issue Sl, 55-142.
Flanagan, Robert J., Strauss, G. and Ulman, Lloyd (1974). “Worker Discontent andWorkplace Behavior”, Industrial Relations, 13, 101-123.
Frank, Robert H. (1985). Choosing the Right Pond, Oxford University Press, New York andOxford.
Freeman, Richard B. (1978). “Job Satisfaction as an Economic Variable”, American EconomicReview, 68, 135-141.
Frey, Bruno S. and Stutzer, Alois (1999). “Happiness, Economy and Institutions”, mimeo,University of Zurich.
Gardner, Jonathan and Oswald, Andrew J. (1999). “Declining Psychological Health AmongBritain’s Public Sector Workers”, mimeo, University of Warwick.
Goldberg, D.P. (1972). The Detection of Psychiatric Illness by Questionnaire, Oxford, OxfordUniversity Press.
Gregg, Paul and Wadsworth, Jonathan (1995). “A Short History of Labour Turnover, JobTenure, and Job Security: 1975-93”, Oxford Review of Economic Policy, 11, 1, 73-90.
Hamermesh, Daniel S. (1977). “Economic Aspects of Job Satisfaction”, in Orley Ashenfelterand Wallace Oates eds, Essays in Labor Market and Population Analysis, Wiley, NewYork.
Hamermesh, Daniel S. (1998). “The Changing Distribution of Job Satisfaction”, University ofTexas at Austin, mimeo.
Inglehart, Ronald (1990). Culture Shift in Advanced Industrial Society, Princeton UniversityPress, Princeton.

64
Jackson, A. and Kumar, P. (1998). “Measuring and Monitoring the Quality of Jobs and theWork Environment in Canada”, mimeo, Queen’s University.
Judge, T.A. and Watanabe, S. (1993). “Another Look at the Job Satisfaction - Life SatisfactionRelationship”, Journal of Applied Psychology, 78, 939-948.
Kahneman, Daniel, Wakker, Peter P. and Sarin, Rakesh (1997). "Back to Bentham?Explorations of Experienced Utility", Quarterly Journal of Economics, 112, 375-406.
Levy-Garboua, L. and Montmarquette, C. (1997). “Reported Job Satisfaction: What Does itMean?”, LAMIA, University of Paris I, discussion paper 1997-1.
Ng, Yew-Kwang (1996). "Happiness Surveys: Some Comparability Issues and an ExploratorySurvey Based on Just Perceivable Increments", Social Indicators Research, 38, 1-27
Ng, Yew-Kwang. (1997). "A Case for Happiness, Cardinalism, and InterpersonalComparability", Economic Journal, 107, 1848-1858.
OECD (1997). “Is Job Insecurity on the Rise in OECD Countries?”, OECD EmploymentOutlook.
Oswald, Andrew J. (1997). "Happiness and Economic Performance", Economic Journal, 107,1815-1831 .
Pavot, William (1991) "Further Validation of the Satisfaction with Life Scale: Evidence for theCross-Method Convergence of Well-Being Measures", Journal of PersonalityAssessment, 57, 149-161.
Spector, Paul E. (1997). Job Satisfaction: Application, Assessment, Causes, andConsequences, Thousand Oaks, CA, Sage.
Spector, Paul E. and twenty nine co-authors (1999). “A Twenty-Two Nation Study of WorkLocus of Control, Well-being, and Individualism: How Generalisable are WesternWork Findings?”, mimeo, University of South Florida.
Sui, O. and Cooper, Cary L. (1998). “A Study of Occupational Stress, Job Satisfaction andQuitting Intentions in Hong Kong Firms: The Role of Locus of Control andOrganizational Commitment”, Stress Medicine, 14, 55-66.
Turnbull, Peter and Wass, Victoria (1999). “Redundancy and the Paradox of Job Insecurity”,mimeo, Cardiff Business School.
Van de Stadt, H., Kapteyn, Ari, and Van de Geer, S. (1985). “The Relativity of Utility:Evidence from Panel Data”, Review of Economics and Statistics, 67, 179-87.
Veenhoven, R. (1991). “Is Happiness Relative?”, Social Indicators Research, 24, 1-34.
Warr, Peter B. (1987). Work, Unemployment and Mental Health, Oxford University Press,Oxford.
Warr, Peter, B. (1997). “Age, Work and Mental Health”, in K.W. Schale and C. Schoolereds, The Impact of Work on Older Adults, Springer, New York.

65
Worrall, Les and Cooper, Cary L. (1998). The Quality of Working Life, Institute ofManagement, London.

66