Embed Size (px)
Citation preview

1 Welsh Cancer Intelligence and Surveillance Unit, Public Health Wales

2 Welsh Cancer Intelligence and Surveillance Unit, Public Health Wales
Project team
Dr Dyfed Wyn Huws, Dr Ceri White, Rebecca Thomas, Tamsin Long, Ciarán Slyne, Julie
Howe, Helen Crowther
Acknowledgements
A special thanks to all the Welsh Cancer Intelligence and Surveillance Unit’s staff,
especially the registration team without whom the data used within this report would not
be produced.
Thanks to the following people for their help with this publication: Huw Brunt, Hugo
Cosh, Dr Ciarán Humphreys, Isabel Puscas, Joy McRae, David Rees, and Janet Warlow
Publication Details
Title: Lung Cancer in Wales, A detailed analysis of population trends of incidence and
stage of diagnosis up to and including 2012
Date: 6 January 2015
ISBN: 978-0-9928835-6-0
Contact:
Welsh Cancer Intelligence and Surveillance Unit
16 Cathedral Road
Cardiff CF11 9LJ
Email: [email protected]
Website: www.wcisu.wales.nhs.uk
© 2014 Public Health Wales NHS Trust
Material contained in this document may be reproduced without prior permission provided it is done so accurately and is not used in a misleading context.
Acknowledgement to Public Health Wales NHS Trust to be stated. Copyright in the typographical arrangement, design and layout belongs to
Public Health Wales NHS Trust.
Definitions Age-standardised rates and EASR
Age-standardisation adjusts rates to take into account how many old or young people are in
the population being looked at. When rates are age-standardised, you know that differences
in the rates over time or between geographical areas do not simply reflect variations or
changes in the age structure of the populations. This is important when looking at cancer
rates because cancer mainly affects older people. Throughout this report we use European
Age Standardised Rates (EASR) using the 2013 European Standard Population (ESP) unless
otherwise specified.
Statistical significance
If a difference between rates or survival between populations is statistically significant, it
means that that difference is unlikely to have occurred due to chance alone, and that we can
be more confident that we are observing a ‘true’ difference. In this report we use the
conventional arbitrary cut-off of less than a 5% chance to mean statistically significant. Just
because a difference is statistically significant doesn’t necessarily mean that it is large or
important - that can depend on our judgement and other things.

3 Welsh Cancer Intelligence and Surveillance Unit, Public Health Wales
Contents
Summary .................................................................................................. 4
Key findings .............................................................................................. 5
1 Lung cancer incidence in Wales and the world ............................................. 9
2 What’s behind the lung cancer incidence trends in Wales? .......................... 18
3 Lung cancer incidence deprivation gap wider than most common cancers ..... 27
4 Explaining geographic inequalities in lung cancer incidence ......................... 35
5 Stage at diagnosis ................................................................................. 36
References .............................................................................................. 44

4 Welsh Cancer Intelligence and Surveillance Unit, Public Health Wales
Summary Lung cancer is one of the four most common cancers in Wales and the most
common cancer worldwide. It is the commonest cancer leading to death in the European Union.
Smoking causes most cases, so it is largely preventable through effective tobacco control and by addressing other modifiable risk factors.
The annual number of cases and the incidence rate is increasing in women in
Wales, especially amongst older women. The annual number in women is now approaching that in men. The rate for women in Wales is among the highest in
Europe, but Scotland’s is the highest of UK countries. Meanwhile, the number of cases is staying roughly the same while the rate is slowly decreasing in Wales’ men.
We estimate that in smokers and non-smokers in Wales, around 36 new cases of lung cancer are diagnosed each week as a result of tobacco smoke’s effects, and
nine per week due to other factors such as naturally-occurring radioactive radon gas, asbestos exposure and transport air pollution. Smoking greatly increases the risk from asbestos and radon.
Lung cancer has the strongest link to deprivation of all the commonest cancers, mainly due to the link with smoking and past industries. The gap in incidence
rate between the most deprived and least deprived areas of Wales has increased dramatically over a ten year period.
The local authority population with the highest rate is Merthyr Tydfil which is 87 per cent higher than the lowest, Monmouthshire. The differences between areas are wider for women than men.
Most people present to their doctor with a late stage of disease or are diagnosed at death, but 12 per cent present in stage 1 when the disease is potentially
curable by surgery and radiotherapy. These figures vary between health board populations (we do not refer to hospitals as patients can be diagnosed or treated outside of their health board area). Cwm Taf is the most favourable with 15 per
cent presenting at stage 1, with proportions even higher for women, but lower for men. Stage distribution is less favourable in the Hywel Dda population, and
particularly so in Abertawe Bro Morgannwg, especially for men.
Lung cancer is preventable in the population. Smoking rates have come down in Wales, and asbestos exposure is now regulated. But to stop lung cancer being a
major public health problem in the future, further effective tobacco control is still needed to bring our rates down to the levels of Sweden or Australia, for
example. We also need to look at the other risks such as transport air pollution and radon. Finally, we also need to see more people diagnosed at an earlier stage when they could be potentially treated with surgery or radiotherapy.

5 Welsh Cancer Intelligence and Surveillance Unit, Public Health Wales
Key findings
Lung cancer incidence in Wales and the world
Compared with the rest of Europe
Lung cancer is the most common cancer worldwide and is the commonest cancer leading to death in the EU
Estimates of the lifetime risk of developing lung cancer in the UK are 1 in 14 for men and 1 in 18 for women
Smoking causes most cases, so it is largely preventable through effective
tobacco control and by addressing other modifiable risk factors
Women’s lung cancer incidence rate in Wales is the third-highest of 40
European countries, the rate in men is higher than 11 of those 40 countries
Compared with the rest of the UK
Incidence rates for men and women in Wales were higher than England’s
from 2003 up until 2012, when Wales’ men had a lower rate than in England, but in women the rate remained higher in Wales
Scotland’s incidence rates are much higher than all UK countries - by 2012
Scotland’s women had the same rate as Wales’ men
Trends in Wales from 2003 to 2012
Lung cancer is one of the four most common cancers in Wales in terms of the
annual numbers of cases - it was the third most common cancer in men, and
the second most common in women in 2012
Over the ten years, annual numbers remained similar in men, but in women
they increased by over a third to almost the same as men - overall numbers increased by ten per cent
Men’s age-adjusted incidence rate was a third higher than in women in 2012,
following a decline for men and a steep increase for women – ten years previously the rate in men was double that in women
Around two-thirds of cases occurred in ages 60 to 79 years, just over ten per cent were in under 60s, but a quarter occurred in ages 80+ years
For 2012, age-specific rates in men keep increasing with age and rise steeply
after age 60, but for women the rate rises steadily to a peak at 75-79 years, then declines

6 Welsh Cancer Intelligence and Surveillance Unit, Public Health Wales
Over the ten years, women’s incidence rates increased in those older than 55 years, with steep increases of 36 per cent in women aged 85 and over, while
rates in younger age groups declined
Incidence rates in the oldest men aged 80+ changed little, but decreased in
most younger age groups – the steepest absolute declines were in men aged 75-79 and 60-64 years
Small cell lung cancer is much less common than non-small cell lung cancer,
with only a very small difference in rates between men and women by 2012
What’s behind the lung cancer incidence trends in Wales?
By far the main factor causing lung cancer in the population of Wales is
smoking tobacco, but some other important factors include
Environmental tobacco smoke or ‘passive smoking’
Naturally occurring radioactive radon gas Asbestos
Particulate matter air pollution and occupational exposure Silicosis from occupational silica dust such as coal mining and quarrying
Today’s lung cancer incidence reflects smoking patterns in the 1970s, 80s and early 90s – men’s cigarette smoking peaked in the 1940s, but women’s
peaked in the late 1980s, when the gap between men and women was getting smaller
A broad estimate of about 1,900 new cases of lung cancer per year in Wales – that’s about 36 cases each week - can be linked to tobacco smoke’s effects
in smokers and non-smokers in the population A broad estimate of about 470 new cases of lung cancer per year in Wales –
that’s nine cases each week - can be linked to factors other than tobacco smoke in the population
Lung cancer risk from asbestos is quite high, but only people from certain
occupations were exposed, along with their spouses or partners at home –
smoking greatly increases the lung cancer risk from asbestos
Lung cancer risk from radon is modest but increases with increasing radon exposure in homes and workplaces – but its risk is greatly increased in
smokers, and many people may be exposed to both Lung cancer risk from outdoor particulate air pollution is modest but
increases with increasing pollution, mainly from transport – many people may be exposed

7 Welsh Cancer Intelligence and Surveillance Unit, Public Health Wales
Lung cancer incidence and area deprivation
Lung cancer incidence rate increases steeply moving from the least to the
most deprived areas of Wales – most recently it was two-and-a-half times
higher in the most deprived areas compared to the least deprived
There were over twice as many lung cancers in the most deprived areas of Wales compared to the least deprived areas in 2012
The deprivation gap in lung cancer incidence widened by 27 per cent from 1999-2003 to 2008-2012
Lung cancer has the strongest association with deprivation of all the
commonest cancers
Geographic inequalities in lung cancer incidence in Wales
Lung cancer incidence rates vary considerably between the populations of the
seven health boards – the highest overall rate is in Cwm Taf which is two-
thirds higher than the lowest, Powys
For women the inequalities are even wider than for men - the lung cancer
incidence rate for women in Cwm Taf is higher than that for men in Powys Variation in lung cancer incidence rates is wider by local authority of
residence than for local health boards – the highest rate is in Merthyr Tydfil which is 87 per cent higher than the lowest, Monmouthshire
Rates are also statistically significantly higher than Wales in neighbouring
areas such as Blaenau Gwent, Rhondda Cynon Taf and Caerphilly, as well as
in north east Wales in Flintshire and Denbighshire
Local authorities’ incidence inequality is wider for women than men - the highest local authority rate for men is almost double the lowest, for women it is over double the lowest
Smaller sub-local authority geographic areas show even wider variation in
lung cancer incidence rate across and within all urban and rural areas of local authorities in Wales
Geographic inequalities in lung cancer incidence in Wales are mainly due to differences in historic trends in smoking prevalence between men and women
and differences in exposure to tobacco smoke, especially in relation to area deprivation
Other relatively common but less important factors include radon exposure across much of Wales, historic occupational exposure to asbestos and silica,
and exposure to particulate air pollution, mainly from transport - interaction and multiplying of the effect of radon and asbestos with the effect of smoking gives them more importance

8 Welsh Cancer Intelligence and Surveillance Unit, Public Health Wales
Stage at diagnosis in Wales
A large majority of men and women diagnosed with lung cancer in Wales
present at a late stage of the disease (stage 3 or 4), nevertheless about 20
per cent still presented at stage 1 or 2 in 2012
After reviewing several sources, stage at diagnosis was unavailable to the cancer registry for 13 per cent of cases in 2012 in people resident in Wales – men and women had similar proportions of unknown stage cases, the
youngest and oldest age groups have the highest compared to other ages
The stage distribution for women is slightly more favourable than for men for Wales as a whole
As the age of people presenting with lung cancer increases, cases with stage 1 or 2 at diagnosis become slightly more common
A large proportion of lung cancer cases present at late stage in areas of all
deprivation levels, with little variation, but with a slightly more favourable
stage distribution in more deprived areas
Health board populations (not hospitals) with the highest proportion of lung cancer cases presenting early in stages 1 and 2 are Cwm Taf and Cardiff and Vale, especially for women – Cwm Taf is the most favourable with 15 per
cent of cases presenting at stage 1 in 2012, and 21 per cent in stage 1 and 2 combined, with proportions even higher for women, but lower for men
Stage distribution was less favourable in the Hywel Dda population, and
particularly so in Abertawe Bro Morgannwg, especially for men compared to
women

9 Welsh Cancer Intelligence and Surveillance Unit, Public Health Wales
1 Lung cancer incidence
in Wales and the world
The most common cancer worldwide and the commonest cancer
leading to death in the EU
Lung cancer is the most common cancer worldwide1 and one of the four most
common cancers in Wales. Of the 28 EU countries, lung cancer was the commonest cancer leading to death in 20112. There are large inequalities in
incidence across the globe, including within Europe, between UK countries and within Wales.
The current lifetime risk of developing lung cancer in the UK has been estimated as 1 in 14 for men and 1 in 18 for womeni.
Smoking accounts for most cases in Wales and worldwide. The disease is largely preventable through effective population-level tobacco control and effectively addressing other preventable risk factors across the population.
Women’s lung cancer incidence rate in Wales is the third-highest
of 40 European countries
There were an estimated 410,000 new cases of lung cancer across the World Health Organization (WHO) European region in 2012, accounting for twelve per
cent of cancer cases, making it the fourth commonest cancer3. Amongst 40 of these countries, estimates for 2012 suggest that Hungary has the highest
incidence rate for men, and Denmark for women (figure 1). Sweden has the lowest rate for men, and Ukraine and Belarus for women. The UK has the eighth lowest rate for men and the sixth highest for women. Using our actual figures for
2012ii, we estimate that Wales’ women have the third highest incidence rate of all the 40 countries, and men in Wales have a rate higher than 11 of these
countries.
i Lifetime risk was calculated by the Statistical Information Team at Cancer Research UK, 2012.
ii The estimates calculated were similar to cancer registry data in high quality registry countries, such as
Wales. We used old European Standard Population for comparability www.wcisu.wales.nhs.uk

10 Welsh Cancer Intelligence and Surveillance Unit, Public Health Wales
Figure 1: Lung cancer incidence in Europe: Estimates for 40 countries 2012
EASR
per 100,000 population calculated using the 1976 European standard population. Source: J. Ferlay, E. Steliarova-Foucher, J.
Lortet-Tieulent, S. Rosso, J.W.W. Coebergh, H. Comber, D. Forman, F. Bray. European Journal of Cancer. Volume 49, Issue 6,
Pages 1374-1403 (April 2013) DOI: 10.1016/j.ejca.2012.12.027. Copyright © 2013 Elsevier

11 Welsh Cancer Intelligence and Surveillance Unit, Public Health Wales
Incidence rates in Wales were higher than England for men and
women until 2012 when Wales’ men had a lower rate
For most of 2003 to 2012, men and women in Wales had a higher age-adjusted incidence rate than England (figure 2). But in 2012 the rate in men was slightly lower than in England, making it the lowest male rate of UK countries. This may
not continue as the male rate in Wales has fluctuated about a downward trend. The rate for men in Scotland and England has had a clear downward trend
throughout the period.
Scotland’s incidence rates are higher than all UK countries - by
2012 Scotland’s women had the same rate as Wales’ men
Throughout the ten year period the rate for men and women in Scotland has
been much higher than the other countries. The trend for women in all the countries has been upward. Although the incidence rate in men was higher than women for the period, by 2012 the incidence for women in Scotland was almost
the same as the incidence for men in Wales. Figure 2: UK country lung cancer incidence rates continue to fall in men and rise in
women from 2003 to 2012
Source: Welsh Cancer Intelligence and Surveillance Unit’s National Cancer Registry and from the Office for
National Statistics, Scottish Cancer Registry and Northern Ireland Cancer Registry
12 Welsh Cancer Intelligence and Surveillance Unit, Public Health Wales
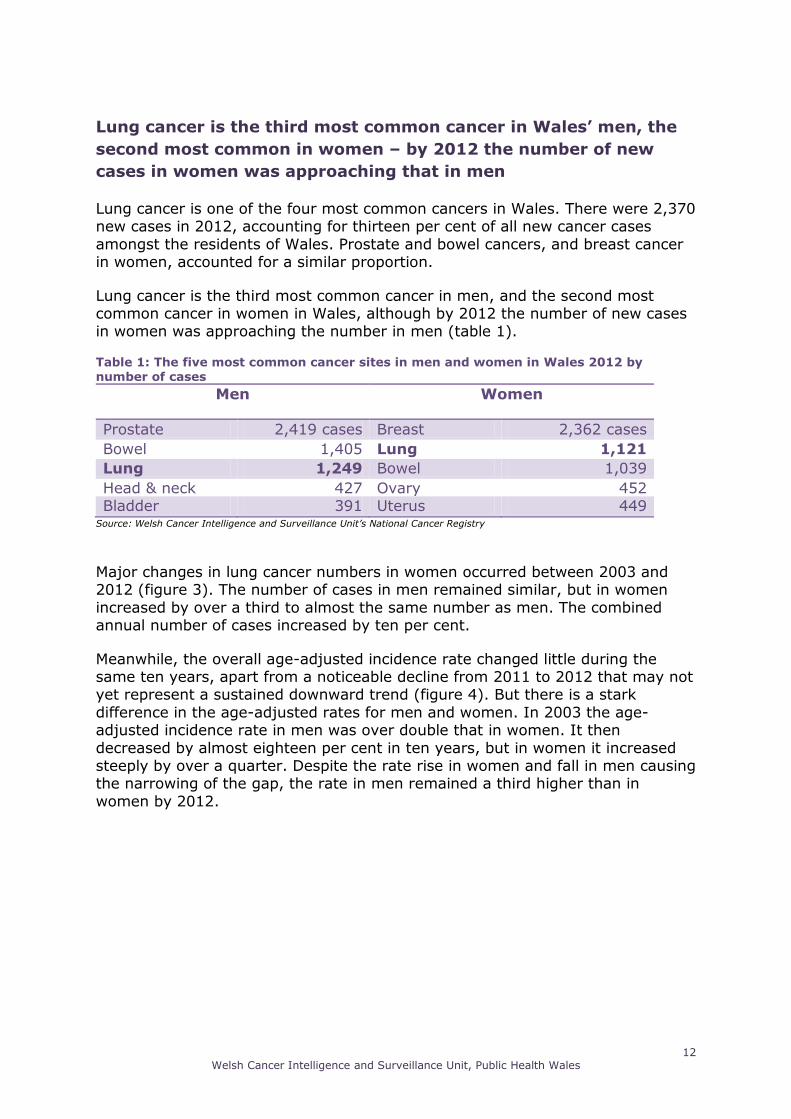
Lung cancer is the third most common cancer in Wales’ men, the
second most common in women – by 2012 the number of new
cases in women was approaching that in men
Lung cancer is one of the four most common cancers in Wales. There were 2,370 new cases in 2012, accounting for thirteen per cent of all new cancer cases
amongst the residents of Wales. Prostate and bowel cancers, and breast cancer in women, accounted for a similar proportion.
Lung cancer is the third most common cancer in men, and the second most common cancer in women in Wales, although by 2012 the number of new cases in women was approaching the number in men (table 1). Table 1: The five most common cancer sites in men and women in Wales 2012 by number of cases
Major changes in lung cancer numbers in women occurred between 2003 and 2012 (figure 3). The number of cases in men remained similar, but in women
increased by over a third to almost the same number as men. The combined annual number of cases increased by ten per cent.
Meanwhile, the overall age-adjusted incidence rate changed little during the same ten years, apart from a noticeable decline from 2011 to 2012 that may not yet represent a sustained downward trend (figure 4). But there is a stark
difference in the age-adjusted rates for men and women. In 2003 the age-adjusted incidence rate in men was over double that in women. It then
decreased by almost eighteen per cent in ten years, but in women it increased steeply by over a quarter. Despite the rate rise in women and fall in men causing the narrowing of the gap, the rate in men remained a third higher than in
women by 2012.
Men Women
Prostate 2,419 cases Breast 2,362 cases
Bowel 1,405 Lung 1,121
Lung 1,249 Bowel 1,039
Head & neck 427 Ovary 452 Bladder 391 Uterus 449
Source: Welsh Cancer Intelligence and Surveillance Unit’s National Cancer Registry

13 Welsh Cancer Intelligence and Surveillance Unit, Public Health Wales
Figure 3: Rising number and rate of lung cancer in Wales’ women while men’s rate falls
Source: Welsh Cancer Intelligence and Surveillance Unit’s National Cancer Registry
Despite the high incidence rates in the oldest, older and middle-aged men (figure 4) changing little or declining only modestly, there was an increase in the
population of men in those age groups because people are generally living longer and from the post-war ‘baby boom’. These factors resulted in the number
of lung cancer cases in men changing little. At the same time there have also been declines in incidence rates for younger male age-groups, but there are fewer cases of lung cancer in these groups.
Although the age-specific rates in older women remain much lower than in older men (figures 4 and 5), the oldest women have shown the steepest rises in
incidence rates over the ten year period (figure 4). The population of women in those groups is higher than men of the same age, and they increased by more than men due to increased life expectancy. Although the age-specific incidence
rate remains similar in men and women below 65 years, there have also been more gradual age-specific rate rises in most other older and middle-age female
groups, along with the increases in their populations from the ‘baby boom’. Combined, these factors explain the sharp overall increase in lung cancer cases in women, so that there are now similar numbers of cases to men in younger
age-groups (figures 4 and 5), with the gender gap closing in older groups.
By 2012, around two-thirds of lung cancer cases occurred in people aged 60 to
79 years. Slightly more than ten per cent were in the under 60s, but a quarter occurred in those aged 80 and over.

14 Welsh Cancer Intelligence and Surveillance Unit, Public Health Wales
Figure 4: Rising lung cancer incidence rates in oldest women in Wales with decreases or
little change in men
Source: Welsh Cancer Intelligence and Surveillance Unit’s National Cancer Registry
Figure 5: Lung cancer incidence rate rises with age in men and women then falls-off in oldest women in 2012 – number of cases similar in men and women in younger and oldest age groups
Source: Welsh Cancer Intelligence and Surveillance Unit’s National Cancer Registry

15 Welsh Cancer Intelligence and Surveillance Unit, Public Health Wales
Non-small cell lung cancer far more common than small cell
There are two main groups:
Non-small cell lung cancer Small cell lung cancer
There are three common sub-types of non-small cell lung cancer. These are
grouped together because their behaviour is similar and they respond to treatment in a different way to small cell lung cancer. The common types of
non-small cell lung cancer are:
Squamous cell carcinoma Adenocarcinoma
Large cell carcinomaiii
Non-small cell lung cancer is much more common than small cell lung cancer. It
accounts for about 89 per cent of lung cancer cases in Wales, and its age-adjusted rate in 2012 was over eight-and-a-half times that of small cell lung
cancer.
Non-small cell incidence rate has a similar trend to the overall for lung cancer because it accounts for most cases (figure 6). The rate in women increased by
over a third from 2003 to 2012, and declined in men by around sixteen per cent. The rate in men was over double that in women in 2003, but by 2012 the rate in
men was less than one-and-a-half times higher than in women.
Unlike for non-small cell lung cancer, the age-adjusted rate of small cell lung cancer is only slightly higher in men than women (figure 7). It has remained
stable in women during the ten year period to 2012, but it appears to have a gradual declining trend in men, so that both sexes are now approaching very
similar rates.
iii This group also contains other (e.g. sarcomas) and unspecific lung cancers

16 Welsh Cancer Intelligence and Surveillance Unit, Public Health Wales
Figure 6: Non-small cell lung cancer incidence trends mirror overall lung cancer trends
with a decline in men and a steeper increase in women
Source: Welsh Cancer Intelligence and Surveillance Unit’s National Cancer Registry
Figure 7: Small cell lung cancer incidence rate similar in men and women
Source: Welsh Cancer Intelligence and Surveillance Unit’s National Cancer Registry

17 Welsh Cancer Intelligence and Surveillance Unit, Public Health Wales
The two main groups of lung cancer differ in their age-specific incidence profile (figure 8). The non-small cell incidence rate rises sharply with age to peak at
age 80-84 before falling sharply, but the lower small cell lung cancer incidence rate rises gradually, peaks at age 70-74 and then gradually declines. The
incidence rate for small cell lung cancer is considerably less than that for non-small cell for all ages. Figure 8: Small cell lung cancer rate increases less with age and peaks earlier than non-small cell in 2012
Source: Welsh Cancer Intelligence and Surveillance Unit’s National Cancer Registry

18 Welsh Cancer Intelligence and Surveillance Unit, Public Health Wales
2What’s behind the lung
cancer incidence trends in
Wales?
Most causes and risk factors are preventable
The current lifetime risk of developing lung cancer in the UK has been estimated as 1 in 14 for men and 1 in 18 for womeniv. The main risk and causal factors for lung cancer include:
Smoking tobacco and environmental tobacco smoke (‘passive smoking’)
Naturally occurring radon gas
Asbestos exposure
Fine particulate matter air pollution exposure
Silicosis from occupational silica dust
Other occupational exposure such as fine particulates, nickel, chromium and arsenic
Genetic
In any one person developing lung cancer, several risk factors may have contributed over time, and in a few people these risk factors may rarely interact
with genetic susceptibility to lung cancer. But some risk factors interact with each other and can combine to give much higher risks than the individual factors
alone, especially for radon and asbestos in smokers – they don’t add to but multiply each other.
Tobacco smoke of old causes most of today’s lung cancer
Lung cancer is largely preventable by effective population tobacco control. Around 80 per cent of population lung cancer incidence in developed countries is
estimated to be attributable to smoking, both in smokers and non-smokers (through environmental tobacco smoke or ‘passive smoking’). It may be over 90
iv Lifetime risk was calculated by the Statistical Information Team at Cancer Research UK, 2012.
19 Welsh Cancer Intelligence and Surveillance Unit, Public Health Wales
per cent in men and around 78 per cent in women, according to some estimates4. In Wales an estimated 1,900 lung cancer cases per year might be
attributed to smoking tobacco (in smokers and non-smokers) at a population but not individual levelv.
Smoking tobacco is strongly related to individual lung cancer risk5,6. The cumulative risk of developing lung cancer by age 75 years in non-smokers has been estimated at nearly 1 in 2007 and about 1 in 7 in smokers. That means that
smokers have around 34 times the risk of developing lung cancer by age 75 compared to non-smokers. But individual risk will depend on the amount of
tobacco smoked daily and the number of years of smoking, as well as on other factors. There is a long latency time of around thirty years between the onset of smoking and lung cancer developing5.
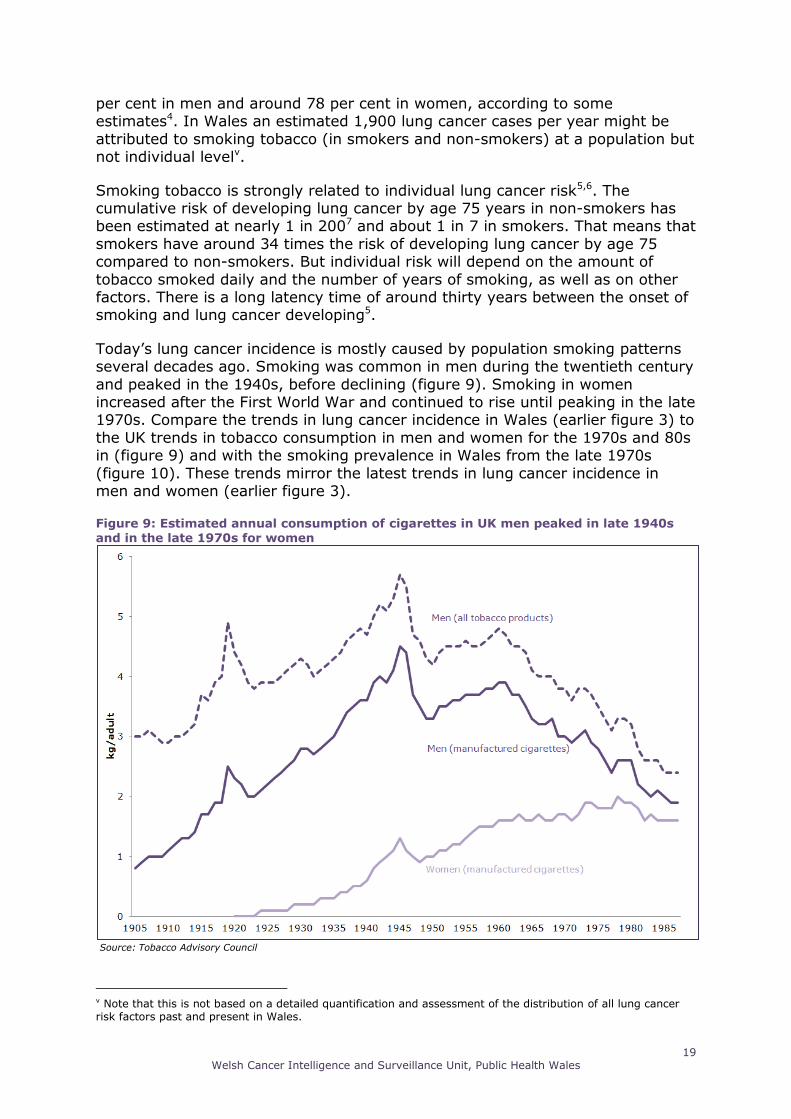
Today’s lung cancer incidence is mostly caused by population smoking patterns several decades ago. Smoking was common in men during the twentieth century
and peaked in the 1940s, before declining (figure 9). Smoking in women increased after the First World War and continued to rise until peaking in the late 1970s. Compare the trends in lung cancer incidence in Wales (earlier figure 3) to
the UK trends in tobacco consumption in men and women for the 1970s and 80s in (figure 9) and with the smoking prevalence in Wales from the late 1970s
(figure 10). These trends mirror the latest trends in lung cancer incidence in men and women (earlier figure 3).
Figure 9: Estimated annual consumption of cigarettes in UK men peaked in late 1940s
and in the late 1970s for women
Source: Tobacco Advisory Council
v Note that this is not based on a detailed quantification and assessment of the distribution of all lung cancer risk factors past and present in Wales.

20 Welsh Cancer Intelligence and Surveillance Unit, Public Health Wales
Figure 10: The decline in percentage of smokers who reported smoking daily in Wales
Source: General Lifestyle Survey (Office for National Statistics)
(a)Weighting applied by ONS to compensate for non-response. Technical reports from the survey show that weighted percentage of smokers has been around one per cent higher than the unweighted percentage from 1998 onwards.
Environmental tobacco smoke is a well established risk factor for lung cancer8 although not as great as in smokers. After a drop in the prevalence of people
exposed to environmental tobacco smoke in Wales following the introduction of the smoking ban, a large minority of adult non-smokers continue to be regularly exposed indoors and outdoors. Many children in Wales continue to be exposed to
tobacco smoke in the home and in cars, especially in more deprived groups and areas (figures 11 and 12).

21 Welsh Cancer Intelligence and Surveillance Unit, Public Health Wales
Figure 11: Gradient of the proportion of children in households with adult smokers by
household socioeconomic classification in Wales 2009-2010
Source: Welsh Health Survey (Welsh Government)
Figure 12: Percentage of 11-16 year-olds exposed to smoke in cars by health board, 2009
Source: Health Behavior in School-Aged Children Survey (World Health Organization/ Welsh Government)

22 Welsh Cancer Intelligence and Surveillance Unit, Public Health Wales
The trends in high prevalence of smoking and environmental tobacco smoke exposure and the high relative risk for lung cancer means it accounts for a large
proportion of the lung cancer population incidence9. In the Welsh Health Survey 2013, 21 per cent of adults aged 16 or older self-reported they smoked daily or
occasionally. The OECD reported that 14 per cent of adults smoked daily in Sweden in 201010.
Some other risk factors magnify the effect of smoking
An estimated 20 per cent of the population incidence of lung cancer is attributable to factors other than tobacco smoke in developed countries. So in Wales an estimated 470 cases per year might be attributed to these other
factors (in smokers and non-smokers) at a population but not individual levelvi.
Radon gas
Radon is a naturally occurring radioactive gas that is produced from the breakdown of naturally occurring uranium present in rocks, soil and water. It is inhaled and emits radioactive alpha particles and other solid radioactive
substances that can remain in the lungs after the gas has been exhaled.
It can accumulate in some buildings that lie over affected geological areas,
particularly if buildings have no radon mitigation measures. The indoor radiation concentration is related to building structure and ventilation.
There is a linear dose-response relationship between radon concentration and risk of lung cancer, even at low levels of radon11. Although their risk factors are similar, exposure to radon gas has a higher relative risk for small cell than non-
small cell lung cancer10.
The estimated absolute cumulative lifetime risk of developing lung cancer of
0.43 per cent in non-smokers not exposed to radon is increased to 0.53 per cent by a lifetime radon exposure in the home of 200 Bq/m3 (which is the domestic action level). This is equivalent to almost a nineteen per cent increase. But in
smokers, the estimated increase is from 14.7 per cent with no radon exposure to 19.0 per cent, equivalent to almost a thirty per cent increase10.
Despite no cut-off point of radon concentration and risk of lung cancer, the recognised action level recommended for radon mitigation of buildings is 200 Bq/m3. Radon-affected areas are defined as those with one per cent or more of
homes predicted to be above this action level. There are separate exposure limits for workplaces exposures in affected areas.
Due to its geology, many parts of Wales lie in identified affected areas (figure 13). Compared to England, a large proportion of Wales has more than an estimated 30 per cent of homes above the action level. It is beyond the scope of
this publication to make a detailed assessment of the level of lung cancer in the population of Wales related to this exposure, but this level of exposure will be
attributable to a significant minority of lung cancer cases in non-smokers and especially in smokers.
vi Note that this is not based on a detailed quantification and assessment of the distribution of all lung cancer risk factors past and present in Wales.

23 Welsh Cancer Intelligence and Surveillance Unit, Public Health Wales
Figure 13: Map of Radon Affected Areas in Wales and England
Source: Public Health England and British Geological Survey
Asbestos and other occupational exposures It is difficult to obtain an accurate picture of past asbestos exposure in Wales,
but it was more common in industrial areas and amongst workers who worked with asbestos containing materials.
Construction workers were exposed most to asbestos, responsible for almost a half of asbestos-related lung cancer cases in one study12. Most of those affected
are men, and include carpenters, plumbers, electricians, insulation workers,

24 Welsh Cancer Intelligence and Surveillance Unit, Public Health Wales
shipbuilders and locomotive engineers. In the past, women tended to be exposed domestically through being partners of those men, or directly related to
assembly-line work.
As well as being a specific risk factor for a rare cancer mesothelioma, the lung
cancer risk from asbestos has also been quantified13. Non-smokers exposed to asbestos have five times the risk of developing lung cancer compared to those not exposed to asbestos. But in smokers exposed to asbestos, there is a very
large fifty-fold increase in risk compared to smokers not exposed to asbestos14. Amongst the types of occupations exposed to asbestos, smoking was also more
prevalent. Risks of lung cancer under those circumstances would be very high.
Silica dust is related to lung cancer risk where long-term silica dust exposure has caused silicosis in the lungs, but not from silica dust exposure alone. Silicosis
used to be common in Wales amongst coal miners and slate quarry workers. Workers in sandblasting, other types of mining, rock drilling, brick cutting, glass
manufacturing, tunnelling, foundry work, stone working, ceramic manufacturing, potteries and construction activities can also be affected. Unlike asbestos and radon, the lung cancer risks from smoking with silicosis may add but not
multiply15, although studies are inconsistent.
Particulate matter air pollution
Long-term studies using a variety of methods have shown that chronic exposure to fine particulate matter increases morbidity and mortality risk through cardiovascular and respiratory health impacts16,17,18.
Evidence of outdoor air pollution causing lung cancer led to the International
Agency for Research on Cancer (IARC) to classify diesel-engine exhaust and
ambient air pollution (fine particulate matter) as carcinogenic to humans19.
Long-term exposure to particulate matter air pollution of 10μg/m3 of PM2.5 has been associated with an 18 per cent increased risk of lung cancer incidence20. The association with larger PM10 is less clear, but an increase of 10μg/m3 in
outdoor pollution was associated with an increased risk of developing lung cancer of 22 per cent.
Outdoor fine particulate air pollution is more often than not associated with road transport emissions, especially those from diesel vehicles21. Although there have
been significant technological advances that have resulted in cleaner fuels and more efficient engines, these are being offset by the ever increasing number of
vehicles on UK roads. Estimates suggest that between five to ten per cent of lung cancers in Europeans
who have never smoked or are ex-smokers are attributable to high-levels of outdoor air pollution8. We have not attempted a detailed analysis of the
contribution of air pollution to lung cancer incidence in Wales in this publication.

25 Welsh Cancer Intelligence and Surveillance Unit, Public Health Wales
3Lung cancer incidence
and area deprivation
Incidence rises steeply moving from least to most deprived areas
of Wales and the gap is widening
Lung cancer incidence is strongly associated with deprivation in men and
women. The association with deprivation occurs to a similar extent in urban and rural areas22.
The association with deprivation is largely due to its association with risk factors, especially smoking. But if deprivation is controlled for some residual risk for lung cancer remains. Some risk factors are less strongly associated with deprivation.
In Wales, the incidence of lung cancer increases steeply moving from the least to the most deprived areas (figure 14). For the latest period, it is two-and-a-half
times (150 per cent) higher in the most deprived areas compared to the least deprived – an absolute difference of 79 more new cases of lung cancer per 100,000 population in the most deprived areas compared to the least deprived.
This gap widened by 27 per cent from 1999-2003 to 2008-2012. This is equivalent to an absolute increase in the gap of 17 more new cases per 100,000
population in the most compared to the least deprived areas.

26 Welsh Cancer Intelligence and Surveillance Unit, Public Health Wales
Figure 14: The increase in the lung cancer incidence rate deprivation gap in Wales from
1999-2003 to 2008-2012
Source: Welsh Cancer Intelligence and Surveillance Unit’s National Cancer Registry
The deprivation gap widened as a result of a decrease in incidence rate in the least deprived areas with an increase in the most deprived areas. In 2012, over
a quarter of all cases of lung cancer occurred in the most deprived twenty per cent (fifth) of areas in Wales (table 2), with almost another quarter in the next most deprived fifth. Over twice as many cases occurred in the most deprived
fifth of areas, compared to the least deprived fifth. Table 2: Most lung cancer cases are diagnosed in residents of the most deprived areas of
Wales
2012
Total number of new lung cancer cases in each deprivation fifth of areas
1 Least deprived fifth 298 (12.6%)
2 Next least deprived 408 (17.2%) 3 Middle deprived 484 (20.4%) 4 Next most deprived fifth 556 (23.4%)
5 Most deprived 627 (26.4%)
WALES 2,373* (100%) Source: Welsh Cancer Intelligence and Surveillance Unit’s National Cancer Registry
* Figures are updated on an ongoing basis due to the dynamic database held at the cancer registry. Hence the difference in the numbers of cases analysed for staging and deprivation data compared to previous analysis.

27 Welsh Cancer Intelligence and Surveillance Unit, Public Health Wales
Lung cancer incidence deprivation gap wider than most common
cancers
The gap in lung cancer incidence rate between the most and least deprived areas in Wales is also the widest by far of all the other most common cancers (figure 15). The gap is least for colon cancer. For prostate and breast cancers
the gap is smaller than lung, but in the opposite direction - the incidence decreases slightly moving from the least to the most deprived areas. Figure 15: Lung cancer incidence rate deprivation gap is widest of all common cancers and is widening
Source: Welsh Cancer Intelligence and Surveillance Unit’s National Cancer Registry

28 Welsh Cancer Intelligence and Surveillance Unit, Public Health Wales
4 Geographic
inequalities in lung cancer
incidence within Wales Wide variation in health board population incidence rates with the highest Cwm Taf two-thirds more than the lowest Powys
Lung cancer incidence rates vary considerably between the populations of the seven health boards (figures 16 and 17).
Powys and Hywel Dda populations are the only populations with age-adjusted rates below that for Wales as a whole, and they are statistically significantly
different. Powys has the lowest incidence in Wales by far. It is 27 per cent lower than the rate for Wales as a whole.
At the other end of the scale, the age-adjusted lung cancer incidence rate in the
Cwm Taf population is 22 per cent higher than the all-Wales rate and two-thirds higher than that of Powys.
The remaining health board populations are similar to the Wales rate, although there is some variation there is no statistically significant difference.

29 Welsh Cancer Intelligence and Surveillance Unit, Public Health Wales
Figure 16: Wide variation in health board population lung cancer incidence rates
Source: Welsh Cancer Intelligence and Surveillance Unit’s National Cancer Registry
Wide variation in health board population lung cancer incidence
rates even wider in women than men - women in Cwm Taf have a higher rate than men in Powys
Differences between the health board populations exist for both men and women (table 3). For women the inequalities are even wider. The highest health board incidence in the Cwm Taf population is 57 per cent more than the lowest for men
in Powys. The age-adjusted lung cancer incidence for women is highest in the Cwm Taf population. It is 87 per cent higher than Powys, the lowest in Wales,
and 23 per cent higher than the all-Wales rate for women. The lung cancer incidence for women in Cwm Taf is higher than that for men in Powys.
Table 3: Wide variation in health board population lung cancer incidence rates
Health board Men Health board Women
Cwm Taf University 124.5 Cwm Taf University 80.7
Cardiff & Vale University 105.6 Abertawe Bro Morgannwg
University
71.0
Betsi Cadwaladr University 103.5 Cardiff & Vale University 67.8
Aneurin Bevan University 102.6 Wales 65.7
Wales 101.8 Aneurin Bevan University 65.3
Abertawe Bro Morgannwg
University
100.8 Betsi Cadwaladr University 64.3
Hywel Dda University 90.1 Hywel Dda University 59.2
Powys Teaching 79.5 Powys Teaching 43.2
Source: Welsh Cancer Intelligence and Surveillance Unit’s National Cancer Registry

30 Welsh Cancer Intelligence and Surveillance Unit, Public Health Wales
Figure 17: Wide variation in health board population lung cancer incidence rates
© Crown Copyright and database right 2014. Ordnance Survey 100044810
Source: Welsh Cancer Intelligence and Surveillance Unit’s National Cancer Registry
Variation in lung cancer incidence rates wider by local authority of
residence than for health boards – highest in Merthyr Tydfil is 87 per cent more than lowest in Monmouthshire The variation in lung cancer incidence is wider by local authority of residence
than for local health boards (figures 18 and 19). The highest overall incidence rate is in Merthyr Tydfil - over 28 per cent higher than Wales as a whole, and 87
per cent higher than Monmouthshire, the lowest. Rates are also statistically significantly higher than Wales in Merthyr Tydfil’s
neighbouring areas such as Blaenau Gwent, Rhondda Cynon Taf and Caerphilly as well as in north east Wales in Flintshire and Denbighshire.

31 Welsh Cancer Intelligence and Surveillance Unit, Public Health Wales
Figure 18: Wider variation in lung cancer incidence rates by local authority of residence, 2008-2012
Source: Welsh Cancer Intelligence and Surveillance Unit’s National Cancer Registry
The incidence rate is statistically significantly lower in Monmouthshire, Ceredigion, Powys and Gwynedd compared to the rate for Wales. The rate in
Monmouthshire is almost a third lower than for all-Wales. But there is wide variability even amongst these lower incidence areas. For example, lung cancer
incidence in Gwynedd is almost 25 per cent higher than in Monmouthshire.

32 Welsh Cancer Intelligence and Surveillance Unit, Public Health Wales
Figure 19: Wider variation in lung cancer incidence rates by local authority of residence
2008-2012
© Crown Copyright and database right 2014. Ordnance Survey 100044810.
Source: Welsh Cancer Intelligence and Surveillance Unit’s National Cancer Registry
Local authorities’ incidence inequality is wider for women than
men - the highest local authority rate for men is almost double the
lowest, for women it is over double the lowest
The inequalities in incidence across local authorities are wide for men, but even wider for women (table 4). For men the highest local authority rate is almost
double the lowest, and for women it is over double the lowest rate.
For men, the highest rate is in Merthyr Tydfil at over 90 per cent more than the
lowest in Monmouthshire, and nearly a quarter higher than all-Wales. For women, the highest rate is also in Merthyr Tydfil which is a third higher than the Wales rate. The lowest rate for women is in Powys.

33 Welsh Cancer Intelligence and Surveillance Unit, Public Health Wales
Table 4: Local authorities’ incidence inequality is wide for women and men
Local Authority Men Local Authority Women
Merthyr Tydfil 126.9 Merthyr Tydfil 88.3
Blaenau Gwent 126.4 Denbighshire 81.3
Flintshire 124.6 Neath Port Talbot 79.9
Rhondda Cynon Taf 123.8 Rhondda Cynon Taf 78.8
Torfaen 110.9 Blaenau Gwent 77.8
Caerphilly 109.8 Caerphilly 75.3
Cardiff 108.9 Flintshire 72.5
Denbighshire 108.8 Cardiff 69.9
Wrexham 106.2 Wrexham 69.2
Newport 104.9 Swansea 68.6
Neath Port Talbot 104.8 Bridgend 65.9
Swansea 102.4 Wales 65.7
Wales 101.8 The Vale of Glamorgan 64.1
The Vale of Glamorgan 99.2 Pembrokeshire 63.3
Pembrokeshire 96.9 Newport 63.1
Isle of Anglesey 96.1 Torfaen 61.2
Conwy 93.5 Carmarthenshire 60.8
Carmarthenshire 93.4 Conwy 59.5
Bridgend 93.6 Gwynedd 52.8
Gwynedd 90.3 Isle of Anglesey 49.5
Powys 79.5 Ceredigion 48.9
Ceredigion 70.2 Monmouthshire 48.5
Monmouthshire 66.6 Powys 43.2
Source: Welsh Cancer Intelligence and Surveillance Unit’s National Cancer Registry
Smaller sub-local authority geographic areas show even wider variation in lung cancer incidence rates
The map (figure 20) shows the very wide small area variation in age-adjusted lung cancer incidence across Wales. This variation between small areas occurs in local authority areas with relatively high and low lung cancer incidence. When
interpreting these apparent differences in lung cancer incidences between the smaller geographic areas caution is required as some of the variation is likely to
be due to chance owing to the small number of cases and small populations of some of the areas.
Numerous small areas of high and some of very high lung cancer incidence occur
in the local authority areas with the highest rates. These local authority areas tend to have few or no smaller areas of low incidence.
There are also a few small areas of higher incidence in local authority areas that have moderate or lower incidence overall. In the more rural local authorities there is also wide variation with several small areas of high and low incidence.
Some larger towns in rural areas tend to have higher rates than the surrounding areas.
Cities and larger towns in more urban local authorities all have wide variation with numerous areas of very high incidence.

34 Welsh Cancer Intelligence and Surveillance Unit, Public Health Wales
Figure 20: Smaller sub-local authority geographic areas show even wider variation in lung cancer incidence rates 2008-2012
© Crown Copyright and database right 2014. Ordnance Survey 100044810.
Source: Welsh Cancer Intelligence and Surveillance Unit’s National Cancer Registry

35 Welsh Cancer Intelligence and Surveillance Unit, Public Health Wales
Explaining geographic inequalities in lung cancer incidence
International differences in lung cancer incidence are the result of historic differences in smoking prevalence trends. There will also be variation between
and within countries in population exposure to radon and fine particulate air pollution, as well as local factors related to occupational exposures such as asbestos, silica and fine particulate matter. Many of these other factors will have
a multiplied effect if they occur in smokers. Smoking prevalence and other lung cancer risk factors are related to deprivation and socioeconomic status in
different ways in different countries.
The geographic inequalities in lung cancer incidence observed in Wales are also mainly due to differences in historic trends in smoking prevalence between men
and women, and differences in exposure to tobacco smoke, especially in relation to area deprivation. Other factors at play include the distribution of radon
exposure across Wales, historic occupational exposure to asbestos and silica, along with population and occupational exposure to fine particulate air pollution. The interaction and multiplying of the effect of radon and asbestos with the
effect of smoking gives them more importance where they are common amongst high smoking prevalence populations in Wales. When interpreting the apparent
differences in lung cancer incidences between the smaller geographic areas it is difficult to ascribe them to particular combinations of risk factors and caution is required. Some of the observed variation is likely to be due to random variation
from chance alone owing to the small number of cases and small populations of some of the areas.

36 Welsh Cancer Intelligence and Surveillance Unit, Public Health Wales
5 Stage at diagnosis
What is stage at diagnosis?
The stage of lung cancer at the time of diagnosis tells us how large the cancer is, whether it has spread to lymph nodes, and whether it has spread to elsewhere in the body (secondary or metastatic cancer). There are several ways of staging
lung cancer. We use the number staging system for our national cancer registry. This divides lung cancers into four main groups:
Stage 1 – the cancer is small and only in one area of the lung (localised)
Stages 2 and 3 – the cancer is larger and may have grown into the surrounding
tissues and there may be cancer cells in the lymph nodes (locally advanced)
Stage 4 – the cancer has spread to another part of the body (secondary or metastatic cancer)
Each of these stages of lung cancer can be divided into sub groups, such as stage 3a, 3b and so on. Further details about cancer staging are available on our
website www.wcisu.wales.nhs.uk
Why is stage at diagnosis important?
Survival mainly depends on how advanced the cancer is when it is diagnosed. Lung cancer is one of the most difficult cancers to treat, it is often diagnosed at
a late stage, and it tends to occur in older people who may also have other medical conditions. Survival statistics fall with more advanced stages of lung
cancervii. So stage at diagnosis is important because it can influence treatment options and survival prospects. Survival is generally better in non-small cell rather than small cell lung cancer. Potentially curative surgery and/or
radiotherapy may be options in stages 1 or 2 of non-small cell lung cancer. Chemotherapy, radiotherapy and rarely, surgery are treatment options used in
small cell lung cancer with various aims of treatment.
Most people diagnosed with lung cancer in Wales present at a late
stage of the disease
By 2012, the largest group by far was stage 4 (figure 21). Stage 3 and 4 lung
cancer together accounted for over two thirds of all cases at the time of diagnosis.
vii More details about lung cancer survival and survival by stage at diagnosis in Wales will be available from our
next publication due 22 January 2015

37 Welsh Cancer Intelligence and Surveillance Unit, Public Health Wales
Although a much lower proportion of people with lung cancer are diagnosed at stage 1 or 2, both stages combined still account for a fifth of all cases.
Figure 21: Most cases of lung cancer in Wales diagnosed at a late stage of disease in 2012
Source: Welsh Cancer Intelligence and Surveillance Unit’s National Cancer Registry
* Figures are updated on an ongoing basis due to the dynamic database held at the cancer registry. Hence the difference in
the numbers of cases analysed for staging and deprivation data compared to previous analysis.
After reviewing several sources, stage at diagnosis was unavailable to the cancer registry for 13 per cent of cases in 2012
in people resident in Wales
The stage at diagnosis was unavailable to the national cancer registry in a
quarter of new lung cancer cases in 2010 (table 5). By 2012, the proportion of unknown stage cases had reduced by nearly a half to thirteen per cent. There
are numerous reasons why we cannot always establish the stage in each case. These include not recording it on electronic clinical records at hospitals, not establishing the stage for clinical reasons, lack of stage information from Welsh
residents diagnosed or treated in England, and no stage information for cases identified via a death certificate only.

38 Welsh Cancer Intelligence and Surveillance Unit, Public Health Wales
Table 5: Increase in proportion of each stage at lung cancer diagnosis with a decrease in
unknown stage from 2010 to 2012
Year 1 2 3 4 Unknown All cases
2010 Number %
227 (9.6%)
125 (5.3%)
465 (19.7%)
965 (40.8%)
581 (24.6%)
2,363 (100.0%)
2011 Number %
246 (10.2%)
152 (6.3%)
511 (21.2%)
1,067 (44.2%)
436 (18.1%)
2,412 (100.0%)
2012 Number
%
279
(11.8%)
186
(7.8%)
544
(22.9%)
1,059
(44.6%)
305
(12.9%)
2,373
(100.0%) Source: Welsh Cancer Intelligence and Surveillance Unit’s National Cancer Registry * Figures are updated on an ongoing basis due to the dynamic database held at the cancer registry. Hence the difference in
the numbers of cases analysed for staging and deprivation data compared to previous analysis.
Reducing the large proportion of cases with unknown stage in 2010 has partly
resulted in a change in the distribution of known stage by 2012 (table 5). The largest proportionate increase of almost 50 per cent was in stage 2 cases. The
smallest increase was in stage 4, although stage 4 had the largest absolute increase. The unknown stage category may have previously contained a large minority of early stages and there may also have been a true stage shift to
earlier diagnosis. In order to understand the stage distribution more accurately it is important to reduce the proportion of unknown stage cases. Table 6: Absolute and proportionate change in number of lung cancer cases in each stage at diagnosis (including unknown stage) from 2010 to 2012
1 2 3 4 Unknown All cases
Absolute change
+ 52 +61 +79 +94 -276 +10
%
change
(+22.9%) (+48.8%) (+17.0%) (+9.7%) (-47.5%) (+0.4%)
Source: Welsh Cancer Intelligence and Surveillance Unit’s National Cancer Registry
Most new cases of lung cancer are diagnosed at a late stage in men and women with stage distribution slightly more favourable
in women than in men
By 2012 the stage distribution was slightly more favourable in women than in
men (figure 22). Women had a slightly higher proportion of cases diagnosed in stage 1, with a lower proportion at stage 4. The proportion of cases of unknown stage was similar for men and women.

39 Welsh Cancer Intelligence and Surveillance Unit, Public Health Wales
Figure 22: Most new cases of lung cancer are diagnosed at a late stage in men and women with stage distribution slightly more favourable in women than in men
Source: Source: Welsh Cancer Intelligence and Surveillance Unit’s National Cancer Registry
As the age of people presenting with lung cancer increases, cases with stage 1 or 2 at diagnosis become slightly more common
The youngest (<45 years) and oldest (75+ years) age groups have the highest proportion of unknown stage cases (figure 23). Although the proportion diagnosed with stages 1 or 2 is small for all age groups, as the age of people
presenting with lung cancer increases, cases with stage 1 or 2 at diagnosis become slightly more common.
Well over two-thirds of all cases are diagnosed at stage 3 or 4 for all age groups, except for the oldest group. This 75+ age group has 57 per cent of cases in either stage 3 or 4, and the smallest proportion of stage 4 cases, but this may
simply reflect the high proportion of unknowns. The youngest age group (<45 years) has a particularly high proportion of stage 4 disease at diagnosis,
although few cases occur in this age group.
People 75 years and over have the lowest proportion (82 per cent) of cases either in stages 3 and 4 or unknown as one group and the under 45s have the
highest proportion (93 per cent).

40 Welsh Cancer Intelligence and Surveillance Unit, Public Health Wales
Figure 23: As the age of people presenting with lung cancer increases, cases with stage
1 or 2 at diagnosis become slightly more common
Source: Welsh Cancer Intelligence and Surveillance Unit’s National Cancer Registry
There is a slightly more favourable stage distribution in more deprived areas
A large majority of cases of lung cancer present at a late stage in areas of all levels of deprivation (figure 24). As area deprivation worsens, the proportion of
cases with unknown stage decreases. There is little variation in the proportion of stage 4 disease which is the most common stage in each. There is a slightly
higher percentage of stage 1 and 2 cases in the most and next most deprived fifths of areas compared to the less deprived areas, but the proportion is low in all. Although the proportion of unknown cases and cases in late stages remains
high in all areas, the findings may reflect a slightly more favourable stage distribution in more deprived areas.

41 Welsh Cancer Intelligence and Surveillance Unit, Public Health Wales
Figure 24: There is a slightly more favourable stage distribution in more deprived areas
2010-2012
Source: Welsh Cancer Intelligence and Surveillance Unit’s National Cancer Registry
Distribution of stage at diagnosis varies considerably between health board populations – the most favourable is in Cwm Taf
This section does not refer to the hospital units of each health board as such, but to the stage of diagnosis of people who live within the geographic areas of the
health boards and who present with lung cancer to a health facility anywhere in Wales or across the border.
We have to exclude Powys from further analysis because many of its residents
are diagnosed or receive treatment across the border (as has been the case for several decades)viii. A smaller proportion of patients resident in the Betsi
Cadwaldr health board area also receive care across the border. This probably explains the higher proportion of unknown stage cases. We include this health board in our analysis as the proportion is much less than for Powys. Cwm Taf
residents have the lowest percentage of cases with unknown stage at 12 per cent. Excluding Betsi Cadwaldr and Powys, Abertawe Morgannwg residents have
the highest proportion with an unknown stage at 17 per cent, which is the same in men and women.
Most cases from each health board present late at stages 3 and 4, mainly stage
4 (figure 25). Residents of all the health boards, apart from Betsi Cadwaldr and Powys, have very similar proportions of cases either at stages 3 or 4, which
account for the large majority of cases in each. Betsi Cadwaldr residents have the lowest proportion in stage 4, but this is difficult to interpret owing to the
viii We do not currently receive staging information on Welsh residents from the cancer registry in England, but we are making arrangements to do so in future.

42 Welsh Cancer Intelligence and Surveillance Unit, Public Health Wales
proportion of unknown cases. Cardiff and Vale, Cwm Taf and Aneurin Bevan health board also have a comparatively low proportion in stage 4, but there are
wide disparities between men and women, with women having considerably lower proportions in stage 4 compared to men (figure 26). The Abertawe Bro
Morgannwg population has the highest proportion presenting in stage 4 overall, and Hywel Dda the second highest, but in contrast, their populations show little difference between men and women presenting at stage 4.
Cardiff and Vale and Cwm Taf health boards have the highest proportion of their residents presenting early with lung cancer stages 1 or 2 (figure 25). Each had
around a fifth of all their resident cases presenting as such in 2012. Cwm Taf was the most favourable with 15 per cent of its residents diagnosed with lung cancer in 2012 having stage 1 disease – although it has the highest proportion in
stage 1 for men and women, there are large differences between the sexes with women fairing much better (figure 26). Abertawe Bro Morgannwg has the lowest
proportion in either stages 1 or 2 overall, followed by Hywel Dda, both with nine per cent at stage 1. Both were also relatively low for women, but men living in the Abertawe Bro Morgannwg area had a very low proportion presenting in
either stage 1 or 2. Figure 25: Distribution of stage at diagnosis varies considerably between health board populations – the most favourable is in Cwm Taf
Source: Welsh Cancer Intelligence and Surveillance Unit’s National Cancer Registry

43 Welsh Cancer Intelligence and Surveillance Unit, Public Health Wales
Figure 26: Differences in stage at diagnosis between men and women varies between
each health board of residence 2010-2012
Source: Welsh Cancer Intelligence and Surveillance Unit’s National Cancer Registry
BC – Betsi Cadwaladr University Health Board, HD – Hywel Dda University Health Board, ABM – Abertawe Bro Morgannwg
University Health Board, CV – Cardiff and Vale University Health Board, CT – Cwm Taf University Health Board, AB – Aneurin
Bevan University Heath Board, P – Powys Teaching Health Board

44 Welsh Cancer Intelligence and Surveillance Unit, Public Health Wales
References 1 Ferlay J et al. Cancer incidence and mortality worldwide: sources, methods and major
patterns in GLOBOCAN 2012. Int J Cancer 2014 doi: 10.1002/ijc.29210.
2 Eurostat. Causes of death in the EU in 2011. 1 in 4 deaths caused by cancer in the
EU. Eurostat news release 179/2014. [25th Nov 2014]. Available at:
http://epp.eurostat.ec.europa.eu/cache/ITY_PUBLIC/3-25112014-BP/EN/3-
25112014-BP-EN.PDF [Accessed: 14th Dec 2014]
3 J. Ferlay et al. Cancer incidence and mortality patterns in Europe: estimates for 40
countries in 2012. Eur J Cancer 2013; 49(6); 1374-1403
4 Sethi TK, El-Ghamry MN, Kloecker GH. Radon and lung cancer. Clin Adv Hematol
Oncol 2012;10(3):57-64
5 Weiss W. Cigarette smoking and lung cancer trends. A light at the end of the tunnel?
Chest 1997;111[5]: 1414-16
6 Parkin D. Tobacco-attributable cancer burden in the UK in 2010. Br J Cancer 2011;
105: S6-S13
7 Health Protection Agency. Limitation of human exposure to radon. Advice from the
Health Protection Agency. RCE-15. London: HPA; 2010
8 Vineis P et al. Environmental tobacco smoke and risk of respiratory cancer and chronic
obstructive pulmonary disease in former smokers and never smokers in the EPIC
prospective study. BMJ 2005;doi:10.1136/bmj.38327.648472.82 [25 Sep 2005]
9 Parkin D et al. Global cancer statistics, 2002. CA Cancer J Clin 2005;55(2): 74-108
10 http://www.oecd-ilibrary.org/sites/factbook-2013-
en/12/02/01/smoke_g1.html?itemId=/content/chapter/factbook-2013-98-
en&_csp_=b363ad2af2448f26d48113c09a7ac2b8 [Accessed: 11th Dec 2014]
11 Darby S et al. Radon in homes and risk of lung cancer: collaborative analysis of
individual data from 13 European case-control studies BMJ 2005;
oi:10.1136/bmj.38308.477650.63 [21st Dec 2005]. Available at:
http://www.bmj.com/content/bmj/early/2003/12/31/bmj.38308.477650.63.full.pdf
[Accessed:14th Nov 2014]
12 Rake C et al. Occupational, domestic and environmental mesothelioma risk in the
British population: a case-control study. Br J Cancer 2009;100(7):1175-83. Available
at: http://www.nature.com/bjc/journal/v100/n7/pdf/6604879a.pdf [Accessed: 14th
Nov 2014]
13 Rushton L, Hutchings S, Brown T. The burden of cancer at work: estimation as the
first step to prevention. Occup Environ Med 2008;65:789-800
doi:10.1136/oem.2007.037002. Available at:
http://oem.bmj.com/content/65/12/789.full.pdf+html [Accessed: 14th Nov 2014]
14 Attanoos R. Lung cancer associated with asbestos exposure, In: E Craighead, AR
Gibbs eds. Asbestos and its diseases. London: OUP; 2008
15 Yu IT,Tse LA. Exploring the joint effects of silicosis and smoking on lung cancer risks.
Int J Cancer 2007;120:133–39.
16 Dockery DW et al. An association between air pollution and mortality in six U.S. cities.
N Engl J Med. 1993; 329(24): 1753-9

45 Welsh Cancer Intelligence and Surveillance Unit, Public Health Wales
17 Pope CA et al. Particulate air pollution as a predictor of mortality in a prospective
study of U.S. Adults. Am J Respir Crit Care Med 1995; (3 Pt 1): 669-74
18 World Health Organisation. Health effects of particulate matter. Policy implications for
countries in eastern Europe,Caucasus and central Asia. Copenhagen: WHO; 2013.
Available at: http://www.euro.who.int/__data/assets/pdf_file/0006/189051/Health-
effects-of-particulate-matter-final-Eng.pdf [Accessed: 14th Nov 2014]
19 International Agency for Research on Cancer. Diesel engine exhaust carcinogenic.
Press release 123. [12th June 2012]. Available at: http://www.iarc.fr/en/media-
centre/pr/2012/pdfs/pr213_E.pdf [Accessed: 14th Nov 2014]
20 Raaschou-Nielsen O et al. Air pollution and lung cancer incidence in 17 European
cohorts: prospective analyses from the European Study of Cohorts for Air Pollution
Effects (ESCAPE). Lancet Oncol 2013;14(9]:813-22
21 Organisation for Economic Co-operation and Development. The cost of air pollution:
Health Impacts of road transport. Paris: OECD Publishing; 2014
22 Riaz SP et al. Lung cancer incidence and survival in England: An analysis by
socioeconomic deprivation and urbanization. Thorac Oncol 2011;6:2005-10