Embed Size (px)
DESCRIPTION
Improved livelihoods for smallholder farmers : A tool for planning agricultural water management investments LIVELIHOOD ZONES ANALYSIS IN WEST BENGAL
Citation preview
Improved livelihoods for smallholder farmers
A tool for planning agricultural water management investments
LIVELIHOOD ZONES ANALYSIS
West Bengal
Prepared by Rajathat PRASARI, Kolkata, West Bengal, India in consultation with FAO, 2011
About this report The AgWater Solutions Project aimed at designing agricultural water management (AWM) strategies for smallholder farmers in sub Saharan Africa and in India. The project was managed by the International Water Management Institute (IWMI) and operated jointly with the Food and Agriculture Organization of the United Nations (FAO), International Food Policy Research Institute (IFPRI), the Stockholm Environmental Institute (SEI) and International Development Enterprise (IDE). It was implemented in Burkina Faso, Ethiopia, Ghana, Tanzania, Zambia and in the States of Madhya Pradesh and West Bengal in India. Several studies have highlighted the potential of AWM for poverty alleviation. In practice, however, adoption rates of AWM solutions remain low, and where adoption has taken place locally, programmes aimed at disseminating these solutions often remain a challenge. The overall goal of the project was to stimulate and support successful pro-poor, gender-equitable AWM investments, policies and implementation strategies through concrete, evidence-based knowledge and decision-making tools. The project has examined AWM interventions at the farm, community, watershed, and national levels. It has analyzed opportunities and constraints of a number of small-scale AWM interventions in several pilot research sites across the different project countries, and assessed their potential in different agro-climatic, socio-economic and political contexts. This report was prepared as part of the efforts to assess the potential for AWM solutions at national level. The livelihood zones analysis divides the country in a series of areas where rural people share relatively homogeneous living conditions on the basis of a combination of biophysical and socio-economic determinants. It describes the main sources of livelihood of rural populations (by category of people), their natural resources base, potential and key constraints to development. It analyses the relation between people and water and helps understanding to what extent and how water can be a factor for development.
i
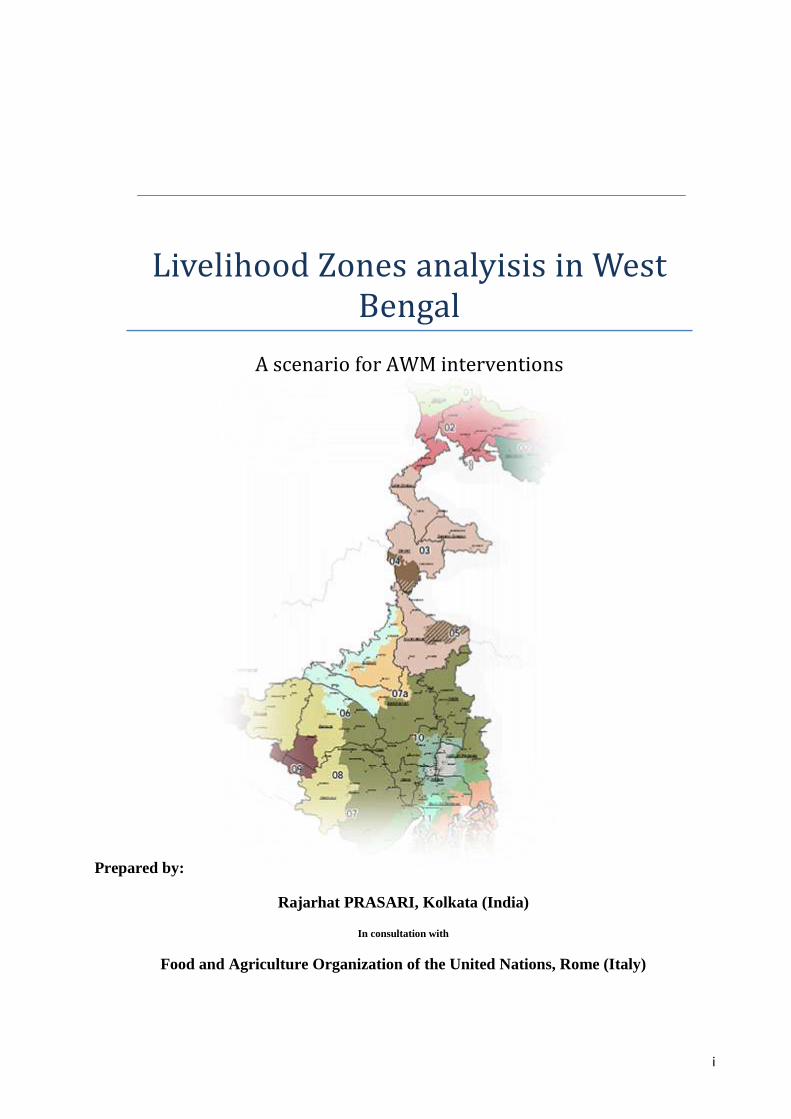
Livelihood Zones analyisis in West Bengal
A scenario for AWM interventions
Prepared by:
Rajarhat PRASARI, Kolkata (India)
In consultation with
Food and Agriculture Organization of the United Nations, Rome (Italy)
ii
PRASARI is a non-governmental organization, which was
established in 2007 and works in the rural development sector.
Within less than four years, PRASARI proved its role in improving
food sufficiency in southern West Bengal in Sundarbans. PRASARI
shares part of its success with local Panchayeti Raj Institutions
(PRIs), which takes a lead role in some parts of Sunderban. Further,
PRASARI has expanded into the northern parts of West Bengal such
as Jalpaiguri district where a system of rice Intensification (SRI) has
been introduced and promoted. PRASARI believes that small-scale
and marginal farmers would be most benefitted by this new
intervention.
Today PRASARI is the leading organization promoting SRI in the
state of West Bengal.
PRASARI receives its support from various national funding
agencies such as the National Bank for Agriculture and Rural
Development (NABARD) and Sir Dorabji Tata Trust (SDTT) and has
recently begun consultations with the Food and Agriculture
Organization of the United Nations (FAO) on the potential for
Agriculture Water Management (AWM) in India.
This document has been prepared by PRASARI in consultation with
FAO. Livelihood Zones were identified during the workshop held
November 2010 in Kolkata (India). The data used in this document
were collected from various government agencies in electronic
format and online resources such as government websites.
Mailing address: PRASARI 17 B, Bapujinagar, Jadavpur, Kolkata – 92 India
+91-33-24297935 +91-9836341858
May 2011

iii
Contents
ACRONYMS AND ABBREVIATIONS ......................................................................................................................... VII
1 INTRODUCTION .............................................................................................................................. 1
IMPORTANT MAPS OF INDIA ......................................................................................................................... 2
2 BACKGROUND ................................................................................................................................ 3
3. METHODOLOGY ............................................................................................................................. 4
OVERVIEW OF THE STATE OF WEST BENGAL ........................................................................................... 6
POPULATION OF WEST BENGAL ........................................................................................................................... 7
LAND-USE PATTERN IN WEST BENGAL ................................................................................................................... 8
ZONE 1 – DARJEELING .......................................................................................................................... 11
ZONE 2 DARJEELING, KOCH BIHAR, UTTAR DINAJPUR AND JALPAIGURI ................................................. 14
PRODUCTION AND PRODUCTIVITY OF RICE ............................................................................................................ 18
ZONE 2A KOCH BIHAR .......................................................................................................................... 18
ZONE 3 – DAKSHIN DINAJPUR, MALDAH, MURSHIDABAD AND UTTAR DINAJPUR .................................. 22
Dakshin Dinajpur ..................................................................................................................................... 24
ZONE 4 – MALDAH ............................................................................................................................... 30
ZONE 5 – MALDAH AND MURSHIDABAD .............................................................................................. 32
MURSHIDABAD ............................................................................................................................................... 32
ZONE 6 PARTS OF BANKURA, BARDHAMAN AND BIRBHUM .................................................................. 35
Bardhamann ............................................................................................................................................ 37
BARDHAMAN .................................................................................................................................................. 38
ZONE 7 – BANKURA, BARDHAMAN, HAORA, HUGLI, NADIA, NORTH 24 PARGANAS, PASCHIM
MEDINIPUR, PURBA MEDINIPUR, SOUTH 24 PARGANAS ....................................................................... 40
WEST MIDNAPUR ............................................................................................................................................ 42
ZONE 7A – BARDHAMAN AND BIRBHUM .............................................................................................. 47
ZONE 8 – BANKURA, WEST MEDINIPUR AND PURULIA DISTRICTS .......................................................... 48
ZONE 9 PARTS OF BANKURA, PASCHIM MEDINIPUR AND PURULIYA ..................................................... 57
ZONE 10 PARTS OF HAORA, HUGLI, NADIA, NORTH AND SOUTH 24 PARGANAS ..................................... 58
ZONE 11 – FIVE BLOCKS OF SOUTH 24 PARGANAS DISTRICT .................................................................. 61
ZONE 12 SOME BLOCKS OF NORTH 24 PARGANAS, EAST MEDINIPUR AND SOUTH 24 PARGANAS .......... 62
ZONE – 13 NORTH AND SOUTH 24 PARGANAS ..................................................................................... 64
AWM INVESTMENT POTENTIAL ............................................................................................................ 66
SOLUTIONS AS AN AWM INTERVENTION ............................................................................................................. 67
WATERSHED DEVELOPMENT .............................................................................................................................. 68
WATER HARVEST ............................................................................................................................................. 71
WATER AND SOIL CONSERVATION ....................................................................................................................... 74
iv
ELECTRIFICATION ............................................................................................................................................. 76
FINANCING ..................................................................................................................................................... 78
DRIP IRRIGATION ............................................................................................................................................. 79
SMALL-SCALE LIFT IRRIGATION............................................................................................................................ 80
SOLAR ............................................................................................................................................................ 81
CAPACITY BUILDING.......................................................................................................................................... 82
REFERENCES ........................................................................................................................................ 83
ANNEXES ............................................................................................................................................. 85
ANNEX 1 – PRODUCTION DETAILS OF DIFFERENT CROPS (‘000 TONNES) IN DIFFERENT DISTRICTS (2006-2007) .............. 85
ANNEX 2 – PRODUCTIVITY DETAILS OF DIFFERENT CROPS (KG/HA) IN DIFFERENT DISTRICTS (2006-2007) ...................... 86
ANNEX 3 – LIVELIHOOD ZONES ATTRIBUTE TABLE – GENERAL CHARACTERISTICS ......................................................... 87
ANNEX 4 – LIVELIHOOD ZONES ATTRIBUTE TABLE – SOCIOECONOMIC ASPECTS ........................................................... 89
ANNEX 5 – LIVELIHOOD ZONES ATTRIBUTE TABLE – WATER-RELATED ASPECTS 1 ......................................................... 92
ANNEX 6 – LIVELIHOOD ZONES ATTRIBUTE TABLE – WATER-RELATED ASPECTS 2 ......................................................... 95
List of Figures
1 – Map 1 Hydrological, 2 – District population, 3 – Drought prone areas, 4 – Flood prone areas, 5 – Groundwater quality, 6 – Land use, 7 – Population growth, 8 – Decadal groundwater fluctuation (1997– 2006)
2 – Different zones defined by the participants during the group discussion 3 – Agro-ecological map of West Bengal 4 – Map of Livelihood Zones 5 – West Bengal showing all districts 6 – Population in the districts of West Bengal – 2001 7 – Growth of population in West Bengal over the years (1941 - 2011) 8 – Available land area in different districts 9 – West Bengal and land use pattern 10 – Area utilized for agriculture purpose in different districts 11 – Fallow areas 12 – Area utilized for non-agricultural purposes 13 – Map of Darjeeling 14 – Persons engaged in agriculture in different blocks of Zone 1 15 – Broken highways 16 – Production of major food crops in Zone 1 17 – Productivity of major food crops in Zone 1 18 – Production (thousand tonne/ha) and productivity (kg/ha) patterns of rice
in different seasons (2006-2007) 19 – Map of Jalpaiguri 20 – People engaged in agriculture in blocks of Zone 2 21 – Production of major crops in district of Jalpaiguri 22 – Productivity of major crops in Zone 2 23 – Production and productivity pattern of rice in different seasons in Zone 2 (2006-2007) 24 – Map of Koch Bihar 25 – Persons engaged in agriculture in Zone 2a 26 – Production pattern of major food crops in Zone 2a 27 – Productivity pattern of major food crops in Zone 2a 28 – Production and productivity pattern of rice in Zone 2a in different seasons (2006-2007) 29 – Map of Uttar Dinajpur 30 – Map of Dakshin Dinajpur 31 – Persons engaged in agriculture in Zone 3 32 – Map of Maldah 33 – Eroded embankment resulting from flooded Ganga
v
34 – Production pattern of major crops in Zone 3 35 – Productivity pattern of major crops 36 – Production pattern of rice in Zone 3 in three different seasons (2006-2007) 37 – Productivity pattern of rice in zone 3 in three different seasons (2006-2007) 38 – Persons engaged in agriculture in Zone 4 39 – Production pattern of major crops in Zone 4 (2006-2007) 40 – Productivity pattern of major crops in Zone 4 41 – Production and productivity pattern of rice in three different seasons in Zone 4 42 – Map of Murshidabad 43 – Number of persons engaged in agriculture in Zone 5 44 – Production pattern of major crops in Zone 5 45 – Productivity pattern of major food crops in Zone 5 46 – Production and productivity patterns of rice in three different seasons in Zone 5 47 – Map of Birbhum 48 – Persons engaged in agriculture in Zone 6 49 – Map of Bardhman 50 – Population growth in Bardhaman 51 – Production pattern of major food crops in Zone 6 52 – Productivity pattern of major food crops in Zone 6 53 – Production and productivity patter of rice in three different seasons in Zone 6 54 – Map of Nadia 55 – Map of Hooghly 56 – Map of Howrah 57 – Map of East Medinipur 58 – North 24 Parganas 59 – Map of Bankura 60 – Production pattern of major food crops in Zone 7 61 – Persons engaged in agriculture in Zone 7 62 – Productivity pattern of major food crops in Zones 7 63 – Production and productivity pattern of rice in zones 7 and 7a 64 – Persons engaged in agricultuer in Zone 7a 65 – Map of Purulia 67 – Persons engaged in agriculture in Zone 8 68 – A typical village transact 69 – Resource ownership pattern of a typical marginal family in the zone 70 – A typical cycle in the zone 71 – Production patter of major crops in Zone 8 72 – Productivity pattern of major food crops in Zone 8 73 – Production and productivity pattern of rice in three different seasons in Zone 8 74 – Persons engaged in agriculture in Zone 9 75 – Persons engaged in agriculture in Zone 10 76 – Production pattern of major food crops in Zone 10 77 – Productivity pattern of major food crops in Zone 10 78 – Persons engaged in agriculture in Zone 11 79 – Persons engaged in agriculture in Zone 12 80 – Persons engaged in agriculture in Zone 13 81 – Resoruce map of a village in coastal West Bengal 82 – Voting was done in order to prioritize zones for AWM interventions 83 – Solution in the zones and its relevance 84 – Rainfall pattern in different districts 85 – Ground water situation in Zone 6, 7, 7a, and 12 86 – Water harvest and its relevance in each area 87 – Area available for production of Boro rice in zones relevant for intervention with water harvest 88 – Yield in Kg/ha of Boro rice in zones relevant for intervention with water harvest 89 – Rainfall trend in zones relevant for intervention with water harvest 90 – Water and soil conservation and its relevance in each zone 91 – Rainfall trend in zones relevant for interventin with water and soil conservation 92 – Trend in irrigation in zones relevant for intervention with water and soil conservation 93 – Electrification and its relevance in each zone
vi
94 – River Lift Irrigation schemes owned and run by WRDD 95 – Financing and its relevance in each zone 96 – Drip irrigation and its relevance in each zone 97 – Small-scale lift irrigation and its relevance in each zone 98 – Solar and its relevance in each zone 99 – Capacity building and its relevance in each zone List of Tables 1 – Nomenclature of Livelihood Zones based on key characteristics and key livelihoods 2 – Zones and districts falling under a particular zone 3 – Overview of West Bengal 4 – Zone 1 showing districts and blocks 5 – Zone 2 districts and blocks 6 – An overview of Jalpaiguri district 7 – Zone 2a districts and blocks 8 – Overview of district Koch Bihar 9 – Overview of district Uttar Dinajpur 10 – Zone 3 with its districts and blocks 11 – Overview of Dakshin Dinajpur 12 – Overview of District Maldah 13 – Zone 4 districts and blocks 14 – Zone 5 districts and blocks 15– Overview of district Murshidabad 16– Zone 6 with its districts and blocks 17 – Overview of district Birbhum 18 – Overview of district Bardhhaman 19 – District 7 with its districts and blocks 20 – Overview of district Nadia 21 – Overview of district North 24 Parganas 22 – Zone 8 districts and blocks 23 – Percentage of the underdeveloped communities 24 – Work availability in different districts 25 – Land size class in the zone 26 – Land categories and their usage 27 – The percentage of cultivable land and irrigated area (2006-07) 28 – Zone 10 districts and blocks 29 – Different solutions and their relevance explored during the workshop in different zones 30 – Zones showing relevance of intervention with Watershed development 31 – Zones showing relevance of intervention with water harvest 32 – Zones showing relevance of intervention with water and soil conservation 33 – Zones showing relevance of intervention with electrification 34 – Zones showing relevance of intervention with financing 35 – Zones showing relevance for intervention with drip irrigation 36 – Zones showing relevance for intervention with small-scale lift irrigation 37 – Zones showing their relevance for solar intervention 38 – Zone showing their relevance for intervention with capacity building
vii
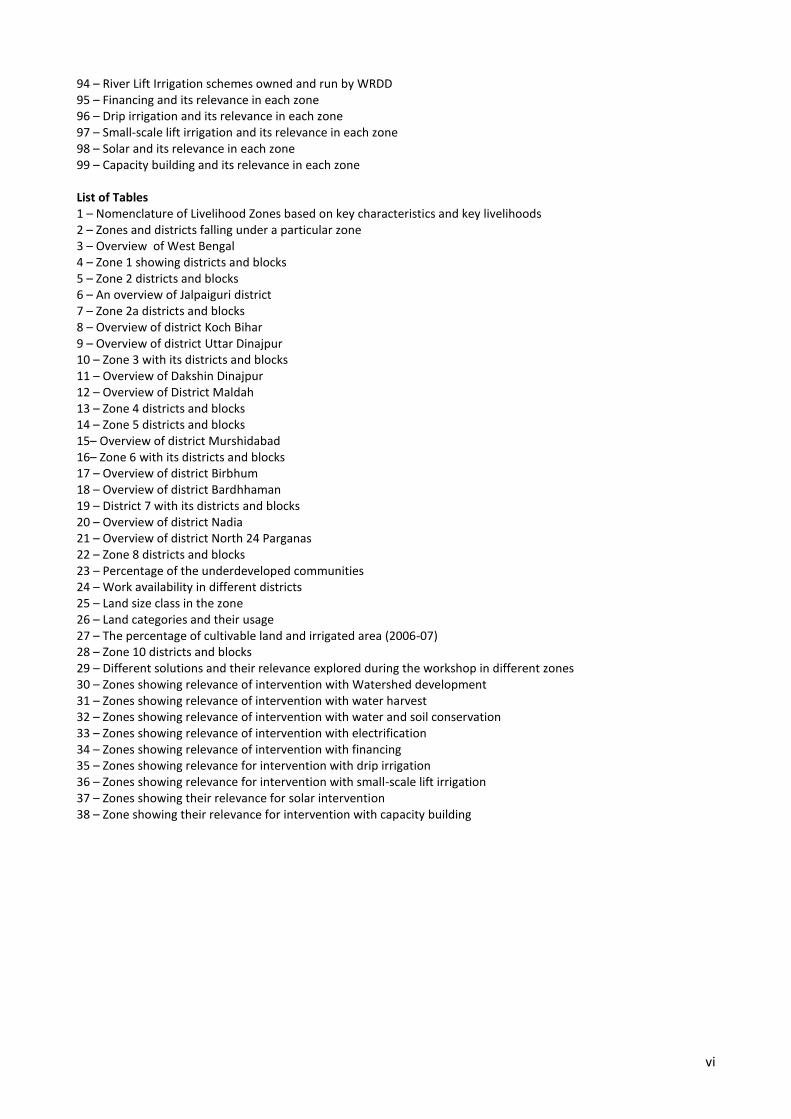
Acronyms and abbreviations
AEZ Agro-ecological zones
AWM Agricultural Water Management
FAO Food and Agriculture Organization of the United Nations
GIS Geographical Information Systems
HDI Human development index
Kharif Rainy season crops
Lahk Unit in Asian system. One hundred thousand, usually written as 1,00000
MSME Micro and small medium enterprises
NFSM National Food Security Mission
PRI Panchayeti Raj Institutions
RKVY Rashtriya Krishi Vikas Yojana
RLI River lift irrigation
NGO Non-governmental organization
NBARD National Bank for Agriculture and Rural Development
PMRY Prime Minister’s Rozgar Yojana
SGSY Swarnajayanti Gram Swarojgar Yogna
SRI System of Rice Intensification
SDTT Sir Dorabji Tata Trust
ST Scheduled tribe
TMC Total miscellaneous crops
1
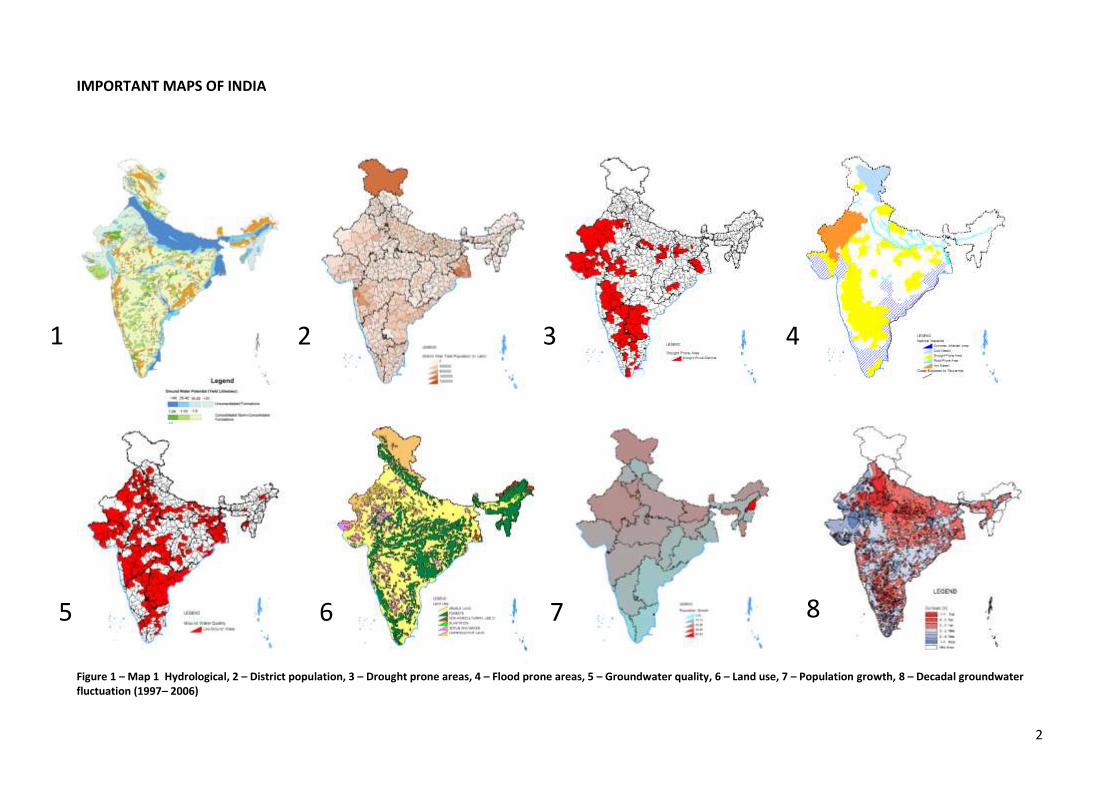
1 INTRODUCTION Water is a precious natural resource, which in India is becoming scarcer in several states; the reason is not its unavailability but rather its harvesting potential. In West Bengal, see Figure 1 (1 and 5) explains the situation. There is a huge difference between groundwater potential (yield litres/s) and groundwater quality where groundwater is low. West Bengal, where more than 72 percent of the population resides in villages, is predominantly agriculture dependent. Rural livelihoods are vulnerable to both floods and droughts, therefore, water has to be planned for, developed, conserved and managed, keeping in mind the socio-economic aspects and needs of the State (MInistry of Water Resources, 2002). Water is also one of the most important aspects to be considered during development planning at ground level.
With technology, a major portion of agriculture in drought-prone areas can be fed with deep tube wells, using shallow water pumps (Figure 1; 4). Though use varies from state-to-state, research shows a sharp decline in the groundwater table over the years (Figure 1; 8). Availability of technology and proper infrastructure might help conserve water thus increasing its availability during the dry season. Lack of awareness of water-related issues in communities, however, can put any conservation efforts at risk. According to the non-governmental organization (NGO) Development Alternatives Group, it is recognized that water problems cannot be solved with quick technical solutions; solutions to water problems require the consideration of various cultural, educational, and scientific aspects (Development Alternatives Group, 2001).
In India, State Governments run various schemes such as canal irrigation, river lift irrigation (RLI), etc. through local administration to strengthen irrigation facilities for local farmers. The ideal situation is to form an arrangement based on user cooperatives/societies (Phadhke, 2002) because the shift in trend towards the use of groundwater resources may be related to the lack of proper canal maintenance/RLIs (IWMI, 2010). Furthermore, the use of shallow water tube wells, and other low-power irrigation devices, permit users independent rights to use groundwater for farming. In this light, if policies to devolve the management of resources assume that (only) users will organize and take on the necessary management for community-based irrigation facilities this may result in the system becoming dysfunctional within a short time (Meinzen-Dick, Raju et al., 2002).
Linking of the above information to that of monsoon rainfall, which is the largest source of water for agriculture, has been random over a long period. Monsoon rainfall trends, based on the rainfall data from 1901 to 2003, have been noted in sub-Himalayan West Bengal and on the Sikkim and Bihar plains (decreasing) and Punjab, Konkan and Goa, West Madhya Pradesh and Telangana (increasing) (Guhathakurta and Rajeevan, 2008). With climate change it may be assumed these rainfall trends will be affected. This implies that water use policies should take a broader perspective and not be based on immediate solutions so that Indian agriculture can achieve its long-term goals.
2
IMPORTANT MAPS OF INDIA
Figure 1 – Map 1 Hydrological, 2 – District population, 3 – Drought prone areas, 4 – Flood prone areas, 5 – Groundwater quality, 6 – Land use, 7 – Population growth, 8 – Decadal groundwater fluctuation (1997– 2006)
1 2 3 4
5 6 7 8
3
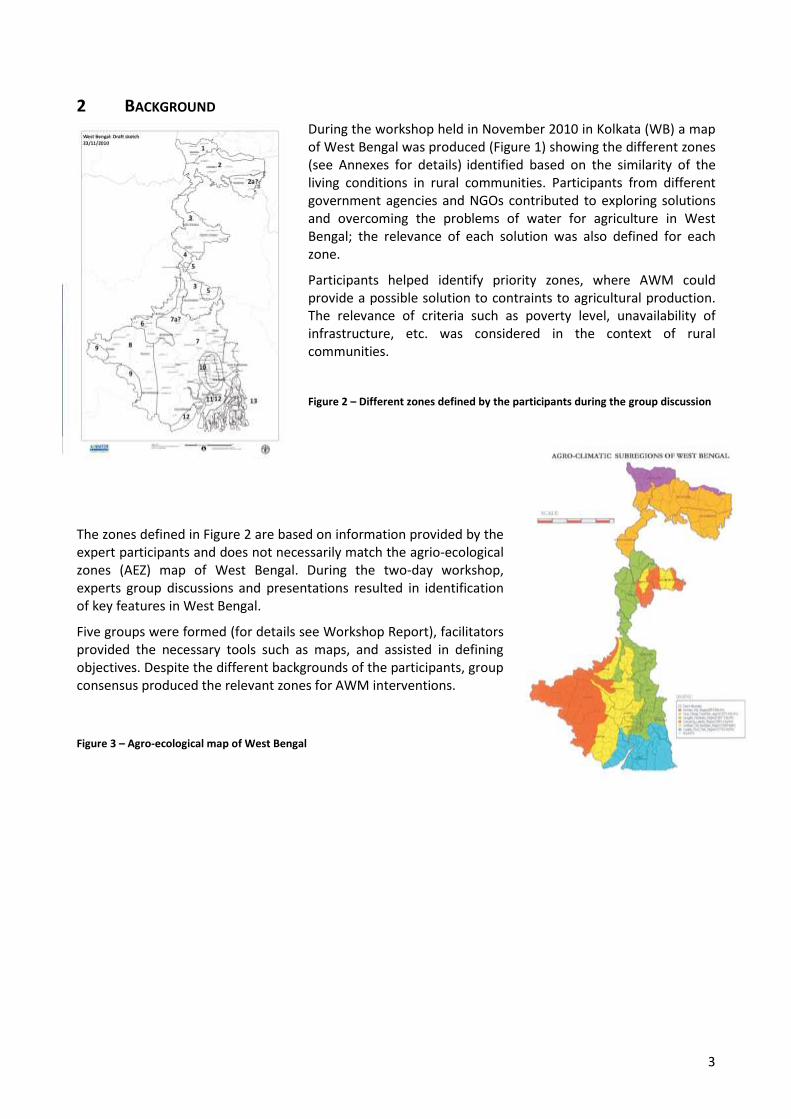
2 BACKGROUND During the workshop held in November 2010 in Kolkata (WB) a map of West Bengal was produced (Figure 1) showing the different zones (see Annexes for details) identified based on the similarity of the living conditions in rural communities. Participants from different government agencies and NGOs contributed to exploring solutions and overcoming the problems of water for agriculture in West Bengal; the relevance of each solution was also defined for each zone.
Participants helped identify priority zones, where AWM could provide a possible solution to contraints to agricultural production. The relevance of criteria such as poverty level, unavailability of infrastructure, etc. was considered in the context of rural communities.
Figure 2 – Different zones defined by the participants during the group discussion
The zones defined in Figure 2 are based on information provided by the expert participants and does not necessarily match the agrio-ecological zones (AEZ) map of West Bengal. During the two-day workshop, experts group discussions and presentations resulted in identification of key features in West Bengal.
Five groups were formed (for details see Workshop Report), facilitators provided the necessary tools such as maps, and assisted in defining objectives. Despite the different backgrounds of the participants, group consensus produced the relevant zones for AWM interventions.
Figure 3 – Agro-ecological map of West Bengal
4
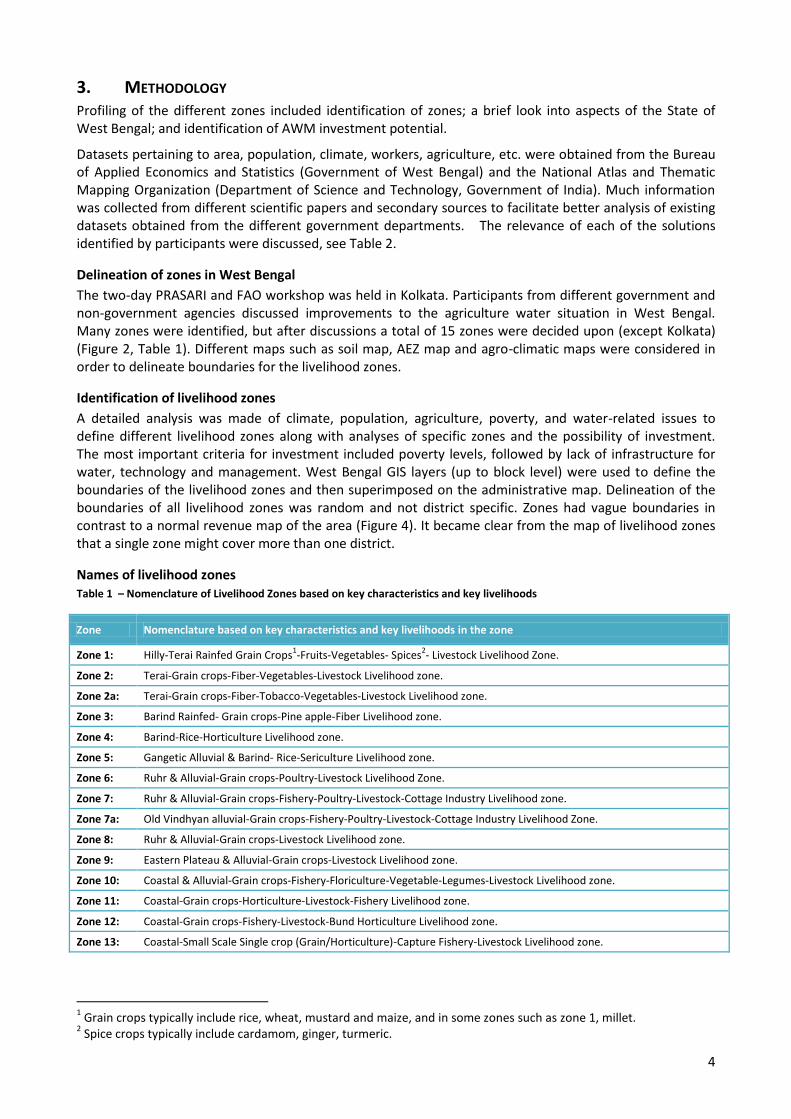
3. METHODOLOGY Profiling of the different zones included identification of zones; a brief look into aspects of the State of West Bengal; and identification of AWM investment potential.
Datasets pertaining to area, population, climate, workers, agriculture, etc. were obtained from the Bureau of Applied Economics and Statistics (Government of West Bengal) and the National Atlas and Thematic Mapping Organization (Department of Science and Technology, Government of India). Much information was collected from different scientific papers and secondary sources to facilitate better analysis of existing datasets obtained from the different government departments. The relevance of each of the solutions identified by participants were discussed, see Table 2.
Delineation of zones in West Bengal
The two-day PRASARI and FAO workshop was held in Kolkata. Participants from different government and non-government agencies discussed improvements to the agriculture water situation in West Bengal. Many zones were identified, but after discussions a total of 15 zones were decided upon (except Kolkata) (Figure 2, Table 1). Different maps such as soil map, AEZ map and agro-climatic maps were considered in order to delineate boundaries for the livelihood zones.
Identification of livelihood zones
A detailed analysis was made of climate, population, agriculture, poverty, and water-related issues to define different livelihood zones along with analyses of specific zones and the possibility of investment. The most important criteria for investment included poverty levels, followed by lack of infrastructure for water, technology and management. West Bengal GIS layers (up to block level) were used to define the boundaries of the livelihood zones and then superimposed on the administrative map. Delineation of the boundaries of all livelihood zones was random and not district specific. Zones had vague boundaries in contrast to a normal revenue map of the area (Figure 4). It became clear from the map of livelihood zones that a single zone might cover more than one district.
Names of livelihood zones Table 1 – Nomenclature of Livelihood Zones based on key characteristics and key livelihoods
Zone Nomenclature based on key characteristics and key livelihoods in the zone
Zone 1: Hilly-Terai Rainfed Grain Crops1-Fruits-Vegetables- Spices
2- Livestock Livelihood Zone.
Zone 2: Terai-Grain crops-Fiber-Vegetables-Livestock Livelihood zone.
Zone 2a: Terai-Grain crops-Fiber-Tobacco-Vegetables-Livestock Livelihood zone.
Zone 3: Barind Rainfed- Grain crops-Pine apple-Fiber Livelihood zone.
Zone 4: Barind-Rice-Horticulture Livelihood zone.
Zone 5: Gangetic Alluvial & Barind- Rice-Sericulture Livelihood zone.
Zone 6: Ruhr & Alluvial-Grain crops-Poultry-Livestock Livelihood Zone.
Zone 7: Ruhr & Alluvial-Grain crops-Fishery-Poultry-Livestock-Cottage Industry Livelihood zone.
Zone 7a: Old Vindhyan alluvial-Grain crops-Fishery-Poultry-Livestock-Cottage Industry Livelihood Zone.
Zone 8: Ruhr & Alluvial-Grain crops-Livestock Livelihood zone.
Zone 9: Eastern Plateau & Alluvial-Grain crops-Livestock Livelihood zone.
Zone 10: Coastal & Alluvial-Grain crops-Fishery-Floriculture-Vegetable-Legumes-Livestock Livelihood zone.
Zone 11: Coastal-Grain crops-Horticulture-Livestock-Fishery Livelihood zone.
Zone 12: Coastal-Grain crops-Fishery-Livestock-Bund Horticulture Livelihood zone.
Zone 13: Coastal-Small Scale Single crop (Grain/Horticulture)-Capture Fishery-Livestock Livelihood zone.
1 Grain crops typically include rice, wheat, mustard and maize, and in some zones such as zone 1, millet.
2 Spice crops typically include cardamom, ginger, turmeric.
5
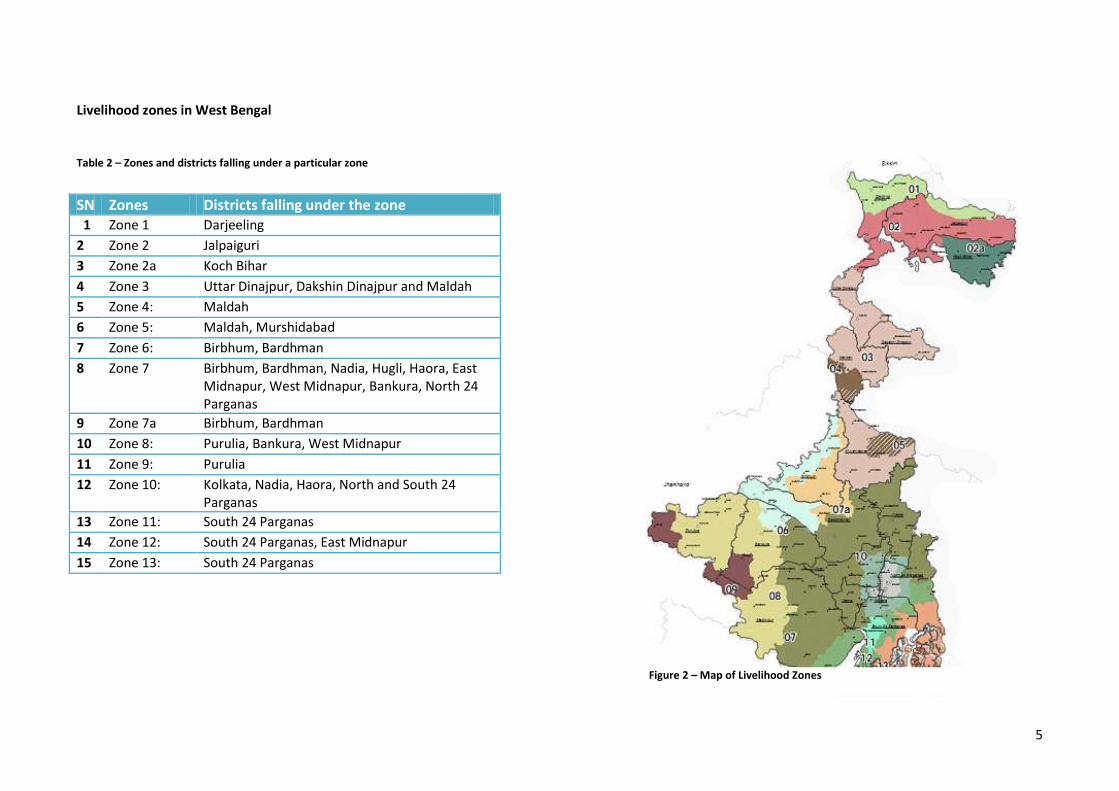
Livelihood zones in West Bengal
Table 2 – Zones and districts falling under a particular zone
SN Zones Districts falling under the zone 1 Zone 1 Darjeeling
2 Zone 2 Jalpaiguri
3 Zone 2a Koch Bihar
4 Zone 3 Uttar Dinajpur, Dakshin Dinajpur and Maldah
5 Zone 4: Maldah
6 Zone 5: Maldah, Murshidabad
7 Zone 6: Birbhum, Bardhman
8 Zone 7 Birbhum, Bardhman, Nadia, Hugli, Haora, East Midnapur, West Midnapur, Bankura, North 24 Parganas
9 Zone 7a Birbhum, Bardhman
10 Zone 8: Purulia, Bankura, West Midnapur
11 Zone 9: Purulia
12 Zone 10: Kolkata, Nadia, Haora, North and South 24 Parganas
13 Zone 11: South 24 Parganas
14 Zone 12: South 24 Parganas, East Midnapur
15 Zone 13: South 24 Parganas
Figure 2 – Map of Livelihood Zones
6
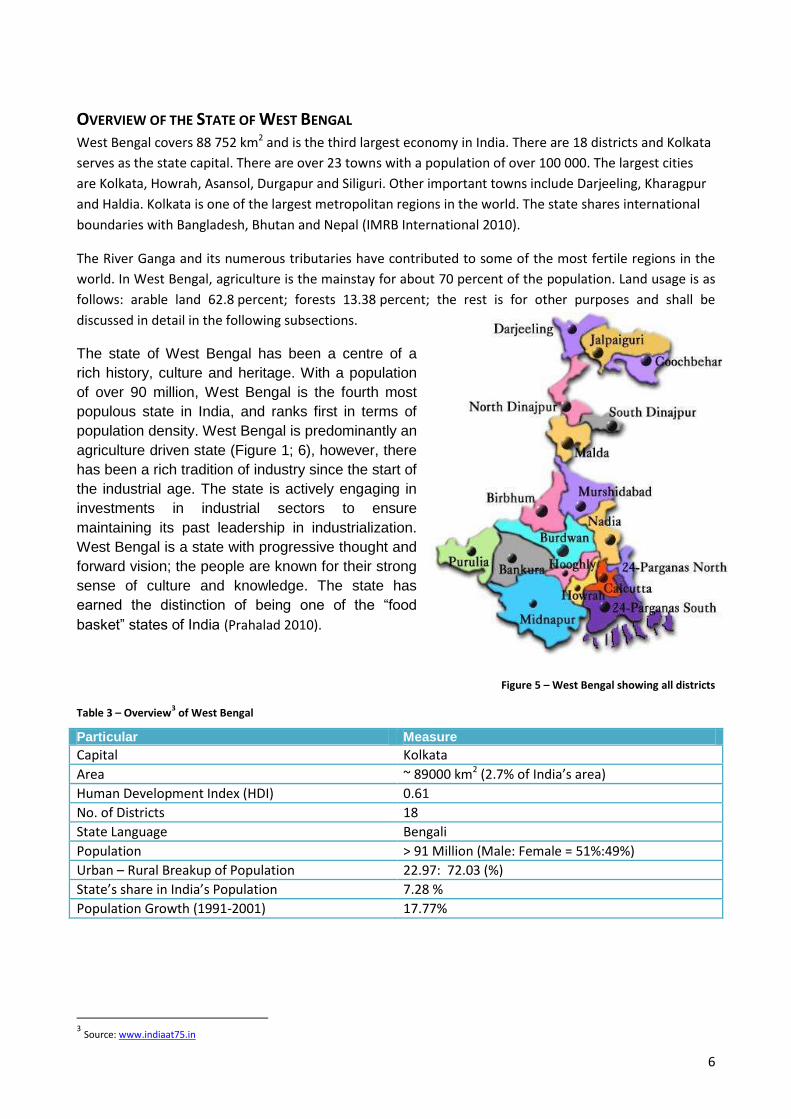
OVERVIEW OF THE STATE OF WEST BENGAL West Bengal covers 88 752 km2 and is the third largest economy in India. There are 18 districts and Kolkata
serves as the state capital. There are over 23 towns with a population of over 100 000. The largest cities
are Kolkata, Howrah, Asansol, Durgapur and Siliguri. Other important towns include Darjeeling, Kharagpur
and Haldia. Kolkata is one of the largest metropolitan regions in the world. The state shares international
boundaries with Bangladesh, Bhutan and Nepal (IMRB International 2010).
The River Ganga and its numerous tributaries have contributed to some of the most fertile regions in the
world. In West Bengal, agriculture is the mainstay for about 70 percent of the population. Land usage is as
follows: arable land 62.8 percent; forests 13.38 percent; the rest is for other purposes and shall be
discussed in detail in the following subsections.
The state of West Bengal has been a centre of a
rich history, culture and heritage. With a population
of over 90 million, West Bengal is the fourth most
populous state in India, and ranks first in terms of
population density. West Bengal is predominantly an
agriculture driven state (Figure 1; 6), however, there
has been a rich tradition of industry since the start of
the industrial age. The state is actively engaging in
investments in industrial sectors to ensure
maintaining its past leadership in industrialization.
West Bengal is a state with progressive thought and
forward vision; the people are known for their strong
sense of culture and knowledge. The state has
earned the distinction of being one of the “food
basket” states of India (Prahalad 2010).
Figure 5 – West Bengal showing all districts
Table 3 – Overview3 of West Bengal
Particular Measure
Capital Kolkata
Area ~ 89000 km2 (2.7% of India’s area)
Human Development Index (HDI) 0.61
No. of Districts 18
State Language Bengali
Population > 91 Million (Male: Female = 51%:49%)
Urban – Rural Breakup of Population 22.97: 72.03 (%)
State’s share in India’s Population 7.28 %
Population Growth (1991-2001) 17.77%
3 Source: www.indiaat75.in
7
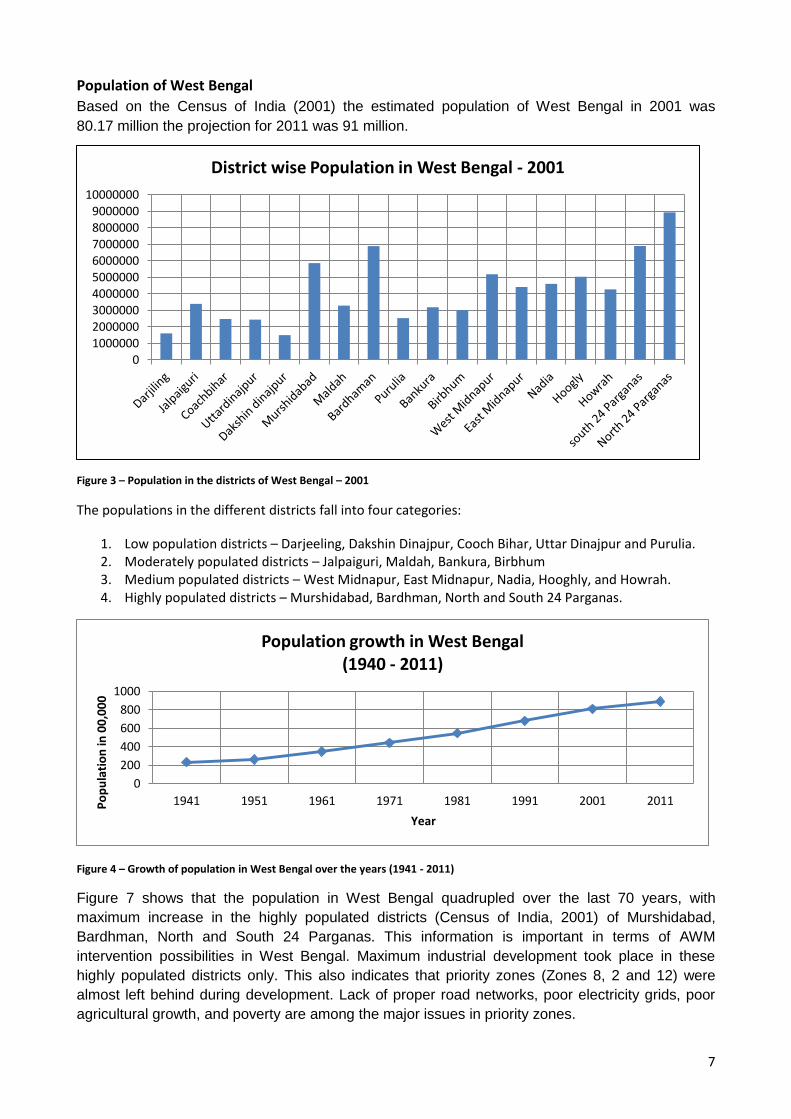
Population of West Bengal
Based on the Census of India (2001) the estimated population of West Bengal in 2001 was
80.17 million the projection for 2011 was 91 million.
Figure 3 – Population in the districts of West Bengal – 2001
The populations in the different districts fall into four categories:
1. Low population districts – Darjeeling, Dakshin Dinajpur, Cooch Bihar, Uttar Dinajpur and Purulia. 2. Moderately populated districts – Jalpaiguri, Maldah, Bankura, Birbhum 3. Medium populated districts – West Midnapur, East Midnapur, Nadia, Hooghly, and Howrah. 4. Highly populated districts – Murshidabad, Bardhman, North and South 24 Parganas.
Figure 4 – Growth of population in West Bengal over the years (1941 - 2011)
Figure 7 shows that the population in West Bengal quadrupled over the last 70 years, with
maximum increase in the highly populated districts (Census of India, 2001) of Murshidabad,
Bardhman, North and South 24 Parganas. This information is important in terms of AWM
intervention possibilities in West Bengal. Maximum industrial development took place in these
highly populated districts only. This also indicates that priority zones (Zones 8, 2 and 12) were
almost left behind during development. Lack of proper road networks, poor electricity grids, poor
agricultural growth, and poverty are among the major issues in priority zones.
0 1000000 2000000 3000000 4000000 5000000 6000000 7000000 8000000 9000000
10000000
District wise Population in West Bengal - 2001
0
200
400
600
800
1000
1941 1951 1961 1971 1981 1991 2001 2011 Po
pu
lati
on
in 0
0,0
00
Year
Population growth in West Bengal (1940 - 2011)
8
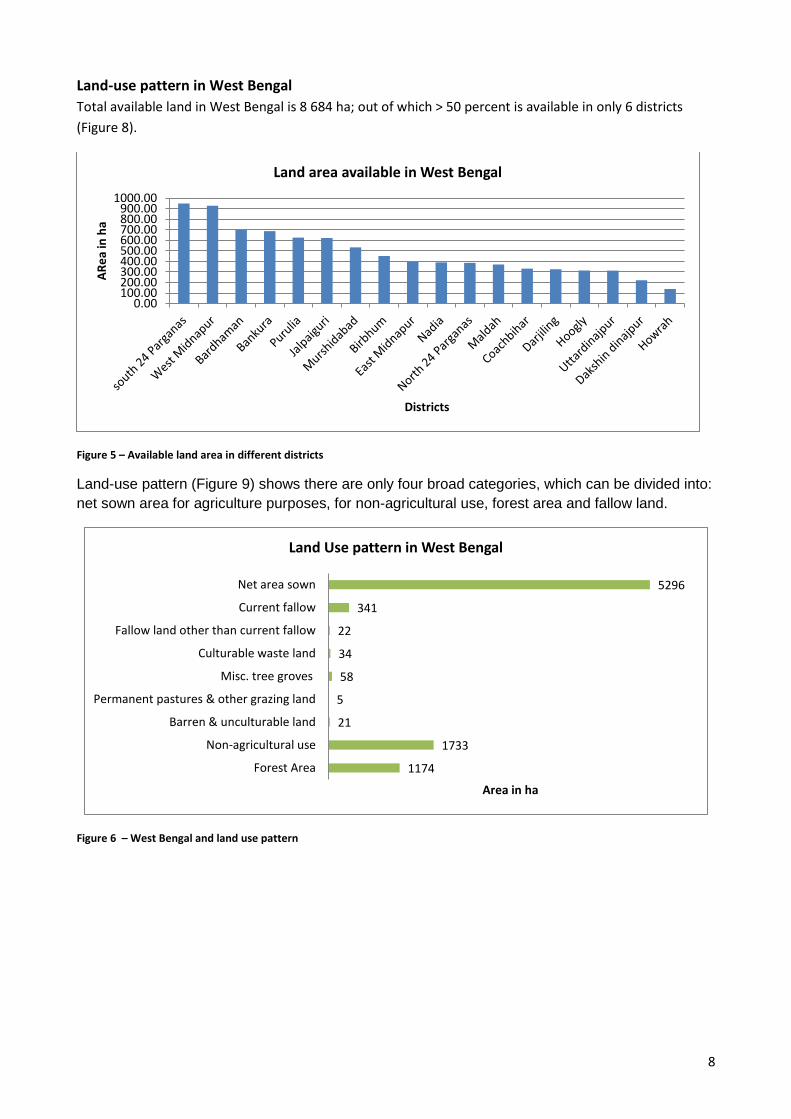
Land-use pattern in West Bengal
Total available land in West Bengal is 8 684 ha; out of which > 50 percent is available in only 6 districts
(Figure 8).
Figure 5 – Available land area in different districts
Land-use pattern (Figure 9) shows there are only four broad categories, which can be divided into:
net sown area for agriculture purposes, for non-agricultural use, forest area and fallow land.
Figure 6 – West Bengal and land use pattern
0.00 100.00 200.00 300.00 400.00 500.00 600.00 700.00 800.00 900.00
1000.00
AR
ea
in h
a
Districts
Land area available in West Bengal
1174
1733
21
5
58
34
22
341
5296
Forest Area
Non-agricultural use
Barren & unculturable land
Permanent pastures & other grazing land
Misc. tree groves
Culturable waste land
Fallow land other than current fallow
Current fallow
Net area sown
Area in ha
Land Use pattern in West Bengal
9
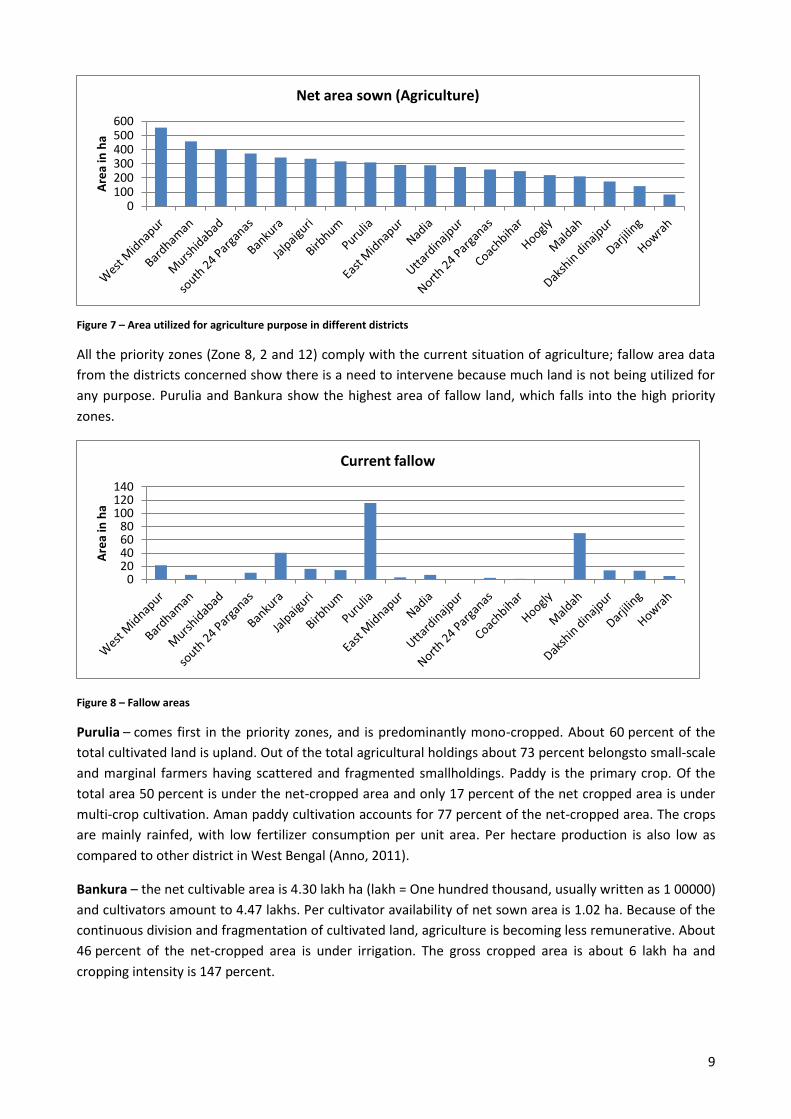
Figure 7 – Area utilized for agriculture purpose in different districts
All the priority zones (Zone 8, 2 and 12) comply with the current situation of agriculture; fallow area data
from the districts concerned show there is a need to intervene because much land is not being utilized for
any purpose. Purulia and Bankura show the highest area of fallow land, which falls into the high priority
zones.
Figure 8 – Fallow areas
Purulia – comes first in the priority zones, and is predominantly mono-cropped. About 60 percent of the
total cultivated land is upland. Out of the total agricultural holdings about 73 percent belongsto small-scale
and marginal farmers having scattered and fragmented smallholdings. Paddy is the primary crop. Of the
total area 50 percent is under the net-cropped area and only 17 percent of the net cropped area is under
multi-crop cultivation. Aman paddy cultivation accounts for 77 percent of the net-cropped area. The crops
are mainly rainfed, with low fertilizer consumption per unit area. Per hectare production is also low as
compared to other district in West Bengal (Anno, 2011).
Bankura – the net cultivable area is 4.30 lakh ha (lakh = One hundred thousand, usually written as 1 00000)
and cultivators amount to 4.47 lakhs. Per cultivator availability of net sown area is 1.02 ha. Because of the
continuous division and fragmentation of cultivated land, agriculture is becoming less remunerative. About
46 percent of the net-cropped area is under irrigation. The gross cropped area is about 6 lakh ha and
cropping intensity is 147 percent.
0 100 200 300 400 500 600
Are
a in
ha
Net area sown (Agriculture)
0 20 40 60 80
100 120 140
Are
a in
ha
Current fallow
10
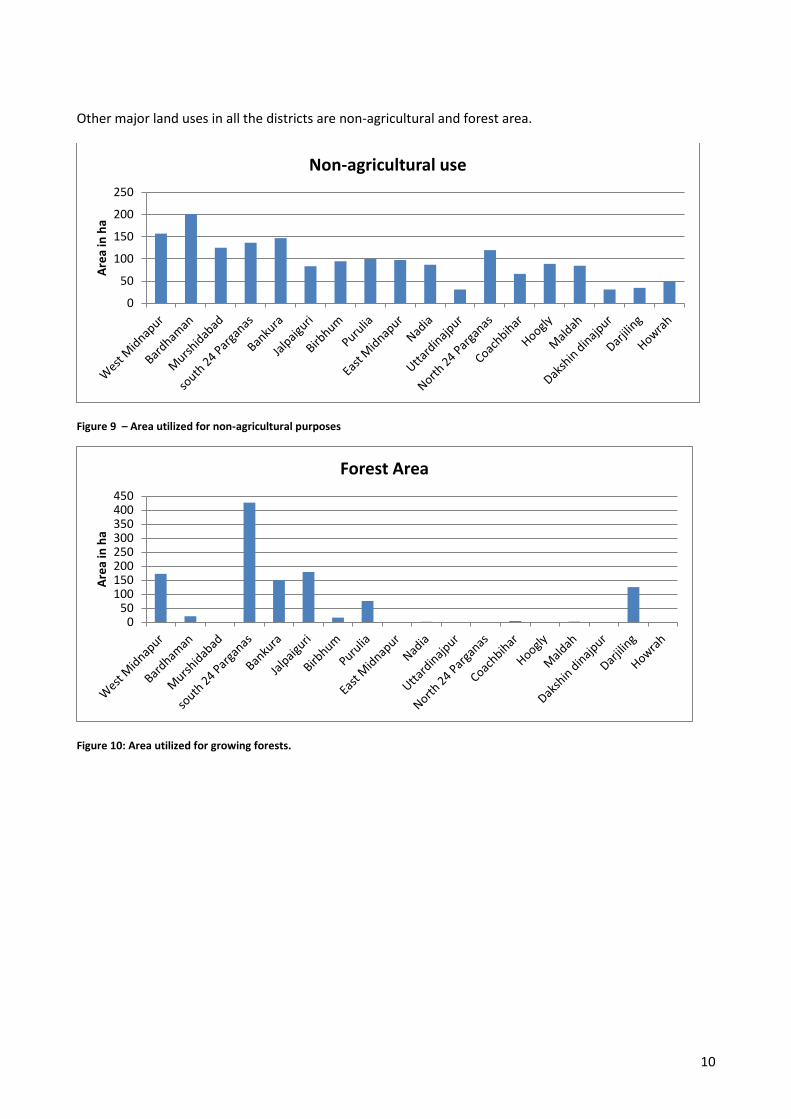
Other major land uses in all the districts are non-agricultural and forest area.
Figure 9 – Area utilized for non-agricultural purposes
Figure 10: Area utilized for growing forests.
0
50
100
150
200
250
Are
a in
ha
Non-agricultural use
0 50
100 150 200 250 300 350 400 450
Are
a in
ha
Forest Area
11
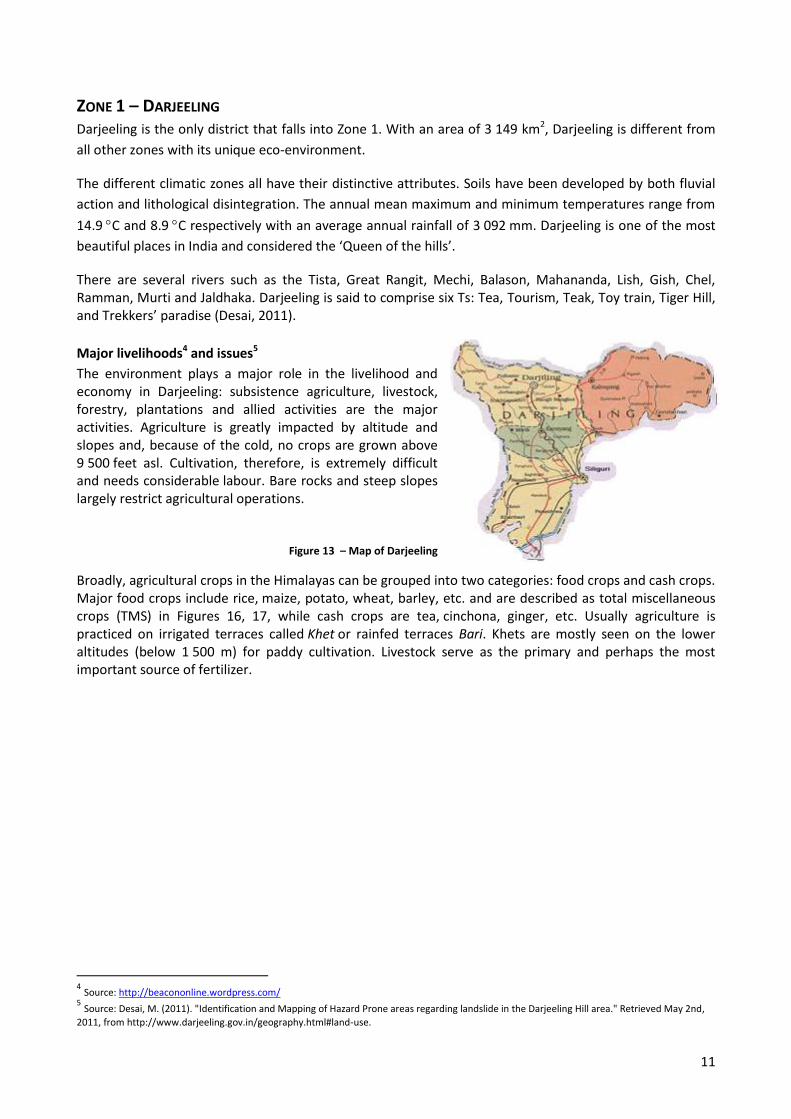
ZONE 1 – DARJEELING Darjeeling is the only district that falls into Zone 1. With an area of 3 149 km2, Darjeeling is different from
all other zones with its unique eco-environment.
The different climatic zones all have their distinctive attributes. Soils have been developed by both fluvial
action and lithological disintegration. The annual mean maximum and minimum temperatures range from
14.9 C and 8.9 C respectively with an average annual rainfall of 3 092 mm. Darjeeling is one of the most
beautiful places in India and considered the ‘Queen of the hills’.
There are several rivers such as the Tista, Great Rangit, Mechi, Balason, Mahananda, Lish, Gish, Chel, Ramman, Murti and Jaldhaka. Darjeeling is said to comprise six Ts: Tea, Tourism, Teak, Toy train, Tiger Hill, and Trekkers’ paradise (Desai, 2011).
Major livelihoods4 and issues5
The environment plays a major role in the livelihood and economy in Darjeeling: subsistence agriculture, livestock, forestry, plantations and allied activities are the major activities. Agriculture is greatly impacted by altitude and slopes and, because of the cold, no crops are grown above 9 500 feet asl. Cultivation, therefore, is extremely difficult and needs considerable labour. Bare rocks and steep slopes largely restrict agricultural operations.
Figure 13 – Map of Darjeeling
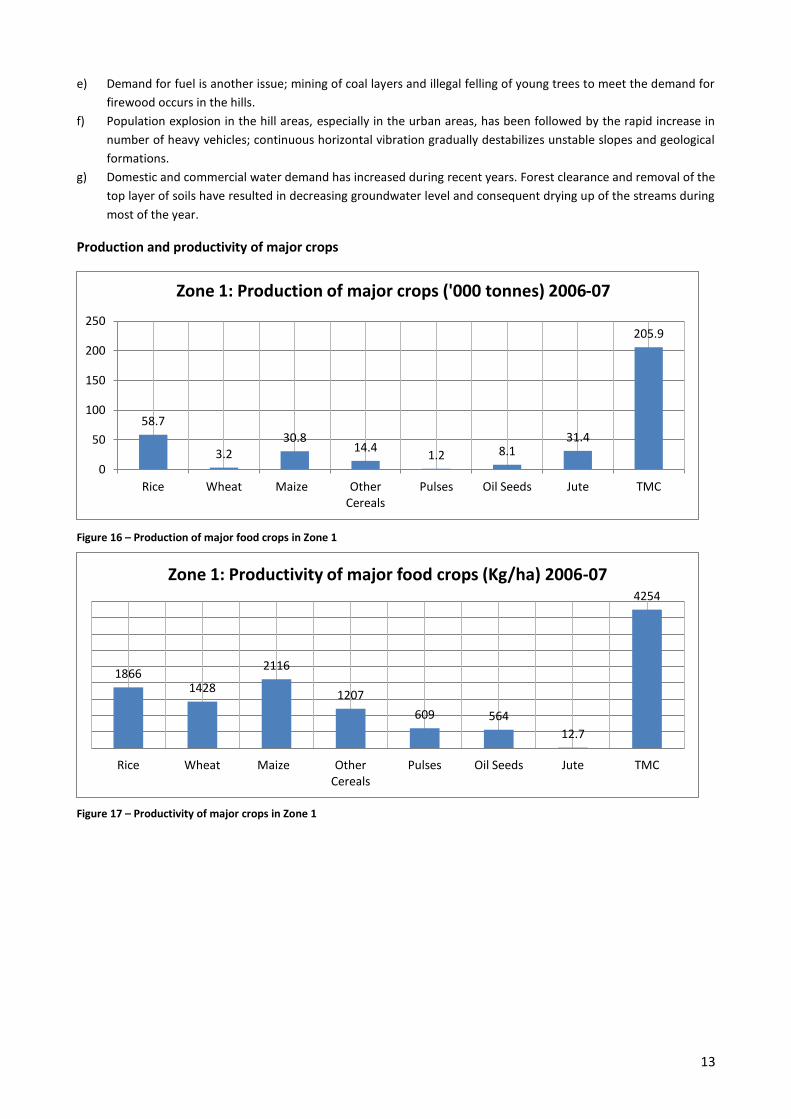
Broadly, agricultural crops in the Himalayas can be grouped into two categories: food crops and cash crops. Major food crops include rice, maize, potato, wheat, barley, etc. and are described as total miscellaneous crops (TMS) in Figures 16, 17, while cash crops are tea, cinchona, ginger, etc. Usually agriculture is practiced on irrigated terraces called Khet or rainfed terraces Bari. Khets are mostly seen on the lower altitudes (below 1 500 m) for paddy cultivation. Livestock serve as the primary and perhaps the most important source of fertilizer.
4 Source: http://beacononline.wordpress.com/
5 Source: Desai, M. (2011). "Identification and Mapping of Hazard Prone areas regarding landslide in the Darjeeling Hill area." Retrieved May 2nd,
2011, from http://www.darjeeling.gov.in/geography.html#land-use.
12
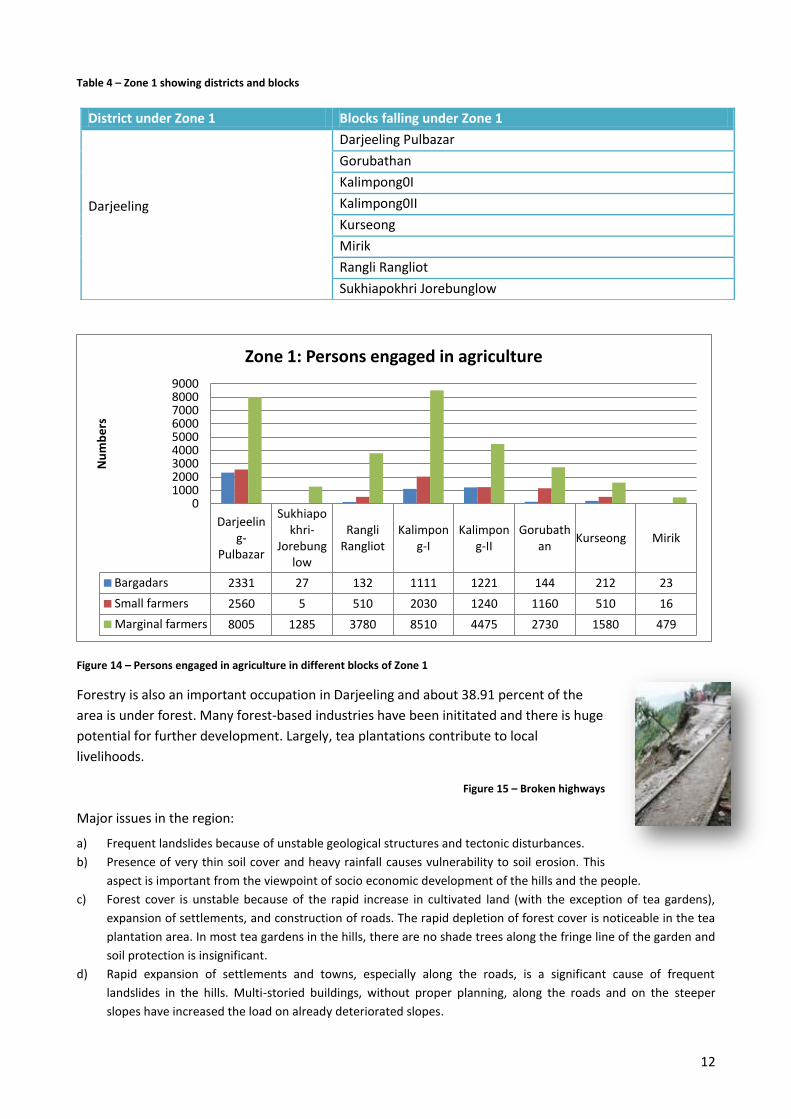
Table 4 – Zone 1 showing districts and blocks
Figure 14 – Persons engaged in agriculture in different blocks of Zone 1
Forestry is also an important occupation in Darjeeling and about 38.91 percent of the
area is under forest. Many forest-based industries have been inititated and there is huge
potential for further development. Largely, tea plantations contribute to local
livelihoods.
Figure 15 – Broken highways
Major issues in the region:
a) Frequent landslides because of unstable geological structures and tectonic disturbances.
b) Presence of very thin soil cover and heavy rainfall causes vulnerability to soil erosion. This
aspect is important from the viewpoint of socio economic development of the hills and the people.
c) Forest cover is unstable because of the rapid increase in cultivated land (with the exception of tea gardens),
expansion of settlements, and construction of roads. The rapid depletion of forest cover is noticeable in the tea
plantation area. In most tea gardens in the hills, there are no shade trees along the fringe line of the garden and
soil protection is insignificant.
d) Rapid expansion of settlements and towns, especially along the roads, is a significant cause of frequent
landslides in the hills. Multi-storied buildings, without proper planning, along the roads and on the steeper
slopes have increased the load on already deteriorated slopes.
Darjeeling-
Pulbazar
Sukhiapokhri-
Jorebunglow
Rangli Rangliot
Kalimpong-I
Kalimpong-II
Gorubathan
Kurseong Mirik
Bargadars 2331 27 132 1111 1221 144 212 23
Small farmers 2560 5 510 2030 1240 1160 510 16
Marginal farmers 8005 1285 3780 8510 4475 2730 1580 479
0 1000 2000 3000 4000 5000 6000 7000 8000 9000
Nu
mb
ers
Zone 1: Persons engaged in agriculture
District under Zone 1 Blocks falling under Zone 1
Darjeeling
Darjeeling Pulbazar
Gorubathan
Kalimpong0I
Kalimpong0II
Kurseong
Mirik
Rangli Rangliot
Sukhiapokhri Jorebunglow
13
e) Demand for fuel is another issue; mining of coal layers and illegal felling of young trees to meet the demand for
firewood occurs in the hills.
f) Population explosion in the hill areas, especially in the urban areas, has been followed by the rapid increase in
number of heavy vehicles; continuous horizontal vibration gradually destabilizes unstable slopes and geological
formations.
g) Domestic and commercial water demand has increased during recent years. Forest clearance and removal of the
top layer of soils have resulted in decreasing groundwater level and consequent drying up of the streams during
most of the year.
Production and productivity of major crops
Figure 16 – Production of major food crops in Zone 1
Figure 17 – Productivity of major crops in Zone 1
58.7
3.2 30.8
14.4 1.2 8.1
31.4
205.9
0
50
100
150
200
250
Rice Wheat Maize Other Cereals
Pulses Oil Seeds Jute TMC
Zone 1: Production of major crops ('000 tonnes) 2006-07
1866 1428
2116
1207
609 564
12.7
4254
Rice Wheat Maize Other Cereals
Pulses Oil Seeds Jute TMC
Zone 1: Productivity of major food crops (Kg/ha) 2006-07
14
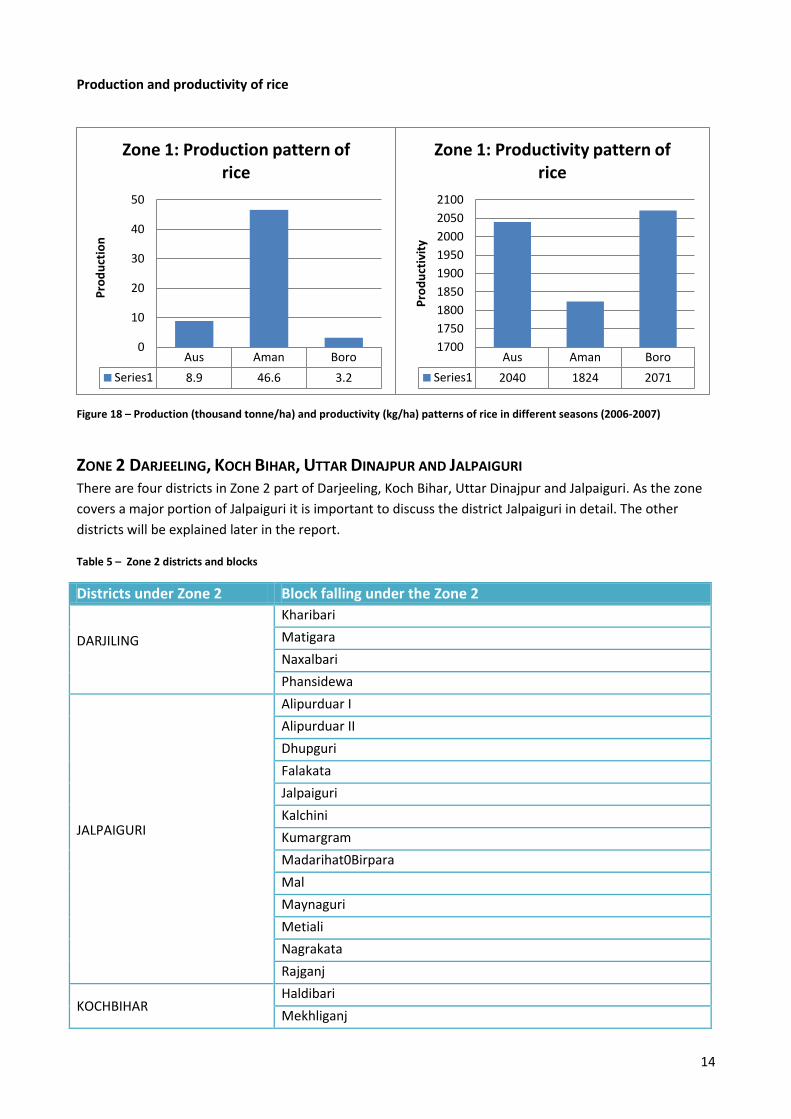
Production and productivity of rice
Figure 18 – Production (thousand tonne/ha) and productivity (kg/ha) patterns of rice in different seasons (2006-2007)
ZONE 2 DARJEELING, KOCH BIHAR, UTTAR DINAJPUR AND JALPAIGURI There are four districts in Zone 2 part of Darjeeling, Koch Bihar, Uttar Dinajpur and Jalpaiguri. As the zone
covers a major portion of Jalpaiguri it is important to discuss the district Jalpaiguri in detail. The other
districts will be explained later in the report.
Table 5 – Zone 2 districts and blocks
Districts under Zone 2 Block falling under the Zone 2
DARJILING
Kharibari
Matigara
Naxalbari
Phansidewa
JALPAIGURI
Alipurduar I
Alipurduar II
Dhupguri
Falakata
Jalpaiguri
Kalchini
Kumargram
Madarihat0Birpara
Mal
Maynaguri
Metiali
Nagrakata
Rajganj
KOCHBIHAR Haldibari
Mekhliganj
Aus Aman Boro
Series1 8.9 46.6 3.2
0
10
20
30
40
50
Pro
du
ctio
n
Zone 1: Production pattern of rice
Aus Aman Boro
Series1 2040 1824 2071
1700
1750
1800
1850
1900
1950
2000
2050
2100
Pro
du
ctiv
ity
Zone 1: Productivity pattern of rice
15
UTTAR DINAJPUR Chopra
Islampur
Criss-crossed with streams, rivers and hills, the district is primarily rural with over 80 percent of the population residing in rural areas. The district is the gateway to the northeastern states and Bhutan. There is a high migrant population of the different cultural groups (Ranjbanshi, Ravas, Totos, Metch, Santhals, Madasia and Oraons), which has created a unique cultural harmony rarely seen in other districts of West Bengal (NIC-Jalpaiguri, 2011).
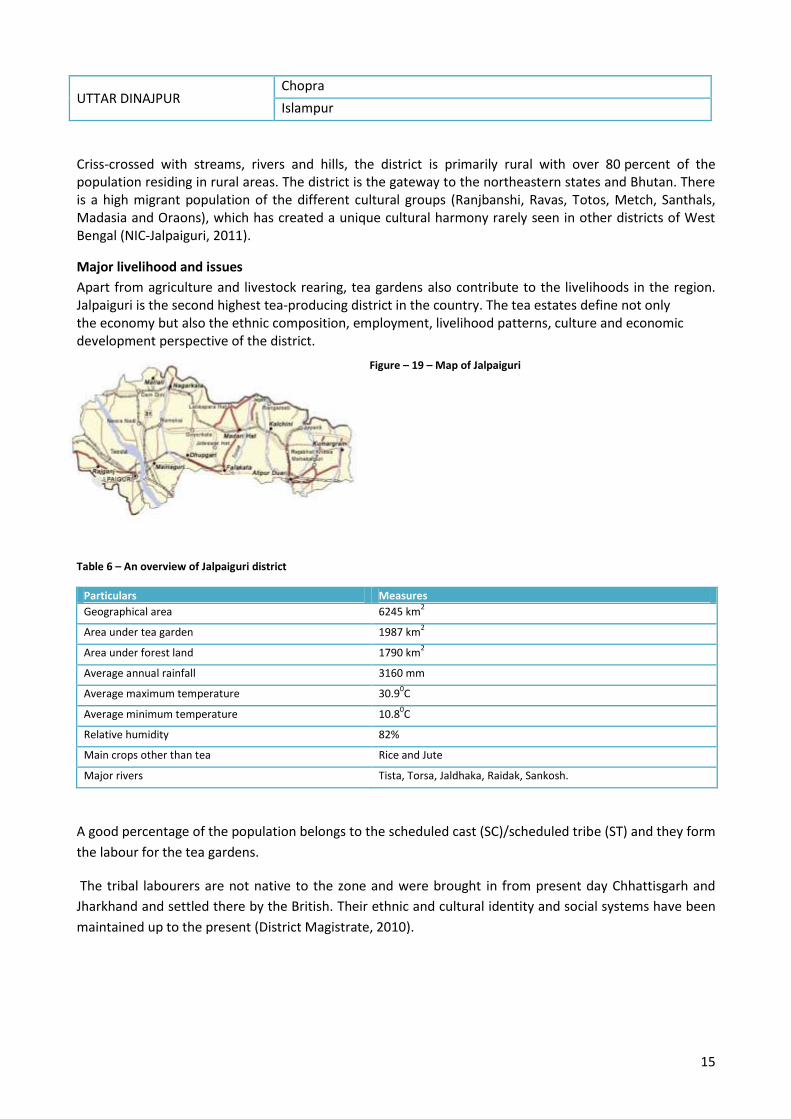
Major livelihood and issues
Apart from agriculture and livestock rearing, tea gardens also contribute to the livelihoods in the region. Jalpaiguri is the second highest tea-producing district in the country. The tea estates define not only the economy but also the ethnic composition, employment, livelihood patterns, culture and economic development perspective of the district.
Figure – 19 – Map of Jalpaiguri
Table 6 – An overview of Jalpaiguri district
Particulars Measures
Geographical area 6245 km2
Area under tea garden 1987 km2
Area under forest land 1790 km2
Average annual rainfall 3160 mm
Average maximum temperature 30.90C
Average minimum temperature 10.80C
Relative humidity 82%
Main crops other than tea Rice and Jute
Major rivers Tista, Torsa, Jaldhaka, Raidak, Sankosh.
A good percentage of the population belongs to the scheduled cast (SC)/scheduled tribe (ST) and they form
the labour for the tea gardens.
The tribal labourers are not native to the zone and were brought in from present day Chhattisgarh and
Jharkhand and settled there by the British. Their ethnic and cultural identity and social systems have been
maintained up to the present (District Magistrate, 2010).
16
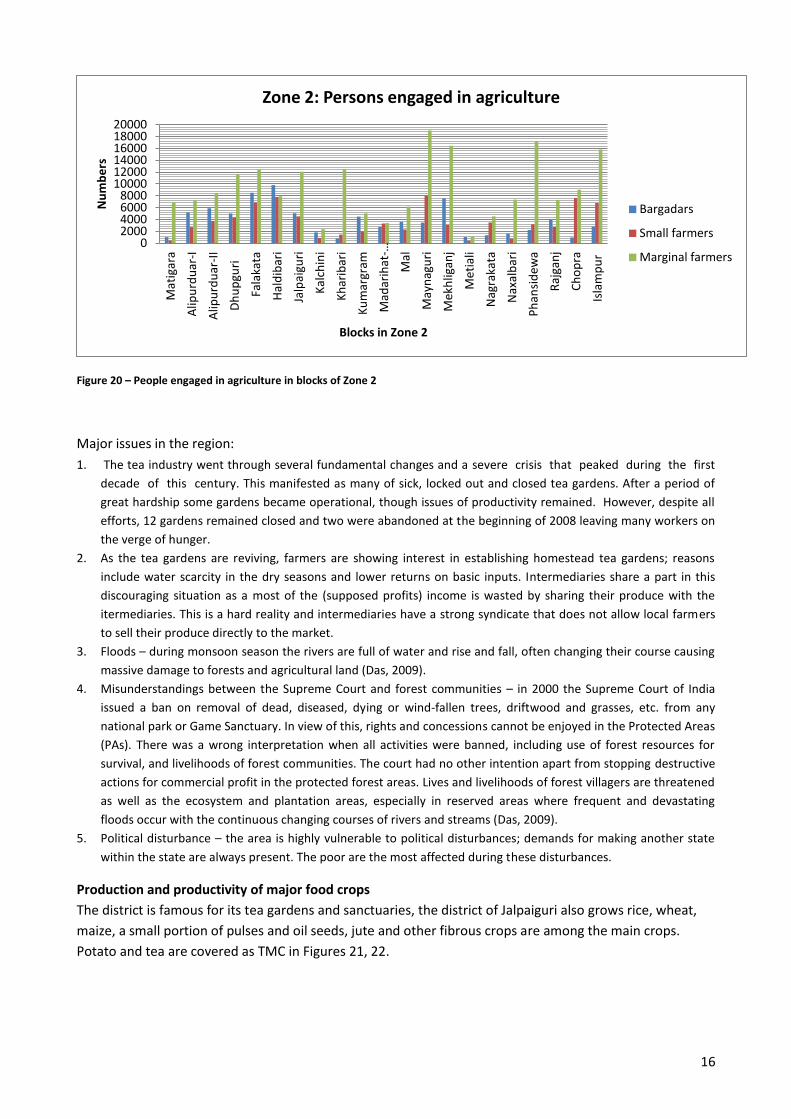
Figure 20 – People engaged in agriculture in blocks of Zone 2
Major issues in the region:
1. The tea industry went through several fundamental changes and a severe crisis that peaked during the first
decade of this century. This manifested as many of sick, locked out and closed tea gardens. After a period of
great hardship some gardens became operational, though issues of productivity remained. However, despite all
efforts, 12 gardens remained closed and two were abandoned at the beginning of 2008 leaving many workers on
the verge of hunger.
2. As the tea gardens are reviving, farmers are showing interest in establishing homestead tea gardens; reasons
include water scarcity in the dry seasons and lower returns on basic inputs. Intermediaries share a part in this
discouraging situation as a most of the (supposed profits) income is wasted by sharing their produce with the
itermediaries. This is a hard reality and intermediaries have a strong syndicate that does not allow local farmers
to sell their produce directly to the market.
3. Floods – during monsoon season the rivers are full of water and rise and fall, often changing their course causing
massive damage to forests and agricultural land (Das, 2009).
4. Misunderstandings between the Supreme Court and forest communities – in 2000 the Supreme Court of India
issued a ban on removal of dead, diseased, dying or wind-fallen trees, driftwood and grasses, etc. from any
national park or Game Sanctuary. In view of this, rights and concessions cannot be enjoyed in the Protected Areas
(PAs). There was a wrong interpretation when all activities were banned, including use of forest resources for
survival, and livelihoods of forest communities. The court had no other intention apart from stopping destructive
actions for commercial profit in the protected forest areas. Lives and livelihoods of forest villagers are threatened
as well as the ecosystem and plantation areas, especially in reserved areas where frequent and devastating
floods occur with the continuous changing courses of rivers and streams (Das, 2009).
5. Political disturbance – the area is highly vulnerable to political disturbances; demands for making another state
within the state are always present. The poor are the most affected during these disturbances.
Production and productivity of major food crops
The district is famous for its tea gardens and sanctuaries, the district of Jalpaiguri also grows rice, wheat,
maize, a small portion of pulses and oil seeds, jute and other fibrous crops are among the main crops.
Potato and tea are covered as TMC in Figures 21, 22.
0 2000 4000 6000 8000
10000 12000 14000 16000 18000 20000
Mat
igar
a
Alip
urd
uar
-I
Alip
urd
uar
-II
Dh
up
guri
Fala
kata
Hal
dib
ari
Jalp
aigu
ri
Kal
chin
i
Kh
arib
ari
Ku
mar
gram
Mad
arih
at-…
Mal
May
nag
uri
Mek
hlig
anj
Met
iali
Nag
raka
ta
Nax
alb
ari
Ph
ansi
dew
a
Raj
gan
j
Ch
op
ra
Isla
mp
ur
Nu
mb
ers
Blocks in Zone 2
Zone 2: Persons engaged in agriculture
Bargadars
Small farmers
Marginal farmers
17
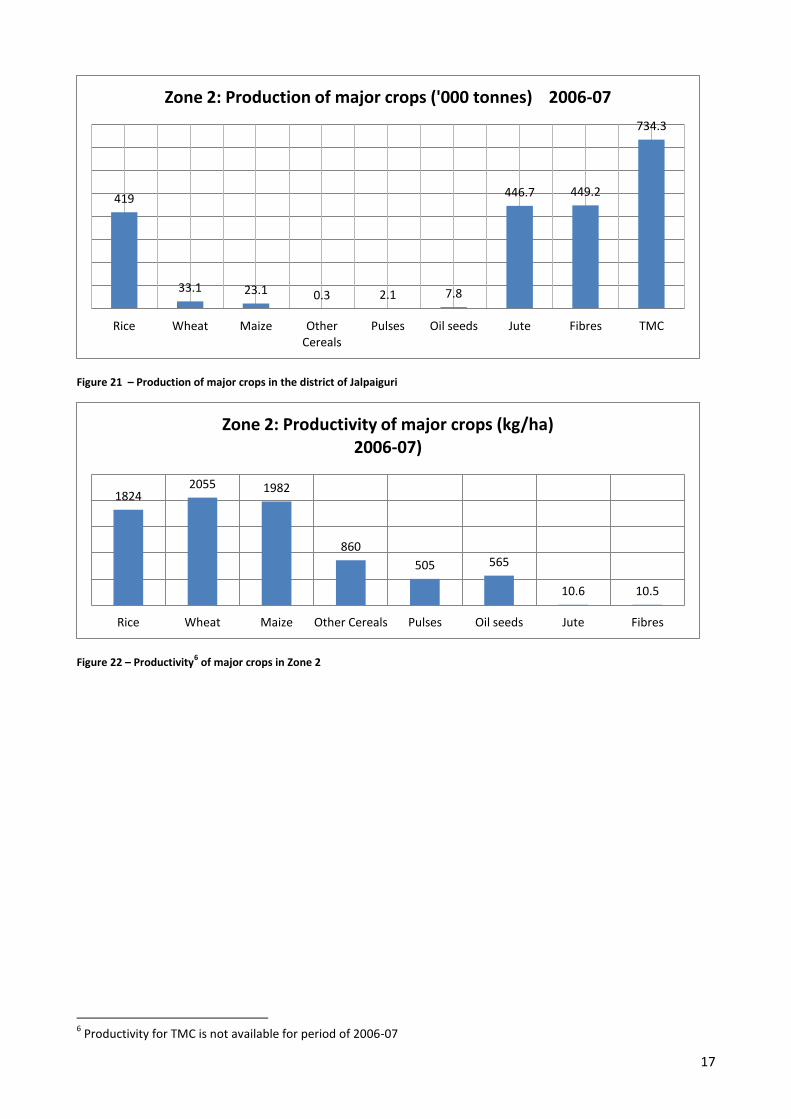
Figure 21 – Production of major crops in the district of Jalpaiguri
Figure 22 – Productivity6 of major crops in Zone 2
6 Productivity for TMC is not available for period of 2006-07
419
33.1 23.1 0.3 2.1 7.8
446.7 449.2
734.3
Rice Wheat Maize Other Cereals
Pulses Oil seeds Jute Fibres TMC
Zone 2: Production of major crops ('000 tonnes) 2006-07
1824 2055 1982
860
505 565
10.6 10.5
Rice Wheat Maize Other Cereals Pulses Oil seeds Jute Fibres
Zone 2: Productivity of major crops (kg/ha) 2006-07)
18
Production and productivity of rice
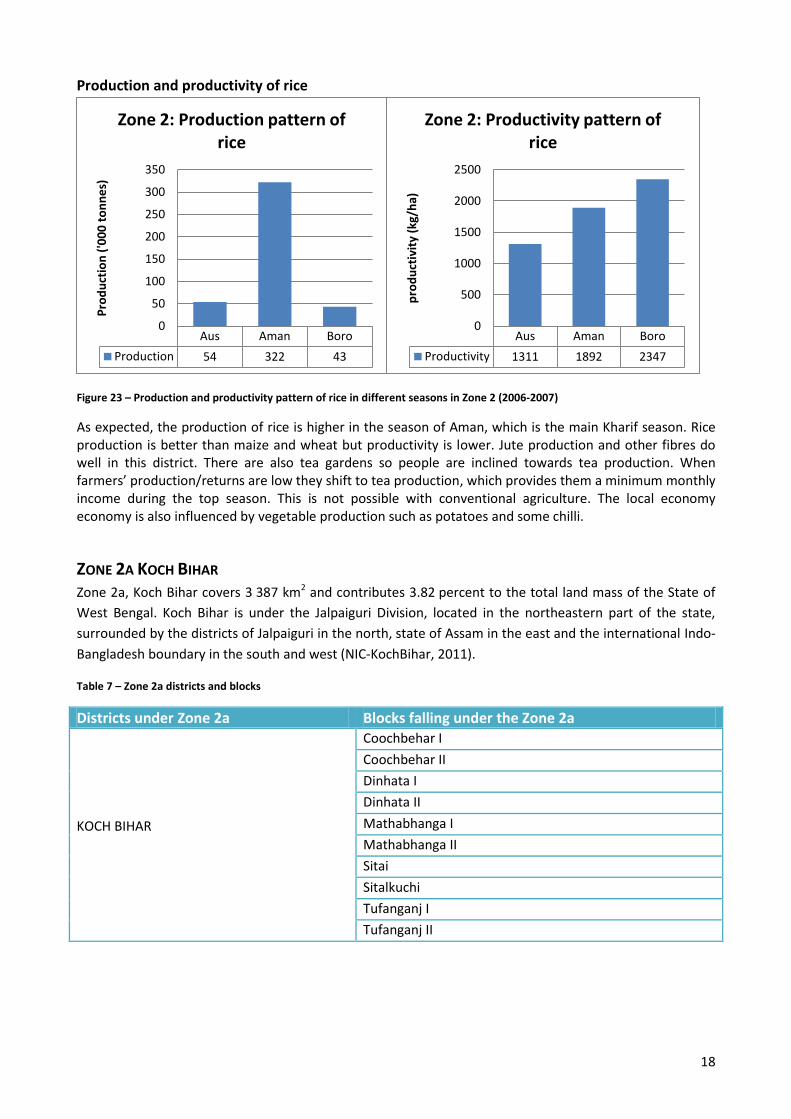
Figure 23 – Production and productivity pattern of rice in different seasons in Zone 2 (2006-2007)
As expected, the production of rice is higher in the season of Aman, which is the main Kharif season. Rice production is better than maize and wheat but productivity is lower. Jute production and other fibres do well in this district. There are also tea gardens so people are inclined towards tea production. When farmers’ production/returns are low they shift to tea production, which provides them a minimum monthly income during the top season. This is not possible with conventional agriculture. The local economy economy is also influenced by vegetable production such as potatoes and some chilli.
ZONE 2A KOCH BIHAR Zone 2a, Koch Bihar covers 3 387 km2 and contributes 3.82 percent to the total land mass of the State of
West Bengal. Koch Bihar is under the Jalpaiguri Division, located in the northeastern part of the state,
surrounded by the districts of Jalpaiguri in the north, state of Assam in the east and the international Indo-
Bangladesh boundary in the south and west (NIC-KochBihar, 2011).
Table 7 – Zone 2a districts and blocks
Districts under Zone 2a Blocks falling under the Zone 2a
KOCH BIHAR
Coochbehar I
Coochbehar II
Dinhata I
Dinhata II
Mathabhanga I
Mathabhanga II
Sitai
Sitalkuchi
Tufanganj I
Tufanganj II
Aus Aman Boro
Production 54 322 43
0
50
100
150
200
250
300
350
Pro
du
ctio
n (
'00
0 t
on
ne
s)
Zone 2: Production pattern of rice
Aus Aman Boro
Productivity 1311 1892 2347
0
500
1000
1500
2000
2500
pro
du
ctiv
ity
(kg/
ha)
Zone 2: Productivity pattern of rice
19
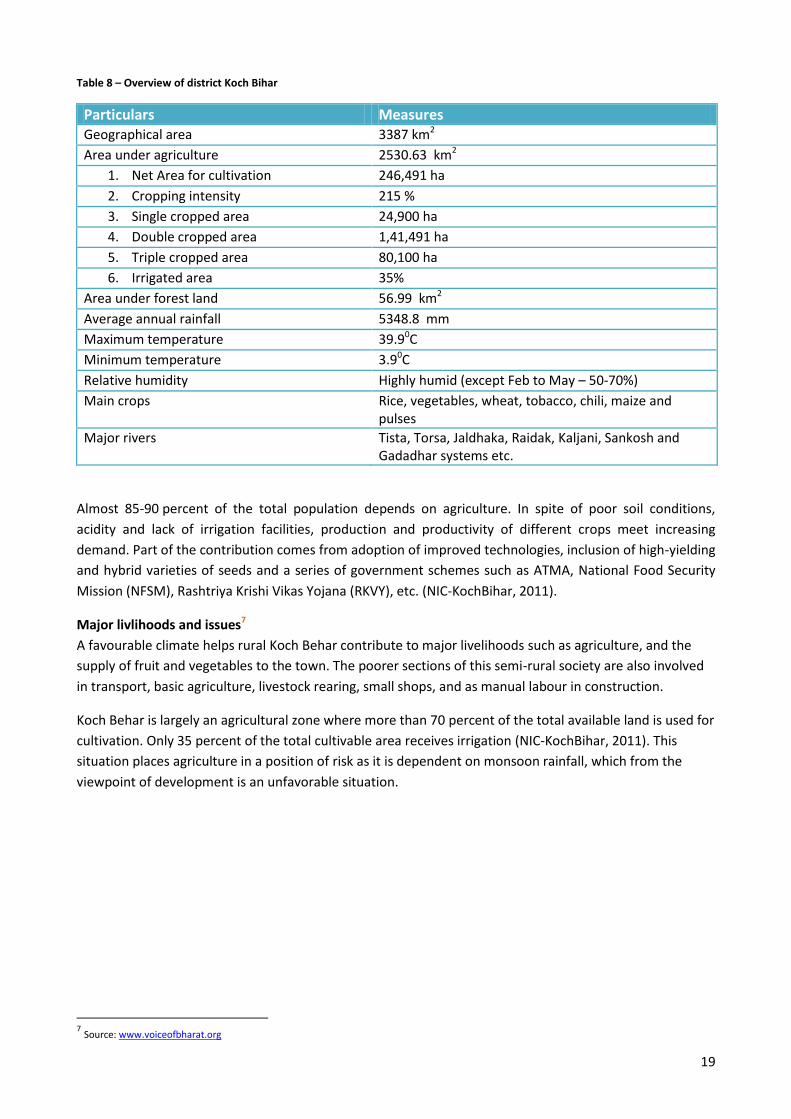
Table 8 – Overview of district Koch Bihar
Particulars Measures Geographical area 3387 km2
Area under agriculture 2530.63 km2
1. Net Area for cultivation 246,491 ha
2. Cropping intensity 215 %
3. Single cropped area 24,900 ha
4. Double cropped area 1,41,491 ha
5. Triple cropped area 80,100 ha
6. Irrigated area 35%
Area under forest land 56.99 km2
Average annual rainfall 5348.8 mm
Maximum temperature 39.90C
Minimum temperature 3.90C
Relative humidity Highly humid (except Feb to May – 50-70%)
Main crops Rice, vegetables, wheat, tobacco, chili, maize and pulses
Major rivers Tista, Torsa, Jaldhaka, Raidak, Kaljani, Sankosh and Gadadhar systems etc.
Almost 85-90 percent of the total population depends on agriculture. In spite of poor soil conditions,
acidity and lack of irrigation facilities, production and productivity of different crops meet increasing
demand. Part of the contribution comes from adoption of improved technologies, inclusion of high-yielding
and hybrid varieties of seeds and a series of government schemes such as ATMA, National Food Security
Mission (NFSM), Rashtriya Krishi Vikas Yojana (RKVY), etc. (NIC-KochBihar, 2011).
Major livlihoods and issues7
A favourable climate helps rural Koch Behar contribute to major livelihoods such as agriculture, and the
supply of fruit and vegetables to the town. The poorer sections of this semi-rural society are also involved
in transport, basic agriculture, livestock rearing, small shops, and as manual labour in construction.
Koch Behar is largely an agricultural zone where more than 70 percent of the total available land is used for
cultivation. Only 35 percent of the total cultivable area receives irrigation (NIC-KochBihar, 2011). This
situation places agriculture in a position of risk as it is dependent on monsoon rainfall, which from the
viewpoint of development is an unfavorable situation.
7 Source: www.voiceofbharat.org
20
Major social and developmental challenges:
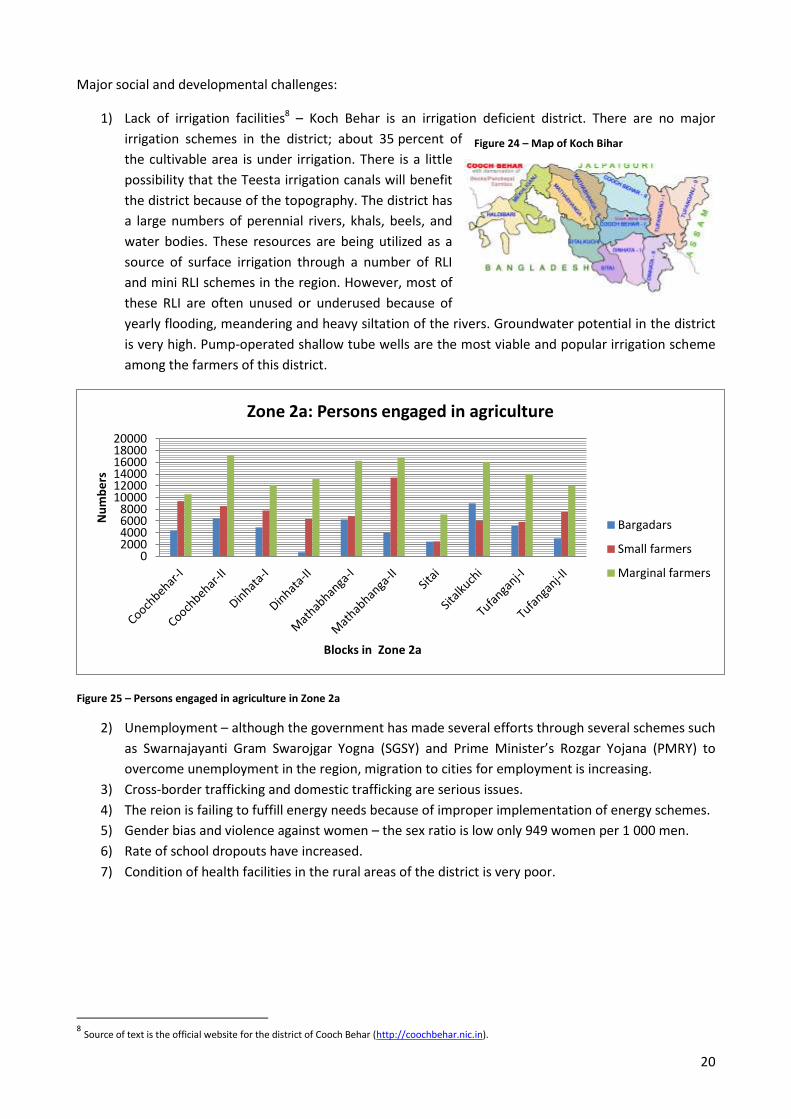
1) Lack of irrigation facilities8 – Koch Behar is an irrigation deficient district. There are no major
irrigation schemes in the district; about 35 percent of
the cultivable area is under irrigation. There is a little
possibility that the Teesta irrigation canals will benefit
the district because of the topography. The district has
a large numbers of perennial rivers, khals, beels, and
water bodies. These resources are being utilized as a
source of surface irrigation through a number of RLI
and mini RLI schemes in the region. However, most of
these RLI are often unused or underused because of
yearly flooding, meandering and heavy siltation of the rivers. Groundwater potential in the district
is very high. Pump-operated shallow tube wells are the most viable and popular irrigation scheme
among the farmers of this district.
Figure 25 – Persons engaged in agriculture in Zone 2a
2) Unemployment – although the government has made several efforts through several schemes such
as Swarnajayanti Gram Swarojgar Yogna (SGSY) and Prime Minister’s Rozgar Yojana (PMRY) to
overcome unemployment in the region, migration to cities for employment is increasing.
3) Cross-border trafficking and domestic trafficking are serious issues.
4) The reion is failing to fuffill energy needs because of improper implementation of energy schemes.
5) Gender bias and violence against women – the sex ratio is low only 949 women per 1 000 men.
6) Rate of school dropouts have increased.
7) Condition of health facilities in the rural areas of the district is very poor.
8 Source of text is the official website for the district of Cooch Behar (http://coochbehar.nic.in).
0 2000 4000 6000 8000
10000 12000 14000 16000 18000 20000
Nu
mb
ers
Blocks in Zone 2a
Zone 2a: Persons engaged in agriculture
Bargadars
Small farmers
Marginal farmers
Figure 24 – Map of Koch Bihar
21
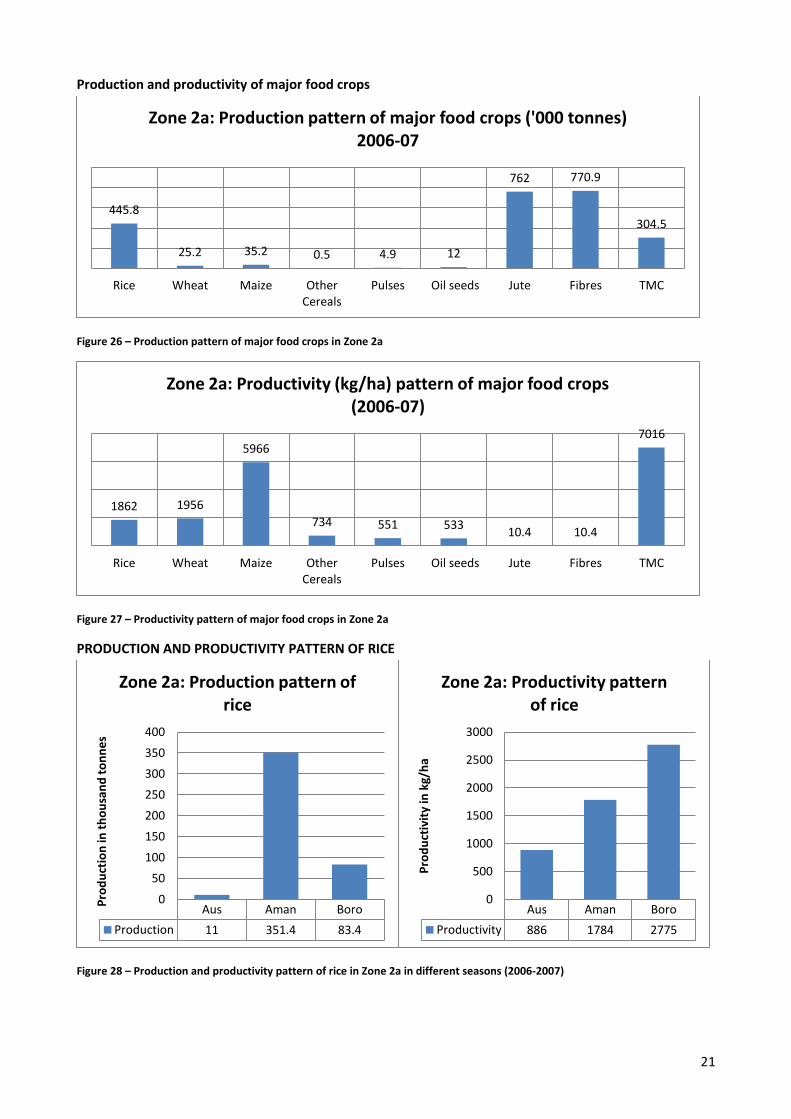
Production and productivity of major food crops
Figure 26 – Production pattern of major food crops in Zone 2a
Figure 27 – Productivity pattern of major food crops in Zone 2a
PRODUCTION AND PRODUCTIVITY PATTERN OF RICE
Figure 28 – Production and productivity pattern of rice in Zone 2a in different seasons (2006-2007)
445.8
25.2 35.2 0.5 4.9 12
762 770.9
304.5
Rice Wheat Maize Other Cereals
Pulses Oil seeds Jute Fibres TMC
Zone 2a: Production pattern of major food crops ('000 tonnes) 2006-07
1862 1956
5966
734 551 533 10.4 10.4
7016
Rice Wheat Maize Other Cereals
Pulses Oil seeds Jute Fibres TMC
Zone 2a: Productivity (kg/ha) pattern of major food crops (2006-07)
Aus Aman Boro
Production 11 351.4 83.4
0
50
100
150
200
250
300
350
400
Pro
du
ctio
n in
th
ou
san
d t
on
ne
s
Zone 2a: Production pattern of rice
Aus Aman Boro
Productivity 886 1784 2775
0
500
1000
1500
2000
2500
3000
Pro
du
ctiv
ity
in k
g/h
a
Zone 2a: Productivity pattern of rice
22
ZONE 3 – DAKSHIN DINAJPUR, MALDAH, MURSHIDABAD AND UTTAR DINAJPUR
There are four districts in Zone 3 Dakshin Dinajpur, Maldah, Murshidabad and Uttar Dinajpur.
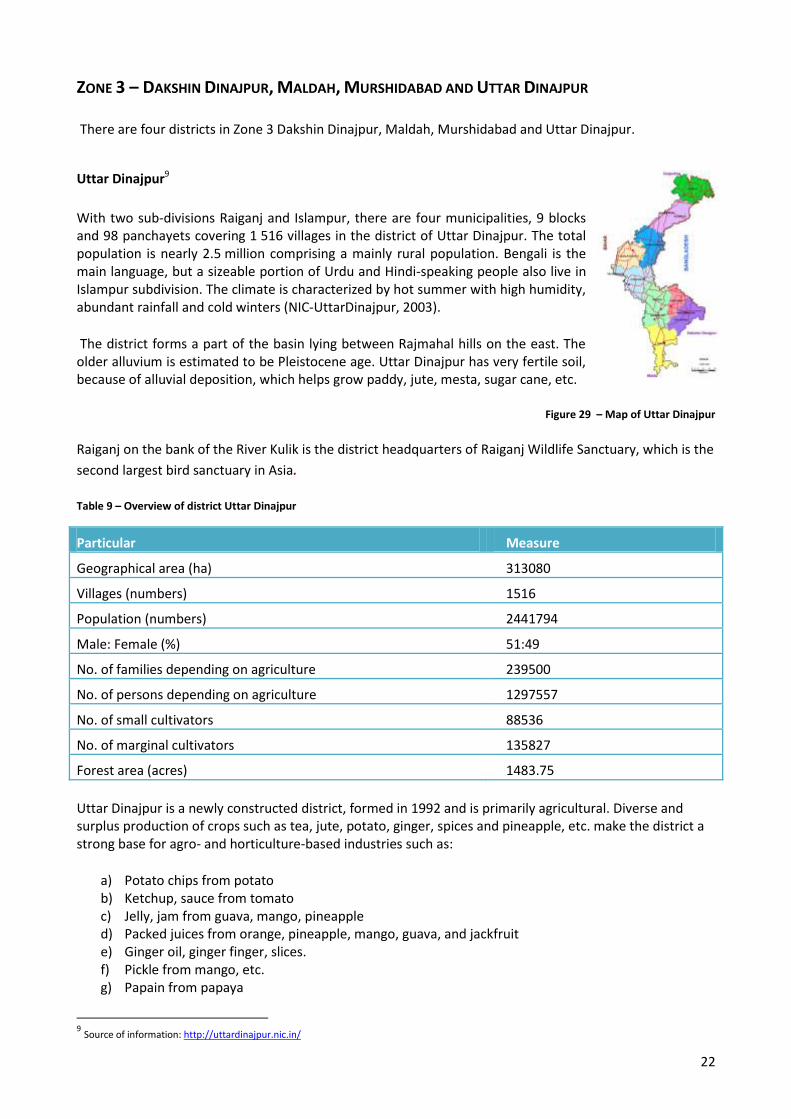
Uttar Dinajpur9
With two sub-divisions Raiganj and Islampur, there are four municipalities, 9 blocks and 98 panchayets covering 1 516 villages in the district of Uttar Dinajpur. The total population is nearly 2.5 million comprising a mainly rural population. Bengali is the main language, but a sizeable portion of Urdu and Hindi-speaking people also live in Islampur subdivision. The climate is characterized by hot summer with high humidity, abundant rainfall and cold winters (NIC-UttarDinajpur, 2003).
The district forms a part of the basin lying between Rajmahal hills on the east. The older alluvium is estimated to be Pleistocene age. Uttar Dinajpur has very fertile soil, because of alluvial deposition, which helps grow paddy, jute, mesta, sugar cane, etc.
Figure 29 – Map of Uttar Dinajpur
Raiganj on the bank of the River Kulik is the district headquarters of Raiganj Wildlife Sanctuary, which is the
second largest bird sanctuary in Asia.
Table 9 – Overview of district Uttar Dinajpur
Particular Measure
Geographical area (ha) 313080
Villages (numbers) 1516
Population (numbers) 2441794
Male: Female (%) 51:49
No. of families depending on agriculture 239500
No. of persons depending on agriculture 1297557
No. of small cultivators 88536
No. of marginal cultivators 135827
Forest area (acres) 1483.75
Uttar Dinajpur is a newly constructed district, formed in 1992 and is primarily agricultural. Diverse and surplus production of crops such as tea, jute, potato, ginger, spices and pineapple, etc. make the district a strong base for agro- and horticulture-based industries such as:
a) Potato chips from potato b) Ketchup, sauce from tomato c) Jelly, jam from guava, mango, pineapple d) Packed juices from orange, pineapple, mango, guava, and jackfruit e) Ginger oil, ginger finger, slices. f) Pickle from mango, etc. g) Papain from papaya
9 Source of information: http://uttardinajpur.nic.in/
23
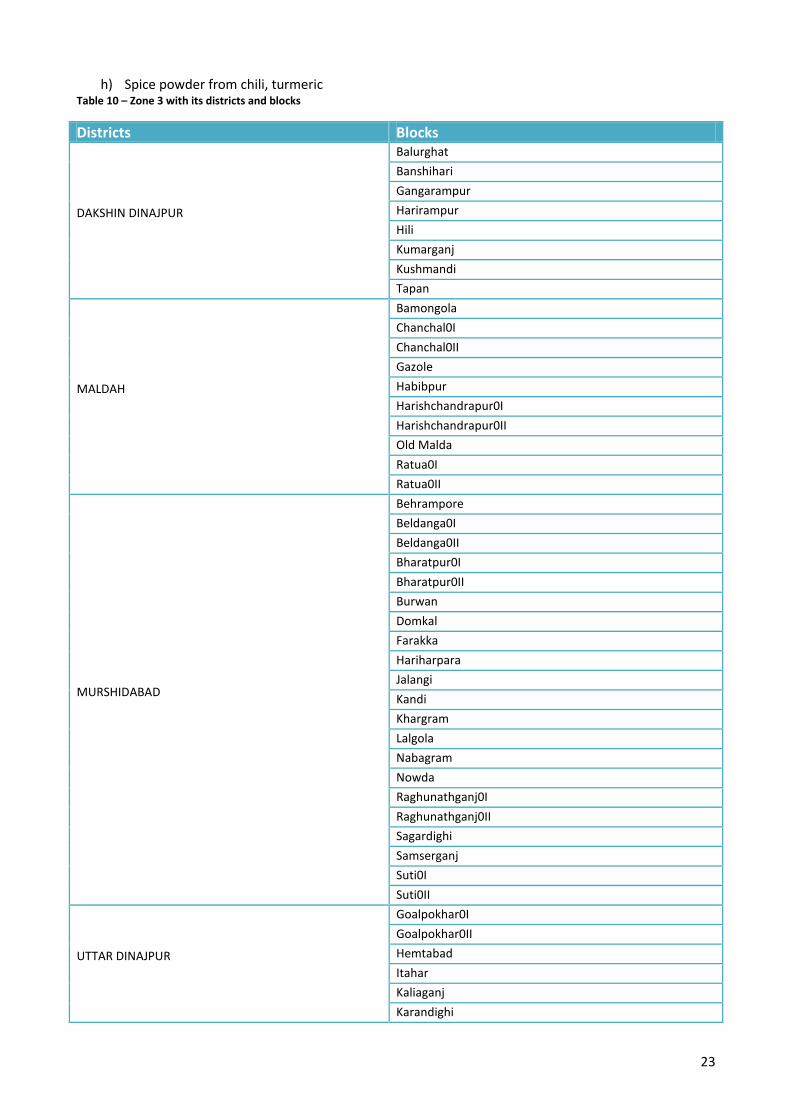
h) Spice powder from chili, turmeric Table 10 – Zone 3 with its districts and blocks
Districts Blocks
DAKSHIN DINAJPUR
Balurghat
Banshihari
Gangarampur
Harirampur
Hili
Kumarganj
Kushmandi
Tapan
MALDAH
Bamongola
Chanchal0I
Chanchal0II
Gazole
Habibpur
Harishchandrapur0I
Harishchandrapur0II
Old Malda
Ratua0I
Ratua0II
MURSHIDABAD
Behrampore
Beldanga0I
Beldanga0II
Bharatpur0I
Bharatpur0II
Burwan
Domkal
Farakka
Hariharpara
Jalangi
Kandi
Khargram
Lalgola
Nabagram
Nowda
Raghunathganj0I
Raghunathganj0II
Sagardighi
Samserganj
Suti0I
Suti0II
UTTAR DINAJPUR
Goalpokhar0I
Goalpokhar0II
Hemtabad
Itahar
Kaliaganj
Karandighi
24
Raiganj
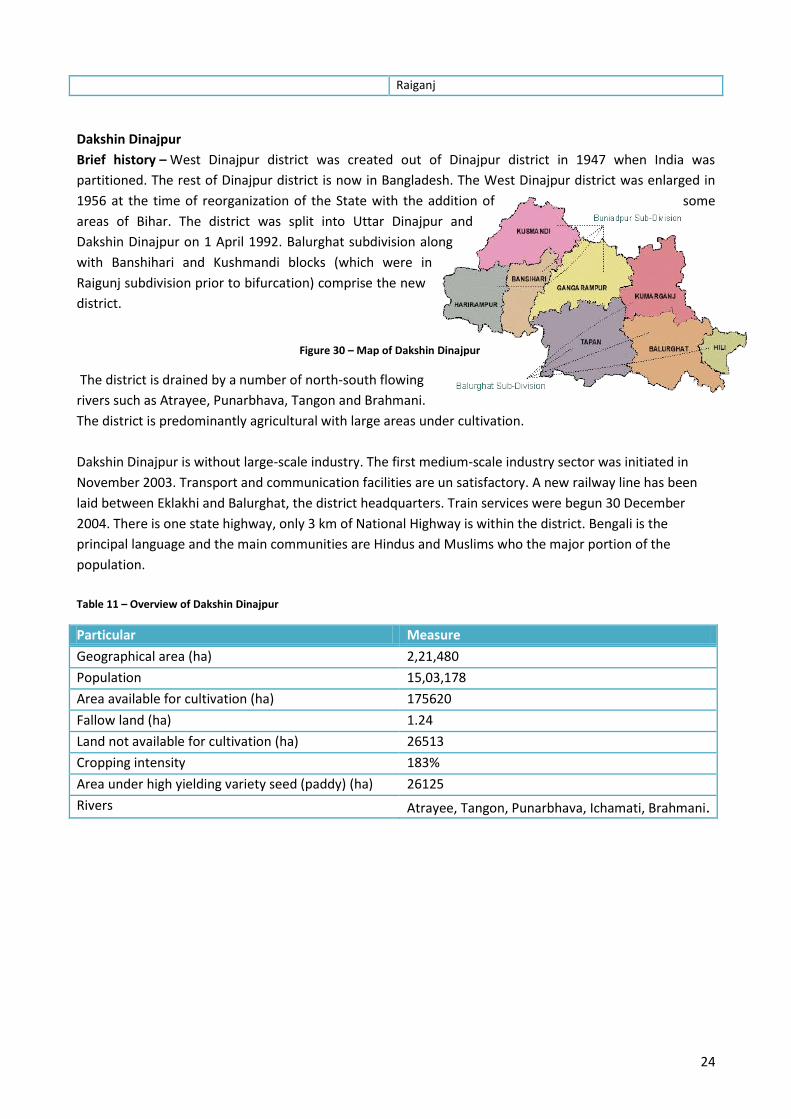
Dakshin Dinajpur
Brief history – West Dinajpur district was created out of Dinajpur district in 1947 when India was
partitioned. The rest of Dinajpur district is now in Bangladesh. The West Dinajpur district was enlarged in
1956 at the time of reorganization of the State with the addition of some
areas of Bihar. The district was split into Uttar Dinajpur and
Dakshin Dinajpur on 1 April 1992. Balurghat subdivision along
with Banshihari and Kushmandi blocks (which were in
Raigunj subdivision prior to bifurcation) comprise the new
district.
Figure 30 – Map of Dakshin Dinajpur
The district is drained by a number of north-south flowing
rivers such as Atrayee, Punarbhava, Tangon and Brahmani.
The district is predominantly agricultural with large areas under cultivation.
Dakshin Dinajpur is without large-scale industry. The first medium-scale industry sector was initiated in
November 2003. Transport and communication facilities are un satisfactory. A new railway line has been
laid between Eklakhi and Balurghat, the district headquarters. Train services were begun 30 December
2004. There is one state highway, only 3 km of National Highway is within the district. Bengali is the
principal language and the main communities are Hindus and Muslims who the major portion of the
population.
Table 11 – Overview of Dakshin Dinajpur
Particular Measure
Geographical area (ha) 2,21,480
Population 15,03,178
Area available for cultivation (ha) 175620
Fallow land (ha) 1.24
Land not available for cultivation (ha) 26513
Cropping intensity 183%
Area under high yielding variety seed (paddy) (ha) 26125
Rivers Atrayee, Tangon, Punarbhava, Ichamati, Brahmani.
25
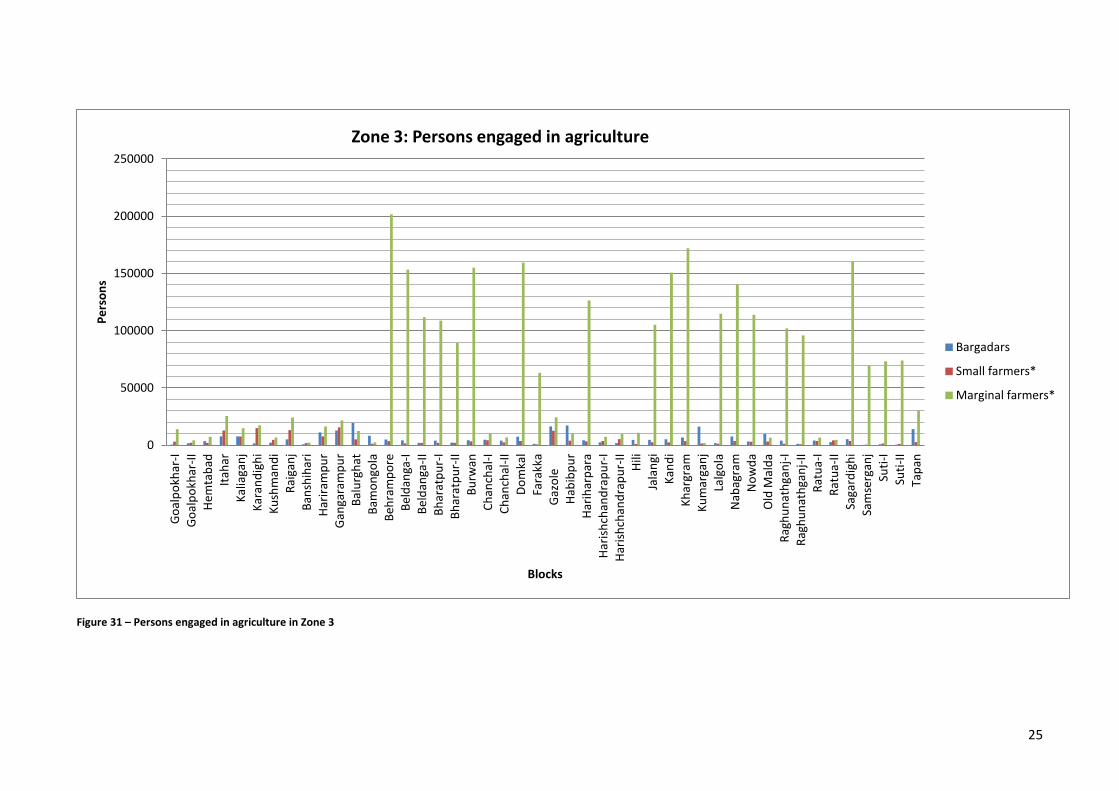
Figure 31 – Persons engaged in agriculture in Zone 3
0
50000
100000
150000
200000
250000 G
oal
po
khar
-I
Go
alp
okh
ar-I
I H
emta
bad
It
ahar
K
alia
gan
j K
aran
dig
hi
Ku
shm
and
i R
aiga
nj
Ban
shih
ari
Har
iram
pu
r G
anga
ram
pu
r B
alu
rgh
at
Bam
on
gola
B
ehra
mp
ore
B
eld
anga
-I
Bel
dan
ga-I
I B
har
atp
ur-
I B
har
atp
ur-
II
Bu
rwan
C
han
chal
-I
Ch
anch
al-I
I D
om
kal
Fara
kka
Gaz
ole
Hab
ibp
ur
Har
ihar
par
a H
aris
hch
and
rap
ur-
I H
aris
hch
and
rap
ur-
II
Hili
Ja
lan
gi
Kan
di
Kh
argr
am
Ku
mar
gan
j La
lgo
la
Nab
agra
m
No
wd
a O
ld M
ald
a R
agh
un
ath
gan
j-I
Rag
hu
nat
hga
nj-
II
Rat
ua-
I R
atu
a-II
Sa
gard
igh
i Sa
mse
rgan
j Su
ti-I
Su
ti-I
I Ta
pan
Pe
rso
ns
Blocks
Zone 3: Persons engaged in agriculture
Bargadars
Small farmers*
Marginal farmers*

26
Maldah
The gateway of North Bengal, Malda, was once the capital of Gour-Banga and covers 3 456 km2. The land is classified into Tal, Diara, and Barind. It is an area of archeological interest (NIC-Malda 2010).
During the eighteenth century the district was known for its prosperous cotton and silk industries. Constituted as a municipality in 1867, rice, jute, legumes and oilseeds are among the main crops. Mulberry plantations and mango orchards occupy large areas; the mango trade and silk manufacture are the main economic activities (Natura Beyond, 2011).
Figure 32 – Map of Maldah
Table 12 – Overview of District Maldah
Particular Measure
Geographical Area (ha) 373300
No. of Villages 3701
Total Population of the District 3290160
Normal Rainfall 1453 mm
Forest (ha) 1694.3
Current Fallow Land (ha) 52800
Other Fallow land that Current Fallow (ha) 300
Net Area under Cultivation (ha) 22849
Marginal Holding (below 1.0 acre) 343677; Area-157309 ha
Small Holding (1.0-2.0 acre) 74863; Area-112926 ha
Medium Holding (4.0-10.0acre) 7528; Area-41342 ha
Large Holding (10.0 acres and above) 120; Area-1232 ha
Vested land distributed 30332.00 ha
Area Irrigated 120067 ha
Electricity consumption ('000 KWH)
a) Domestic 77560
b) Commercial 13454
c) Industrial 16199
d) Public Lighting 598
e) Agri-irrigation & Dewatering 31627
f) Public water works & Sewerage Pump 4187
27
Major livelihoods and issues
Zone 3 may be considered a ‘challenged’ zone; more than 50 percent of the population are small-scale
farmers and 12-31 percent are landless (IRRI, 2011). The local economy is dependent on agriculture and
small-scale industries. Main constraints to the economy are poor market service, poor access to farm
mechanization and increasing population.
Major social and development challenges:
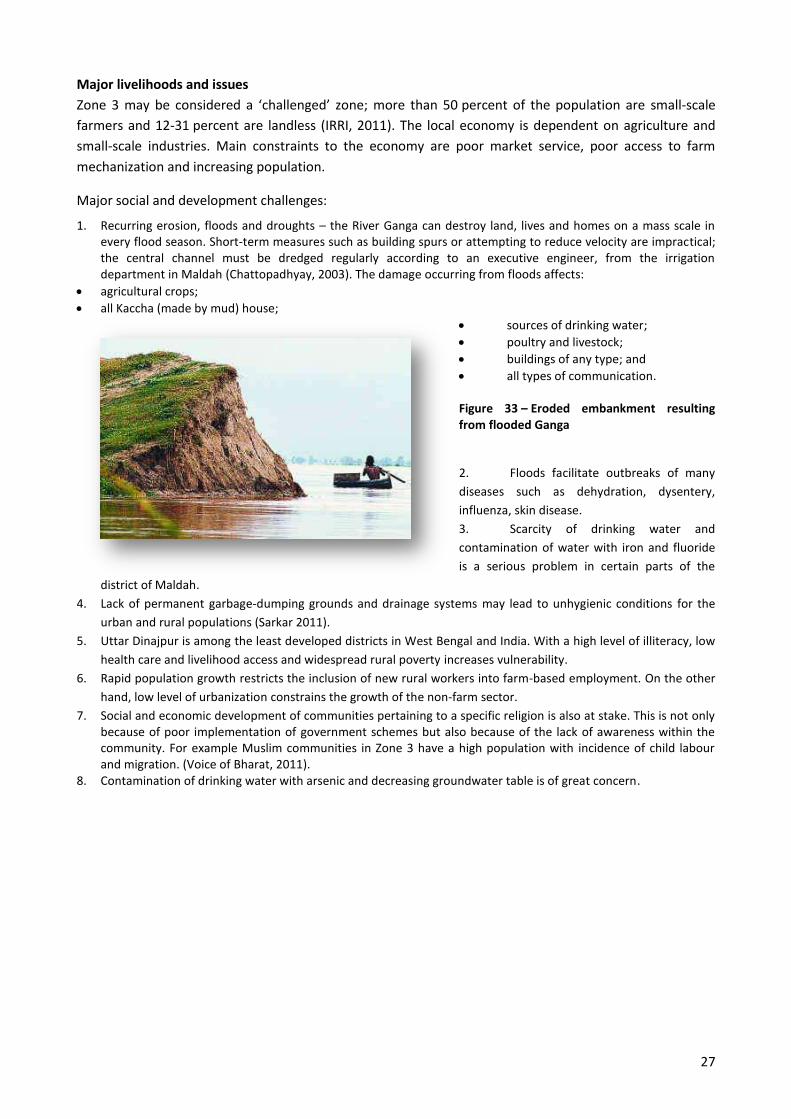
1. Recurring erosion, floods and droughts – the River Ganga can destroy land, lives and homes on a mass scale in every flood season. Short-term measures such as building spurs or attempting to reduce velocity are impractical; the central channel must be dredged regularly according to an executive engineer, from the irrigation department in Maldah (Chattopadhyay, 2003). The damage occurring from floods affects:
agricultural crops;
all Kaccha (made by mud) house;
sources of drinking water;
poultry and livestock;
buildings of any type; and
all types of communication. Figure 33 – Eroded embankment resulting from flooded Ganga
2. Floods facilitate outbreaks of many
diseases such as dehydration, dysentery,
influenza, skin disease.
3. Scarcity of drinking water and
contamination of water with iron and fluoride
is a serious problem in certain parts of the
district of Maldah.
4. Lack of permanent garbage-dumping grounds and drainage systems may lead to unhygienic conditions for the
urban and rural populations (Sarkar 2011).
5. Uttar Dinajpur is among the least developed districts in West Bengal and India. With a high level of illiteracy, low
health care and livelihood access and widespread rural poverty increases vulnerability.
6. Rapid population growth restricts the inclusion of new rural workers into farm-based employment. On the other
hand, low level of urbanization constrains the growth of the non-farm sector.
7. Social and economic development of communities pertaining to a specific religion is also at stake. This is not only because of poor implementation of government schemes but also because of the lack of awareness within the community. For example Muslim communities in Zone 3 have a high population with incidence of child labour and migration. (Voice of Bharat, 2011).
8. Contamination of drinking water with arsenic and decreasing groundwater table is of great concern.
28
Production and productivity of major food crops
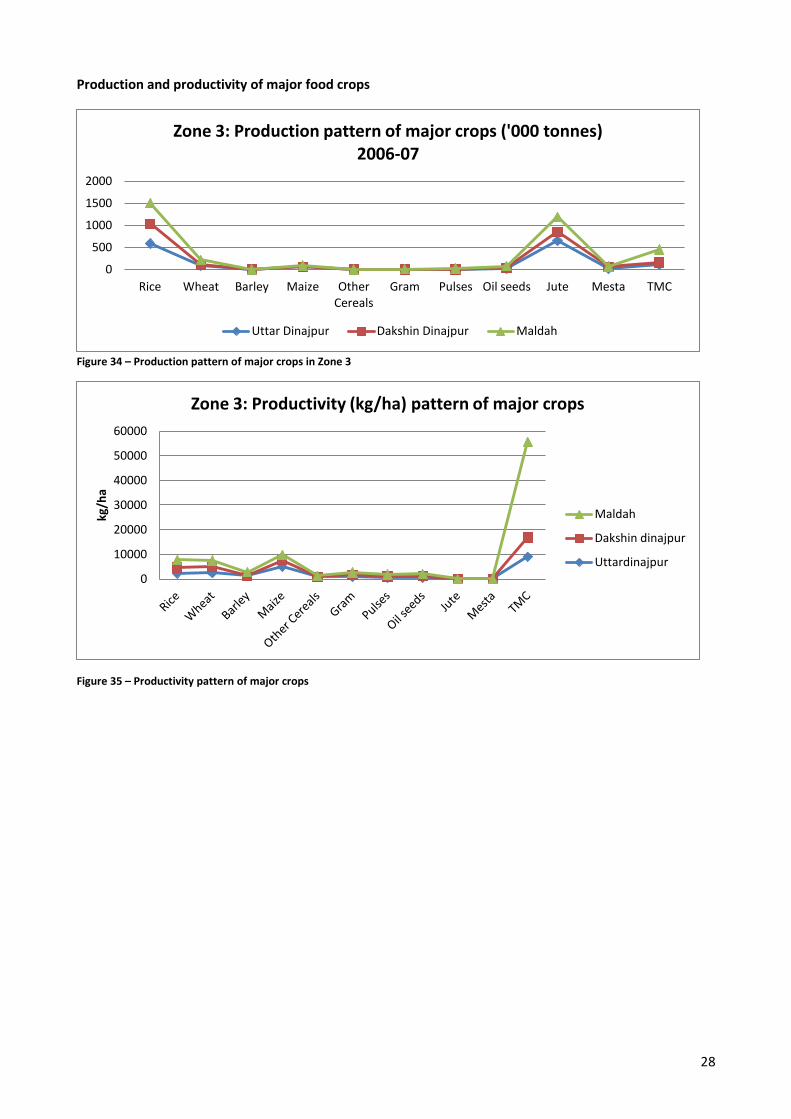
Figure 34 – Production pattern of major crops in Zone 3
Figure 35 – Productivity pattern of major crops
0
500
1000
1500
2000
Rice Wheat Barley Maize Other Cereals
Gram Pulses Oil seeds Jute Mesta TMC
Zone 3: Production pattern of major crops ('000 tonnes) 2006-07
Uttar Dinajpur Dakshin Dinajpur Maldah
0
10000
20000
30000
40000
50000
60000
kg/h
a
Zone 3: Productivity (kg/ha) pattern of major crops
Maldah
Dakshin dinajpur
Uttardinajpur
29
Production and productivity of rice
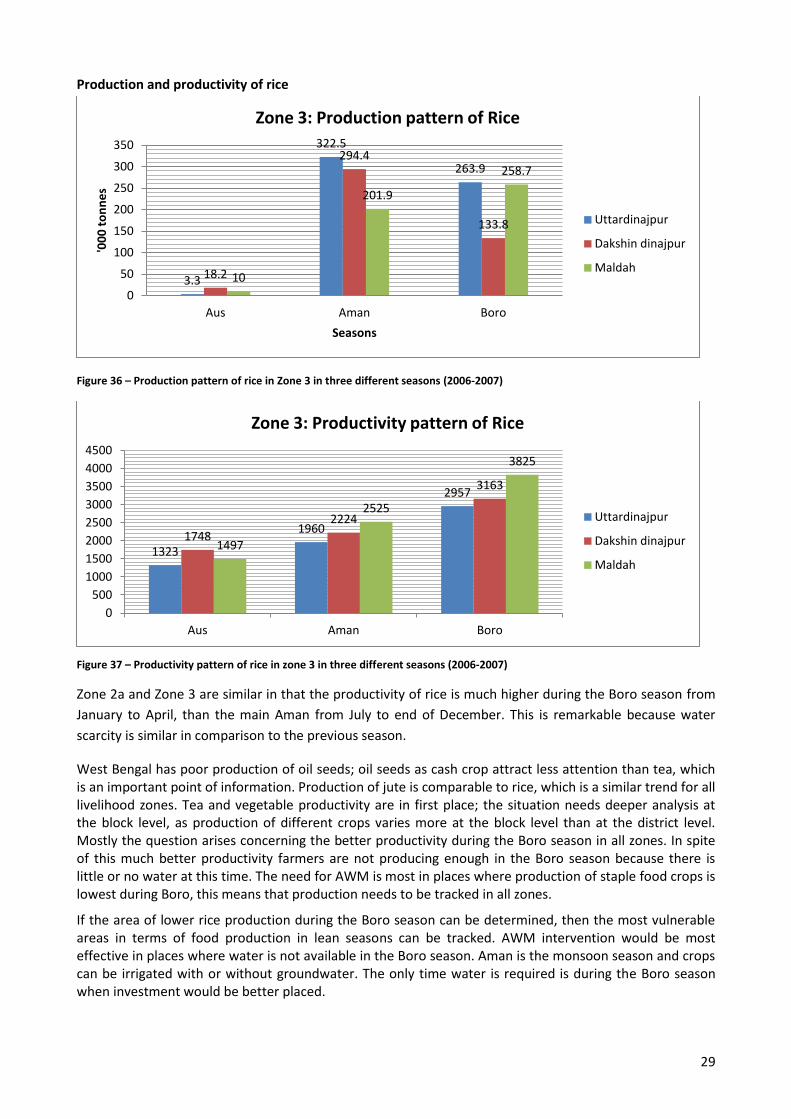
Figure 36 – Production pattern of rice in Zone 3 in three different seasons (2006-2007)
Figure 37 – Productivity pattern of rice in zone 3 in three different seasons (2006-2007)
Zone 2a and Zone 3 are similar in that the productivity of rice is much higher during the Boro season from
January to April, than the main Aman from July to end of December. This is remarkable because water
scarcity is similar in comparison to the previous season.
West Bengal has poor production of oil seeds; oil seeds as cash crop attract less attention than tea, which is an important point of information. Production of jute is comparable to rice, which is a similar trend for all livelihood zones. Tea and vegetable productivity are in first place; the situation needs deeper analysis at the block level, as production of different crops varies more at the block level than at the district level. Mostly the question arises concerning the better productivity during the Boro season in all zones. In spite of this much better productivity farmers are not producing enough in the Boro season because there is little or no water at this time. The need for AWM is most in places where production of staple food crops is lowest during Boro, this means that production needs to be tracked in all zones.
If the area of lower rice production during the Boro season can be determined, then the most vulnerable areas in terms of food production in lean seasons can be tracked. AWM intervention would be most effective in places where water is not available in the Boro season. Aman is the monsoon season and crops can be irrigated with or without groundwater. The only time water is required is during the Boro season when investment would be better placed.
3.3
322.5
263.9
18.2
294.4
133.8
10
201.9
258.7
0
50
100
150
200
250
300
350
Aus Aman Boro
'00
0 t
on
ne
s
Seasons
Zone 3: Production pattern of Rice
Uttardinajpur
Dakshin dinajpur
Maldah
1323
1960
2957
1748
2224
3163
1497
2525
3825
0
500
1000
1500
2000
2500
3000
3500
4000
4500
Aus Aman Boro
Zone 3: Productivity pattern of Rice
Uttardinajpur
Dakshin dinajpur
Maldah
30
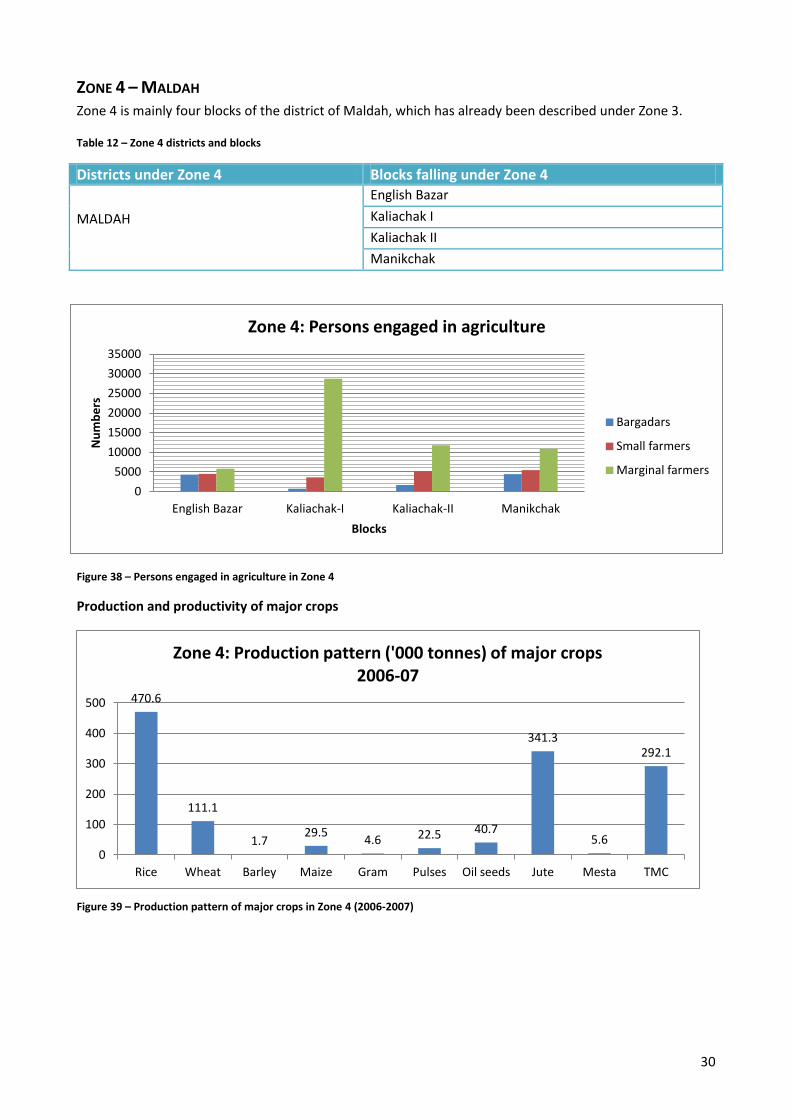
ZONE 4 – MALDAH Zone 4 is mainly four blocks of the district of Maldah, which has already been described under Zone 3.
Table 12 – Zone 4 districts and blocks
Districts under Zone 4 Blocks falling under Zone 4
MALDAH
English Bazar
Kaliachak I
Kaliachak II
Manikchak
Figure 38 – Persons engaged in agriculture in Zone 4
Production and productivity of major crops
Figure 39 – Production pattern of major crops in Zone 4 (2006-2007)
0
5000
10000
15000
20000
25000
30000
35000
English Bazar Kaliachak-I Kaliachak-II Manikchak
Nu
mb
ers
Blocks
Zone 4: Persons engaged in agriculture
Bargadars
Small farmers
Marginal farmers
470.6
111.1
1.7 29.5
4.6 22.5 40.7
341.3
5.6
292.1
0
100
200
300
400
500
Rice Wheat Barley Maize Gram Pulses Oil seeds Jute Mesta TMC
Zone 4: Production pattern ('000 tonnes) of major crops 2006-07
31
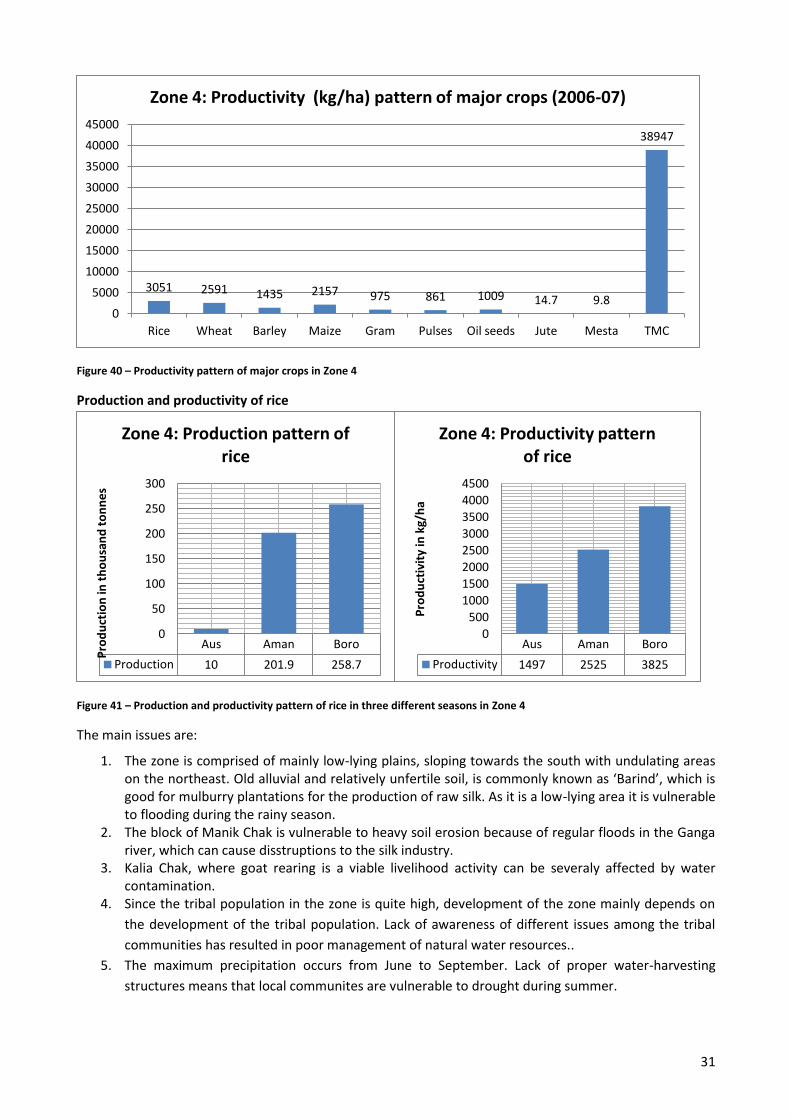
Figure 40 – Productivity pattern of major crops in Zone 4
Production and productivity of rice
Figure 41 – Production and productivity pattern of rice in three different seasons in Zone 4
The main issues are:
1. The zone is comprised of mainly low-lying plains, sloping towards the south with undulating areas on the northeast. Old alluvial and relatively unfertile soil, is commonly known as ‘Barind’, which is good for mulburry plantations for the production of raw silk. As it is a low-lying area it is vulnerable to flooding during the rainy season.
2. The block of Manik Chak is vulnerable to heavy soil erosion because of regular floods in the Ganga river, which can cause disstruptions to the silk industry.
3. Kalia Chak, where goat rearing is a viable livelihood activity can be severaly affected by water contamination.
4. Since the tribal population in the zone is quite high, development of the zone mainly depends on
the development of the tribal population. Lack of awareness of different issues among the tribal
communities has resulted in poor management of natural water resources..
5. The maximum precipitation occurs from June to September. Lack of proper water-harvesting
structures means that local communites are vulnerable to drought during summer.
3051 2591 1435 2157 975 861 1009 14.7 9.8
38947
0
5000
10000
15000
20000
25000
30000
35000
40000
45000
Rice Wheat Barley Maize Gram Pulses Oil seeds Jute Mesta TMC
Zone 4: Productivity (kg/ha) pattern of major crops (2006-07)
Aus Aman Boro
Production 10 201.9 258.7
0
50
100
150
200
250
300
Pro
du
ctio
n in
th
ou
san
d t
on
ne
s
Zone 4: Production pattern of rice
Aus Aman Boro
Productivity 1497 2525 3825
0
500
1000
1500
2000
2500
3000
3500
4000
4500
Pro
du
ctiv
ity
in k
g/h
a
Zone 4: Productivity pattern of rice
32
6. In the ‘Barind’ areas where the ground is high and agriculture is the sole occupation, the tendency
is that people remain in small hamlets. This tendency towards individuality leads towards a
disorganized society and there is an incapacity for major economic activities.
ZONE 5 – MALDAH AND MURSHIDABAD There are two districts in Zone 5 Maldah, only one block, and Murshidabad. Most of the zone is covered by
the district Murshidabad; which will be described later in the document.
Table 13 – Zone 5 districts and blocks
Districts under Zone 5 Blocks falling under Zone 5 MALDAH Kaliachak III
MURSHIDABAD
Bhagwangola I
Bhagwangola II
Msd Jiaganj
Raninagar I
Raninagar II
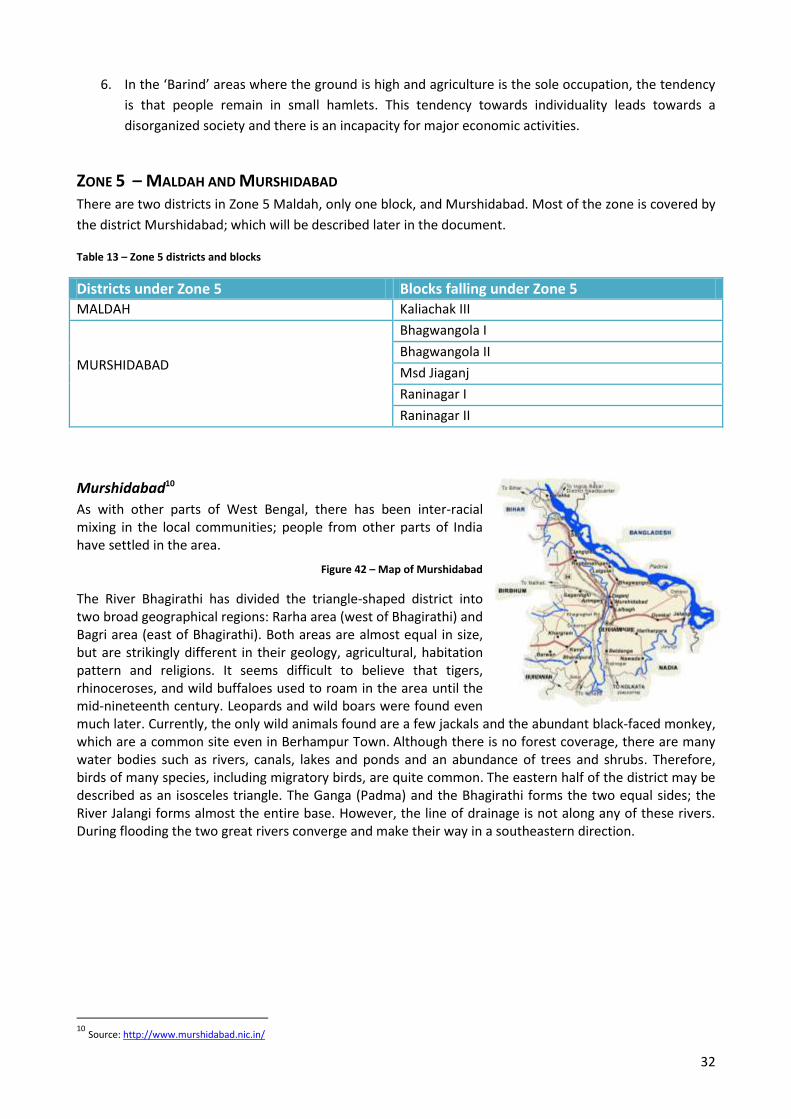
Murshidabad10
As with other parts of West Bengal, there has been inter-racial mixing in the local communities; people from other parts of India have settled in the area.
Figure 42 – Map of Murshidabad
The River Bhagirathi has divided the triangle-shaped district into two broad geographical regions: Rarha area (west of Bhagirathi) and Bagri area (east of Bhagirathi). Both areas are almost equal in size, but are strikingly different in their geology, agricultural, habitation pattern and religions. It seems difficult to believe that tigers, rhinoceroses, and wild buffaloes used to roam in the area until the mid-nineteenth century. Leopards and wild boars were found even much later. Currently, the only wild animals found are a few jackals and the abundant black-faced monkey, which are a common site even in Berhampur Town. Although there is no forest coverage, there are many water bodies such as rivers, canals, lakes and ponds and an abundance of trees and shrubs. Therefore, birds of many species, including migratory birds, are quite common. The eastern half of the district may be described as an isosceles triangle. The Ganga (Padma) and the Bhagirathi forms the two equal sides; the River Jalangi forms almost the entire base. However, the line of drainage is not along any of these rivers. During flooding the two great rivers converge and make their way in a southeastern direction.
10
Source: http://www.murshidabad.nic.in/
33
Table 14 – Overview of district Murshidabad
Particular Measures
Geographical area 5324 Km2
Population 5863717
a) Rural population 5131374
b) Urban population 732343
Forest area (ha) 771
Agriculture area (ha) 408296
Irrigated area (ha) 116950
Annual mean temperature 270C
Annual rainfall 1600 mm
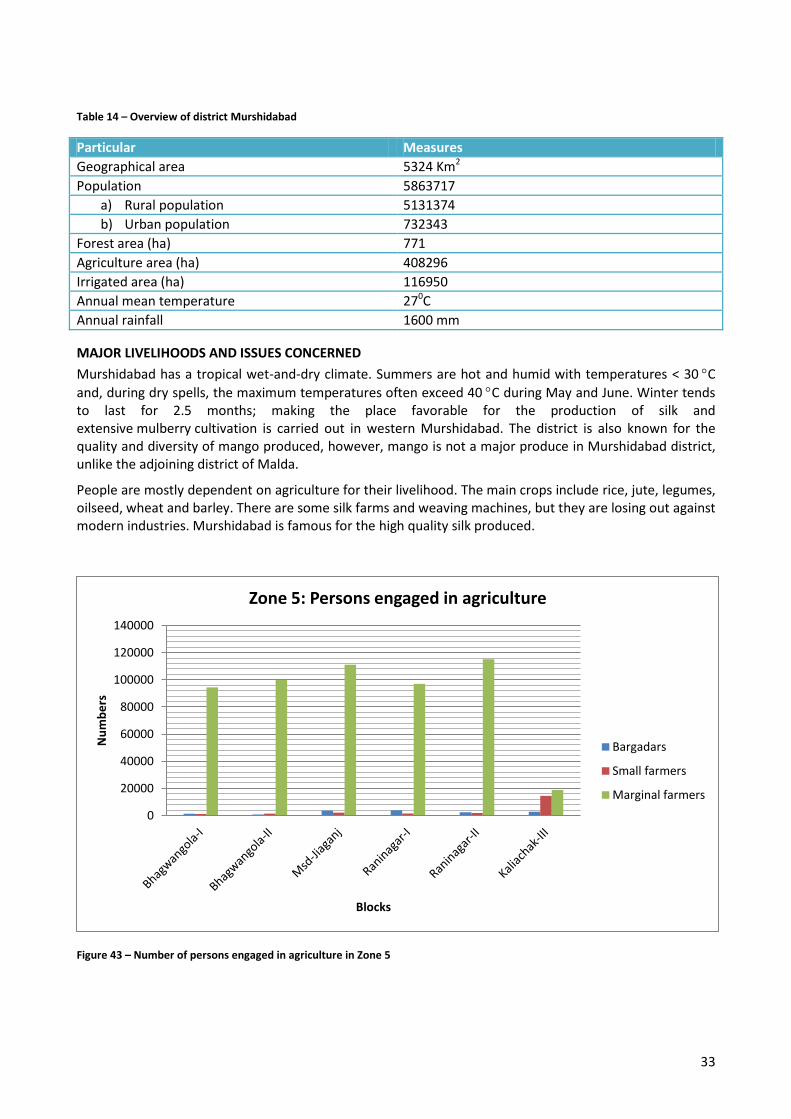
MAJOR LIVELIHOODS AND ISSUES CONCERNED
Murshidabad has a tropical wet-and-dry climate. Summers are hot and humid with temperatures < 30 C
and, during dry spells, the maximum temperatures often exceed 40 C during May and June. Winter tends to last for 2.5 months; making the place favorable for the production of silk and extensive mulberry cultivation is carried out in western Murshidabad. The district is also known for the quality and diversity of mango produced, however, mango is not a major produce in Murshidabad district, unlike the adjoining district of Malda.
People are mostly dependent on agriculture for their livelihood. The main crops include rice, jute, legumes, oilseed, wheat and barley. There are some silk farms and weaving machines, but they are losing out against modern industries. Murshidabad is famous for the high quality silk produced.
Figure 43 – Number of persons engaged in agriculture in Zone 5
0
20000
40000
60000
80000
100000
120000
140000
Nu
mb
ers
Blocks
Zone 5: Persons engaged in agriculture
Bargadars
Small farmers
Marginal farmers
34
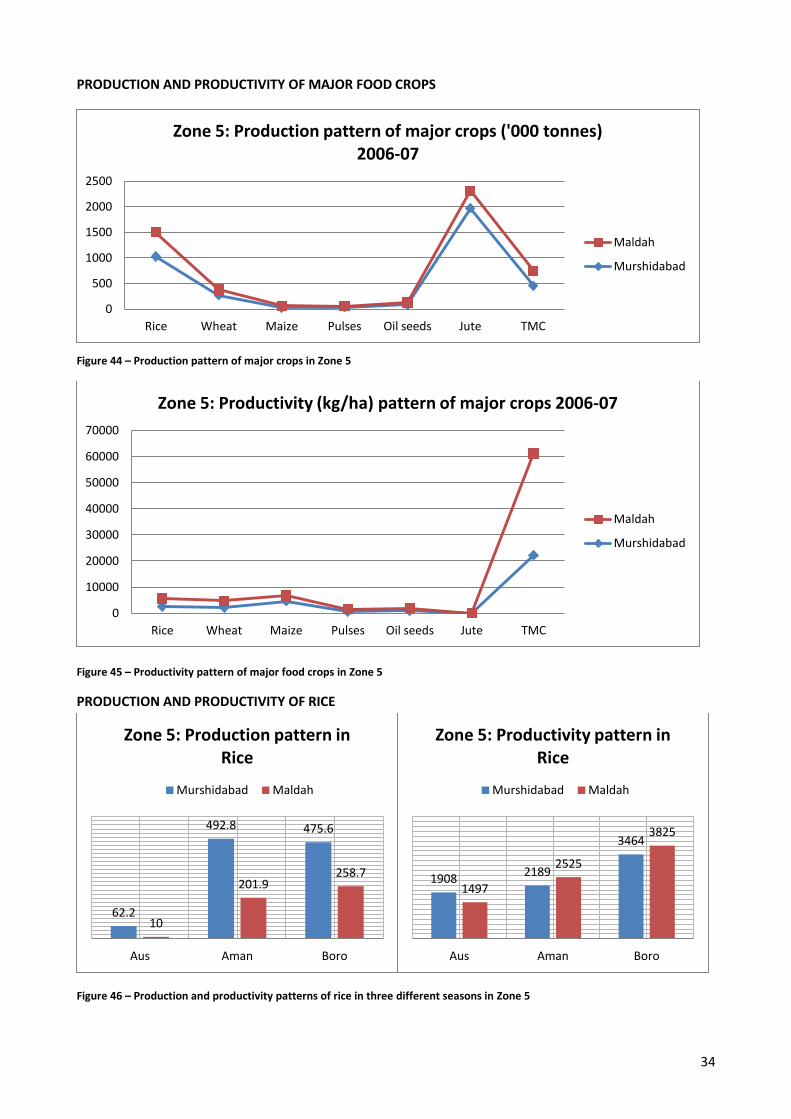
PRODUCTION AND PRODUCTIVITY OF MAJOR FOOD CROPS
Figure 44 – Production pattern of major crops in Zone 5
Figure 45 – Productivity pattern of major food crops in Zone 5
PRODUCTION AND PRODUCTIVITY OF RICE
Figure 46 – Production and productivity patterns of rice in three different seasons in Zone 5
0
500
1000
1500
2000
2500
Rice Wheat Maize Pulses Oil seeds Jute TMC
Zone 5: Production pattern of major crops ('000 tonnes) 2006-07
Maldah
Murshidabad
0
10000
20000
30000
40000
50000
60000
70000
Rice Wheat Maize Pulses Oil seeds Jute TMC
Zone 5: Productivity (kg/ha) pattern of major crops 2006-07
Maldah
Murshidabad
62.2
492.8 475.6
10
201.9 258.7
Aus Aman Boro
Zone 5: Production pattern in Rice
Murshidabad Maldah
1908 2189
3464
1497
2525
3825
Aus Aman Boro
Zone 5: Productivity pattern in Rice
Murshidabad Maldah
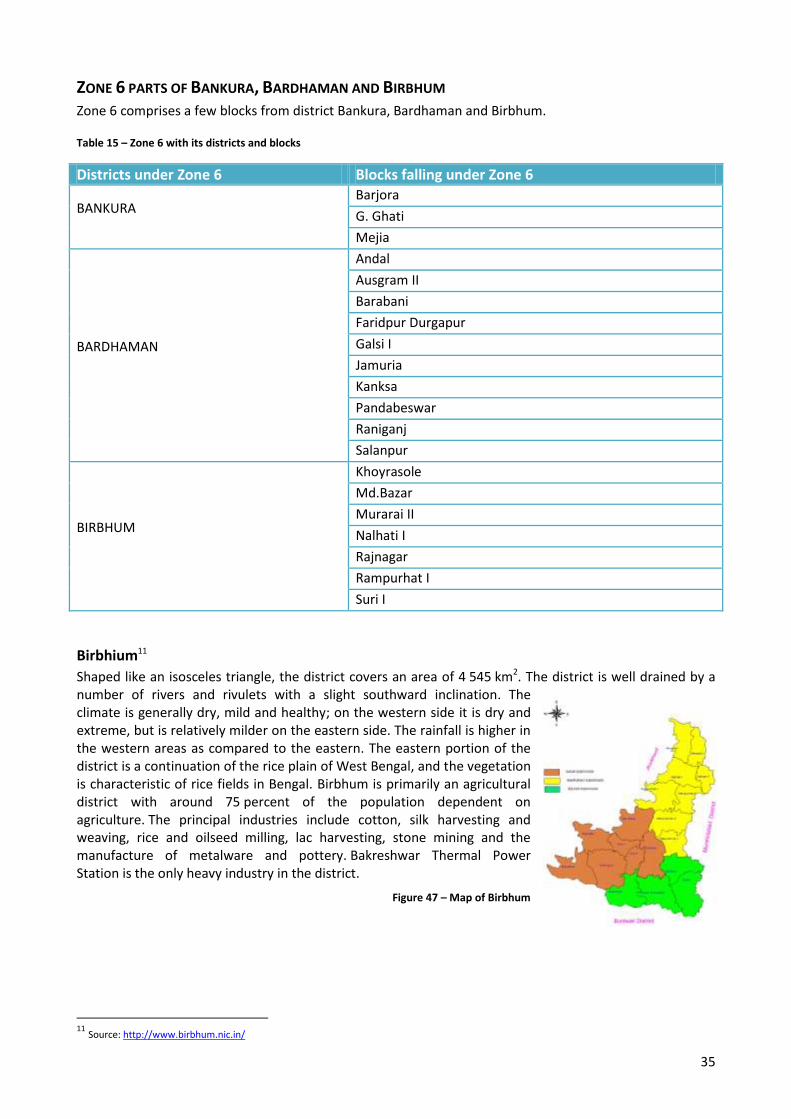
35
ZONE 6 PARTS OF BANKURA, BARDHAMAN AND BIRBHUM Zone 6 comprises a few blocks from district Bankura, Bardhaman and Birbhum.
Table 15 – Zone 6 with its districts and blocks
Districts under Zone 6 Blocks falling under Zone 6
BANKURA
Barjora
G. Ghati
Mejia
BARDHAMAN
Andal
Ausgram II
Barabani
Faridpur Durgapur
Galsi I
Jamuria
Kanksa
Pandabeswar
Raniganj
Salanpur
BIRBHUM
Khoyrasole
Md.Bazar
Murarai II
Nalhati I
Rajnagar
Rampurhat I
Suri I
Birbhium11
Shaped like an isosceles triangle, the district covers an area of 4 545 km2. The district is well drained by a number of rivers and rivulets with a slight southward inclination. The climate is generally dry, mild and healthy; on the western side it is dry and extreme, but is relatively milder on the eastern side. The rainfall is higher in the western areas as compared to the eastern. The eastern portion of the district is a continuation of the rice plain of West Bengal, and the vegetation is characteristic of rice fields in Bengal. Birbhum is primarily an agricultural district with around 75 percent of the population dependent on agriculture. The principal industries include cotton, silk harvesting and weaving, rice and oilseed milling, lac harvesting, stone mining and the manufacture of metalware and pottery. Bakreshwar Thermal Power Station is the only heavy industry in the district.
Figure 47 – Map of Birbhum
11
Source: http://www.birbhum.nic.in/
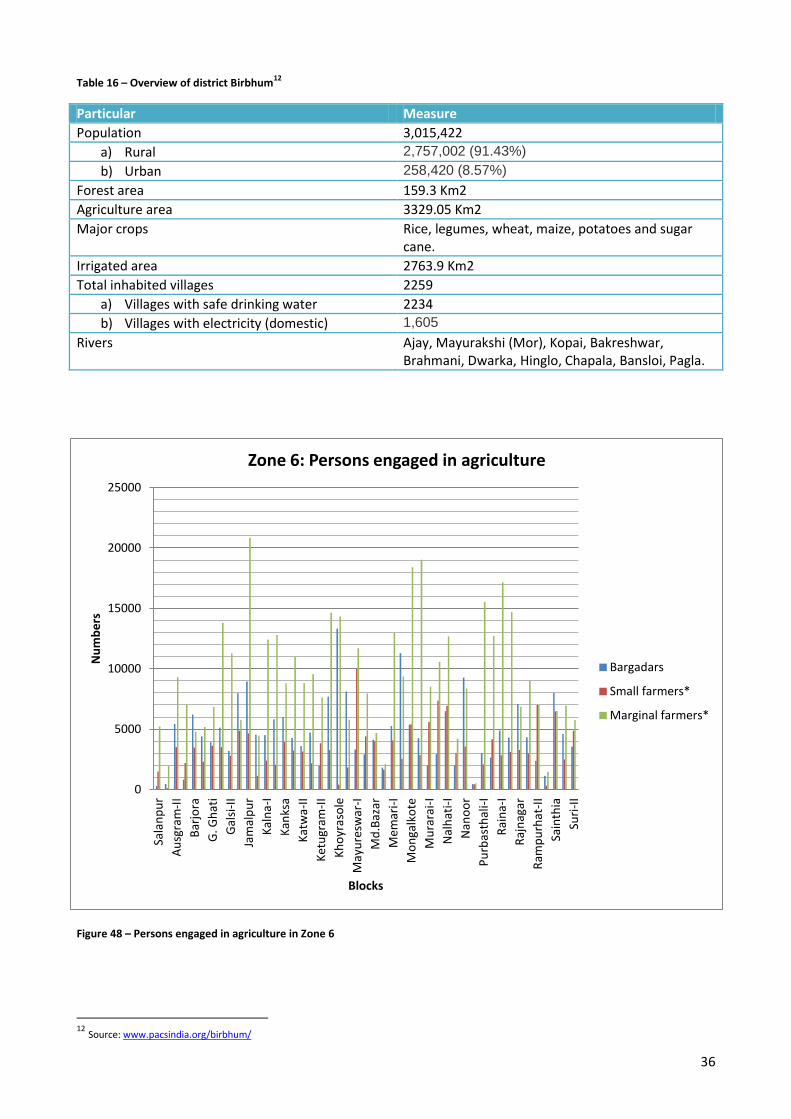
36
Table 16 – Overview of district Birbhum12
Particular Measure
Population 3,015,422
a) Rural 2,757,002 (91.43%)
b) Urban 258,420 (8.57%)
Forest area 159.3 Km2
Agriculture area 3329.05 Km2
Major crops Rice, legumes, wheat, maize, potatoes and sugar cane.
Irrigated area 2763.9 Km2
Total inhabited villages 2259
a) Villages with safe drinking water 2234
b) Villages with electricity (domestic) 1,605
Rivers Ajay, Mayurakshi (Mor), Kopai, Bakreshwar, Brahmani, Dwarka, Hinglo, Chapala, Bansloi, Pagla.
Figure 48 – Persons engaged in agriculture in Zone 6
12
Source: www.pacsindia.org/birbhum/
0
5000
10000
15000
20000
25000
Sala
np
ur
Au
sgra
m-I
I
Bar
jora
G. G
hat
i
Gal
si-I
I
Jam
alp
ur
Kal
na-
I
Kan
ksa
Kat
wa-
II
Ket
ugr
am-I
I
Kh
oyr
aso
le
May
ure
swar
-I
Md
.Baz
ar
Mem
ari-
I
Mo
nga
lko
te
Mu
rara
i-I
Nal
hat
i-I
Nan
oo
r
Pu
rbas
thal
i-I
Rai
na-
I
Raj
nag
ar
Ram
pu
rhat
-II
Sain
thia
Suri
-II
Nu
mb
ers
Blocks
Zone 6: Persons engaged in agriculture
Bargadars
Small farmers*
Marginal farmers*
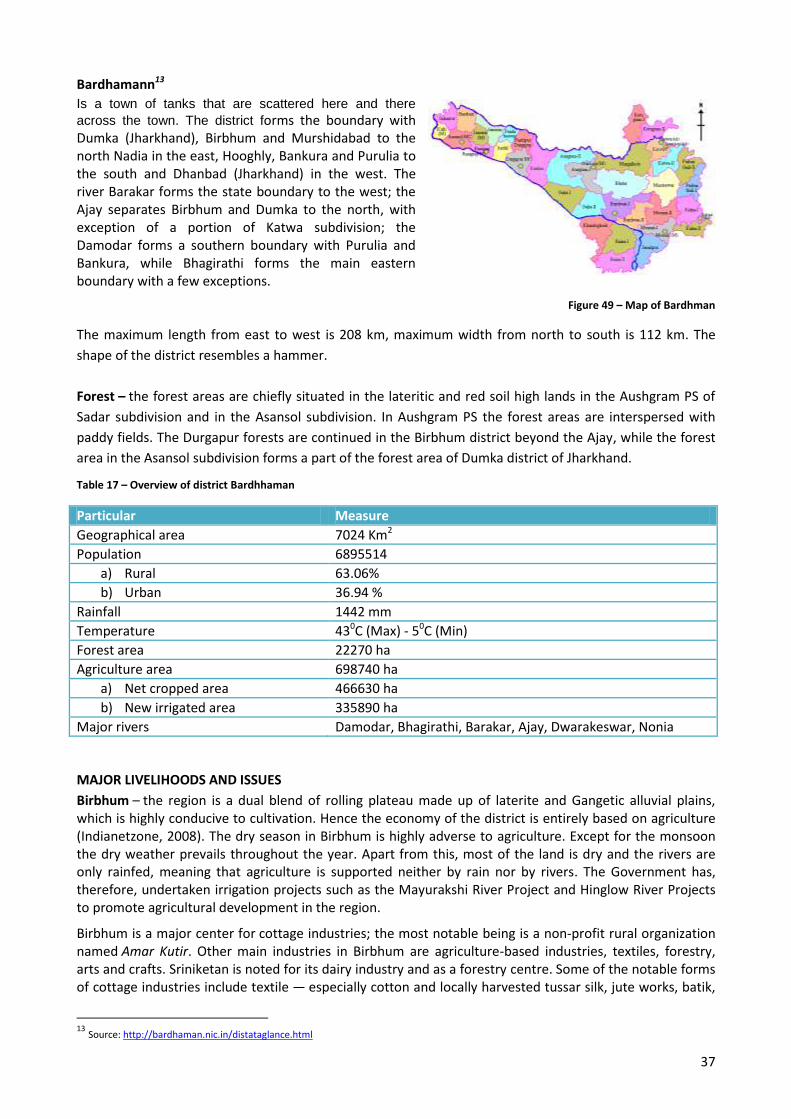
37
Bardhamann13
Is a town of tanks that are scattered here and there
across the town. The district forms the boundary with Dumka (Jharkhand), Birbhum and Murshidabad to the north Nadia in the east, Hooghly, Bankura and Purulia to the south and Dhanbad (Jharkhand) in the west. The river Barakar forms the state boundary to the west; the Ajay separates Birbhum and Dumka to the north, with exception of a portion of Katwa subdivision; the Damodar forms a southern boundary with Purulia and Bankura, while Bhagirathi forms the main eastern boundary with a few exceptions.
Figure 49 – Map of Bardhman
The maximum length from east to west is 208 km, maximum width from north to south is 112 km. The
shape of the district resembles a hammer.
Forest – the forest areas are chiefly situated in the lateritic and red soil high lands in the Aushgram PS of
Sadar subdivision and in the Asansol subdivision. In Aushgram PS the forest areas are interspersed with
paddy fields. The Durgapur forests are continued in the Birbhum district beyond the Ajay, while the forest
area in the Asansol subdivision forms a part of the forest area of Dumka district of Jharkhand.
Table 17 – Overview of district Bardhhaman
Particular Measure
Geographical area 7024 Km2
Population 6895514
a) Rural 63.06%
b) Urban 36.94 %
Rainfall 1442 mm
Temperature 430C (Max) - 50C (Min)
Forest area 22270 ha
Agriculture area 698740 ha
a) Net cropped area 466630 ha
b) New irrigated area 335890 ha
Major rivers Damodar, Bhagirathi, Barakar, Ajay, Dwarakeswar, Nonia
MAJOR LIVELIHOODS AND ISSUES
Birbhum – the region is a dual blend of rolling plateau made up of laterite and Gangetic alluvial plains, which is highly conducive to cultivation. Hence the economy of the district is entirely based on agriculture (Indianetzone, 2008). The dry season in Birbhum is highly adverse to agriculture. Except for the monsoon the dry weather prevails throughout the year. Apart from this, most of the land is dry and the rivers are only rainfed, meaning that agriculture is supported neither by rain nor by rivers. The Government has, therefore, undertaken irrigation projects such as the Mayurakshi River Project and Hinglow River Projects to promote agricultural development in the region.
Birbhum is a major center for cottage industries; the most notable being is a non-profit rural organization named Amar Kutir. Other main industries in Birbhum are agriculture-based industries, textiles, forestry, arts and crafts. Sriniketan is noted for its dairy industry and as a forestry centre. Some of the notable forms of cottage industries include textile — especially cotton and locally harvested tussar silk, jute works, batik,
13
Source: http://bardhaman.nic.in/distataglance.html
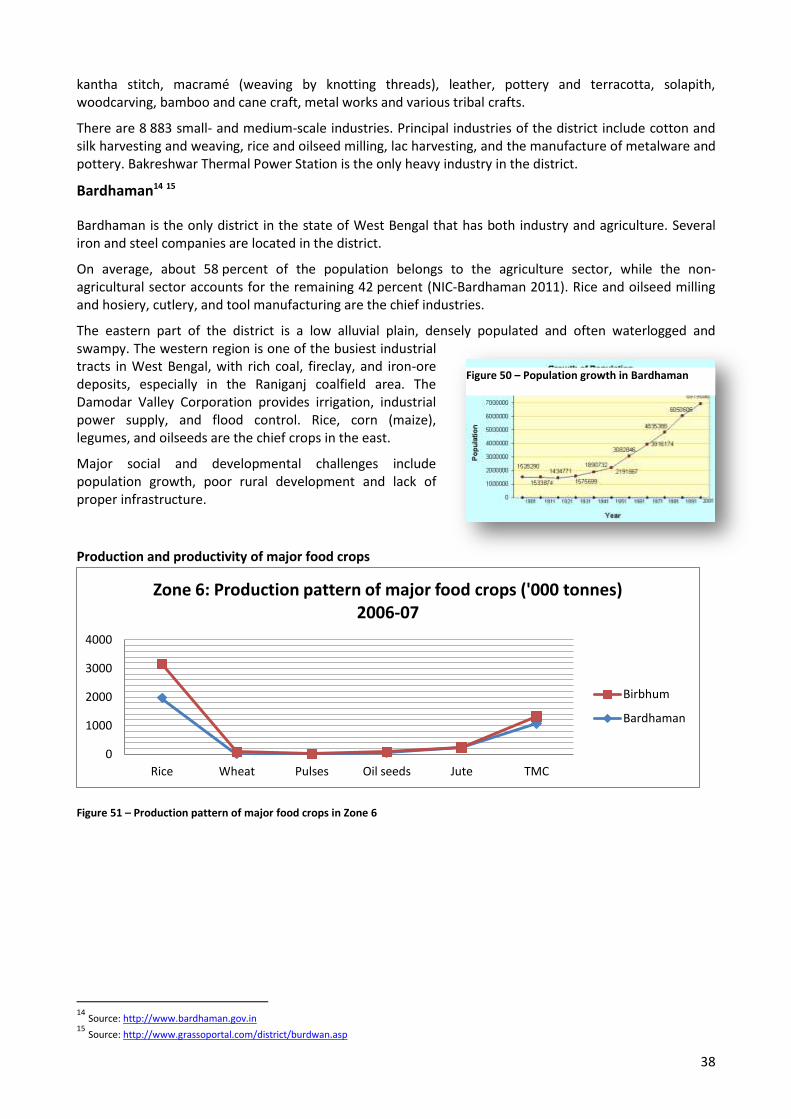
38
kantha stitch, macramé (weaving by knotting threads), leather, pottery and terracotta, solapith, woodcarving, bamboo and cane craft, metal works and various tribal crafts.
There are 8 883 small- and medium-scale industries. Principal industries of the district include cotton and silk harvesting and weaving, rice and oilseed milling, lac harvesting, and the manufacture of metalware and pottery. Bakreshwar Thermal Power Station is the only heavy industry in the district.
Bardhaman14 15
Bardhaman is the only district in the state of West Bengal that has both industry and agriculture. Several iron and steel companies are located in the district.
On average, about 58 percent of the population belongs to the agriculture sector, while the non-agricultural sector accounts for the remaining 42 percent (NIC-Bardhaman 2011). Rice and oilseed milling and hosiery, cutlery, and tool manufacturing are the chief industries.
The eastern part of the district is a low alluvial plain, densely populated and often waterlogged and swampy. The western region is one of the busiest industrial tracts in West Bengal, with rich coal, fireclay, and iron-ore deposits, especially in the Raniganj coalfield area. The Damodar Valley Corporation provides irrigation, industrial power supply, and flood control. Rice, corn (maize), legumes, and oilseeds are the chief crops in the east.
Major social and developmental challenges include population growth, poor rural development and lack of proper infrastructure.
Production and productivity of major food crops
Figure 51 – Production pattern of major food crops in Zone 6
14
Source: http://www.bardhaman.gov.in 15
Source: http://www.grassoportal.com/district/burdwan.asp
0
1000
2000
3000
4000
Rice Wheat Pulses Oil seeds Jute TMC
Zone 6: Production pattern of major food crops ('000 tonnes) 2006-07
Birbhum
Bardhaman
Figure 50 – Population growth in Bardhaman
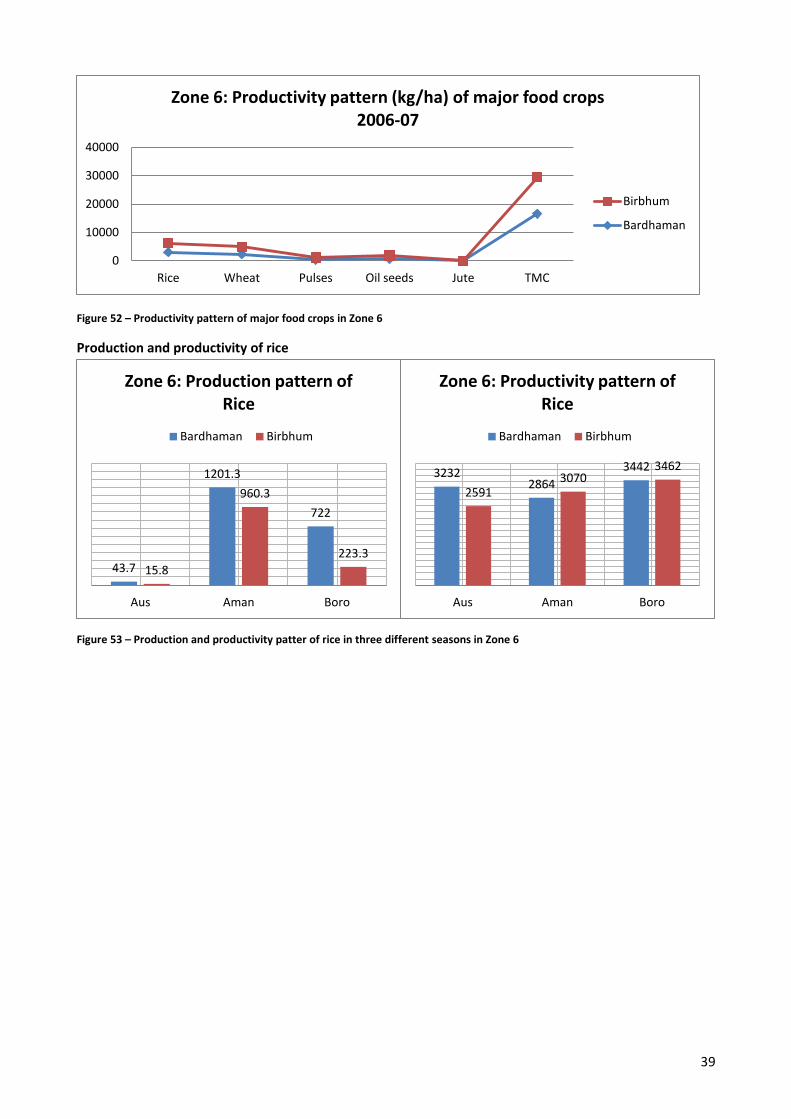
39
Figure 52 – Productivity pattern of major food crops in Zone 6
Production and productivity of rice
Figure 53 – Production and productivity patter of rice in three different seasons in Zone 6
0
10000
20000
30000
40000
Rice Wheat Pulses Oil seeds Jute TMC
Zone 6: Productivity pattern (kg/ha) of major food crops 2006-07
Birbhum
Bardhaman
43.7
1201.3
722
15.8
960.3
223.3
Aus Aman Boro
Zone 6: Production pattern of Rice
Bardhaman Birbhum
3232 2864
3442
2591 3070
3462
Aus Aman Boro
Zone 6: Productivity pattern of Rice
Bardhaman Birbhum
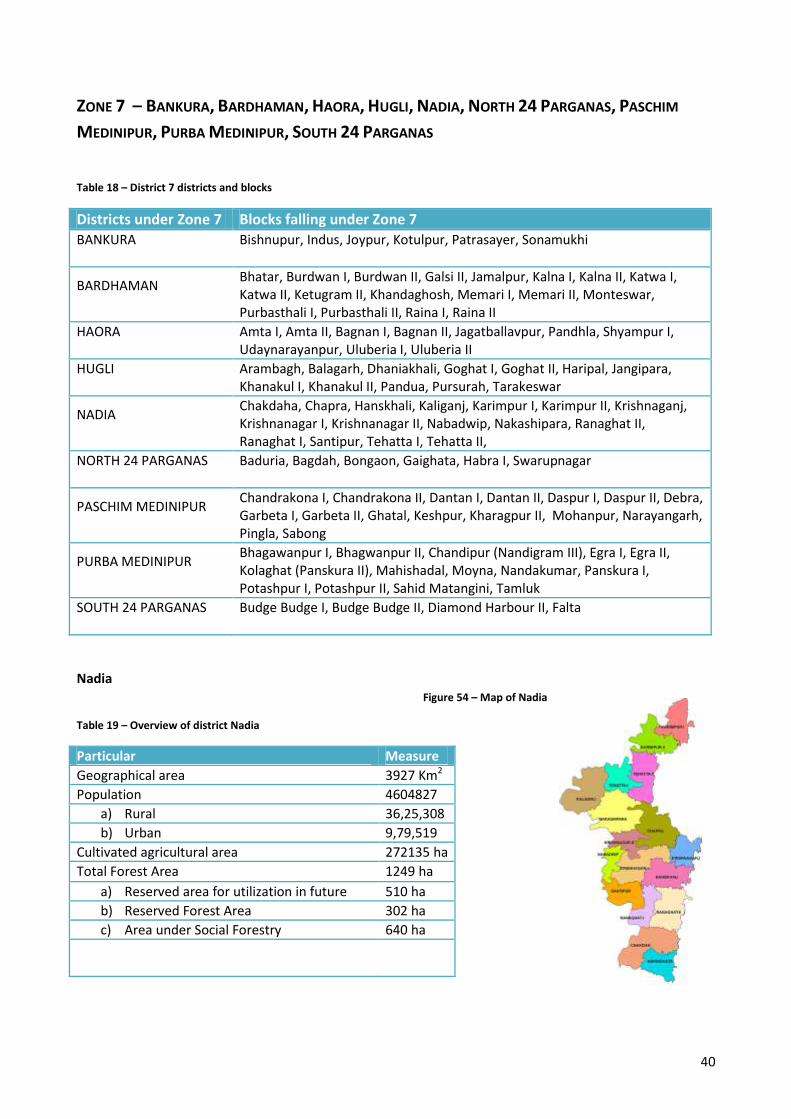
40
ZONE 7 – BANKURA, BARDHAMAN, HAORA, HUGLI, NADIA, NORTH 24 PARGANAS, PASCHIM
MEDINIPUR, PURBA MEDINIPUR, SOUTH 24 PARGANAS
Table 18 – District 7 districts and blocks
Districts under Zone 7 Blocks falling under Zone 7 BANKURA
Bishnupur, Indus, Joypur, Kotulpur, Patrasayer, Sonamukhi
BARDHAMAN
Bhatar, Burdwan I, Burdwan II, Galsi II, Jamalpur, Kalna I, Kalna II, Katwa I, Katwa II, Ketugram II, Khandaghosh, Memari I, Memari II, Monteswar, Purbasthali I, Purbasthali II, Raina I, Raina II
HAORA
Amta I, Amta II, Bagnan I, Bagnan II, Jagatballavpur, Pandhla, Shyampur I, Udaynarayanpur, Uluberia I, Uluberia II
HUGLI
Arambagh, Balagarh, Dhaniakhali, Goghat I, Goghat II, Haripal, Jangipara, Khanakul I, Khanakul II, Pandua, Pursurah, Tarakeswar
NADIA
Chakdaha, Chapra, Hanskhali, Kaliganj, Karimpur I, Karimpur II, Krishnaganj, Krishnanagar I, Krishnanagar II, Nabadwip, Nakashipara, Ranaghat II, Ranaghat I, Santipur, Tehatta I, Tehatta II,
NORTH 24 PARGANAS
Baduria, Bagdah, Bongaon, Gaighata, Habra I, Swarupnagar
PASCHIM MEDINIPUR
Chandrakona I, Chandrakona II, Dantan I, Dantan II, Daspur I, Daspur II, Debra, Garbeta I, Garbeta II, Ghatal, Keshpur, Kharagpur II, Mohanpur, Narayangarh, Pingla, Sabong
PURBA MEDINIPUR
Bhagawanpur I, Bhagwanpur II, Chandipur (Nandigram III), Egra I, Egra II, Kolaghat (Panskura II), Mahishadal, Moyna, Nandakumar, Panskura I, Potashpur I, Potashpur II, Sahid Matangini, Tamluk
SOUTH 24 PARGANAS
Budge Budge I, Budge Budge II, Diamond Harbour II, Falta
Nadia Figure 54 – Map of Nadia
Table 19 – Overview of district Nadia
Particular Measure
Geographical area 3927 Km2
Population 4604827
a) Rural 36,25,308
b) Urban 9,79,519
Cultivated agricultural area 272135 ha
Total Forest Area 1249 ha
a) Reserved area for utilization in future 510 ha
b) Reserved Forest Area 302 ha
c) Area under Social Forestry 640 ha
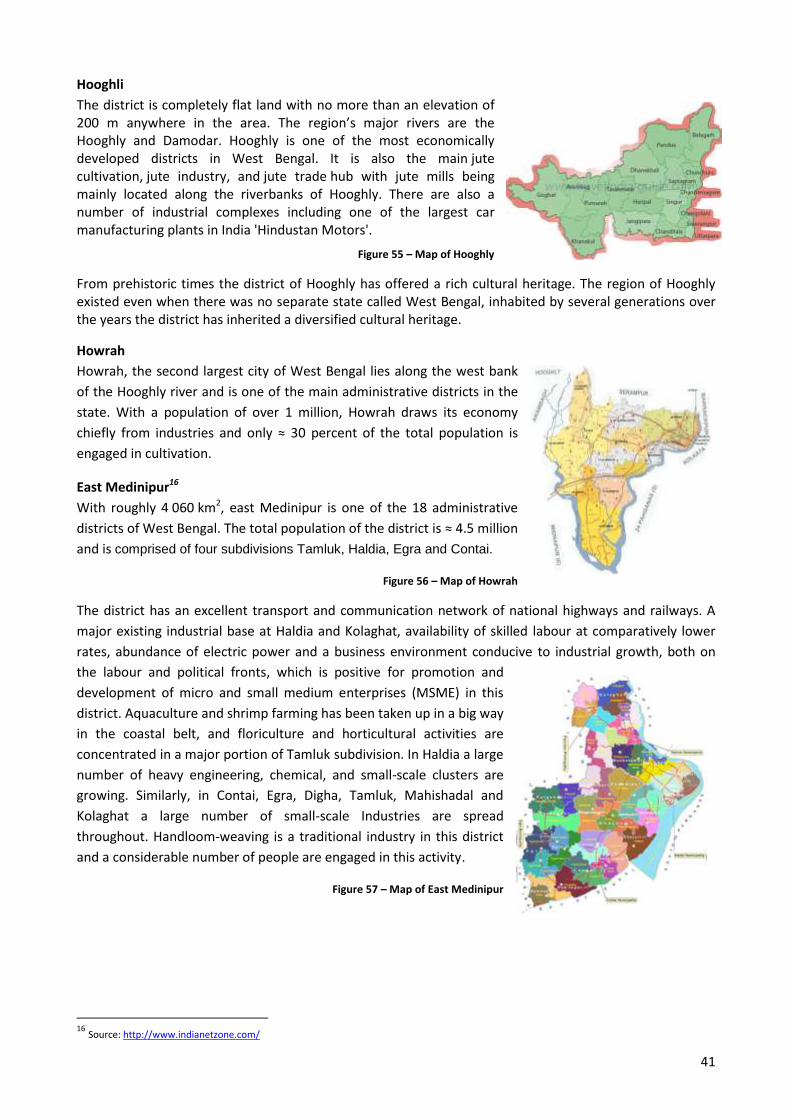
41
Hooghli
The district is completely flat land with no more than an elevation of 200 m anywhere in the area. The region’s major rivers are the Hooghly and Damodar. Hooghly is one of the most economically developed districts in West Bengal. It is also the main jute cultivation, jute industry, and jute trade hub with jute mills being mainly located along the riverbanks of Hooghly. There are also a number of industrial complexes including one of the largest car manufacturing plants in India 'Hindustan Motors'.
Figure 55 – Map of Hooghly
From prehistoric times the district of Hooghly has offered a rich cultural heritage. The region of Hooghly existed even when there was no separate state called West Bengal, inhabited by several generations over the years the district has inherited a diversified cultural heritage.
Howrah
Howrah, the second largest city of West Bengal lies along the west bank
of the Hooghly river and is one of the main administrative districts in the
state. With a population of over 1 million, Howrah draws its economy
chiefly from industries and only ≈ 30 percent of the total population is
engaged in cultivation.
East Medinipur16
With roughly 4 060 km2, east Medinipur is one of the 18 administrative
districts of West Bengal. The total population of the district is ≈ 4.5 million
and is comprised of four subdivisions Tamluk, Haldia, Egra and Contai.
Figure 56 – Map of Howrah
The district has an excellent transport and communication network of national highways and railways. A
major existing industrial base at Haldia and Kolaghat, availability of skilled labour at comparatively lower
rates, abundance of electric power and a business environment conducive to industrial growth, both on
the labour and political fronts, which is positive for promotion and
development of micro and small medium enterprises (MSME) in this
district. Aquaculture and shrimp farming has been taken up in a big way
in the coastal belt, and floriculture and horticultural activities are
concentrated in a major portion of Tamluk subdivision. In Haldia a large
number of heavy engineering, chemical, and small-scale clusters are
growing. Similarly, in Contai, Egra, Digha, Tamluk, Mahishadal and
Kolaghat a large number of small-scale Industries are spread
throughout. Handloom-weaving is a traditional industry in this district
and a considerable number of people are engaged in this activity.
Figure 57 – Map of East Medinipur
16
Source: http://www.indianetzone.com/
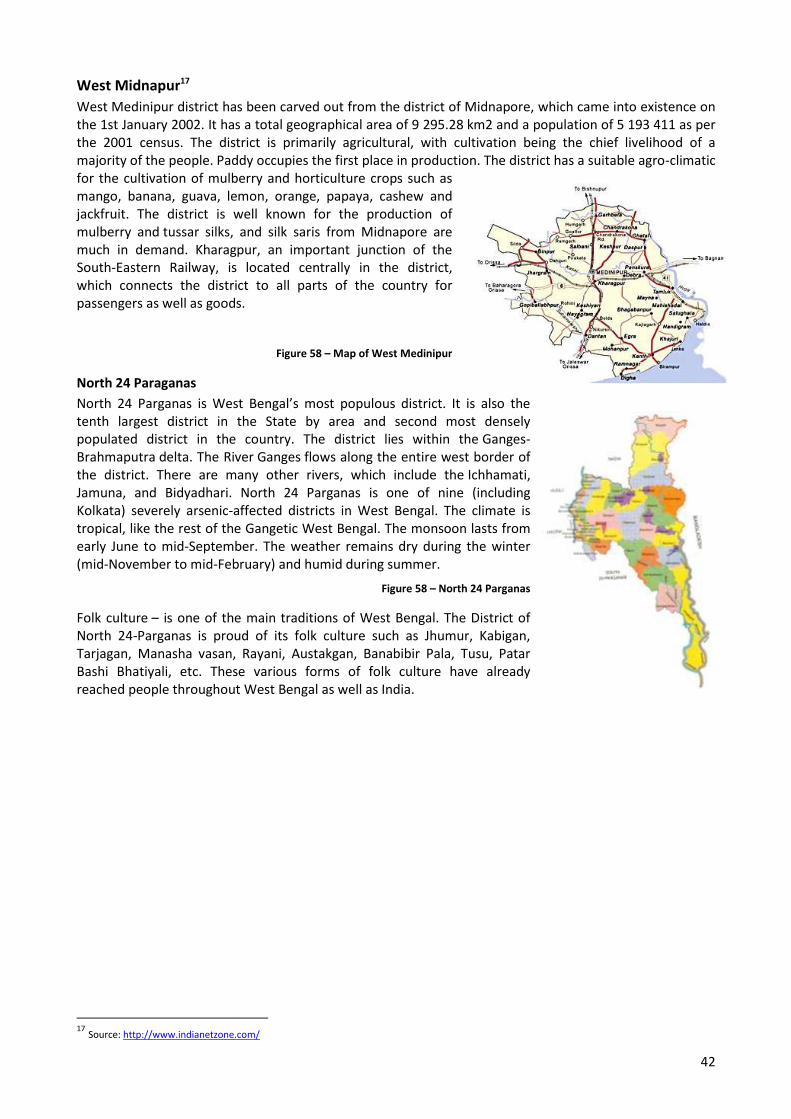
42
West Midnapur17
West Medinipur district has been carved out from the district of Midnapore, which came into existence on the 1st January 2002. It has a total geographical area of 9 295.28 km2 and a population of 5 193 411 as per the 2001 census. The district is primarily agricultural, with cultivation being the chief livelihood of a majority of the people. Paddy occupies the first place in production. The district has a suitable agro-climatic for the cultivation of mulberry and horticulture crops such as mango, banana, guava, lemon, orange, papaya, cashew and jackfruit. The district is well known for the production of mulberry and tussar silks, and silk saris from Midnapore are much in demand. Kharagpur, an important junction of the South-Eastern Railway, is located centrally in the district, which connects the district to all parts of the country for passengers as well as goods.
Figure 58 – Map of West Medinipur
North 24 Paraganas
North 24 Parganas is West Bengal’s most populous district. It is also the tenth largest district in the State by area and second most densely populated district in the country. The district lies within the Ganges-Brahmaputra delta. The River Ganges flows along the entire west border of the district. There are many other rivers, which include the Ichhamati, Jamuna, and Bidyadhari. North 24 Parganas is one of nine (including Kolkata) severely arsenic-affected districts in West Bengal. The climate is tropical, like the rest of the Gangetic West Bengal. The monsoon lasts from early June to mid-September. The weather remains dry during the winter (mid-November to mid-February) and humid during summer.
Figure 58 – North 24 Parganas
Folk culture – is one of the main traditions of West Bengal. The District of North 24-Parganas is proud of its folk culture such as Jhumur, Kabigan, Tarjagan, Manasha vasan, Rayani, Austakgan, Banabibir Pala, Tusu, Patar Bashi Bhatiyali, etc. These various forms of folk culture have already reached people throughout West Bengal as well as India.
17
Source: http://www.indianetzone.com/
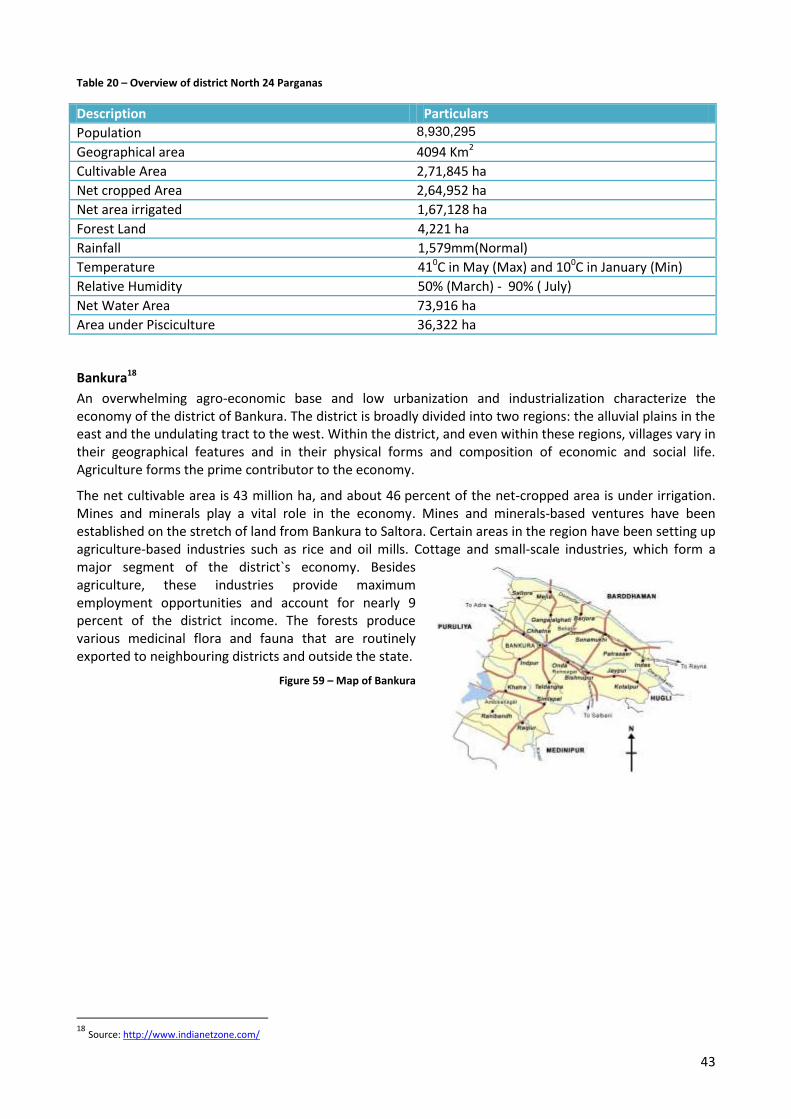
43
Table 20 – Overview of district North 24 Parganas
Description Particulars
Population 8,930,295
Geographical area 4094 Km2
Cultivable Area 2,71,845 ha
Net cropped Area 2,64,952 ha
Net area irrigated 1,67,128 ha
Forest Land 4,221 ha
Rainfall 1,579mm(Normal)
Temperature 410C in May (Max) and 100C in January (Min)
Relative Humidity 50% (March) - 90% ( July)
Net Water Area 73,916 ha
Area under Pisciculture 36,322 ha
Bankura18
An overwhelming agro-economic base and low urbanization and industrialization characterize the economy of the district of Bankura. The district is broadly divided into two regions: the alluvial plains in the east and the undulating tract to the west. Within the district, and even within these regions, villages vary in their geographical features and in their physical forms and composition of economic and social life. Agriculture forms the prime contributor to the economy.
The net cultivable area is 43 million ha, and about 46 percent of the net-cropped area is under irrigation. Mines and minerals play a vital role in the economy. Mines and minerals-based ventures have been established on the stretch of land from Bankura to Saltora. Certain areas in the region have been setting up agriculture-based industries such as rice and oil mills. Cottage and small-scale industries, which form a major segment of the district`s economy. Besides agriculture, these industries provide maximum employment opportunities and account for nearly 9 percent of the district income. The forests produce various medicinal flora and fauna that are routinely exported to neighbouring districts and outside the state.
Figure 59 – Map of Bankura
18
Source: http://www.indianetzone.com/
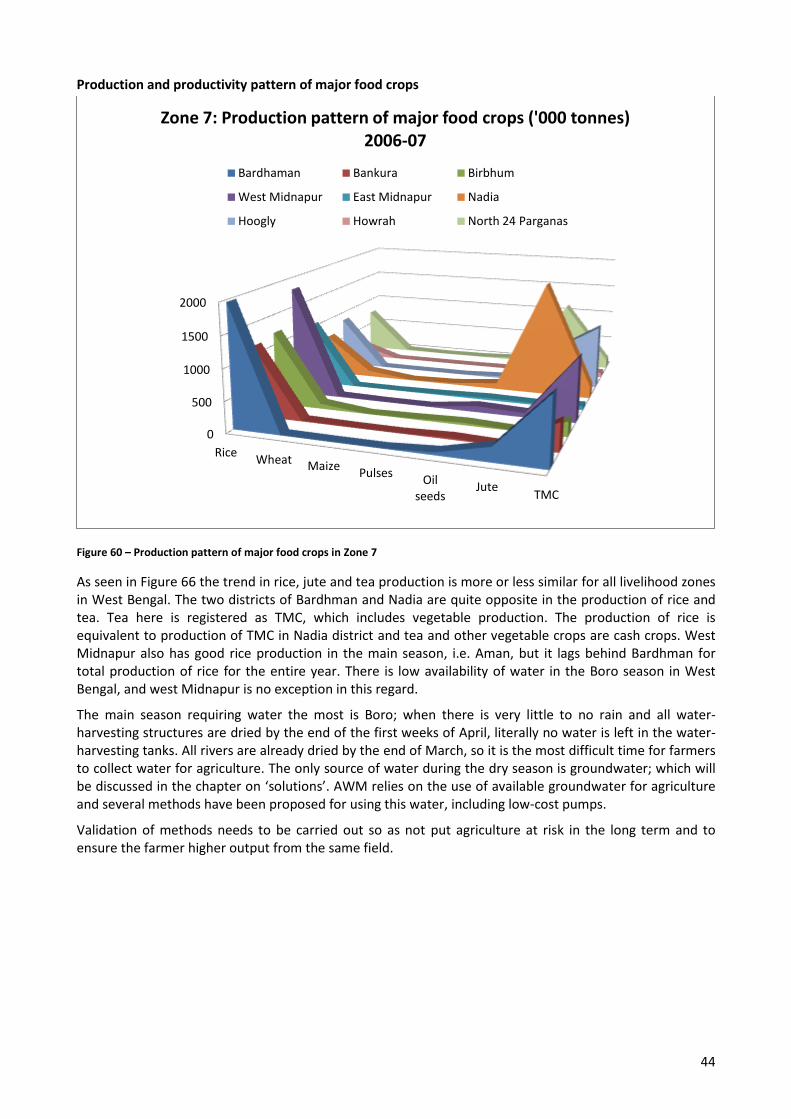
44
Production and productivity pattern of major food crops
Figure 60 – Production pattern of major food crops in Zone 7
As seen in Figure 66 the trend in rice, jute and tea production is more or less similar for all livelihood zones in West Bengal. The two districts of Bardhman and Nadia are quite opposite in the production of rice and tea. Tea here is registered as TMC, which includes vegetable production. The production of rice is equivalent to production of TMC in Nadia district and tea and other vegetable crops are cash crops. West Midnapur also has good rice production in the main season, i.e. Aman, but it lags behind Bardhman for total production of rice for the entire year. There is low availability of water in the Boro season in West Bengal, and west Midnapur is no exception in this regard.
The main season requiring water the most is Boro; when there is very little to no rain and all water-harvesting structures are dried by the end of the first weeks of April, literally no water is left in the water-harvesting tanks. All rivers are already dried by the end of March, so it is the most difficult time for farmers to collect water for agriculture. The only source of water during the dry season is groundwater; which will be discussed in the chapter on ‘solutions’. AWM relies on the use of available groundwater for agriculture and several methods have been proposed for using this water, including low-cost pumps.
Validation of methods needs to be carried out so as not put agriculture at risk in the long term and to ensure the farmer higher output from the same field.
0
500
1000
1500
2000
Rice Wheat Maize
Pulses Oil
seeds Jute
TMC
Zone 7: Production pattern of major food crops ('000 tonnes) 2006-07
Bardhaman Bankura Birbhum
West Midnapur East Midnapur Nadia
Hoogly Howrah North 24 Parganas
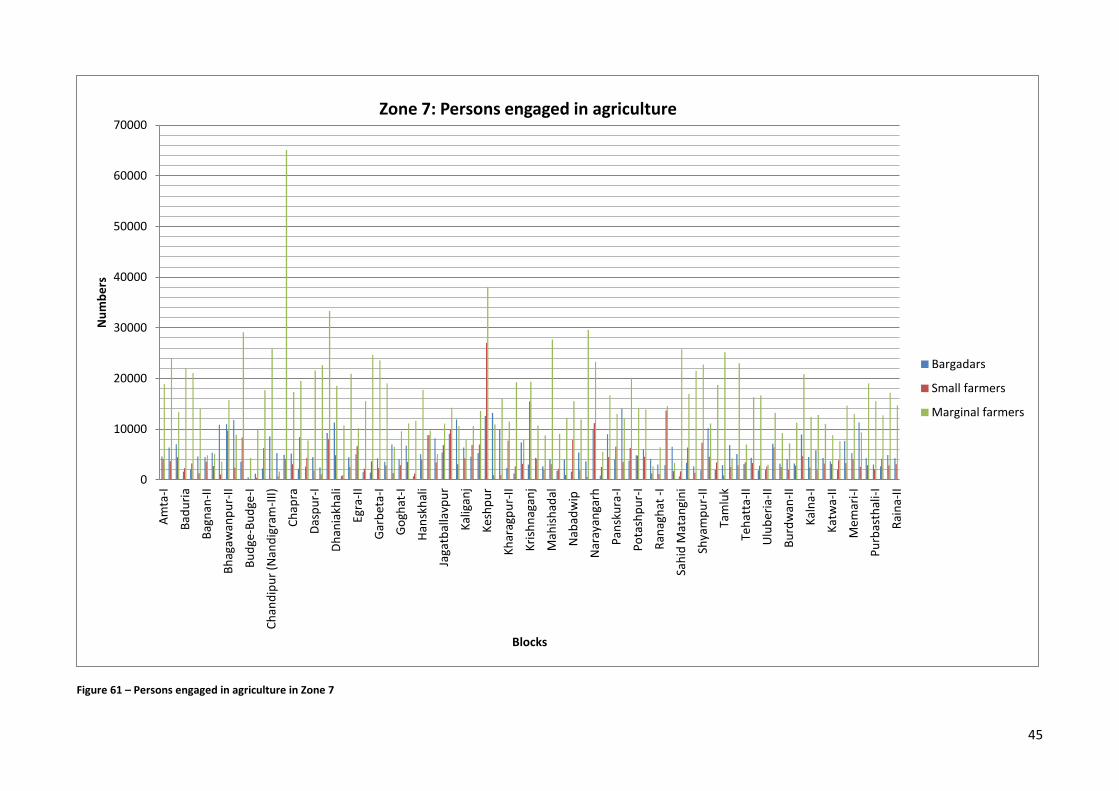
45
Figure 61 – Persons engaged in agriculture in Zone 7
0
10000
20000
30000
40000
50000
60000
70000
Am
ta-I
Bad
uri
a
Bag
nan
-II
Bh
agaw
anp
ur-
II
Bu
dge
-Bu
dge
-I
Ch
and
ipu
r (N
and
igra
m-I
II)
Ch
apra
Das
pu
r-I
Dh
ania
khal
i
Egra
-II
Gar
bet
a-I
Go
ghat
-I
Han
skh
ali
Jaga
tbal
lavp
ur
Kal
igan
j
Kes
hp
ur
Kh
arag
pu
r-II
Kri
shn
agan
j
Mah
ish
adal
Nab
adw
ip
Nar
ayan
garh
Pan
sku
ra-I
Po
tash
pu
r-I
Ran
agh
at -
I
Sah
id M
atan
gin
i
Shya
mp
ur-
II
Tam
luk
Teh
atta
-II
Ulu
ber
ia-I
I
Bu
rdw
an-I
I
Kal
na-
I
Kat
wa-
II
Mem
ari-
I
Pu
rbas
thal
i-I
Rai
na-
II
Nu
mb
ers
Blocks
Zone 7: Persons engaged in agriculture
Bargadars
Small farmers
Marginal farmers
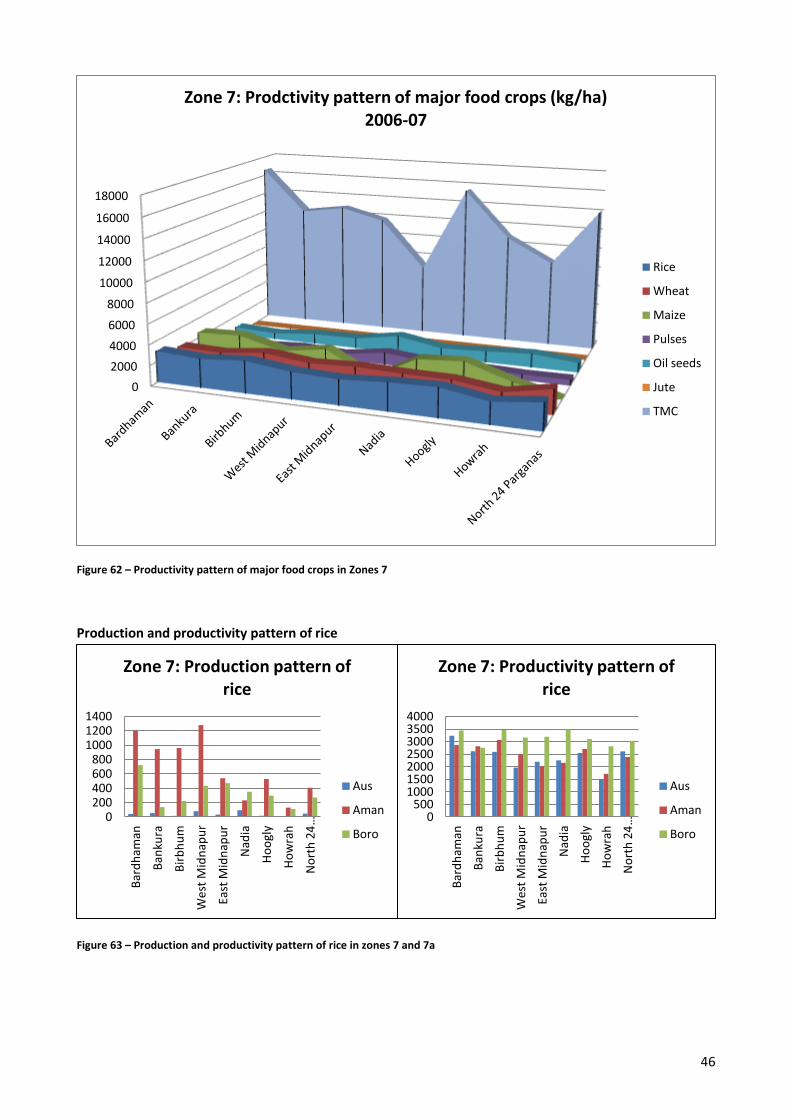
46
Figure 62 – Productivity pattern of major food crops in Zones 7
Production and productivity pattern of rice
Figure 63 – Production and productivity pattern of rice in zones 7 and 7a
0
2000
4000
6000
8000
10000
12000
14000
16000
18000
Zone 7: Prodctivity pattern of major food crops (kg/ha) 2006-07
Rice
Wheat
Maize
Pulses
Oil seeds
Jute
TMC
0 200 400 600 800
1000 1200 1400
Bar
dh
aman
Ban
kura
Bir
bh
um
Wes
t M
idn
apu
r
East
Mid
nap
ur
Nad
ia
Ho
ogl
y
Ho
wra
h
No
rth
24
…
Zone 7: Production pattern of rice
Aus
Aman
Boro
0 500
1000 1500 2000 2500 3000 3500 4000
Bar
dh
aman
Ban
kura
Bir
bh
um
Wes
t M
idn
apu
r
East
Mid
nap
ur
Nad
ia
Ho
ogl
y
Ho
wra
h
No
rth
24
…
Zone 7: Productivity pattern of rice
Aus
Aman
Boro
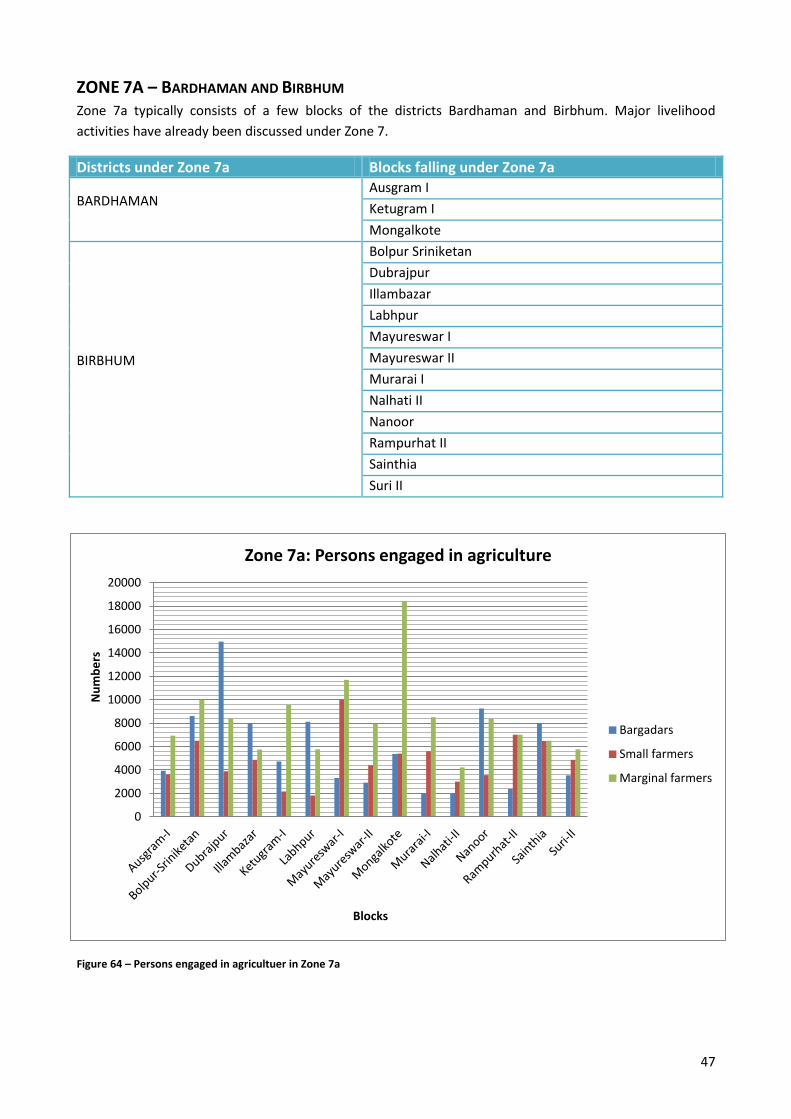
47
ZONE 7A – BARDHAMAN AND BIRBHUM Zone 7a typically consists of a few blocks of the districts Bardhaman and Birbhum. Major livelihood
activities have already been discussed under Zone 7.
Districts under Zone 7a Blocks falling under Zone 7a
BARDHAMAN
Ausgram I
Ketugram I
Mongalkote
BIRBHUM
Bolpur Sriniketan
Dubrajpur
Illambazar
Labhpur
Mayureswar I
Mayureswar II
Murarai I
Nalhati II
Nanoor
Rampurhat II
Sainthia
Suri II
Figure 64 – Persons engaged in agricultuer in Zone 7a
0
2000
4000
6000
8000
10000
12000
14000
16000
18000
20000
Nu
mb
ers
Blocks
Zone 7a: Persons engaged in agriculture
Bargadars
Small farmers
Marginal farmers
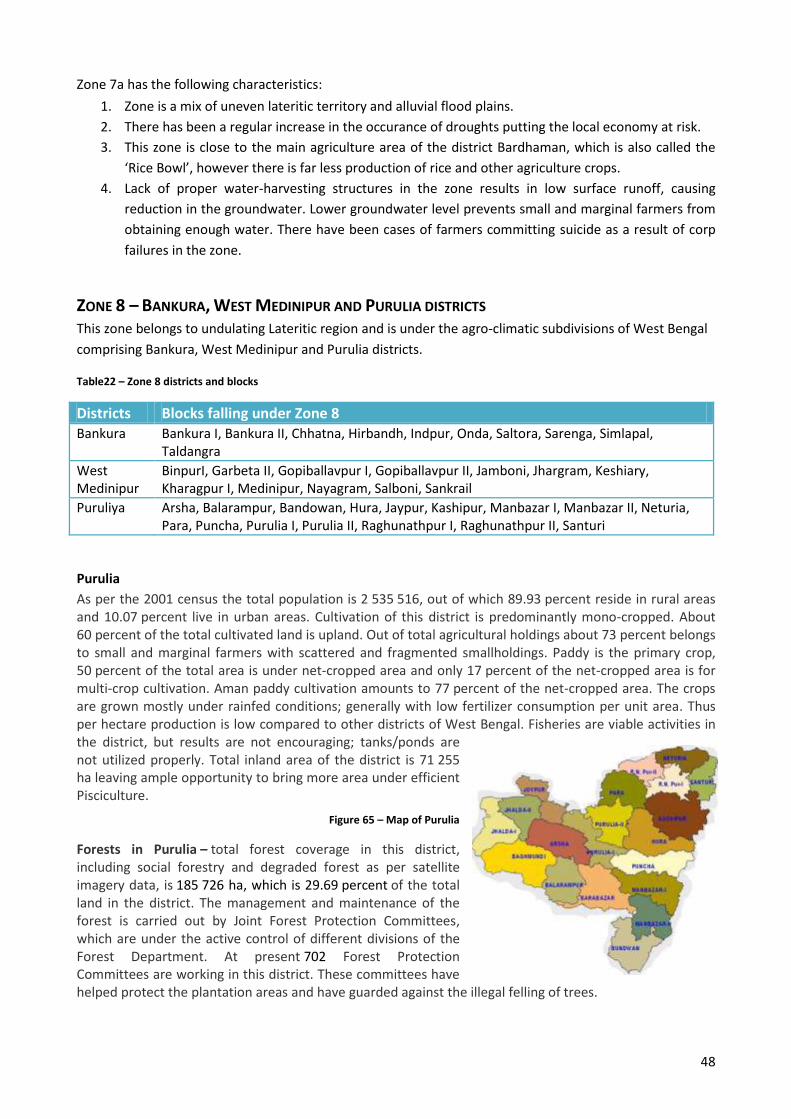
48
Zone 7a has the following characteristics:
1. Zone is a mix of uneven lateritic territory and alluvial flood plains.
2. There has been a regular increase in the occurance of droughts putting the local economy at risk.
3. This zone is close to the main agriculture area of the district Bardhaman, which is also called the
‘Rice Bowl’, however there is far less production of rice and other agriculture crops.
4. Lack of proper water-harvesting structures in the zone results in low surface runoff, causing
reduction in the groundwater. Lower groundwater level prevents small and marginal farmers from
obtaining enough water. There have been cases of farmers committing suicide as a result of corp
failures in the zone.
ZONE 8 – BANKURA, WEST MEDINIPUR AND PURULIA DISTRICTS This zone belongs to undulating Lateritic region and is under the agro-climatic subdivisions of West Bengal
comprising Bankura, West Medinipur and Purulia districts.
Table22 – Zone 8 districts and blocks
Districts Blocks falling under Zone 8 Bankura Bankura I, Bankura II, Chhatna, Hirbandh, Indpur, Onda, Saltora, Sarenga, Simlapal,
Taldangra
West Medinipur
BinpurI, Garbeta II, Gopiballavpur I, Gopiballavpur II, Jamboni, Jhargram, Keshiary, Kharagpur I, Medinipur, Nayagram, Salboni, Sankrail
Puruliya Arsha, Balarampur, Bandowan, Hura, Jaypur, Kashipur, Manbazar I, Manbazar II, Neturia, Para, Puncha, Purulia I, Purulia II, Raghunathpur I, Raghunathpur II, Santuri
Purulia
As per the 2001 census the total population is 2 535 516, out of which 89.93 percent reside in rural areas and 10.07 percent live in urban areas. Cultivation of this district is predominantly mono-cropped. About 60 percent of the total cultivated land is upland. Out of total agricultural holdings about 73 percent belongs to small and marginal farmers with scattered and fragmented smallholdings. Paddy is the primary crop, 50 percent of the total area is under net-cropped area and only 17 percent of the net-cropped area is for multi-crop cultivation. Aman paddy cultivation amounts to 77 percent of the net-cropped area. The crops are grown mostly under rainfed conditions; generally with low fertilizer consumption per unit area. Thus per hectare production is low compared to other districts of West Bengal. Fisheries are viable activities in the district, but results are not encouraging; tanks/ponds are not utilized properly. Total inland area of the district is 71 255 ha leaving ample opportunity to bring more area under efficient Pisciculture.
Figure 65 – Map of Purulia
Forests in Purulia – total forest coverage in this district, including social forestry and degraded forest as per satellite imagery data, is 185 726 ha, which is 29.69 percent of the total land in the district. The management and maintenance of the forest is carried out by Joint Forest Protection Committees, which are under the active control of different divisions of the Forest Department. At present 702 Forest Protection Committees are working in this district. These committees have helped protect the plantation areas and have guarded against the illegal felling of trees.

49
The natural forests are mostly mixed and restricted to the northwest covering the Ajodhya and Panchet
hills of the northeast. As per remote sensing data the forest cover of this district is increasing as compared
to its past status. The extensive farm and social forestry plantation programmes may have largely
contributed to the increase in forest cover.
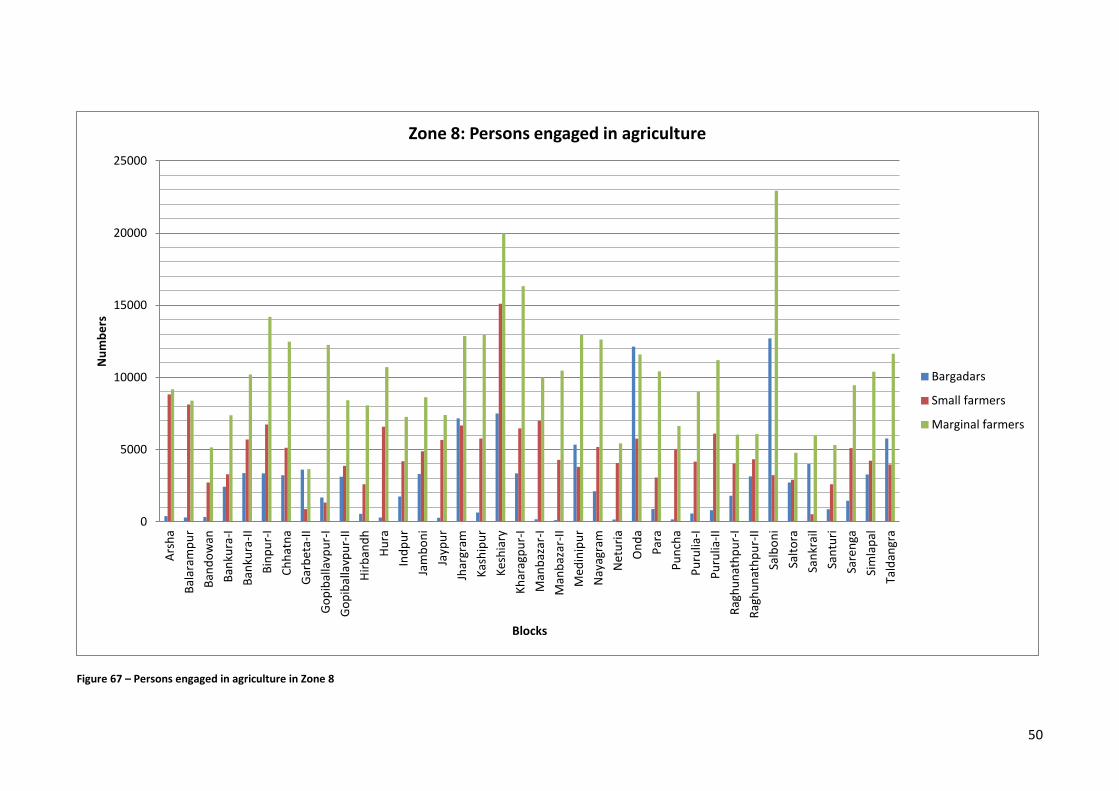
50
Figure 67 – Persons engaged in agriculture in Zone 8
0
5000
10000
15000
20000
25000 A
rsh
a
Bal
aram
pu
r
Ban
do
wan
Ban
kura
-I
Ban
kura
-II
Bin
pu
r-I
Ch
hat
na
Gar
bet
a-II
Go
pib
alla
vpu
r-I
Go
pib
alla
vpu
r-II
Hir
ban
dh
Hu
ra
Ind
pu
r
Jam
bo
ni
Jayp
ur
Jhar
gram
Kas
hip
ur
Kes
hia
ry
Kh
arag
pu
r-I
Man
baz
ar-I
Man
baz
ar-I
I
Med
inip
ur
Nay
agra
m
Net
uri
a
On
da
Par
a
Pu
nch
a
Pu
rulia
-I
Pu
rulia
-II
Rag
hu
nat
hp
ur-
I
Rag
hu
nat
hp
ur-
II
Salb
on
i
Salt
ora
San
krai
l
San
turi
Sare
nga
Sim
lap
al
Tald
angr
a
Nu
mb
ers
Blocks
Zone 8: Persons engaged in agriculture
Bargadars
Small farmers
Marginal farmers
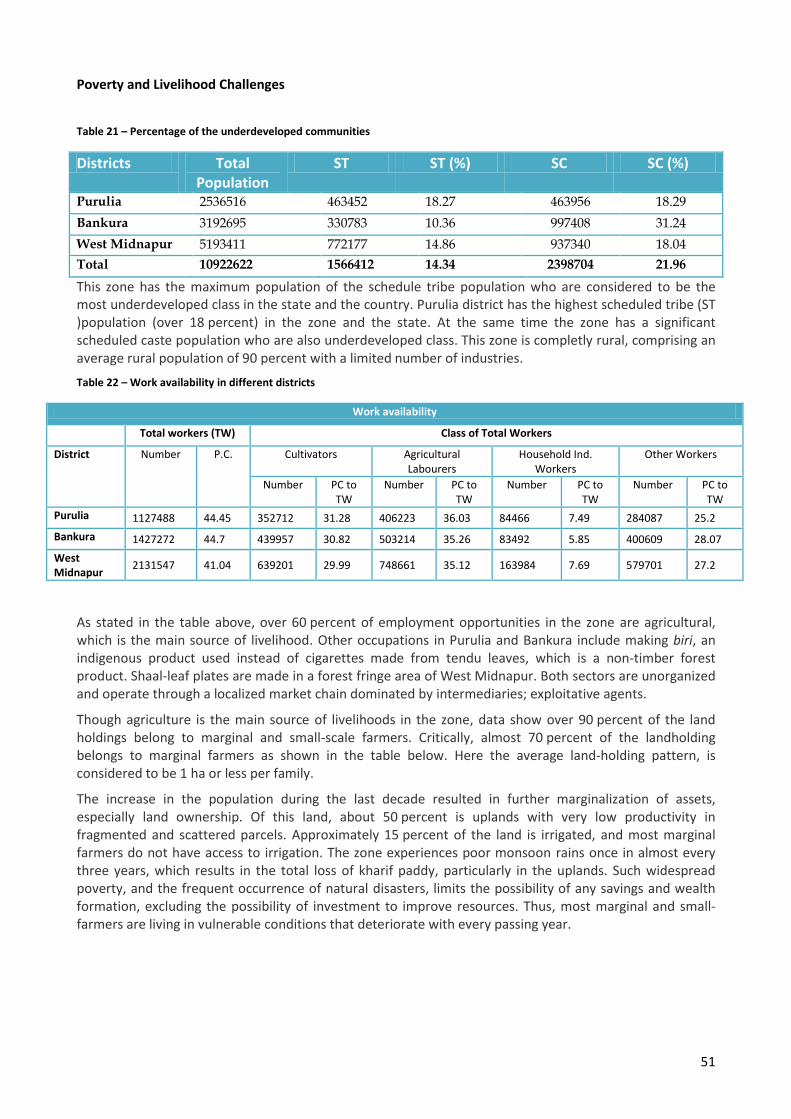
51
Poverty and Livelihood Challenges
Table 21 – Percentage of the underdeveloped communities
Districts Total Population
ST ST (%) SC SC (%)
Purulia 2536516 463452 18.27 463956 18.29
Bankura 3192695 330783 10.36 997408 31.24
West Midnapur 5193411 772177 14.86 937340 18.04
Total 10922622 1566412 14.34 2398704 21.96
This zone has the maximum population of the schedule tribe population who are considered to be the most underdeveloped class in the state and the country. Purulia district has the highest scheduled tribe (ST )population (over 18 percent) in the zone and the state. At the same time the zone has a significant scheduled caste population who are also underdeveloped class. This zone is completly rural, comprising an average rural population of 90 percent with a limited number of industries.
Table 22 – Work availability in different districts
Work availability
Total workers (TW) Class of Total Workers
District Number P.C. Cultivators Agricultural Labourers
Household Ind. Workers
Other Workers
Number PC to TW
Number PC to TW
Number PC to TW
Number PC to TW
Purulia 1127488 44.45 352712 31.28 406223 36.03 84466 7.49 284087 25.2
Bankura 1427272 44.7 439957 30.82 503214 35.26 83492 5.85 400609 28.07
West Midnapur
2131547 41.04 639201 29.99 748661 35.12 163984 7.69 579701 27.2
As stated in the table above, over 60 percent of employment opportunities in the zone are agricultural, which is the main source of livelihood. Other occupations in Purulia and Bankura include making biri, an indigenous product used instead of cigarettes made from tendu leaves, which is a non-timber forest product. Shaal-leaf plates are made in a forest fringe area of West Midnapur. Both sectors are unorganized and operate through a localized market chain dominated by intermediaries; exploitative agents.
Though agriculture is the main source of livelihoods in the zone, data show over 90 percent of the land holdings belong to marginal and small-scale farmers. Critically, almost 70 percent of the landholding belongs to marginal farmers as shown in the table below. Here the average land-holding pattern, is considered to be 1 ha or less per family.
The increase in the population during the last decade resulted in further marginalization of assets, especially land ownership. Of this land, about 50 percent is uplands with very low productivity in fragmented and scattered parcels. Approximately 15 percent of the land is irrigated, and most marginal farmers do not have access to irrigation. The zone experiences poor monsoon rains once in almost every three years, which results in the total loss of kharif paddy, particularly in the uplands. Such widespread poverty, and the frequent occurrence of natural disasters, limits the possibility of any savings and wealth formation, excluding the possibility of investment to improve resources. Thus, most marginal and small-farmers are living in vulnerable conditions that deteriorate with every passing year.
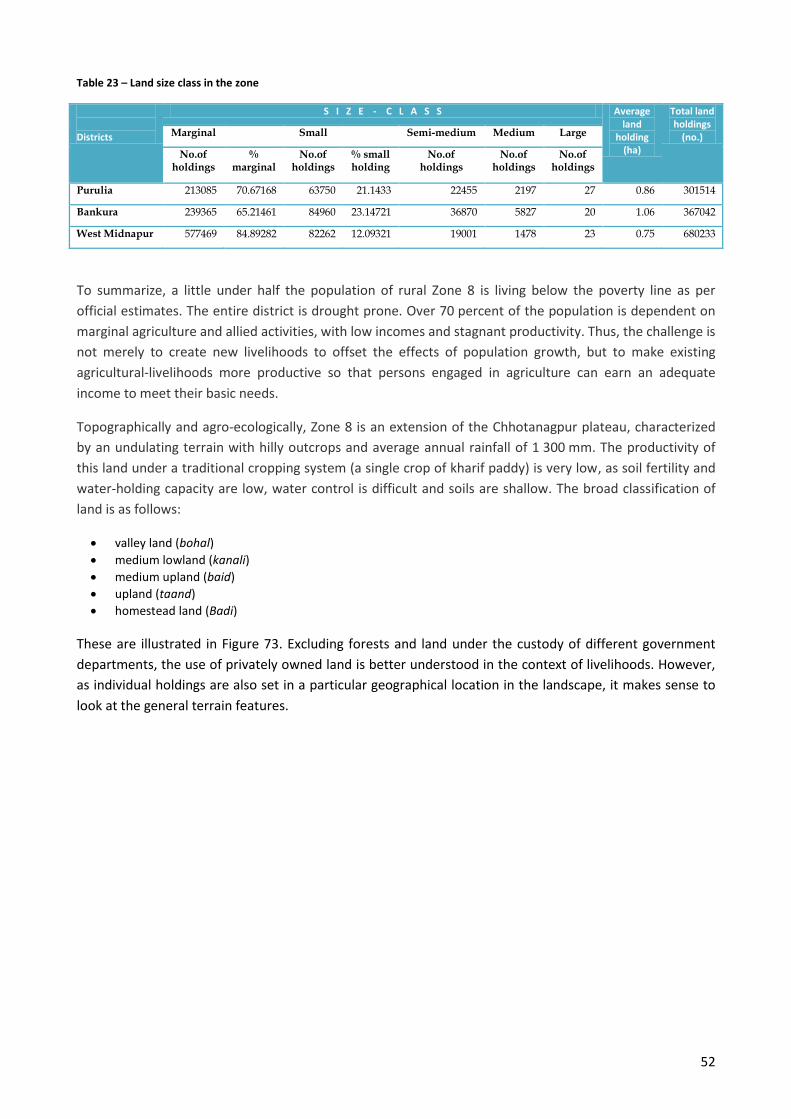
52
Table 23 – Land size class in the zone
Districts
S I Z E - C L A S S Average land
holding (ha)
Total land holdings
(no.) Marginal Small Semi-medium Medium Large
No.of holdings
% marginal
No.of holdings
% small holding
No.of holdings
No.of holdings
No.of holdings
Purulia 213085 70.67168 63750 21.1433 22455 2197 27 0.86 301514
Bankura 239365 65.21461 84960 23.14721 36870 5827 20 1.06 367042
West Midnapur 577469 84.89282 82262 12.09321 19001 1478 23 0.75 680233
To summarize, a little under half the population of rural Zone 8 is living below the poverty line as per
official estimates. The entire district is drought prone. Over 70 percent of the population is dependent on
marginal agriculture and allied activities, with low incomes and stagnant productivity. Thus, the challenge is
not merely to create new livelihoods to offset the effects of population growth, but to make existing
agricultural-livelihoods more productive so that persons engaged in agriculture can earn an adequate
income to meet their basic needs.
Topographically and agro-ecologically, Zone 8 is an extension of the Chhotanagpur plateau, characterized
by an undulating terrain with hilly outcrops and average annual rainfall of 1 300 mm. The productivity of
this land under a traditional cropping system (a single crop of kharif paddy) is very low, as soil fertility and
water-holding capacity are low, water control is difficult and soils are shallow. The broad classification of
land is as follows:
valley land (bohal)
medium lowland (kanali)
medium upland (baid)
upland (taand)
homestead land (Badi)
These are illustrated in Figure 73. Excluding forests and land under the custody of different government
departments, the use of privately owned land is better understood in the context of livelihoods. However,
as individual holdings are also set in a particular geographical location in the landscape, it makes sense to
look at the general terrain features.
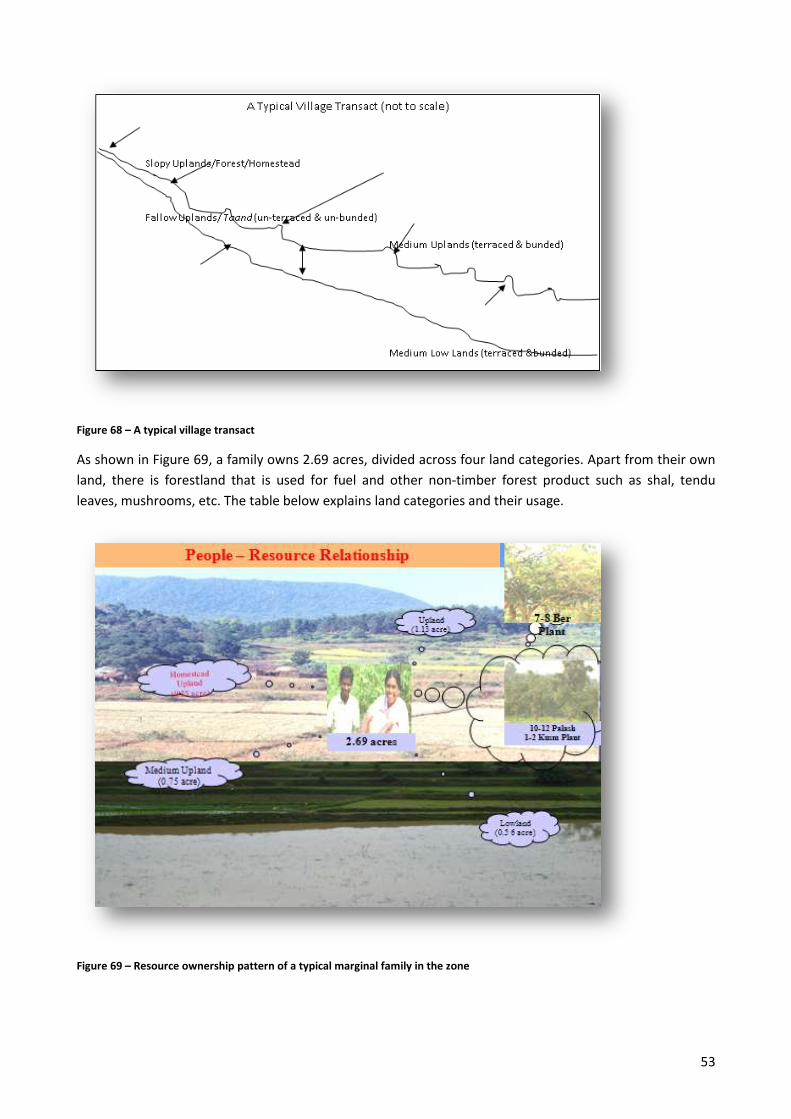
53
Figure 68 – A typical village transact
As shown in Figure 69, a family owns 2.69 acres, divided across four land categories. Apart from their own
land, there is forestland that is used for fuel and other non-timber forest product such as shal, tendu
leaves, mushrooms, etc. The table below explains land categories and their usage.
Figure 69 – Resource ownership pattern of a typical marginal family in the zone
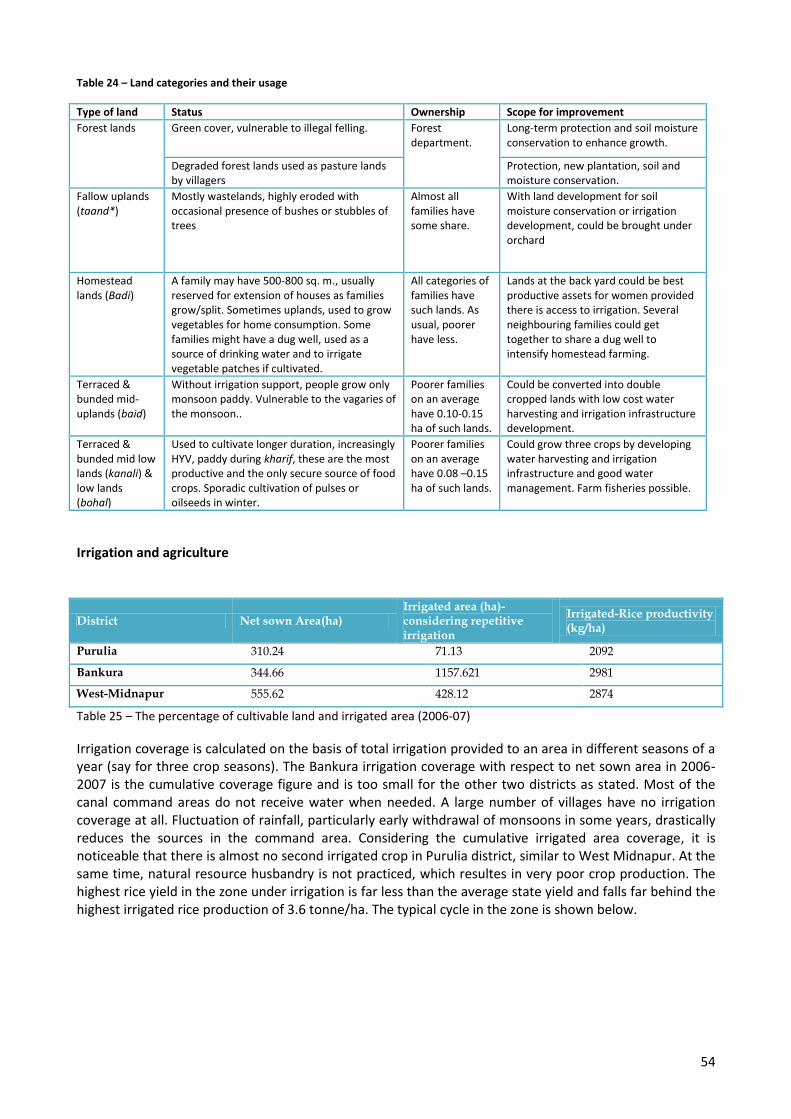
54
Table 24 – Land categories and their usage
Type of land Status Ownership Scope for improvement
Forest lands Green cover, vulnerable to illegal felling. Forest department.
Long-term protection and soil moisture conservation to enhance growth.
Degraded forest lands used as pasture lands by villagers
Protection, new plantation, soil and moisture conservation.
Fallow uplands (taand*)
Mostly wastelands, highly eroded with occasional presence of bushes or stubbles of trees
Almost all families have some share.
With land development for soil moisture conservation or irrigation development, could be brought under orchard
Homestead lands (Badi)
A family may have 500-800 sq. m., usually reserved for extension of houses as families grow/split. Sometimes uplands, used to grow vegetables for home consumption. Some families might have a dug well, used as a source of drinking water and to irrigate vegetable patches if cultivated.
All categories of families have such lands. As usual, poorer have less.
Lands at the back yard could be best productive assets for women provided there is access to irrigation. Several neighbouring families could get together to share a dug well to intensify homestead farming.
Terraced & bunded mid-uplands (baid)
Without irrigation support, people grow only monsoon paddy. Vulnerable to the vagaries of the monsoon..
Poorer families on an average have 0.10-0.15 ha of such lands.
Could be converted into double cropped lands with low cost water harvesting and irrigation infrastructure development.
Terraced & bunded mid low lands (kanali) & low lands (bohal)
Used to cultivate longer duration, increasingly HYV, paddy during kharif, these are the most productive and the only secure source of food crops. Sporadic cultivation of pulses or oilseeds in winter.
Poorer families on an average have 0.08 –0.15 ha of such lands.
Could grow three crops by developing water harvesting and irrigation infrastructure and good water management. Farm fisheries possible.
Irrigation and agriculture
District Net sown Area(ha) Irrigated area (ha)-considering repetitive irrigation
Irrigated-Rice productivity (kg/ha)
Purulia 310.24 71.13 2092
Bankura 344.66 1157.621 2981
West-Midnapur 555.62 428.12 2874
Table 25 – The percentage of cultivable land and irrigated area (2006-07)
Irrigation coverage is calculated on the basis of total irrigation provided to an area in different seasons of a year (say for three crop seasons). The Bankura irrigation coverage with respect to net sown area in 2006-2007 is the cumulative coverage figure and is too small for the other two districts as stated. Most of the canal command areas do not receive water when needed. A large number of villages have no irrigation coverage at all. Fluctuation of rainfall, particularly early withdrawal of monsoons in some years, drastically reduces the sources in the command area. Considering the cumulative irrigated area coverage, it is noticeable that there is almost no second irrigated crop in Purulia district, similar to West Midnapur. At the same time, natural resource husbandry is not practiced, which resultes in very poor crop production. The highest rice yield in the zone under irrigation is far less than the average state yield and falls far behind the highest irrigated rice production of 3.6 tonne/ha. The typical cycle in the zone is shown below.
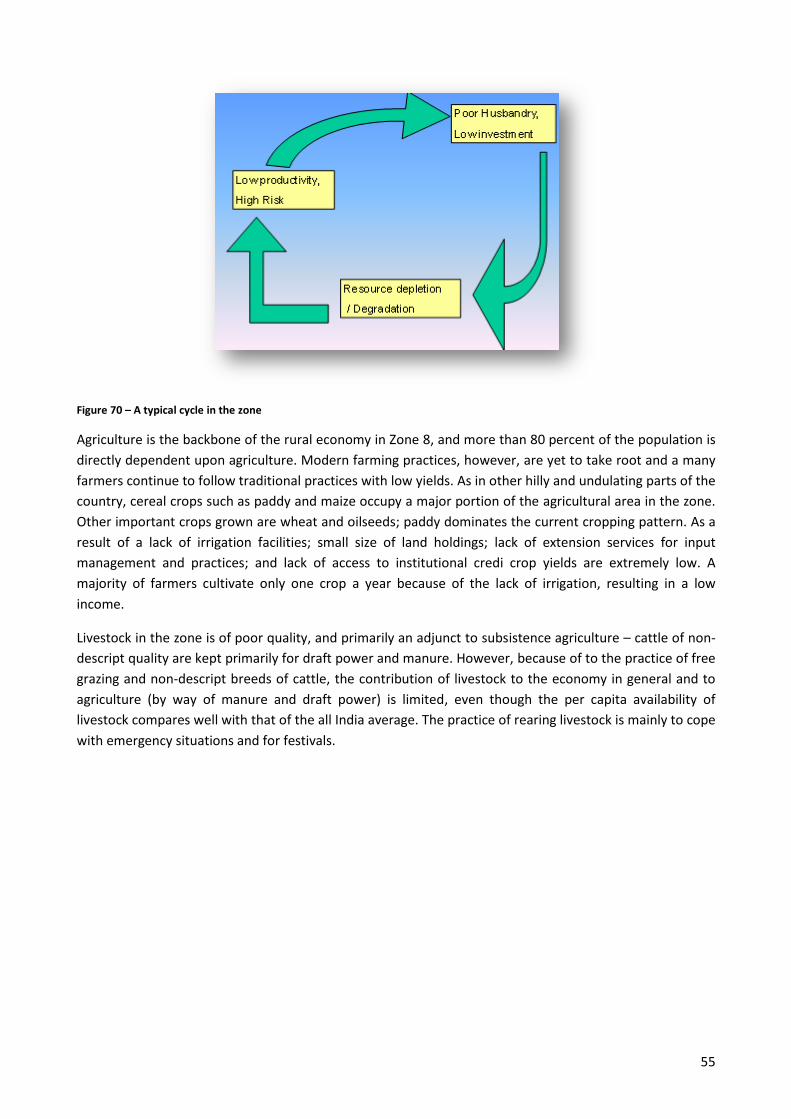
55
Figure 70 – A typical cycle in the zone
Agriculture is the backbone of the rural economy in Zone 8, and more than 80 percent of the population is
directly dependent upon agriculture. Modern farming practices, however, are yet to take root and a many
farmers continue to follow traditional practices with low yields. As in other hilly and undulating parts of the
country, cereal crops such as paddy and maize occupy a major portion of the agricultural area in the zone.
Other important crops grown are wheat and oilseeds; paddy dominates the current cropping pattern. As a
result of a lack of irrigation facilities; small size of land holdings; lack of extension services for input
management and practices; and lack of access to institutional credi crop yields are extremely low. A
majority of farmers cultivate only one crop a year because of the lack of irrigation, resulting in a low
income.
Livestock in the zone is of poor quality, and primarily an adjunct to subsistence agriculture – cattle of non-
descript quality are kept primarily for draft power and manure. However, because of to the practice of free
grazing and non-descript breeds of cattle, the contribution of livestock to the economy in general and to
agriculture (by way of manure and draft power) is limited, even though the per capita availability of
livestock compares well with that of the all India average. The practice of rearing livestock is mainly to cope
with emergency situations and for festivals.
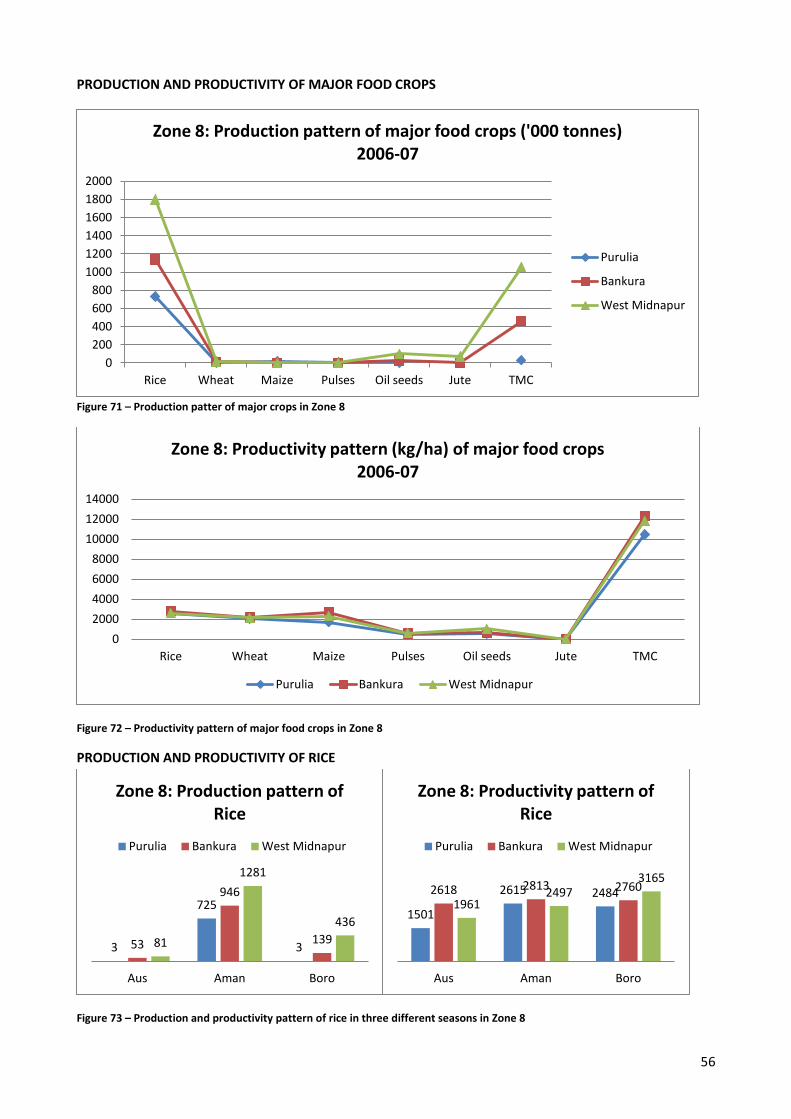
56
PRODUCTION AND PRODUCTIVITY OF MAJOR FOOD CROPS
Figure 71 – Production patter of major crops in Zone 8
Figure 72 – Productivity pattern of major food crops in Zone 8
PRODUCTION AND PRODUCTIVITY OF RICE
Figure 73 – Production and productivity pattern of rice in three different seasons in Zone 8
0
200
400
600
800
1000
1200
1400
1600
1800
2000
Rice Wheat Maize Pulses Oil seeds Jute TMC
Zone 8: Production pattern of major food crops ('000 tonnes) 2006-07
Purulia
Bankura
West Midnapur
0
2000
4000
6000
8000
10000
12000
14000
Rice Wheat Maize Pulses Oil seeds Jute TMC
Zone 8: Productivity pattern (kg/ha) of major food crops 2006-07
Purulia Bankura West Midnapur
3
725
3 53
946
139 81
1281
436
Aus Aman Boro
Zone 8: Production pattern of Rice
Purulia Bankura West Midnapur
1501
2615 2484 2618 2813 2760
1961 2497
3165
Aus Aman Boro
Zone 8: Productivity pattern of Rice
Purulia Bankura West Midnapur
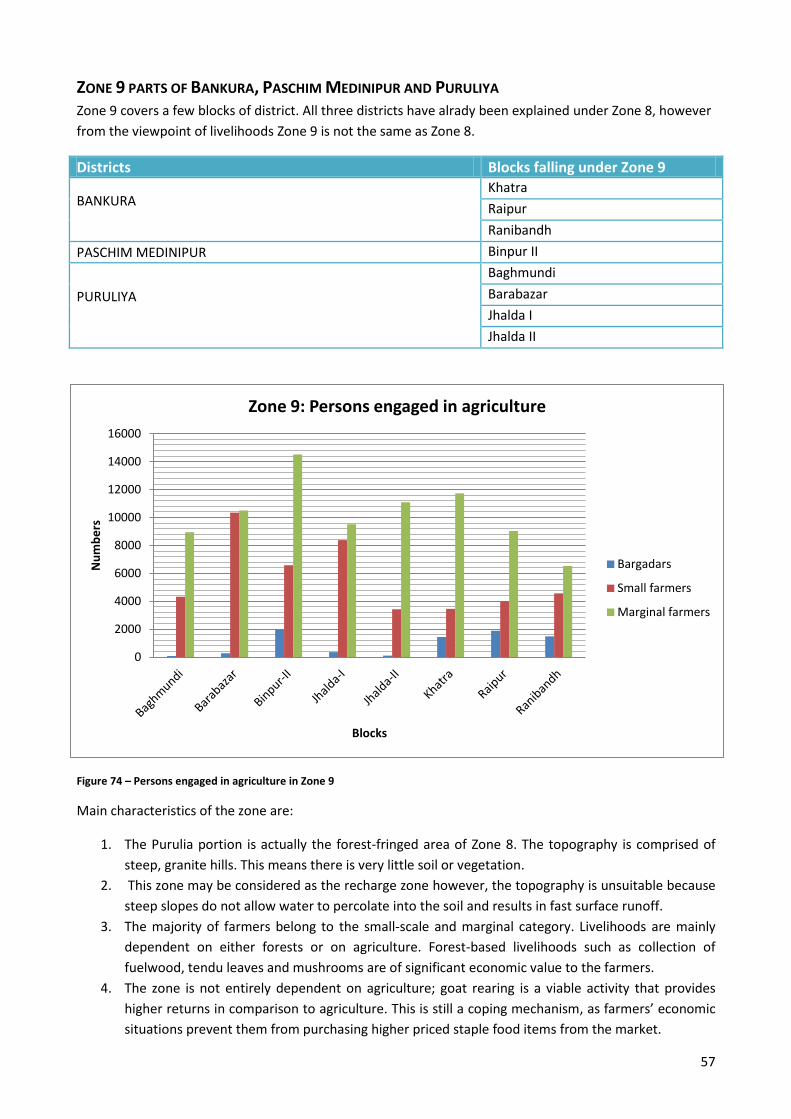
57
ZONE 9 PARTS OF BANKURA, PASCHIM MEDINIPUR AND PURULIYA Zone 9 covers a few blocks of district. All three districts have alrady been explained under Zone 8, however
from the viewpoint of livelihoods Zone 9 is not the same as Zone 8.
Districts Blocks falling under Zone 9
BANKURA
Khatra
Raipur
Ranibandh
PASCHIM MEDINIPUR Binpur II
PURULIYA
Baghmundi
Barabazar
Jhalda I
Jhalda II
Figure 74 – Persons engaged in agriculture in Zone 9
Main characteristics of the zone are:
1. The Purulia portion is actually the forest-fringed area of Zone 8. The topography is comprised of
steep, granite hills. This means there is very little soil or vegetation.
2. This zone may be considered as the recharge zone however, the topography is unsuitable because
steep slopes do not allow water to percolate into the soil and results in fast surface runoff.
3. The majority of farmers belong to the small-scale and marginal category. Livelihoods are mainly
dependent on either forests or on agriculture. Forest-based livelihoods such as collection of
fuelwood, tendu leaves and mushrooms are of significant economic value to the farmers.
4. The zone is not entirely dependent on agriculture; goat rearing is a viable activity that provides
higher returns in comparison to agriculture. This is still a coping mechanism, as farmers’ economic
situations prevent them from purchasing higher priced staple food items from the market.
0
2000
4000
6000
8000
10000
12000
14000
16000
Nu
mb
ers
Blocks
Zone 9: Persons engaged in agriculture
Bargadars
Small farmers
Marginal farmers
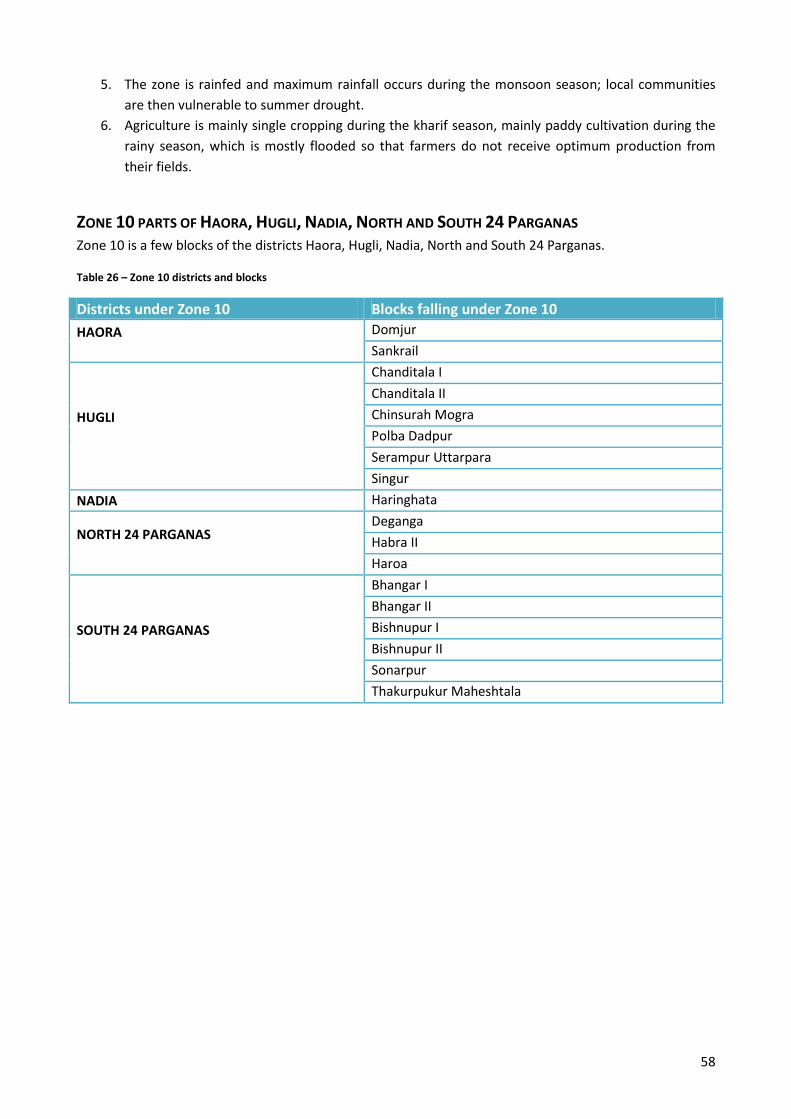
58
5. The zone is rainfed and maximum rainfall occurs during the monsoon season; local communities
are then vulnerable to summer drought.
6. Agriculture is mainly single cropping during the kharif season, mainly paddy cultivation during the
rainy season, which is mostly flooded so that farmers do not receive optimum production from
their fields.
ZONE 10 PARTS OF HAORA, HUGLI, NADIA, NORTH AND SOUTH 24 PARGANAS Zone 10 is a few blocks of the districts Haora, Hugli, Nadia, North and South 24 Parganas.
Table 26 – Zone 10 districts and blocks
Districts under Zone 10 Blocks falling under Zone 10
HAORA
Domjur
Sankrail
HUGLI
Chanditala I
Chanditala II
Chinsurah Mogra
Polba Dadpur
Serampur Uttarpara
Singur
NADIA Haringhata
NORTH 24 PARGANAS
Deganga
Habra II
Haroa
SOUTH 24 PARGANAS
Bhangar I
Bhangar II
Bishnupur I
Bishnupur II
Sonarpur
Thakurpukur Maheshtala
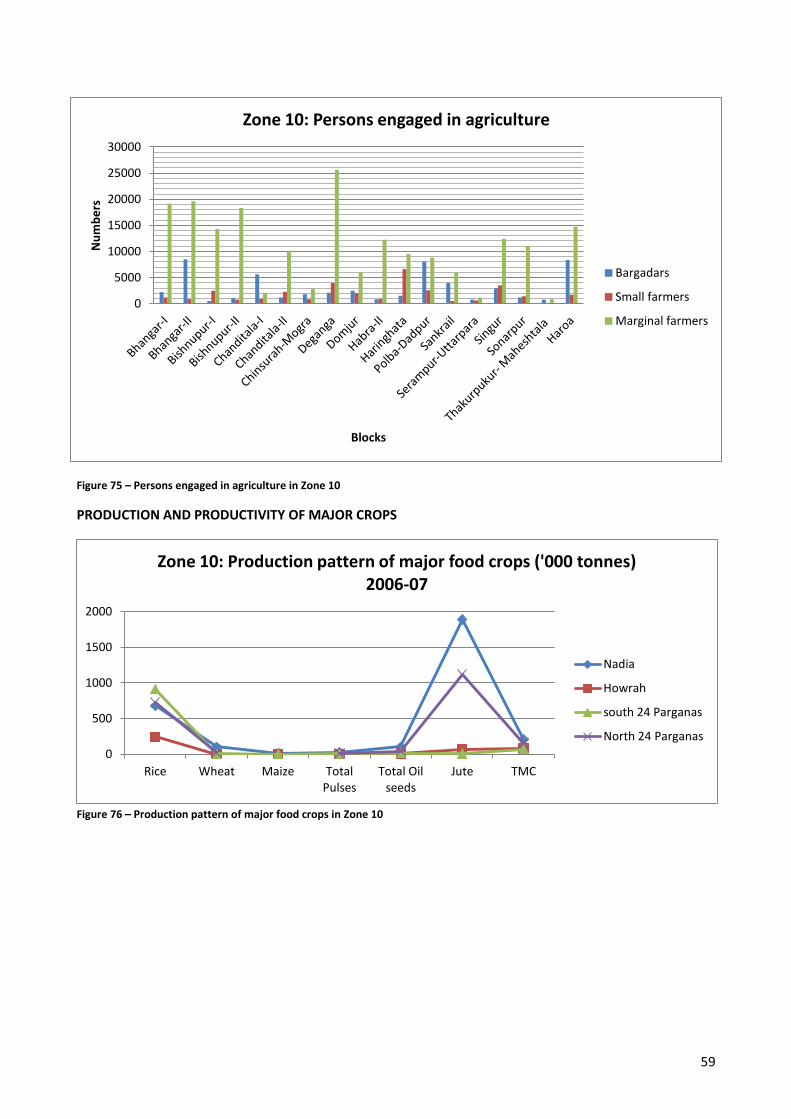
59
Figure 75 – Persons engaged in agriculture in Zone 10
PRODUCTION AND PRODUCTIVITY OF MAJOR CROPS
Figure 76 – Production pattern of major food crops in Zone 10
0
5000
10000
15000
20000
25000
30000
Nu
mb
ers
Blocks
Zone 10: Persons engaged in agriculture
Bargadars
Small farmers
Marginal farmers
0
500
1000
1500
2000
Rice Wheat Maize Total Pulses
Total Oil seeds
Jute TMC
Zone 10: Production pattern of major food crops ('000 tonnes) 2006-07
Nadia
Howrah
south 24 Parganas
North 24 Parganas
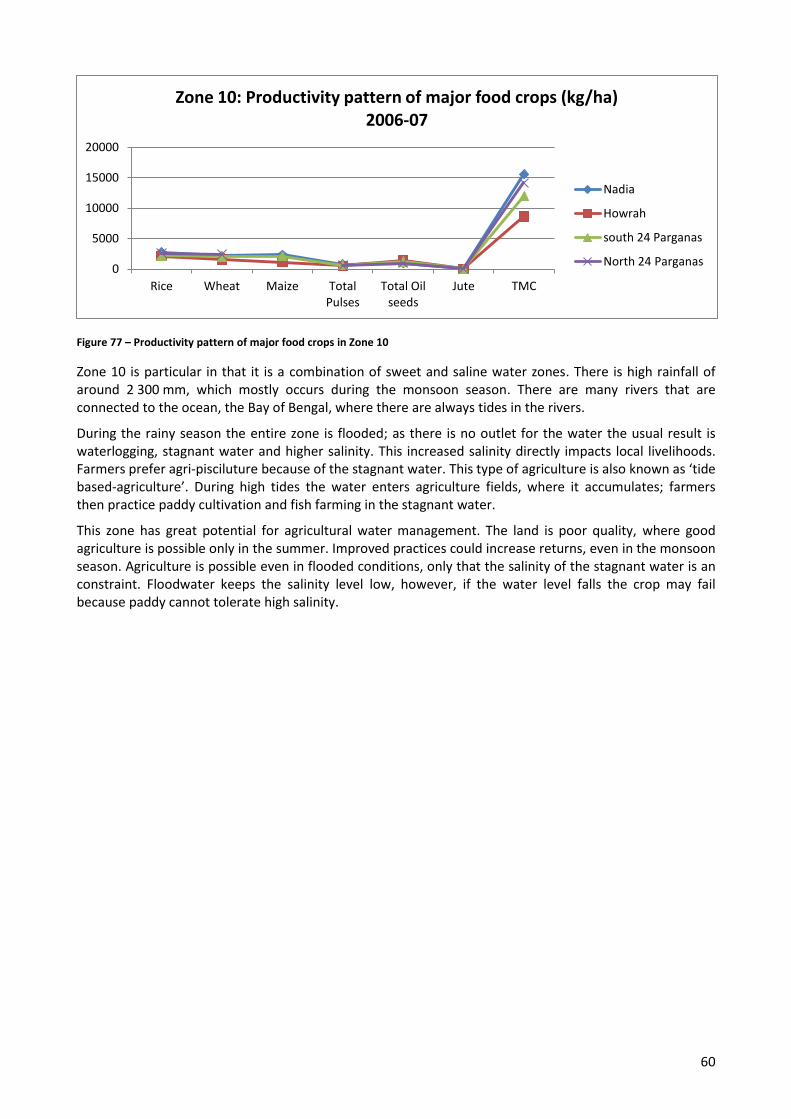
60
Figure 77 – Productivity pattern of major food crops in Zone 10
Zone 10 is particular in that it is a combination of sweet and saline water zones. There is high rainfall of around 2 300 mm, which mostly occurs during the monsoon season. There are many rivers that are connected to the ocean, the Bay of Bengal, where there are always tides in the rivers.
During the rainy season the entire zone is flooded; as there is no outlet for the water the usual result is waterlogging, stagnant water and higher salinity. This increased salinity directly impacts local livelihoods. Farmers prefer agri-pisciluture because of the stagnant water. This type of agriculture is also known as ‘tide based-agriculture’. During high tides the water enters agriculture fields, where it accumulates; farmers then practice paddy cultivation and fish farming in the stagnant water.
This zone has great potential for agricultural water management. The land is poor quality, where good agriculture is possible only in the summer. Improved practices could increase returns, even in the monsoon season. Agriculture is possible even in flooded conditions, only that the salinity of the stagnant water is an constraint. Floodwater keeps the salinity level low, however, if the water level falls the crop may fail because paddy cannot tolerate high salinity.
0
5000
10000
15000
20000
Rice Wheat Maize Total Pulses
Total Oil seeds
Jute TMC
Zone 10: Productivity pattern of major food crops (kg/ha) 2006-07
Nadia
Howrah
south 24 Parganas
North 24 Parganas
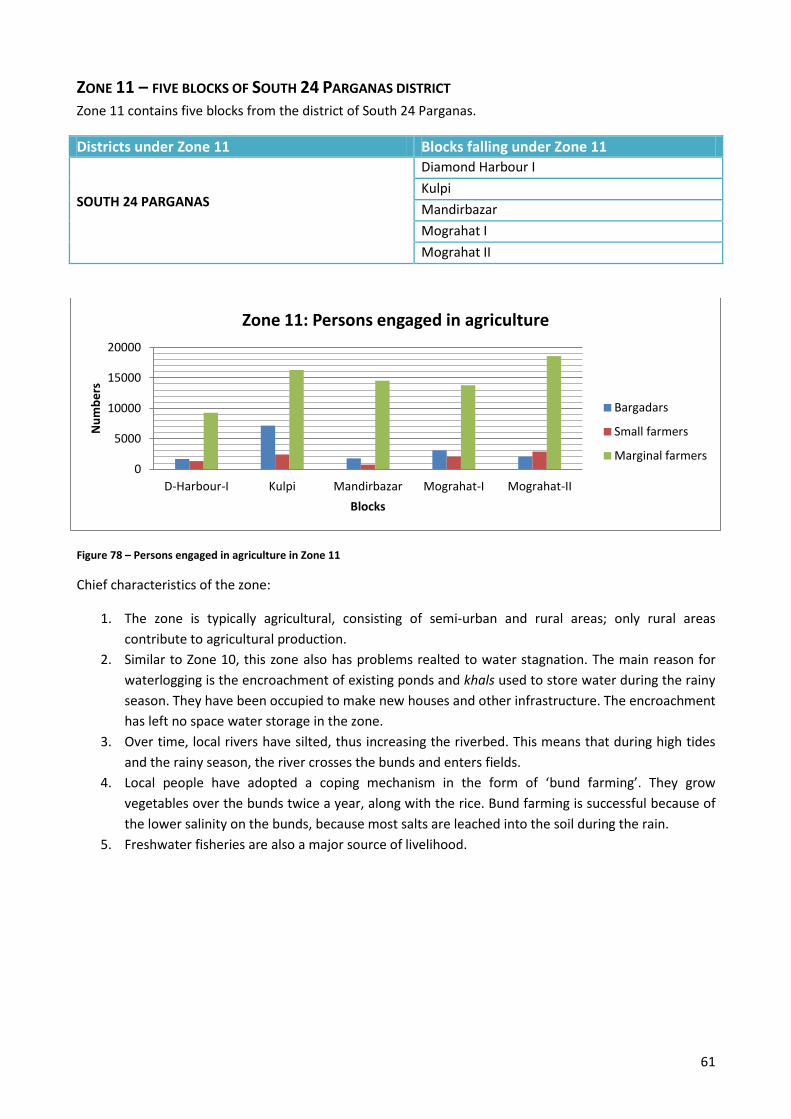
61
ZONE 11 – FIVE BLOCKS OF SOUTH 24 PARGANAS DISTRICT Zone 11 contains five blocks from the district of South 24 Parganas.
Districts under Zone 11 Blocks falling under Zone 11
SOUTH 24 PARGANAS
Diamond Harbour I
Kulpi
Mandirbazar
Mograhat I
Mograhat II
Figure 78 – Persons engaged in agriculture in Zone 11
Chief characteristics of the zone:
1. The zone is typically agricultural, consisting of semi-urban and rural areas; only rural areas
contribute to agricultural production.
2. Similar to Zone 10, this zone also has problems realted to water stagnation. The main reason for
waterlogging is the encroachment of existing ponds and khals used to store water during the rainy
season. They have been occupied to make new houses and other infrastructure. The encroachment
has left no space water storage in the zone.
3. Over time, local rivers have silted, thus increasing the riverbed. This means that during high tides
and the rainy season, the river crosses the bunds and enters fields.
4. Local people have adopted a coping mechanism in the form of ‘bund farming’. They grow
vegetables over the bunds twice a year, along with the rice. Bund farming is successful because of
the lower salinity on the bunds, because most salts are leached into the soil during the rain.
5. Freshwater fisheries are also a major source of livelihood.
0
5000
10000
15000
20000
D-Harbour-I Kulpi Mandirbazar Mograhat-I Mograhat-II
Nu
mb
ers
Blocks
Zone 11: Persons engaged in agriculture
Bargadars
Small farmers
Marginal farmers
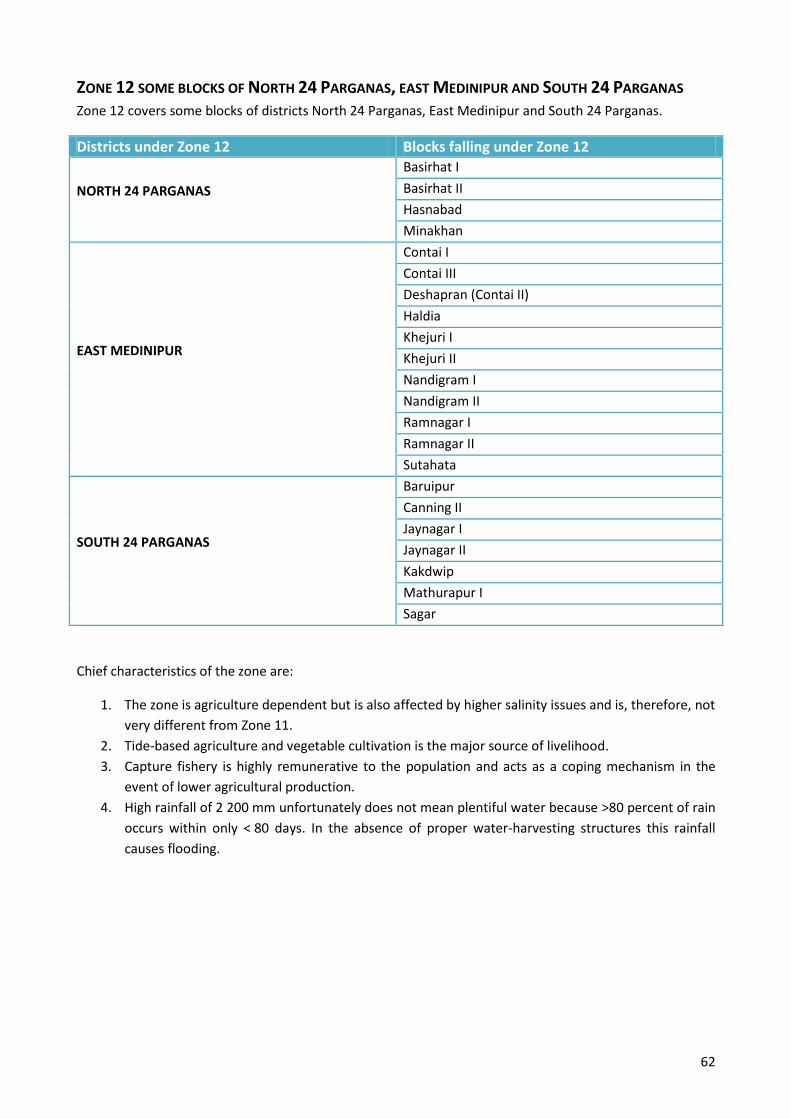
62
ZONE 12 SOME BLOCKS OF NORTH 24 PARGANAS, EAST MEDINIPUR AND SOUTH 24 PARGANAS Zone 12 covers some blocks of districts North 24 Parganas, East Medinipur and South 24 Parganas.
Districts under Zone 12 Blocks falling under Zone 12
NORTH 24 PARGANAS
Basirhat I
Basirhat II
Hasnabad
Minakhan
EAST MEDINIPUR
Contai I
Contai III
Deshapran (Contai II)
Haldia
Khejuri I
Khejuri II
Nandigram I
Nandigram II
Ramnagar I
Ramnagar II
Sutahata
SOUTH 24 PARGANAS
Baruipur
Canning II
Jaynagar I
Jaynagar II
Kakdwip
Mathurapur I
Sagar
Chief characteristics of the zone are:
1. The zone is agriculture dependent but is also affected by higher salinity issues and is, therefore, not
very different from Zone 11. 2. Tide-based agriculture and vegetable cultivation is the major source of livelihood. 3. Capture fishery is highly remunerative to the population and acts as a coping mechanism in the
event of lower agricultural production. 4. High rainfall of 2 200 mm unfortunately does not mean plentiful water because >80 percent of rain
occurs within only < 80 days. In the absence of proper water-harvesting structures this rainfall
causes flooding.
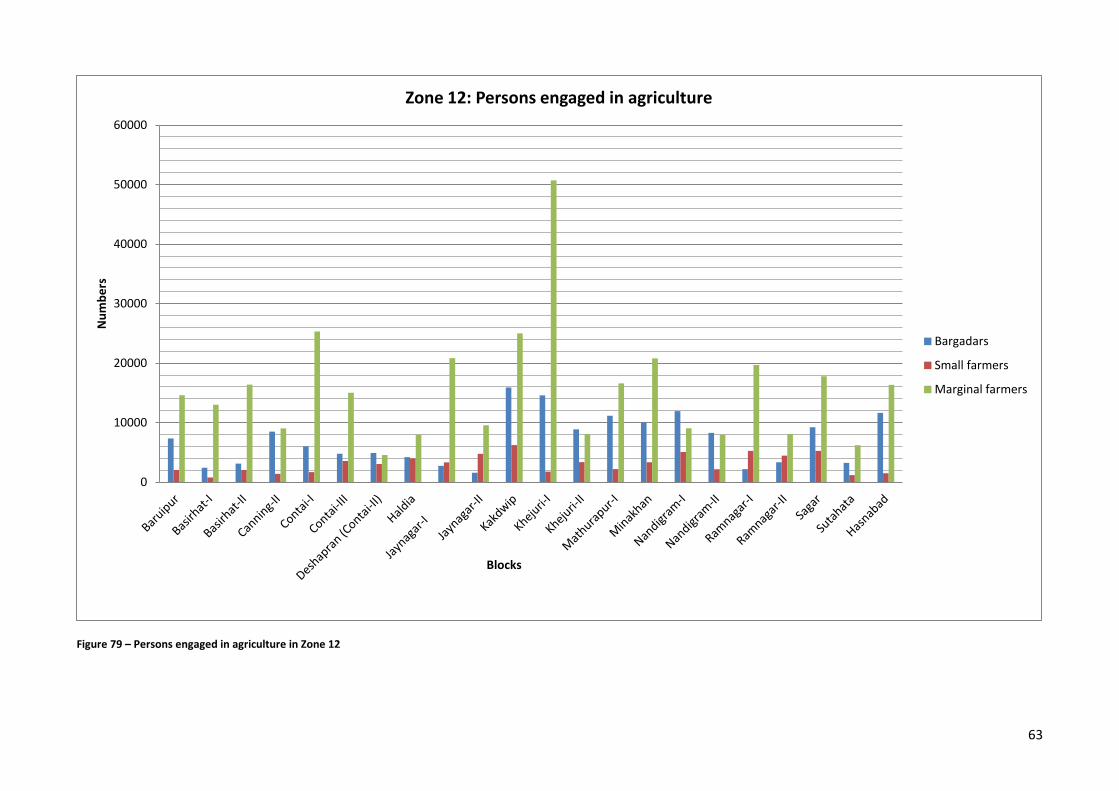
63
Figure 79 – Persons engaged in agriculture in Zone 12
0
10000
20000
30000
40000
50000
60000
Nu
mb
ers
Blocks
Zone 12: Persons engaged in agriculture
Bargadars
Small farmers
Marginal farmers
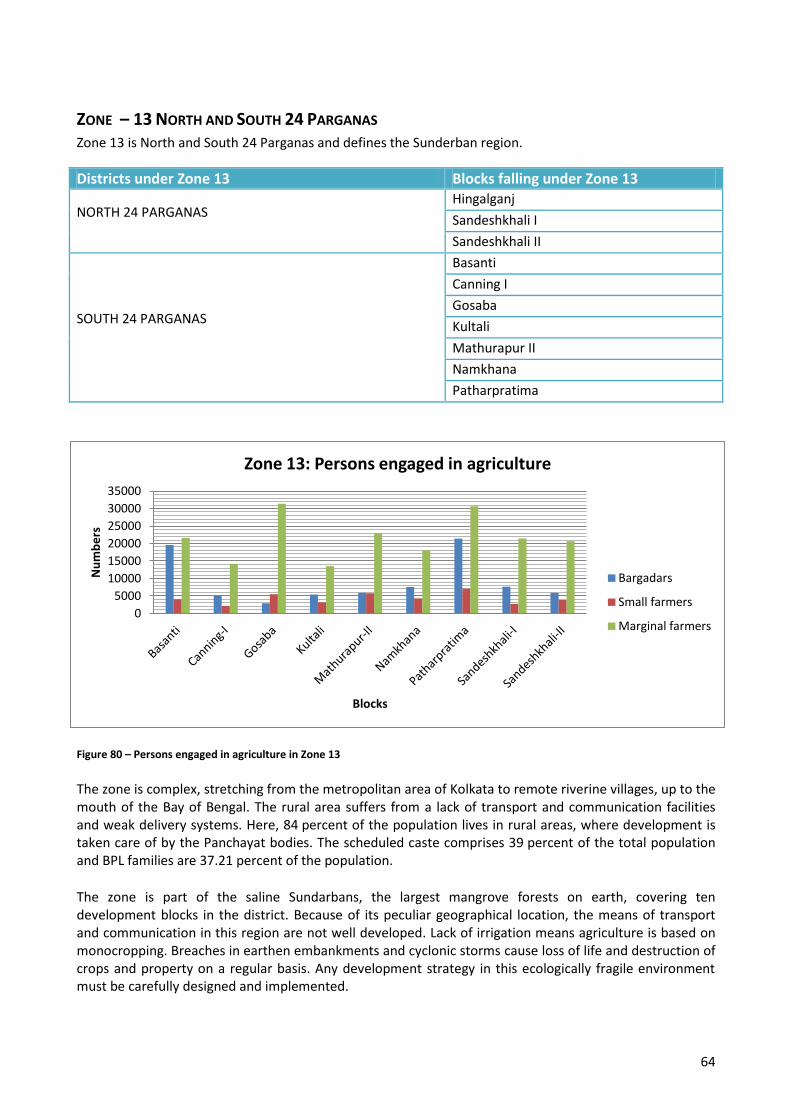
64
ZONE – 13 NORTH AND SOUTH 24 PARGANAS Zone 13 is North and South 24 Parganas and defines the Sunderban region.
Districts under Zone 13 Blocks falling under Zone 13
NORTH 24 PARGANAS
Hingalganj
Sandeshkhali I
Sandeshkhali II
SOUTH 24 PARGANAS
Basanti
Canning I
Gosaba
Kultali
Mathurapur II
Namkhana
Patharpratima
Figure 80 – Persons engaged in agriculture in Zone 13
The zone is complex, stretching from the metropolitan area of Kolkata to remote riverine villages, up to the mouth of the Bay of Bengal. The rural area suffers from a lack of transport and communication facilities and weak delivery systems. Here, 84 percent of the population lives in rural areas, where development is taken care of by the Panchayat bodies. The scheduled caste comprises 39 percent of the total population and BPL families are 37.21 percent of the population.
The zone is part of the saline Sundarbans, the largest mangrove forests on earth, covering ten development blocks in the district. Because of its peculiar geographical location, the means of transport and communication in this region are not well developed. Lack of irrigation means agriculture is based on monocropping. Breaches in earthen embankments and cyclonic storms cause loss of life and destruction of crops and property on a regular basis. Any development strategy in this ecologically fragile environment must be carefully designed and implemented.
0
5000
10000
15000
20000
25000
30000
35000
Nu
mb
ers
Blocks
Zone 13: Persons engaged in agriculture
Bargadars
Small farmers
Marginal farmers
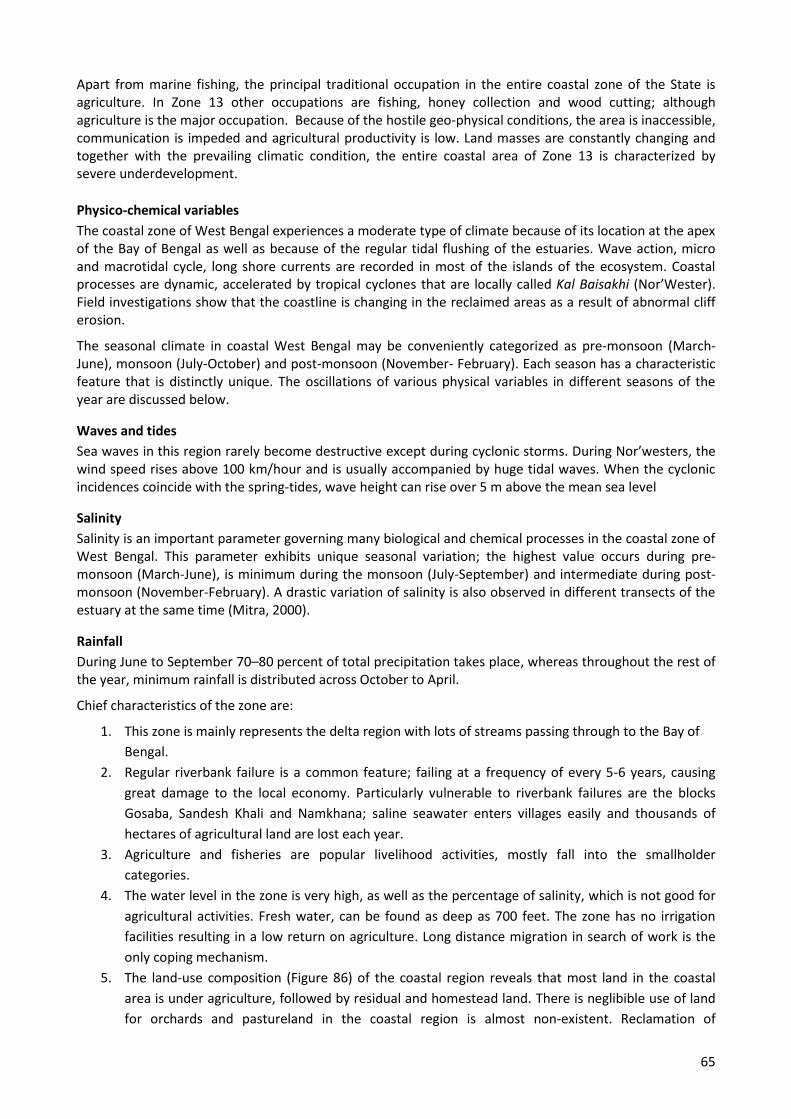
65
Apart from marine fishing, the principal traditional occupation in the entire coastal zone of the State is agriculture. In Zone 13 other occupations are fishing, honey collection and wood cutting; although agriculture is the major occupation. Because of the hostile geo-physical conditions, the area is inaccessible, communication is impeded and agricultural productivity is low. Land masses are constantly changing and together with the prevailing climatic condition, the entire coastal area of Zone 13 is characterized by severe underdevelopment.
Physico-chemical variables
The coastal zone of West Bengal experiences a moderate type of climate because of its location at the apex of the Bay of Bengal as well as because of the regular tidal flushing of the estuaries. Wave action, micro and macrotidal cycle, long shore currents are recorded in most of the islands of the ecosystem. Coastal processes are dynamic, accelerated by tropical cyclones that are locally called Kal Baisakhi (Nor’Wester). Field investigations show that the coastline is changing in the reclaimed areas as a result of abnormal cliff erosion.
The seasonal climate in coastal West Bengal may be conveniently categorized as pre-monsoon (March-June), monsoon (July-October) and post-monsoon (November- February). Each season has a characteristic feature that is distinctly unique. The oscillations of various physical variables in different seasons of the year are discussed below.
Waves and tides
Sea waves in this region rarely become destructive except during cyclonic storms. During Nor’westers, the wind speed rises above 100 km/hour and is usually accompanied by huge tidal waves. When the cyclonic incidences coincide with the spring-tides, wave height can rise over 5 m above the mean sea level
Salinity
Salinity is an important parameter governing many biological and chemical processes in the coastal zone of West Bengal. This parameter exhibits unique seasonal variation; the highest value occurs during pre-monsoon (March-June), is minimum during the monsoon (July-September) and intermediate during post-monsoon (November-February). A drastic variation of salinity is also observed in different transects of the estuary at the same time (Mitra, 2000).
Rainfall
During June to September 70–80 percent of total precipitation takes place, whereas throughout the rest of the year, minimum rainfall is distributed across October to April.
Chief characteristics of the zone are:
1. This zone is mainly represents the delta region with lots of streams passing through to the Bay of
Bengal.
2. Regular riverbank failure is a common feature; failing at a frequency of every 5-6 years, causing
great damage to the local economy. Particularly vulnerable to riverbank failures are the blocks
Gosaba, Sandesh Khali and Namkhana; saline seawater enters villages easily and thousands of
hectares of agricultural land are lost each year.
3. Agriculture and fisheries are popular livelihood activities, mostly fall into the smallholder
categories.
4. The water level in the zone is very high, as well as the percentage of salinity, which is not good for
agricultural activities. Fresh water, can be found as deep as 700 feet. The zone has no irrigation
facilities resulting in a low return on agriculture. Long distance migration in search of work is the
only coping mechanism.
5. The land-use composition (Figure 86) of the coastal region reveals that most land in the coastal
area is under agriculture, followed by residual and homestead land. There is neglibible use of land
for orchards and pastureland in the coastal region is almost non-existent. Reclamation of
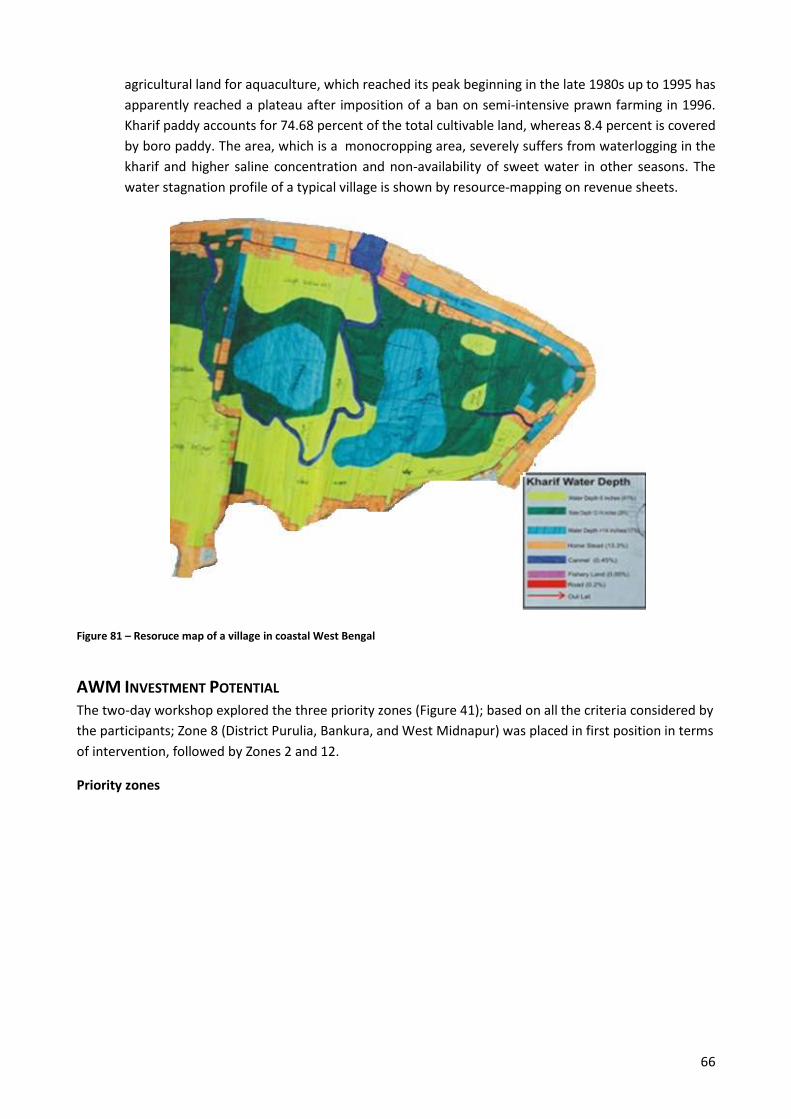
66
agricultural land for aquaculture, which reached its peak beginning in the late 1980s up to 1995 has
apparently reached a plateau after imposition of a ban on semi-intensive prawn farming in 1996.
Kharif paddy accounts for 74.68 percent of the total cultivable land, whereas 8.4 percent is covered
by boro paddy. The area, which is a monocropping area, severely suffers from waterlogging in the
kharif and higher saline concentration and non-availability of sweet water in other seasons. The
water stagnation profile of a typical village is shown by resource-mapping on revenue sheets.
Figure 81 – Resoruce map of a village in coastal West Bengal
AWM INVESTMENT POTENTIAL The two-day workshop explored the three priority zones (Figure 41); based on all the criteria considered by
the participants; Zone 8 (District Purulia, Bankura, and West Midnapur) was placed in first position in terms
of intervention, followed by Zones 2 and 12.
Priority zones
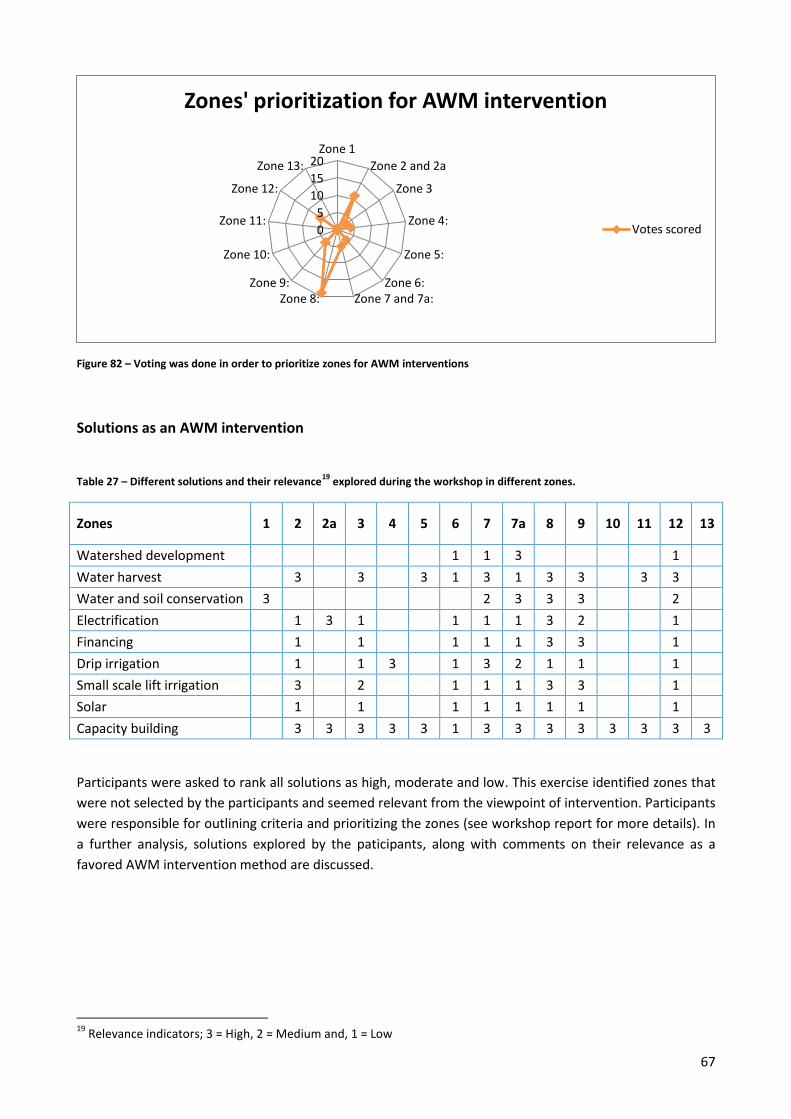
67
Figure 82 – Voting was done in order to prioritize zones for AWM interventions
Solutions as an AWM intervention
Table 27 – Different solutions and their relevance19
explored during the workshop in different zones.
Zones 1 2 2a 3 4 5 6 7 7a 8 9 10 11 12 13
Watershed development
1 1 3
1
Water harvest
3
3
3 1 3 1 3 3
3 3
Water and soil conservation 3
2 3 3 3
2
Electrification
1 3 1
1 1 1 3 2
1
Financing
1
1
1 1 1 3 3
1
Drip irrigation
1
1 3
1 3 2 1 1
1
Small scale lift irrigation
3
2
1 1 1 3 3
1
Solar
1
1
1 1 1 1 1
1
Capacity building
3 3 3 3 3 1 3 3 3 3 3 3 3 3
Participants were asked to rank all solutions as high, moderate and low. This exercise identified zones that
were not selected by the participants and seemed relevant from the viewpoint of intervention. Participants
were responsible for outlining criteria and prioritizing the zones (see workshop report for more details). In
a further analysis, solutions explored by the paticipants, along with comments on their relevance as a
favored AWM intervention method are discussed.
19
Relevance indicators; 3 = High, 2 = Medium and, 1 = Low
0
5
10
15
20 Zone 1
Zone 2 and 2a
Zone 3
Zone 4:
Zone 5:
Zone 6: Zone 7 and 7a: Zone 8:
Zone 9:
Zone 10:
Zone 11:
Zone 12:
Zone 13:
Zones' prioritization for AWM intervention
Votes scored
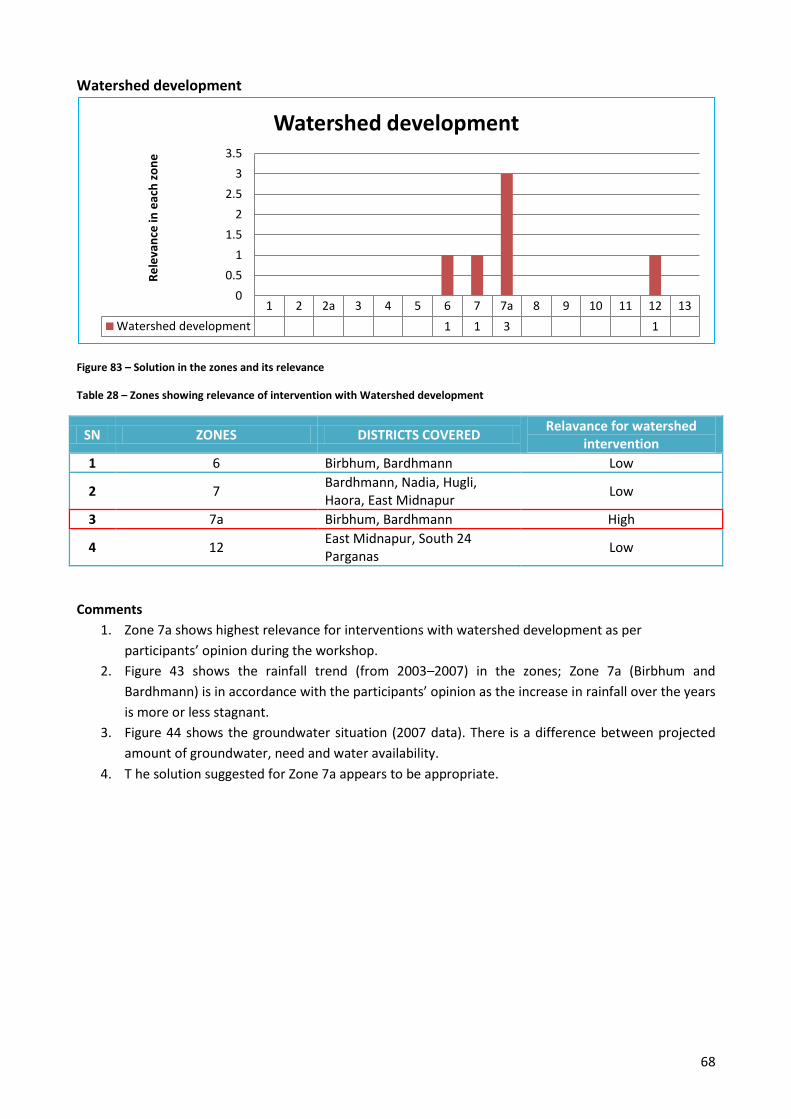
68
Watershed development
Figure 83 – Solution in the zones and its relevance
Table 28 – Zones showing relevance of intervention with Watershed development
SN ZONES DISTRICTS COVERED Relavance for watershed
intervention
1 6 Birbhum, Bardhmann Low
2 7 Bardhmann, Nadia, Hugli, Haora, East Midnapur
Low
3 7a Birbhum, Bardhmann High
4 12 East Midnapur, South 24 Parganas
Low
Comments
1. Zone 7a shows highest relevance for interventions with watershed development as per
participants’ opinion during the workshop.
2. Figure 43 shows the rainfall trend (from 2003–2007) in the zones; Zone 7a (Birbhum and
Bardhmann) is in accordance with the participants’ opinion as the increase in rainfall over the years
is more or less stagnant.
3. Figure 44 shows the groundwater situation (2007 data). There is a difference between projected
amount of groundwater, need and water availability.
4. T he solution suggested for Zone 7a appears to be appropriate.
1 2 2a 3 4 5 6 7 7a 8 9 10 11 12 13
Watershed development 1 1 3 1
0
0.5
1
1.5
2
2.5
3
3.5 R
ele
van
ce in
eac
h z
on
e
Watershed development
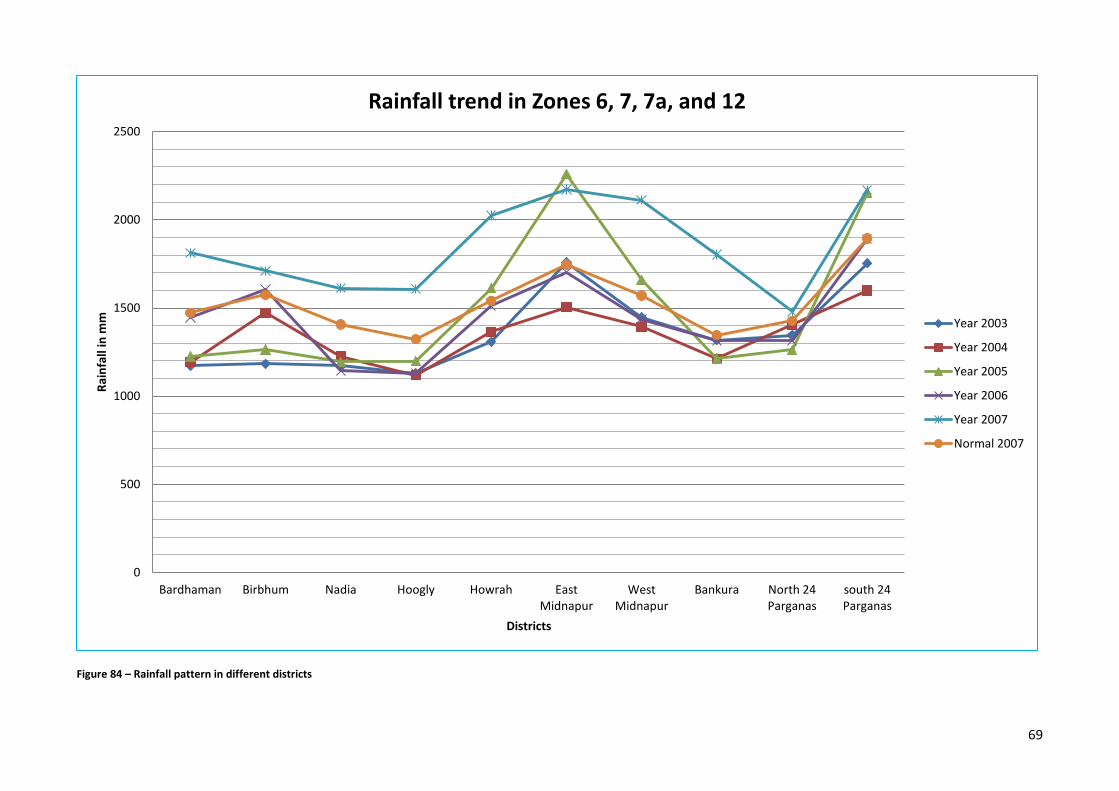
69
Figure 84 – Rainfall pattern in different districts
0
500
1000
1500
2000
2500
Bardhaman Birbhum Nadia Hoogly Howrah East Midnapur
West Midnapur
Bankura North 24 Parganas
south 24 Parganas
Rai
nfa
ll in
mm
Districts
Rainfall trend in Zones 6, 7, 7a, and 12
Year 2003
Year 2004
Year 2005
Year 2006
Year 2007
Normal 2007
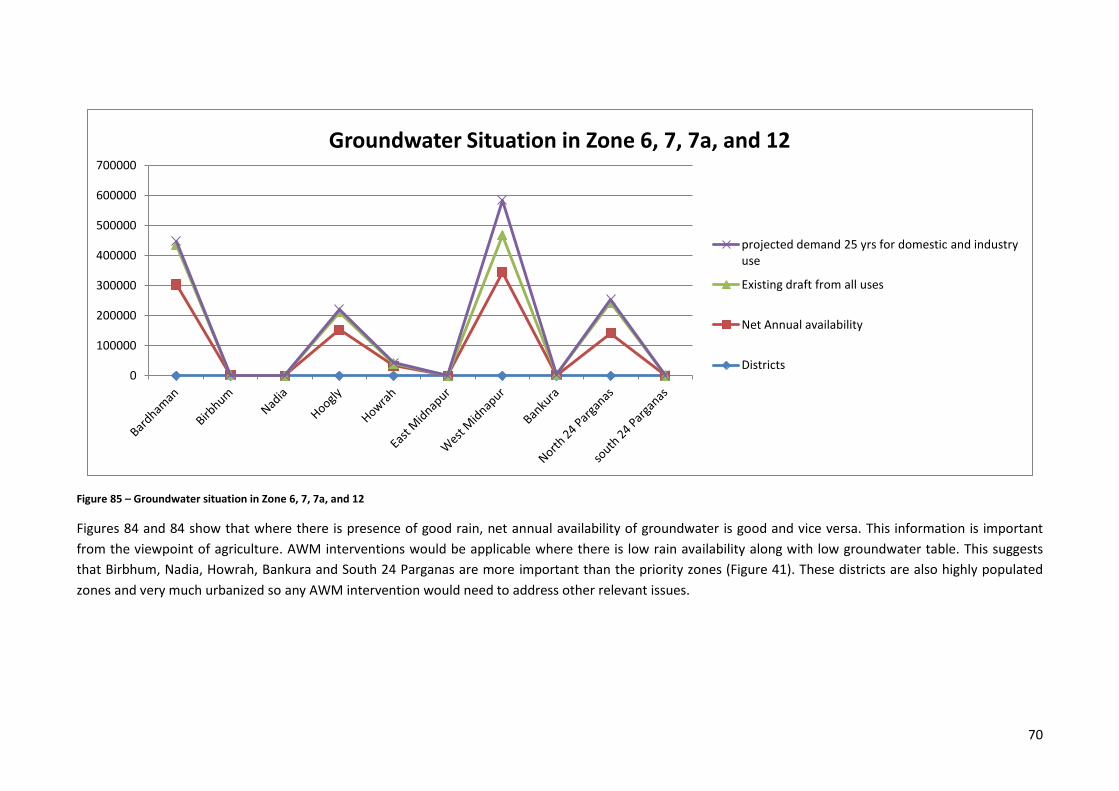
70
Figure 85 – Groundwater situation in Zone 6, 7, 7a, and 12
Figures 84 and 84 show that where there is presence of good rain, net annual availability of groundwater is good and vice versa. This information is important
from the viewpoint of agriculture. AWM interventions would be applicable where there is low rain availability along with low groundwater table. This suggests
that Birbhum, Nadia, Howrah, Bankura and South 24 Parganas are more important than the priority zones (Figure 41). These districts are also highly populated
zones and very much urbanized so any AWM intervention would need to address other relevant issues.
0
100000
200000
300000
400000
500000
600000
700000
Groundwater Situation in Zone 6, 7, 7a, and 12
projected demand 25 yrs for domestic and industry use
Existing draft from all uses
Net Annual availability
Districts
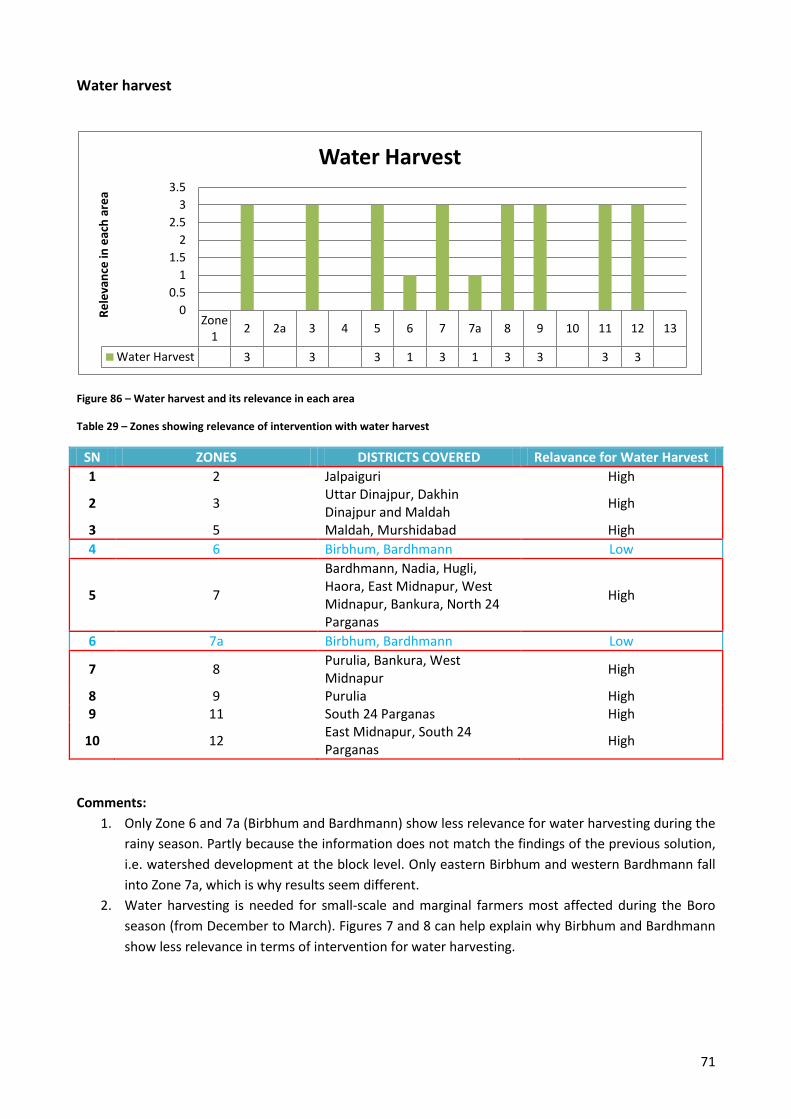
71
Water harvest
Figure 86 – Water harvest and its relevance in each area
Table 29 – Zones showing relevance of intervention with water harvest
SN ZONES DISTRICTS COVERED Relavance for Water Harvest
1 2 Jalpaiguri High
2 3 Uttar Dinajpur, Dakhin Dinajpur and Maldah
High
3 5 Maldah, Murshidabad High
4 6 Birbhum, Bardhmann Low
5 7
Bardhmann, Nadia, Hugli, Haora, East Midnapur, West Midnapur, Bankura, North 24 Parganas
High
6 7a Birbhum, Bardhmann Low
7 8 Purulia, Bankura, West Midnapur
High
8 9 Purulia High 9 11 South 24 Parganas High
10 12 East Midnapur, South 24 Parganas
High
Comments:
1. Only Zone 6 and 7a (Birbhum and Bardhmann) show less relevance for water harvesting during the
rainy season. Partly because the information does not match the findings of the previous solution,
i.e. watershed development at the block level. Only eastern Birbhum and western Bardhmann fall
into Zone 7a, which is why results seem different.
2. Water harvesting is needed for small-scale and marginal farmers most affected during the Boro
season (from December to March). Figures 7 and 8 can help explain why Birbhum and Bardhmann
show less relevance in terms of intervention for water harvesting.
Zone 1
2 2a 3 4 5 6 7 7a 8 9 10 11 12 13
Water Harvest 3 3 3 1 3 1 3 3 3 3
0
0.5
1
1.5
2
2.5
3
3.5
Re
leva
nce
in e
ach
are
a
Water Harvest
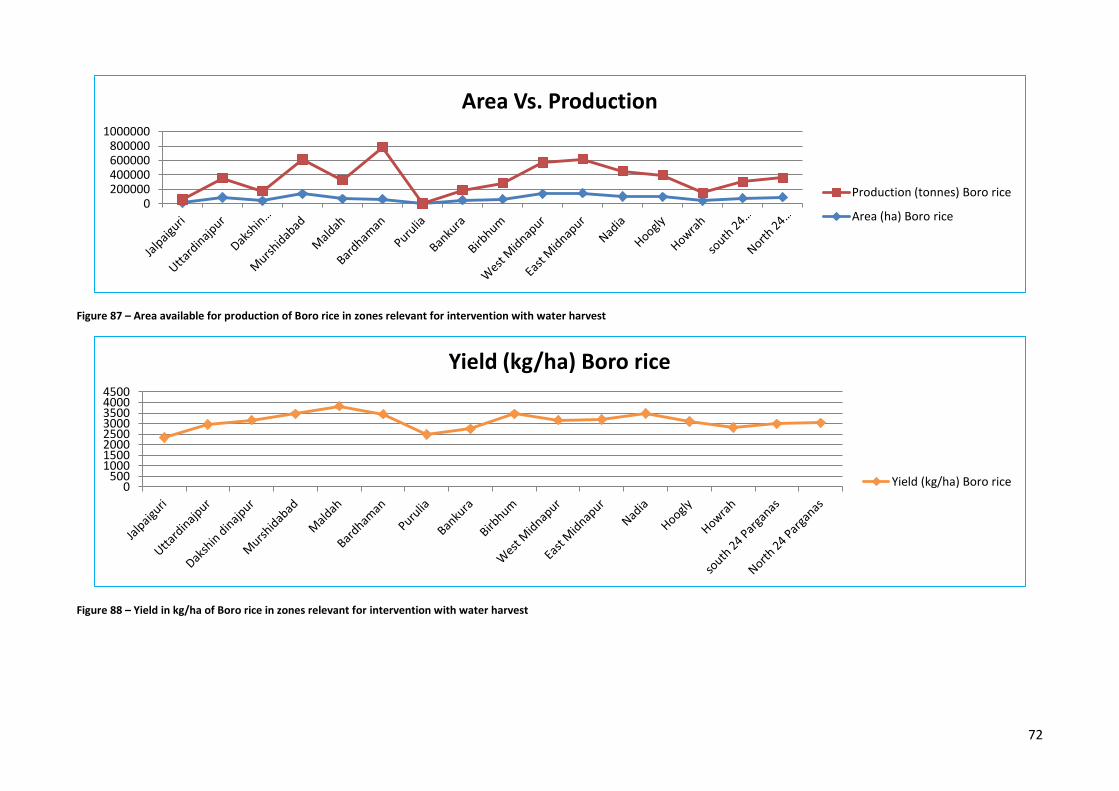
72
Figure 87 – Area available for production of Boro rice in zones relevant for intervention with water harvest
Figure 88 – Yield in kg/ha of Boro rice in zones relevant for intervention with water harvest
0 200000 400000 600000 800000
1000000
Area Vs. Production
Production (tonnes) Boro rice
Area (ha) Boro rice
0 500
1000 1500 2000 2500 3000 3500 4000 4500
Yield (kg/ha) Boro rice
Yield (kg/ha) Boro rice
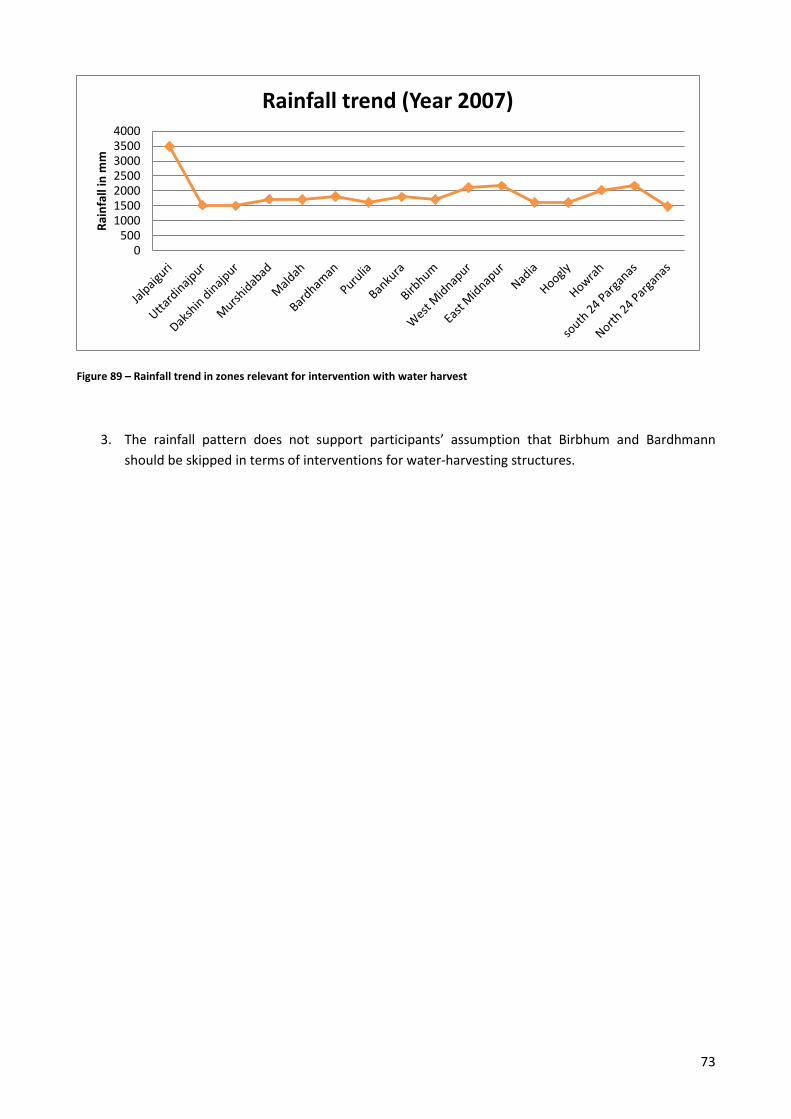
73
Figure 89 – Rainfall trend in zones relevant for intervention with water harvest
3. The rainfall pattern does not support participants’ assumption that Birbhum and Bardhmann
should be skipped in terms of interventions for water-harvesting structures.
0 500
1000 1500 2000 2500 3000 3500 4000
Rai
nfa
ll in
mm
Rainfall trend (Year 2007)
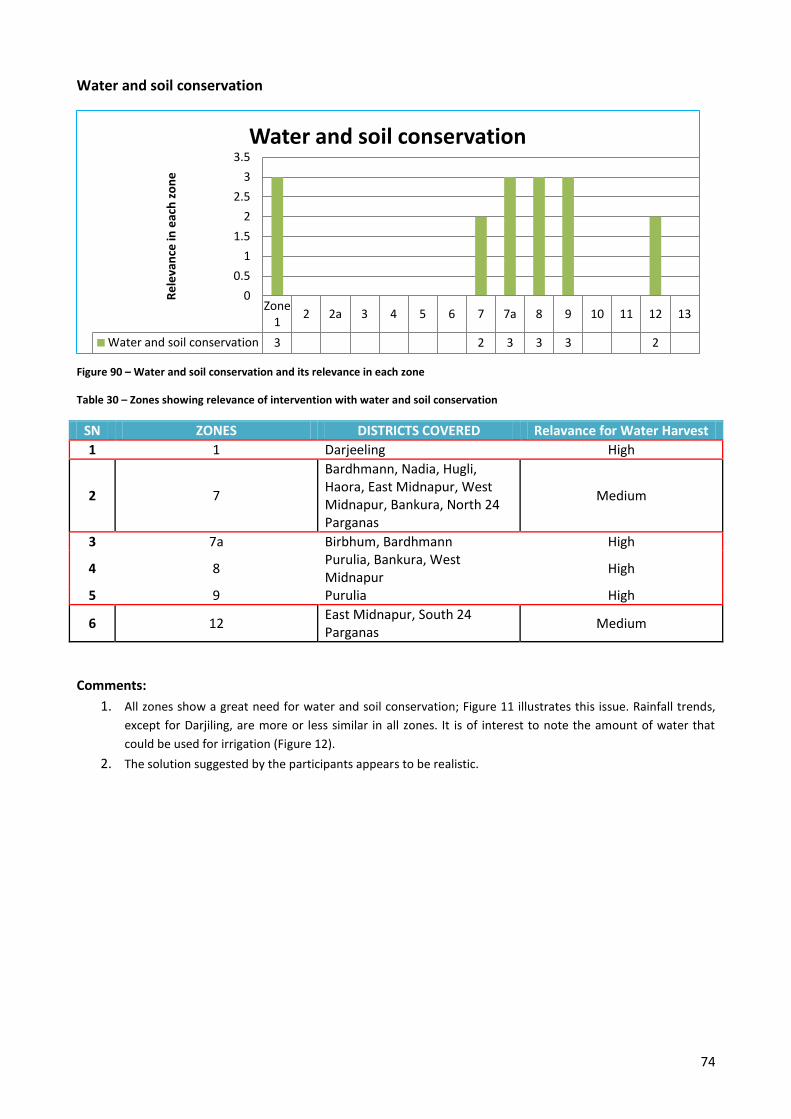
74
Water and soil conservation
Figure 90 – Water and soil conservation and its relevance in each zone
Table 30 – Zones showing relevance of intervention with water and soil conservation
SN ZONES DISTRICTS COVERED Relavance for Water Harvest
1 1 Darjeeling High
2 7
Bardhmann, Nadia, Hugli, Haora, East Midnapur, West Midnapur, Bankura, North 24 Parganas
Medium
3 7a Birbhum, Bardhmann High
4 8 Purulia, Bankura, West Midnapur
High
5 9 Purulia High
6 12 East Midnapur, South 24 Parganas
Medium
Comments:
1. All zones show a great need for water and soil conservation; Figure 11 illustrates this issue. Rainfall trends,
except for Darjiling, are more or less similar in all zones. It is of interest to note the amount of water that
could be used for irrigation (Figure 12).
2. The solution suggested by the participants appears to be realistic.
Zone 1
2 2a 3 4 5 6 7 7a 8 9 10 11 12 13
Water and soil conservation 3 2 3 3 3 2
0
0.5
1
1.5
2
2.5
3
3.5 R
ele
van
ce in
eac
h z
on
e
Water and soil conservation
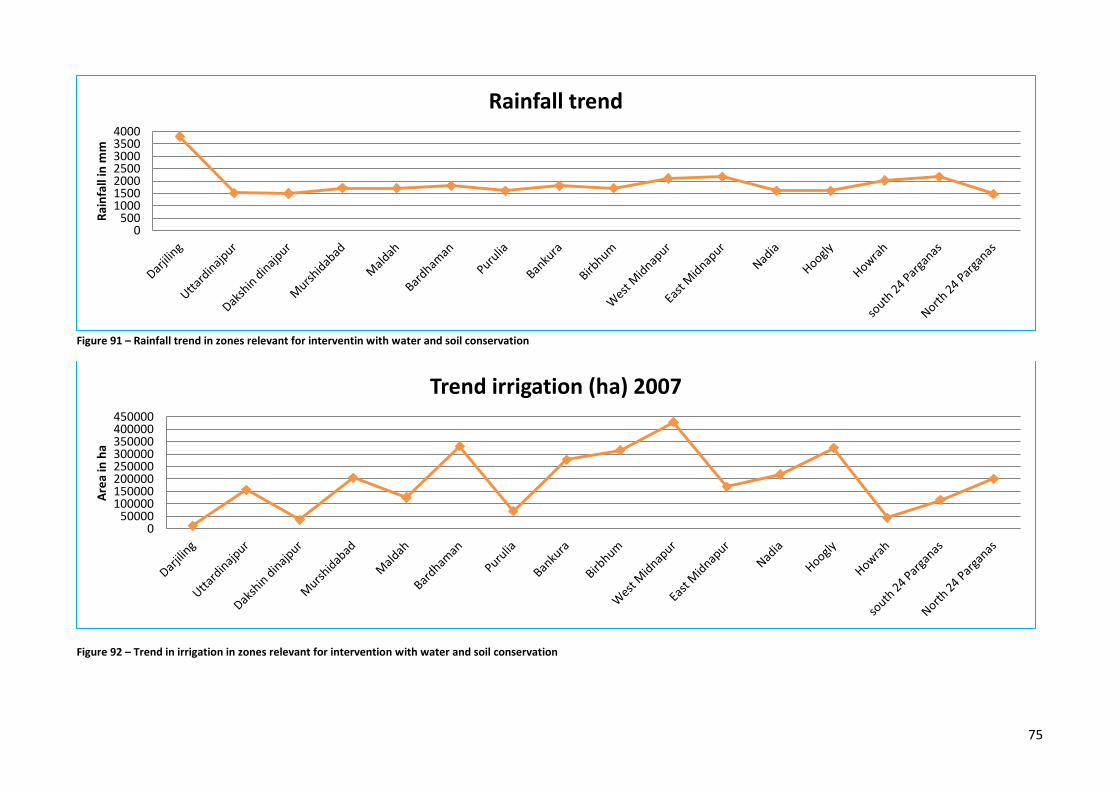
75
Figure 91 – Rainfall trend in zones relevant for interventin with water and soil conservation
Figure 92 – Trend in irrigation in zones relevant for intervention with water and soil conservation
0 500
1000 1500 2000 2500 3000 3500 4000
Rai
nfa
ll in
mm
Rainfall trend
0 50000
100000 150000 200000 250000 300000 350000 400000 450000
Are
a in
ha
Trend irrigation (ha) 2007
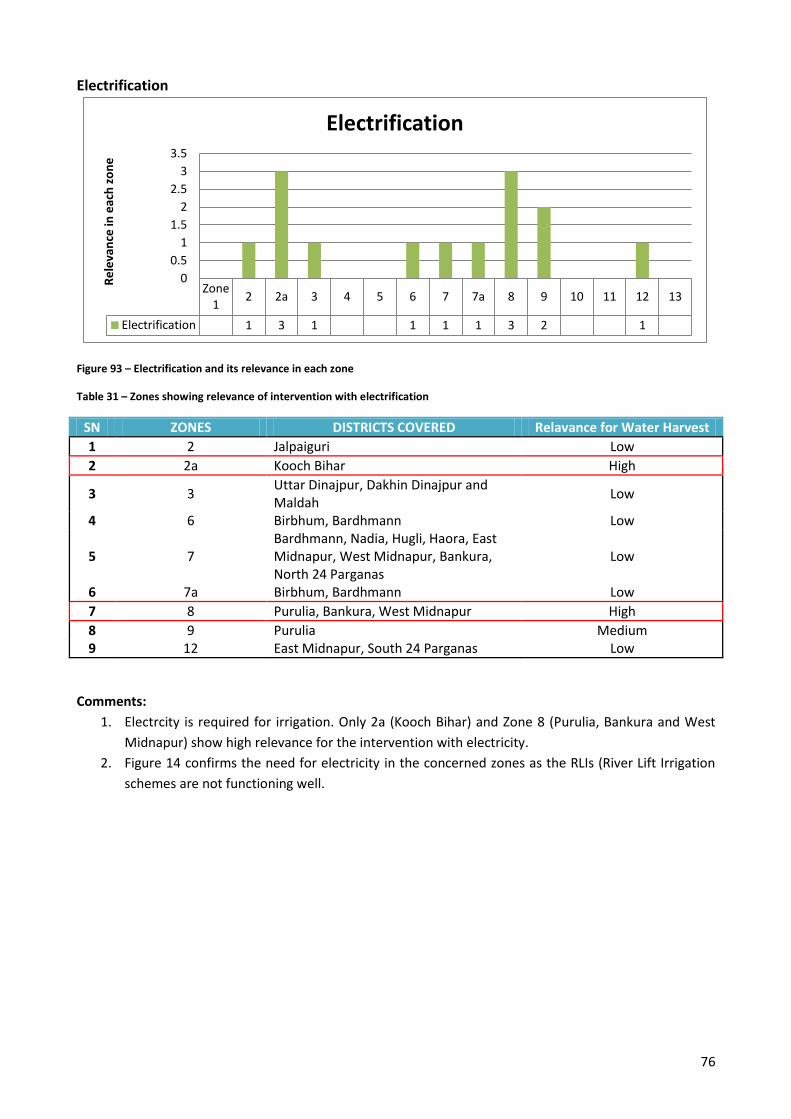
76
Electrification
Figure 93 – Electrification and its relevance in each zone
Table 31 – Zones showing relevance of intervention with electrification
SN ZONES DISTRICTS COVERED Relavance for Water Harvest
1 2 Jalpaiguri Low
2 2a Kooch Bihar High
3 3 Uttar Dinajpur, Dakhin Dinajpur and Maldah
Low
4 6 Birbhum, Bardhmann Low
5 7 Bardhmann, Nadia, Hugli, Haora, East Midnapur, West Midnapur, Bankura, North 24 Parganas
Low
6 7a Birbhum, Bardhmann Low
7 8 Purulia, Bankura, West Midnapur High
8 9 Purulia Medium 9 12 East Midnapur, South 24 Parganas Low
Comments:
1. Electrcity is required for irrigation. Only 2a (Kooch Bihar) and Zone 8 (Purulia, Bankura and West
Midnapur) show high relevance for the intervention with electricity.
2. Figure 14 confirms the need for electricity in the concerned zones as the RLIs (River Lift Irrigation
schemes are not functioning well.
Zone 1
2 2a 3 4 5 6 7 7a 8 9 10 11 12 13
Electrification 1 3 1 1 1 1 3 2 1
0
0.5
1
1.5
2
2.5
3
3.5
Re
leva
nce
in e
ach
zo
ne
Electrification
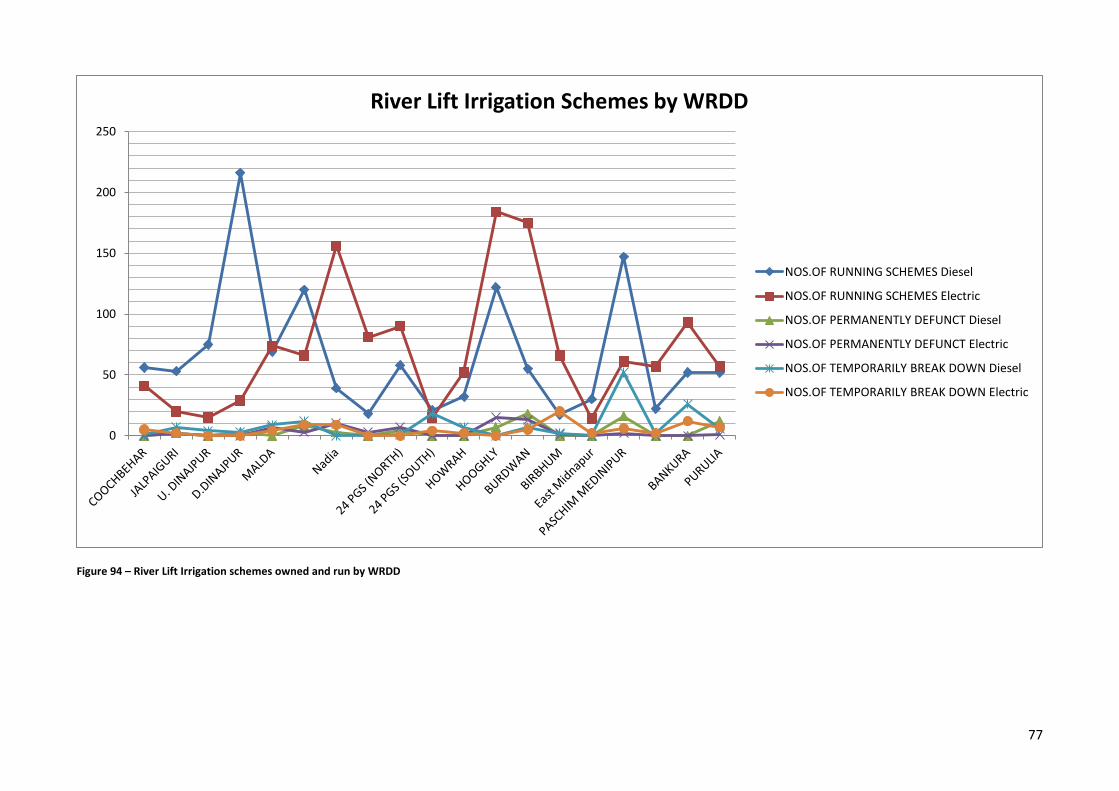
77
Figure 94 – River Lift Irrigation schemes owned and run by WRDD
0
50
100
150
200
250
River Lift Irrigation Schemes by WRDD
NOS.OF RUNNING SCHEMES Diesel
NOS.OF RUNNING SCHEMES Electric
NOS.OF PERMANENTLY DEFUNCT Diesel
NOS.OF PERMANENTLY DEFUNCT Electric
NOS.OF TEMPORARILY BREAK DOWN Diesel
NOS.OF TEMPORARILY BREAK DOWN Electric
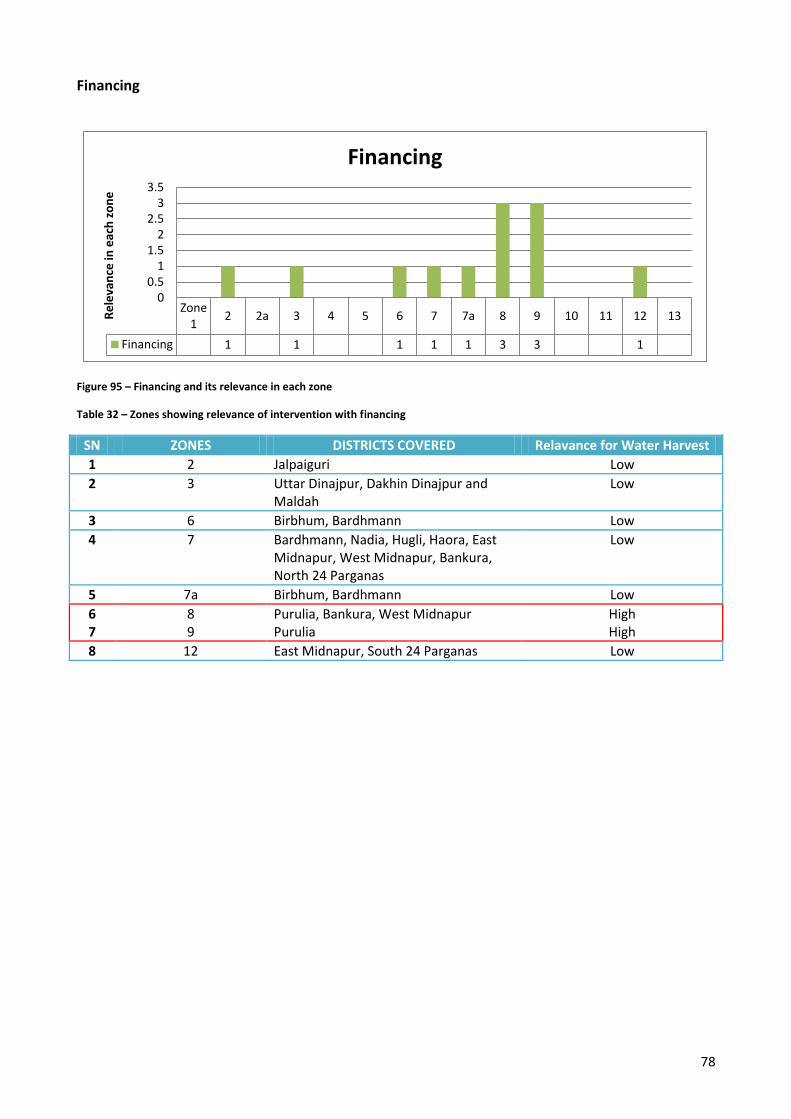
78
Financing
Figure 95 – Financing and its relevance in each zone
Table 32 – Zones showing relevance of intervention with financing
SN ZONES DISTRICTS COVERED Relavance for Water Harvest
1 2 Jalpaiguri Low
2 3 Uttar Dinajpur, Dakhin Dinajpur and Maldah
Low
3 6 Birbhum, Bardhmann Low
4 7 Bardhmann, Nadia, Hugli, Haora, East Midnapur, West Midnapur, Bankura, North 24 Parganas
Low
5 7a Birbhum, Bardhmann Low
6 8 Purulia, Bankura, West Midnapur High 7 9 Purulia High
8 12 East Midnapur, South 24 Parganas Low
Zone 1
2 2a 3 4 5 6 7 7a 8 9 10 11 12 13
Financing 1 1 1 1 1 3 3 1
0 0.5
1 1.5
2 2.5
3 3.5
Re
leva
nce
in e
ach
zo
ne
Financing
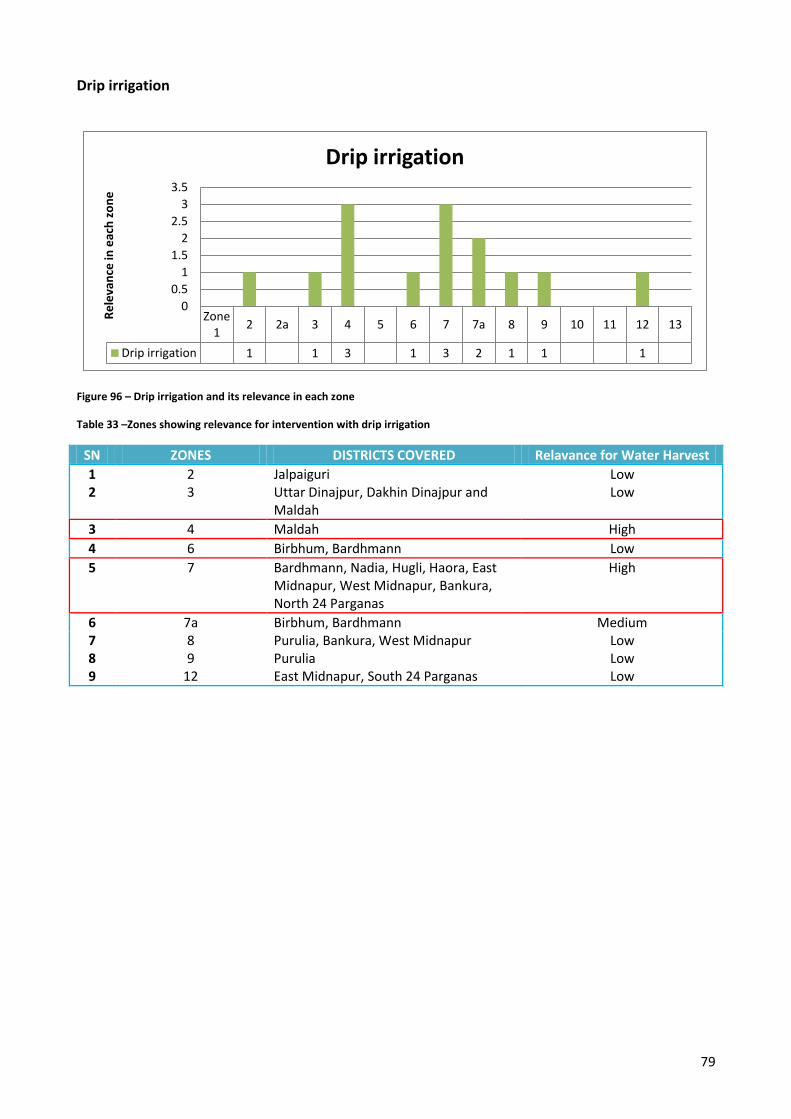
79
Drip irrigation
Figure 96 – Drip irrigation and its relevance in each zone
Table 33 –Zones showing relevance for intervention with drip irrigation
SN ZONES DISTRICTS COVERED Relavance for Water Harvest
1 2 Jalpaiguri Low 2 3 Uttar Dinajpur, Dakhin Dinajpur and
Maldah Low
3 4 Maldah High
4 6 Birbhum, Bardhmann Low
5 7 Bardhmann, Nadia, Hugli, Haora, East Midnapur, West Midnapur, Bankura, North 24 Parganas
High
6 7a Birbhum, Bardhmann Medium 7 8 Purulia, Bankura, West Midnapur Low 8 9 Purulia Low 9 12 East Midnapur, South 24 Parganas Low
Zone 1
2 2a 3 4 5 6 7 7a 8 9 10 11 12 13
Drip irrigation 1 1 3 1 3 2 1 1 1
0
0.5
1
1.5
2
2.5
3
3.5
Re
leva
nce
in e
ach
zo
ne
Drip irrigation
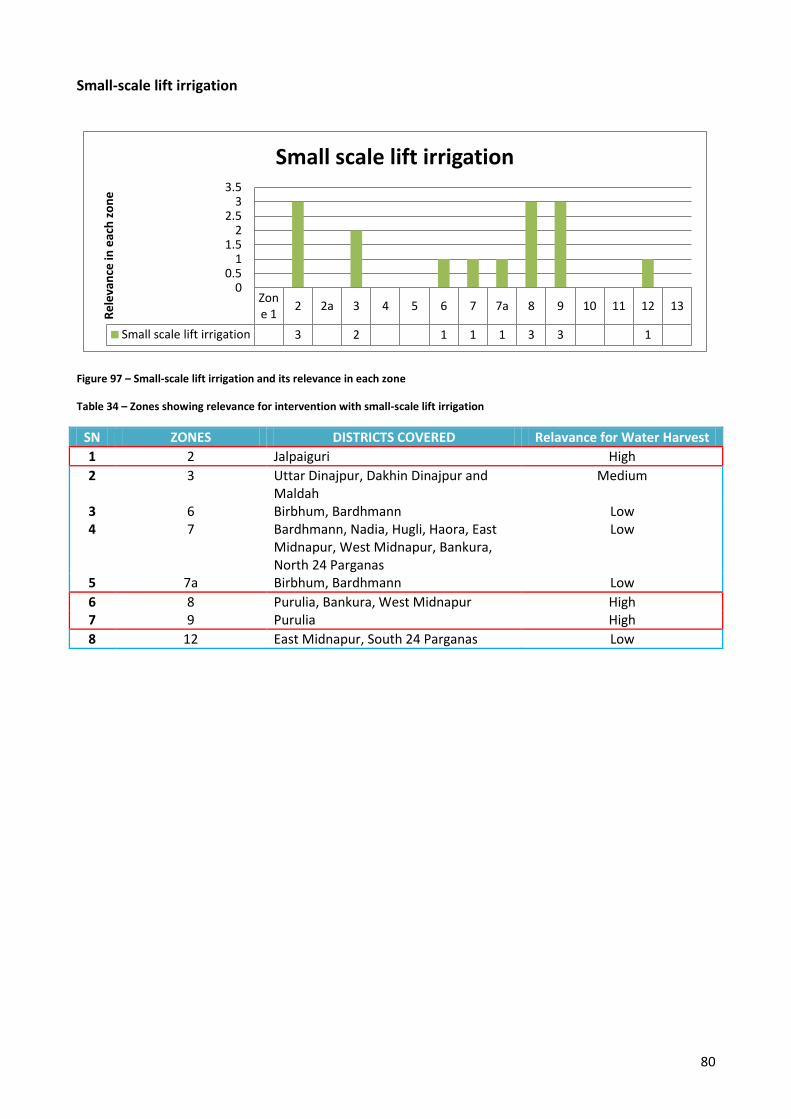
80
Small-scale lift irrigation
Figure 97 – Small-scale lift irrigation and its relevance in each zone
Table 34 – Zones showing relevance for intervention with small-scale lift irrigation
SN ZONES DISTRICTS COVERED Relavance for Water Harvest
1 2 Jalpaiguri High
2 3 Uttar Dinajpur, Dakhin Dinajpur and Maldah
Medium
3 6 Birbhum, Bardhmann Low 4 7 Bardhmann, Nadia, Hugli, Haora, East
Midnapur, West Midnapur, Bankura, North 24 Parganas
Low
5 7a Birbhum, Bardhmann Low
6 8 Purulia, Bankura, West Midnapur High 7 9 Purulia High
8 12 East Midnapur, South 24 Parganas Low
Zone 1
2 2a 3 4 5 6 7 7a 8 9 10 11 12 13
Small scale lift irrigation 3 2 1 1 1 3 3 1
0 0.5
1 1.5
2 2.5
3 3.5
Re
leva
nce
in e
ach
zo
ne
Small scale lift irrigation
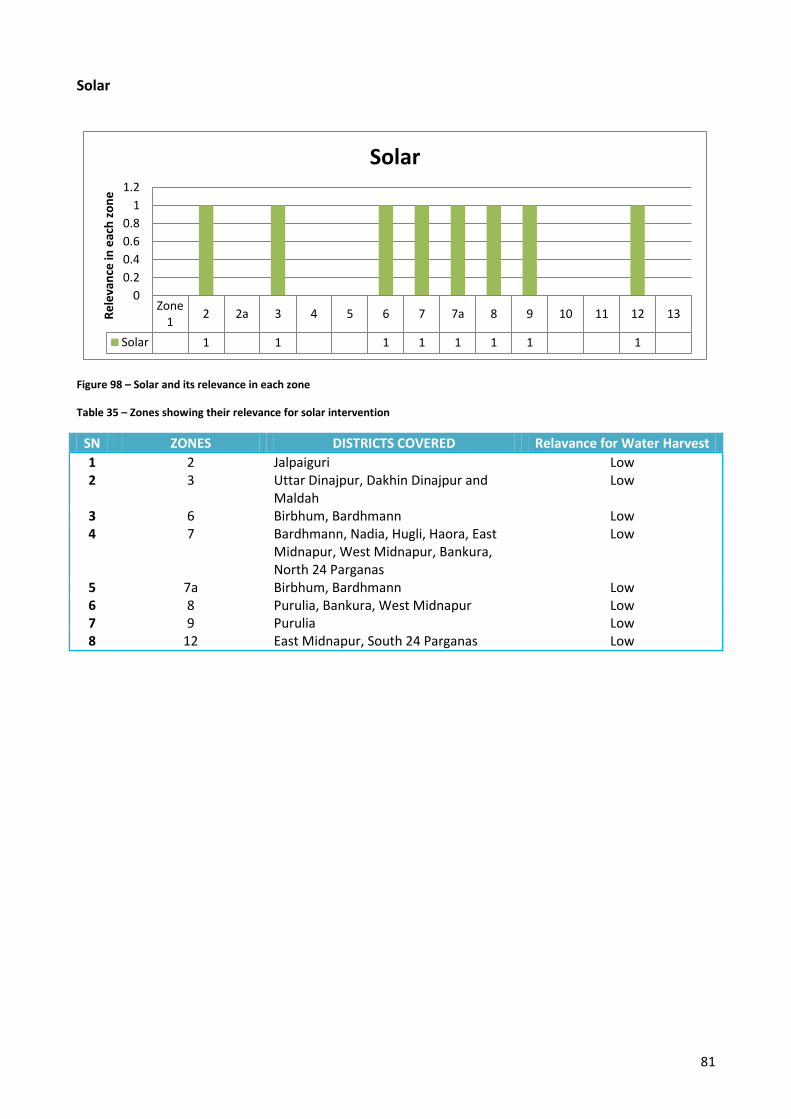
81
Solar
Figure 98 – Solar and its relevance in each zone
Table 35 – Zones showing their relevance for solar intervention
SN ZONES DISTRICTS COVERED Relavance for Water Harvest
1 2 Jalpaiguri Low 2 3 Uttar Dinajpur, Dakhin Dinajpur and
Maldah Low
3 6 Birbhum, Bardhmann Low 4 7 Bardhmann, Nadia, Hugli, Haora, East
Midnapur, West Midnapur, Bankura, North 24 Parganas
Low
5 7a Birbhum, Bardhmann Low 6 8 Purulia, Bankura, West Midnapur Low 7 9 Purulia Low 8 12 East Midnapur, South 24 Parganas Low
Zone 1
2 2a 3 4 5 6 7 7a 8 9 10 11 12 13
Solar 1 1 1 1 1 1 1 1
0
0.2
0.4
0.6
0.8
1
1.2
Re
leva
nce
in e
ach
zo
ne
Solar
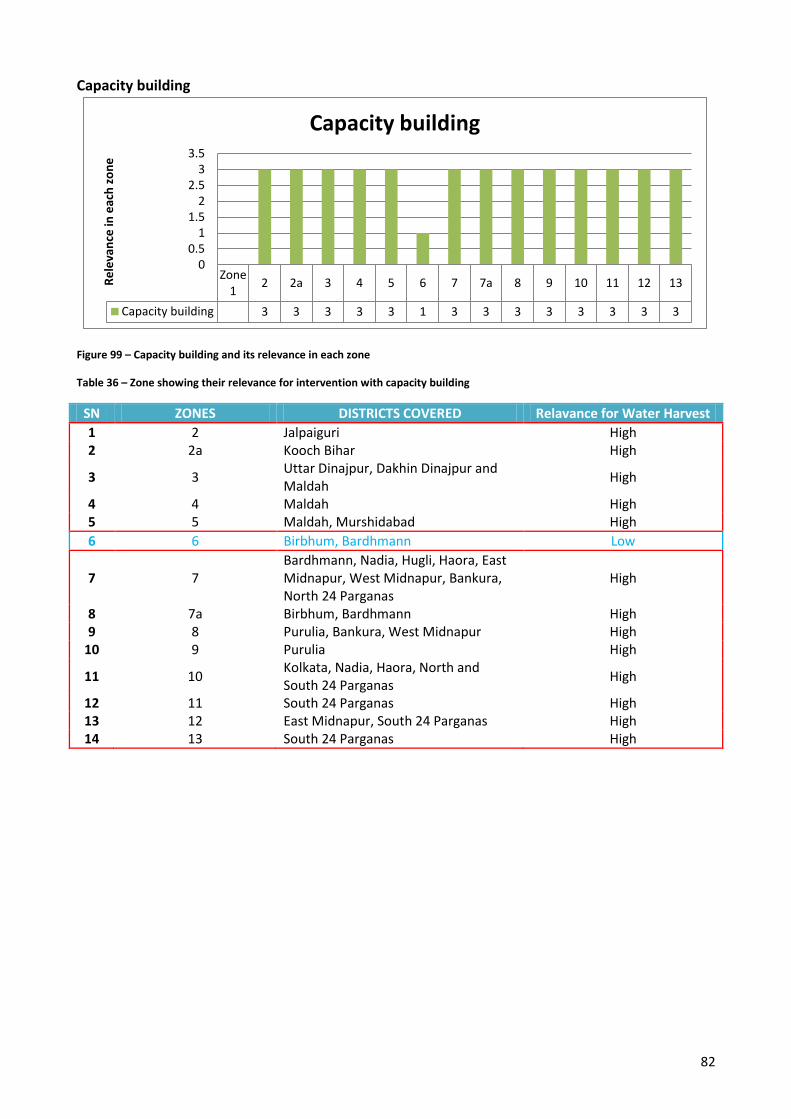
82
Capacity building
Figure 99 – Capacity building and its relevance in each zone
Table 36 – Zone showing their relevance for intervention with capacity building
SN ZONES DISTRICTS COVERED Relavance for Water Harvest
1 2 Jalpaiguri High 2 2a Kooch Bihar High
3 3 Uttar Dinajpur, Dakhin Dinajpur and Maldah
High
4 4 Maldah High 5 5 Maldah, Murshidabad High
6 6 Birbhum, Bardhmann Low
7 7 Bardhmann, Nadia, Hugli, Haora, East Midnapur, West Midnapur, Bankura, North 24 Parganas
High
8 7a Birbhum, Bardhmann High 9 8 Purulia, Bankura, West Midnapur High
10 9 Purulia High
11 10 Kolkata, Nadia, Haora, North and South 24 Parganas
High
12 11 South 24 Parganas High 13 12 East Midnapur, South 24 Parganas High 14 13 South 24 Parganas High
Zone 1
2 2a 3 4 5 6 7 7a 8 9 10 11 12 13
Capacity building 3 3 3 3 3 1 3 3 3 3 3 3 3 3
0 0.5
1 1.5
2 2.5
3 3.5
Re
leva
nce
in e
ach
zo
ne
Capacity building
83
REFERENCES Anno. (2011). "District Profile, Purulia." Retrieved April 1st 2011, from http://www.purulia.nic.in/aboutDistrict/district_profile.html.
Chattopadhyay, S. (2003). "Ravaged by a river." Retrieved May 10, 2011, from http://www.hinduonnet.com/fline/fl2020/stories/20031010002209300.htm.
Das, B. K. (2009). "Flood Disasters and Forest Villagers in sub-Himalayan Bengal." Economic & Political Weekly 71.
Desai, M. (2011). "Identification and Mapping of Hazard Prone areas regarding landslide in the Darjeeling Hill area." Retrieved May 2nd, 2011, from http://www.darjeeling.gov.in/geography.html#land-use.
DevelopmentAlternativesGroup (2001). "Sustainable Water Management."
DistrictMagistrate, J. (2010) The Jalpaiguri story: Innovative application for livelihood security 2011,
Guhathakurta, P. and M. Rajeevan (2008). "Trends in the rainfall pattern over India." International Journal of Climatology 28(11): 1453-1469.
IMRBInternational (2010). To understand the investment potential in the state of West Bengal. B. I. R. Division, Royal Thai Embassy, New Delhi: 1-284.
Indianetzone (2008). "Birbhum District, West Bengal." Retrieved May 12, 2011, from http://www.indianetzone.com/14/birbhum_west_bengal.htm.
IRRI (2011). "Resource conserving technologies and livelihoods in West Bengal." Retrieved May 11, 2011, from http://irri.org/partnerships/networks/ifad-facility-grant/subprograms/resource-conserving-technologies-and-livelihoods-in-west-bengal.
IWMI (2010). West Benal Situation Analysis: 1-4.
Meinzen-Dick, R., K. V. Raju, et al. (2002). "What Affects Organization and Collective Action for Managing Resources? Evidence from Canal Irrigation Systems in India." World Development 30(4): 649-666.
MInistry of water resources, I. (2002). "National Water Policy." 10.
NaturaBeyond (2011). "Malda." Retrieved May 10, 2011, from http://www.north-bengal.com/places/malda/.
NIC-Bardhaman (2011, May 11, 2011). "Bardhamann." Retrieved May 11, 2011, from http://bardhaman.nic.in/distataglance.html.
84
NIC-Jalpaiguri (2011). "Jalpaiguri Online." Retrieved May 2nd, 2011, from http://jalpaiguri.gov.in/index.htm.
NIC-KochBihar (2011). "Cooch Behar." Retrieved May 4th, 2011, from http://coochbehar.nic.in/Htmfiles/index.html#.
NIC-Malda (2010). "Malda District." Retrieved May 10, 2011, from http://malda.nic.in/.
NIC-UttarDinajpur (2003). "Uttar Dinajpur ". Retrieved May 10, 2011, from http://uttardinajpur.nic.in/.
Phadhke, R. (2002). THE DREAMS OF A WATER WARRIOR, GOOGLE: 507-513.
Prahalad, P. C. K. (2010) West Bengal Vision @ 2022 1-31
Sarkar, S. (2011). "X FACTOR - ENGLISH BAZAAR Municipal Problems to Influence Result in English Bazaar." Retrieved May 10, 2011, from http://soumyadesarkar.blogspot.com/2011/04/x-factor-english-bazaar-municipal.html.
VoiceOfBharat (2011). "South Dinajpur District
Social, Developmental, Environmental and Economic Canvas." Retrieved May 11, 2011, from http://www.voiceofbharat.org/districts/coochbehar.asp.
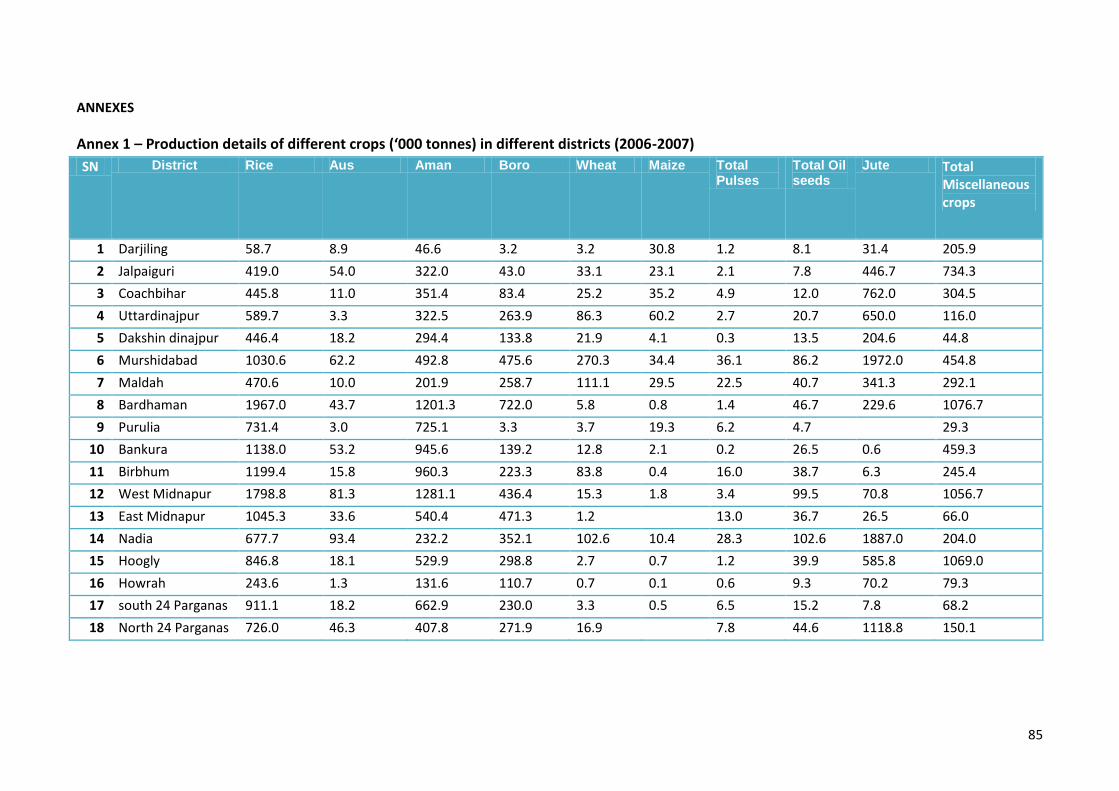
85
ANNEXES
Annex 1 – Production details of different crops (‘000 tonnes) in different districts (2006-2007)
SN District Rice Aus Aman Boro Wheat Maize Total Pulses
Total Oil seeds
Jute Total Miscellaneous crops
1 Darjiling 58.7 8.9 46.6 3.2 3.2 30.8 1.2 8.1 31.4 205.9
2 Jalpaiguri 419.0 54.0 322.0 43.0 33.1 23.1 2.1 7.8 446.7 734.3
3 Coachbihar 445.8 11.0 351.4 83.4 25.2 35.2 4.9 12.0 762.0 304.5
4 Uttardinajpur 589.7 3.3 322.5 263.9 86.3 60.2 2.7 20.7 650.0 116.0
5 Dakshin dinajpur 446.4 18.2 294.4 133.8 21.9 4.1 0.3 13.5 204.6 44.8
6 Murshidabad 1030.6 62.2 492.8 475.6 270.3 34.4 36.1 86.2 1972.0 454.8
7 Maldah 470.6 10.0 201.9 258.7 111.1 29.5 22.5 40.7 341.3 292.1
8 Bardhaman 1967.0 43.7 1201.3 722.0 5.8 0.8 1.4 46.7 229.6 1076.7
9 Purulia 731.4 3.0 725.1 3.3 3.7 19.3 6.2 4.7 29.3
10 Bankura 1138.0 53.2 945.6 139.2 12.8 2.1 0.2 26.5 0.6 459.3
11 Birbhum 1199.4 15.8 960.3 223.3 83.8 0.4 16.0 38.7 6.3 245.4
12 West Midnapur 1798.8 81.3 1281.1 436.4 15.3 1.8 3.4 99.5 70.8 1056.7
13 East Midnapur 1045.3 33.6 540.4 471.3 1.2 13.0 36.7 26.5 66.0
14 Nadia 677.7 93.4 232.2 352.1 102.6 10.4 28.3 102.6 1887.0 204.0
15 Hoogly 846.8 18.1 529.9 298.8 2.7 0.7 1.2 39.9 585.8 1069.0
16 Howrah 243.6 1.3 131.6 110.7 0.7 0.1 0.6 9.3 70.2 79.3
17 south 24 Parganas 911.1 18.2 662.9 230.0 3.3 0.5 6.5 15.2 7.8 68.2
18 North 24 Parganas 726.0 46.3 407.8 271.9 16.9 7.8 44.6 1118.8 150.1
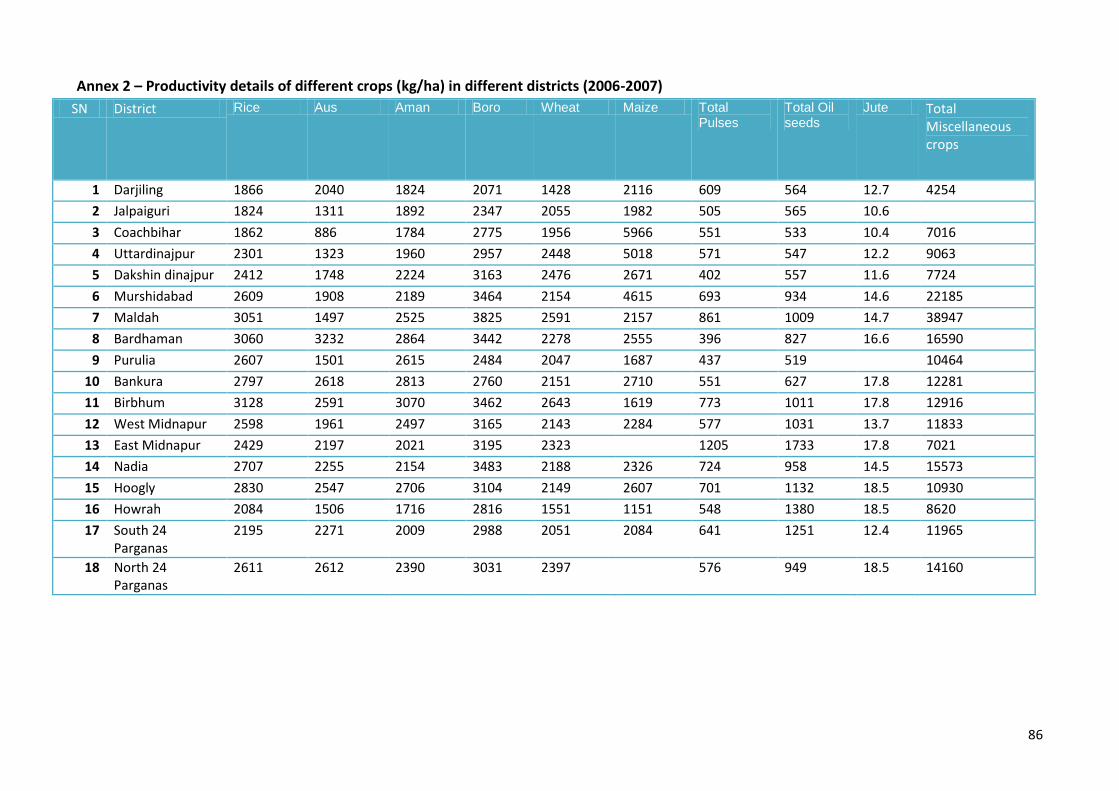
86
Annex 2 – Productivity details of different crops (kg/ha) in different districts (2006-2007)
SN District Rice Aus Aman Boro Wheat Maize Total Pulses
Total Oil seeds
Jute Total Miscellaneous crops
1 Darjiling 1866 2040 1824 2071 1428 2116 609 564 12.7 4254
2 Jalpaiguri 1824 1311 1892 2347 2055 1982 505 565 10.6
3 Coachbihar 1862 886 1784 2775 1956 5966 551 533 10.4 7016
4 Uttardinajpur 2301 1323 1960 2957 2448 5018 571 547 12.2 9063
5 Dakshin dinajpur 2412 1748 2224 3163 2476 2671 402 557 11.6 7724
6 Murshidabad 2609 1908 2189 3464 2154 4615 693 934 14.6 22185
7 Maldah 3051 1497 2525 3825 2591 2157 861 1009 14.7 38947
8 Bardhaman 3060 3232 2864 3442 2278 2555 396 827 16.6 16590
9 Purulia 2607 1501 2615 2484 2047 1687 437 519 10464
10 Bankura 2797 2618 2813 2760 2151 2710 551 627 17.8 12281
11 Birbhum 3128 2591 3070 3462 2643 1619 773 1011 17.8 12916
12 West Midnapur 2598 1961 2497 3165 2143 2284 577 1031 13.7 11833
13 East Midnapur 2429 2197 2021 3195 2323 1205 1733 17.8 7021
14 Nadia 2707 2255 2154 3483 2188 2326 724 958 14.5 15573
15 Hoogly 2830 2547 2706 3104 2149 2607 701 1132 18.5 10930
16 Howrah 2084 1506 1716 2816 1551 1151 548 1380 18.5 8620
17 South 24 Parganas
2195 2271 2009 2988 2051 2084 641 1251 12.4 11965
18 North 24 Parganas
2611 2612 2390 3031 2397 576 949 18.5 14160
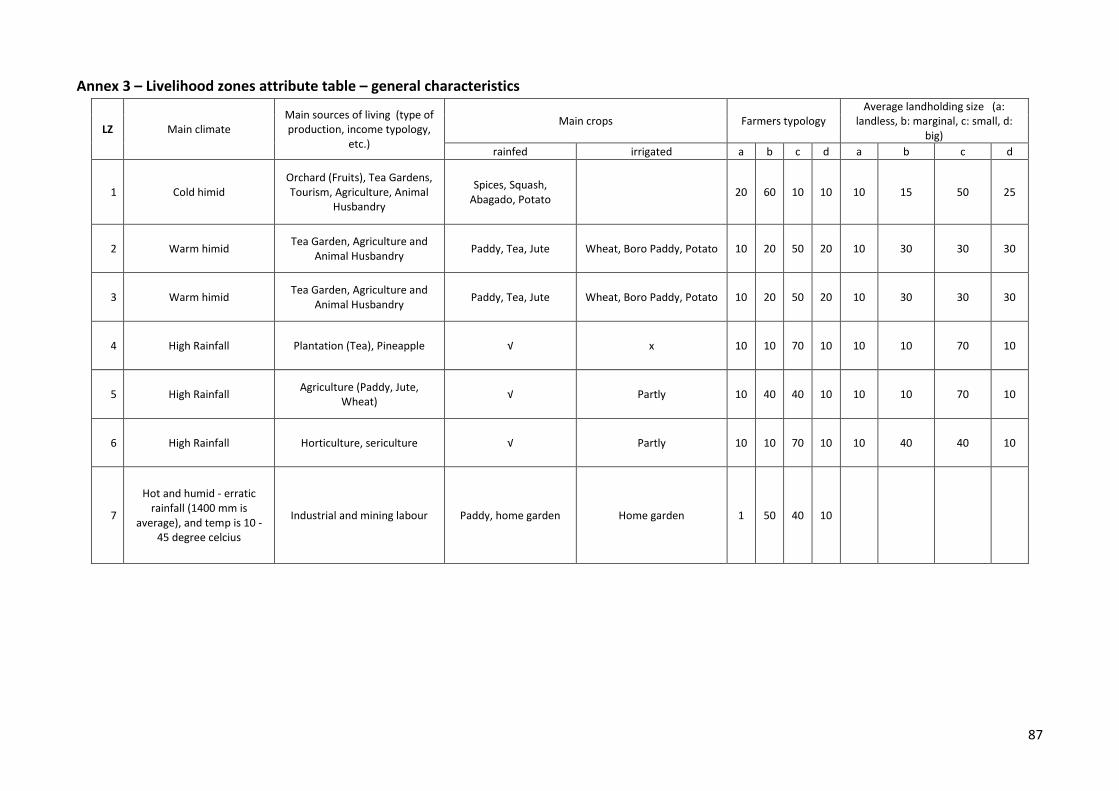
87
Annex 3 – Livelihood zones attribute table – general characteristics
LZ Main climate Main sources of living (type of production, income typology,
etc.)
Main crops Farmers typology Average landholding size (a:
landless, b: marginal, c: small, d: big)
rainfed irrigated a b c d a b c d
1 Cold himid Orchard (Fruits), Tea Gardens, Tourism, Agriculture, Animal
Husbandry
Spices, Squash, Abagado, Potato
20 60 10 10 10 15 50 25
2 Warm himid Tea Garden, Agriculture and
Animal Husbandry Paddy, Tea, Jute Wheat, Boro Paddy, Potato 10 20 50 20 10 30 30 30
3 Warm himid Tea Garden, Agriculture and
Animal Husbandry Paddy, Tea, Jute Wheat, Boro Paddy, Potato 10 20 50 20 10 30 30 30
4 High Rainfall Plantation (Tea), Pineapple √ x 10 10 70 10 10 10 70 10
5 High Rainfall Agriculture (Paddy, Jute,
Wheat) √ Partly 10 40 40 10 10 10 70 10
6 High Rainfall Horticulture, sericulture √ Partly 10 10 70 10 10 40 40 10
7
Hot and humid - erratic rainfall (1400 mm is
average), and temp is 10 - 45 degree celcius
Industrial and mining labour Paddy, home garden Home garden 1 50 40 10
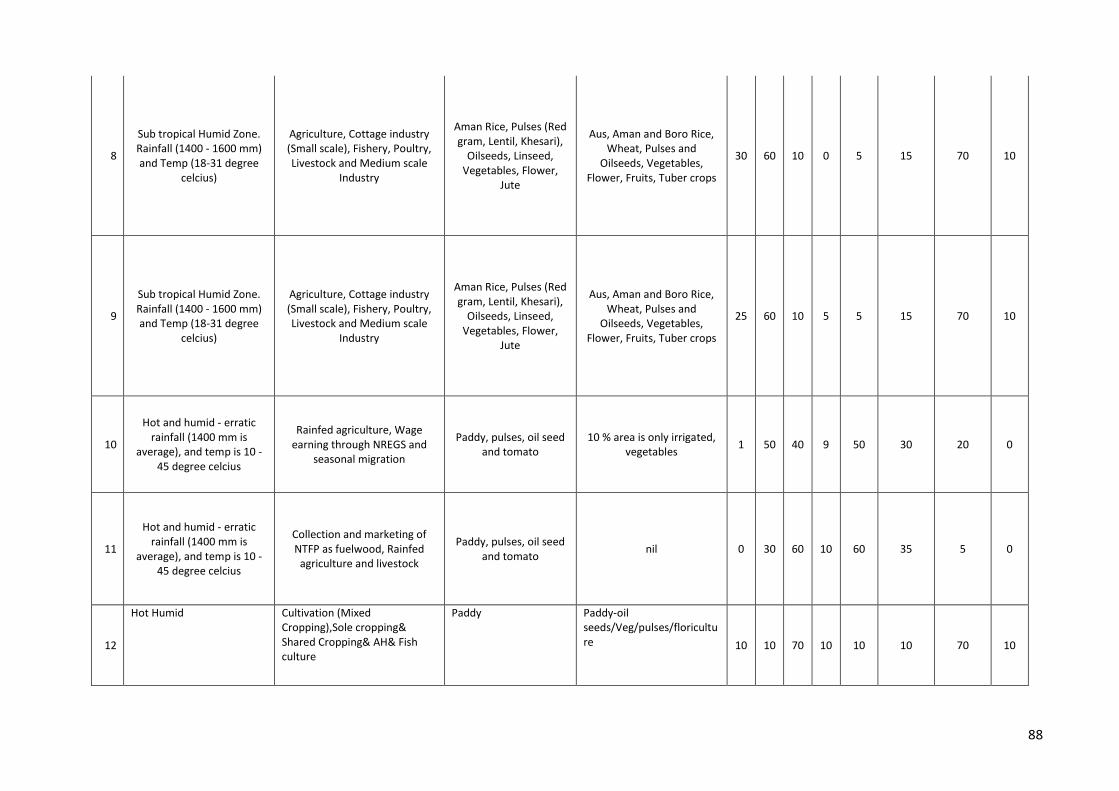
88
8
Sub tropical Humid Zone. Rainfall (1400 - 1600 mm) and Temp (18-31 degree
celcius)
Agriculture, Cottage industry (Small scale), Fishery, Poultry, Livestock and Medium scale
Industry
Aman Rice, Pulses (Red gram, Lentil, Khesari),
Oilseeds, Linseed, Vegetables, Flower,
Jute
Aus, Aman and Boro Rice, Wheat, Pulses and
Oilseeds, Vegetables, Flower, Fruits, Tuber crops
30 60 10 0 5 15 70 10
9
Sub tropical Humid Zone. Rainfall (1400 - 1600 mm) and Temp (18-31 degree
celcius)
Agriculture, Cottage industry (Small scale), Fishery, Poultry, Livestock and Medium scale
Industry
Aman Rice, Pulses (Red gram, Lentil, Khesari),
Oilseeds, Linseed, Vegetables, Flower,
Jute
Aus, Aman and Boro Rice, Wheat, Pulses and
Oilseeds, Vegetables, Flower, Fruits, Tuber crops
25 60 10 5 5 15 70 10
10
Hot and humid - erratic rainfall (1400 mm is
average), and temp is 10 - 45 degree celcius
Rainfed agriculture, Wage earning through NREGS and
seasonal migration
Paddy, pulses, oil seed and tomato
10 % area is only irrigated, vegetables
1 50 40 9 50 30 20 0
11
Hot and humid - erratic rainfall (1400 mm is
average), and temp is 10 - 45 degree celcius
Collection and marketing of NTFP as fuelwood, Rainfed
agriculture and livestock
Paddy, pulses, oil seed and tomato
nil 0 30 60 10 60 35 5 0
12
Hot Humid Cultivation (Mixed Cropping),Sole cropping& Shared Cropping& AH& Fish culture
Paddy Paddy-oil seeds/Veg/pulses/floriculture 10 10 70 10 10 10 70 10
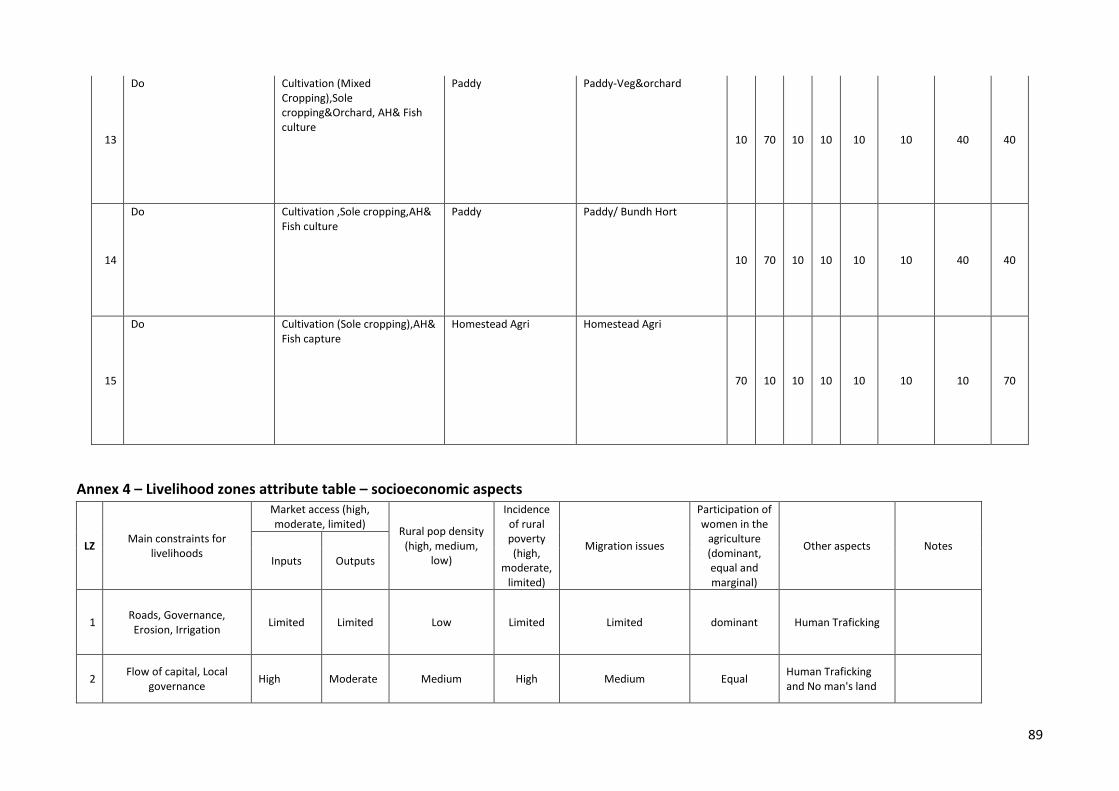
89
13
Do Cultivation (Mixed Cropping),Sole cropping&Orchard, AH& Fish culture
Paddy Paddy-Veg&orchard
10 70 10 10 10 10 40 40
14
Do Cultivation ,Sole cropping,AH& Fish culture
Paddy Paddy/ Bundh Hort
10 70 10 10 10 10 40 40
15
Do Cultivation (Sole cropping),AH& Fish capture
Homestead Agri Homestead Agri
70 10 10 10 10 10 10 70
Annex 4 – Livelihood zones attribute table – socioeconomic aspects
LZ Main constraints for
livelihoods
Market access (high, moderate, limited)
Rural pop density (high, medium,
low)
Incidence of rural poverty (high,
moderate, limited)
Migration issues
Participation of women in the
agriculture (dominant, equal and marginal)
Other aspects Notes
Inputs Outputs
1 Roads, Governance, Erosion, Irrigation
Limited Limited Low Limited Limited dominant Human Traficking
2 Flow of capital, Local
governance High Moderate Medium High Medium Equal
Human Traficking and No man's land
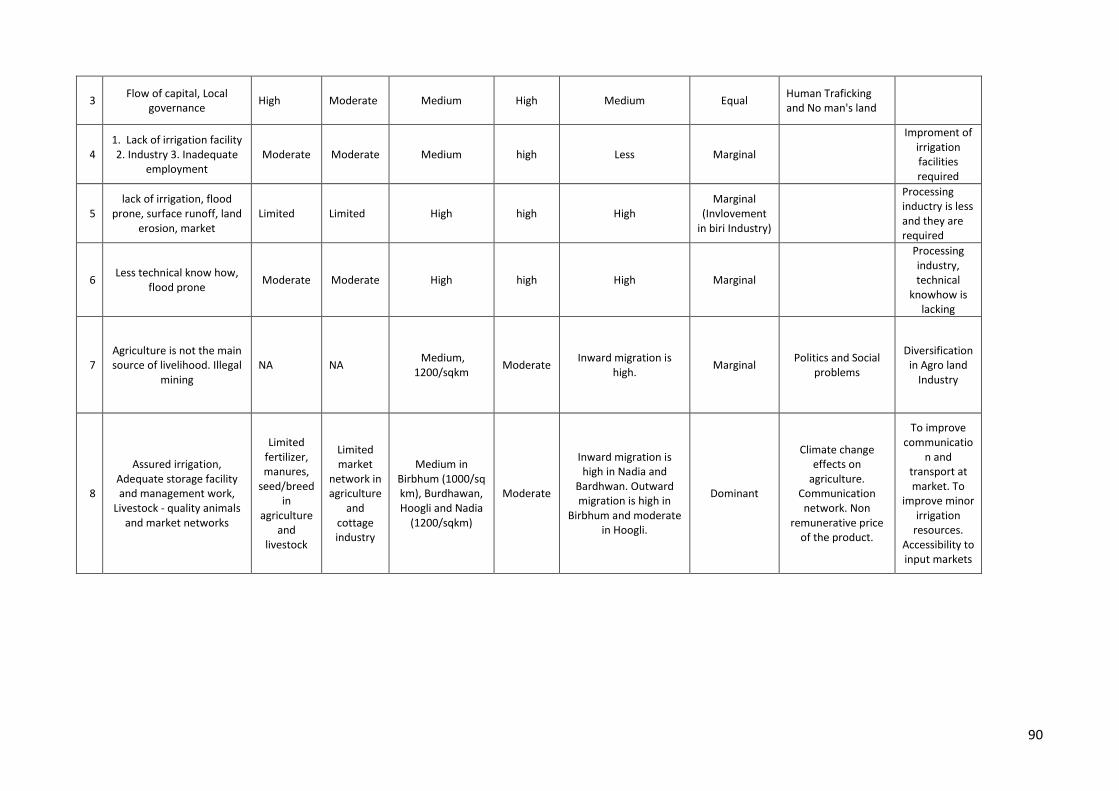
90
3 Flow of capital, Local
governance High Moderate Medium High Medium Equal
Human Traficking and No man's land
4 1. Lack of irrigation facility 2. Industry 3. Inadequate
employment Moderate Moderate Medium high Less Marginal
Improment of irrigation facilities required
5 lack of irrigation, flood
prone, surface runoff, land erosion, market
Limited Limited High high High Marginal
(Invlovement in biri Industry)
Processing inductry is less and they are required
6 Less technical know how,
flood prone Moderate Moderate High high High Marginal
Processing industry, technical
knowhow is lacking
7 Agriculture is not the main source of livelihood. Illegal
mining NA NA
Medium, 1200/sqkm
Moderate Inward migration is
high. Marginal
Politics and Social problems
Diversification in Agro land
Industry
8
Assured irrigation, Adequate storage facility and management work,
Livestock - quality animals and market networks
Limited fertilizer, manures,
seed/breed in
agriculture and
livestock
Limited market
network in agriculture
and cottage industry
Medium in Birbhum (1000/sq km), Burdhawan, Hoogli and Nadia
(1200/sqkm)
Moderate
Inward migration is high in Nadia and
Bardhwan. Outward migration is high in
Birbhum and moderate in Hoogli.
Dominant
Climate change effects on
agriculture. Communication network. Non
remunerative price of the product.
To improve communicatio
n and transport at market. To
improve minor irrigation
resources. Accessibility to input markets
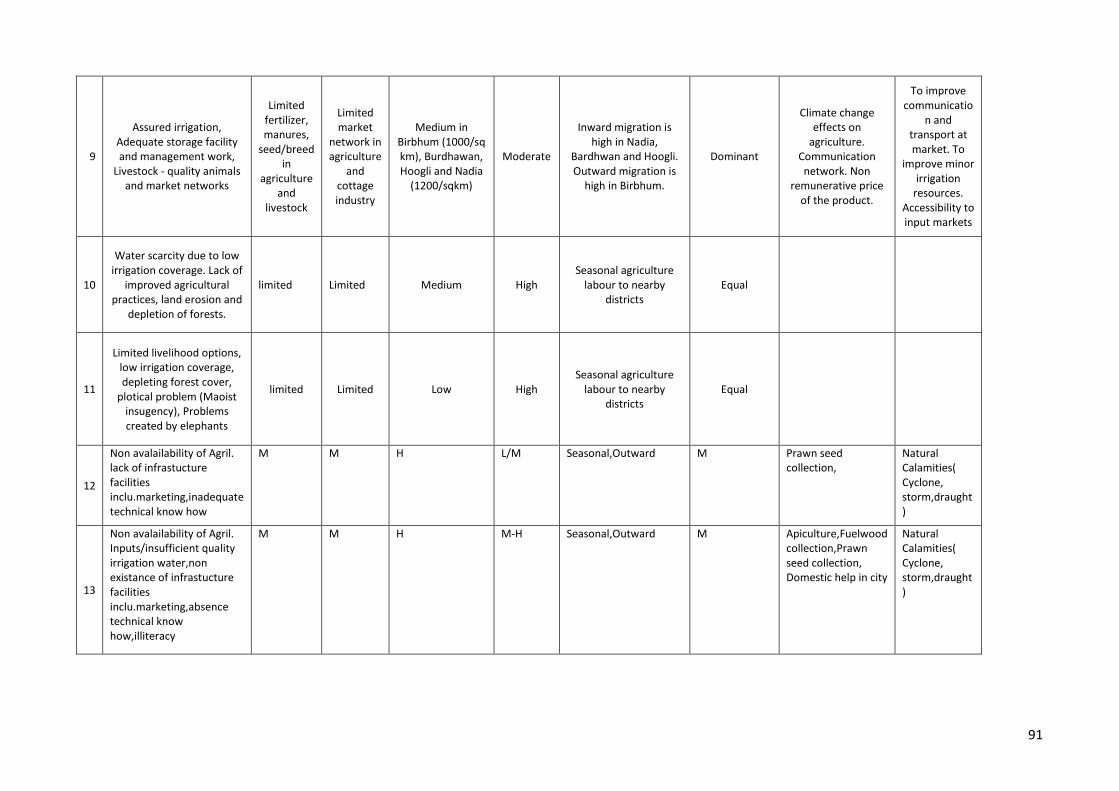
91
9
Assured irrigation, Adequate storage facility and management work,
Livestock - quality animals and market networks
Limited fertilizer, manures,
seed/breed in
agriculture and
livestock
Limited market
network in agriculture
and cottage industry
Medium in Birbhum (1000/sq km), Burdhawan, Hoogli and Nadia
(1200/sqkm)
Moderate
Inward migration is high in Nadia,
Bardhwan and Hoogli. Outward migration is
high in Birbhum.
Dominant
Climate change effects on
agriculture. Communication network. Non
remunerative price of the product.
To improve communicatio
n and transport at market. To
improve minor irrigation
resources. Accessibility to input markets
10
Water scarcity due to low irrigation coverage. Lack of
improved agricultural practices, land erosion and
depletion of forests.
limited Limited Medium High Seasonal agriculture
labour to nearby districts
Equal
11
Limited livelihood options, low irrigation coverage, depleting forest cover,
plotical problem (Maoist insugency), Problems created by elephants
limited Limited Low High Seasonal agriculture
labour to nearby districts
Equal
12
Non avalailability of Agril. lack of infrastucture facilities inclu.marketing,inadequate technical know how
M M H L/M Seasonal,Outward M Prawn seed collection,
Natural Calamities( Cyclone, storm,draught)
13
Non avalailability of Agril. Inputs/insufficient quality irrigation water,non existance of infrastucture facilities inclu.marketing,absence technical know how,illiteracy
M M H M-H Seasonal,Outward M Apiculture,Fuelwood collection,Prawn seed collection, Domestic help in city
Natural Calamities( Cyclone, storm,draught)
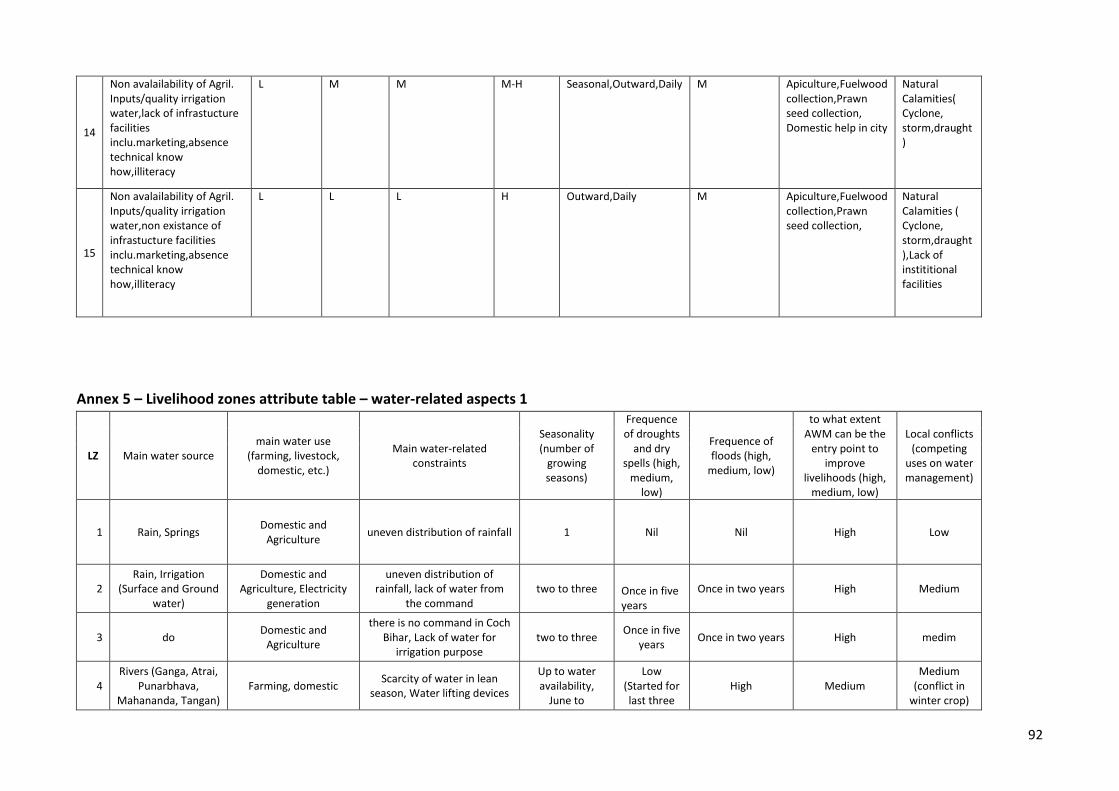
92
14
Non avalailability of Agril. Inputs/quality irrigation water,lack of infrastucture facilities inclu.marketing,absence technical know how,illiteracy
L M M M-H Seasonal,Outward,Daily M Apiculture,Fuelwood collection,Prawn seed collection, Domestic help in city
Natural Calamities( Cyclone, storm,draught)
15
Non avalailability of Agril. Inputs/quality irrigation water,non existance of infrastucture facilities inclu.marketing,absence technical know how,illiteracy
L L L H Outward,Daily M Apiculture,Fuelwood collection,Prawn seed collection,
Natural Calamities ( Cyclone, storm,draught),Lack of instititional facilities
Annex 5 – Livelihood zones attribute table – water-related aspects 1
LZ Main water source main water use
(farming, livestock, domestic, etc.)
Main water-related constraints
Seasonality (number of
growing seasons)
Frequence of droughts
and dry spells (high,
medium, low)
Frequence of floods (high,
medium, low)
to what extent AWM can be the
entry point to improve
livelihoods (high, medium, low)
Local conflicts (competing
uses on water management)
1 Rain, Springs Domestic and
Agriculture uneven distribution of rainfall 1 Nil Nil High Low
2 Rain, Irrigation
(Surface and Ground water)
Domestic and Agriculture, Electricity
generation
uneven distribution of rainfall, lack of water from
the command two to three Once in five
years
Once in two years High Medium
3 do Domestic and
Agriculture
there is no command in Coch Bihar, Lack of water for
irrigation purpose two to three
Once in five years
Once in two years High medim
4 Rivers (Ganga, Atrai,
Punarbhava, Mahananda, Tangan)
Farming, domestic Scarcity of water in lean
season, Water lifting devices
Up to water availability,
June to
Low (Started for last three
High Medium Medium
(conflict in winter crop)
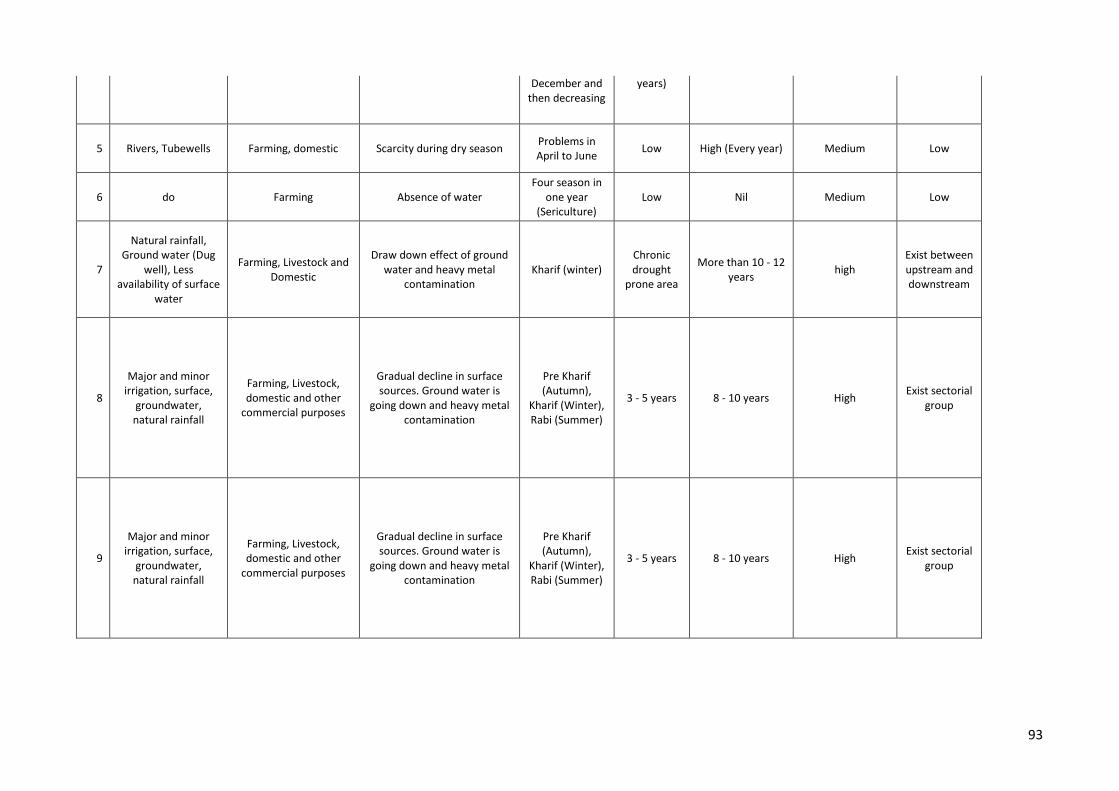
93
December and then decreasing
years)
5 Rivers, Tubewells Farming, domestic Scarcity during dry season Problems in April to June
Low High (Every year) Medium Low
6 do Farming Absence of water Four season in
one year (Sericulture)
Low Nil Medium Low
7
Natural rainfall, Ground water (Dug
well), Less availability of surface
water
Farming, Livestock and Domestic
Draw down effect of ground water and heavy metal
contamination Kharif (winter)
Chronic drought
prone area
More than 10 - 12 years
high Exist between upstream and downstream
8
Major and minor irrigation, surface,
groundwater, natural rainfall
Farming, Livestock, domestic and other
commercial purposes
Gradual decline in surface sources. Ground water is
going down and heavy metal contamination
Pre Kharif (Autumn),
Kharif (Winter), Rabi (Summer)
3 - 5 years 8 - 10 years High Exist sectorial
group
9
Major and minor irrigation, surface,
groundwater, natural rainfall
Farming, Livestock, domestic and other
commercial purposes
Gradual decline in surface sources. Ground water is
going down and heavy metal contamination
Pre Kharif (Autumn),
Kharif (Winter), Rabi (Summer)
3 - 5 years 8 - 10 years High Exist sectorial
group
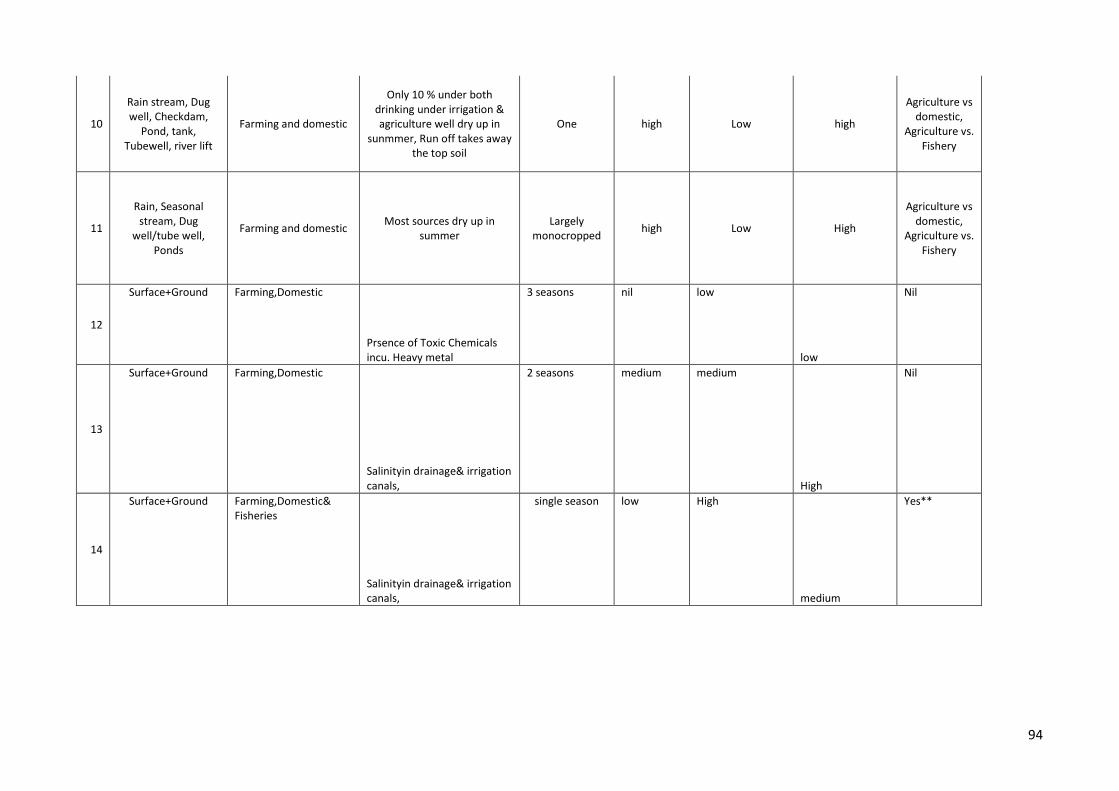
94
10
Rain stream, Dug well, Checkdam,
Pond, tank, Tubewell, river lift
Farming and domestic
Only 10 % under both drinking under irrigation & agriculture well dry up in
sunmmer, Run off takes away the top soil
One high Low high
Agriculture vs domestic,
Agriculture vs. Fishery
11
Rain, Seasonal stream, Dug
well/tube well, Ponds
Farming and domestic Most sources dry up in
summer Largely
monocropped high Low High
Agriculture vs domestic,
Agriculture vs. Fishery
12
Surface+Ground Farming,Domestic
Prsence of Toxic Chemicals incu. Heavy metal
3 seasons nil low
low
Nil
13
Surface+Ground Farming,Domestic
Salinityin drainage& irrigation canals,
2 seasons medium medium
High
Nil
14
Surface+Ground Farming,Domestic& Fisheries
Salinityin drainage& irrigation canals,
single season low High
medium
Yes**
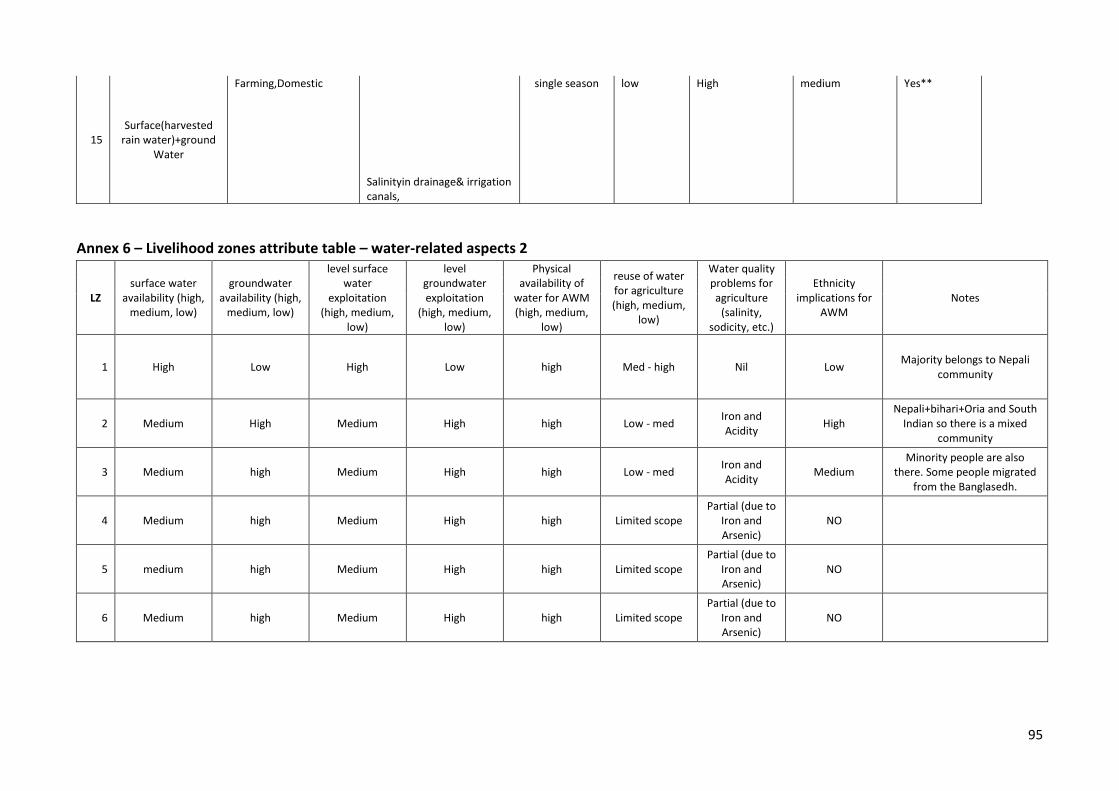
95
15 Surface(harvested
rain water)+ground Water
Farming,Domestic
Salinityin drainage& irrigation canals,
single season low High medium Yes**
Annex 6 – Livelihood zones attribute table – water-related aspects 2
LZ surface water
availability (high, medium, low)
groundwater availability (high,
medium, low)
level surface water
exploitation (high, medium,
low)
level groundwater exploitation
(high, medium, low)
Physical availability of
water for AWM (high, medium,
low)
reuse of water for agriculture (high, medium,
low)
Water quality problems for agriculture
(salinity, sodicity, etc.)
Ethnicity implications for
AWM Notes
1 High Low High Low high Med - high Nil Low Majority belongs to Nepali
community
2 Medium High Medium High high Low - med Iron and Acidity
High Nepali+bihari+Oria and South
Indian so there is a mixed community
3 Medium high Medium High high Low - med Iron and Acidity
Medium Minority people are also
there. Some people migrated from the Banglasedh.
4 Medium high Medium High high Limited scope Partial (due to
Iron and Arsenic)
NO
5 medium high Medium High high Limited scope Partial (due to
Iron and Arsenic)
NO
6 Medium high Medium High high Limited scope Partial (due to
Iron and Arsenic)
NO
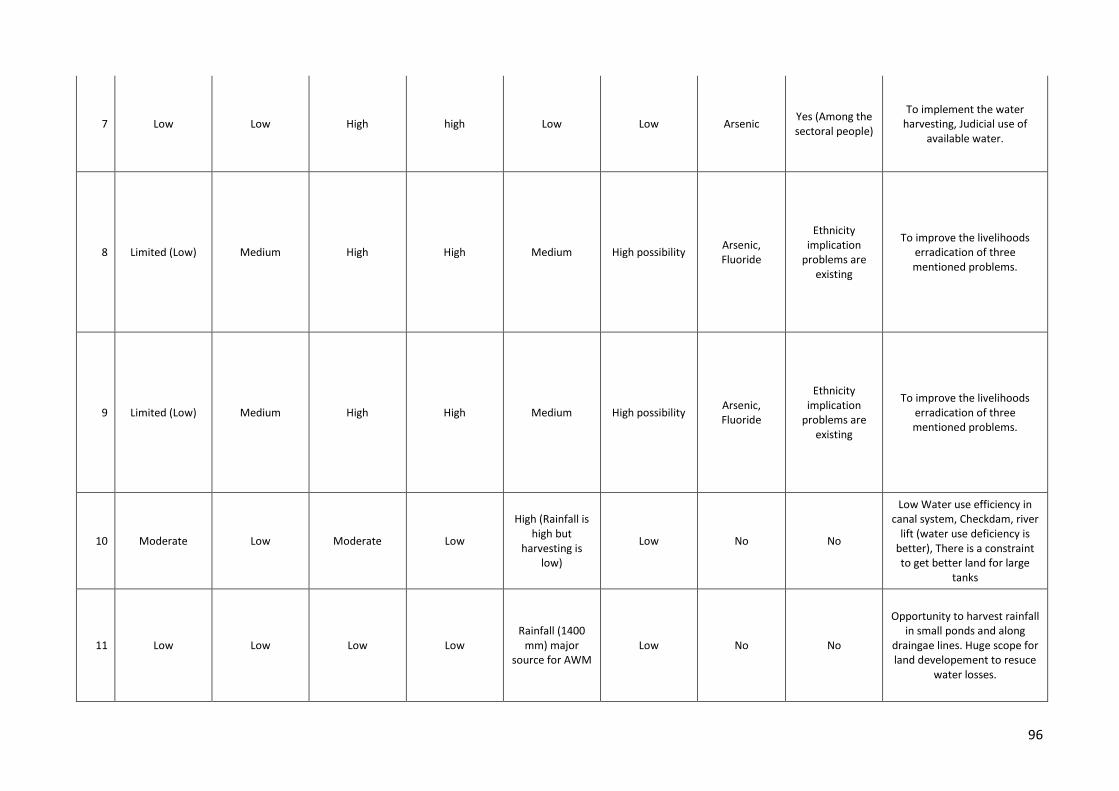
96
7 Low Low High high Low Low Arsenic Yes (Among the sectoral people)
To implement the water harvesting, Judicial use of
available water.
8 Limited (Low) Medium High High Medium High possibility Arsenic, Fluoride
Ethnicity implication
problems are existing
To improve the livelihoods erradication of three mentioned problems.
9 Limited (Low) Medium High High Medium High possibility Arsenic, Fluoride
Ethnicity implication
problems are existing
To improve the livelihoods erradication of three mentioned problems.
10 Moderate Low Moderate Low
High (Rainfall is high but
harvesting is low)
Low No No
Low Water use efficiency in canal system, Checkdam, river
lift (water use deficiency is better), There is a constraint to get better land for large
tanks
11 Low Low Low Low Rainfall (1400
mm) major source for AWM
Low No No
Opportunity to harvest rainfall in small ponds and along
draingae lines. Huge scope for land developement to resuce
water losses.
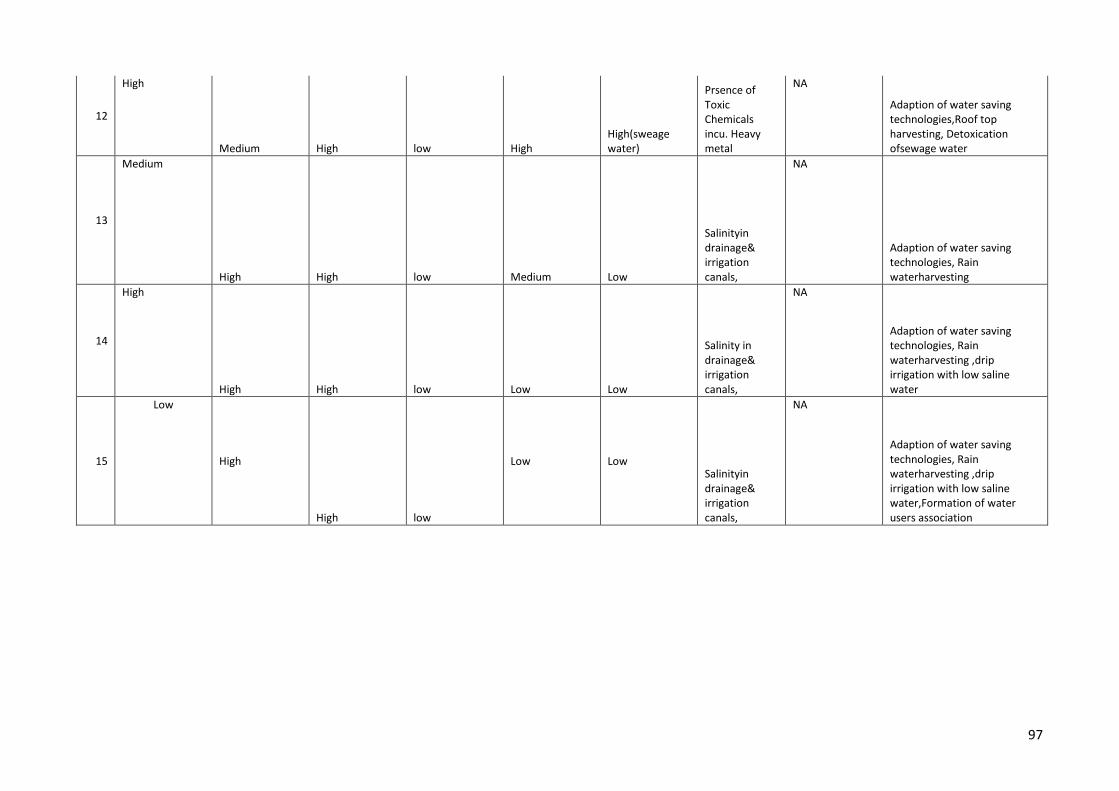
97
12
High
Medium High low High High(sweage water)
Prsence of Toxic Chemicals incu. Heavy metal
NA
Adaption of water saving technologies,Roof top harvesting, Detoxication ofsewage water
13
Medium
High High low Medium Low
Salinityin drainage& irrigation canals,
NA
Adaption of water saving technologies, Rain waterharvesting
14
High
High High low Low Low
Salinity in drainage& irrigation canals,
NA
Adaption of water saving technologies, Rain waterharvesting ,drip irrigation with low saline water
15
Low
High
High low
Low Low Salinityin drainage& irrigation canals,
NA
Adaption of water saving technologies, Rain waterharvesting ,drip irrigation with low saline water,Formation of water users association