Embed Size (px)
Citation preview

Iowa
West Fork of the Cedar River – 07080204 8-Digit Hydrologic Unit Profile
November 2008
The West Fork of the Cedar River Rapid Watershed Assessment (RWA) provides initial estimates of where conservation investments would best address the resource concerns of landowners, conservation districts, and other community organizations and stakeholders. These assessments help landowners and local leaders set priorities and determine the best actions to achieve their goals to conserve and improve soil and water resources.
The West Fork of the Cedar River 8-Digit Hydrologic Unit Code (HUC) watershed contains 550,684 acres (1). Forty-five percent of the watershed is in Franklin County, 29 percent in Butler County, 24 percent in Cerro Gordo County, and the remaining 2 percent is split between Black Hawk, Bremer, and Hancock counties (1). Ninety-five percent of the watershed is privately owned, 1.8 percent is publicly owned, and the remaining 3.2 percent is split between municipal areas and private conservation areas (2).
Eighty-two percent of the watershed is in cropland, 8.2 percent is pasture or hayland, 3.6 percent is woodland or natural areas, and 6.2 percent is split between water, wetlands, and developed/urban areas (3).
Elevations range from 853 feet to 1,306 feet (4). The average watershed slope is 6.3 percent (5). The primary Land Capability Class in the watershed is class 2. The Land Capability Class (LCC) breakdown for the watershed is: 8.6 percent in class 1; 71.4 percent in class 2; 14.9 percent in class 3; 2 percent in class 4; and the remaining 3.1 percent is split between classes 5, 6, 7, and 8 (6). Rainfall ranges from 31 to 35 inches per year (7). The HUC includes one interstate highway (35), one US highway (65), and three state highways (3, 14, and 107) (8).
Conservation assistance is provided by six Soil and Water Conservation Districts (SWCD) and Natural Resources Conservation Service (NRCS) field offices located in Allison, Garner, Hampton, Mason City, Waterloo, and Waverly. There are two Resource Conservation and Development (RC&D) offices that cover the watershed, including Prairie Winds in Garner and Cedar Valley in Charles City. An office locator is found at http://offices.sc.egov.usda.gov/locator/app
The West Fork of the Cedar River HUC includes 32 NRCS conservation easements totaling 3,772.3 acres. The easements include the Emergency Watershed Protection (EWP) program, Wetlands Reserve Program (WRP), and the Emergency Wetlands Restoration Program (EWRP). Fifty-eight percent of the easements are in Butler County, 27 percent in Cerro Gordo County, and 15 percent in Franklin County (9). The United States Department of Agriculture (USDA) prohibits discrimination in all its programs and activities on the basis of race, color, national origin, sex, religion, age, disability, political beliefs, sexual orientation, and marital or family status. (Not all prohibited bases apply to all programs.) Persons with disabilities who require alternative means for communication of program information (Braille, large print, audiotape, etc.) should contact USDA’s TARGET Center at 202-720-2600 (voice and TDD). To file a complaint of discrimination, write USDA, Director, Office of Civil Rights, Room 326W, Whitten Building, 14th and Independence Avenue, SW, Washington, DC 20250-9410 or call 202-720-5964 (voice and TDD). USDA is an equal opportunity provider and employer.

2
Iowa
West Fork of the Cedar River – 07080204 8-Digit Hydrologic Unit Profile November 2008

3
Iowa
West Fork of the Cedar River – 07080204 8-Digit Hydrologic Unit Profile November 2008

4
Iowa
West Fork of the Cedar River – 07080204 8-Digit Hydrologic Unit Profile
November 2008

5
Iowa
West Fork of the Cedar River – 07080204 8-Digit Hydrologic Unit Profile
November 2008

6
Iowa
West Fork of the Cedar River – 07080204 8-Digit Hydrologic Unit Profile November 2008

7
Iowa
West Fork of the Cedar River – 07080204 8-Digit Hydrologic Unit Profile November 2008

8
Iowa
West Fork of the Cedar River – 07080204 8-Digit Hydrologic Unit Profile November 2008

9
Iowa
West Fork of the Cedar River – 07080204 8-Digit Hydrologic Unit Profile November 2008

10
Iowa
West Fork of the Cedar River – 07080204 8-Digit Hydrologic Unit Profile November 2008
Physical Description There are 231 drainage districts in the West Fork of the Cedar River HUC. Forty-nine percent of the districts are located in Cerro Gordo County, 42 percent in Franklin County, and 9 percent in Hancock County (11).

11
Iowa
West Fork of the Cedar River – 07080204 8-Digit Hydrologic Unit Profile November 2008

12
Iowa
West Fork of the Cedar River – 07080204 8-Digit Hydrologic Unit Profile November 2008

13
Iowa
West Fork of the Cedar River – 07080204 8-Digit Hydrologic Unit Profile November 2008
Special Considerations Drainage laws in Iowa are contained in the Code of Iowa. Chapter 465 applies to individual drainage rights, including tile drainage. Chapter 455 applies to levee and drainage districts, and Chapter 455B applies to the Department of Natural Resources (10). Legal drainage districts are formed according to state laws. Chapter 455 of the Code of Iowa applies to formation by County Board of Supervisors of legal drainage districts. Two or more landowners can petition for the formation of a drainage district, and single individuals can petition for sub-districts. Once established, installation and maintenance is under the direct control of the County Board of Supervisors or Drainage District Trustees (10). Iowa source water faces increasing pressure from development, pollution, land use changes, and growing demands for drinking water. Source water is a lake, stream, river, or aquifer where drinking water is obtained. Source Water Protection (SWP) is the act of preventing contaminants from entering public drinking water sources. SWP includes ground water (wellhead) protection and surface water protection (12). Iowa Department of Natural Resources’ (IDNR) SWP Program has developed two main phases to the SWP Program: SWP Assessment Reports (Phase 1) and the SWP Plan (Phase 2). In addition, the program has recently included implementation as part of the SWP planning (12). IDNR’s SWP Program has developed a list of Priority Community Water Supplies. The West Fork of the Cedar River Watershed includes one Priority SWP community, the town of Bristow, which is located in Butler County. Bristow is identified by the DNR SWP Program as one of the top 40 priority communities listed for high nitrates (12).

14
Iowa
West Fork of the Cedar River – 07080204 8-Digit Hydrologic Unit Profile
November 2008
The West Fork of the Cedar River HUC includes portions of three National Common Resource Areas (CRA): 103.1; 104.1; and 104.2. Fifty-nine percent of the watershed is in CRA 104.1, 36 percent in 103.1, and 5 percent in 104.2 (13, 14). The CRAs delineated below for the West Fork of the Cedar River HUC are described in the next section (for additional information, see http://soils.usda.gov/survey/geography/cra.html). A CRA is defined as a geographical area where resource concerns, problems, or treatment needs are similar. It is considered a subdivision of an existing Major Land Resource Area (MLRA) map delineation or polygon. Landscape conditions, soil, climate, human considerations, and other natural resource information are used to determine the geographic boundaries of a CRA (General Manual Title 450, Subpart C, §401.21) (13, 14).

15
Iowa
West Fork of the Cedar River – 07080204 8-Digit Hydrologic Unit Profile November 2008
Common Resource Area Descriptions (13, 14) The National Coordinated CRA Geographic Database provides: • A consistent CRA geographic database; • CRA geographic data compatible with other GIS data digitized from 1:250,000
scale maps, such as land use/land cover, political boundaries, Digital General Soil Map of the U.S. (updated STATSGO), and ecoregion boundaries;
• A consistent (correlated) geographic index for Conservation Management Guide Sheet information and the eFOTG;
• A geographic linkage with the national MLRA framework. 103.1 Iowa and Minnesota Till – Prairies Primarily loamy glacial till soils with scattered lacustrine areas, potholes, outwash, and floodplains. Nearly level to gently undulating with relatively short slopes. Most of the wet soils have been artificially drained to maximize crop production. Primary land use is cropland. Corn, soybeans, sugar beets, peas, and sweet corn are the major crops. Native vegetation was dominantly tall grass prairie. Resource concerns are water and wind erosion, nutrient management, and water quality. 104.1 Silty and Loamy Mantled – Firm Till Plain Gently sloping to very steep dissected till plain. Soils are predominantly well drained and are formed in thin silty material over loamy till, underlain by sedimentary bedrock. Cropland and grazing land on ridge tops and valley bottoms with a mix of dairy, beef, and cash grain agricultural enterprises. Deciduous forest on side slopes. Primary resource concerns are cropland erosion, surface water quality, grazing land and woodland productivity, and soil erosion during timber harvest. 104.2 Eastern Iowa Eroded Till – Plain This area is made up of broad upland, nearly level to moderately sloping, moderately well drained to poorly drained soils that formed in silty/loamy material over glacial till. Many low gradient drainage ways are common in this unit. Native vegetation was mostly prairie with timber and brush in valleys and steeper side slopes. Corn and soybeans are common crops with many swine and poultry production facilities. Resource concerns are soil erosion, water quality and nutrient management.

16
Iowa
West Fork of the Cedar River – 07080204 8-Digit Hydrologic Unit Profile November 2008
Geology This watershed is drained by the West Fork of the Cedar River and its main tributaries, Maynes Creek and Hartgrave Creek. Soils and landforms of the watershed formed in deposits laid down by ice and water during the Pleistocene and Holocene Epochs. The unconsolidated deposits rest on Paleozoic bedrock. A narrow band of Devonian shale — 2-3 miles in width and extending from Thornton in the northwest to Applington in the south — separates Devonian dolomite and limestone in the northeast half of the watershed from Mississippian dolomite and limestone in the southwest half. The bedrock is rarely exposed except in quarries. The western one-quarter of the RWA area is characterized in Cerro Gordo County by wide bands of hummocky terrain, which mark the major glacial end moraines and are pocked by numerous kames and kettles (prairie potholes), glacial lake plains, and smaller areas of level till plain. In western Franklin County, the glacial terrain is mainly low-relief ground moraine. The lower (eastern) three-quarters of the watershed consists of gently sloping till plain dissected by narrow and shallow stream valleys. Elevations in the watershed range from about 900 feet to 1,280 feet. The glacial deposits in the watershed belong to two distinctly different glacial eras, separated temporally by nearly a half million years. The upper portion belongs to the Des Moines Lobe landform region, which geologically speaking is a very young landscape. It is the result of a surging ice lobe that extended southward from the last continental glacier some 12,000 to 14,000 years ago. This late-Wisconsinan ice left a range of deposits, including dense basal till, variable supraglacial till, and a complex suite of sorted sediments—silty lake deposits, sands interstratified with loamy till, and outwash sands and gravels. The lower three-quarters of the watershed is part of the Iowan Erosion Surface, which developed on much older Pre-Illinoian till as a result of the intense periglacial conditions and strong winds during the Wisconsinan glaciation. The erosion left behind a lag deposit called a “stone line,” which is covered by loamy sediments of variable thickness. Loess mantles the till on isolated topographic highs that survived the widespread erosion. In the upper portion of the watershed, soils are predominantly loams and clay loams formed in glacial till and glacial lacustrine sediments. The lower portion of the watershed consists mainly of loamy soils that formed in surficial sediments and the underlying till on uplands, and in loamy and sandy alluvium on stream benches in the major river valleys. Drainage class of the soils ranges from poorly-drained to well-drained and is largely dependent on landscape position.

17
Iowa
West Fork of the Cedar River – 07080204 8-Digit Hydrologic Unit Profile November 2008
Resource Concerns Resource Concerns by Land Use Pasture (16) Vegetation typically consists of introduced cool season forage. Predominant species are introduced cool season forages, including Kentucky Bluegrass and Smooth Bromegrass, with lesser amounts of Tall Fescue and Orchardgrass. Some introduced legumes are present, with White (Ladino) Clover being the most predominant. Some Red Clover, Birdsfoot Trefoil and Alfalfa are included in lesser amounts. Continuous overgrazing is common. Typically soil erosion as a result of sheet and rill will be less than1 ton/acre/year. There is evidence of a small amount of gully erosion. Stream bank erosion may be significant because grazing animals typically have unlimited access to streams. In time, undesirable woody species may invade older pastures and decrease the productivity of the forage. Soil compaction on cattle paths and around watering sources can increase soil erosion and create a niche for undesirable plant species. Availability of a reliable watering source can be a hindrance to developing rotational grazing systems. Hayland (16) Hayland has been seeded to introduce species, including predominantly Smooth Bromegrass and Alfalfa. There also exists Orchardgrass and Red Clover, to a lesser extent. Erosion is not typically a problem on hayland. Nutrient and pest management are often under-utilized. Typically, three cuttings of hay are taken from May through early September. Cropland (17, 18, 19) Cropland is intensively used, primarily for corn and soybeans production, with a very small amount of oats and meadow as part of a rotation. Corn acres increased in recent years, compared to soybean acres, due to increased grain prices and ethanol plant development. The average slope is 6.3 percent. Predominant resource concerns on cropland include soil erosion (sheet and rill, gully, and wind); soil compaction; soil eutrophication; weed infestation; and decrease in soil carbon. Over-application of nutrients (commercial and manure-based) and pesticides typically does not meet Iowa NRCS standards. In recent years, no-till systems on soybean acres have increased, although no-till on corn acres has decreased.

18
Iowa
West Fork of the Cedar River – 07080204 8-Digit Hydrologic Unit Profile November 2008
Natural Areas/Woodland (20) Natural areas in Iowa consist mostly of poor quality woodlands, degraded meadow found mostly in odd areas along property corners, fence lines, or abandoned pastures. In many locations, these areas include steeper slopes than cropland and pasture. Vegetation includes a mix of native trees and shrubs with increasing undesirable populations of introduced and often noxious species of woody or non-woody plants. Predominant resource concerns include invasive species, classic gully erosion, habitat fragmentation, increasing homogeneity, and land use conversion to cropland.

19
Iowa
West Fork of the Cedar River – 07080204 8-Digit Hydrologic Unit Profile November 2008
SWAPA+H stands for soils, water, air, plants, animals, and humans. SWAPA+H is used in watershed and ecosystem planning to identify natural systems and how they relate to social and economic conditions. The table below lists the resource concern priorities of stakeholders and landowners in the watershed. SWAPA + H Concerns Table (26)
Resource Concerns/Issues by Land Use
SWAPA * Specific Resource Concerns/Issues Cropland Pasture Natural
Areas Farmstead
Soil Erosion Sheet and Rill X Ephemeral Gully X Classic Gully X X Streambank X Wind X Water Quality, Surface
Suspended Sediment & Turbidity X
Pesticides X
Excessive Nutrients & Organics X
Water Quality, Ground
Excessive Nutrients & Organics X X
Soil Condition Animal Waste & Other Organics (N,P,K) X
Plant Condition Productivity, Health, and Vigor X Palatability X Domestic Animals
Inadequate Quantity & Quality Feed & Forage X
Inadequate Stock Water X Air Quality Particulates, Ammonia, CO2 X Wildlife Inadequate cover & shelter X T & E Species X * SWAPA: - Soil, Water, Air, Plants, and Animals Human Considerations: Implementation of conservation practices and enhancements has the potential for change in management and cost of production. Installation of practices will have an upfront cost and require maintenance. In the short run, increased management may be required as new techniques are learned. Land may be taken out of production for installation of practices or conversion to other uses, such as wildlife habitat. Long term benefits should result from increased soil health, benefits to water quality, improved domestic livestock, air quality, and wildlife habitat. Other considerations by humans in the watershed may include recreation, rural and urban perceptions, market trends and how they relate to conservation practice costs, profitability, and current high land values.

20
Iowa
West Fork of the Cedar River – 07080204 8-Digit Hydrologic Unit Profile November 2008
Soil Loss Water erosion (sheet and rill) from cropland accounts for nearly 90 percent of Iowa’s soil erosion. In Iowa, there has been a steady decline in sheet and rill erosion from 1982 to 1997, but on average soil erosion remains above the sustainable levels. In order to maintain sustainable levels of soil stability, soil erosion should not exceed 5 tons/acre/year (22). National Resource Inventory (NRI) estimates for sheet and rill erosion by water on cropland and pastureland decreased by approximately 760.9 tons (33 percent) of soil loss between 1982 and 1997. NRCS estimates indicate wind erosion rates decreased by 1,339.6 tons (81 percent) between 1982 and 1997 (22).
NRI Soil Loss Estimates
0
500
1000
1500
2000
2500
1982 1987 1992 1997
Soil
Loss
(100
0 to
ns/tr
)
Water ErosionWind Erosion

21
Iowa
West Fork of the Cedar River – 07080204 8-Digit Hydrologic Unit Profile November 2008
Under Section 303(d) of the Clean Water Act, states are required from "time to time" to submit a list of waters for which effluent limits will not be sufficient to meet all state water quality standards. EPA has defined "time to time" to mean April 1 of even numbered years. The failure to meet water quality standards might be due to an individual pollutant, multiple pollutants, "pollution," or an unknown cause of impairment. The 303(d) listing process includes waters impaired by point sources and nonpoint sources of pollutants. States must also establish a priority ranking for the listed waters, taking into account the severity of pollution and uses. The EPA regulations that govern 303(d) listing can be found in the Code of Federal Regulations 40 CFR 130.7. The Iowa Department of Natural Resources compiles this impaired water list, or 303(d) listing. The 303(d) listing is composed of those lakes, wetlands, streams, rivers, and portions of rivers that do not meet all state water quality standards. These are considered "impaired waterbodies" and states are required to calculate total maximum daily loads (TMDLs) for pollutants causing impairments (15).

22
Iowa
West Fork of the Cedar River – 07080204 8-Digit Hydrologic Unit Profile
November 2008

23
Iowa
West Fork of the Cedar River – 07080204 8-Digit Hydrologic Unit Profile November 2008
Water Quality Concerns Data Graph/Table (23)
Impaired Water Bodies
Stre
am M
iles
Sedi
men
t &
Silta
tion
Nut
rient
s
Am
mon
ia
Bac
teria
&
Path
ogen
s
Tem
pera
ture
Turb
idity
Flow
A
ltera
tion
Org
anic
En
richm
ent
Oth
er o
r U
nkno
wn
Bailey Creek (WFC-0110_0) 23.5 X
Beeds Lake (WFC-0090-L_0) 100 ac X X X Unnamed Tributary to West Fork Cedar (WFC-0150_0) 8.2 X
Impaired and TMDL Needed
Other Impairments, TMDL not needed
Impaired, TMDL Complete & Approved

24
Iowa
West Fork of the Cedar River – 07080204 8-Digit Hydrologic Unit Profile November 2008
Watershed Projects, Plans, Studies, and Assessments *
Federal: State:
NRCS Watershed Plans/Studies/Assessments IDNR TMDLs
West Fork of the Cedar River Rapid Watershed Assessment (10/08) Beeds Lake (2006)
IDNR 319 Projects
None
* Listing includes past efforts in the watershed, and ongoing studies and assessments. Sediment, nutrients, pathogens, and their affects are the major pollutants impacting surface waters of the West Fork of the Cedar Watershed. Surface waters, especially lakes and ponds, have a repeated history of algal blooms. A variety of human activities contribute directly to pollutant loads in the water bodies, including intensive row crop agriculture; urban storm run off; failing septic systems; and Confined Animal Feeding Operations (CAFOs). The change in hydrology due to stream channel straightening, subsurface drainage systems, wetland destruction, and lack of perennial groundcover has resulted in flashy stream flows, thus contributing to stream down cutting and increased stream bank instability. Conservation practices that can be used to address these water quality issues include erosion control structures, residue management, nutrient management, riparian buffers, drainage control structures, wetland restoration, urban Best Management Practices (BMPs), and improved septic systems (24).

25
Iowa
West Fork of the Cedar River – 07080204 8-Digit Hydrologic Unit Profile November 2008

26
Iowa
West Fork of the Cedar River – 07080204 8-Digit Hydrologic Unit Profile November 2008

27
Iowa
West Fork of the Cedar River – 07080204 8-Digit Hydrologic Unit Profile November 2008
Threatened and Endangered Species (21)
Status County
SPECIES
Sta
te
Fede
ral
Bla
ck H
awk
Bre
mer
Cer
ro G
ordo
But
ler
Han
cock
Fran
klin
Wrig
ht
Bald Eagle (Haliaeetus leucocephalus) E
Red-shouldered Hawk (Buteo lineatus) E
Bird
s
Short-eared Owl (Asio flammeus) E
Southern Bog Lemming (Synaptomys cooperi) T
Plains Pocket Mouse (Perognathus flavescens) E
Mam
mal
s
Spotted Skunk(Spilogale putorius) E
Blandings Turtle (Emydoidea blandingii) T
Ornate Box Turtle (Terrapene ornata) T
Massasauga Rattlesnake (Sistrurus catenatus) E
Bullsnake (Pituophis catenifer sayi) C
Wood Turtle (Clemmys insculpta) E
Rep
tile
Smooth Green Snake (Liochlorophis vernalis) C

28
Threatened and Endangered Species (21)
Status County
SPECIES
Sta
te
Fede
ral
Bla
ck H
awk
Bre
mer
Cer
ro G
ordo
But
ler
Han
cock
Fran
klin
Wrig
ht
Black Redhorse (Moxostoma duquesnel) T Blacknose Shiner (Notropis heterolepis) T Western Sand Darter (Ammocrypta clara) T Weed Shiner (Notropis texanus) E American Brook Lamprey (Lampetra appendix) T
Fish
Topeka Shiner (Notropis topeka) T E Creek Heelsplitter (Lasmigona compressa) T Yellow Sandshell (Lampsilis teres) E Ellipse (Venustaconcha ellipsiformis) T Round Pigtoe (Pleurobema sintoxia) E Cylindrical Papershell (Anodontoides ferussacianus) T
Mus
sel
Creeper (Strophitus undulatus) T Baltimore (Euphydryas phaeton) T Purplish Copper (Lycaena helloides) C Poweshiek Skipperling (Oarisma powesheik) T Acadian Hairstreak (Satyrium acadicum) C Arogos Skipper (Atrytone arogos) C Broad-winged Skipper (Poanes viator) C Dion Skipper (Euphyes dion) C
Inse
cts
Regal Fritillary (Speyeria idalia) C

29
Threatened and Endangered Species (21)
Status County
SPECIES
Sta
te
Fede
ral
Bla
ck H
awk
Bre
mer
Cer
ro G
ordo
But
ler
Han
cock
Fran
klin
Wrig
ht
Bog Bedstraw (Galium labradoricum) E
Bog Willow (Salix pedicellaris) T
Sweet Indian Plantain (Cacalia suaveolens) T
Buckbean (Menyanthes trifoliata) T
Bent Milk-vetch (Astragalus distortus) C
Ragwort (Senecio pseudareus) C
Rush Aster (Symphyotrichum boreale) T
Sage Willow (Salix candida) C
Showy Milkweed (Asclepias speciosa) T
Swamp Thistle (Cirisium muticum) C
Yelow Monkey Flower (Mimulus glabratus) T
Purple Angelica (Angelica atropurpurea) C
Small Fringed Gentian (Gentianopsis procera) C
Valerian (Valeriana edulis) C
Pla
nts
(Dic
ots)
Water Shield (Brasenia schreberi) C

30
Threatened and Endangered Species (21)
Status County
SPECIES
Sta
te
Fede
ral
Bla
ck H
awk
Bre
mer
Cer
ro G
ordo
But
ler
Han
cock
Fran
klin
Wrig
ht
Flat Top White Aster (Doellinger umbellata) C
Lesser Bladderwort (Utricularia minor) C
Roundleaf Sundew (Drosera rotundifolia) E
Brook Lobelia (Lobelia kalmii) C
Common Mare's-tail (Hippuris vulgaris) C
Earleaf Foxglove (Tomanthera auriculata) C
Fragrant False Indigo (Amorpha nan) T
Pale Corydalis (Corydalis sempervirens) T
Prairie Bush Clover (Lespedeza leptostachya) T T
Shining Willow (Salix lucida) T
Water Marigold (Megalodonta beckii) E
Glade Mallow (Napaea dioica) C
Hill's Thistle (Cirisium hillii) C
Kitten Tails (Besseya bullii) T
Pla
nt (D
icot
s) (c
ont.)
Bog Birch (Betula pumila) T

31
Threatened and Endangered Species (21)
Status County
SPECIES
Sta
te
Fede
ral
Bla
ck H
awk
Bre
mer
Cer
ro G
ordo
But
ler
Han
cock
Fran
klin
Wrig
ht
Pink Milkwort (Polygala incarnata) T
Cleft Phlox (Phlox bifida) C
Hawksbeard (Crepis runcinata) C
Marsh Speedwell (Veronica scutellata) C
Pretty Dodder (Cuscuta indecora) C
Silky Prairie Clover (Dalea villosa) E
Silver Bladderpod (Lesquerella ludoviciana) C
Toothcup (Rotala ramosior) C
Water Milfoil (Myriophyllum verticillatum) C
False Mermaid-weed (Floerkea prosperpinacoides) E
Lance-leaved Violet (Viola lanceolata) C
Spring Avens (Geum vernum) C
Winterberry (Ilex verticillata) E
Narrowleaf Pinweed (Lechea intermedia) T
Pla
nts
(Dic
ots)
(con
t.)
Pearly Everlasting (Anaphalis margaritacea) C

32
Threatened and Endangered Species (21)
Status County
SPECIES
Sta
te
Fede
ral
Bla
ck H
awk
Bre
mer
Cer
ro G
ordo
But
ler
Han
cock
Fran
klin
Wrig
ht
Arrow Grass (Triglochin maritimum) T Hidden Sedge (Carex umbellata) C Yellow-eyed Grass (Xyris torta) E Small White Lady's Slipper (Cypripedium candidum) C Norther Panic-grass (Dichanthelium boreale) E Tall Cotton Grass (Eriophorum angustifolium) C Crawe Sedge (Carex crawei) C Leafy Northern Green Orchid (Platanthera hyperborea) T Richardson Sedge (Carex richardsonii) C Slender Sedge (Carex lepalea) C Creeping Sedge (Carex chordorrhiza) E Green's Rush (Juncus greenei) C Large-leaf Pondweed (Potamogeton amplifolius) C Ovate Spikerush (Eleocharis ovata) C Philadelphia Panic Grass (Panicum philadelphicum) T Star Sedge (Carex cephalantha) C Shore Sedge (Carex limosa) C Slender Cotton Grass (Eriophorum gracile) T Western Prairie Fringed Orchid (Platanthera praeclara) T T
Pla
nts
(Mon
ocot
s)
Beakrush (Rhynchospora capillacea) T

33
Threatened and Endangered Species (21)
Status County
SPECIES
Sta
te
Fede
ral
Bla
ck H
awk
Bre
mer
Cer
ro G
ordo
But
ler
Han
cock
Fran
klin
Wrig
ht
Lesser Panicled Sedge (Carex diandra) C
Slender Arrow Grass (Triglochin palustris) T
Slender Cotton Grass (Eriophorum gracile) T
Smith Bulrush (Scirpus smithii) C
Straight-leaf Pondweed (Potamogeton strictifolius) C
Field Sedge (Carex conoidea) C
Tubercled Orchid (Platanthera flava) E
Slender Ladies'-tresses (Spiranthes lacera) T
Great Plains Ladies'-tresses (Spiranthes magnicamponum) C
Pla
nts
(Mon
ocot
s) (c
ont.)
Purple Fringed Orchid (Platanthera psycodes) T
Meadow Spikemoss (Selaginella eclipes) E
Oak Fern (Gymnocarpium dryopteris) T
Leathery Grape Fern (Botrychium multifidum) T
Ledge Spikemoss (Selaginella rupestris) C
Little Grape Fern (Botrychium simplex) T
Woodland Horsetail (Equisetum sylvaticum) T
Norther Adder's-tongue (Ophioglossum pusillum) C
Pte
riodo
phyt
es
Prairie Moonwort (Botrychium capestre) C

34
Threatened and Endangered Species (21)
Status County
SPECIES
Sta
te
Fede
ral
Bla
ck H
awk
Bre
mer
Cer
ro G
ordo
But
ler
Han
cock
Fran
klin
Wrig
ht
Blue-spotted Salamander (Ambystoma laterale) E
Central Newt (Notophthalmus viridescens) T
Am
phib
ians
Mudpuppy (Necturus maculosus) T
E = Endangered Specie T = Threatened Specie C = Candidate/Species of Concern

35
Iowa
West Fork of the Cedar River – 07080204 8-Digit Hydrologic Unit Profile November 2008
Census and Social Data There are 1,324 total farm operators in the watershed. Of these, 1,260 are male and 64 are female. There are 686 principal operators, including 66 percent working full time on the farm (27). There are 892 farms in the West Fork of the Cedar Watershed with farm size ranging from one acre to over 1,000 acres. Size of farms: 7 percent are 1-9 acres; 20 percent are 10-49 acres; 22 percent are 50-179 acres; 25 percent are 180-499 acres; 16 percent are 500-999 acres; and 10 percent are over 1,000 acres. The Census of Agriculture is authorized under Public Law (PL) 105-113 and uses the definition of a farm as any place from which $1,000 or more of agricultural products are produced and sold, or normally would have been sold, during the census year (27). Limiting factors to conservation practice application include such human issues as lack of knowledge, prohibitive costs, lack of management knowledge and skills, resistance to changes in crop yield and profitability (28).

36
Iowa
West Fork of the Cedar River – 07080204 8-Digit Hydrologic Unit Profile November 2008

37
Iowa
West Fork of the Cedar River – 07080204 8-Digit Hydrologic Unit Profile November 2008

38
Iowa
West Fork of the Cedar River – 07080204 8-Digit Hydrologic Unit Profile November 2008

39
Iowa
West Fork of the Cedar River – 07080204 8-Digit Hydrologic Unit Profile November 2008
Resource Concern Trends Focus of Past 7 Years of Progress Efforts in the past seven years have included: promotion of conservation tillage and no-till; promotion of Conservation Reserve Program (CRP) and contract extensions to protect sensitive lands; applying comprehensive nutrient management plans; pest management plans; and water monitoring through IOWATER (Iowa's volunteer water monitoring program). Increase in ethanol plant manufacturing utilizes crop residues which adversely affects soil quality and increases soil erosion. This creates more of a need for increased conservation efforts. Resource Concerns that Require Ongoing Attention Water quality concerns are increased by manure from livestock that is commonly spread on cropland as fertilizer. Using manure as a fertilizer creates potential water quality challenges from bacteria and nutrients delivered through runoff and subsurface drainage (29). Additional water quality concerns include cattle feedlots and pastures, especially with livestock grazing along streams. Grazing along streams also creates problems with stream bank stability and creates erosion, which is reduced when management restricts cattle access. Underground storage tanks create resource issues due to storage of substances, primarily petroleum products (30). In the state of Iowa, as of November 2008, there were approximately 60 biofuel plants that are in operation or under construction. At this time, there is one ethanol plant and one biodiesel plant in operation in the West Fork of the Cedar Watershed. It is reported that 2 - 4 gallons of water is required for every gallon of biofuel produced, creating a concern about water quantity (31). Soil erosion by water is an ongoing concern, especially on cropland. Ongoing efforts are needed to increase acres utilizing conservation tillage and no-till and contoured buffer strips. Wildlife habitat and recreational area resource protection and improvement are ongoing concerns. This includes agricultural land and urban/rural lands that have a lack of recreation trails and greenbelts along river systems.

40
Iowa
West Fork of the Cedar River – 07080204 8-Digit Hydrologic Unit Profile November 2008
The primary natural resource concerns with animal feeding operations are water and air pollution. Concerns include over-application of manure and associated spills; odor; particulates; and ammonia. Potential air quality issues include: effects on human and animal health; impacts on property values; increased risk of nuisance litigation; and NO and NO2 pollution (32). There are 177 Confined Animal Feeding Operations (CAFO) in the watershed, with a total of 239,878 animal units. Ninety-eight percent of the CAFOs are swine, 1 percent cattle, and 1 percent poultry. There are 150 Animal Feeding Operations (AFO) in the watershed, with a total number of 176,230 animal units. Ninety-five percent of the AFOs are swine, 4 percent cattle, and 1 percent poultry (33, 34). Educational activities are needed to promote extension of expiring CRP contracts. Other resource concerns include flood damage to land, infrastructure and buildings along major rivers and streams, lack of adequate wastewater facilities and safe drinking water in small towns and unincorporated towns; and lack of infrastructure for renewable energy efforts. There is a need for development of alternative and renewable energy resources such as wind, geothermal, biomass, or methane from livestock facilities (28). There is a lack of alternative crop production and agricultural diversity, thus decreasing opportunities for positive affects on water quality (28).

41
Iowa
West Fork of the Cedar River – 07080204 8-Digit Hydrologic Unit Profile November 2008
Footnotes and Bibliography
1. U. S. Department of Agriculture, Natural Resources Conservation Service
(USDA-NRCS). Watershed Boundary Dataset (WBD). Projections from UTM Zone 15 NAD 83.
2. Iowa GAP Analysis Program (01/01/2002).
Iowa Department of Natural Resources (IDNR) and Iowa Department of Transportation (IDOT). INCORP Dataset (1997).
3. U. S. Department of Agriculture, National Agricultural Statistics Service
(USDA-NASS). Reclassified Landuse. 4. U. S. Geological Survey (USGS). Digital Elevation Model (DEM). 7.5’ (1:24,000)
Quadrangle Topographic Base Maps. 5. U. S. Geological Survey (USGS). Digital Elevation Model (DEM). 6. U. S. Department of Agriculture, Natural Resources Conservation Service (USDA-NRCS). Soil Survey (July 2008). Summarized data from individual county SSURGO data sets. Des Moines, Iowa. 7. National Climatic Data Center (NCDC). Average Rainfall 1961 – 1990. 8. Iowa Department of Transportation (IDOT). Iowa Transportation Map (2008). Ames,
IA. www.iowadotmaps.com. Last Accessed November 2008. 9. U. S. Department of Agriculture, Natural Resources Conservation Service
(USDA-NRCS). 2008. Wetland Restoration Team. Des Moines, Iowa. 10. Iowa Department of Natural Resources (IDNR). Geological Survey Bureau, Iowa
City, Iowa. Data from county based drainage maps (February 2005). 11. Iowa Drainage Guide, rev. (March 1987). Cooperative Extension Service, Iowa State
University. Ames, Iowa. 12. Iowa Department of Natural Resources (IDNR). Watershed Improvement Section,
Iowa. Source Water Protection. http://www.iowadnr.gov/water/watershed/sourcewater.html. Last Accessed October 22, 2008.
13. U. S. Department of Agriculture, Natural Resources Conservation Service
(USDA-NRCS). 2008. State Soils Staff. Des Moines, Iowa.

42
Iowa
West Fork of the Cedar River – 07080204 8-Digit Hydrologic Unit Profile November 2008
14. National Coordinated Common Resource Area (CRA) Geographic Database.
http://soils.usda.gov/survey/geograhpy/cra.html. Last Accessed September 2008. 15. Iowa Department of Natural Resources (IDNR). 20080813, Lakes in Iowa Listed as
Impaired in 2006 under the Clean Water Act. 16. U. S. Department of Agriculture, Natural Resources Conservation Service
(USDA-NRCS). 2008. State Grassland Specialist. Des Moines, Iowa. 17. U. S. Department of Agriculture, National Agricultural Statistics Service
(USDA-NASS). 18. Conservation Technology Information Center (CTIC). National Crop Residue
Management Survey (2004). 19. U. S. Department of Agriculture, Natural Resources Conservation Service
(USDA-NRCS). Field Office Technical Guide, Section III. 20. U. S. Department of Agriculture, Natural Resources Conservation Service
(USDA-NRCS). 2008. Resource Conservationist. Des Moines, Iowa. 21. Iowa Department of Natural Resources (IDNR). Natural Areas Inventory.
https://programs.iowadnr.gov/naturalareasinventory/pages/Query.aspx Last Accessed September 17, 2008
22. 1997 Natural Resources Inventory (NRI). Estimates for sheet and rill erosion (WEQ
and USLE). The NRI estimates sheet and rill erosion together using the Universal Soil Loss Equation (USLE). The Revised Universal Soil Loss Equation (RUSLE) was not used in the 1997 NRI. RUSLE was not available for previous inventories, therefore, the use of USLE was continued to preserve the trending capacity of the NRI database. Wind erosion is estimated using the Wind Erosion Equation (WEQ). http://www.ia.nrcs.usda.gov/technical/nri/findings/erosion/htm
23. Iowa Department of Natural Resources (IDNR). North Central Iowa – Impaired
Waters (2006). http://wqm.igsb.iowa.edu/WQA/303d/2006/303dFO2.htm. Last Accessed September 9, 2008.
24. Iowa Department of Natural Resources (IDNR). Iowa DNR Watershed Improvement.
http://www.iowadnr.gov/water/watershed/index.html. Last Accessed September 4, 2008.
25. Soil and Water Conservation District (SWCD) Long Range Plans. Butler County,
Iowa, Franklin County, Iowa.
43
Iowa
West Fork of the Cedar River – 07080204 8-Digit Hydrologic Unit Profile November 2008
26. 2008 Environmental Quality Incentive Program (EQIP) Work Group Plans. Butler
County, Iowa. Franklin County, Iowa. 27. U. S. Department of Agriculture, National Agricultural Statistics Service
(USDA-NASS). County number obtained by correlating the percent county which lies within the watershed to determine an estimated number (shown in table). 2002
28. Resource Conservation & Development (RC&D) Area Plan (2008-2012).
Cedar Valley RC&D. Charles City, Iowa. 29. Soil and Water Conservation District (SWCD) Long Range Plan. Cerro Gordo
County, Iowa. 30. George, Gale (2003). Underground Storage Tanks in Iowa. Iowa City, IA: Iowa
Department of Natural Resources. http://www.igsb.uiowa.edu/nrgislibx/gishome.htm. Last Accessed September 2008.
31. Des Moines Register. Iowa Biofuels Database. Interactive Map.
http://data.desmoinesregister.com/ethanol2/index.php. Last Accessed October 22, 2008.
32. Iowa Department of Natural Resources (IDNR) (2007). Animal Feeding Operations
(03/23/07). Iowa City, IA: Iowa DNR, Geological Survey Bureau. Animal feeding operations are registered, permitted, or monitored by the Iowa DNR. http://www.igsb.uiowa.edu/nrgislibx.gishome.htm. Last Accessed September 2008.
33. Wolter, Calvin (February 6, 2006). Confinement Feeding Operations Registered With
the Iowa Department of Natural Resources. Iowa Department of Natural Resources (IDNR), Geologic Survey Bureau. Iowa City, Iowa.
34. Clark, Kathryne (February 2005). Animal Feeding Operations under Regulation by
the Department of Natural Resources in the State of Iowa. Iowa Department of Natural Resources (IDNR), Geologic Survey Bureau. Iowa City, Iowa.

44
WATERSHED NAME & CODE WEST FORK OF CEDAR - 07080204 LANDUSE ACRES 451,467
LANDUSE TYPE ROW CROP TYPICAL UNIT SIZE ACRES 179
POSSIBLE SOURCES OF FUNDING ESTIMATED PARTICIPATION 37%
FUTURE USDA INVESTMENT OTHERS
CONSERVATION SYSTEMS BY TREATMENT LEVELS
New Treatment
Units CTA EQIP WRP WHIP CSP CRP/
CREP Fed State Local NOTES/COMMENTS
Progressive System Acres Treated 120,451
Conservation Crop Rotation (ac.) 328 0 X X 0 0 X 0 Grassed Waterway (ac.) 412 0 X X X X IFIP Nutrient Management (ac.) 590 115,633 X X X Pest Management (ac.) 595 115,633 X X X Residue and Tillage Management, Mulch Till (ac.) 345 0 X X X Residue Management, Seasonal (ac.) 344 0 X 0 0 0 0 Waste Utilization (ac.) 633 22,886 X X 0
Resource Management System (RMS) Acres Treated 31,151
Conservation Crop Rotation (ac.) 328 0 X X X 0 Filter Strip (ac.) 393 2,492 X X X REAP Grassed Waterway (ac.) 412 0 X X X IFIP Nutrient Management (ac.) 590 11,464 X X X Pest Management (ac.) 595 11,464 X X X 0 Residue and Tillage Management, Mulch Till (ac.) 345 0 X X X 0 Residue Management, Seasonal (ac.) 344 0 X 0 0 Upland Wildlife Habitat Management (ac.) 645 20,248 X X X X X Waste Utilization (ac.) 633 2,367 X X

45
WATERSHED NAME & CODE WEST FORK OF CEDAR - 07080204 LANDUSE ACRES 451,467
LANDUSE TYPE ROW CROP TYPICAL UNIT SIZE ACRES 179
ASSESSMENT INFORMATION ESTIMATED PARTICIPATION 37%
CURRENT CONDITIONS FUTURE CONDITIONS RESOURCE CONCERNS
CONSERVATION SYSTEMS BY TREATMENT LEVELS Total
Units Existing
UnchangedUnits
New Treatment
Units Total Units
Soil Erosion – Sheet and Rill
Soil Erosion – Ephemeral Gully
Water Quality – Excessive Nutrients and Organics in Surface Water
Water Quality – Excessive Suspended Sediment and Turbidity in Surface Water
Baseline System System Rating -> 2 3 1 2
Total Acreage at Baseline Level 207,675 74,763 0 74,763 Conservation Crop Rotation (ac.) 328 207,675 74,763 0 74,763 4 2 2 2 Grassed Waterway (ac.) 412 2,077 748 0 748 0 5 2 2 Residue and Tillage Management, Mulch Till (ac.) 345 72,686 26,167 0 26,167 1 0 0 1 Residue Management, Seasonal (ac.) 344 134,989 48,596 0 48,596 2 1 0 1
Progressive System System Rating -> 3 3 4 2
Total Acreage at Progressive Level 207,675 188,984 120,451 309,435 Conservation Crop Rotation (ac.) 328 207,675 309,435 0 309,435 4 2 2 2 Grassed Waterway (ac.) 412 2,077 3,094 0 3,094 0 5 2 2 Nutrient Management (ac.) 590 199,368 181,425 115,633 297,058 0 0 5 0 Pest Management (ac.) 595 199,368 181,425 115,633 297,058 0 0 0 2 Residue and Tillage Management, Mulch Till (ac.) 345 72,686 108,302 0 108,302 1 0 0 1 Residue Management, Seasonal (ac.) 344 134,989 201,133 0 201,133 2 1 0 1 Waste Utilization (ac.) 633 39,458 35,907 22,886 58,793 2 0 2 0
Resource Management System (RMS) System Rating -> 3 4 4 3
Total Acreage at RMS Level 36,117 36,117 31,151 67,269 Conservation Crop Rotation (ac.) 328 32,867 61,214 0 61,214 4 2 2 2 Filter Strip (ac.) 393 2,889 2,889 2,492 5,381 0 0 4 4 Grassed Waterway (ac.) 412 361 673 0 673 0 5 2 2 Nutrient Management (ac.) 590 33,228 50,423 11,464 61,887 0 0 5 0 Pest Management (ac.) 595 33,228 50,423 11,464 61,887 0 0 0 2 Residue and Tillage Management, Mulch Till (ac.) 345 12,641 23,544 0 23,544 1 0 0 1 Residue Management, Seasonal (ac.) 344 20,226 37,670 0 37,670 2 1 0 1 Upland Wildlife Habitat Management (ac.) 645 23,476 23,476 20,248 43,725 3 3 0 2 Waste Utilization (ac.) 633 6,862 10,414 2,367 12,781 2 0 2 0

46
CONSERVATION INVESTMENT INFORMATION
FUTURE USDA INVESTMENT PRIVATE INVESTMENT
InstallationCost
ManagementCost - 3 yrs
Technical Assistance
Installation Cost
Annual O & M+ Mgt Costs CONSERVATION SYSTEMS
BY TREATMENT LEVELS New
Treatment Units 50% 100% 20%
Total Present Value Cost
50% 100%
Total Present Value Cost
Progressive System Acres Treated 120451.3956
Conservation Crop Rotation (ac.) 328 0 $0 $0 $0 $0 $0 $0 $0 Grassed Waterway (ac.) 412 0 $0 $0 $0 $0 $0 $0 $0 Nutrient Management (ac.) 590 115,633 $0 $4,509,700 $901,940 $4,920,101 $0 $1,503,233 $2,314,005 Pest Management (ac.) 595 115,633 $0 $1,387,600 $277,520 $1,513,877 $0 $462,533 $712,002 Residue and Tillage Management, Mulch Till (ac.) 345 0 $0 $0 $0 $0 $0 $0 $0 Residue Management, Seasonal (ac.) 344 0 $0 $0 $0 $0 $0 $0 $0 Waste Utilization (ac.) 633 22,886 $0 $205,972 $41,194 $224,716 $0 $68,657 $105,688
Subtotal $0 $6,103,272 $1,220,654 $6,658,694 $0 $2,034,424 $3,131,694
Resource Management System (RMS) Acres Treated 31151.223
Conservation Crop Rotation (ac.) 328 0 $0 $0 $0 $0 $0 $0 $0 Filter Strip (ac.) 393 2,492 $4,984,196 $0 $996,839 $5,981,035 $4,984,196 $199,368 $5,824,005 Grassed Waterway (ac.) 412 0 $0 $0 $0 $0 $0 $0 $0 Nutrient Management (ac.) 590 11,464 $0 $447,082 $89,416 $487,769 $0 $149,027 $229,406 Pest Management (ac.) 595 11,464 $0 $137,564 $27,513 $150,083 $0 $45,855 $70,586 Residue and Tillage Management, Mulch Till (ac.) 345 0 $0 $0 $0 $0 $0 $0 $0 Residue Management, Seasonal (ac.) 344 0 $0 $0 $0 $0 $0 $0 $0 Upland Wildlife Habitat Management (ac.) 645 20,248 $0 $607,449 $121,490 $662,729 $0 $202,483 $311,693 Waste Utilization (ac.) 633 2,367 $0 $21,307 $4,261 $23,246 $0 $7,102 $10,933
Subtotal $4,984,196 $1,213,402 $1,239,520 $7,304,862 $4,984,196 $603,835 $6,446,623
TOTAL ACRES TREATED / ESTIMATED TREATMENT COSTS 151602.6186 $4,984,196 $7,316,675 $2,460,174 $13,963,556 $4,984,196 $2,638,259 $9,578,318

47
WATERSHED NAME & CODE WEST FORK OF CEDAR - 07080204 LANDUSE ACRES 4,046
LANDUSE TYPE FARMSTEAD TYPICAL UNIT SIZE ACRES 4
POSSIBLE SOURCES OF FUNDING ESTIMATED PARTICIPATION 37%
FUTURE USDA INVESTMENT OTHERS
CONSERVATION SYSTEMS BY TREATMENT LEVELS
New Treatment
Units CTA EQIP WRP WHIP CSP CRP/
CREP Fed State Local NOTES/COMMENTS
Progressive System Acres Treated 1,080
Animal Mortality Facility (no.) 316 274 X X 0 0 Pest Management (ac.) 595 313 X X X Waste Storage Facility (no.) 313 0 X X Windbreak/Shelterbreak Establishment (ft.) 380 0 X X X X X REAP
Resource Management System (RMS) Acres Treated 279
Animal Mortality Facility (no.) 316 28 X X 0 0 Pest Management (ac.) 595 32 X X X Upland Wildlife Habitat Management (ac.) 645 128 X X Waste Storage Facility (no.) 313 0 X X 0 Windbreak/Shelterbreak Establishment (ft.) 380 0 X X X X X REAP

48
WATERSHED NAME & CODE WEST FORK OF CEDAR - 07080204 LANDUSE ACRES 4,046
LANDUSE TYPE FARMSTEAD TYPICAL UNIT SIZE ACRES 4
ASSESSMENT INFORMATION ESTIMATED PARTICIPATION 37%
CURRENT CONDITIONS FUTURE CONDITIONS RESOURCE CONCERNS
CONSERVATION SYSTEMS BY TREATMENT LEVELS Total
Units Existing
UnchangedUnits
New Treatment
Units Total Units
Water Quality – Excessive Nutrients and Organics in Groundwater
Air Quality – Particulate matter less than 10 micrometers in diameter (PM 10)
Air Quality – Excessive Greenhouse Gas: CO2 (carbon dioxide)
Air Quality – Ammonia (NH3)
Baseline System System Rating -> 1 1 1 1
Total Acreage at Baseline Level 1,861 670 0 670 Waste Storage Facility (no.) 313 472 170 0 170 2 0 0 2 Windbreak/Shelterbreak Establishment (ft.) 380 298,097 107,315 0 107,315 1 2 2 2
Progressive System System Rating -> 2 1 1 1
Total Acreage at Progressive Level 1,861 1,694 1,080 2,773 Animal Mortality Facility (no.) 316 472 430 274 704 2 1 -1 0 Pest Management (ac.) 595 540 491 313 804 0 0 0 0 Waste Storage Facility (no.) 313 472 704 0 704 2 0 0 2 Windbreak/Shelterbreak Establishment (ft.) 380 298,097 444,165 0 444,165 1 2 2 2
Resource Management System (RMS) System Rating -> 2 2 1 1
Total Acreage at RMS Level 324 324 279 603 Animal Mortality Facility (no.) 316 82 125 28 153 2 1 -1 0 Pest Management (ac.) 595 94 142 32 175 0 0 0 0 Upland Wildlife Habitat Management (ac.) 645 149 149 128 277 0 2 2 0 Waste Storage Facility (no.) 313 82 153 0 153 2 0 0 2 Windbreak/Shelterbreak Establishment (ft.) 380 51,843 96,558 0 96,558 1 2 2 2

49
CONSERVATION INVESTMENT INFORMATION
FUTURE USDA INVESTMENT PRIVATE INVESTMENT
InstallationCost
ManagementCost - 3 yrs
Technical Assistance
Installation Cost
Annual O & M+ Mgt Costs CONSERVATION SYSTEMS
BY TREATMENT LEVELS New
Treatment Units 50% 100% 20%
Total Present Value Cost
50% 100%
Total Present Value Cost
Progressive System Acres Treated 1079.574184
Animal Mortality Facility (no.) 316 274 $2,877,038 $0 $575,408 $3,452,445 $2,877,038 $287,704 $4,088,951 Pest Management (ac.) 595 313 $0 $3,757 $751 $4,099 $0 $1,252 $1,928 Waste Storage Facility (no.) 313 0 $0 $0 $0 $0 $0 $0 $0 Windbreak/Shelterbreak Establishment (ft.) 380 0 $0 $0 $0 $0 $0 $0 $0
Subtotal $2,877,038 $3,757 $576,159 $3,456,544 $2,877,038 $288,956 $4,090,879
Resource Management System (RMS) Acres Treated 279.20022
Animal Mortality Facility (no.) 316 28 $297,625 $0 $59,525 $357,150 $297,625 $29,762 $422,995 Pest Management (ac.) 595 32 $0 $389 $78 $424 $0 $130 $199 Upland Wildlife Habitat Management (ac.) 645 128 $0 $3,853 $771 $4,204 $0 $1,284 $1,977 Waste Storage Facility (no.) 313 0 $0 $0 $0 $0 $0 $0 $0 Windbreak/Shelterbreak Establishment (ft.) 380 0 $0 $0 $0 $0 $0 $0 $0
Subtotal $297,625 $4,242 $60,373 $361,777 $297,625 $31,176 $425,171
TOTAL ACRES TREATED / ESTIMATED TREATMENT COSTS 1358.774404 $3,174,662 $7,999 $636,532 $3,818,321 $3,174,662 $320,132 $4,516,050

50
WATERSHED NAME & CODE WEST FORK OF CEDAR - 07080204 LANDUSE ACRES 10,315
LANDUSE TYPE NATURAL AREAS TYPICAL UNIT SIZE ACRES 42
POSSIBLE SOURCES OF FUNDING ESTIMATED PARTICIPATION 37%
FUTURE USDA INVESTMENT OTHERS
CONSERVATION SYSTEMS BY TREATMENT LEVELS
New Treatment
Units CTA EQIP WRP WHIP CSP CRP/
CREP Fed State Local NOTES/COMMENTS
Progressive System Acres Treated 2,752
Forest Stand Improvement (ac.) 666 1,073 X X X X X REAP Pasture & Hayland Planting (ac.) 512 0 X X X REAP, IFIP Tree/Shrub Establishment (ac.) 612 0 X X X X X REAP Upland Wildlife Habitat Management (ac.) 645 83 X X Wetland Wildlife Habitat Management (ac.) 644 28 X X X X
Resource Management System (RMS) Acres Treated 712
Early Successional Habitat Development/Management (ac.) 647 28 X X Forest Stand Improvement (ac.) 666 545 X X X X X REAP Pasture & Hayland Planting (ac.) 512 0 X X X REAP, IFIP Pest Management (ac.) 595 712 X X X Tree/Shrub Establishment (ac.) 612 0 X X X X X REAP Upland Wildlife Habitat Management (ac.) 645 286 X X X Use Exclusion (ac.) 472 712 X X X X REAP Wetland Wildlife Habitat Management (ac.) 644 10 X X X X

51
WATERSHED NAME & CODE WEST FORK OF CEDAR - 07080204 LANDUSE ACRES 10,315
LANDUSE TYPE NATURAL AREAS TYPICAL UNIT SIZE ACRES 42
ASSESSMENT INFORMATION ESTIMATED PARTICIPATION 37%
CURRENT CONDITIONS FUTURE CONDITIONS RESOURCE CONCERNS
CONSERVATION SYSTEMS BY TREATMENT LEVELS Total
Units Existing
UnchangedUnits
New Treatment
Units Total Units
Soil Erosion – Classic Gully
Soil Erosion – Streambank
Fish and Wildlife – Inadequate Cover/Shelter
Fish and Wildlife – T & E Species: Declining Species, Species of Concern
Baseline System System Rating -> 1 0 3 1
Total Acreage at Baseline Level 4,745 1,708 0 1,708 Pasture & Hayland Planting (ac.) 512 190 68 0 68 0 0 3 0 Tree/Shrub Establishment (ac.) 612 1,851 666 0 666 2 0 4 3
Progressive System System Rating -> 1 0 5 3
Total Acreage at Progressive Level 4,745 7,117 2,752 9,869 Forest Stand Improvement (ac.) 666 1,851 2,776 1,073 3,849 0 0 3 1 Pasture & Hayland Planting (ac.) 512 190 395 0 395 0 0 3 0 Tree/Shrub Establishment (ac.) 612 1,851 3,849 0 3,849 2 0 4 3 Upland Wildlife Habitat Management (ac.) 645 142 214 83 296 0 1 5 4 Wetland Wildlife Habitat Management (ac.) 644 47 71 28 99 0 0 5 4
Resource Management System (RMS) System Rating -> 1 2 5 4
Total Acreage at RMS Level 825 825 712 1,537 Early Successional Habitat Development/Management (ac.) 647 33 33 28 61 0 0 4 4 Forest Stand Improvement (ac.) 666 825 992 545 1,537 0 0 3 1 Pasture & Hayland Planting (ac.) 512 33 61 0 61 0 0 3 0 Pest Management (ac.) 595 825 825 712 1,537 0 0 3 0 Tree/Shrub Establishment (ac.) 612 322 599 0 599 2 0 4 3 Upland Wildlife Habitat Management (ac.) 645 347 359 286 646 0 1 5 4 Use Exclusion (ac.) 472 825 825 712 1,537 2 4 3 2 Wetland Wildlife Habitat Management (ac.) 644 17 21 10 31 0 0 5 4
52
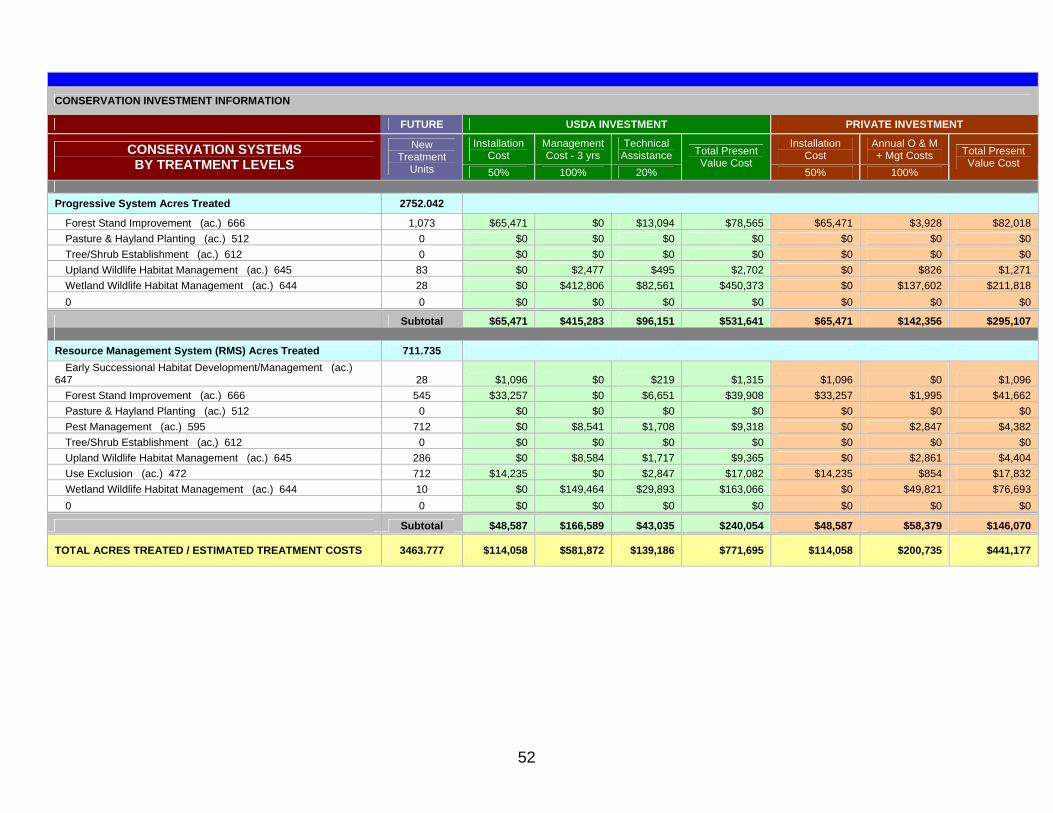
CONSERVATION INVESTMENT INFORMATION
FUTURE USDA INVESTMENT PRIVATE INVESTMENT
InstallationCost
ManagementCost - 3 yrs
Technical Assistance
Installation Cost
Annual O & M+ Mgt Costs CONSERVATION SYSTEMS
BY TREATMENT LEVELS New
Treatment Units 50% 100% 20%
Total Present Value Cost
50% 100%
Total Present Value Cost
Progressive System Acres Treated 2752.042
Forest Stand Improvement (ac.) 666 1,073 $65,471 $0 $13,094 $78,565 $65,471 $3,928 $82,018 Pasture & Hayland Planting (ac.) 512 0 $0 $0 $0 $0 $0 $0 $0 Tree/Shrub Establishment (ac.) 612 0 $0 $0 $0 $0 $0 $0 $0 Upland Wildlife Habitat Management (ac.) 645 83 $0 $2,477 $495 $2,702 $0 $826 $1,271 Wetland Wildlife Habitat Management (ac.) 644 28 $0 $412,806 $82,561 $450,373 $0 $137,602 $211,818 0 0 $0 $0 $0 $0 $0 $0 $0
Subtotal $65,471 $415,283 $96,151 $531,641 $65,471 $142,356 $295,107
Resource Management System (RMS) Acres Treated 711.735 Early Successional Habitat Development/Management (ac.)
647 28 $1,096 $0 $219 $1,315 $1,096 $0 $1,096 Forest Stand Improvement (ac.) 666 545 $33,257 $0 $6,651 $39,908 $33,257 $1,995 $41,662 Pasture & Hayland Planting (ac.) 512 0 $0 $0 $0 $0 $0 $0 $0 Pest Management (ac.) 595 712 $0 $8,541 $1,708 $9,318 $0 $2,847 $4,382 Tree/Shrub Establishment (ac.) 612 0 $0 $0 $0 $0 $0 $0 $0 Upland Wildlife Habitat Management (ac.) 645 286 $0 $8,584 $1,717 $9,365 $0 $2,861 $4,404 Use Exclusion (ac.) 472 712 $14,235 $0 $2,847 $17,082 $14,235 $854 $17,832 Wetland Wildlife Habitat Management (ac.) 644 10 $0 $149,464 $29,893 $163,066 $0 $49,821 $76,693 0 0 $0 $0 $0 $0 $0 $0 $0
Subtotal $48,587 $166,589 $43,035 $240,054 $48,587 $58,379 $146,070
TOTAL ACRES TREATED / ESTIMATED TREATMENT COSTS 3463.777 $114,058 $581,872 $139,186 $771,695 $114,058 $200,735 $441,177

53
WATERSHED NAME & CODE WEST FORK OF CEDAR - 07080204 LANDUSE ACRES 27,945
LANDUSE TYPE PASTURE/HAYLAND TYPICAL UNIT SIZE ACRES 23
POSSIBLE SOURCES OF FUNDING ESTIMATED PARTICIPATION 37%
FUTURE USDA INVESTMENT OTHERS
CONSERVATION SYSTEMS BY TREATMENT LEVELS
New Treatment
Units CTA EQIP WRP WHIP CSP CRP/
CREP Fed State Local NOTES/COMMENTS
Progressive System Acres Treated 7,456
Fence (ft.) 382 103,084 x x 0 x x x REAP Pasture & Hayland Planting (ac.) 512 0 x x x x REAP, IFIP Upland Wildlife Habitat Management (ac.) 645 820 x x x Wetland Wildlife Habitat Management (ac.) 644 6,636 x x x x
Resource Management System (RMS) Acres Treated 1,928
Early Successional Habitat Development/Management (ac.) 647 1,716 x x x Fence (ft.) 382 10,664 x x x x x REAP Nutrient Management (ac.) 590 1,928 x x 0 x Pasture & Hayland Planting (ac.) 512 212 x x 0 x x REAP, IFIP Pest Management (ac.) 595 1,928 x x x 0 Pipeline (ft.) 516 60,948 x x x Prescribed Grazing (ac.) 528 1,928 x x x x REAP Upland Wildlife Habitat Management (ac.) 645 85 x x x x Watering Facility (no.) 614 419 x x 0 x Wetland Wildlife Habitat Management (ac.) 644 686 x 0 x x x

54
WATERSHED NAME & CODE WEST FORK OF CEDAR - 07080204 LANDUSE ACRES 27,945
LANDUSE TYPE PASTURE/HAYLAND TYPICAL UNIT SIZE ACRES 23
ASSESSMENT INFORMATION ESTIMATED PARTICIPATION 37%
CURRENT CONDITIONS FUTURE CONDITIONS RESOURCE CONCERNS
CONSERVATION SYSTEMS BY TREATMENT LEVELS Total
Units Existing
UnchangedUnits
New Treatment
Units Total Units
Soil Erosion – Streambank
Water Quality – Excessive Nutrients and Organics in Surface Water
Domestic Animals – Inadequate Quantities and Quality of Feed and Forage
Domestic Animals – Inadequate Stock Water
Baseline System System Rating -> 0 1 3 0
Total Acreage at Baseline Level 12,855 4,628 0 4,628 Pasture & Hayland Planting (ac.) 512 11,441 4,119 0 4,119 0 2 5 0
Progressive System System Rating -> 0 1 4 0
Total Acreage at Progressive Level 12,855 19,282 7,456 26,738 Fence (ft.) 382 177,730 266,596 103,084 369,680 0 0 4 0 Pasture & Hayland Planting (ac.) 512 11,441 23,797 0 23,797 0 2 5 0 Upland Wildlife Habitat Management (ac.) 645 1,414 2,121 820 2,941 1 0 2 0 Wetland Wildlife Habitat Management (ac.) 644 11,441 17,161 6,636 23,797 0 0 1 1
Resource Management System (RMS) System Rating -> 2 3 5 4
Total Acreage at RMS Level 2,236 2,236 1,928 4,164 Early Successional Habitat Development/Management (ac.) 647 1,990 1,990 1,716 3,706 0 0 1 0 Fence (ft.) 382 30,910 46,905 10,664 57,569 0 0 4 0 Nutrient Management (ac.) 590 2,236 2,236 1,928 4,164 0 5 4 0 Pasture & Hayland Planting (ac.) 512 2,236 3,952 212 4,164 0 2 5 0 Pest Management (ac.) 595 2,236 2,236 1,928 4,164 0 0 4 0 Pipeline (ft.) 516 70,664 70,664 60,948 131,612 2 0 0 5 Prescribed Grazing (ac.) 528 2,236 2,236 1,928 4,164 3 1 5 0 Upland Wildlife Habitat Management (ac.) 645 246 373 85 458 1 0 2 0 Watering Facility (no.) 614 486 486 419 905 0 0 4 5 Wetland Wildlife Habitat Management (ac.) 644 1,990 3,019 686 3,706 0 0 1 1

55
CONSERVATION INVESTMENT INFORMATION
FUTURE USDA INVESTMENT PRIVATE INVESTMENT
InstallationCost
ManagementCost - 3 yrs
Technical Assistance
Installation Cost
Annual O & M+ Mgt Costs CONSERVATION SYSTEMS
BY TREATMENT LEVELS New
Treatment Units 50% 100% 20%
Total Present Value Cost
50% 100%
Total Present Value Cost
Progressive System Acres Treated 7455.726
Fence (ft.) 382 103,084 $95,868 $0 $19,174 $115,041 $95,868 $3,835 $112,021 Pasture & Hayland Planting (ac.) 512 0 $0 $0 $0 $0 $0 $0 $0 Upland Wildlife Habitat Management (ac.) 645 820 $0 $24,604 $4,921 $26,843 $0 $8,201 $12,625 Wetland Wildlife Habitat Management (ac.) 644 6,636 $0 $99,533,942 $19,906,788 $108,591,927 $0 $33,177,981 $51,072,586 0 0 $0 $0 $0 $0 $0 $0 $0
Subtotal $95,868 $99,558,546 $19,930,883 $108,733,811 $95,868 $33,190,017 $51,197,231
Resource Management System (RMS) Acres Treated 1928.205
Early Successional Habitat Development/Management (ac.) 647 1,716 $66,070 $0 $13,214 $79,284 $66,070 $0 $66,070 Fence (ft.) 382 10,664 $9,917 $0 $1,983 $11,901 $9,917 $397 $11,588 Nutrient Management (ac.) 590 1,928 $0 $75,200 $15,040 $82,043 $0 $25,067 $38,586 Pasture & Hayland Planting (ac.) 512 212 $14,317 $0 $2,863 $17,180 $14,317 $286 $15,523 Pest Management (ac.) 595 1,928 $0 $23,138 $4,628 $25,244 $0 $7,713 $11,873 Pipeline (ft.) 516 60,948 $48,758 $0 $9,752 $58,510 $48,758 $1,950 $56,974 Prescribed Grazing (ac.) 528 1,928 $54,954 $0 $10,991 $65,945 $54,954 $0 $54,954 Upland Wildlife Habitat Management (ac.) 645 85 $0 $2,545 $509 $2,777 $0 $848 $1,306 Watering Facility (no.) 614 419 $209,588 $0 $41,918 $251,505 $209,588 $12,575 $262,559 Wetland Wildlife Habitat Management (ac.) 644 686 $0 $10,296,615 $2,059,323 $11,233,648 $0 $3,432,205 $5,283,371 0 0 $0 $0 $0 $0 $0 $0 $0
Subtotal $403,604 $10,397,498 $2,160,220 $11,828,037 $403,604 $3,481,041 $5,802,804
TOTAL ACRES TREATED / ESTIMATED TREATMENT COSTS 9383.931 $499,472 $109,956,044 $22,091,103 $120,561,848 $499,472 $36,671,058 $57,000,035