Embed Size (px)
Citation preview

Westlife Development Limited
Analyst Meet
30 March 2016

Disclaimer
Some of the statements herein constitute “forward-looking statements” that do not directly or
exclusively relate to historical facts. These forward-looking statements reflect our intentions, plans,
expectations, assumptions and beliefs about future events and are subject to risks, uncertainties
and other factors, many of which are outside our control. Important factors that could cause
actual results to differ materially from the expectations expressed or implied in the forward-
looking statements include known and unknown risks. Because actual results could differ
materially from our intentions, plans, expectations, assumptions and beliefs about the future, you
are urged to view with caution all forward-looking statements contained herein. Westlife
Development Limited does not undertake any obligation to update or revise forward-looking
statements, whether as a result of new information, future events or otherwise. In addition, some
of the information and estimates quoted in this document have been obtained from external
sources, and the same have not been independently verified by Westlife Development Limited.

Investor day
The purpose of the meeting is to help provide you with a deeper understanding of the business
by deep diving into our business drivers and by giving an overview of the strategic direction of
the Company
Intention is to conduct an investor day once in two years. Shall evaluate the frequency moving
forward
The data provided in the presentation will not be shared during our regular interactions and
quarterly earnings calls. Updates will be provided in future investor day meetings

Agenda
Presenters/Speakers Title
Ankit Arora Welcome, introductions, disclaimer & today’s agenda
Amit Jatia - Overview of the industry - Introduction to McDonald’s India and Hardcastle Restaurants
Smita Jatia Strategic pillars to grow average unit volume (AUV)
Amit Jatia Resetting unit economics to support growth
Executive Leadership Team Q&A

Western Fast Food (WFF) in India
Presented by :
Amit Jatia, Vice Chairman

Informal Eat Out (IEO)
USD 112 Bn
QSR
USD 18 Bn
IFF
USD 16.7 Bn
WFF
USD
1.3 Bn
8.4%
7.1%
6.8%
12.4%
Estimated Growth : 2015-16
WFF constitutes just 1% of IEO and has tremendous scope to grow1
1- Euromonitor International 2014 report - QSR Food Service Market
1% 19% 20%
81%
99% 81% 80% 19%
India China Singapore U.S.A.
Share of Western Fast Food in IEO
Other segments' share in IEO
Eat out
frequency 5-6 22 22
WFF – A nascent but rapidly growing
category
Market share of WFF and eat out frequency in India is
low. Recovering economy and future growth in
disposable income to help drive growth
Source – McDonald’s brand track research

Who We Are & Our Opportunities

INDIA’S LEADING BURGER COMPANY
BASED ON SALES AND UNITS
380+ Restaurants across India
0.8%1 Market share in the QSR
industry
OVER 10,000 Employees
300+ million customers served pan
India annually
* As of 31 March 2016
McDonald’s in India
1 : Euromonitor International - QSR Food Service Market

WEST AND SOUTH INDIA
236 Restaurants
75 McCafés
124 Delivery hubs
125 Breakfast restaurants
180+ million customers
* As of 31 March 2016
Promoter group
ownership
62.2%
Westlife Development
Ltd (WDL)
(BSE : 505533)
100% Hardcastle
Restaurants Pvt. Ltd. (HRPL)
HARDCASTLE RESTAURANTS
PVT. LTD.
(HRPL )
West and South
CONNAUGHT PLAZA
RESTAURANTS PVT. LTD.
(CPRL)
North and East
Westlife Development Limited in India
1 : Euromonitor International - QSR Food Service Market

Solid foundation – A competitive advantage
Strong supply chain
Unique “farm to fork” cold supply
chain including delivery of fresh
produce & buns every alternate
day
Provides economies of scale, high
food safety standards, product
consistency & innovation
Continuously work with farmers on
an extensive agronomy program
Real estate
Diverse portfolio of restaurants built
through intelligent market planning
and penetration
Long term deals (normally 20 years vs. industry average of 9-12 years)
Strong unit economics that helps
deliver a cash on cash ROI of 20%+
within 30 months
People
One of the most experienced
management team in QSR industry
with deep knowledge of the
business
Strong people development and
management processes in place
Strong knowledge transfer from
McDonald’s Corp
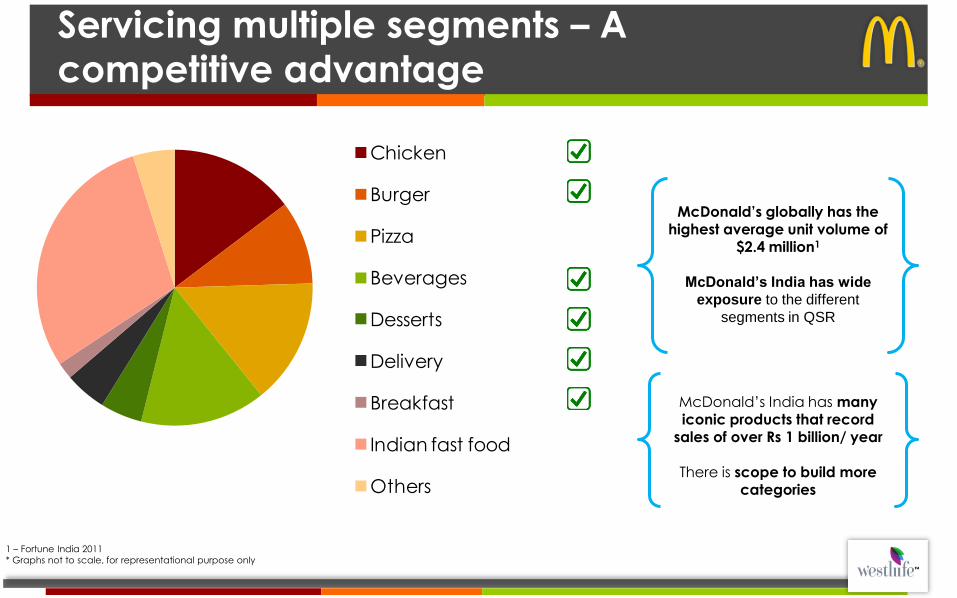
Servicing multiple segments – A competitive advantage
McDonald’s India has many iconic products that record
sales of over Rs 1 billion/ year
There is scope to build more
categories
Chicken
Burger
Pizza
Beverages
Desserts
Delivery
Breakfast
Indian fast food
Others
1 – Fortune India 2011
* Graphs not to scale, for representational purpose only
McDonald’s globally has the
highest average unit volume of $2.4 million1
McDonald’s India has wide
exposure to the different
segments in QSR

Brand extensions add more occasions – A
competitive advantage
In-store for celebrations,
bonding and hanging out
McDelivery, Drive Thru and
breakfast for convenience
McCafé for experience
and indulgence
As we add brand extensions to each restaurant, the results are greater as a whole than the individual parts resulting in
1+1+1=5 With just incremental capital expenditure and minimal increase in operating costs, brand extensions provide significant operating leverage as they scale

Highest Annual Sales
Per Store Fortune India 2011
Forbes 2015
Brand Ranking World’s 6th most valuable brand
McDonald’s Corporation – The Big Mac of
fast food

Brand extensions - drives SSSG and
operating margin
Leveraging McCafé,
McDelivery and menu
further in recent times has
accelerated speed of
recovery of SSSG
Operating leverage
because of “store in store
format” has helped
improve restaurant
operating margins
* Graphs not to scale, for representational purpose only
-8.1%
-0.3%
-5.1% -4.9%
1.7%
3.1% 6.2%
8.2% 8.5%
10.6% 11.1%
13.1%
Q2 FY15 Q3 FY15 Q4 FY15 Q1 FY16 Q2 FY16 Q3 FY16
Contribution of brand extensions to total sales SSSG% Restaurant operating margin

Westlife Development Ltd Vision : 2022
Market
share and
margin
growth Targ
ets
B
uild
ing
blo
ck
s
Grow restaurant base
BROADENING ACCESSIBILITY
OF BRAND MCDONALD’S GROW BASELINE SALES
Grow average unit volume
Brand extensions, menu
introductions and brand
differentiation

Food tech industry overview
Launch of several “food
tech” companies in India
has caused a boom in the
food delivery market
They have raised $350+
million in the last 2 years
resulting in many of them
having multimillion dollar
valuations

Vision for McDelivery
McDonald’s will grow the western fast food eat out market by providing the
convenience of “eating out at home” through cutting edge technology and
operational excellence

Role of McDelivery – Another occasion to grow AUV
McDelivery is another strategic
pillar for growth
Enables McDonald’s to service
one more eat our occasion
Big opportunity for McDelivery to
grow as the existing $1+ billion
delivery industry grows
Source : Euromonitor International - QSR Food Service Market
2%
16%
18%
India
Delivery
India
Takeaway
U.S.A
Delivery
Share of Eat Out Market

Role of McDelivery – Increases addressable
base
Source : Euromonitor International - QSR Food Service Market, HRPL proprietary third party market segmentation study Past market segment – Chicken, burger, pizza, other cuisine fast food + Ice cream parlors
$1.3b
$0.45b
$1.75b
Past market segment exposure Delivery market New market segment exposure
Total market segment exposure for McDonald’s

1x
1.9x
2010 2011 2012 2013 2014 2015
Same store delivery sales
McDelivery – Strong baseline growth
1x
2.2x
2011 2012 2013 2014 2015
Growth in McDelivery sales
Strong baseline growth through same store delivery sales growth and addition of delivery hubs
* Graphs not to scale, for representational purpose only

McDelivery – Technology driven customer
growth
1x
1.75x
2011 2012 2013 2014 2015
Growth in McDelivery orders
93%
71%
57%
7%
29%
43%
2013 2014 2015
Source of delivery orders
Call centre Online
Website launch Launch of mobile app
Revamp of mobile app

Solid foundation for growth
125 hubs in over 9 cities Evolving customer interface and digital enablement
Strong backend with 500+ bikes and 600+ riders
(including outsourced riders)
Strong operational processes and systems

Potential for McDelivery
5 - 8
8 -12
Current Potential
Average annual sales/ McDelivery hub
(Rs in millions)
Will be driven by improvement in technology
platforms, digital enablement and McDelivery
specific promotions
125 140 - 160
330 - 350 105 80
120 - 150
Mar-16 Current potential Future potential
Number of delivery hubs
McDelivery stores Non McDelivery stores
McDelivery is in 55% of restaurants. Delivery network
can be easily expanded as minimal capital
expenditure is required
* Graphs not to scale, for representational purpose only

Potential for McDelivery
5 - 8
8 -12
Current Potential
Average annual sales/ McDelivery hub
(Rs in millions)
Will be driven by improvement in technology
platforms, digital enablement and McDelivery
specific promotions
125 140 - 160
330 - 350 105 80
120 - 150
Mar-16 Current potential Future potential
Number of delivery hubs
McDelivery stores Non McDelivery stores
McDelivery is in 55% of restaurants. Delivery network
can be easily expanded as minimal capital
expenditure is required
Future sales potential as restaurant base doubles : Rs 3.25 – 3.50 billion
YoY 100 bps ROM growth with an 18% - 22% CAGR in McDelivery sales
* Graphs not to scale, for representational purpose only

Overview of the coffee industry
The retail coffee industry is
underdeveloped in India as there is
a low per capita consumption of
coffee
The industry is estimated to grow at
a CAGR of 20% taking the industry
size from Rs 20 billion to Rs 50 billion
by 2020
0.1
0.9 1 1.1 1.3
4.5
India China Indonesia Thailand Phillipines U.S.A
Annual per capita consumption of coffee (in kgs)
Source : International Coffee Organization

Vision for McCafé
McDonald’s will bring premium coffee to the mass market in India and
accelerate the growth of coffee and specialty beverages in India like it did
with Western Fast Food in the early 2000s

Role of McCafé – Increases addressable base
further
Source : Euromonitor International - QSR Food Service Market, HRPL proprietary third party market segmentation study Past market segment – Chicken, burger, pizza, other cuisine fast food + Ice cream parlors
$1.3b
1,723
$0.45b
$0.6b
$1.75b
$2.35b
Past market
segment
exposure
Delivery market New market
segment
exposure
Coffee and
Specialty
beverages
Total market
segment
exposure
Total market segment exposure for McDonald’s
McCafé is a strategic pillar for
growth
Enables McDonald’s to compete
in the coffee and specialty
beverages arena, broaden it’s
opportunity beyond the QSR
industry and grow baseline sales
McDonald’s already has a base
180+ million customers to target

McCafé – Premium hand crafted coffee
adding new occasions
Grow average unit volume Hand made barista coffee makes the brand more premium,
aspirational and personalized
Added occasion for customers to visit McDonald’s,
improves experience
Presence in high footfall retail locations, makes coffee and
specialty beverages more accessible

McCafé – People, the key differentiator
4 of the 6 top Baristas in India in
2016 are from McCafé
100% baristas are internally
recruited and trained

McCafé – Sound unit economics, rapid
expansion and growing AUV
By developing a low capex
model of Rs 2.0 – 2.5 mn /
McCafé, McDonald’s is
already the #2 player in
Mumbai in terms of units
Aim is penetrate other key
markets intelligently and
become a leading player in
the industry by doubling
restaurant count over the next
12-18 months 6
75
1x
1.4x
10,500
11,000
11,500
12,000
12,500
13,000
13,500
14,000
14,500
15,000
0
10
20
30
40
50
60
70
80
Q1 FY15 Q2 FY15 Q3 FY15 Q4 FY15 Q1 FY16 Q2 FY16 Q3 FY16 Q4 FY16E
No of McCafes Average sales/ McCafé
* Graphs not to scale, for representational purpose only
40% growth in average sales/ day since launch

McCafé – Growth through new platforms
Smoothies – April 2015
Double frappés – Aug 2015
Iced Splashers – April 2016

Customer scorecard for McCafé -Like the fresh look of McCafé restaurants, great place to hang out with friends or family
-McCafé offers good variety, coffee is better than Costa Coffee and Starbucks -Service is warm and friendly
-Have been visiting specifically because of the coffee and will continue to do so in the future

Potential for McCafé
5 - 8
8 -12
Current Potential
Average annual sales/ McCafé hub
(Rs in millions)
Will be driven by new platform launches, McCafé
specific promotion and people
75
200 - 250
300 - 350
Mar-16 Current
potential*
Future potential*
Number of McCafés
High potential, McDonald’s can become one of the
largest coffee players in the country as unit
economics is in place
* Assuming 100% penetration of McCafé * Graphs not to scale, for representational purpose only

Potential for McCafé
5 - 8
8 -12
Current Potential
Average annual sales/ McCafé hub
(Rs in millions)
Will be driven by new platform launches, McCafé
specific promotion and people
75
200 - 250
300 - 350
Mar-16 Current
potential*
Future potential*
Number of McCafés
High potential, McDonald’s can become one of the
largest coffee players in the country as unit
economics is in place
* Assuming 100% penetration of McCafé
Potential sales with addition of McCafe in all existing restaurants : Rs1.5 – 1.75 billion
Future sales potential as restaurant base doubles : Rs 3.25 – 3.5 billion
Growth in Restaurant Operating Margin on addition of a McCafe to a restaurant: 200 – 250 bps
* Graphs not to scale, for representational purpose only

Launched strong product platforms
Chicken
McNuggets
2010
McFlurry
2011
McEgg
2012 Spice Fest
2012
McSpicy
2011
McAloo Tikki
2004 Breakfast
2009 Masala Grill
2013
Veg Pops
2013 Royale
2014
CWT
2014
CPP
2015 Indi McSpicy
2015

Robust supply chain drives product
innovation
Strong cold chain and
distribution
infrastructure
Extensive glocal
supplier network with
local production
Direct linkage to the
farms

Menu has driven SSSG and GM expansion in
FY16
55.6% 56.0%
57.6%
58.4%
59.1%
59.6% 60.4%
FY12 FY13 FY14 FY15 Q1 FY16 Q2 FY16 Q3 FY16
Gross Margin %
-5.60% -4.90%
1.70%
3.10%
FY15 Q1 FY16 Q2 FY16 Q3FY16
SSSG%
Q2 FY16 Q3 FY16 Q4 FY16

Multiple QSR segments captured through
menu
Burgers
Over 10 products with
many burgers that record
annual sales of Rs 1+ billion
Wraps
5 wraps
Sides
Strong sides offering
Desserts
$130 million dollar category
Breakfast
Only organized WFF player
in this space
$2+ billion dollar market
Beverages
WFF player with the widest
variety in this space
$4+ billion dollar market
Source : HRPL proprietary third party market segmentation study + Euromonitor
International
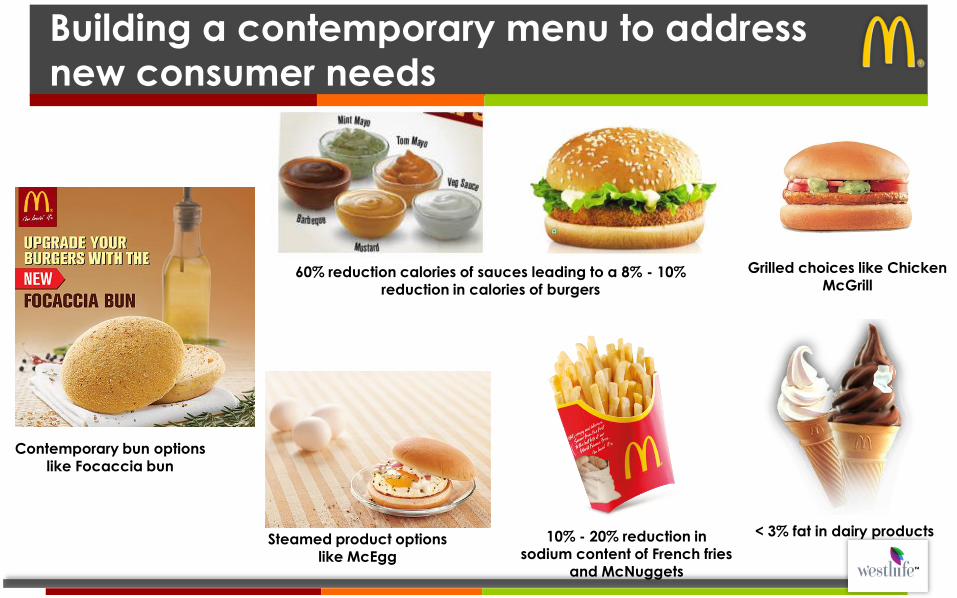
Building a contemporary menu to address
new consumer needs
60% reduction calories of sauces leading to a 8% - 10% reduction in calories of burgers
< 3% fat in dairy products 10% - 20% reduction in sodium content of French fries
and McNuggets
Steamed product options like McEgg
Contemporary bun options like Focaccia bun
Grilled choices like Chicken
McGrill

Menu & Brand – A winning combination
Focus on brand and strengthening customer connect vs. industry approach of focusing on low prices and discounts
Started the journey with the award winning #KuchPalOffline campaign in April 2015

Westlife Development Ltd Vision : 2022
GROW BASELINE SALES
Grow average unit volume Grow restaurant base
BROADENING ACCESSIBILITY
OF BRAND MCDONALD’S
Market
share and
margin
growth Targ
ets
B
uild
ing
blo
ck
s
Profitable and sustainable
unit economics and
market planning
Brand extensions, menu
introductions and brand
differentiation

Resetting unit economics to support growth
Restaurant Operating Platform 2.0
Presented by:
Amit Jatia, Vice Chairman

FY 97 FY 98 FY 99 FY 00 FY 01 FY 02 FY 03 FY 04 FY 05 FY 06 FY 07 FY 08 FY 09 FY 10 FY 11 FY 12 FY 13 FY 14 FY 15
Restaurant Operating Margin%
Sta
rte
d w
ork
o
n R
OP
2.0
Brought down capex by 60% with ROP 1.0. As
development costs remained stable and sales
volumes increased, ROM grew YoY for the
next 8 years
Why did we need ROP 1.0?
Increase in dvlp cost
and opex due to –
1) High inflation
2) Labour and utility
rate increases
3) Dollar inflation
Drop in sales volume
RO
P 1
.0
* Graphs not to scale, for representational purpose only
Restaurant Operating Margin represents the total revenues of company operated restaurants less the operating costs of these restaurants (including royalty etc.) before depreciation and corporate overheads; expressed as a percent of total revenue

ROP 1.0 – Foundation set for restaurant growth in 2003
• Local supply chain for equipment • Right Sizing Restaurants
• Optimizing Kitchen Capacity
• Over 95% of produce locally sourced
• Tax Rationalization • Increased supplier capacity through
3rd party business
20
02
-03
R
OP
1.0
19
96
20
02
-03
R
OP
1.0
-X%
2240 basis points improvement 1x
0.4x
Average Development Cost Restaurant Operating Margins
(ROM)
19
96
* Graphs not to scale, for representational purpose only
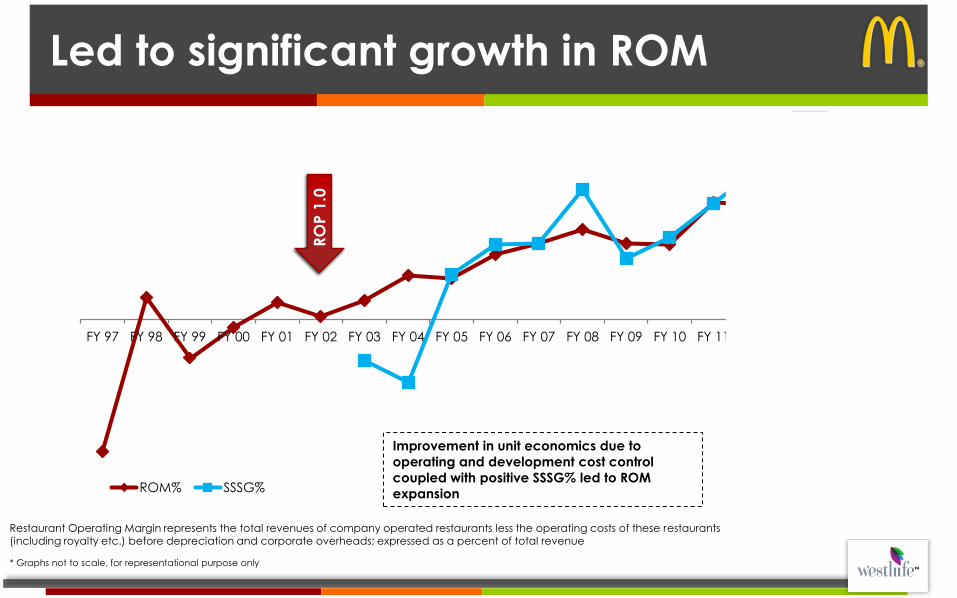
FY 97 FY 98 FY 99 FY 00 FY 01 FY 02 FY 03 FY 04 FY 05 FY 06 FY 07 FY 08 FY 09 FY 10 FY 11 FY 12 FY 13 FY 14 FY 15
ROM% SSSG%
Sta
rte
d w
ork
o
n R
OP
2.0
Improvement in unit economics due to
operating and development cost control
coupled with positive SSSG% led to ROM
expansion
Led to significant growth in ROM
RO
P 1
.0
* Graphs not to scale, for representational purpose only
Restaurant Operating Margin represents the total revenues of company operated restaurants less the operating costs of these restaurants (including royalty etc.) before depreciation and corporate overheads; expressed as a percent of total revenue

High inflation and slowing SSSG hurt ROP in 2013-14
High double digit food inflation
20%+ increase in utility rates and minimum wages
Slowdown in GDP from 8.9% in 2011 to 4.9% in 2014
High inflation, rising development cost, lower consumer confidence hurts cost structure and
SSSG%

FY 97 FY 98 FY 99 FY 00 FY 01 FY 02 FY 03 FY 04 FY 05 FY 06 FY 07 FY 08 FY 09 FY 10 FY 11 FY 12 FY 13 FY 14 FY 15
ROM% SSSG%
Sta
rte
d w
ork
o
n R
OP
2.0
Rising costs + weak
SSSG% + New
restaurant growth
drag margins down
RO
P 1
.0
* Graphs not to scale, for representational purpose only
Leading to contraction of restaurant operating
margin

Restaurant design
Equipment options
Operating costs
Reset foundation for restaurant growth
Conceptualization of ROP 2.0 in 2013 and launch in 2016
ROP 2.0 Disciplines
Key to success
•Optimisation to reduce capex and opex
•Localisation to reduce capex
•Design changes & innovation to reduce opex

Restaurant design changes
Seating and design Lower cost through
localization Upgraded look
New external façade and signage
Pre fabrication of parts of building structure

Equipment Localization
Localization of kitchen
equipment helped reduce
capital expenditure
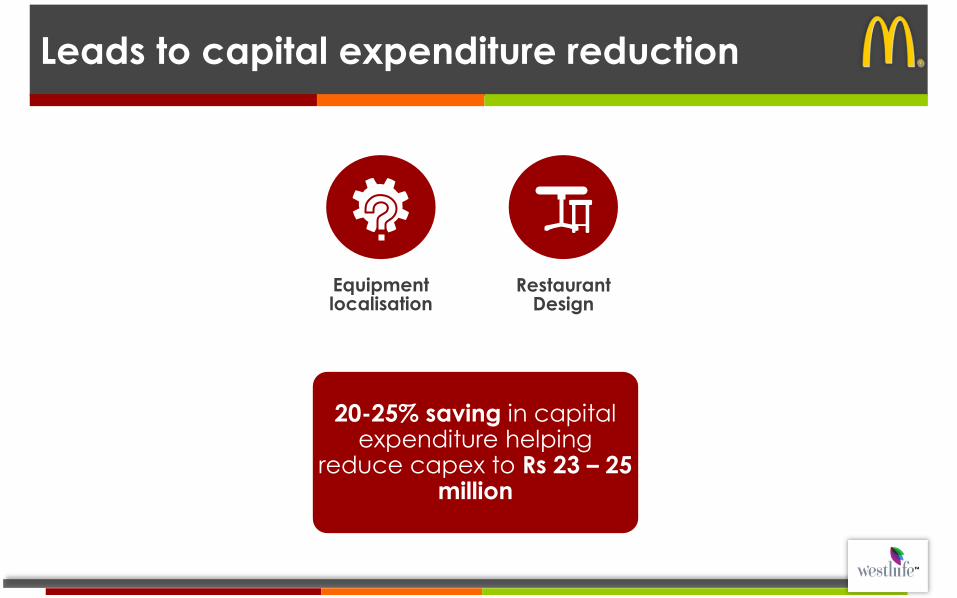
Leads to capital expenditure reduction
Restaurant Design
Equipment localisation
20-25% saving in capital expenditure helping
reduce capex to Rs 23 – 25 million

Energy saving
initiatives like LED
lighting
LED lighting
Initiatives to reduce operating costs
Early adopters of green
initiatives like solar
powered heaters and
waterless urinals
Worked with
productivity growth
team to drive labour
productivity
improvements
Utility re-design and green initiatives Labour productivity
Worked on heat map to
redesign HVAC for lower unit
consumption

Leading to savings in operating costs
20-25% reduction in operating costs
Utility re-design leading to
optimisation
OPERATING COSTS
Energy efficient equipment and
labour productivity

Average Development Cost*
Encouraging early results delivered by ROP 2.0
20
12
-14
Restaurant Operating Margins*
20
16
RO
P 2
.0
300 – 350 bps improvement for
new restaurants
2012-1
4
20
16
R
OP
2.0
1x
0.8x
Cash breakeven*
20
12
-14
20
16
R
OP
2.0
24
months
12-18
months
* Can vary basis restaurant type, region and presence of brand extensions
** Graphs not to scale, for representational purpose only
Cash on cash ROI* to 20%+ in 24 – 30 months

FY 02 FY 03 FY 04 FY 05 FY 06 FY 07 FY 08 FY 09 FY 10 FY 11 FY 12 FY 13 FY 14 FY 15 Q1
FY16
Q2
FY16
Q3
FY16
ROM% SSSG%
Sta
rte
d w
ork
o
n R
OP
2.0
Improvement in
ROM driven by
improving SSSG and
unit economics
RO
P 1
.0
* Graphs not to scale, for representational purpose only
Improving unit economics and SSSG%
leads to expansion in ROM

… leads to attractive breakeven sales for new restaurants
• Breakeven sales at
1x 2003
ROP 1.0
• Breakeven sales at
~ 1.6x
2012/14
• Breakeven sales at
~ 1.1x 2016
ROP 2.0

Growth foundation in place
• Significant capital expenditure savings - approximately Rs 1.2 – 1. 5 billion as we double the base of restaurants
• Reduction in new restaurant cash breakeven from 18 – 24 months to 12 – 18
months
• Restaurant operating margins of newly opened restaurants higher by 300 – 350
bps reducing margin drag from new restaurant openings
• Potential opportunity in retrofitting existing restaurants with the new platform

Westlife Development Ltd Vision : 2022
Grow restaurant base
with solid unit economics
BROADENING ACCESSIBILITY
OF BRAND MCDONALD’S
450 – 500 restaurants Presence in 40+ cities
Investment of Rs 5+
billion
GROW BASELINE SALES
Grow average unit volume
Mid to high single digit SSSG% McCafé : 75 to 300-350
McDelivery: 124 to 300-325
Leverage other models and menu in the future
Market
share and
margin
growth
Sales growth of 2.4x - 3x
Take EBITDA margin to low to mid teens

Thank You!