Embed Size (px)
Citation preview
Westlife Development | 2017 | Confidential | November 6, 2017 | 1 www.westlife.co.in
Westlife Development Ltd.
Hardcastle Restaurants Pvt. Ltd.
Q2 FY2018 Earnings Update
Nov 6, 2017
Westlife Development | 2017 | Confidential | November 6, 2017 | 2 www.westlife.co.in
Disclaimer
This presentation contains forward-looking statements that represent our beliefs, projections and
predictions about future events or our future performance. Forward-looking statements can be
identified by terminology such as “may,” “will,” “would,” “could,” “should,” “expect,” “intend,” “plan,”
“anticipate,” “believe,” “estimate,” “predict,” “potential,” “continue” or the negative of these terms or
other similar expressions or phrases. These forward-looking statements are necessarily subjective and
involve known and unknown risks, uncertainties and other important factors that could cause our actual
results, performance or achievements or industry results to differ materially from any future results,
performance or achievement described in or implied by such statements. The forward-looking
statements contained herein include statements about the business prospects of Westlife Development
Ltd (‘Westlife Development’), its ability to attract customers, its affordable platform, its expectation for
revenue generation and its outlook. These statements are subject to the general risks inherent in Westlife
Development’s business. These expectations may or may not be realized. Some of these expectations
may be based upon assumptions or judgments that prove to be incorrect. In addition, Westlife
Development’s business and operations involve numerous risks and uncertainties, many of which are
beyond the control of Westlife Development, which could result in Westlife Development’s expectations
not being realized or otherwise materially affect the financial condition, results of operations and cash
flows of Westlife Development. Additional information relating to the uncertainties affecting Westlife
Development’s business is contained in its filings with various regulators and the Bombay Stock
Exchange (BSE). The forward-looking statements are made only as of the date hereof, and Westlife
Development does not undertake any obligation to (and expressly disclaims any obligation to update any
forward-looking statements to reflect events or circumstances after the date such statements were made,
or to reflect the occurrence of unanticipated events.
Westlife Development | 2017 | Confidential | November 6, 2017 | 3 www.westlife.co.in
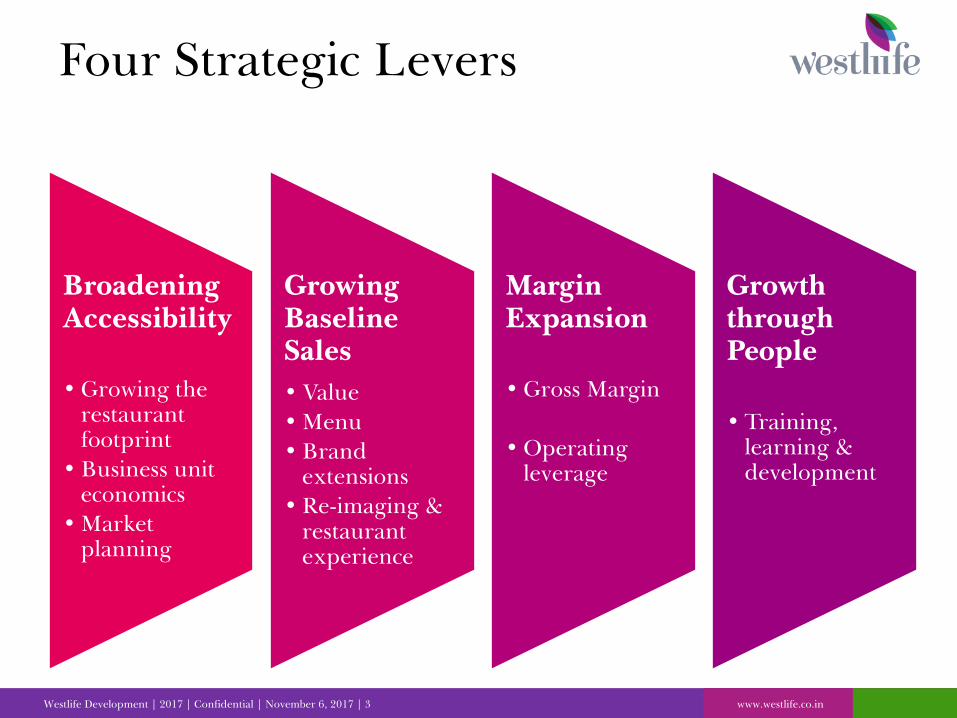
Broadening
Accessibility
• Growing the
restaurant
footprint
• Business unit
economics
• Market
planning
Growing
Baseline
Sales
• Value
• Menu
• Brand
extensions
• Re-imaging &
restaurant
experience
Margin
Expansion
• Gross Margin
• Operating
leverage
Growth
through
People
• Training,
learning &
development
Four Strategic Levers
Westlife Development | 2017 | Confidential | November 6, 2017 | 4 www.westlife.co.in
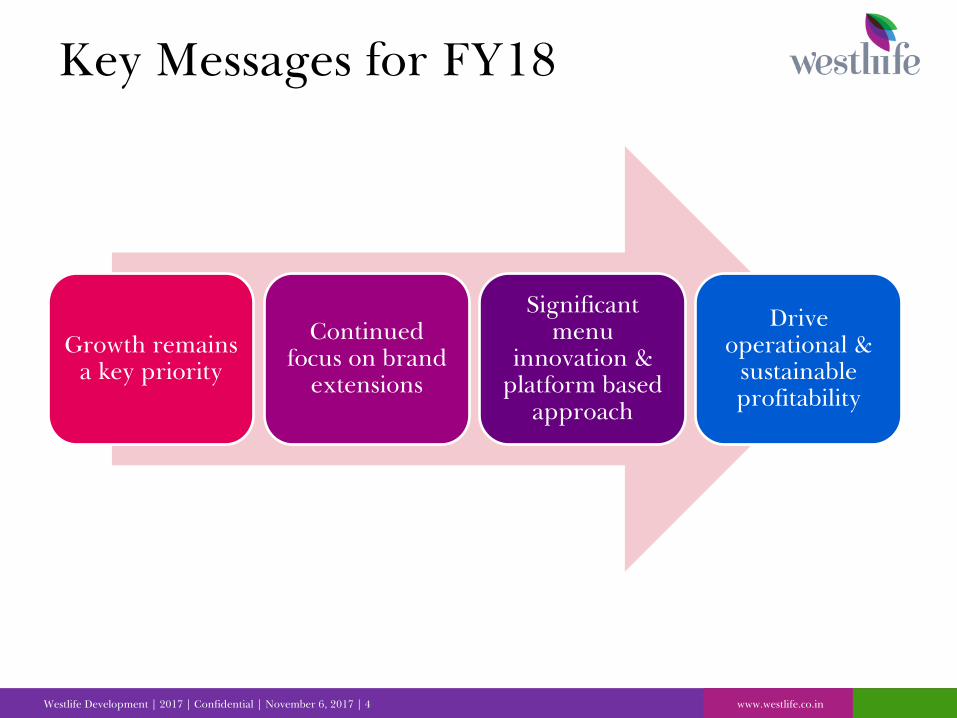
Key Messages for FY18
Growth remains
a key priority
Continued
focus on brand
extensions
Significant
menu
innovation &
platform based
approach
Drive
operational &
sustainable
profitability
Westlife Development | 2017 | Confidential | November 6, 2017 | 5 www.westlife.co.in
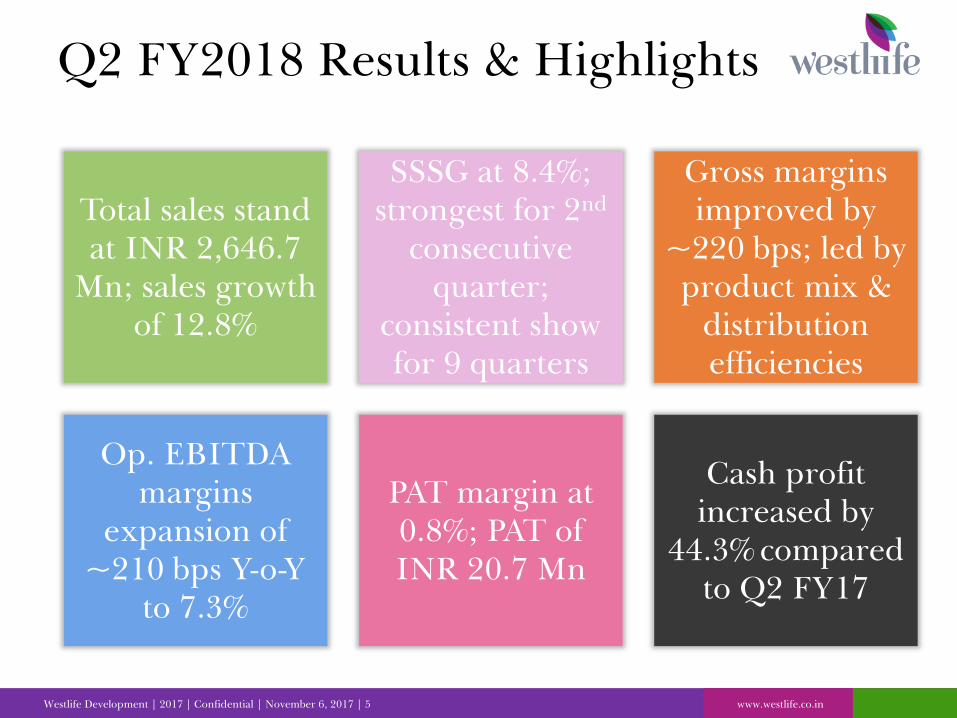
Q2 FY2018 Results & Highlights
Total sales stand
at INR 2,646.7
Mn; sales growth
of 12.8%
SSSG at 8.4%;
strongest for 2nd
consecutive
quarter;
consistent show
for 9 quarters
Op. EBITDA
margins
expansion of
~210 bps Y-o-Y
to 7.3%
PAT margin at
0.8%; PAT of
INR 20.7 Mn
Gross margins
improved by
~220 bps; led by
product mix &
distribution
efficiencies
Cash profit
increased by
44.3% compared
to Q2 FY17

Westlife Development | 2017 | Confidential | November 6, 2017 | 6 www.westlife.co.in
SALES GROWTH & DRIVERS
Westlife Development | 2017 | Confidential | November 6, 2017 | 7 www.westlife.co.in
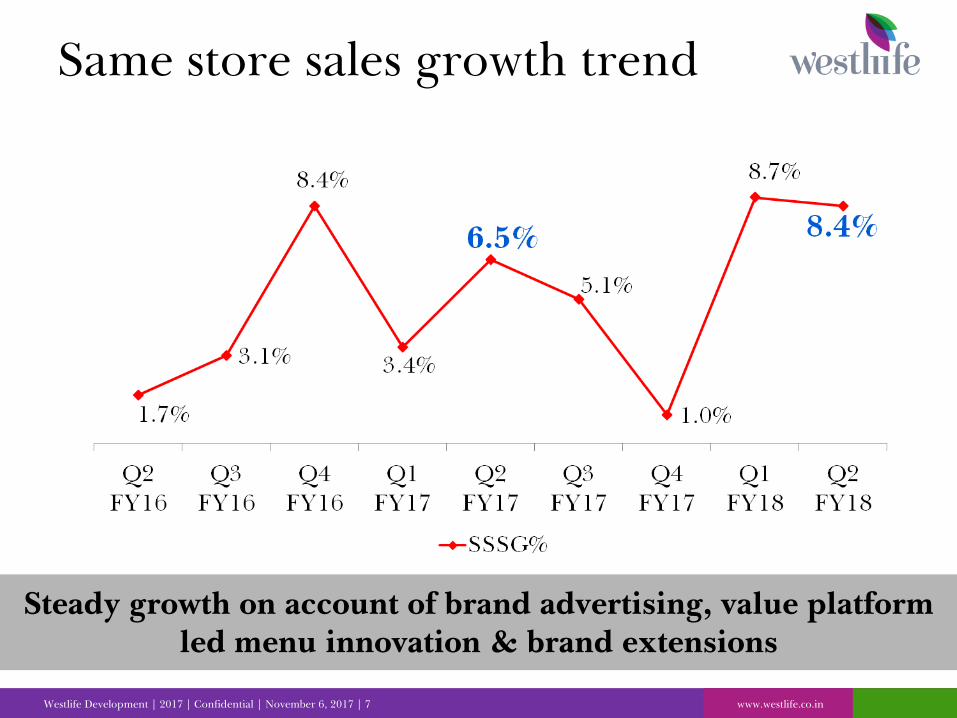
Same store sales growth trend
Steady growth on account of brand advertising, value platform
led menu innovation & brand extensions
Westlife Development | 2017 | Confidential | November 6, 2017 | 8 www.westlife.co.in
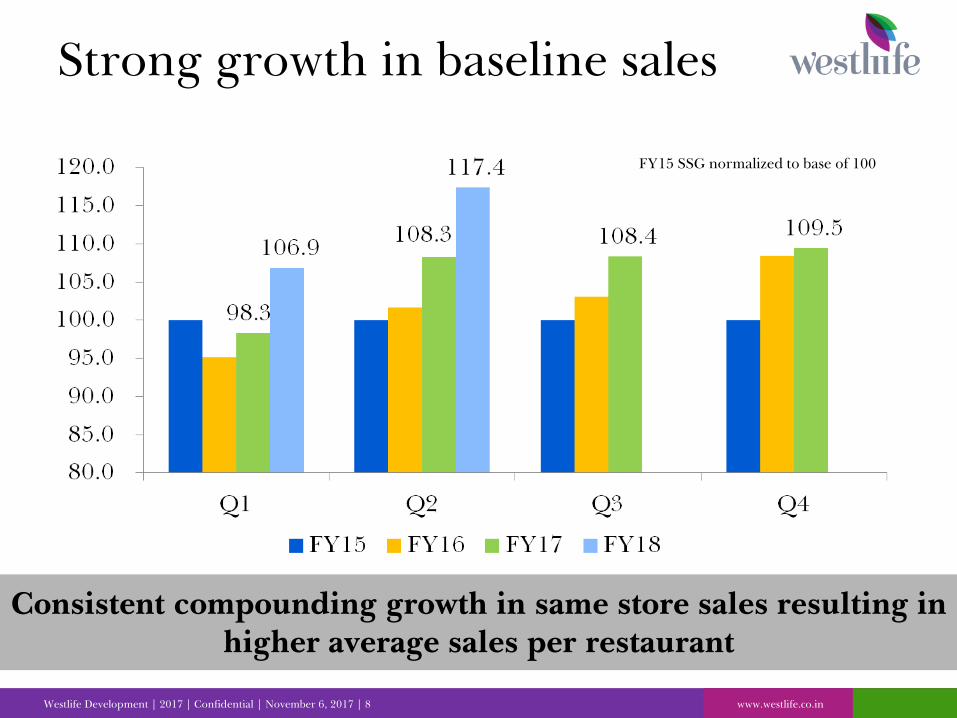
Strong growth in baseline sales
Consistent compounding growth in same store sales resulting in
higher average sales per restaurant
FY15 SSG normalized to base of 100
Westlife Development | 2017 | Confidential | November 6, 2017 | 9 www.westlife.co.in
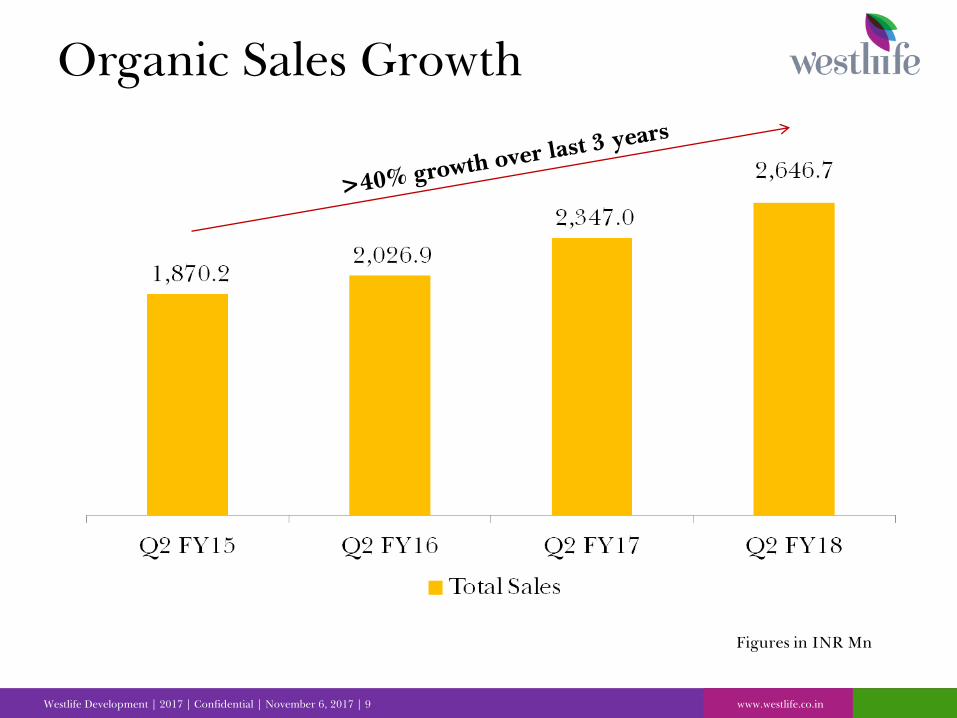
Organic Sales Growth
Figures in INR Mn
Westlife Development | 2017 | Confidential | November 6, 2017 | 10 www.westlife.co.in
33
54
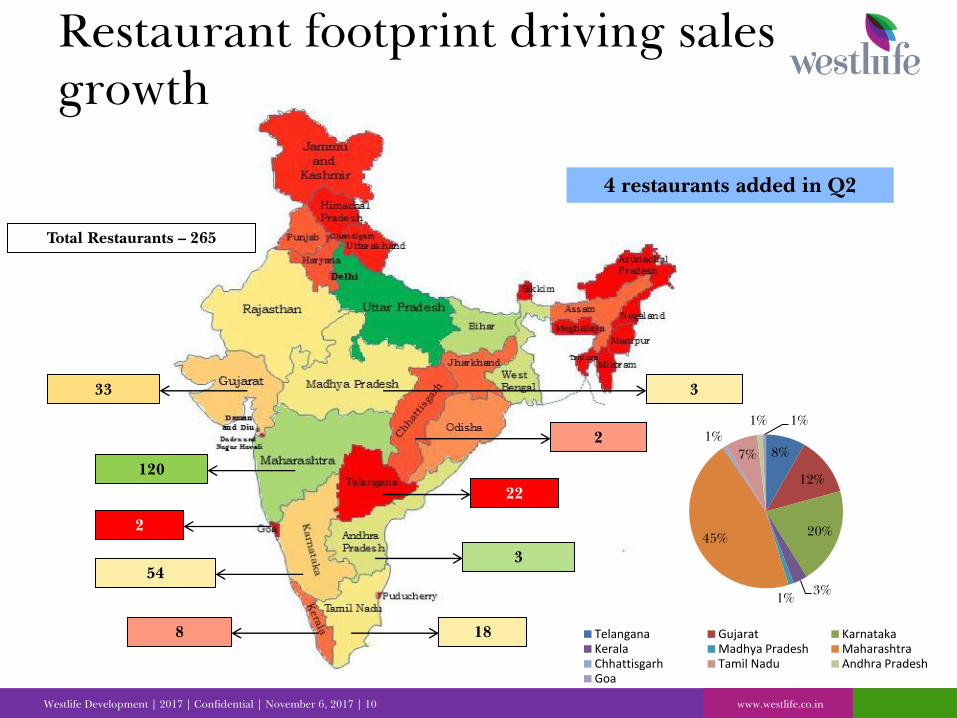
Total Restaurants – 265
120
22
8 18
3
2
2
3
8%
12%
20%
3% 1%
45%
1%
7%
1% 1%
Telangana Gujarat Karnataka Kerala Madhya Pradesh Maharashtra Chhattisgarh Tamil Nadu Andhra Pradesh Goa
Restaurant footprint driving sales
growth
4 restaurants added in Q2
Westlife Development | 2017 | Confidential | November 6, 2017 | 11 www.westlife.co.in
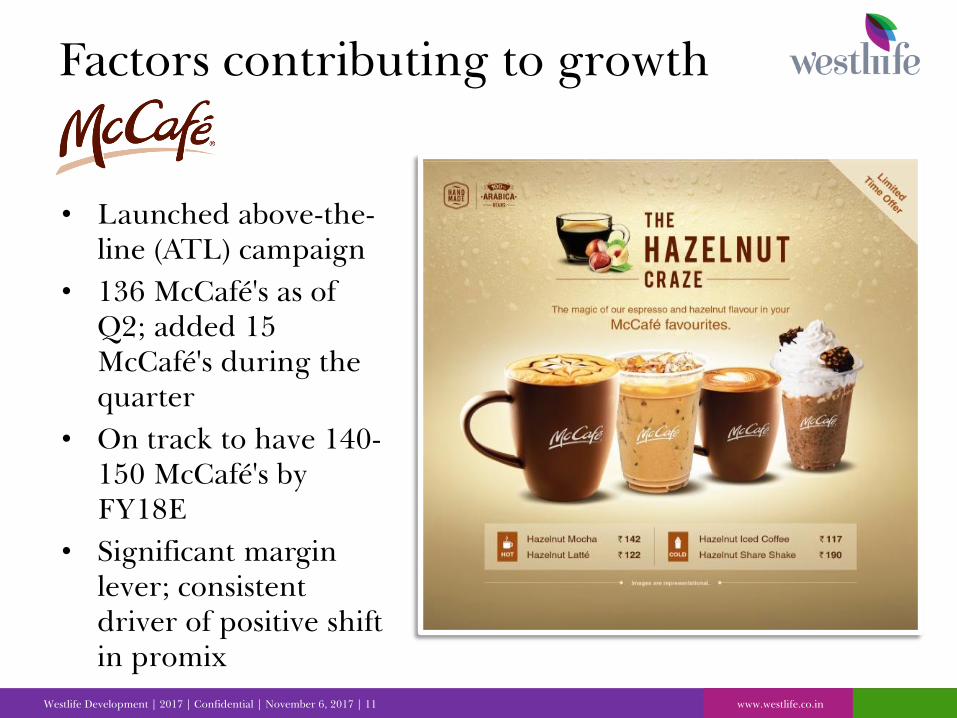
Factors contributing to growth
• Launched above-the-
line (ATL) campaign
• 136 McCafé's as of
Q2; added 15
McCafé's during the
quarter
• On track to have 140-
150 McCafé's by
FY18E
• Significant margin
lever; consistent
driver of positive shift
in promix
Westlife Development | 2017 | Confidential | November 6, 2017 | 12 www.westlife.co.in
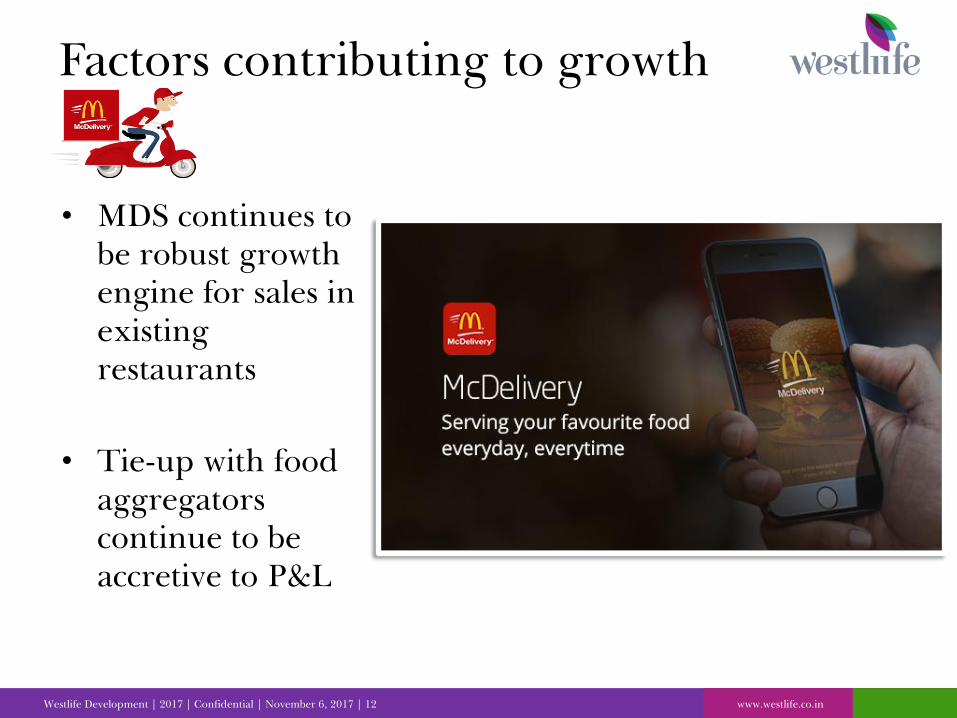
Factors contributing to growth
• MDS continues to
be robust growth
engine for sales in
existing
restaurants
• Tie-up with food
aggregators
continue to be
accretive to P&L

Westlife Development | 2017 | Confidential | November 6, 2017 | 13 www.westlife.co.in
Factors contributing to growth
• Momentum
around ‘everyday
value’ platform
continued & drove
significant footfalls
• Consumer led
menu innovation
& strategy yielding
strong results
Menu
Westlife Development | 2017 | Confidential | November 6, 2017 | 14 www.westlife.co.in
FINANCIAL PERFORMANCE
DISCUSSION
Westlife Development | 2017 | Confidential | November 6, 2017 | 15 www.westlife.co.in
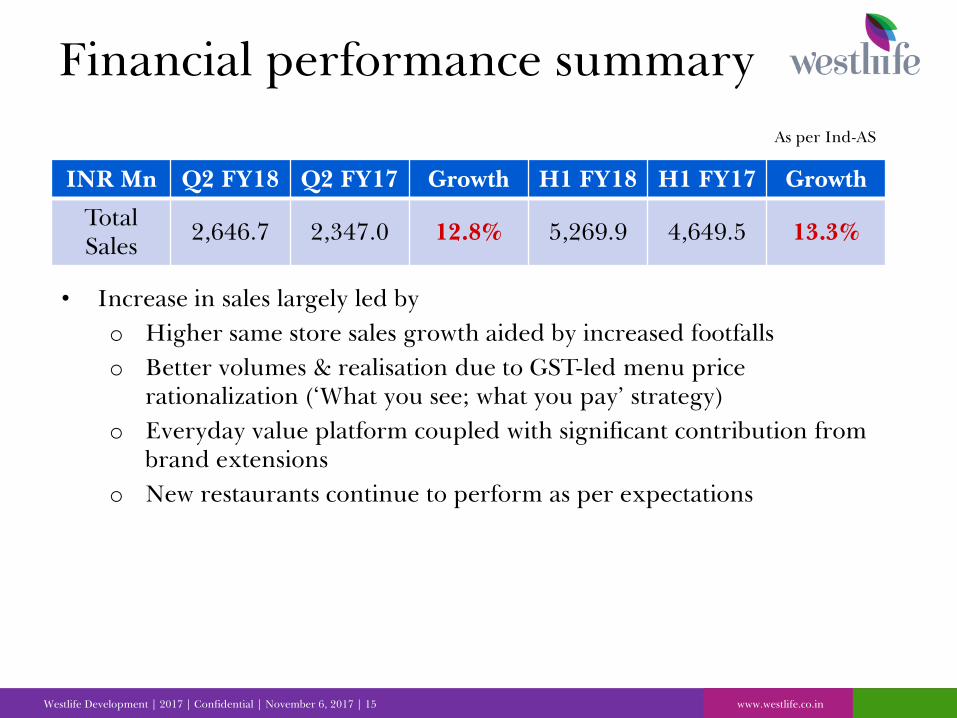
Financial performance summary
INR Mn Q2 FY18 Q2 FY17 Growth H1 FY18 H1 FY17 Growth
Total
Sales 2,646.7 2,347.0 12.8% 5,269.9 4,649.5 13.3%
• Increase in sales largely led by
o Higher same store sales growth aided by increased footfalls
o Better volumes & realisation due to GST-led menu price
rationalization (‘What you see; what you pay’ strategy)
o Everyday value platform coupled with significant contribution from
brand extensions
o New restaurants continue to perform as per expectations
As per Ind-AS
Westlife Development | 2017 | Confidential | November 6, 2017 | 16 www.westlife.co.in
Financial performance summary
INR Mn Q2 FY18 Q2 FY17 H1 FY18 H1 FY17
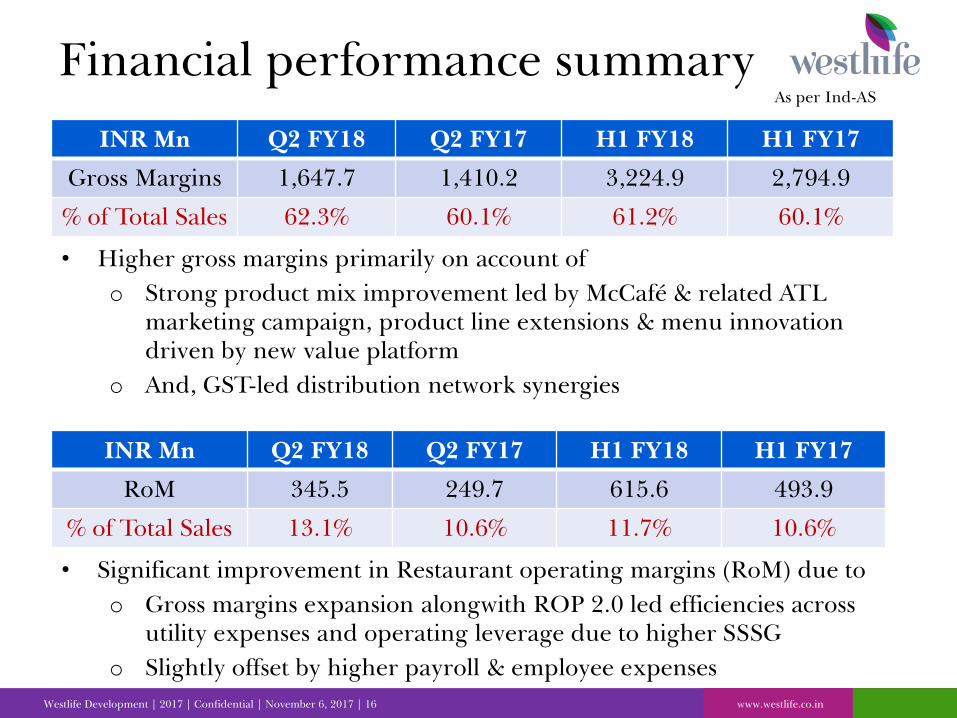
Gross Margins 1,647.7 1,410.2 3,224.9 2,794.9
% of Total Sales 62.3% 60.1% 61.2% 60.1%
• Higher gross margins primarily on account of
o Strong product mix improvement led by McCafé & related ATL
marketing campaign, product line extensions & menu innovation
driven by new value platform
o And, GST-led distribution network synergies
As per Ind-AS
• Significant improvement in Restaurant operating margins (RoM) due to
o Gross margins expansion alongwith ROP 2.0 led efficiencies across
utility expenses and operating leverage due to higher SSSG
o Slightly offset by higher payroll & employee expenses
INR Mn Q2 FY18 Q2 FY17 H1 FY18 H1 FY17
RoM 345.5 249.7 615.6 493.9
% of Total Sales 13.1% 10.6% 11.7% 10.6%
Westlife Development | 2017 | Confidential | November 6, 2017 | 17 www.westlife.co.in
Financial performance summary
INR Mn Q2 FY18 Q2 FY17 H1 FY18 H1 FY17
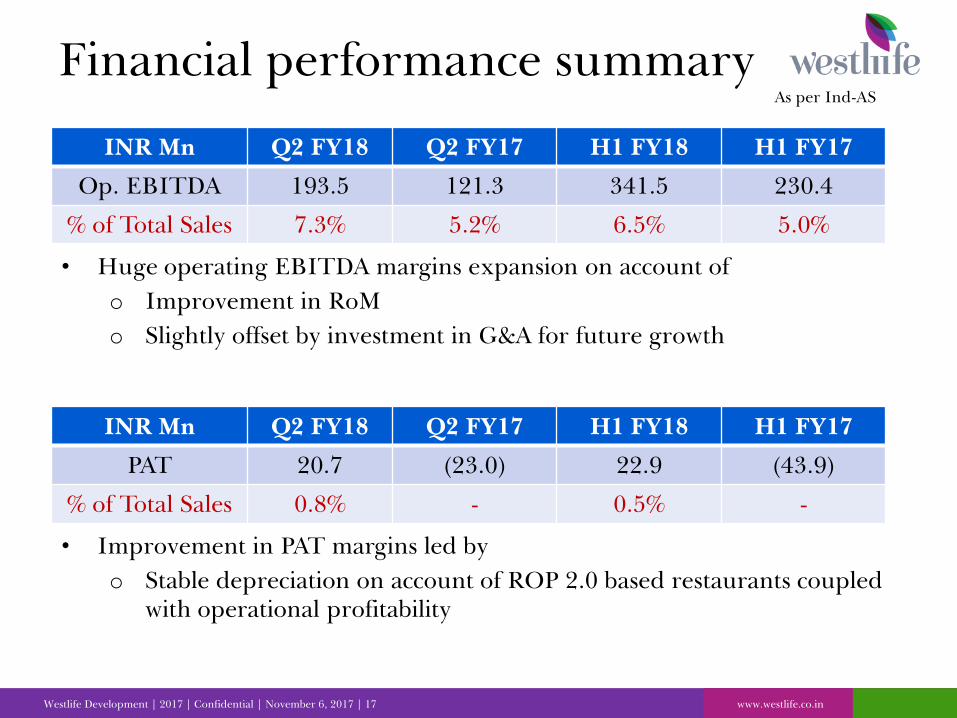
Op. EBITDA 193.5 121.3 341.5 230.4
% of Total Sales 7.3% 5.2% 6.5% 5.0%
• Huge operating EBITDA margins expansion on account of
o Improvement in RoM
o Slightly offset by investment in G&A for future growth
As per Ind-AS
INR Mn Q2 FY18 Q2 FY17 H1 FY18 H1 FY17
PAT 20.7 (23.0) 22.9 (43.9)
% of Total Sales 0.8% - 0.5% -
• Improvement in PAT margins led by
o Stable depreciation on account of ROP 2.0 based restaurants coupled
with operational profitability
Westlife Development | 2017 | Confidential | November 6, 2017 | 18 www.westlife.co.in
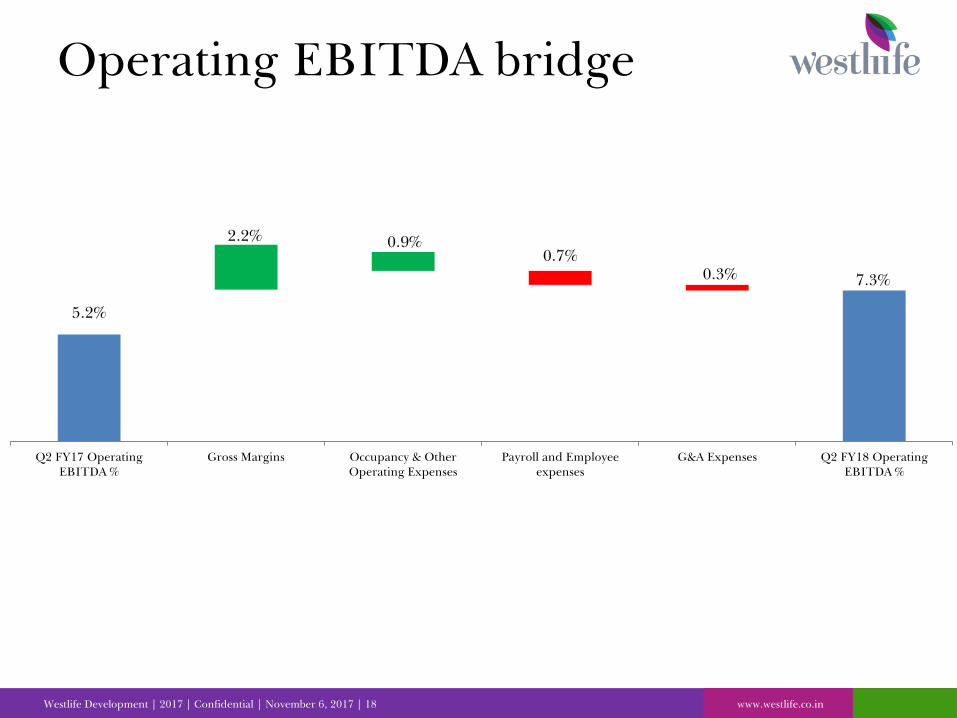
Operating EBITDA bridge
5.2%
2.2% 0.9%
0.7%
0.3% 7.3%
Q2 FY17 Operating
EBITDA %
Gross Margins Occupancy & Other
Operating Expenses
Payroll and Employee
expenses
G&A Expenses Q2 FY18 Operating
EBITDA %
Westlife Development | 2017 | Confidential | November 6, 2017 | 19 www.westlife.co.in
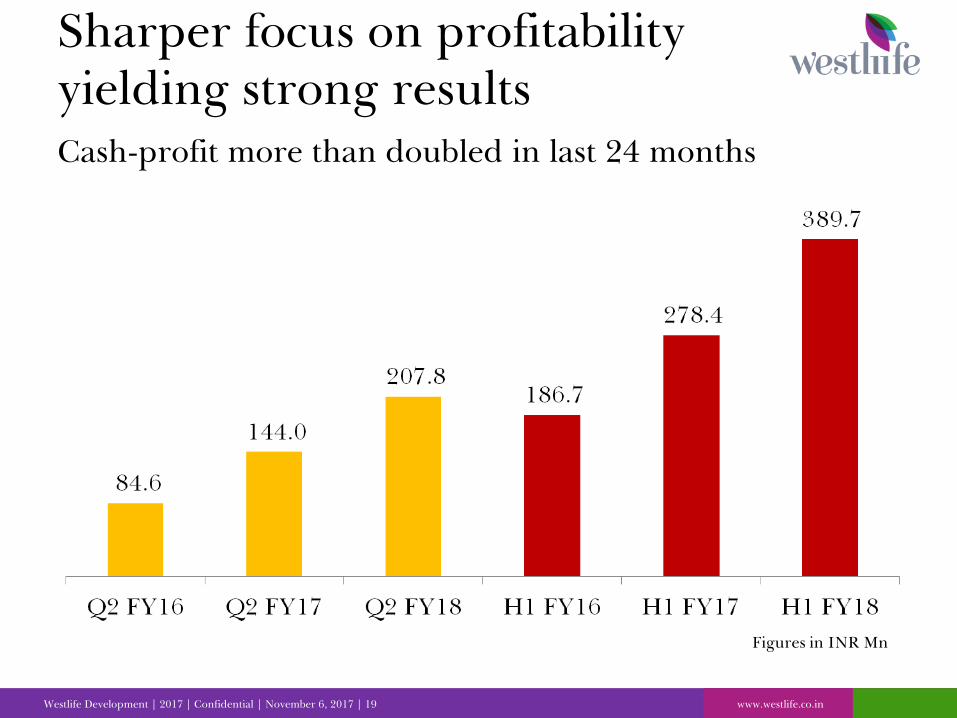
Sharper focus on profitability
yielding strong results
Cash-profit more than doubled in last 24 months
Figures in INR Mn
Westlife Development | 2017 | Confidential | November 6, 2017 | 20 www.westlife.co.in
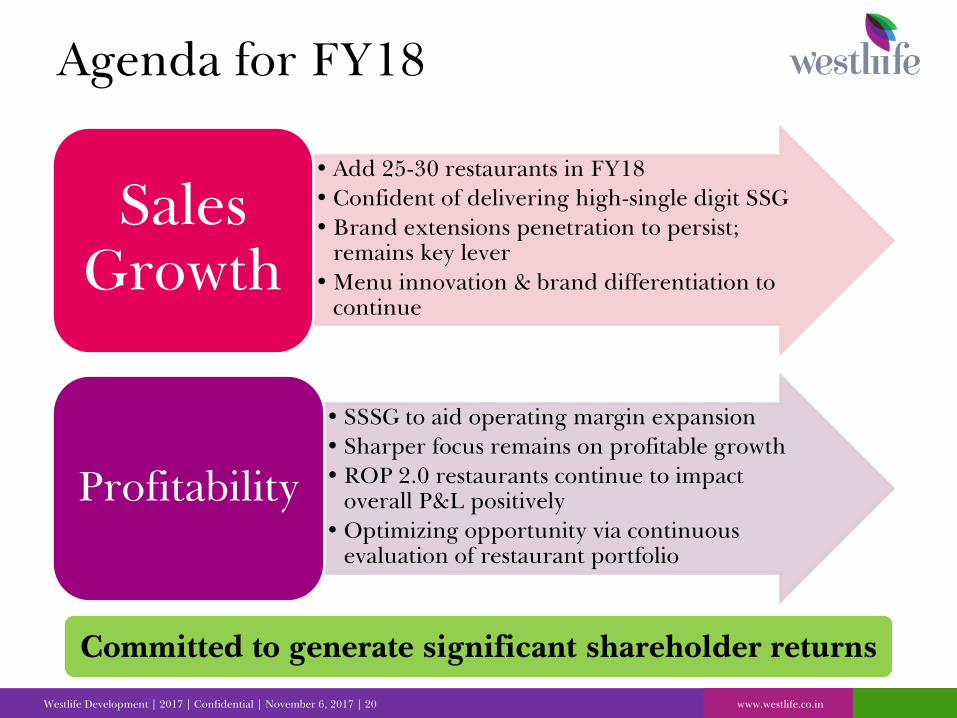
Agenda for FY18
• Add 25-30 restaurants in FY18
• Confident of delivering high-single digit SSG
• Brand extensions penetration to persist;
remains key lever
• Menu innovation & brand differentiation to
continue
Sales
Growth
• SSSG to aid operating margin expansion
• Sharper focus remains on profitable growth
• ROP 2.0 restaurants continue to impact
overall P&L positively
• Optimizing opportunity via continuous
evaluation of restaurant portfolio
Profitability
Committed to generate significant shareholder returns

Westlife Development | 2017 | Confidential | November 6, 2017 | 21 www.westlife.co.in
For additional information:
Ankit Arora
Investor Relations
(+91.22) 4913.5306
www.westlife.co.in
IR Contact