Embed Size (px)
Citation preview
Algebra 1 (Honors, Level 1 and Level 2 Page 1 of 35
Wethersfield Public Schools Course Outline
Course Name: Algebra 1 (Honors, Level 1 and Level 2) Department: Math Grade(s): 8 Honors and 9 Level 1 and Level 2 Level(s): Honors, Level 1, and Level 2 Course Number(s): 30101 Level 1, 30302 Level 2 Credits: 1.0 Course Description: Algebra 1 Honors – Grade 8 Students ready for this course have demonstrated a mastery of the prerequisite math concepts and have the ability to grasp, comprehend and perform abstract mathematical tasks. They possess superior skills and outstanding problem solving ability. This course includes the following concepts arithmetic with polynomials and rational expressions, creating equations that describe numbers or relationships, reasoning with equations, building, interpreting, and manipulating functions, linear, quadratic, and exponential models, and interpreting categorical and quantitative data. 30101 Algebra I-Level 1 This course prepares students for Geometry, Level 1 in 10th grade. Entering students are expect to have mastered: operations with signed numbers as integers and as rational numbers; properties of number systems; number sense; solving single and multi-step problems; ratios, proportions and percent problems; understanding of the concept of variables; combining like terms, and estimating and judging reasonableness of answers to problems. Topics include: arithmetic with polynomials and rational expressions, creating equations that describe numbers or relationships, reasoning with equations, building, interpreting, and manipulating functions, linear, quadratic, and exponential models, and interpreting categorical and quantitative data. 30302 Algebra I-Level 2 The content and skills in this course are the same as in Level 1, Algebra I, except that the following skills and concepts are not included: exponential growth and decay, rational expressions and equations, reflexive and symmetric properties, inverse variations and linear inequalities. Topics include: arithmetic with polynomials and rational expressions, creating equations that describe numbers or relationships, reasoning with equations, building, interpreting, and manipulating functions, linear, quadratic, and exponential models, and interpreting categorical and quantitative data. Required Instructional Materials:
• Algebra 1, Holt McDougal, 2012 & Online Interactive Textbook • Graphing Calculators
Revised/Approval Date: July 8, 2015, Approved by Administrative Team 1/13/16 Approved Student Programs & Services Committee 4/19/16 Approved Board of Education 4/26/16 Authors/Contributors: Katie Byrnes, Melissa Morello, Shannon Shouldice, Dan Jensen, Jeff Weber, Jeremy Sasur, Tara Tabellione
Algebra 1 (Honors, Level 1 and Level 2 Page 2 of 35
Overarching Skills This section includes 21st Century skills and discipline focused skills such as inquiry skills, problem solving skills, research skills, etc. These objectives should be taught and assessed through the integration of the other units. This unit is not meant to be taught in isolation as a separate unit. Students will engage in tasks for which the solution method is not known in advance and build new mathematical knowledge through problem solving. Students will reason and think analytically to make and investigate mathematical conjectures. Students will learn from and work collaboratively with others in a spirit of mutual respect and open dialogue. Students will be able to express their understanding orally, in writing, and with models. Students will deepen their understanding by connecting mathematical ideas to each other and to real world applications of those ideas. Students will learn to use representation to understand and communicate mathematical ideas. Students will use technology as a tool to research, organize, evaluate and communicate information. Enduring Understandings Essential Questions
• Algebra is a generalization of arithmetic. • The fundamental structure of algebra
provides a systematic method for identifying, describing, extending, analyzing and generalizing patterns.
• Algebra provides the underlying structure to make connection among all branches of mathematics, including measurement, geometry, calculus and statistics.
• Innovations in technology allow users to explore and deepen their understanding of a new and long-standing mathematical concepts and applications of algebra.
• How is thinking algebraically differently from thinking arithmetically?
• How are the principles of algebra used to solve problems?
• What makes a solution reasonable? • How is the understanding of mathematics
enhanced by the use of technology? • How does the use of technology enrich
mathematics? • What criterion determines the most
efficient method of solving a problem?
Mathematical Practices (Show link to standards in parenthesis after objective) The student will: Mathematical Practices #1 and #3 describe a classroom environment that encourages thinking mathematically and are critical for quality teaching and learning. 1. Make sense of problems and persevere in solving them. 2. Reason abstractly and quantitatively. 3. Construct viable arguments and critique the reasoning of others. 4. Model with mathematics. 5. Use appropriate tools strategically. 6. Attend to precision. 7. Look for and make use of structure. 8. Look for and express regularity in repeated reasoning. Instructional Support Materials
• TI-84 Plus graphing calculator • TI-SmartView software • Teaching tablet
Algebra 1 (Honors, Level 1 and Level 2 Page 3 of 35
Suggested Instructional Strategies • Modeling • Direct instruction • Guided practice • Interactive models • Differentiated tasks • Electronic demonstrations • Cooperative learning
Suggested Assessment Methods
• Pre-assessments • Quizzes • Chapter Tests • Common summative assessments (midterm and final) • School-wide rubrics
Algebra 1 (Honors, Level 1 and Level 2 Page 4 of 35
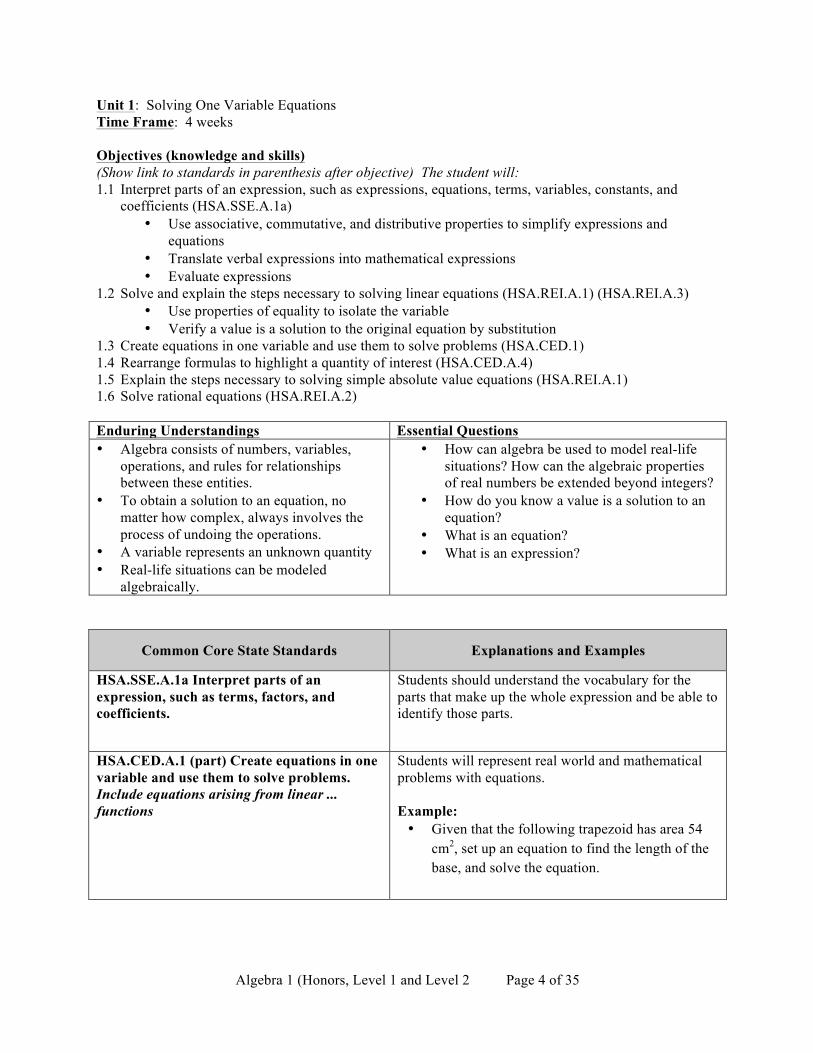
Unit 1: Solving One Variable Equations Time Frame: 4 weeks Objectives (knowledge and skills) (Show link to standards in parenthesis after objective) The student will: 1.1 Interpret parts of an expression, such as expressions, equations, terms, variables, constants, and
coefficients (HSA.SSE.A.1a) • Use associative, commutative, and distributive properties to simplify expressions and
equations • Translate verbal expressions into mathematical expressions • Evaluate expressions
1.2 Solve and explain the steps necessary to solving linear equations (HSA.REI.A.1) (HSA.REI.A.3) • Use properties of equality to isolate the variable • Verify a value is a solution to the original equation by substitution
1.3 Create equations in one variable and use them to solve problems (HSA.CED.1) 1.4 Rearrange formulas to highlight a quantity of interest (HSA.CED.A.4) 1.5 Explain the steps necessary to solving simple absolute value equations (HSA.REI.A.1) 1.6 Solve rational equations (HSA.REI.A.2) Enduring Understandings Essential Questions • Algebra consists of numbers, variables,
operations, and rules for relationships between these entities.
• To obtain a solution to an equation, no matter how complex, always involves the process of undoing the operations.
• A variable represents an unknown quantity • Real-life situations can be modeled
algebraically.
• How can algebra be used to model real-life situations? How can the algebraic properties of real numbers be extended beyond integers?
• How do you know a value is a solution to an equation?
• What is an equation? • What is an expression?
Common Core State Standards Explanations and Examples
HSA.SSE.A.1a Interpret parts of an expression, such as terms, factors, and coefficients.
Students should understand the vocabulary for the parts that make up the whole expression and be able to identify those parts.
HSA.CED.A.1 (part) Create equations in one variable and use them to solve problems. Include equations arising from linear ... functions
Students will represent real world and mathematical problems with equations. Example: • Given that the following trapezoid has area 54
cm2, set up an equation to find the length of the base, and solve the equation.
Algebra 1 (Honors, Level 1 and Level 2 Page 5 of 35
Common Core State Standards Explanations and Examples
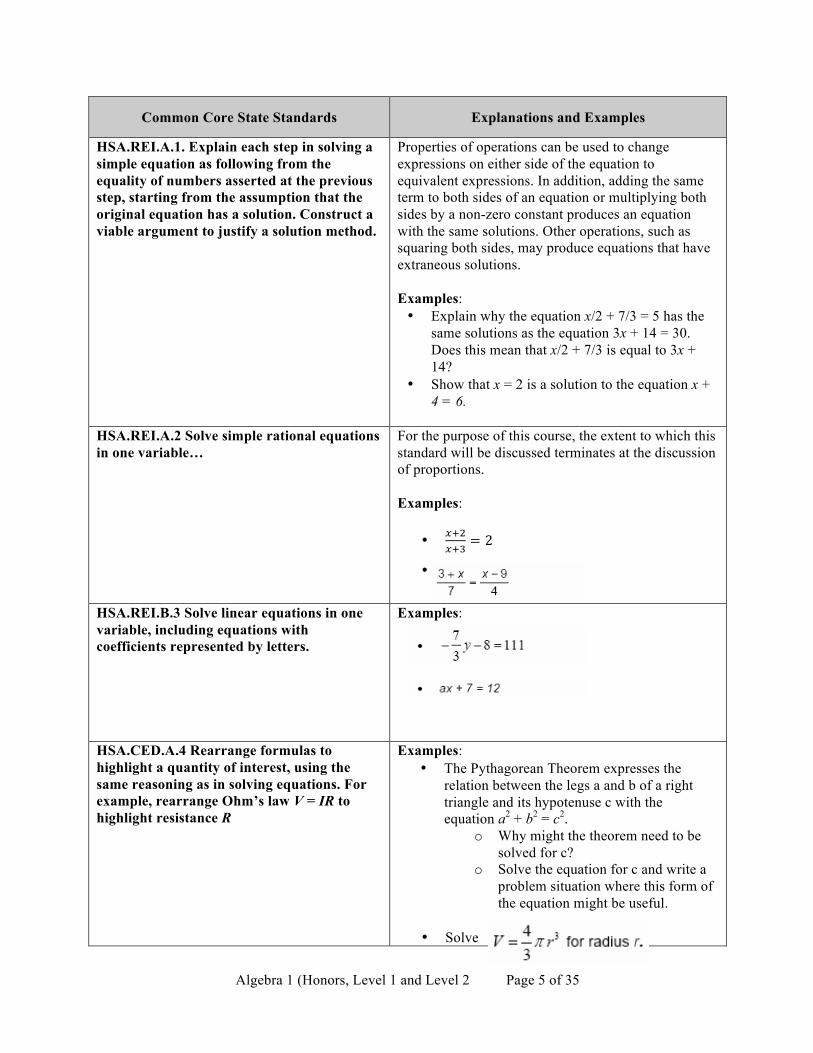
HSA.REI.A.1. Explain each step in solving a simple equation as following from the equality of numbers asserted at the previous step, starting from the assumption that the original equation has a solution. Construct a viable argument to justify a solution method.
Properties of operations can be used to change expressions on either side of the equation to equivalent expressions. In addition, adding the same term to both sides of an equation or multiplying both sides by a non-zero constant produces an equation with the same solutions. Other operations, such as squaring both sides, may produce equations that have extraneous solutions. Examples: • Explain why the equation x/2 + 7/3 = 5 has the
same solutions as the equation 3x + 14 = 30. Does this mean that x/2 + 7/3 is equal to 3x + 14?
• Show that x = 2 is a solution to the equation x + 4 = 6.
HSA.REI.A.2 Solve simple rational equations in one variable…
For the purpose of this course, the extent to which this standard will be discussed terminates at the discussion of proportions. Examples:
• !!!!!!
= 2
•
HSA.REI.B.3 Solve linear equations in one variable, including equations with coefficients represented by letters.
Examples:
HSA.CED.A.4 Rearrange formulas to highlight a quantity of interest, using the same reasoning as in solving equations. For example, rearrange Ohm’s law V = IR to highlight resistance R
Examples: • The Pythagorean Theorem expresses the
relation between the legs a and b of a right triangle and its hypotenuse c with the equation a2 + b2 = c2.
o Why might the theorem need to be solved for c?
o Solve the equation for c and write a problem situation where this form of the equation might be useful.
• Solve
Algebra 1 (Honors, Level 1 and Level 2 Page 6 of 35
Common Core State Standards Explanations and Examples
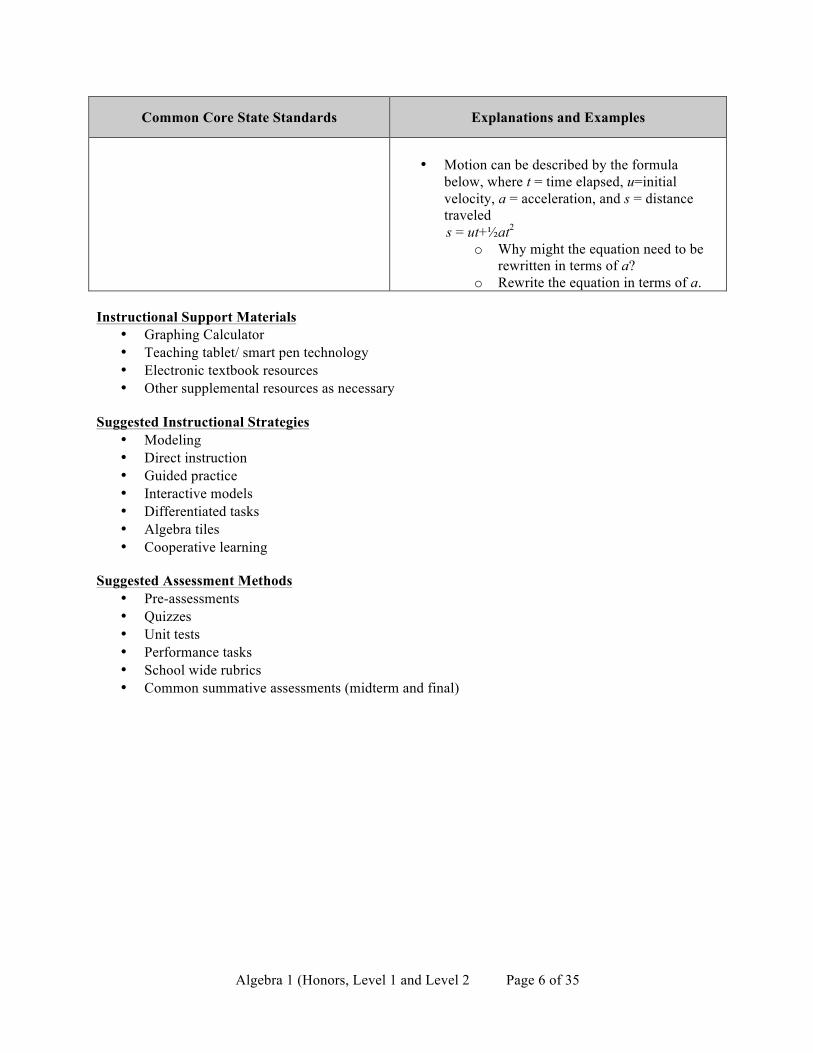
• Motion can be described by the formula
below, where t = time elapsed, u=initial velocity, a = acceleration, and s = distance traveled
s = ut+½at2 o Why might the equation need to be
rewritten in terms of a? o Rewrite the equation in terms of a.
Instructional Support Materials
• Graphing Calculator • Teaching tablet/ smart pen technology • Electronic textbook resources • Other supplemental resources as necessary
Suggested Instructional Strategies
• Modeling • Direct instruction • Guided practice • Interactive models • Differentiated tasks • Algebra tiles • Cooperative learning
Suggested Assessment Methods
• Pre-assessments • Quizzes • Unit tests • Performance tasks • School wide rubrics • Common summative assessments (midterm and final)
Algebra 1 (Honors, Level 1 and Level 2 Page 7 of 35
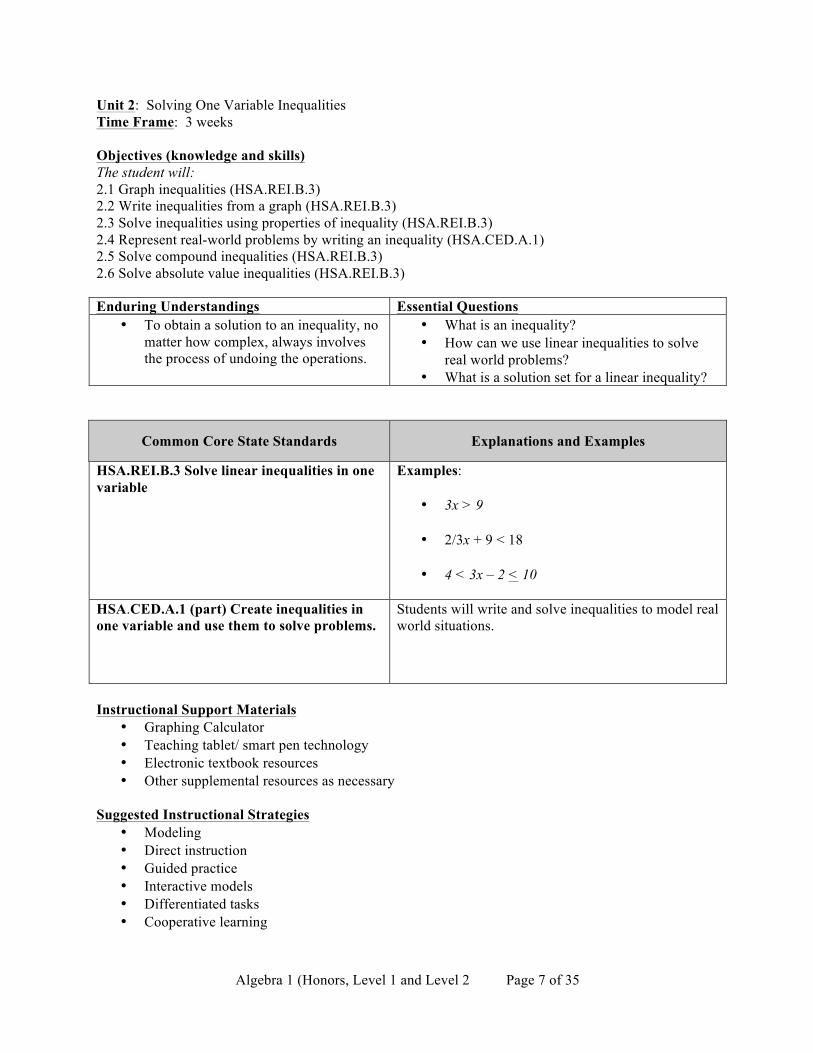
Unit 2: Solving One Variable Inequalities Time Frame: 3 weeks Objectives (knowledge and skills) The student will: 2.1 Graph inequalities (HSA.REI.B.3) 2.2 Write inequalities from a graph (HSA.REI.B.3) 2.3 Solve inequalities using properties of inequality (HSA.REI.B.3) 2.4 Represent real-world problems by writing an inequality (HSA.CED.A.1) 2.5 Solve compound inequalities (HSA.REI.B.3) 2.6 Solve absolute value inequalities (HSA.REI.B.3)
Common Core State Standards Explanations and Examples
HSA.REI.B.3 Solve linear inequalities in one variable
Examples:
• 3x > 9
• 2/3x + 9 < 18
• 4 < 3x – 2 < 10
HSA.CED.A.1 (part) Create inequalities in one variable and use them to solve problems.
Students will write and solve inequalities to model real world situations.
Instructional Support Materials
• Graphing Calculator • Teaching tablet/ smart pen technology • Electronic textbook resources • Other supplemental resources as necessary
Suggested Instructional Strategies
• Modeling • Direct instruction • Guided practice • Interactive models • Differentiated tasks • Cooperative learning
Enduring Understandings Essential Questions • To obtain a solution to an inequality, no
matter how complex, always involves the process of undoing the operations.
• What is an inequality? • How can we use linear inequalities to solve
real world problems? • What is a solution set for a linear inequality?
Algebra 1 (Honors, Level 1 and Level 2 Page 8 of 35
Suggested Assessment Methods • Pre-assessments • Quizzes • Unit tests • Performance tasks • School wide rubrics • Common summative assessments (midterm and final)
Algebra 1 (Honors, Level 1 and Level 2 Page 9 of 35
Unit 3: Introduction to Functions Time Frame: 5 weeks Objectives (knowledge and skills) The student will:
3.1 Sketch graphs based on a given situation (HSA.REI.D.10) • Identify situations that are discrete or continuous
3.2 Identify whether a relation is a function given a variety of representations (HSF.IF.B.5) • Identify domain and range of a function. (HSF.IF.A.1)
3.3 Write a function rule for a given pattern or real-world situation (HSF.LE.A.2) 3.4 Evaluate functions using function notation (HSF.IF.A.2) 3.5 Graph square root, cube root, and piece-wise functions, including step functions and absolute
value functions (HSF.IF.C.7b) • Understand the graph of an equation in two variables is the set of all its solutions plotted in
the coordinate plane, often forming a curve (which could be a line) 3.6 Investigate the characteristics of functions and their graphs: intercepts, intervals, maximums,
minimums, symmetry, end behavior (HSF.IF.B.4) • Relate a domain of a function to its graph • Compare properties of functions each represented in a different way
3.7 Create scatter plots to represent bivariate data (HSS.ID.C.9) • Distinguish between correlation and causation
3.8 Write arithmetic sequences both recursively and with an explicit formula, use them to model situations, and translate between the two forms ( HSF.IF.A.3) • Recognize that sequences are functions, sometimes defined recursively
Enduring Understandings Essential Questions
• Functions are a mathematical way to describe relationships between two quantities that vary.
• Functions can be represented in a variety of ways.
• Graphing functions gives us a visual model to study and interpret real-world situations.
• There are a variety of methods and techniques which can be used to graph functions.
• Although scatter plots and trend lines may reveal a pattern, the relationship of the variables may indicate a correlation, but not causation.
• In what ways does a relation differ from a function?
• Why is the vertical line test a valid method in determining whether a relation is a function?
• How can functions be used to model real-world situations?
• To what extent can we predict the future? • Is correlation ever causation? • How can modeling data help us to understand
patterns?
Algebra 1 (Honors, Level 1 and Level 2 Page 10 of 35
Common Core State Standards Explanations and Examples
HSA.REI.D.10 Understand that the graph of an equation in two variables is the set of all its solutions plotted in the coordinate plane, often forming a curve (which could be a line).
Example:
• Which of the following points is on the line with equation𝑦 = 2𝑥 − 2?
(a) (1, -2) (b) (2, 2) (c) (3, -1) (d) (3, 4)
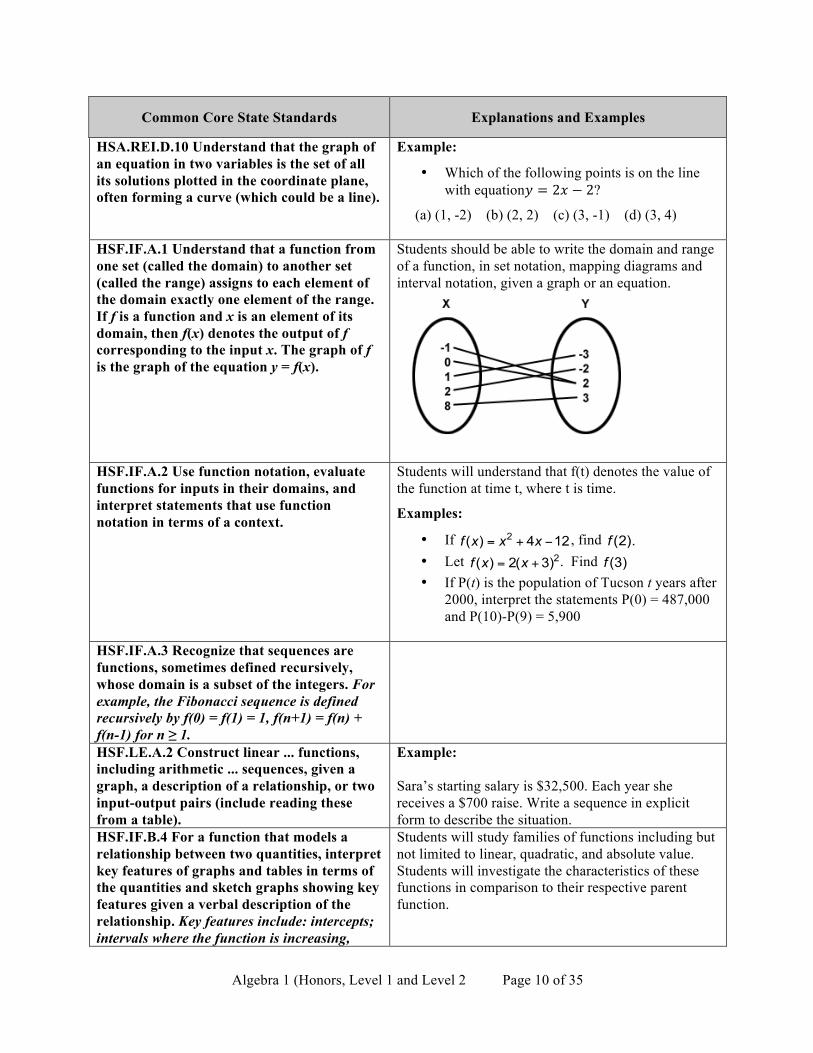
HSF.IF.A.1 Understand that a function from one set (called the domain) to another set (called the range) assigns to each element of the domain exactly one element of the range. If f is a function and x is an element of its domain, then f(x) denotes the output of f corresponding to the input x. The graph of f is the graph of the equation y = f(x).
Students should be able to write the domain and range of a function, in set notation, mapping diagrams and interval notation, given a graph or an equation.
HSF.IF.A.2 Use function notation, evaluate functions for inputs in their domains, and interpret statements that use function notation in terms of a context.
Students will understand that f(t) denotes the value of the function at time t, where t is time.
Examples:
• If 124)( 2 −+= xxxf , find ).2(f • Let 2)3(2)( += xxf . Find )3(f • If P(t) is the population of Tucson t years after
2000, interpret the statements P(0) = 487,000 and P(10)-P(9) = 5,900
HSF.IF.A.3 Recognize that sequences are functions, sometimes defined recursively, whose domain is a subset of the integers. For example, the Fibonacci sequence is defined recursively by f(0) = f(1) = 1, f(n+1) = f(n) + f(n-1) for n ≥ 1.
HSF.LE.A.2 Construct linear ... functions, including arithmetic ... sequences, given a graph, a description of a relationship, or two input-output pairs (include reading these from a table).
Example: Sara’s starting salary is $32,500. Each year she receives a $700 raise. Write a sequence in explicit form to describe the situation.
HSF.IF.B.4 For a function that models a relationship between two quantities, interpret key features of graphs and tables in terms of the quantities and sketch graphs showing key features given a verbal description of the relationship. Key features include: intercepts; intervals where the function is increasing,
Students will study families of functions including but not limited to linear, quadratic, and absolute value. Students will investigate the characteristics of these functions in comparison to their respective parent function.
Algebra 1 (Honors, Level 1 and Level 2 Page 11 of 35
Common Core State Standards Explanations and Examples
decreasing, positive, or negative....*
HSF.IF.B.5 Relate the domain of a function to its graph and, where applicable, to the quantitative relationship it describes.
For example, if the function h(n) gives the number of person-hours it takes to assemble n engines in factory, then the positive integers would be an appropriate domain for the function.
HSF.IF.C.7b Graph square root, cube root, and piecewise-defined functions, including step functions and absolute value functions
Examples:
• Describe key characteristics of the graph of f(x) = │x – 3│ + 5.
HSS.ID.C.9 Distinguish between correlation and causation.
Some data leads observers to believe that there is a cause and effect relationship when a strong relationship is observed. Students should be careful not to assume that correlation implies causation. The determination that one thing causes another requires a controlled randomized experiment.
Example:
Diane did a study for a health class about the effects of a student’s end-of-year math test scores on height. Based on a graph of her data, she found that there was a direct relationship between students’ math scores and height. She concluded that “doing well on your end-of-course math tests makes you tall.” Is this conclusion justified? Explain any flaws in Diane’s reasoning.
Instructional Support Materials
• Graphing Calculator • Teaching tablet/ smart pen technology • Electronic textbook resources
Suggested Instructional Strategies
• Modeling • Guided practice • Interactive models • Differentiated tasks • Electronic demonstrations • Cooperative learning
Suggested Assessment Methods
• Pre-assessments • Quizzes & unit test • Performance tasks • School wide rubrics • Common summative assessments (midterm and final)
Algebra 1 (Honors, Level 1 and Level 2 Page 12 of 35
Unit 4: Linear Functions Time Frame: 6 weeks Objectives (knowledge and skills) The student will:
4.1 Identify linear functions from a graph, table and equation (HSF.IF.C.9) ( HSF.LE.A.1) 4.2 Calculate and interpret the average rate of change of a function over a specified interval
(HSF.IF.B.6) (HSS.ID.C.7) • Analyze differences in end behavior of polynomial verses exponential functions using graphs
and tables • Calculate and interpret the meaning of intercepts of a function
4.3 Identify situations that model direct variation (HSA.CED.A.2) 4.4 Write a function rule to model a linear relationship (HSF.IF.C.8)
• Create equations in two or more variables to represent relationships between quantities; graph equations on coordinate axes with labels and scales (HSF.LE.B.5)
4.5 Graph linear equations (HSF.IF.C.7) 4.5 Write a linear regression model (HSS.ID.B.6a) (HSS.ID.B.6b) (HSS.ID.B.6c) (HSS.ID.C.8) 4.6 Distinguish whether or not the graphs of two functions are parallel, perpendicular, or neither
(HSG.GPE.B.5) 4.7 Use slope and y-intercept to describe transformations (HSF.IF.B.4) 4.8 Graph absolute value functions (HSF.IF.C.)
• Relate absolute value functions to the combination of two linear piecewise functions
Enduring Understanding Essential Questions
• Linear functions are characterized by a constant average rate of change (or constant additive change).
• A line represents a set of infinite solutions to a two variable equation
• Models can be used to represent and make predictions about bivariate data
• What is a linear function? • What are the different ways that linear
functions may be represented? • What is the significance of a linear function’s
slope and y-intercept? • How may linear functions model real world
situations? • How may linear functions help us analyze real
world situations and solve practical problems?
Common Core State Standards Explanations and Examples
HSF.IF.B.6 Calculate and interpret the average rate of change of a function (presented symbolically or as a table) over a specified interval. Estimate the rate of change from a graph.*
The average rate of change of a function y = f(x) over an interval [a,b] is !"!"= ! ! !! !
!!!
In addition to finding average rates of change from functions given symbolically, graphically, or in a table, Students may collect data from experiments or simulations (ex. falling ball, velocity of a car, etc.) and find average rates of change for the function modeling the situation.
Algebra 1 (Honors, Level 1 and Level 2 Page 13 of 35
Common Core State Standards Explanations and Examples
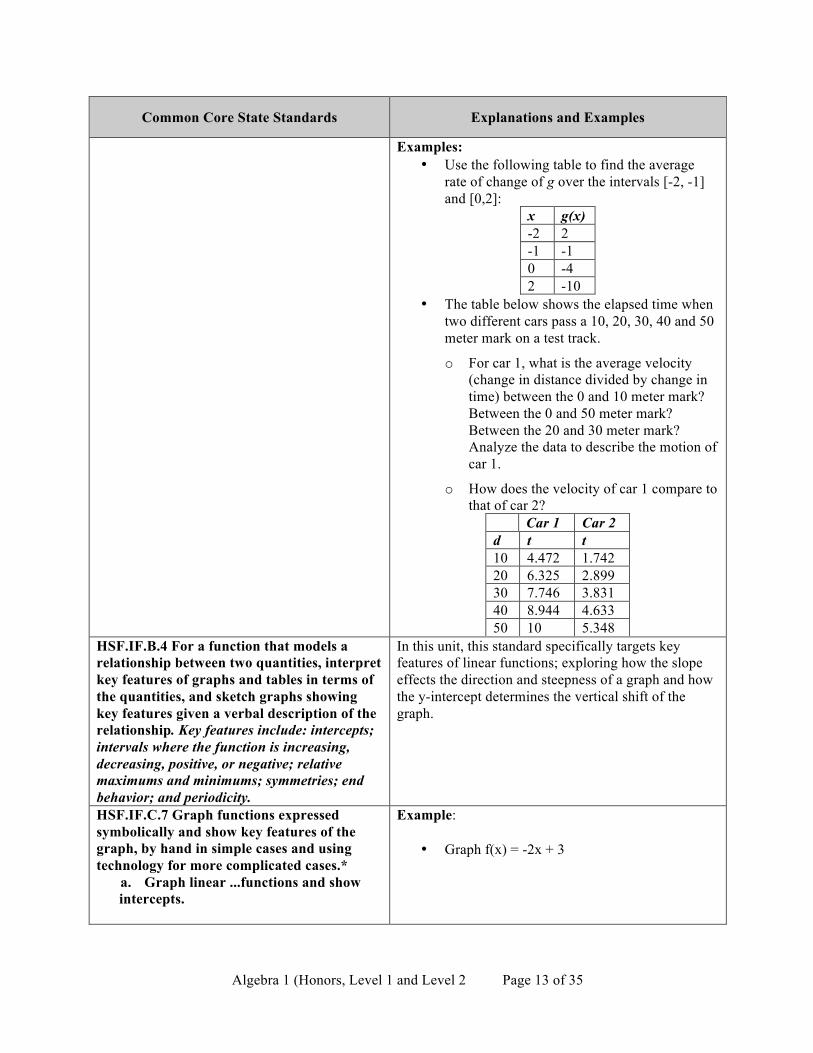
Examples: • Use the following table to find the average
rate of change of g over the intervals [-2, -1] and [0,2]:
x g(x) -2 2 -1 -1 0 -4 2 -10
• The table below shows the elapsed time when two different cars pass a 10, 20, 30, 40 and 50 meter mark on a test track.
o For car 1, what is the average velocity (change in distance divided by change in time) between the 0 and 10 meter mark? Between the 0 and 50 meter mark? Between the 20 and 30 meter mark? Analyze the data to describe the motion of car 1.
o How does the velocity of car 1 compare to that of car 2?
Car 1 Car 2 d t t 10 4.472 1.742 20 6.325 2.899 30 7.746 3.831 40 8.944 4.633 50 10 5.348
HSF.IF.B.4 For a function that models a relationship between two quantities, interpret key features of graphs and tables in terms of the quantities, and sketch graphs showing key features given a verbal description of the relationship. Key features include: intercepts; intervals where the function is increasing, decreasing, positive, or negative; relative maximums and minimums; symmetries; end behavior; and periodicity.
In this unit, this standard specifically targets key features of linear functions; exploring how the slope effects the direction and steepness of a graph and how the y-intercept determines the vertical shift of the graph.
HSF.IF.C.7 Graph functions expressed symbolically and show key features of the graph, by hand in simple cases and using technology for more complicated cases.*
a. Graph linear ...functions and show intercepts.
Example:
• Graph f(x) = -2x + 3
Algebra 1 (Honors, Level 1 and Level 2 Page 14 of 35
Common Core State Standards Explanations and Examples
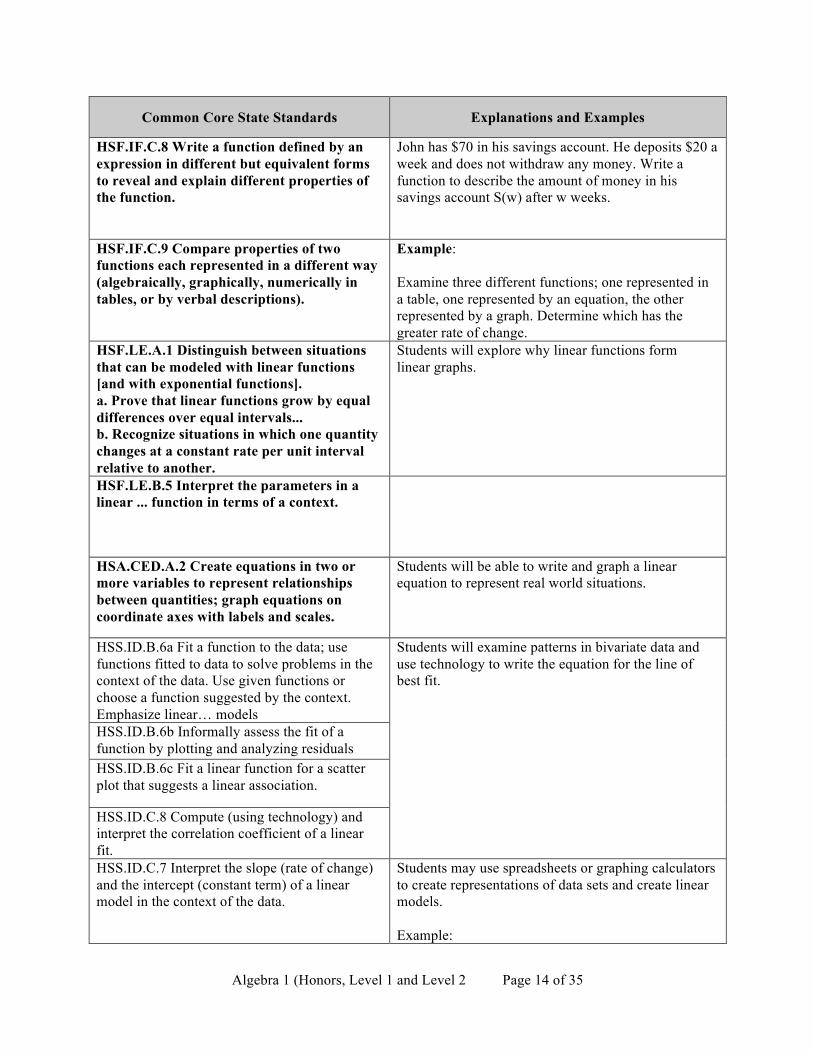
HSF.IF.C.8 Write a function defined by an expression in different but equivalent forms to reveal and explain different properties of the function.
John has $70 in his savings account. He deposits $20 a week and does not withdraw any money. Write a function to describe the amount of money in his savings account S(w) after w weeks.
HSF.IF.C.9 Compare properties of two functions each represented in a different way (algebraically, graphically, numerically in tables, or by verbal descriptions).
Example: Examine three different functions; one represented in a table, one represented by an equation, the other represented by a graph. Determine which has the greater rate of change.
HSF.LE.A.1 Distinguish between situations that can be modeled with linear functions [and with exponential functions]. a. Prove that linear functions grow by equal differences over equal intervals... b. Recognize situations in which one quantity changes at a constant rate per unit interval relative to another.
Students will explore why linear functions form linear graphs.
HSF.LE.B.5 Interpret the parameters in a linear ... function in terms of a context.
HSA.CED.A.2 Create equations in two or more variables to represent relationships between quantities; graph equations on coordinate axes with labels and scales.
Students will be able to write and graph a linear equation to represent real world situations.
HSS.ID.B.6a Fit a function to the data; use functions fitted to data to solve problems in the context of the data. Use given functions or choose a function suggested by the context. Emphasize linear… models
Students will examine patterns in bivariate data and use technology to write the equation for the line of best fit.
HSS.ID.B.6b Informally assess the fit of a function by plotting and analyzing residuals HSS.ID.B.6c Fit a linear function for a scatter plot that suggests a linear association.
HSS.ID.C.8 Compute (using technology) and interpret the correlation coefficient of a linear fit. HSS.ID.C.7 Interpret the slope (rate of change) and the intercept (constant term) of a linear model in the context of the data.
Students may use spreadsheets or graphing calculators to create representations of data sets and create linear models. Example:
Algebra 1 (Honors, Level 1 and Level 2 Page 15 of 35
Common Core State Standards Explanations and Examples
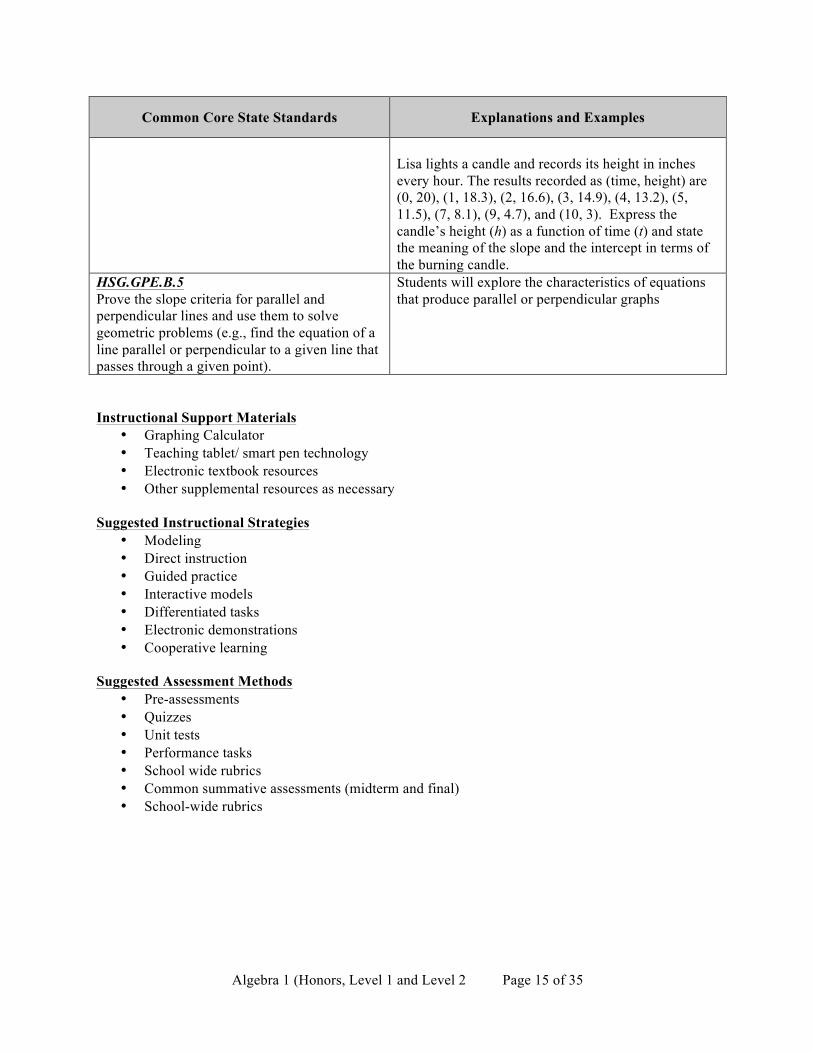
Lisa lights a candle and records its height in inches every hour. The results recorded as (time, height) are (0, 20), (1, 18.3), (2, 16.6), (3, 14.9), (4, 13.2), (5, 11.5), (7, 8.1), (9, 4.7), and (10, 3). Express the candle’s height (h) as a function of time (t) and state the meaning of the slope and the intercept in terms of the burning candle.
HSG.GPE.B.5 Prove the slope criteria for parallel and perpendicular lines and use them to solve geometric problems (e.g., find the equation of a line parallel or perpendicular to a given line that passes through a given point).
Students will explore the characteristics of equations that produce parallel or perpendicular graphs
Instructional Support Materials
• Graphing Calculator • Teaching tablet/ smart pen technology • Electronic textbook resources • Other supplemental resources as necessary
Suggested Instructional Strategies
• Modeling • Direct instruction • Guided practice • Interactive models • Differentiated tasks • Electronic demonstrations • Cooperative learning
Suggested Assessment Methods
• Pre-assessments • Quizzes • Unit tests • Performance tasks • School wide rubrics • Common summative assessments (midterm and final) • School-wide rubrics
Algebra 1 (Honors, Level 1 and Level 2 Page 16 of 35
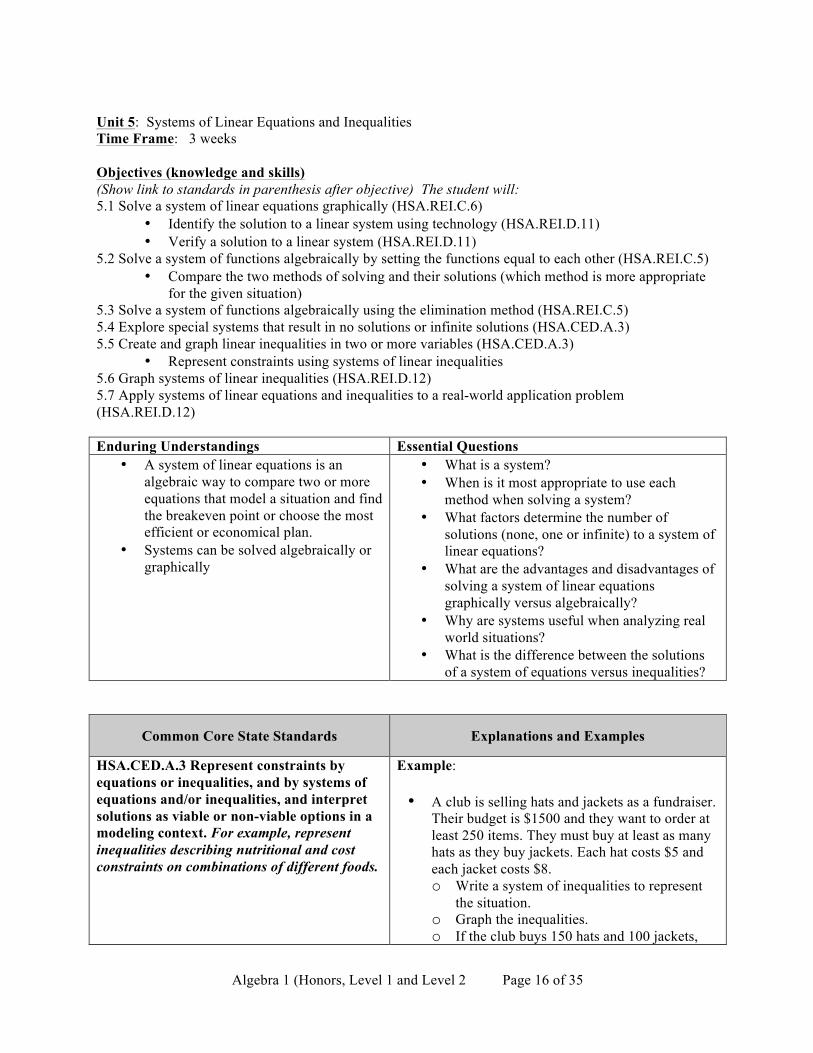
Unit 5: Systems of Linear Equations and Inequalities Time Frame: 3 weeks Objectives (knowledge and skills) (Show link to standards in parenthesis after objective) The student will: 5.1 Solve a system of linear equations graphically (HSA.REI.C.6)
• Identify the solution to a linear system using technology (HSA.REI.D.11) • Verify a solution to a linear system (HSA.REI.D.11)
5.2 Solve a system of functions algebraically by setting the functions equal to each other (HSA.REI.C.5) • Compare the two methods of solving and their solutions (which method is more appropriate
for the given situation) 5.3 Solve a system of functions algebraically using the elimination method (HSA.REI.C.5) 5.4 Explore special systems that result in no solutions or infinite solutions (HSA.CED.A.3) 5.5 Create and graph linear inequalities in two or more variables (HSA.CED.A.3)
• Represent constraints using systems of linear inequalities 5.6 Graph systems of linear inequalities (HSA.REI.D.12) 5.7 Apply systems of linear equations and inequalities to a real-world application problem (HSA.REI.D.12) Enduring Understandings Essential Questions
• A system of linear equations is an algebraic way to compare two or more equations that model a situation and find the breakeven point or choose the most efficient or economical plan.
• Systems can be solved algebraically or graphically
• What is a system? • When is it most appropriate to use each
method when solving a system? • What factors determine the number of
solutions (none, one or infinite) to a system of linear equations?
• What are the advantages and disadvantages of solving a system of linear equations graphically versus algebraically?
• Why are systems useful when analyzing real world situations?
• What is the difference between the solutions of a system of equations versus inequalities?
Common Core State Standards Explanations and Examples
HSA.CED.A.3 Represent constraints by equations or inequalities, and by systems of equations and/or inequalities, and interpret solutions as viable or non-viable options in a modeling context. For example, represent inequalities describing nutritional and cost constraints on combinations of different foods.
Example: • A club is selling hats and jackets as a fundraiser.
Their budget is $1500 and they want to order at least 250 items. They must buy at least as many hats as they buy jackets. Each hat costs $5 and each jacket costs $8. o Write a system of inequalities to represent
the situation. o Graph the inequalities. o If the club buys 150 hats and 100 jackets,
Algebra 1 (Honors, Level 1 and Level 2 Page 17 of 35
Common Core State Standards Explanations and Examples
will the conditions be satisfied? o What is the maximum number of jackets
they can buy and still meet the conditions?
HSA.REI.C.6 Solve systems of linear equations exactly and approximately (e.g., with graphs), focusing on pairs of linear equations in two variables.
The system solution methods can include but are not limited to graphical, elimination/linear combination, substitution, and modeling. Systems can be written algebraically or can be represented in context. Students may use graphing calculators, programs, or applets to model and find approximate solutions for systems of equations. • Solve the system of equations: x+ y = 11 and 3x
– y = 5. Use a second method to check your answer.
• Solve the system of equations: x – 2y + 3z = 5, x
+ 3z = 11, 5y – 6z = 9. • The opera theater contains 1,200 seats, with
three different prices. The seats cost $45 dollars per seat, $50 per seat, and $60 per seat. The opera needs to gross $63,750 on seat sales. There are twice as many $60 seats as $45 seats. How many seats in each level need to be sold?
HSA.REI.C.5 Prove that, given a system of two equations in two variables, replacing one equation by the sum of that equation and a multiple of the other produces a system with the same solutions.
Example: Given that the sum of two numbers is 10 and their difference is 4, what are the numbers? Explain how your answer can be deduced from the fact that they two numbers, x and y, satisfy the equations x + y = 10 and x – y = 4.
HSA.REI.D.11 Explain why the x-coordinates of the points where the graphs of the equations y = f(x) and y = g(x) intersect are the solutions of the equation f(x) = g(x); find the solutions approximately, e.g., using technology to graph the functions, make tables of values, or find successive approximations. Include cases where f(x) and/or g(x) are linear, polynomial, rational, absolute value, exponential, and logarithmic functions.*
Students need to understand that numerical solution methods (data in a table used to approximate an algebraic function) and graphical solution methods may produce approximate solutions, and algebraic solution methods produce precise solutions that can be represented graphically or numerically. Students may use graphing calculators or programs to generate tables of values, graph, or solve a variety of functions. Example: • Given the following equations determine the x
value of the intersection point results in an equal output for both functions
𝑓 𝑥 = 3𝑥 − 2 𝑔 𝑥 = 𝑥 + 3 ! − 1
Algebra 1 (Honors, Level 1 and Level 2 Page 18 of 35
Common Core State Standards Explanations and Examples
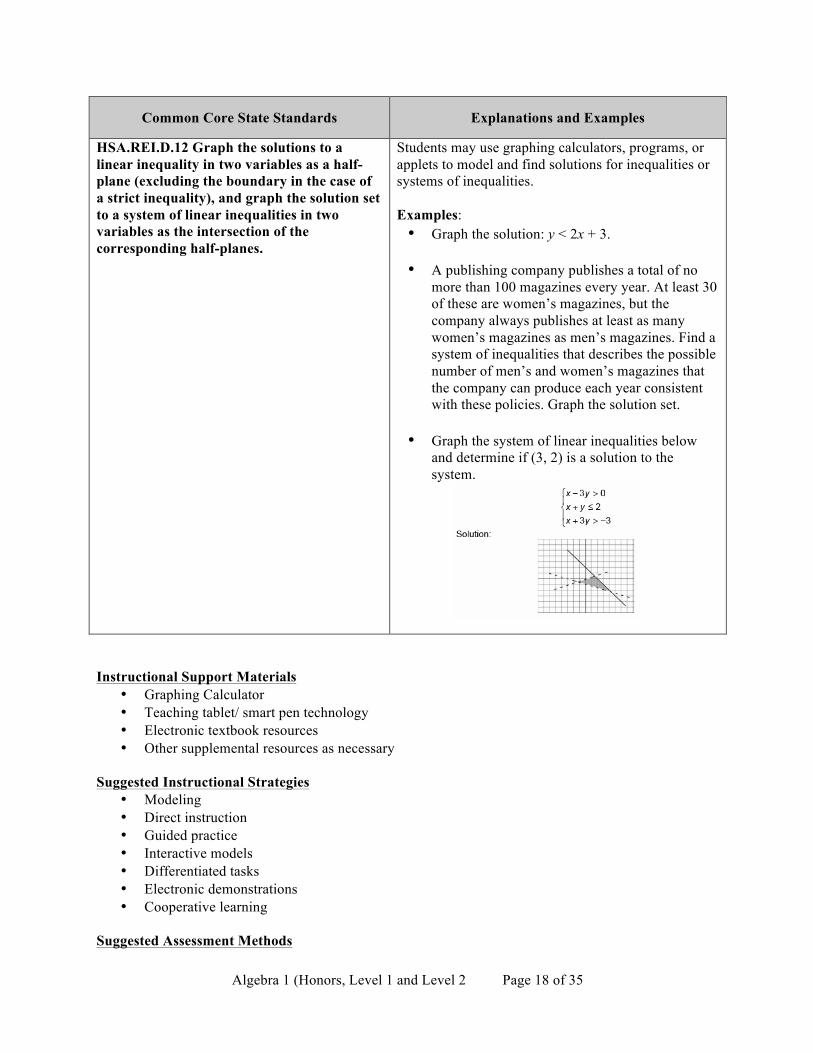
HSA.REI.D.12 Graph the solutions to a linear inequality in two variables as a half-plane (excluding the boundary in the case of a strict inequality), and graph the solution set to a system of linear inequalities in two variables as the intersection of the corresponding half-planes.
Students may use graphing calculators, programs, or applets to model and find solutions for inequalities or systems of inequalities. Examples: • Graph the solution: y < 2x + 3.
• A publishing company publishes a total of no
more than 100 magazines every year. At least 30 of these are women’s magazines, but the company always publishes at least as many women’s magazines as men’s magazines. Find a system of inequalities that describes the possible number of men’s and women’s magazines that the company can produce each year consistent with these policies. Graph the solution set.
• Graph the system of linear inequalities below
and determine if (3, 2) is a solution to the system.
Instructional Support Materials
• Graphing Calculator • Teaching tablet/ smart pen technology • Electronic textbook resources • Other supplemental resources as necessary
Suggested Instructional Strategies
• Modeling • Direct instruction • Guided practice • Interactive models • Differentiated tasks • Electronic demonstrations • Cooperative learning
Suggested Assessment Methods

Algebra 1 (Honors, Level 1 and Level 2 Page 19 of 35
• Pre-assessments • Quizzes • Unit tests • Performance tasks • School-wide rubrics • Common summative assessments (midterm and final)
Algebra 1 (Honors, Level 1 and Level 2 Page 20 of 35
Unit 6: Properties of Exponents Time Frame: 4 weeks Objectives (knowledge and skills) The student will:
6.1 Discovery and apply properties of exponents (HSN.RN.A.1) (HSN.RN.B.3) 6.2 Justify the properties of exponents extended to rational exponents (HSN.RN.A.2) 6.3 Perform operations with polynomials (HSA.APR.A.1)
Enduring Understandings Essential Questions
• Exponents are a representation of repeated multiplication
• Exponents are efficient ways of expressing numbers
• The value of any number to the first power is equal to itself.
• The value of any number raised to a negative exponent can be expressed with the multiplicative inverse (reciprocal) of the number.
• Polynomials are closed under addition, subtraction, and multiplication.
• What is the purpose of exponents? • Why are exponent rules essential? • How do you simplify expressions using the
laws of exponents? • Why does any non-zero base with an exponent
of zero equal one? • How are algebraic operations applied to
polynomials?
Common Core State Standards Explanations and Examples
HSN.RN.A.1 Explain how the definition of the meaning of rational exponents follows from extending the properties of integer exponents to those values, allowing for a notation for radicals in terms of rational exponents.
For example, we define 5(1/3) to be the cube root of 5 because we want [5 (1/3)]3 = 5[(1/3) x 3] to hold, so [5(1/3)]3 must equal 5.
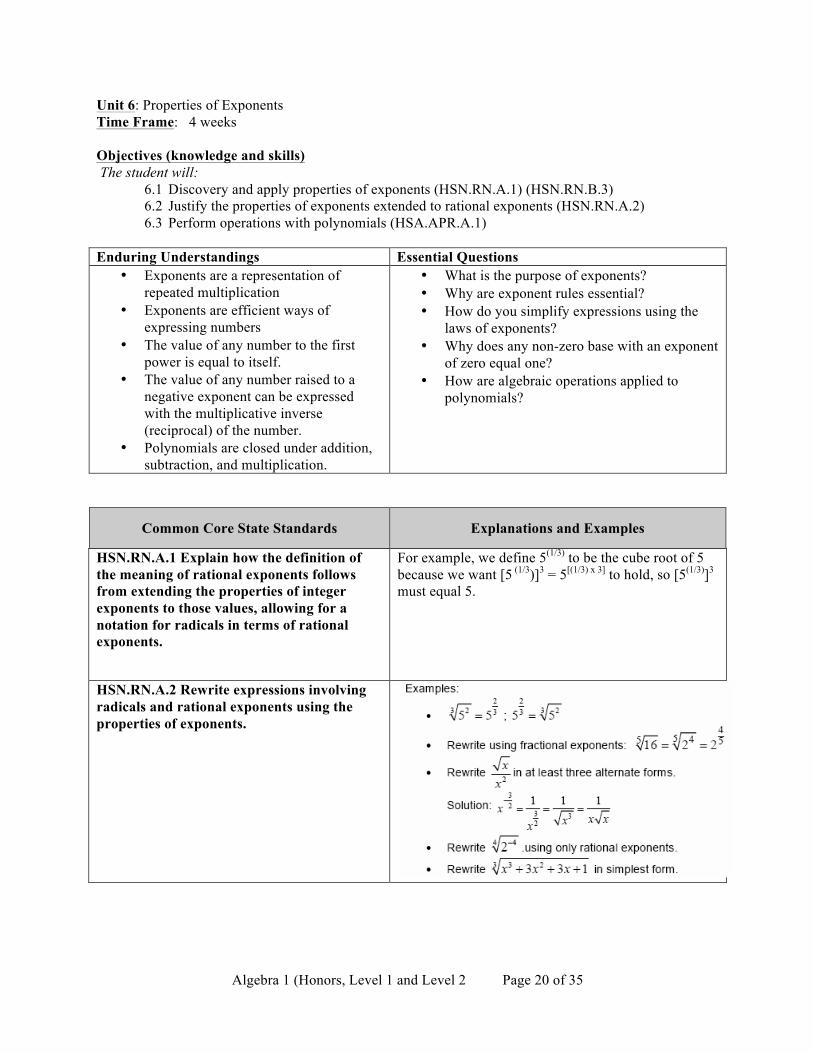
HSN.RN.A.2 Rewrite expressions involving radicals and rational exponents using the properties of exponents.
Algebra 1 (Honors, Level 1 and Level 2 Page 21 of 35
Common Core State Standards Explanations and Examples
HSA.APR.A.1 Understand that polynomials form a system analogous to the integers, namely, they are closed under the operations of addition, subtraction, and multiplication; add, subtract, and multiply polynomials.
Instructional Support Materials
• Graphing Calculator • Teaching tablet/ smart pen technology • Electronic textbook resources • Other supplemental resources as necessary
Suggested Instructional Strategies
• Modeling • Direct instruction • Guided practice • Interactive models • Differentiated tasks • Electronic demonstrations • Cooperative learning
Suggested Assessment Methods
• Pre-assessments • Quizzes • Unit tests • Performance tasks • School-wide rubrics • Common summative assessments (midterm and final)
Algebra 1 (Honors, Level 1 and Level 2 Page 22 of 35
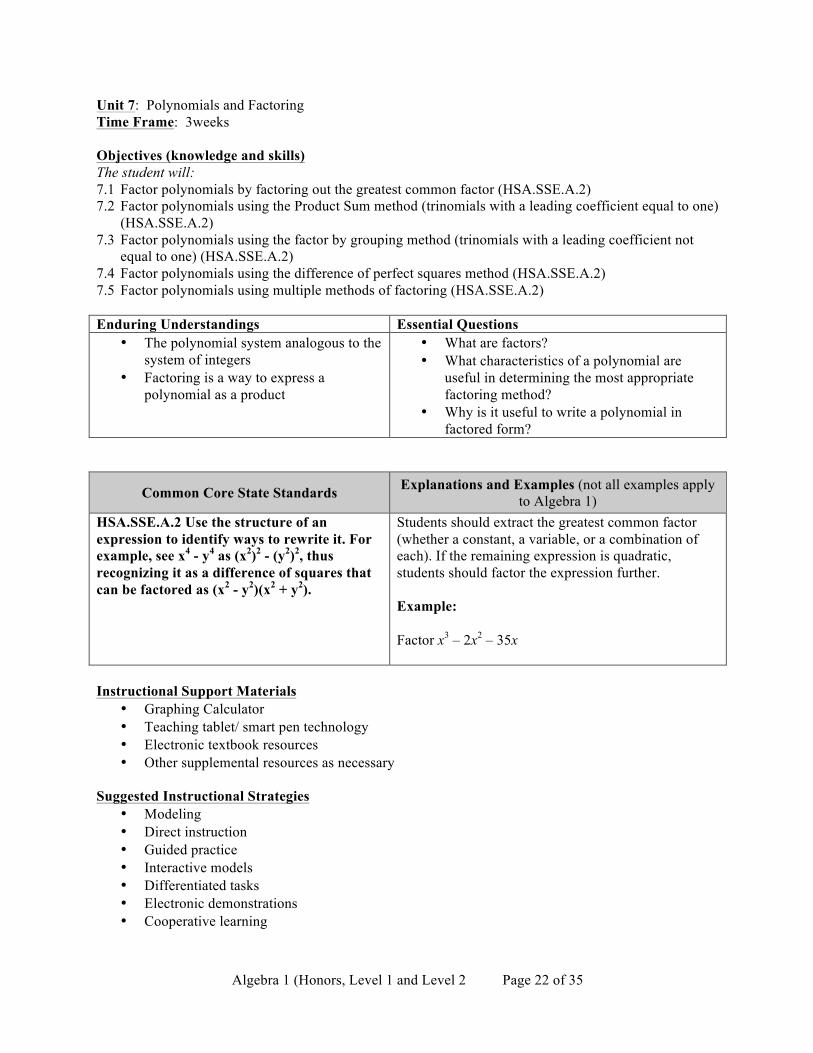
Unit 7: Polynomials and Factoring Time Frame: 3weeks Objectives (knowledge and skills) The student will: 7.1 Factor polynomials by factoring out the greatest common factor (HSA.SSE.A.2) 7.2 Factor polynomials using the Product Sum method (trinomials with a leading coefficient equal to one)
(HSA.SSE.A.2) 7.3 Factor polynomials using the factor by grouping method (trinomials with a leading coefficient not
equal to one) (HSA.SSE.A.2) 7.4 Factor polynomials using the difference of perfect squares method (HSA.SSE.A.2) 7.5 Factor polynomials using multiple methods of factoring (HSA.SSE.A.2)
Enduring Understandings Essential Questions
• The polynomial system analogous to the system of integers
• Factoring is a way to express a polynomial as a product
• What are factors? • What characteristics of a polynomial are
useful in determining the most appropriate factoring method?
• Why is it useful to write a polynomial in factored form?
Common Core State Standards Explanations and Examples (not all examples apply to Algebra 1)
HSA.SSE.A.2 Use the structure of an expression to identify ways to rewrite it. For example, see x4 - y4 as (x2)2 - (y2)2, thus recognizing it as a difference of squares that can be factored as (x2 - y2)(x2 + y2).
Students should extract the greatest common factor (whether a constant, a variable, or a combination of each). If the remaining expression is quadratic, students should factor the expression further. Example: Factor x3 – 2x2 – 35x
Instructional Support Materials
• Graphing Calculator • Teaching tablet/ smart pen technology • Electronic textbook resources • Other supplemental resources as necessary
Suggested Instructional Strategies
• Modeling • Direct instruction • Guided practice • Interactive models • Differentiated tasks • Electronic demonstrations • Cooperative learning
Algebra 1 (Honors, Level 1 and Level 2 Page 23 of 35
Suggested Assessment Methods • Pre-assessments • Quizzes • Unit Tests • Common summative assessments (midterm and final)
Algebra 1 (Honors, Level 1 and Level 2 Page 24 of 35
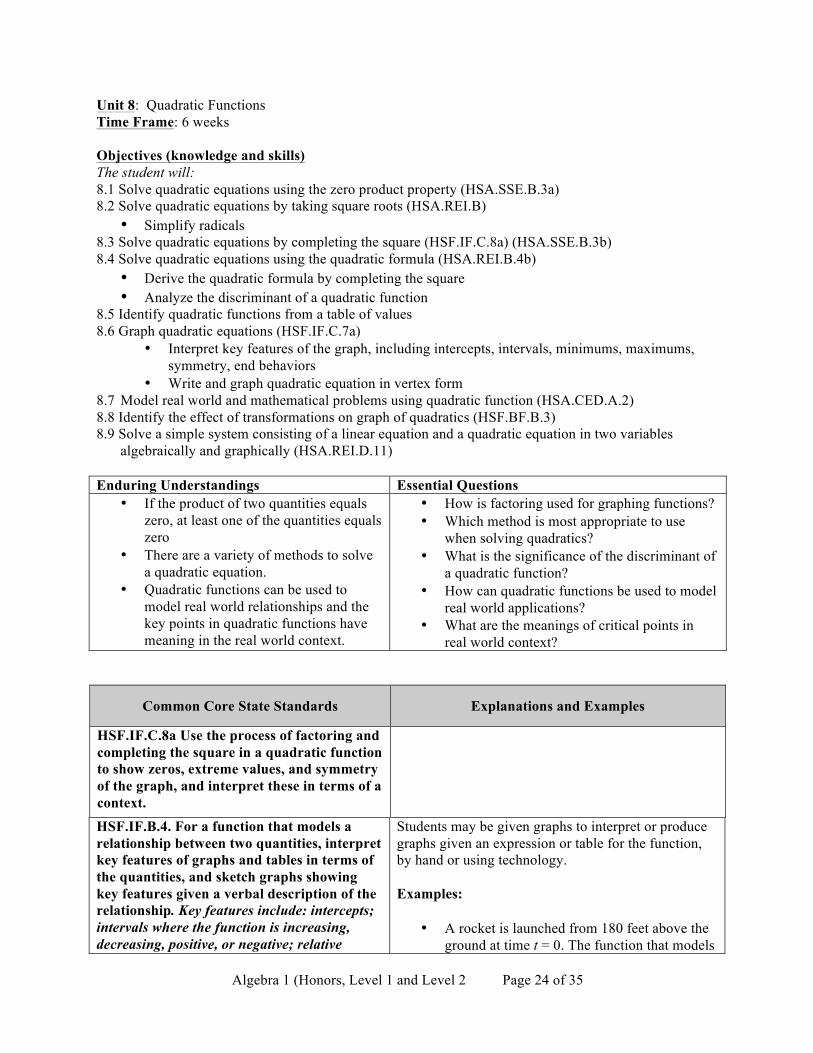
Unit 8: Quadratic Functions Time Frame: 6 weeks Objectives (knowledge and skills) The student will: 8.1 Solve quadratic equations using the zero product property (HSA.SSE.B.3a) 8.2 Solve quadratic equations by taking square roots (HSA.REI.B)
• Simplify radicals 8.3 Solve quadratic equations by completing the square (HSF.IF.C.8a) (HSA.SSE.B.3b) 8.4 Solve quadratic equations using the quadratic formula (HSA.REI.B.4b)
• Derive the quadratic formula by completing the square • Analyze the discriminant of a quadratic function
8.5 Identify quadratic functions from a table of values 8.6 Graph quadratic equations (HSF.IF.C.7a)
• Interpret key features of the graph, including intercepts, intervals, minimums, maximums, symmetry, end behaviors
• Write and graph quadratic equation in vertex form 8.7 Model real world and mathematical problems using quadratic function (HSA.CED.A.2) 8.8 Identify the effect of transformations on graph of quadratics (HSF.BF.B.3) 8.9 Solve a simple system consisting of a linear equation and a quadratic equation in two variables
algebraically and graphically (HSA.REI.D.11) Enduring Understandings Essential Questions
• If the product of two quantities equals zero, at least one of the quantities equals zero
• There are a variety of methods to solve a quadratic equation.
• Quadratic functions can be used to model real world relationships and the key points in quadratic functions have meaning in the real world context.
• How is factoring used for graphing functions? • Which method is most appropriate to use
when solving quadratics? • What is the significance of the discriminant of
a quadratic function? • How can quadratic functions be used to model
real world applications? • What are the meanings of critical points in
real world context?
Common Core State Standards Explanations and Examples
HSF.IF.C.8a Use the process of factoring and completing the square in a quadratic function to show zeros, extreme values, and symmetry of the graph, and interpret these in terms of a context.
HSF.IF.B.4. For a function that models a relationship between two quantities, interpret key features of graphs and tables in terms of the quantities, and sketch graphs showing key features given a verbal description of the relationship. Key features include: intercepts; intervals where the function is increasing, decreasing, positive, or negative; relative
Students may be given graphs to interpret or produce graphs given an expression or table for the function, by hand or using technology. Examples:
• A rocket is launched from 180 feet above the ground at time t = 0. The function that models
Algebra 1 (Honors, Level 1 and Level 2 Page 25 of 35
Common Core State Standards Explanations and Examples
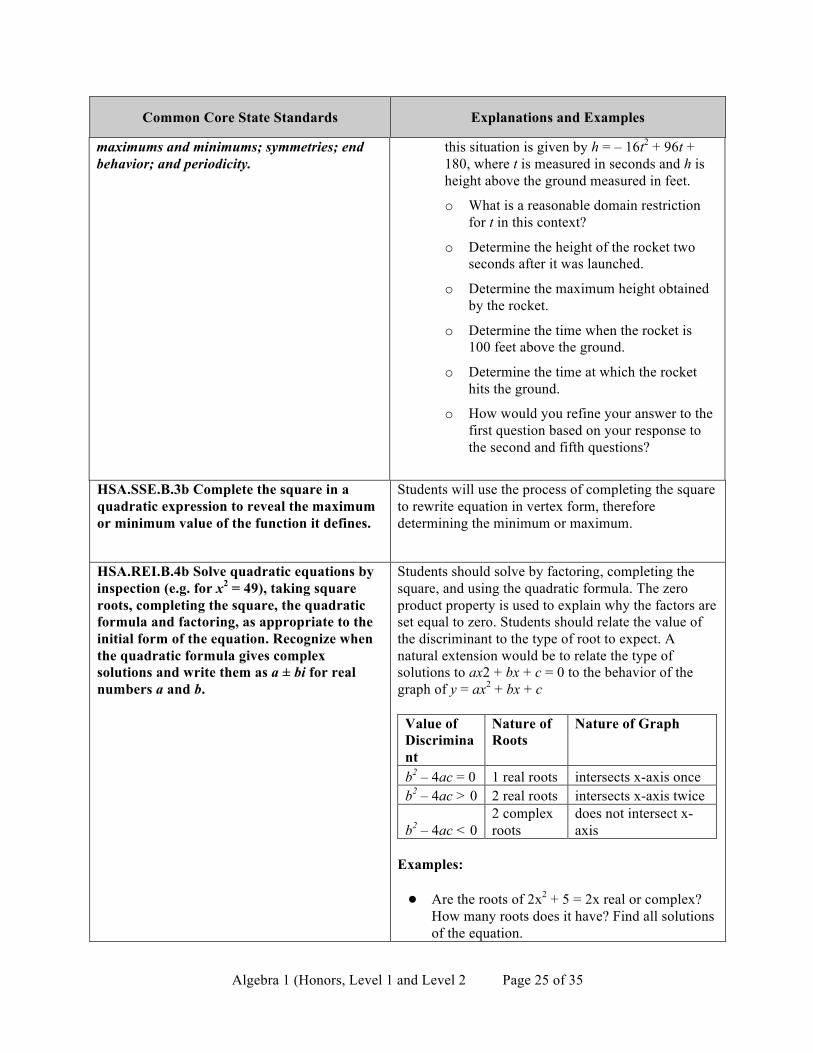
maximums and minimums; symmetries; end behavior; and periodicity.
this situation is given by h = – 16t2 + 96t + 180, where t is measured in seconds and h is height above the ground measured in feet.
o What is a reasonable domain restriction for t in this context?
o Determine the height of the rocket two seconds after it was launched.
o Determine the maximum height obtained by the rocket.
o Determine the time when the rocket is 100 feet above the ground.
o Determine the time at which the rocket hits the ground.
o How would you refine your answer to the first question based on your response to the second and fifth questions?
HSA.SSE.B.3b Complete the square in a quadratic expression to reveal the maximum or minimum value of the function it defines.
Students will use the process of completing the square to rewrite equation in vertex form, therefore determining the minimum or maximum.
HSA.REI.B.4b Solve quadratic equations by inspection (e.g. for x2 = 49), taking square roots, completing the square, the quadratic formula and factoring, as appropriate to the initial form of the equation. Recognize when the quadratic formula gives complex solutions and write them as a ± bi for real numbers a and b.
Students should solve by factoring, completing the square, and using the quadratic formula. The zero product property is used to explain why the factors are set equal to zero. Students should relate the value of the discriminant to the type of root to expect. A natural extension would be to relate the type of solutions to ax2 + bx + c = 0 to the behavior of the graph of y = ax2 + bx + c
Value of Discriminant
Nature of Roots
Nature of Graph
b2 – 4ac = 0 1 real roots intersects x-axis once b2 – 4ac > 0 2 real roots intersects x-axis twice
b2 – 4ac < 0 2 complex roots
does not intersect x-axis
Examples: ● Are the roots of 2x2 + 5 = 2x real or complex?
How many roots does it have? Find all solutions of the equation.
Algebra 1 (Honors, Level 1 and Level 2 Page 26 of 35
Common Core State Standards Explanations and Examples
● What is the nature of the roots of x2 + 6x + 10 = 0? Solve the equation using the quadratic formula and completing the square. How are the two methods related?
HSA.CED.A.2 Create equations in two or more variables to represent relationships between quantities; graph equations on coordinate axes with labels and scales.
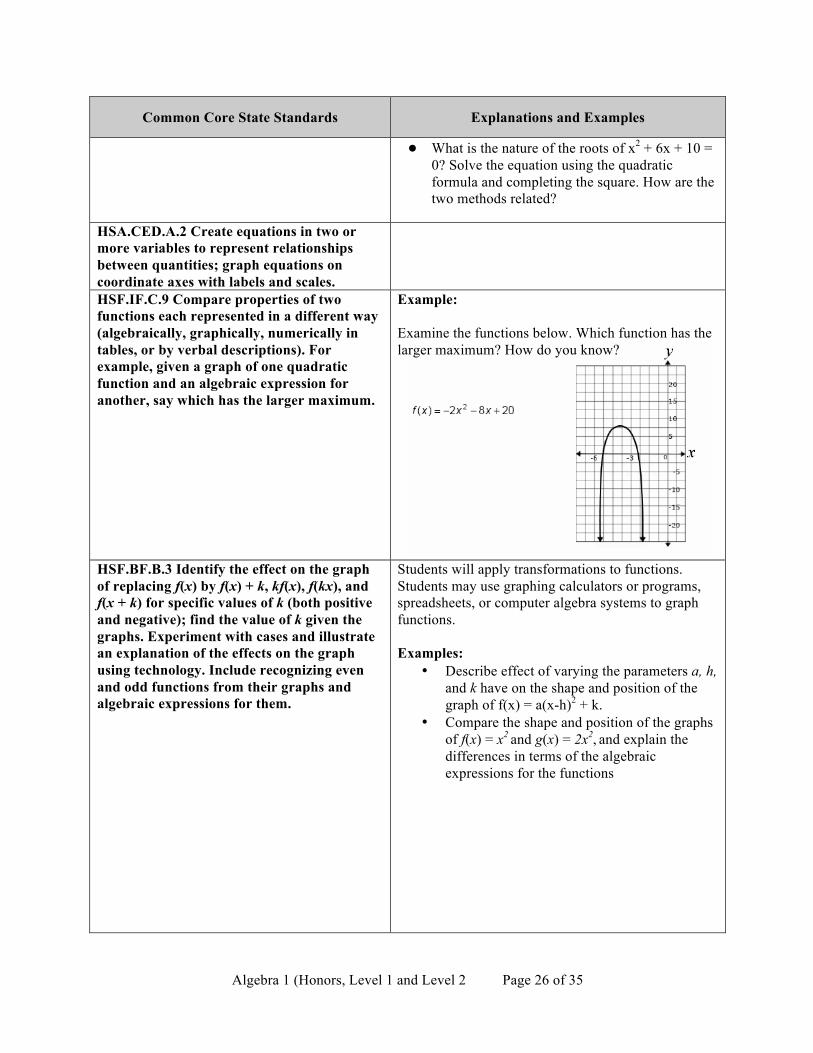
HSF.IF.C.9 Compare properties of two functions each represented in a different way (algebraically, graphically, numerically in tables, or by verbal descriptions). For example, given a graph of one quadratic function and an algebraic expression for another, say which has the larger maximum.
Example: Examine the functions below. Which function has the larger maximum? How do you know?
HSF.BF.B.3 Identify the effect on the graph of replacing f(x) by f(x) + k, kf(x), f(kx), and f(x + k) for specific values of k (both positive and negative); find the value of k given the graphs. Experiment with cases and illustrate an explanation of the effects on the graph using technology. Include recognizing even and odd functions from their graphs and algebraic expressions for them.
Students will apply transformations to functions. Students may use graphing calculators or programs, spreadsheets, or computer algebra systems to graph functions. Examples:
• Describe effect of varying the parameters a, h, and k have on the shape and position of the graph of f(x) = a(x-h)2 + k.
• Compare the shape and position of the graphs of f(x) = x2 and g(x) = 2x2, and explain the differences in terms of the algebraic expressions for the functions
Algebra 1 (Honors, Level 1 and Level 2 Page 27 of 35
Common Core State Standards Explanations and Examples
HSF.IF.C.7a Graph … quadratic functions and show intercepts, maxima, and minima.
Key characteristics include but are not limited to maxima, minima, intercepts, symmetry, end behavior, and asymptotes. Students may use graphing calculators or programs, spreadsheets, or computer algebra systems to graph functions.
HSA.REI.C.7 Solve a simple system consisting of a linear equation and a quadratic equation in two variables algebraically and graphically. For example, find the points of intersection between the line y = -3x and the circle x2 + y2 = 3.
Example: ● Two friends are driving to the Grand Canyon in
separate cars. Suzette has been there before and knows the way but Andrea does not. During the trip Andrea gets ahead of Suzette and pulls over to wait for her. Suzette is traveling at a constant rate of 65 miles per hour. Andrea sees Suzette drive past. To catch up, Andrea accelerates at a constant rate. The distance in miles (d) that her car travels as a function of time in hours (t) since Suzette’s car passed is given by d = 3500t2.
Write and solve a system of equations to determine how long it takes for Andrea to catch up with Suzette.
HSA.REI.D.11 Explain why the x-coordinates of the points where the graphs of the equations y = f(x) and y = g(x) intersect are the solutions of the equation f(x) = g(x); find the solutions approximately, e.g., using technology to graph the functions, make tables of values, or find successive approximations. Include cases where f(x) and/or g(x) are linear, polynomial, rational, absolute value, exponential, and logarithmic functions.*
Students need to understand that numerical solution methods (data in a table used to approximate an algebraic function) and graphical solution methods may produce approximate solutions, and algebraic solution methods produce precise solutions that can be represented graphically or numerically. Students may use graphing calculators or programs to generate tables of values, graph, or solve a variety of functions. Example: • Given the following equations determine the x
value of the intersection point results in an equal output for both functions.
HSA.SSE.B.3a Factor a quadratic expression to reveal the zeros of the function it defines.
Students will use a variety of factoring methods to rewrite quadratics as two or more products. The zero product property will be used to find the zeros.
Algebra 1 (Honors, Level 1 and Level 2 Page 28 of 35
Instructional Support Materials • Graphing Calculator • Teaching tablet/ smart pen technology • Electronic textbook resources • Other supplemental resources as necessary
Suggested Instructional Strategies
• Modeling • Direct instruction • Guided practice • Interactive models • Differentiated tasks • Electronic demonstrations • Cooperative learning
Suggested Assessment Methods
• Pre-assessments • Quizzes • Unit tests • Performance tasks • School-wide rubrics • Common summative assessments (midterm and final)
Algebra 1 (Honors, Level 1 and Level 2 Page 29 of 35
Unit 9: Exponential Functions Time Frame: 5 weeks Objectives (knowledge and skills) The student will: 9.1 Write an explicit and recursive function for a geometric sequence (HSF.BF.A.2) 9.2 Sketch a graph of an exponential function (HSF.LE.A.2)(HSA.CED.A.2)
• Understand effects of variables on the parent function 9.3 Write models for real world problems that exhibit exponential behavior such as half-life and compound interest (HSF.LE.A.1c) 9.4 Create an equation to model data with an exponential curve of best fit, using technology (HSS.ID.B.6a) (HSA.CED.A.2) 9.5 Compare the differences of exponential, linear, and quadratic functions (HSF.LE.A.1) (HSF.LE.A.3) Enduring Understandings Essential Questions
• Exponential functions grow by a constant factor over equal intervals
• Exponential growth functions occur in real world situations, such as compound interest
• Exponential decay models occur in real world situations, such as half-life
• When comparing an exponential model with a linear model, the question is not if the exponential model will generate very large or very small inputs, but rather when.
• What characterizes exponential growth and decay?
• What are real world models of exponential growth and decay?
• How can one differentiate an exponential model from a linear model given a real world data set?
Common Core State Standards Explanations and Examples
HSF.BF.A.2. Write ... geometric sequences both recursively and with an explicit formula, use them to model situations, and translate between the two forms.*
HSF.LE.A.1 Distinguish between situations that can be modeled with linear functions [and with exponential functions]. a. Prove that … exponential functions grow by equal factors over equal intervals.
HSF.LE.A.1c Recognize situations in which a quantity grows or decays by a constant percent rate per unit interval relative to another.
Students can investigate functions and graphs modeling different situations involving simple and compound interest. Students can compare interest rates with different periods of compounding (monthly, daily) and compare them with the corresponding annual percentage rate. Spreadsheets and applets can be used to explore and model different interest rates and loan terms.
Algebra 1 (Honors, Level 1 and Level 2 Page 30 of 35
Common Core State Standards Explanations and Examples
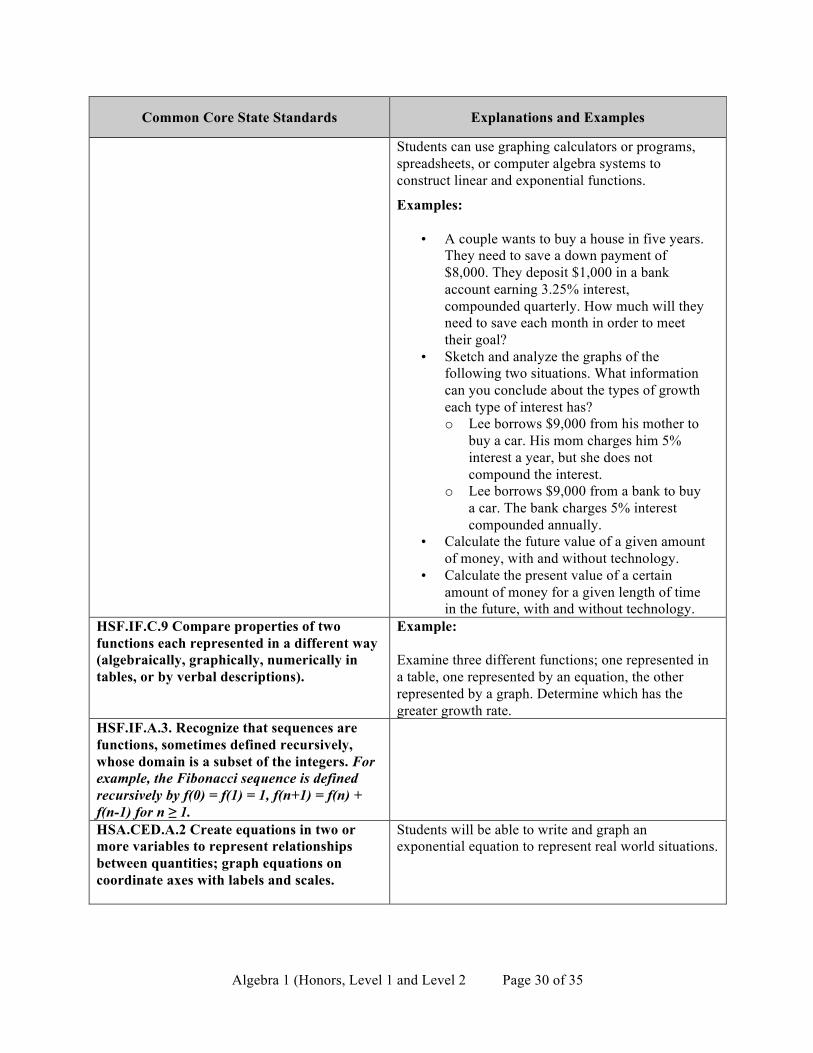
Students can use graphing calculators or programs, spreadsheets, or computer algebra systems to construct linear and exponential functions.
Examples:
• A couple wants to buy a house in five years. They need to save a down payment of $8,000. They deposit $1,000 in a bank account earning 3.25% interest, compounded quarterly. How much will they need to save each month in order to meet their goal?
• Sketch and analyze the graphs of the following two situations. What information can you conclude about the types of growth each type of interest has? o Lee borrows $9,000 from his mother to
buy a car. His mom charges him 5% interest a year, but she does not compound the interest.
o Lee borrows $9,000 from a bank to buy a car. The bank charges 5% interest compounded annually.
• Calculate the future value of a given amount of money, with and without technology.
• Calculate the present value of a certain amount of money for a given length of time in the future, with and without technology.
HSF.IF.C.9 Compare properties of two functions each represented in a different way (algebraically, graphically, numerically in tables, or by verbal descriptions).
Example: Examine three different functions; one represented in a table, one represented by an equation, the other represented by a graph. Determine which has the greater growth rate.
HSF.IF.A.3. Recognize that sequences are functions, sometimes defined recursively, whose domain is a subset of the integers. For example, the Fibonacci sequence is defined recursively by f(0) = f(1) = 1, f(n+1) = f(n) + f(n-1) for n ≥ 1.
HSA.CED.A.2 Create equations in two or more variables to represent relationships between quantities; graph equations on coordinate axes with labels and scales.
Students will be able to write and graph an exponential equation to represent real world situations.
Algebra 1 (Honors, Level 1 and Level 2 Page 31 of 35
Common Core State Standards Explanations and Examples
HSF.IF.B.4 For a function that models a relationship between two quantities, interpret key features of graphs and tables in terms of the quantities, and sketch graphs showing key features given a verbal description of the relationship. Key features include: intercepts; intervals where the function is increasing, decreasing, positive, or negative; relative maximums and minimums; symmetries; end behavior; and periodicity.
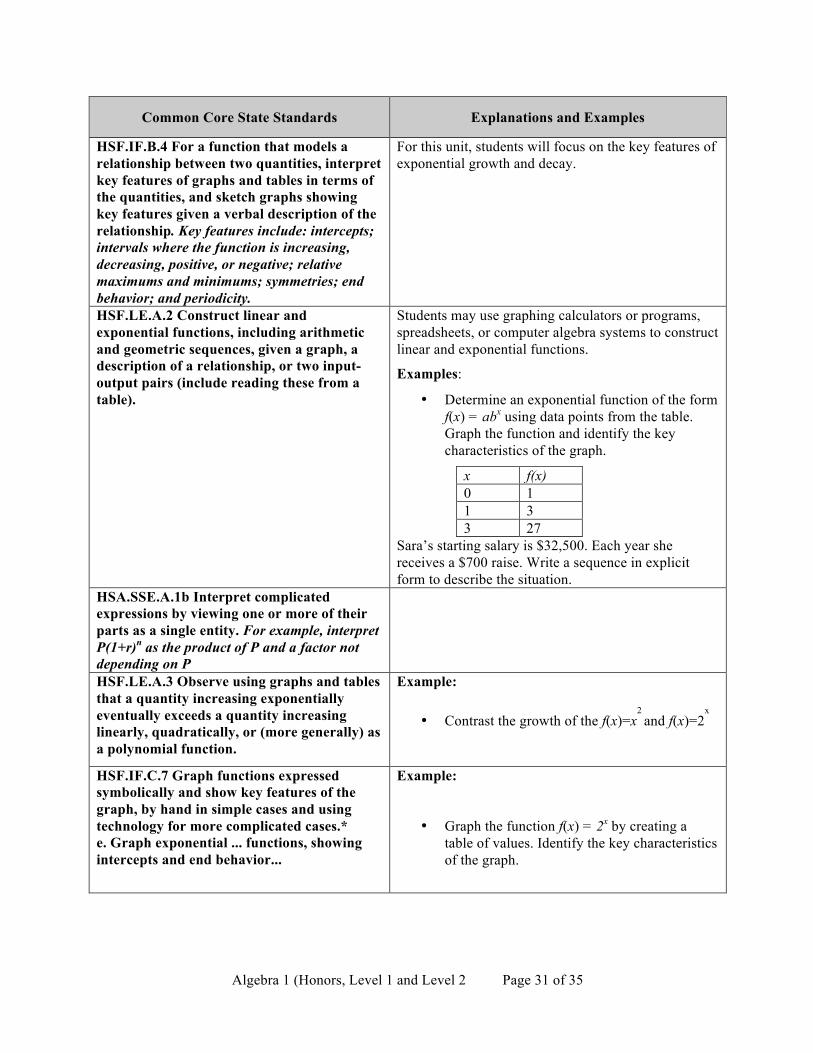
For this unit, students will focus on the key features of exponential growth and decay.
HSF.LE.A.2 Construct linear and exponential functions, including arithmetic and geometric sequences, given a graph, a description of a relationship, or two input-output pairs (include reading these from a table).
Students may use graphing calculators or programs, spreadsheets, or computer algebra systems to construct linear and exponential functions.
Examples:
• Determine an exponential function of the form f(x) = abx using data points from the table. Graph the function and identify the key characteristics of the graph.
x f(x) 0 1 1 3 3 27
Sara’s starting salary is $32,500. Each year she receives a $700 raise. Write a sequence in explicit form to describe the situation.
HSA.SSE.A.1b Interpret complicated expressions by viewing one or more of their parts as a single entity. For example, interpret P(1+r)n as the product of P and a factor not depending on P
HSF.LE.A.3 Observe using graphs and tables that a quantity increasing exponentially eventually exceeds a quantity increasing linearly, quadratically, or (more generally) as a polynomial function.
Example:
• Contrast the growth of the f(x)=x2 and f(x)=2
x
HSF.IF.C.7 Graph functions expressed symbolically and show key features of the graph, by hand in simple cases and using technology for more complicated cases.* e. Graph exponential ... functions, showing intercepts and end behavior...
Example:
• Graph the function f(x) = 2x by creating a table of values. Identify the key characteristics of the graph.

Algebra 1 (Honors, Level 1 and Level 2 Page 32 of 35
Common Core State Standards Explanations and Examples
HSF.IF.C.8b. Use the properties of exponents to interpret expressions for exponential functions.
For example, identify percent rate of change in functions such as y = (1.02) t, y = (0.97)t, y = (1.01) 12t, y = (1.2) (t/10), and classify them as representing exponential functions.
HSF.LE.B.5 Interpret the parameters in a ... exponential function in terms of a context.
HSS.ID.B.6a Fit a function to the data; use functions fitted to data to solve problems in the context of the data. Use given functions or choose a function suggested by the context. Emphasize linear, quadratic, and exponential models
Students will examine patterns in bivariate data and use technology to write the equation for the line of best fit.
HSS.ID.B.6b Informally assess the fit of a function by plotting and analyzing residuals
Instructional Support Materials
• Graphing Calculator • Teaching tablet/ smart pen technology • Electronic textbook resources • Other supplemental resources as necessary
Suggested Instructional Strategies
• Modeling • Direct instruction • Guided practice • Interactive models • Differentiated tasks • Electronic demonstrations • Cooperative learning
Suggested Assessment Methods
• Pre-assessments • Quizzes • Unit tests • Performance tasks • School-wide rubrics • Common summative assessments (midterm and final)
Algebra 1 (Honors, Level 1 and Level 2 Page 33 of 35
Unit 10: Descriptive Statistics Time Frame: 2 weeks Objectives (knowledge and skills) (Show link to standards in parenthesis after objective) The student will: 10.1 Use statistics methods to compute and compare the center and spread of two or more different data
sets (HSS.ID.A.2) 10.2 Represent data graphically (HSS.ID.A.1) 10.3 Summarize categorical data in two-way tables (HSS.ID.B.5)
• Interpret relative frequencies in the context of the data 10.4 Interpret difference in shape, center, and spread in the context of the data sets, and discuss the
possible effects of outliers (HSS.ID.A.3) Enduring Understandings Essential Questions
• Exploratory analysis of data makes use of graphical and numerical techniques to study patterns.
• The skew of the data determines which measure of central tendency is most appropriate
• What interpretations can be made from an organized set of data?
• What organizational strategy provides the best representation of data?
Common Core State Standards Explanations and Examples
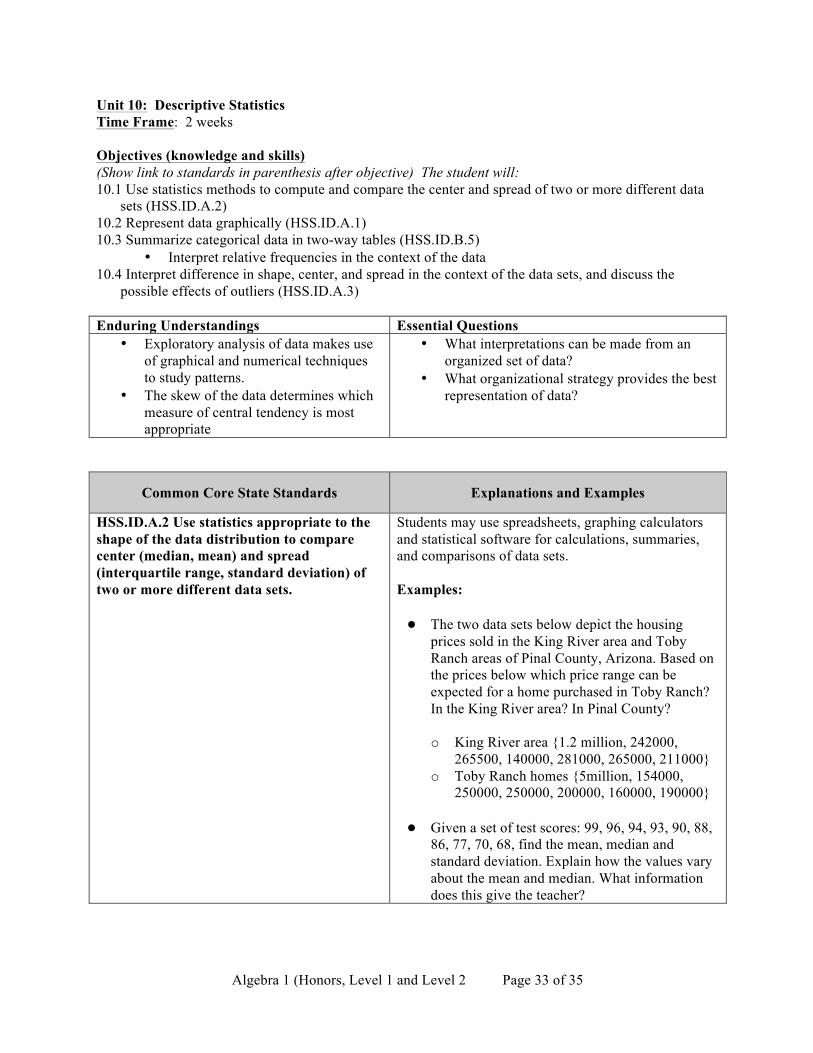
HSS.ID.A.2 Use statistics appropriate to the shape of the data distribution to compare center (median, mean) and spread (interquartile range, standard deviation) of two or more different data sets.
Students may use spreadsheets, graphing calculators and statistical software for calculations, summaries, and comparisons of data sets. Examples: ● The two data sets below depict the housing
prices sold in the King River area and Toby Ranch areas of Pinal County, Arizona. Based on the prices below which price range can be expected for a home purchased in Toby Ranch? In the King River area? In Pinal County?
o King River area {1.2 million, 242000,
265500, 140000, 281000, 265000, 211000} o Toby Ranch homes {5million, 154000,
250000, 250000, 200000, 160000, 190000} ● Given a set of test scores: 99, 96, 94, 93, 90, 88,
86, 77, 70, 68, find the mean, median and standard deviation. Explain how the values vary about the mean and median. What information does this give the teacher?
Algebra 1 (Honors, Level 1 and Level 2 Page 34 of 35
Common Core State Standards Explanations and Examples
HSS.ID.A.1 Represent data with plots on the real number line (dot plots, histograms, and box plots.
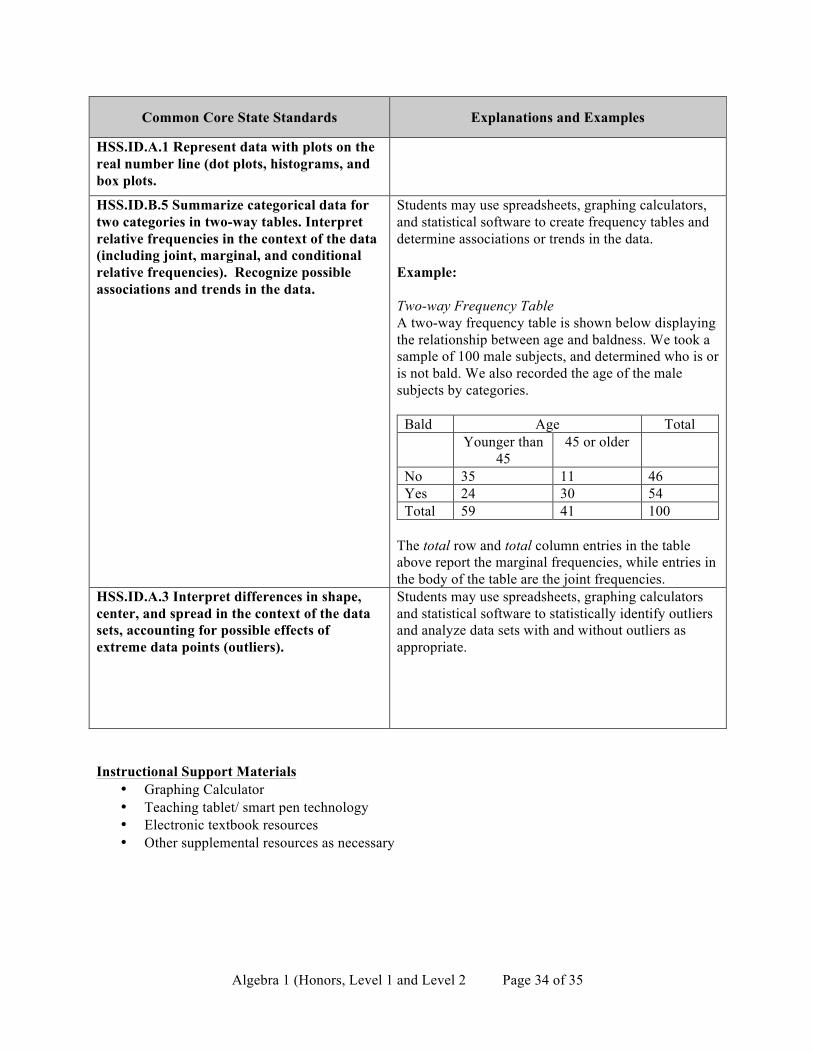
HSS.ID.B.5 Summarize categorical data for two categories in two-way tables. Interpret relative frequencies in the context of the data (including joint, marginal, and conditional relative frequencies). Recognize possible associations and trends in the data.
Students may use spreadsheets, graphing calculators, and statistical software to create frequency tables and determine associations or trends in the data. Example: Two-way Frequency Table A two-way frequency table is shown below displaying the relationship between age and baldness. We took a sample of 100 male subjects, and determined who is or is not bald. We also recorded the age of the male subjects by categories.
Bald Age Total Younger than
45 45 or older
No 35 11 46 Yes 24 30 54 Total 59 41 100
The total row and total column entries in the table above report the marginal frequencies, while entries in the body of the table are the joint frequencies.
HSS.ID.A.3 Interpret differences in shape, center, and spread in the context of the data sets, accounting for possible effects of extreme data points (outliers).
Students may use spreadsheets, graphing calculators and statistical software to statistically identify outliers and analyze data sets with and without outliers as appropriate.
Instructional Support Materials
• Graphing Calculator • Teaching tablet/ smart pen technology • Electronic textbook resources • Other supplemental resources as necessary
Algebra 1 (Honors, Level 1 and Level 2 Page 35 of 35
Suggested Instructional Strategies
• Modeling • Direct instruction • Guided practice • Interactive models • Differentiated tasks • Electronic demonstrations • Cooperative learning
Suggested Assessment Methods
• Pre-assessments • Quizzes • Unit tests • Performance tasks • School-wide rubrics • Common summative assessments (midterm and final)