Embed Size (px)
Citation preview
THE SEARS TOWER
A CASE STUDY OF THE DEVELOPMENT, RE-FINANCINGS AND SALE OF NORTH AMERICA’S TALLEST BUILDING
Students: Ben Bove, Aristithis Loukas, Rich McPhillips, Eddie Meder, Kevin Merchant, Agustin Rizo, Greg Trimmer, Susan Weaver, Neal White, and John Wilbeck. Faculty Member: Joseph L. Pagliari, Jr.
January 1, 2007
This case study has been prepared solely for purposes of class discussion. It should not be construed as a judgment about or endorsement of any particular business matter. Moreover, the information contained herein has been obtained from sources we believe to be reliable; however, we make no representation or warranty as to their accuracy.
The Sears Tower January 1, 2007
I. Executive Summary ............................................................................................................. 1 II. Overview of The Sears Tower ............................................................................................ 3
Background of Sears & Roebuck Co........................................................................................ 3Sears Consolidates Chicago Operations ................................................................................. 3 Tower Construction & Architectural Significance ................................................................ 4Retail Industry Background in the 1970s - 1980s.................................................................. 9Sears Encounters Hard Times and Decides to Leave the Tower ............................................ 9Sears Relocates its Headquarters .......................................................................................... 13
III. A Series of Tower Refinancings (1990-2003) .................................................................. 15The MetLife / AEW Years .................................................................................................... 16The MetLife / Trizec Years ................................................................................................... 21September 11, 2001............................................................................................................... 23Trizec Decides to Exit the Sears Tower ................................................................................ 27The MetLife Years................................................................................................................. 29MetLife’s Decision to Purchase the Sears Tower ................................................................. 30 MetLife’s Decision to Sell the Sears Tower .......................................................................... 30
IV. Joseph Chetrit and Company Acquire the Sears Tower .............................................. 32 Valuation of the Tower in 2004 ............................................................................................ 32 Aggressive Financing Leads to Sky High Prices & Emergence of Private Buyers ............. 36 Chetrit Group Wins the Deal ............................................................................................... 37 The CMBS Market Provides the Fuel................................................................................... 39The Sears Tower Today (2006) ............................................................................................. 50 The State of the Office Market .............................................................................................. 53Repositioning Possibilities for the Sears Tower.................................................................... 57
V. Conclusion .......................................................................................................................... 61VI. Case Questions ................................................................................................................... 62 VII. Acknowledgments ............................................................................................................. 66 VIII. Appendices ......................................................................................................................... 68

1
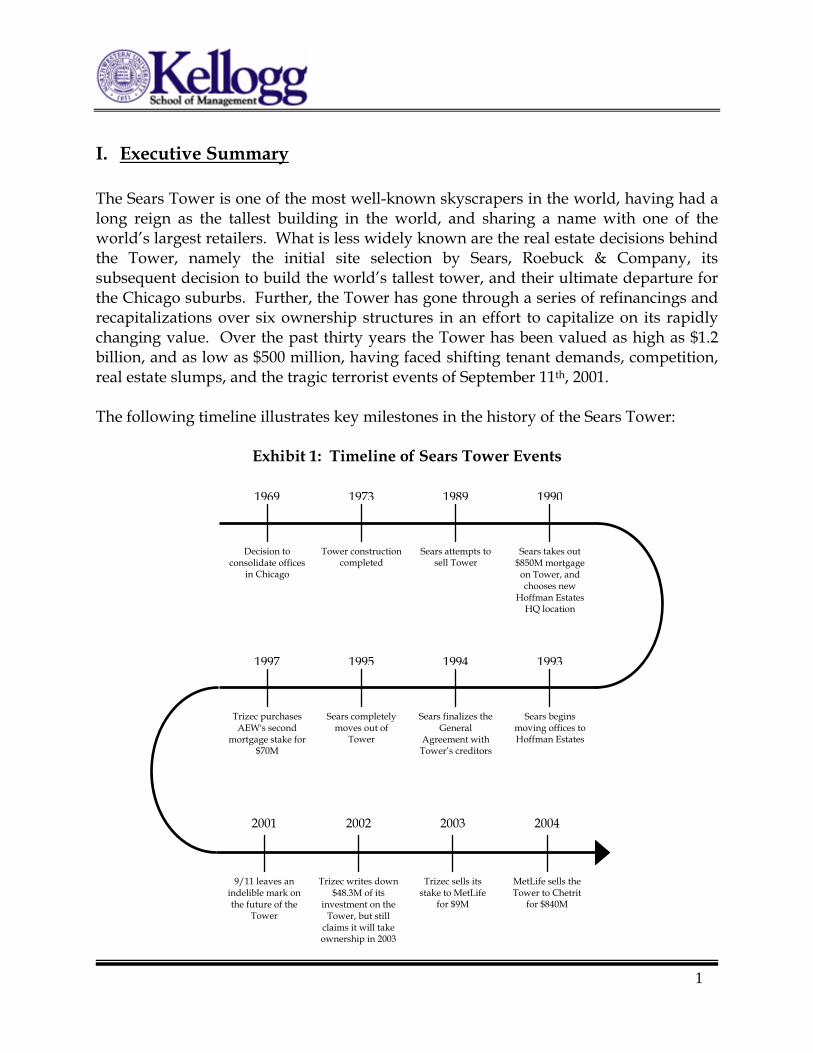
I. Executive Summary The Sears Tower is one of the most well-known skyscrapers in the world, having had a long reign as the tallest building in the world, and sharing a name with one of the world’s largest retailers. What is less widely known are the real estate decisions behind the Tower, namely the initial site selection by Sears, Roebuck & Company, its subsequent decision to build the world’s tallest tower, and their ultimate departure for the Chicago suburbs. Further, the Tower has gone through a series of refinancings and recapitalizations over six ownership structures in an effort to capitalize on its rapidly changing value. Over the past thirty years the Tower has been valued as high as $1.2 billion, and as low as $500 million, having faced shifting tenant demands, competition, real estate slumps, and the tragic terrorist events of September 11th, 2001. The following timeline illustrates key milestones in the history of the Sears Tower:
Exhibit 1: Timeline of Sears Tower Events
Sears takes out $850M mortgage
on Tower, and chooses new
Hoffman Estates HQ location
Sears attempts to sell Tower
Tower construction completed
Decision to consolidate offices
in Chicago
1990 1989 1973 1969
Sears begins moving offices to Hoffman Estates
Sears finalizes the General
Agreement with Tower’s creditors
Sears completely moves out of
Tower
Trizec purchases AEW's second
mortgage stake for $70M
1993 1994 1995 1997
MetLife sells the Tower to Chetrit
for $840M
Trizec sells its stake to MetLife
for $9M
Trizec writes down $48.3M of its
investment on the Tower, but still
claims it will take ownership in 2003
9/11 leaves an indelible mark on the future of the
Tower
2004 2003 2002 2001
The Sears Tower January 1, 2007
As one of fastest-growing retailers of the 20th century, Sears, Roebuck and Company had an impressive need for space and a desire to consolidate its vast operations under one roof. Several sites in Illinois were considered and Sears quickly settled on 233 South Wacker Drive for its convenience to major transportation nodes and widespread city support. Skidmore, Owings & Merrill were retained as architects and created a flexible, yet open design based on a “megamodule” system of structural tubes. Sears presence at the Tower, however, was short lived; in 1990, Sears moved to a new headquarters complex in Hoffman Estates, a suburb outside of Chicago. Unable to find a buyer to purchase the Tower during the late 1980s, Sears instead leveraged the value of the Tower and borrowed $850 million in 1990, thereby injecting cash into its balance sheet. In 1994, Sears entered into a complex financial arrangement transferring effective control of the Tower to its creditors MetLife ($600 million first mortgage loan) and AEW ($250 million second mortgage loan). Between 1997 and 2003, TrizecHahn – which had acquired AEW’s interest – attempted to buy a controlling stake in the Tower but reversed course due to the economic downturn after September 11, 2001. Subsequently, Trizec sold its position to MetLife. After serving as the primary loan note holder for the past 13 years, MetLife now had full control of the Tower. In 2004, MetLife sold the Tower to a small investor group led by Joseph Chetrit for $840 million. In a great twist of irony, Chetrit’s financing package ($600 million in first-mortgage financing and $225 million in mezzanine financing) looks eerily similar to the financing package supplied by MetLife and AEW nearly 15 years earlier. Fueling the purchase was a combination of historically low interest rates and an aggressive lending environment. Chetrit was able to secure an interest-only loan covering 93% of the purchase price of the Tower. As of the date of this writing, Chetrit is reportedly looking to refinance the Tower, using a combination of outside equity and a fixed-rate loan. Despite the Tower’s turbulent history, an impressive rent roll, a desirable Chicago CBD location, a design well ahead of its time and a perceived premier status have made the Tower an attractive acquisition for investors since it was built. What does the future hold for the Tower? There are several key questions that must be considered in the context of the Chicago office market and national investment trends. They include: Will the Chetrit acquisition of the Tower prove financially viable? Will lenders remain as aggressive? Will the Tower be repositioned for another purpose or kept as primarily office space?
2
3
II. Overview of The Sears Tower
Background of Sears & Roebuck Co. 1
Sears, Roebuck & Company (“Sears”) was formed in 1893 as a mail-order watch company in Chicago, Illinois, and was the innovative idea of Richard Sears, a railway station agent from Minneapolis, Minnesota. Early on, Sears and his partner, Alvah C. Roebuck, recognized that there was a lucrative market to sell general merchandise using a mail-order business model. At this time, the United States was largely an agricultural economy. Rural farmers primarily bought their goods at the local general store and, since little competition existed in these locations, were often faced with intolerably high markups on the items they purchased. By purchasing goods in bulk to take advantage of volume discounts, Sears utilized the rail and postal systems to deliver goods to rural customers at prices well below those of the local general stores. Sears’ mail order business took off. Sales reached $400,000 by 1893, and surpassed $750,000 by 1895. The company began producing a general merchandise catalog with over 500 pages offering items ranging from shoes, women's garments and china to firearms, furniture and buggies. As Sears expanded, they leased various buildings throughout Chicago. By 1906, they constructed a 40-acre, $5 million2, 3 million square foot mail-order plant and office building on Chicago's West Side. At that time, it was the largest commercial building in the world.
Sears Consolidates Chicago Operations
Sears’ continued success led to the expansion of its offices and retail stores nationwide as well as internationally. In December 1967, Sears, Roebuck & Co reached $1 billion of sales in a single month, a new record for Sears. By 1969, Sears earned $8.9 billion in annual sales up from $8.2 billion the year prior, thus breaking its own sales record for 15 consecutive years. That same year, the company’s management, under the direction of Chairman Gordon Metcalf and President Arthur Wood, decided to consolidate its Chicago office locations into one building. The company had an immediate need for approximately 3 million square feet of space and wanted to ensure it would have room to expand in the future. Rumors circulated about where the new headquarters would be. Sears had previously moved its Allstate Insurance division to Northbrook, Illinois, a northern suburb of Chicago. Speculation came to an end in April 1969, when Sears named Cushman and
1 Sears Archives. Sears, Roebuck & Co. 23 May 2006 <www.searsarchives.com/history/history1887.htm>. 2 Adjusted for inflation, this expenditure would have roughly equaled $100 million in today’s dollars.
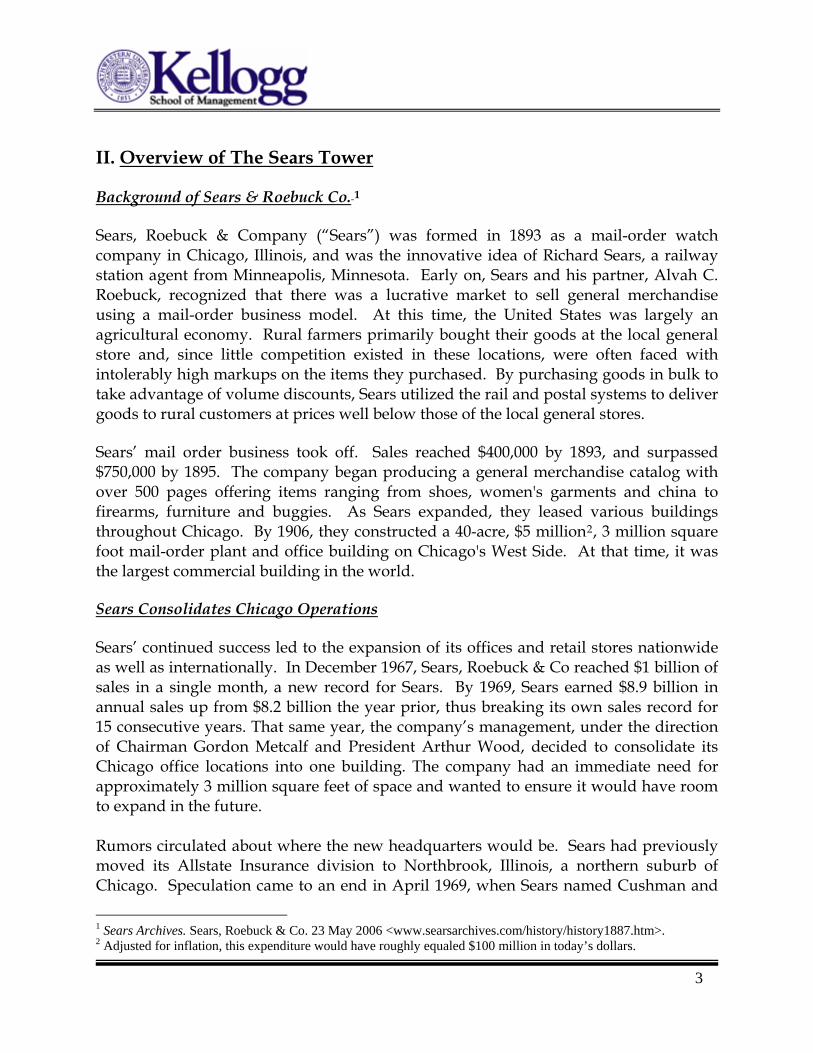
The Sears Tower January 1, 2007 Wakefield, Inc. as the developer of its new headquarters at 233 South Wacker Drive in Chicago’s West Loop, as shown in Exhibit 2. The site provided easy access to public transportation including suburban commuter trains and the city’s elevated trains, as well as several major expressways. Building the Tower in Chicago helped combat the downtown’s downtrodden image (partially caused by the loss of manufacturing companies), strengthened the city’s tax base, and stimulated additional office construction in the Loop.3 A disadvantage of this site was that the City of Chicago had to vacate Quincy Street between Franklin and Wacker Streets.4
Exhibit 2: Map of Downtown Chicago
Tower Construction & Architectural Significance
The design of the Tower was a culmination of careful planning for the current and future needs of Sears as well as the imaginative creativity of the architects at Skidmore, Owings & Merrill (SOM). Guided by the Mies van der Rohe mantra of “less is more,” lead architect Bruce Graham and structural engineer Fazlur Khan designed the Tower to minimize material costs and structural impediments and maximize the number of windows and corner offices. Khan devised the idea of a building constructed of nine
3 “The Sears Tower and Chicago’s Future,” Chicago Tribune, 29 July 1970: 12.
4
4 See Appendix 1for more detail.
5
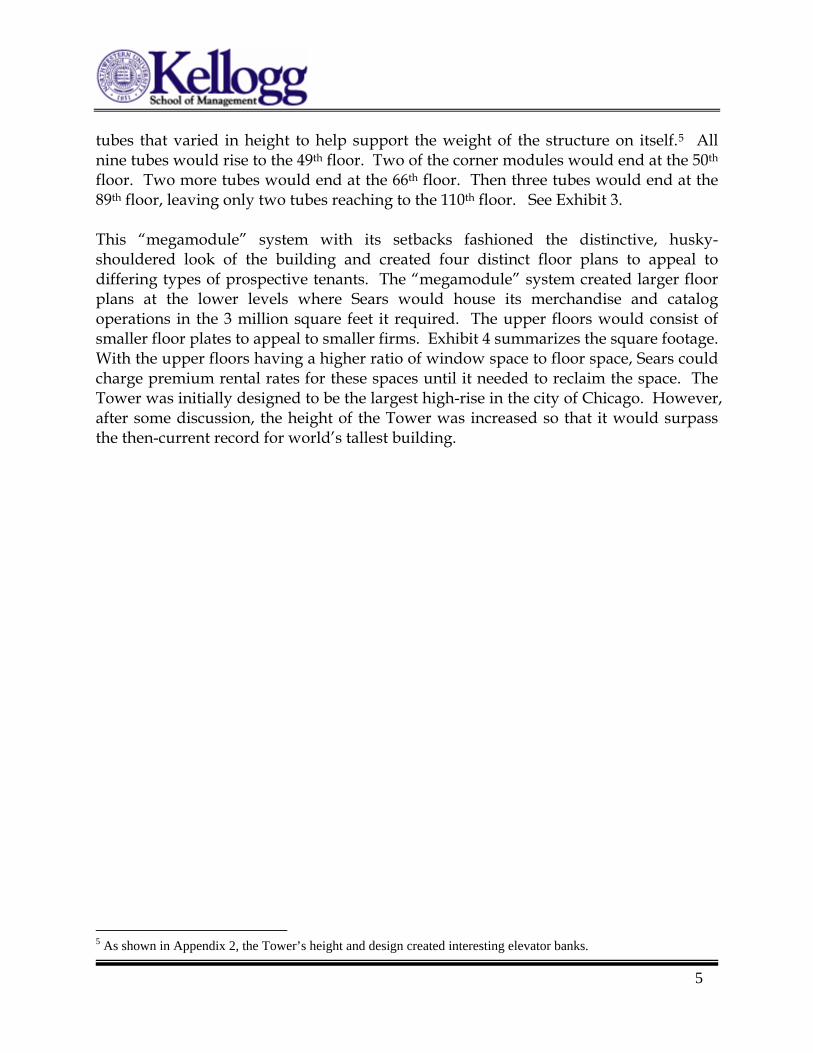
tubes that varied in height to help support the weight of the structure on itself.5 All nine tubes would rise to the 49th floor. Two of the corner modules would end at the 50th floor. Two more tubes would end at the 66th floor. Then three tubes would end at the 89th floor, leaving only two tubes reaching to the 110th floor. See Exhibit 3. This “megamodule” system with its setbacks fashioned the distinctive, husky-shouldered look of the building and created four distinct floor plans to appeal to differing types of prospective tenants. The “megamodule” system created larger floor plans at the lower levels where Sears would house its merchandise and catalog operations in the 3 million square feet it required. The upper floors would consist of smaller floor plates to appeal to smaller firms. Exhibit 4 summarizes the square footage. With the upper floors having a higher ratio of window space to floor space, Sears could charge premium rental rates for these spaces until it needed to reclaim the space. The Tower was initially designed to be the largest high-rise in the city of Chicago. However, after some discussion, the height of the Tower was increased so that it would surpass the then-current record for world’s tallest building.
5 As shown in Appendix 2, the Tower’s height and design created interesting elevator banks.
The Sears Tower January 1, 2007
Exhibit 3: Sears Tower Floor Plans
6
7
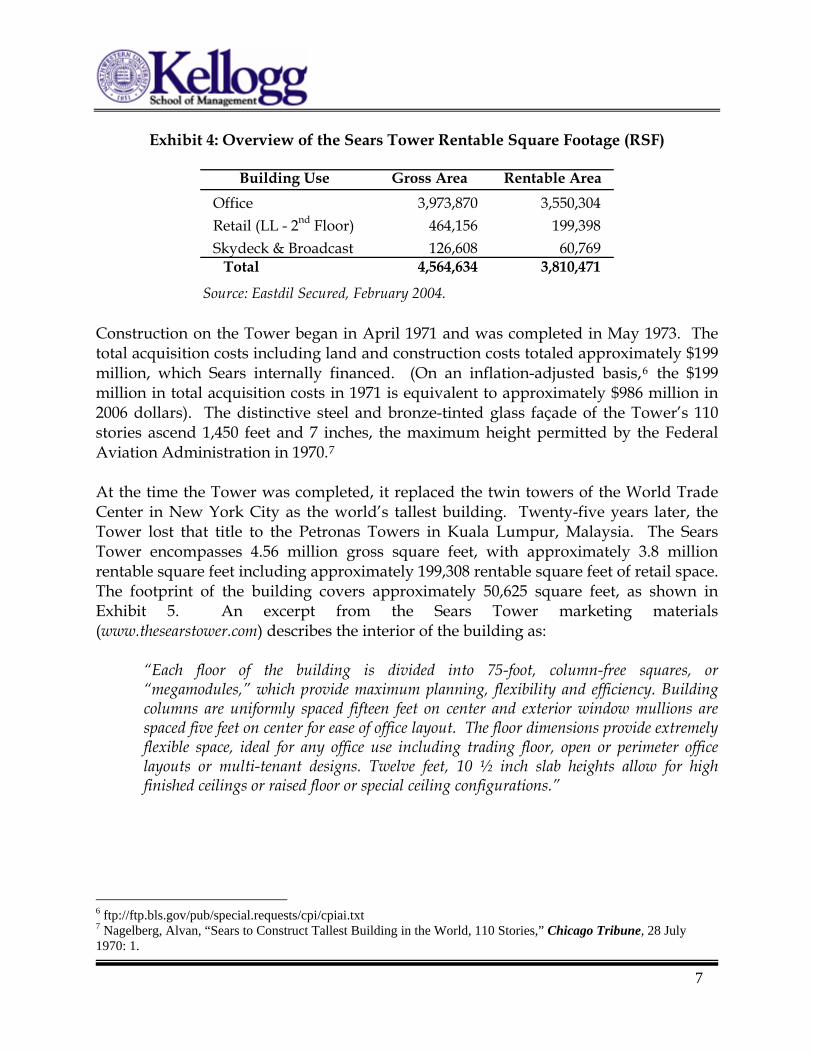
Exhibit 4: Overview of the Sears Tower Rentable Square Footage (RSF)
Building Use Gross Area Rentable AreaOffice 3,973,870 3,550,304Retail (LL - 2nd Floor) 464,156 199,398Skydeck & Broadcast 126,608 60,769
Total 4,564,634 3,810,471
Source: Eastdil Secured, February 2004. Construction on the Tower began in April 1971 and was completed in May 1973. The total acquisition costs including land and construction costs totaled approximately $199 million, which Sears internally financed. (On an inflation-adjusted basis,6 the $199 million in total acquisition costs in 1971 is equivalent to approximately $986 million in 2006 dollars). The distinctive steel and bronze-tinted glass façade of the Tower’s 110 stories ascend 1,450 feet and 7 inches, the maximum height permitted by the Federal Aviation Administration in 1970.7 At the time the Tower was completed, it replaced the twin towers of the World Trade Center in New York City as the world’s tallest building. Twenty-five years later, the Tower lost that title to the Petronas Towers in Kuala Lumpur, Malaysia. The Sears Tower encompasses 4.56 million gross square feet, with approximately 3.8 million rentable square feet including approximately 199,308 rentable square feet of retail space. The footprint of the building covers approximately 50,625 square feet, as shown in Exhibit 5. An excerpt from the Sears Tower marketing materials (www.thesearstower.com) describes the interior of the building as:
“Each floor of the building is divided into 75-foot, column-free squares, or “megamodules,” which provide maximum planning, flexibility and efficiency. Building columns are uniformly spaced fifteen feet on center and exterior window mullions are spaced five feet on center for ease of office layout. The floor dimensions provide extremely flexible space, ideal for any office use including trading floor, open or perimeter office layouts or multi-tenant designs. Twelve feet, 10 ½ inch slab heights allow for high finished ceilings or raised floor or special ceiling configurations.”
6 ftp://ftp.bls.gov/pub/special.requests/cpi/cpiai.txt 7 Nagelberg, Alvan, “Sears to Construct Tallest Building in the World, 110 Stories,” Chicago Tribune, 28 July 1970: 1.
The Sears Tower January 1, 2007
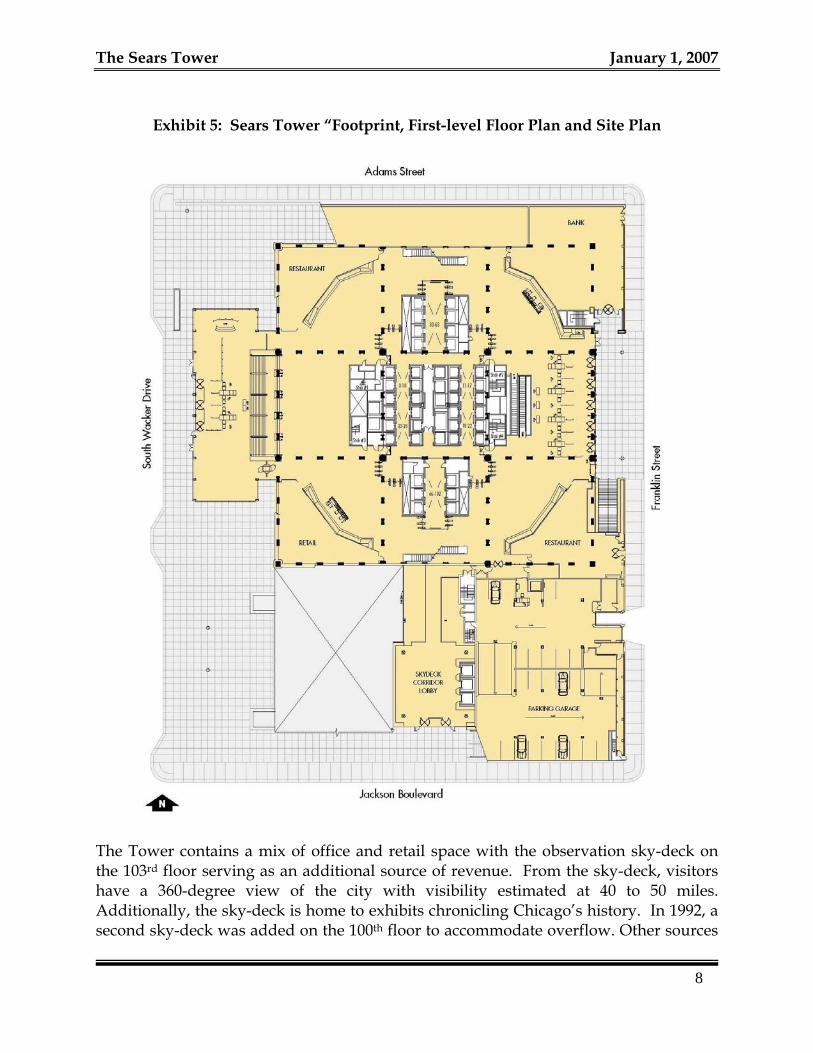
Exhibit 5: Sears Tower “Footprint, First-level Floor Plan and Site Plan
The Tower contains a mix of office and retail space with the observation sky-deck on the 103rd floor serving as an additional source of revenue. From the sky-deck, visitors have a 360-degree view of the city with visibility estimated at 40 to 50 miles. Additionally, the sky-deck is home to exhibits chronicling Chicago’s history. In 1992, a second sky-deck was added on the 100th floor to accommodate overflow. Other sources
8
9
of revenue include a 160-car underground parking garage below the building as well as easement rights to 810 parking spaces (out of 950 total) in the Franklin Street Garage located across from the east side of the building.
Retail Industry Background in the 1970s - 1980s
In the early to mid 1970s, the U.S. experienced slowing retail sales due to increasing joblessness. The country entered an economic recession in 1973, its first since the end of World War II. At this time, retailers were receiving mixed signals. Reports of increasing retail sales bolstered executive’s confidence to build inventories in one month; then, slowing sales would cause retail management to invoke aggressive price-reduction strategies to trim inventory levels in the next month. Inflation grew to 12% between 1974 and 1975 while retail sales only increased by 7%.8 The US economy recovered from the recession in 1976, but by 1979, consumer spending decreased as energy costs increased. Consumers again felt the effects of price inflation, which brought on another recession in the early 1980s. The 1980s also brought with it a new retail culture. Specialty retailers led the economic recovery for the retail sector, posting higher sales and earnings increases than the general merchandise department stores. Additionally, discount stores such as K-Mart and Wal-Mart and junior department stores such as Kohl’s challenged the traditional department stores model.
Sears Encounters Hard Times and Decides to Leave the Tower
Sears was losing market share in both its retail stores and its catalog business. Sears’ merchandise group struggled against the big-box discount retail stores. Losing market share to Wal-Mart and others, Sears’ management decided to create its own low-price strategy. However, in sharp contrast to Sears’ original model of integrating low-cost procurement in order to offer low prices, this time around Sears dropped prices before it could secure lower costs from its suppliers. The costs of operating its 82-year-old distribution system were much higher than those, for example, of the leaner Wal-Mart. To help offset deteriorating retail profits, Sears had expanded into the financial services industry to diversify its operations. It added Allstate Insurance, Dean Witter, and Coldwell Banker over the years. The Sears catalog business also lost share to specialty retail catalogs. In 1987, Sears began planning cost-cutting measures, which included trimming marketing budgets
8 Slom, Stanley H. and Rothmyer, Karen, “Reeling Retailers,” The Wall Street Journal. 6 Feb 1975: 1.
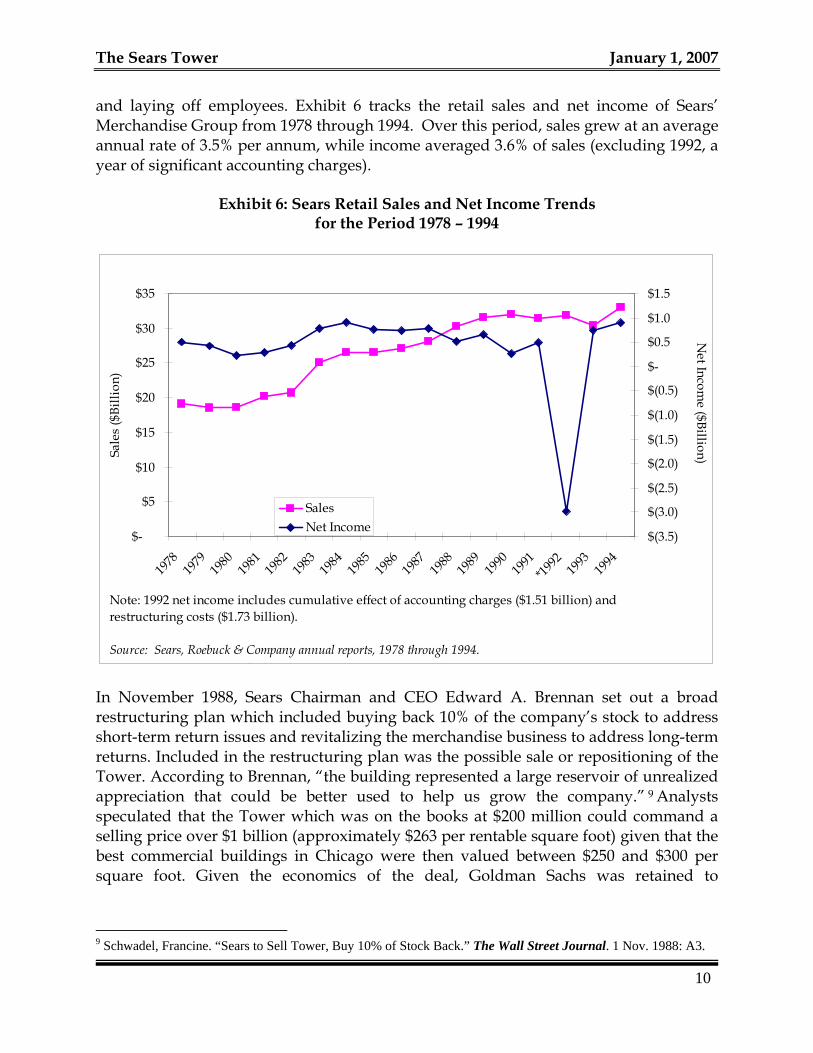
The Sears Tower January 1, 2007 and laying off employees. Exhibit 6 tracks the retail sales and net income of Sears’ Merchandise Group from 1978 through 1994. Over this period, sales grew at an average annual rate of 3.5% per annum, while income averaged 3.6% of sales (excluding 1992, a year of significant accounting charges).
Exhibit 6: Sears Retail Sales and Net Income Trends
for the Period 1978 – 1994
$-
$5
$10
$15
$20
$25
$30
$35
1978
1979
1980
1981
1982
1983
1984
1985
1986
1987
1988
1989
1990
1991
*1992 19
9319
94
Sale
s ($
Billi
on)
$(3.5)
$(3.0)
$(2.5)
$(2.0)
$(1.5)
$(1.0)
$(0.5)
$-
$0.5
$1.0
$1.5
Net Incom
e ($Billion)
SalesNet Income
N
Note: 1992 net income includes cumulative effect of accounting charges ($1.51 billion) and restructuring costs ($1.73 billion).
Source: Sears, Roebuck & Company annual reports, 1978 through 1994.
In November 1988, Sears Chairman and CEO Edward A. Brennan set out a broad restructuring plan which included buying back 10% of the company’s stock to address short-term return issues and revitalizing the merchandise business to address long-term returns. Included in the restructuring plan was the possible sale or repositioning of the Tower. According to Brennan, “the building represented a large reservoir of unrealized appreciation that could be better used to help us grow the company.” 9 Analysts speculated that the Tower which was on the books at $200 million could command a selling price over $1 billion (approximately $263 per rentable square foot) given that the best commercial buildings in Chicago were then valued between $250 and $300 per square foot. Given the economics of the deal, Goldman Sachs was retained to
10
9 Schwadel, Francine. “Sears to Sell Tower, Buy 10% of Stock Back.” The Wall Street Journal. 1 Nov. 1988: A3.
11
orchastrate the sale of the Sears Tower and, shortly thereafter, Toronto-based Olympia & York Developments Ltd. emerged as the primary bidder with a $1.045 billion offer. However, the potential sale of the Tower was tainted by two looming factors. First, as part of its restructuring, Sears planned to relocate all but 600 of its 8,700 employees to a separate (but undetermined) location. This would leave the Tower almost two-thirds vacant and the new owner would be faced with the formidable task of leasing the space soon after its purchase. This task was further hindered by the construction of 1.2 million square feet of office space next door at 311 S. Wacker where developers of this building were reportedly offering concessions of 5 years worth of free rent to lock in tenants for 15 years or more.10 Second, the building had appreciated significantly over the past decade and a half. The sale of the building was sure to trigger a reassessment of the property value, thus significantly increasing the new owner’s real estate taxes. The Wall Street Journal reported that as part of the sales negotiations, Sears was willing to pay Olympia & York rent for six years on the space it would vacate in the Tower.11 However, due to failed negotiations over the Tower’s property-tax burden, Olympia & York withdrew its bid for the Tower in September, 1989. Thereafter, Sears decided instead to refinance the Tower for approximately $850 million in order to procure the money needed for its stock buy-back, which had been initially funded by working capital. The details of the refinancing are discussed in a subsequent section. Exhibit 7 provides a pro forma comparison of selling the building for Olympia & York’s bid at $1.045 billion dollars12 to refinancing the building at $850 million. Our internal estimates suggest that the sale of the building would have resulted in a taxable gain of approximately $900 million, which at the 1989 capital gains tax rate of 28% would have resulted in a $252 million tax liability. With a mortgage amount of $850 million on the Tower, the refinancing would have generated $65 million more in after-tax proceeds for Sears’ immediate redeployment. Refinancing, however, is a tax-deferred solution. The capital gains tax associated with the refinancing would ultimately be due at the point in the future when the Tower is eventually sold. In theory, the tax liability associated with the refinancing could be deferred indefinitely, while preserving the option to sell the Tower at a later date.13 Given Sears’ broad restructuring plan (including a 10% stock
10 Elstrom, Peter J. “Office Glut Sparks Boon for Tenants; Developers Compete in Discount Frenzy.” Crain’s Chicago Business. 20 Aug. 1990: 1. 11 Barsky, Neil. “Edifice Rex: Toronto’s Reichmann Scales the Heights of Real Estate.” The Wall Street Journal. 5 Sept. 1989: A1.12 The break-even sale price (i.e., gross sale price at which the net after-tax proceeds would have equaled the net refinancing proceeds) would have equaled $1.137 billion. 13 The tax liability could be further deferred through the use of §1031 like-kind exchange. Given Sears’ extensive real estate holdings and the nature of its core business, such an exchange would seem quite plausible.
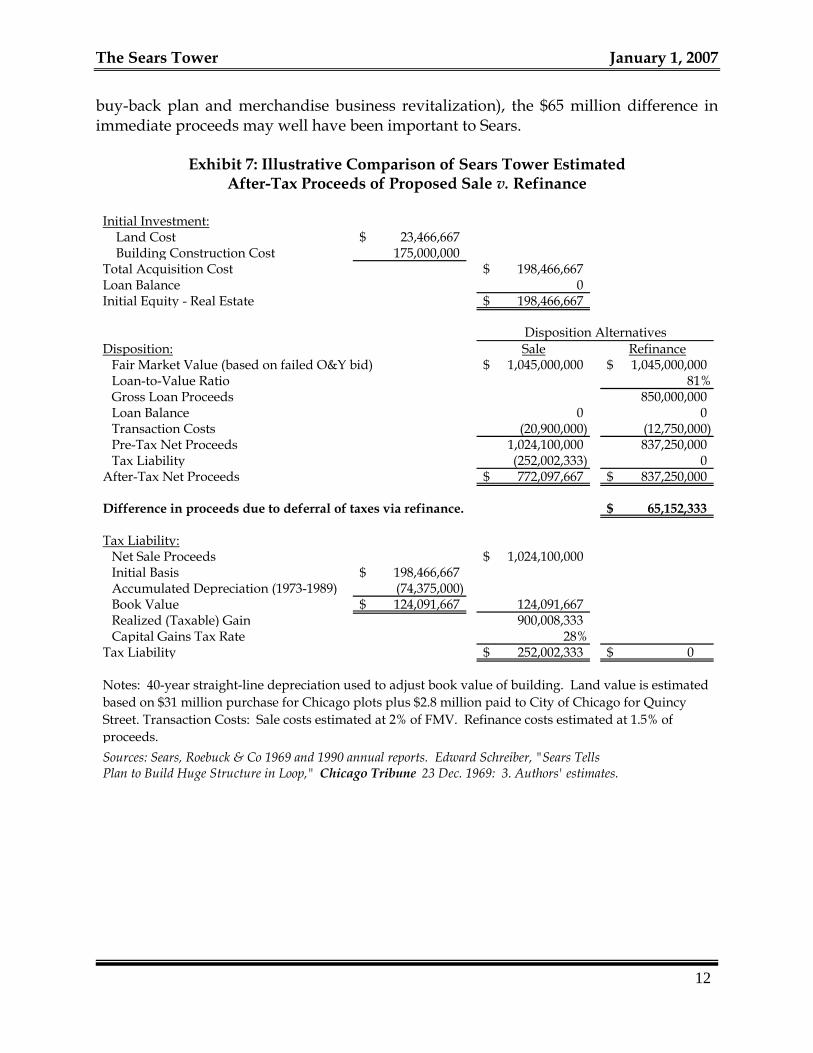
The Sears Tower January 1, 2007 buy-back plan and merchandise business revitalization), the $65 million difference in immediate proceeds may well have been important to Sears.
Exhibit 7: Illustrative Comparison of Sears Tower Estimated
After-Tax Proceeds of Proposed Sale v. Refinance
Initial Investment: Land Cost 23,466,667$ Building Construction Cost 175,000,000 Total Acquisition Cost 198,466,667$ Loan Balance 0Initial Equity - Real Estate 198,466,667$
Disposition: Sale RefinanceFair Market Value (based on failed O&Y bid) 1,045,000,000$ 1,045,000,000$ Loan-to-Value Ratio 81%Gross Loan Proceeds 850,000,000 Loan Balance 0 0Transaction Costs (20,900,000) (12,750,000) Pre-Tax Net Proceeds 1,024,100,000 837,250,000 Tax Liability (252,002,333) 0
After-Tax Net Proceeds 772,097,667$ 837,250,000$
Difference in proceeds due to deferral of taxes via refinance. 65,152,333$
Tax Liability:Net Sale Proceeds 1,024,100,000$ Initial Basis 198,466,667$ Accumulated Depreciation (1973-1989) (74,375,000) Book Value 124,091,667$ 124,091,667 Realized (Taxable) Gain 900,008,333 Capital Gains Tax Rate 28%
Tax Liability 252,002,333$ 0$
Sources: Sears, Roebuck & Co 1969 and 1990 annual reports. Edward Schreiber, "Sears TellsPlan to Build Huge Structure in Loop," Chicago Tribune 23 Dec. 1969: 3. Authors' estimates.
Disposition Alternatives
Notes: 40-year straight-line depreciation used to adjust book value of building. Land value is estimated based on $31 million purchase for Chicago plots plus $2.8 million paid to City of Chicago for Quincy Street. Transaction Costs: Sale costs estimated at 2% of FMV. Refinance costs estimated at 1.5% of proceeds.
12
13
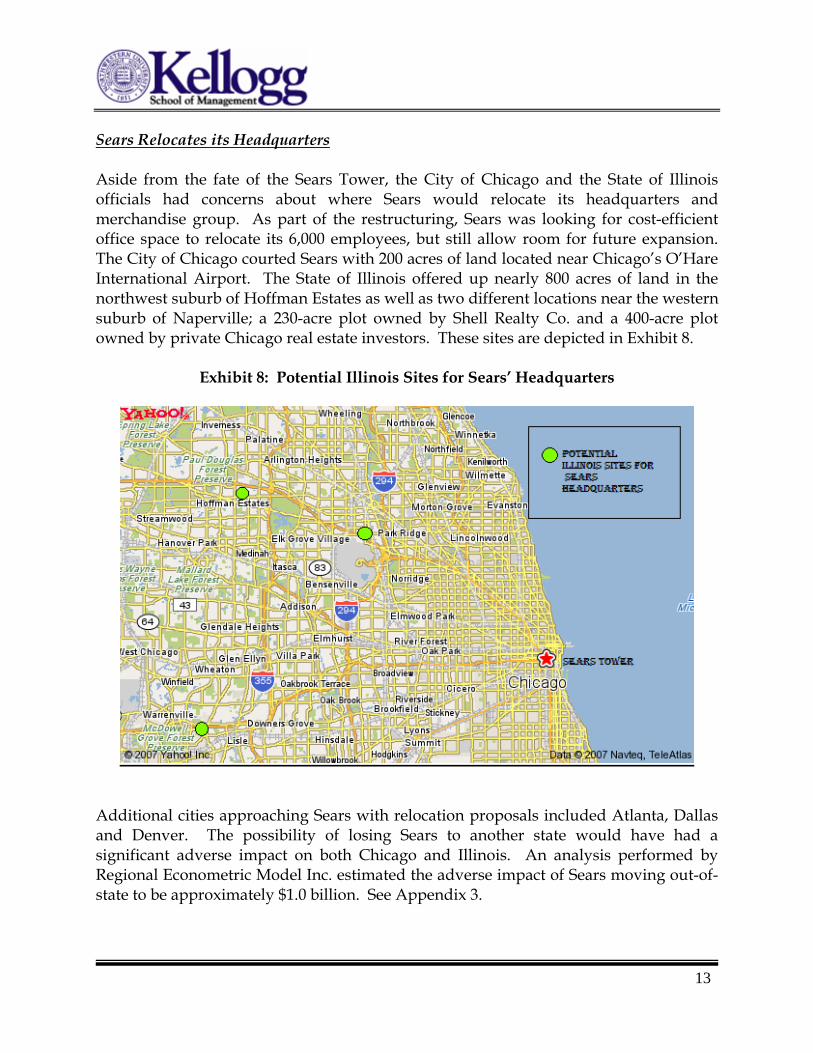
Sears Relocates its Headquarters Aside from the fate of the Sears Tower, the City of Chicago and the State of Illinois officials had concerns about where Sears would relocate its headquarters and merchandise group. As part of the restructuring, Sears was looking for cost-efficient office space to relocate its 6,000 employees, but still allow room for future expansion. The City of Chicago courted Sears with 200 acres of land located near Chicago’s O’Hare International Airport. The State of Illinois offered up nearly 800 acres of land in the northwest suburb of Hoffman Estates as well as two different locations near the western suburb of Naperville; a 230-acre plot owned by Shell Realty Co. and a 400-acre plot owned by private Chicago real estate investors. These sites are depicted in Exhibit 8.
Exhibit 8: Potential Illinois Sites for Sears’ Headquarters
Additional cities approaching Sears with relocation proposals included Atlanta, Dallas and Denver. The possibility of losing Sears to another state would have had a significant adverse impact on both Chicago and Illinois. An analysis performed by Regional Econometric Model Inc. estimated the adverse impact of Sears moving out-of-state to be approximately $1.0 billion. See Appendix 3.
The Sears Tower January 1, 2007 Clearly, the city and state were deeply concerned and highly motivated to accommodate Sears. The Chicago/O’Hare and Hoffman Estates locations were among the frontrunners in the competition for Sears, as the company had its roots in Chicago. The cost of relocating 3,000 salaried employees was estimated around $100 million. The State of Illinois was offering to deem the proposed locations as State Enterprise Zones so that Sears would be exempt of the 5% sales tax on construction materials for its development of the land. Additionally, the State of Illinois pledged $49 million in direct subsidies for land infrastructure and road improvements. (See Appendix 4 for a summary of the Chicago/O’Hare and Hoffman Estates relocation packages).
The City of Chicago offered to purchase an 80-acre plot of land located near O’Hare airport. The City would have leased the land to Sears for a negligible amount ($10 per year) for 99 years. Adjacent to the 80-acre tract of land was a 140-acre plot of land which Sears would have the option to purchase at market prices. Not to be outdone, Illinois state legislature drafted a provision whereby a tax increment financing (TIF) district would be created for the prosperous Hoffman Estates suburb, legislation which at that time was typically reserved for blighted communities. The TIF district designation would allow Hoffman Estates to purchase the land for the potential Sears site by floating tax-exempt long-term bonds. The debt service on the bonds would then be paid by Sears via the incremental property tax increases generated from the real estate development. By January 1990, Sears made its decision to move out of Chicago and relocate its headquarters and Merchandise Group to Hoffman Estates. The two-year move out of the Tower began in 1993, the same year in which Sears discontinued publishing its general merchandise catalog.
14
15
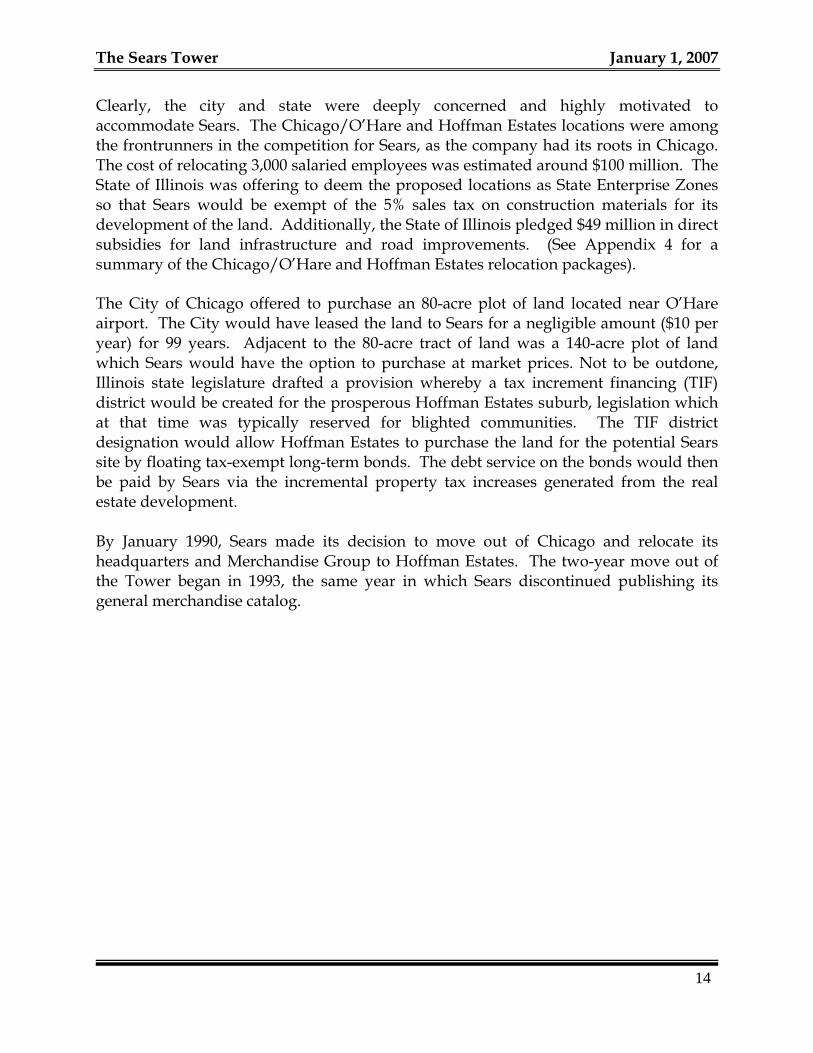
III. A Series of Tower Refinancings (1990-2003) In the 13 years following Sears’ decision to leave Chicago, the Sears Tower underwent numerous revisions to its financing structure and the Tower’s ownership rights changed hands several times. Additionally, as a backdrop to these transformations, both the national and Chicago office markets were going through several boom and bust cycles. This time period also contained an event that indelibly changed the future of skyscrapers in the United States forever: the terrorists’ attacks of September 11, 2001. A brief overview of this turbulent period in the Tower’s history is illustrated below:
Exhibit 9: Book Value of Mortgage Loans as Compared to Estimated
Property Value for the Period 1990 Through 2003
$0
$200
$400
$600
$800
$1,000
$1,200
$1,400
1990 1991 1992 1993 1994 1995 1996 1997 1998 1999 2000 2001 2002 2003
MetLife AEW Trizec Tower Value
AEW / MetLife Trizec / MetLife MetLife
A summary of the important mileposts includes:
• July 2 1990: Sears finances the Tower with loans totaling $850 million, in one of the largest real estate financings then on record
• November 7, 1994: Sears transfers control of the building to its creditors (MetLife and AEW) via the General Agreement – essentially, a deed-in-lieu-of-foreclosure.
The Sears Tower January 1, 2007
• December 3, 1997: TrizecHahn (Trizec) purchases AEW’s stake for $70M in a highly levered deal considered a large risk at the time.
• December 31, 2002: Trizec recognizes that their original investment is
impaired and writes it down $48.3 of the $70 million originally invested.
• August 28, 2003: Trizec sells its ownership rights to MetLife for only $9 million with less than three years before the $766 million MetLife loan (i.e. the original $600M plus accrued interest) was to come due.
The next sections will explore these refinancing arrangements in much greater detail.
The MetLife / AEW Years
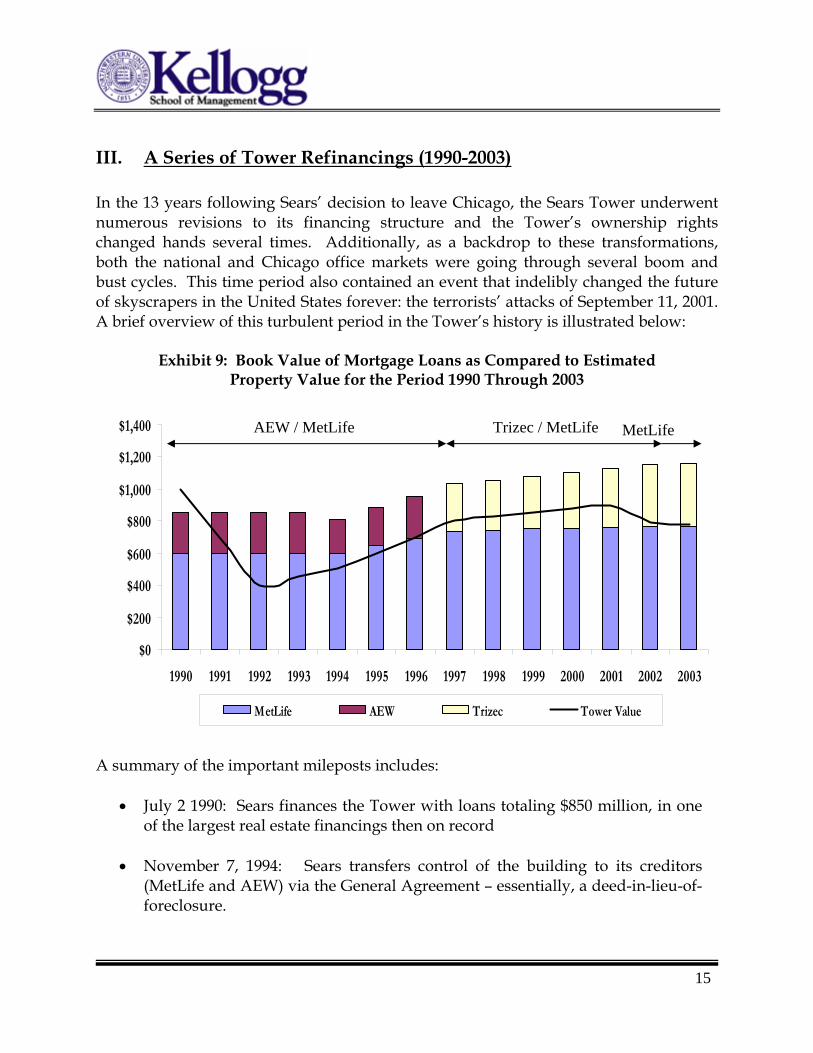
Sears looked to sell the Tower in the late 1980s amid declining real estate values, increased retail competition and its declining stock price. See Exhibit 10:
Exhibit 10: Stock Price History for Sears January, 1988 - December, 1996
$-
$20
$40
$60
$80
$100
$120
Jan-88
May-88
Sep-88
Jan-89
May-89
Sep-89
Jan-90
May-90
Sep-90
Jan-91
May-91
Sep-91
Jan-92
May-92
Sep-92
Jan-93
May-93
Sep-93
Jan-94
May-94
Sep-94
Jan-95
May-95
Sep-95
Jan-96
May-96
Sep-96
Source: Center for Reseach in Security Prices
Shar
e Pr
ice
(as
Adj
uste
d fo
r Sp
lits)
Sears borrows against the Tower
Sears “sells” the Tower
Sears attempts to sell the Tower
Sears begins the move to Hoffman
Estates
Unable to consummate a sale with Olympia and York (at approximately $1 billion), Sears sought a mortgage loan on the Tower in order to raise cash. In July of 1990, Sears entered into an agreement with two lenders who were willing to provide $850 million
16
17
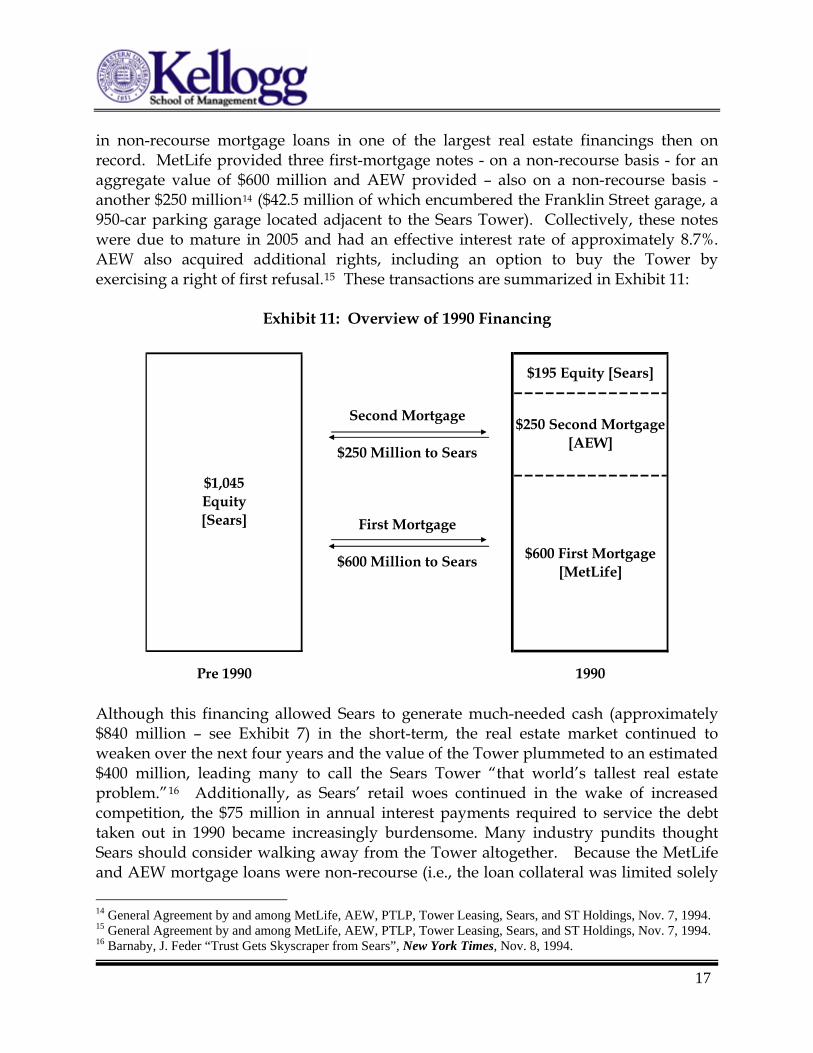
in non-recourse mortgage loans in one of the largest real estate financings then on record. MetLife provided three first-mortgage notes - on a non-recourse basis - for an aggregate value of $600 million and AEW provided – also on a non-recourse basis - another $250 million14 ($42.5 million of which encumbered the Franklin Street garage, a 950-car parking garage located adjacent to the Sears Tower). Collectively, these notes were due to mature in 2005 and had an effective interest rate of approximately 8.7%. AEW also acquired additional rights, including an option to buy the Tower by exercising a right of first refusal.15 These transactions are summarized in Exhibit 11:
Exhibit 11: Overview of 1990 Financing
Pre 1990 1990
$1,045 Equity [Sears]
Second Mortgage
$250 Million to Sears
First Mortgage
$600 Million to Sears $600 First Mortgage [MetLife]
$195 Equity [Sears]
$250 Second Mortgage [AEW]
Although this financing allowed Sears to generate much-needed cash (approximately $840 million – see Exhibit 7) in the short-term, the real estate market continued to weaken over the next four years and the value of the Tower plummeted to an estimated $400 million, leading many to call the Sears Tower “that world’s tallest real estate problem.”16 Additionally, as Sears’ retail woes continued in the wake of increased competition, the $75 million in annual interest payments required to service the debt taken out in 1990 became increasingly burdensome. Many industry pundits thought Sears should consider walking away from the Tower altogether. Because the MetLife and AEW mortgage loans were non-recourse (i.e., the loan collateral was limited solely 14 General Agreement by and among MetLife, AEW, PTLP, Tower Leasing, Sears, and ST Holdings, Nov. 7, 1994. 15 General Agreement by and among MetLife, AEW, PTLP, Tower Leasing, Sears, and ST Holdings, Nov. 7, 1994. 16 Barnaby, J. Feder “Trust Gets Skyscraper from Sears”, New York Times, Nov. 8, 1994.
The Sears Tower January 1, 2007
18
to the real estate assets) none of Sears’ corporate assets were exposed to satisfying any loan shortfall. In 1993, Sears entered into negotiations with MetLife and AEW to restructure the Tower’s finances. After more than a year of negotiating, they finalized a deal. Under the terms of the complex arrangement (the “1994 General Agreement”), Sears essentially transferred all control, but technically not ownership, of the building to an AEW-directed trust which would hold the Tower until 2003. AEW would then have the option to take title of the building from the trust in 2003 provided AEW could retire the remaining MetLife loan balance (if AEW could not retire the MetLife loan balance, then MetLife would have the option to take title to the Tower). As a demonstration of its continued ownership interests, the trust also received a cash contribution of $36 million and a subordinated loan of $9 million from Sears. According to Sears Vice-chairman James Denny, the rationale for such as decision was as follows:
“Sears believes the move helps it retain enough of an economic interest in the Tower to legally defer taxes on the ownership transfer, despite escaping liability for the building's debt.”
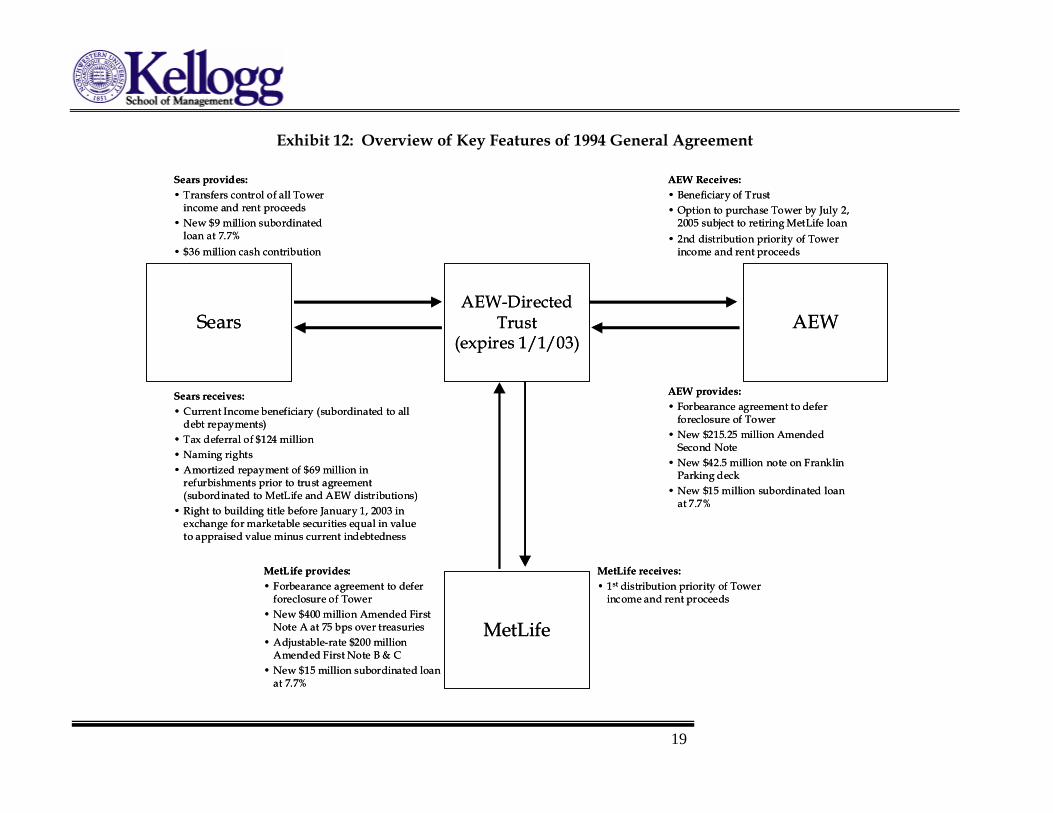
This transaction also allowed Sears to remove $845 million in long-term debt from its balance sheet and, when combined with the $501 million asset book value, to record a before-tax profit of $344 million. However, because ownership was not set to transfer until 2003, Sears was able to defer its tax liability of $149 million for approximately 10 years.17 For all intents and purposes, Sears had – after 20 years – finally fully divested itself of control of the Sears Tower. However, as part of the agreement, the Sears name would remain on the Tower. Exhibit 12 overviews the flow of potential benefits and liabilities for each party included in the 1994 General Agreement:
17 Sears 1994 10-K.
19
Sears
Sears provides:• Transfers control of all Tower
income and rent proceeds• New $9 million subordinated
loan at 7.7%• $36 million cash contribution
MetLife
AEW-Directed Trust
(expires 1/1/03)AEW
AEW Receives: • Beneficiary of Trust • Option to purchase Tower by July 2,
2005 subject to retiring MetLife loan• 2nd distribution priority of Tower
income and rent proceeds
AEW provides:• Forbearance agreement to defer
foreclosure of Tower• New $215.25 million Amended
Second Note• New $42.5 million note on Franklin
Parking deck• New $15 million subordinated loan
at 7.7%
Sears receives:• Current Income beneficiary (subordinated to all
debt repayments)• Tax deferral of $124 million• Naming rights• Amortized repayment of $69 million in
refurbishments prior to trust agreement (subordinated to MetLife and AEW distributions)
• Right to building title before January 1, 2003 in exchange for marketable securities equal in value to appraised value minus current indebtedness
MetLife provides:• Forbearance agreement to defer
foreclosure of Tower• New $400 million Amended First
Note A at 75 bps over treasuries• Adjustable-rate $200 million
Amended First Note B & C • New $15 million subordinated loan
at 7.7%
MetLife receives:• 1st distribution priority of Tower
income and rent proceeds
Exhibit 12: Overview of Key Features of 1994 General Agreement
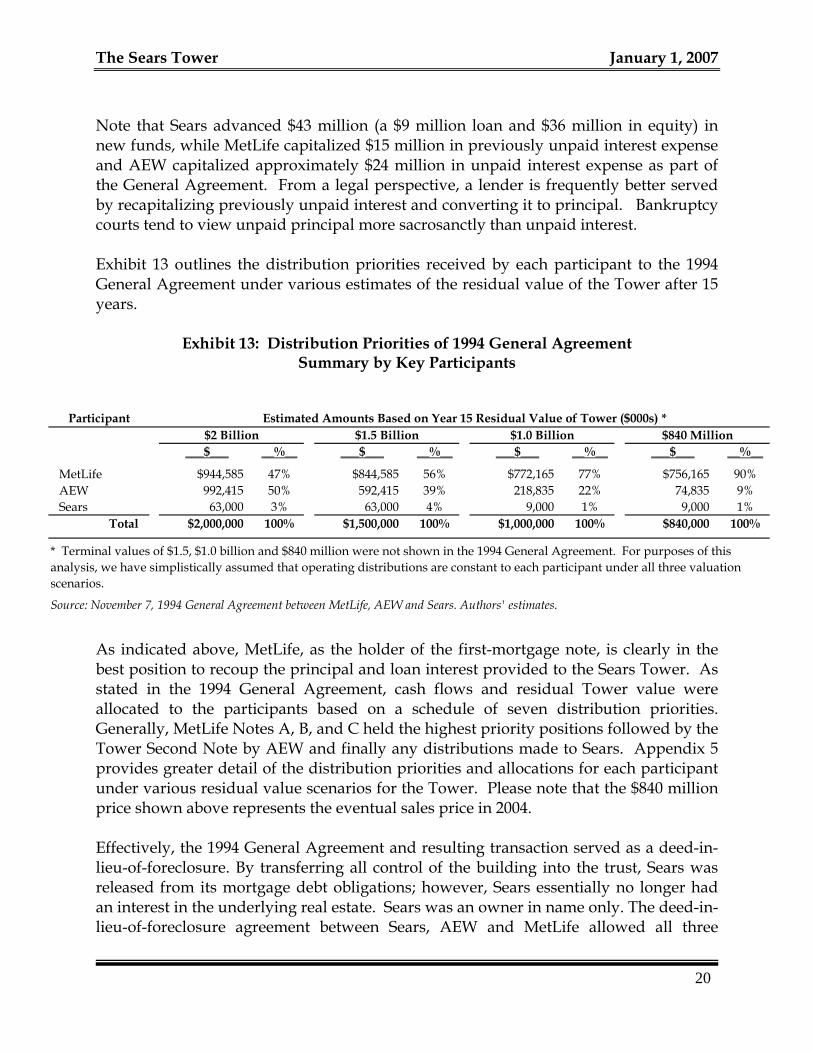
The Sears Tower January 1, 2007 Note that Sears advanced $43 million (a $9 million loan and $36 million in equity) in new funds, while MetLife capitalized $15 million in previously unpaid interest expense and AEW capitalized approximately $24 million in unpaid interest expense as part of the General Agreement. From a legal perspective, a lender is frequently better served by recapitalizing previously unpaid interest and converting it to principal. Bankruptcy courts tend to view unpaid principal more sacrosanctly than unpaid interest. Exhibit 13 outlines the distribution priorities received by each participant to the 1994 General Agreement under various estimates of the residual value of the Tower after 15 years.
Exhibit 13: Distribution Priorities of 1994 General Agreement Summary by Key Participants
Participant Estimated Amounts Based on Year 15 Residual Value of Tower ($000s) *$2 Billion $1.5 Billion $1.0 Billion $840 Million
___$___ __%__ ___$___ __%__ ___$___ __%__ ___$___ __%__
MetLife $944,585 47% $844,585 56% $772,165 77% $756,165 90%AEW 992,415 50% 592,415 39% 218,835 22% 74,835 9%Sears 63,000 3% 63,000 4% 9,000 1% 9,000 1%
Total $2,000,000 100% $1,500,000 100% $1,000,000 100% $840,000 100%
Source: November 7, 1994 General Agreement between MetLife, AEW and Sears. Authors' estimates.
* Terminal values of $1.5, $1.0 billion and $840 million were not shown in the 1994 General Agreement. For purposes of this analysis, we have simplistically assumed that operating distributions are constant to each participant under all three valuation scenarios.
As indicated above, MetLife, as the holder of the first-mortgage note, is clearly in the best position to recoup the principal and loan interest provided to the Sears Tower. As stated in the 1994 General Agreement, cash flows and residual Tower value were allocated to the participants based on a schedule of seven distribution priorities. Generally, MetLife Notes A, B, and C held the highest priority positions followed by the Tower Second Note by AEW and finally any distributions made to Sears. Appendix 5 provides greater detail of the distribution priorities and allocations for each participant under various residual value scenarios for the Tower. Please note that the $840 million price shown above represents the eventual sales price in 2004. Effectively, the 1994 General Agreement and resulting transaction served as a deed-in-lieu-of-foreclosure. By transferring all control of the building into the trust, Sears was released from its mortgage debt obligations; however, Sears essentially no longer had an interest in the underlying real estate. Sears was an owner in name only. The deed-in-lieu-of-foreclosure agreement between Sears, AEW and MetLife allowed all three
20
21
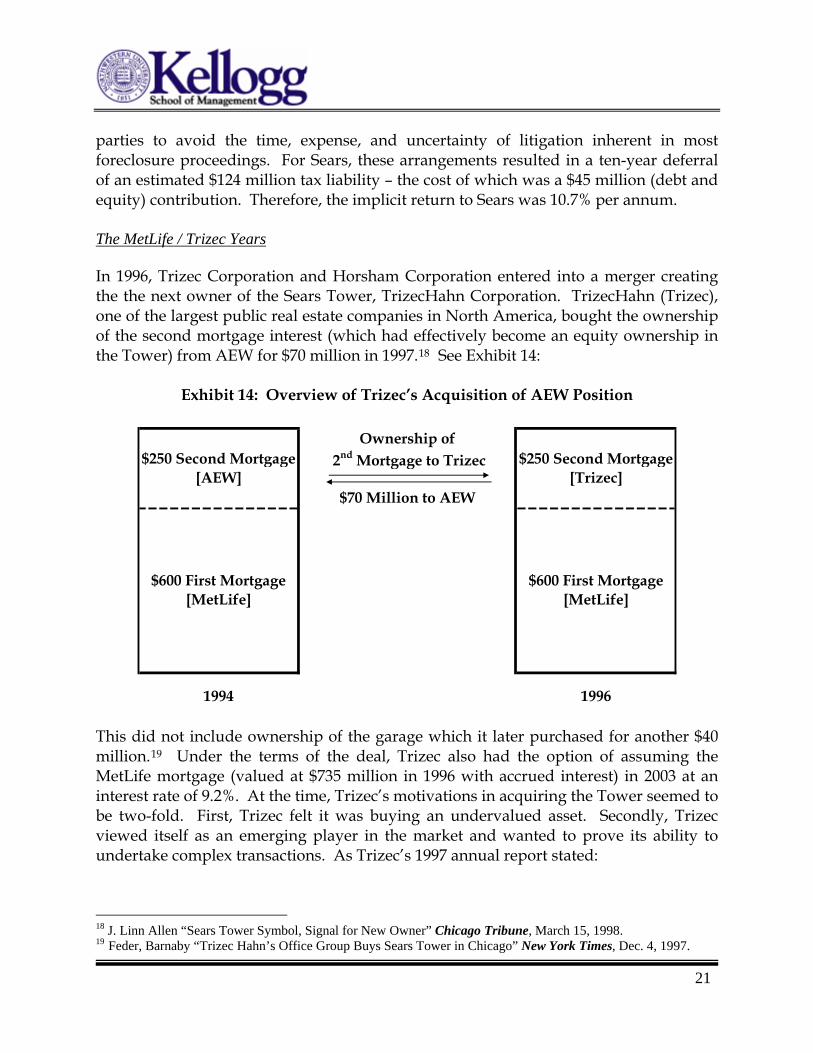
parties to avoid the time, expense, and uncertainty of litigation inherent in most foreclosure proceedings. For Sears, these arrangements resulted in a ten-year deferral of an estimated $124 million tax liability – the cost of which was a $45 million (debt and equity) contribution. Therefore, the implicit return to Sears was 10.7% per annum. The MetLife / Trizec Years In 1996, Trizec Corporation and Horsham Corporation entered into a merger creating the the next owner of the Sears Tower, TrizecHahn Corporation. TrizecHahn (Trizec), one of the largest public real estate companies in North America, bought the ownership of the second mortgage interest (which had effectively become an equity ownership in the Tower) from AEW for $70 million in 1997.18 See Exhibit 14:
Exhibit 14: Overview of Trizec’s Acquisition of AEW Position
Ownership of 2nd Mortgage to Trizec
1994 1996
$600 First Mortgage [MetLife]
$600 First Mortgage [MetLife]
$250 Second Mortgage [AEW]
$250 Second Mortgage [Trizec]
$70 Million to AEW
This did not include ownership of the garage which it later purchased for another $40 million.19 Under the terms of the deal, Trizec also had the option of assuming the MetLife mortgage (valued at $735 million in 1996 with accrued interest) in 2003 at an interest rate of 9.2%. At the time, Trizec’s motivations in acquiring the Tower seemed to be two-fold. First, Trizec felt it was buying an undervalued asset. Secondly, Trizec viewed itself as an emerging player in the market and wanted to prove its ability to undertake complex transactions. As Trizec’s 1997 annual report stated:
18 J. Linn Allen “Sears Tower Symbol, Signal for New Owner” Chicago Tribune, March 15, 1998. 19 Feder, Barnaby “Trizec Hahn’s Office Group Buys Sears Tower in Chicago” New York Times, Dec. 4, 1997.
The Sears Tower January 1, 2007
“…our ability to understand and manage complex transactions, involving multiple affected parties, results from the depth of our management team and our relationships with industry participants. One such example was [our] purchase of an interest in the Sears Tower in December 1997. The seller held a set of complicated rights, including a second mortgage and effective control of the Tower, but received no current cash payments on its investment. However, this position did have substantial appreciation potential given the property’s strong market position in Chicago, which has been experiencing rapid rental rate growth. By understanding and ultimately acquiring this complex position, TrizecHahn was able to acquire effective control of the Sears Tower, a world-class, quality office building, on favorable terms.”
Trizec projected that the Sears Tower would quickly reach a value of $1 billion and looked for this property to be the prize of its portfolio. Trizec felt the Chicago office market was improving. Given that the Tower had a large number of leases about to expire, Trizec felt it could renegotiate higher rents. Many industry pundits however felt the Trizec move was extremely risky. As one insider put it:
“In 1997, just about everyone felt the only way to ‘own’ the Tower was to get the first mortgage. Even though Trizec technically bought the ownership rights to the building, it was a huge gamble because conventional wisdom was that the only way to really control the building was to get the first mortgage, but Met was not about to let go. However, as a result, Trizec was able to purchase the second mortgage for an extremely reduced rate.”
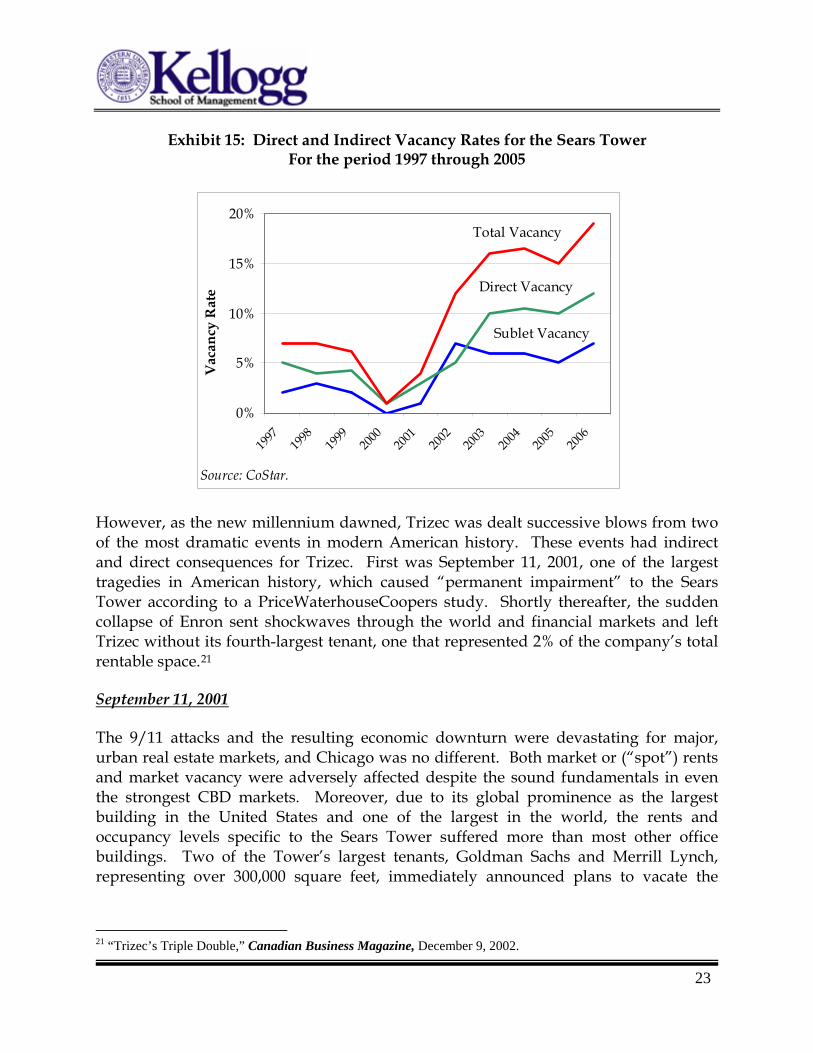
Nevertheless, some of Trizec’s optimism can be attributed to the strength of the firm during this time period. In 1998 Green Street Advisors indicated that Trizec’s strengths included the breadth of the firm’s global investment opportunities and a visionary management team. During this period, Green Street20 suggested that Trizec warranted a share price of about $23.00. At the time of their report, Trizec’s share price was $19.88. For the first few years, Trizec’s projection seemed on the mark as the Sears Tower experienced occupancy rates of up to 97.0% – see Exhibit 15 for vacancy rates from 1997-2006 – and its value has been estimated to have increased to over $900 million.
22
20 “Green Street Advisors Research – TrizecHahn Corp,” Green Street Advisors 1998.
23
Exhibit 15: Direct and Indirect Vacancy Rates for the Sears Tower For the period 1997 through 2005
0%
5%
10%
15%
20%
1997
1998
1999
2000
2001
2002
2003
2004
2005
2006
Vac
ancy
Rat
e Direct Vacancy
Total Vacancy
Sublet Vacancy
Source: CoStar.
However, as the new millennium dawned, Trizec was dealt successive blows from two of the most dramatic events in modern American history. These events had indirect and direct consequences for Trizec. First was September 11, 2001, one of the largest tragedies in American history, which caused “permanent impairment” to the Sears Tower according to a PriceWaterhouseCoopers study. Shortly thereafter, the sudden collapse of Enron sent shockwaves through the world and financial markets and left Trizec without its fourth-largest tenant, one that represented 2% of the company’s total rentable space.21
September 11, 2001
The 9/11 attacks and the resulting economic downturn were devastating for major, urban real estate markets, and Chicago was no different. Both market or (“spot”) rents and market vacancy were adversely affected despite the sound fundamentals in even the strongest CBD markets. Moreover, due to its global prominence as the largest building in the United States and one of the largest in the world, the rents and occupancy levels specific to the Sears Tower suffered more than most other office buildings. Two of the Tower’s largest tenants, Goldman Sachs and Merrill Lynch, representing over 300,000 square feet, immediately announced plans to vacate the
21 “Trizec’s Triple Double,” Canadian Business Magazine, December 9, 2002.
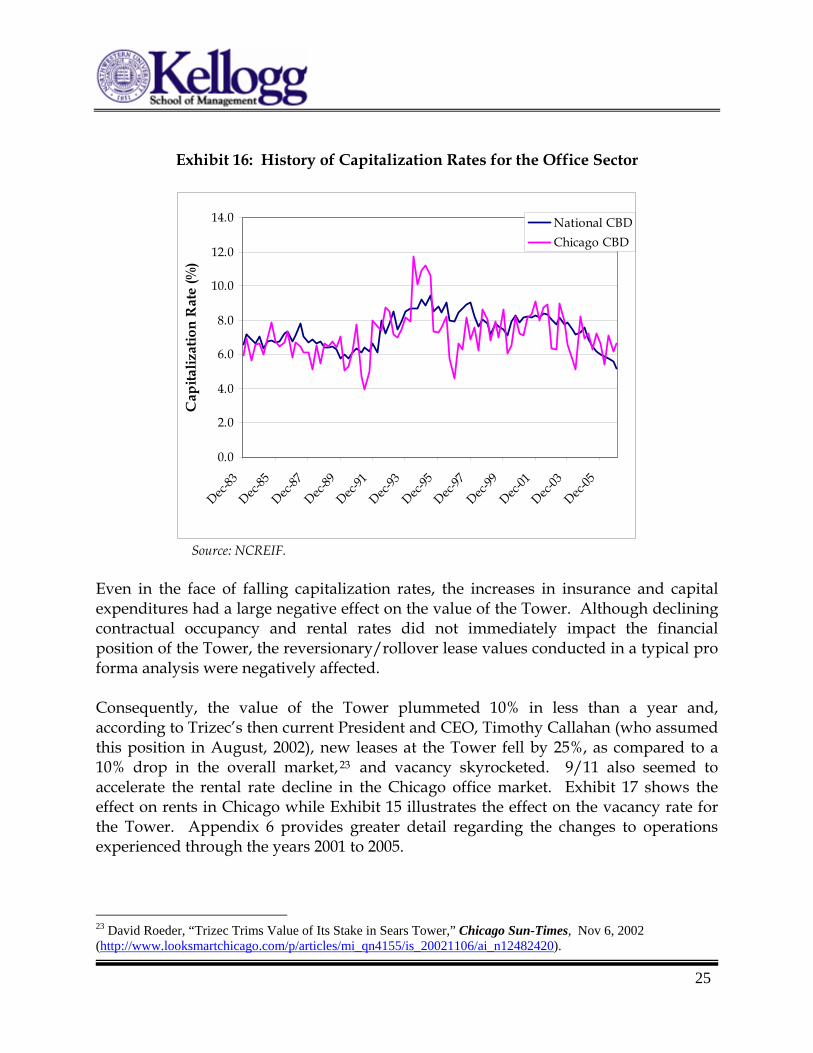
The Sears Tower January 1, 2007 building despite considerable remaining lease lengths reflected in contractual rent obligations – while other tenants felt similarly, not all acted upon such concerns. Despite significant tenant unease, the Tower had a very strong tenant roster both in terms of investment-grade financial strength and long lease maturities. The six largest tenants were all high-quality tenants with three rated by S&P with credit ratings of AA- or better and two others rated by Dun & Bradstreet with Composite Credit Appraisals of 2 (good). These six alone represented over 1,335,000 rentable square feet (or 35% of the Tower) with a weighted average lease commitment of over 8.3 years remaining. In fact, although physical occupancy plummeted from 95.3% in 2001 to 83.9% in 2004 and first-year net rent for new leases plunged from $26.32 in 2001 to $11.95 in 2003, the Tower’s NOI was actually forecasted to increase from $66,721,895 in 2001 to $67,979,183 in 2004 – see Appendix 6. This apparent discrepancy was largely attributable to contractual lease obligations providing rental income which was higher than then-current “spot” rates and to unoccupied space still paying rent (due to lease contracts with credit-worthy tenants); in addition, the number of new tenants leasing at historically low market rental rates was very small in comparison to the total space in the Tower. However, property insurance on the building jumped from approximately $751,000 in 2002 to $6.75 million in 2003 and held steady around $5.5 million during 2004 and 2005. 22 Further, capital expenditures of over $5 million for counter-terrorism improvements were made. With the exception of a sharp increase between 2000 at 6.89% to 7.98% in 2002, capitalization rates steadily fell to 6.40% in 2005. See Exhibit 16:
24
22 Eastdil Offering Memorandum.
25
Exhibit 16: History of Capitalization Rates for the Office Sector
0.0
2.0
4.0
6.0
8.0
10.0
12.0
14.0
Dec-83
Dec-85
Dec-87
Dec-89
Dec-91
Dec-93
Dec-95
Dec-97
Dec-99
Dec-01
Dec-03
Dec-05
Cap
italiz
atio
n R
ate
(%)
National CBDChicago CBD
Source: NCREIF.
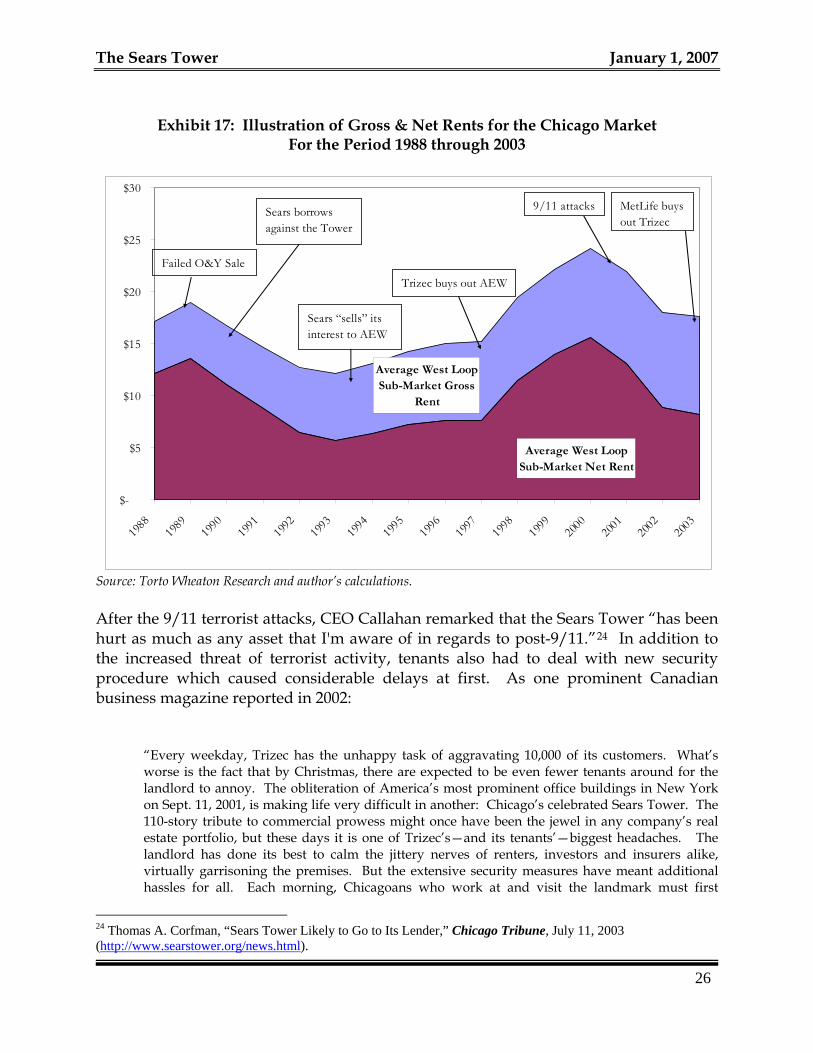
Even in the face of falling capitalization rates, the increases in insurance and capital expenditures had a large negative effect on the value of the Tower. Although declining contractual occupancy and rental rates did not immediately impact the financial position of the Tower, the reversionary/rollover lease values conducted in a typical pro forma analysis were negatively affected. Consequently, the value of the Tower plummeted 10% in less than a year and, according to Trizec’s then current President and CEO, Timothy Callahan (who assumed this position in August, 2002), new leases at the Tower fell by 25%, as compared to a 10% drop in the overall market,23 and vacancy skyrocketed. 9/11 also seemed to accelerate the rental rate decline in the Chicago office market. Exhibit 17 shows the effect on rents in Chicago while Exhibit 15 illustrates the effect on the vacancy rate for the Tower. Appendix 6 provides greater detail regarding the changes to operations experienced through the years 2001 to 2005.
23 David Roeder, “Trizec Trims Value of Its Stake in Sears Tower,” Chicago Sun-Times, Nov 6, 2002 (http://www.looksmartchicago.com/p/articles/mi_qn4155/is_20021106/ai_n12482420).
The Sears Tower January 1, 2007
Exhibit 17: Illustration of Gross & Net Rents for the Chicago Market For the Period 1988 through 2003
Average West Loop Sub-Market Net Rent
Average West Loop Sub-Market Gross
Rent
$-
$5
$10
$15
$20
$25
$30
1988
1989
1990
1991
1992
1993
1994
1995
1996
1997
1998
1999
2000
2001
2002
2003
Sears borrows against the Tower
Sears “sells” its interest to AEW
Trizec buys out AEW
MetLife buys out Trizec
9/11 attacks
Failed O&Y Sale
Source: Torto Wheaton Research and author’s calculations. After the 9/11 terrorist attacks, CEO Callahan remarked that the Sears Tower “has been hurt as much as any asset that I'm aware of in regards to post-9/11.”24 In addition to the increased threat of terrorist activity, tenants also had to deal with new security procedure which caused considerable delays at first. As one prominent Canadian business magazine reported in 2002:
“Every weekday, Trizec has the unhappy task of aggravating 10,000 of its customers. What’s worse is the fact that by Christmas, there are expected to be even fewer tenants around for the landlord to annoy. The obliteration of America’s most prominent office buildings in New York on Sept. 11, 2001, is making life very difficult in another: Chicago’s celebrated Sears Tower. The 110-story tribute to commercial prowess might once have been the jewel in any company’s real estate portfolio, but these days it is one of Trizec’s—and its tenants’—biggest headaches. The landlord has done its best to calm the jittery nerves of renters, investors and insurers alike, virtually garrisoning the premises. But the extensive security measures have meant additional hassles for all. Each morning, Chicagoans who work at and visit the landmark must first
26
24 Thomas A. Corfman, “Sears Tower Likely to Go to Its Lender,” Chicago Tribune, July 11, 2003 (http://www.searstower.org/news.html).
27
negotiate the perimeter of concrete highway pillars that fortify its entrances against truck bombs. Then it’s a phalanx of security guards, examining each building pass, inspecting every bag. Guests must show photo identification and sign in at the front desk. Even deliveries are vetted by sniffer dogs trained to identify explosive material.”
Trizec Decides to Exit the Sears Tower
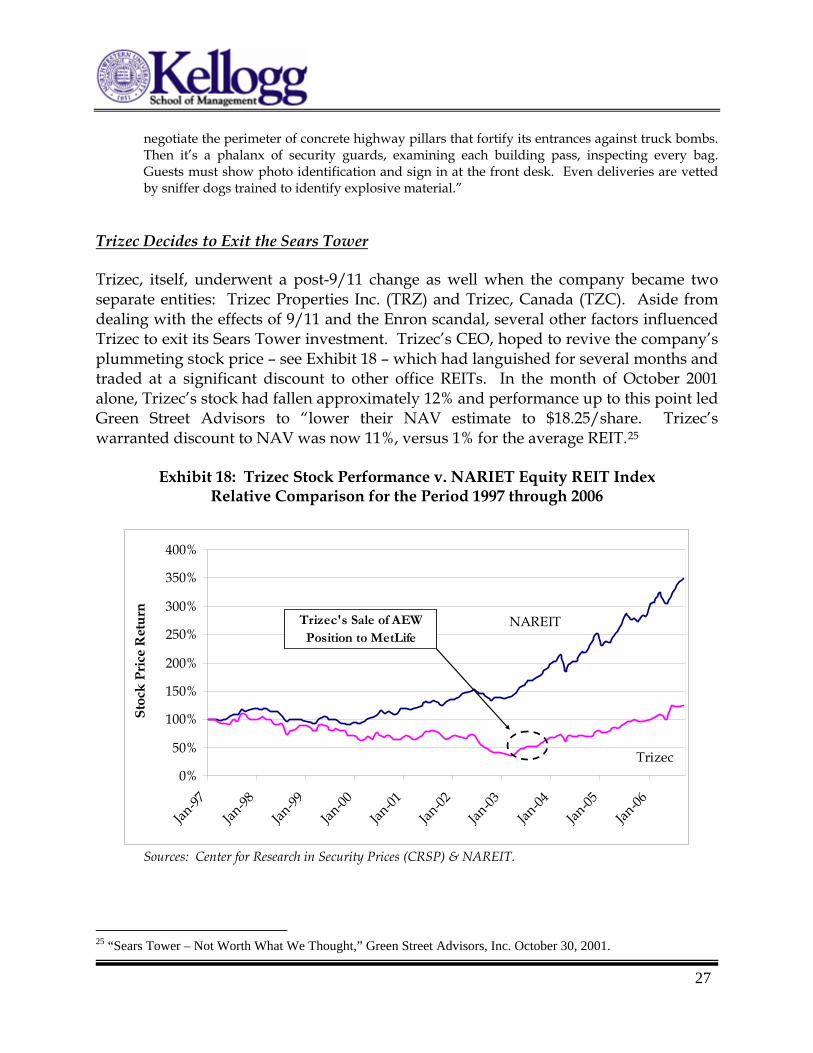
Trizec, itself, underwent a post-9/11 change as well when the company became two separate entities: Trizec Properties Inc. (TRZ) and Trizec, Canada (TZC). Aside from dealing with the effects of 9/11 and the Enron scandal, several other factors influenced Trizec to exit its Sears Tower investment. Trizec’s CEO, hoped to revive the company’s plummeting stock price – see Exhibit 18 – which had languished for several months and traded at a significant discount to other office REITs. In the month of October 2001 alone, Trizec’s stock had fallen approximately 12% and performance up to this point led Green Street Advisors to “lower their NAV estimate to $18.25/share. Trizec’s warranted discount to NAV was now 11%, versus 1% for the average REIT.25
Exhibit 18: Trizec Stock Performance v. NARIET Equity REIT Index
Relative Comparison for the Period 1997 through 2006
0%
50%
100%
150%
200%
250%
300%
350%
400%
Jan-97
Jan-98
Jan-99
Jan-00
Jan-01
Jan-02
Jan-03
Jan-04
Jan-05
Jan-06
Stoc
k Pr
ice
Ret
urn
NAREIT
Trizec
Trizec's Sale of AEW Position to MetLife
Sources: Center for Research in Security Prices (CRSP) & NAREIT.
25 “Sears Tower – Not Worth What We Thought,” Green Street Advisors, Inc. October 30, 2001.
The Sears Tower January 1, 2007 One of the problems with Trizec’s stock was that its leverage ratio was around 65% as compared to its peer group average of around 50%. If Trizec became the owner of the Sears Tower, then the company would have added the $766 million first mortgage (including accrued interest) to its highly levered balance sheet, which would come due in 2005.26 Increasing its leverage, coupled with the soft office market, led investors and analysts to suggest selling the Sears Tower was Trizec’s best course of action. The Sears Tower only contributed about $0.02 per share to Trizec’s funds from operations (FFO). In mid-2002, the Sears Tower was 94% leased, but this was projected to drop to 91% by the fourth quarter of 2002.27
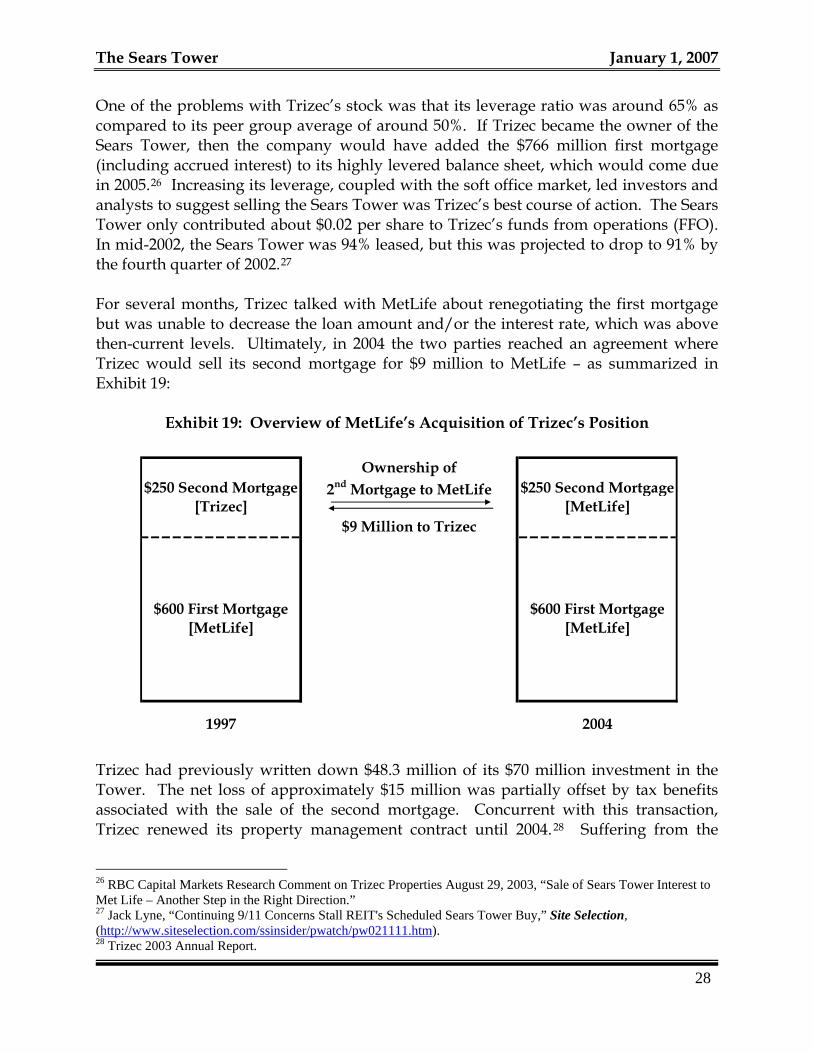
For several months, Trizec talked with MetLife about renegotiating the first mortgage but was unable to decrease the loan amount and/or the interest rate, which was above then-current levels. Ultimately, in 2004 the two parties reached an agreement where Trizec would sell its second mortgage for $9 million to MetLife – as summarized in Exhibit 19:
Exhibit 19: Overview of MetLife’s Acquisition of Trizec’s Position
Ownership of2nd Mortgage to MetLife
1997 2004
$600 First Mortgage [MetLife]
$600 First Mortgage [MetLife]
$250 Second Mortgage [Trizec]
$250 Second Mortgage [MetLife]
$9 Million to Trizec
Trizec had previously written down $48.3 million of its $70 million investment in the Tower. The net loss of approximately $15 million was partially offset by tax benefits associated with the sale of the second mortgage. Concurrent with this transaction, Trizec renewed its property management contract until 2004.28 Suffering from the
26 RBC Capital Markets Research Comment on Trizec Properties August 29, 2003, “Sale of Sears Tower Interest to Met Life – Another Step in the Right Direction.” 27 Jack Lyne, “Continuing 9/11 Concerns Stall REIT's Scheduled Sears Tower Buy,” Site Selection, (http://www.siteselection.com/ssinsider/pwatch/pw021111.htm).
28
28 Trizec 2003 Annual Report.
29
challenges posed by ownership of the Tower as well as poor stock performance overall, Trizec’s sale of its AEW position to MetLife had a minimal effect on the stock price. The Trizec entities were finally acquired in 2006 by Brookfield Properties Corporation and Blackstone Group in an $8.9 billion deal.29
The MetLife Years
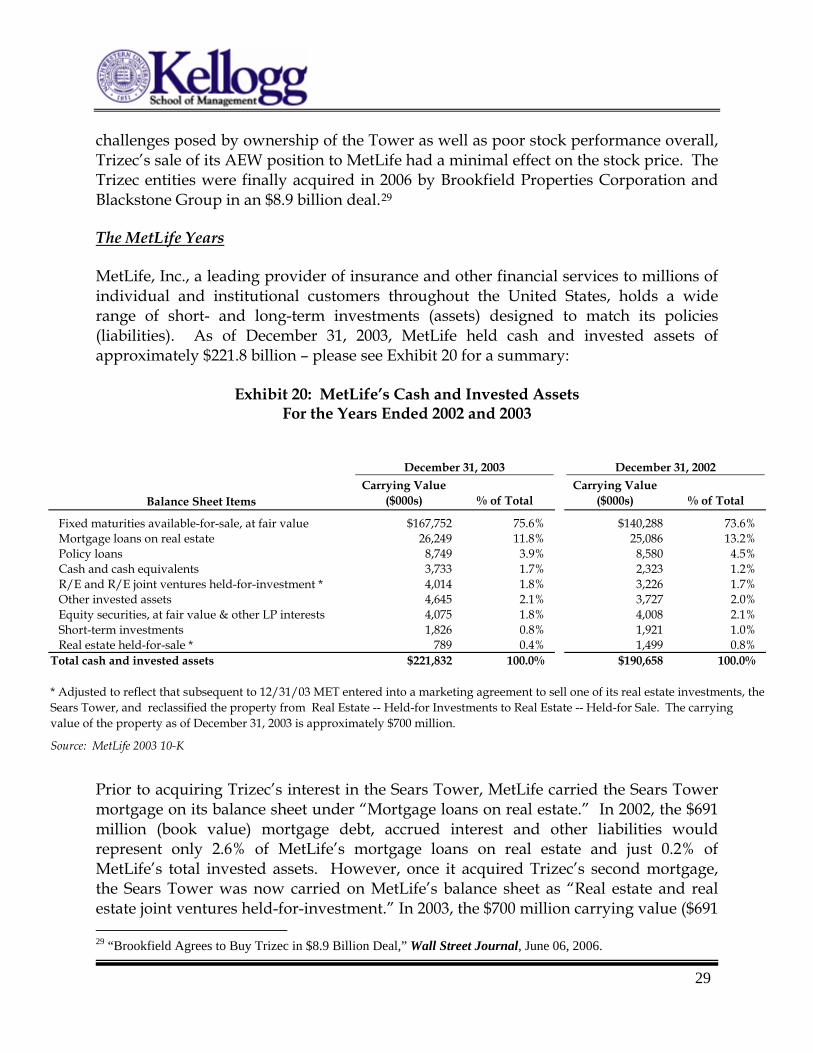
MetLife, Inc., a leading provider of insurance and other financial services to millions of individual and institutional customers throughout the United States, holds a wide range of short- and long-term investments (assets) designed to match its policies (liabilities). As of December 31, 2003, MetLife held cash and invested assets of approximately $221.8 billion – please see Exhibit 20 for a summary:
Exhibit 20: MetLife’s Cash and Invested Assets For the Years Ended 2002 and 2003
December 31, 2003 December 31, 2002
Balance Sheet ItemsCarrying Value
($000s) % of TotalCarrying Value
($000s) % of Total
Fixed maturities available-for-sale, at fair value $167,752 75.6% $140,288 73.6%Mortgage loans on real estate 26,249 11.8% 25,086 13.2%Policy loans 8,749 3.9% 8,580 4.5%Cash and cash equivalents 3,733 1.7% 2,323 1.2%R/E and R/E joint ventures held-for-investment * 4,014 1.8% 3,226 1.7%Other invested assets 4,645 2.1% 3,727 2.0%Equity securities, at fair value & other LP interests 4,075 1.8% 4,008 2.1%Short-term investments 1,826 0.8% 1,921 1.0%Real estate held-for-sale * 789 0.4% 1,499 0.8%
Total cash and invested assets $221,832 100.0% $190,658 100.0%
Source: MetLife 2003 10-K
* Adjusted to reflect that subsequent to 12/31/03 MET entered into a marketing agreement to sell one of its real estate investments, the Sears Tower, and reclassified the property from Real Estate -- Held-for Investments to Real Estate -- Held-for Sale. The carrying value of the property as of December 31, 2003 is approximately $700 million.
Prior to acquiring Trizec’s interest in the Sears Tower, MetLife carried the Sears Tower mortgage on its balance sheet under “Mortgage loans on real estate.” In 2002, the $691 million (book value) mortgage debt, accrued interest and other liabilities would represent only 2.6% of MetLife’s mortgage loans on real estate and just 0.2% of MetLife’s total invested assets. However, once it acquired Trizec’s second mortgage, the Sears Tower was now carried on MetLife’s balance sheet as “Real estate and real estate joint ventures held-for-investment.” In 2003, the $700 million carrying value ($691 29 “Brookfield Agrees to Buy Trizec in $8.9 Billion Deal,” Wall Street Journal, June 06, 2006.
The Sears Tower January 1, 2007 million mortgage plus $9 million cash purchase price from Trizec) of the Sears Tower would represent 17.4% of MetLife’s real estate and real estate joint ventures held-for-investment, but less than 0.32% of MetLife’s total invested assets.30 MetLife’s Decision to Purchase the Sears Tower According to a company press release, purchasing Trizec’s second mortgage on the Sears Tower allowed MetLife to “manage the long-term strategy of its investment”31 and “allows us more flexibility and operational control.”32 As mentioned previously, there were questions about whether Trizec would be able to repay the first mortgage on the Tower, especially during a time of declining building values. This transaction allowed – at least temporarily - MetLife to avoid any further asset impairment charges or write-downs. MetLife now carried the Sears Tower on its balance sheet at a value of $700 million. MetLife’s Decision to Sell the Sears Tower During 2003 and 2004, MetLife sold many of its commercial real estate holdings to take advantage of falling capitalization rates and rebounding asset prices. In November 2003, MetLife sold One Cal Plaza in Los Angeles to Maguire Properties for $225 million. In December 2003, MetLife agreed to sell 11 Madison Avenue (an art deco office building in Manhattan’s Midtown South District) to ZAR Realty for $675 million. After the sale of these two high-profile deals, MetLife estimated that there was an additional $3.6 billion of unrealized gains in its real estate portfolio. Shortly after purchasing the Sears Tower from Trizec, MetLife began discussions with brokers to explore its options, including an out-right sale as well as “selling a stake in the building to a joint venture partner or refinancing its debt, among other options.” Early in 2004, the Chicago office of Eastdil Realty won the assignment to sell the Sears Tower. They began marketing the Tower and expected bids in the range of $750 million, significantly higher than MetLife’s $700 million carrying value on its balance sheet. The sale of these assets increased MetLife’s statutory capital and allowed the company to repurchase more stock in efforts to boost its own share price. The sale would end MetLife’s relationship with the Sears Tower, which had begun in 1990, but take advantage of Chicago’s strengthening office market. Although economic uncertainty prevailed between 2002 and 2003, Chicago’s population had grown by 4% since 1990 and the city was ranked 5th best out of 31 markets in the
30 MetLife 2003 Annual Report. 31 “MetLife Acquires Sears Tower,” A/E/C Newswire, August 28, 2003 http://www.aecnewswire.com/industrynews/Detailed/470.shtml.
30
32 Kelly Quigley, “Trizec Sells Back Sears Tower Stake” Crain’s Chicago Business, 8/28/2003. (http://chicagobusiness.com/cgi-bin/news.pl?id=9912&rel=1).
31
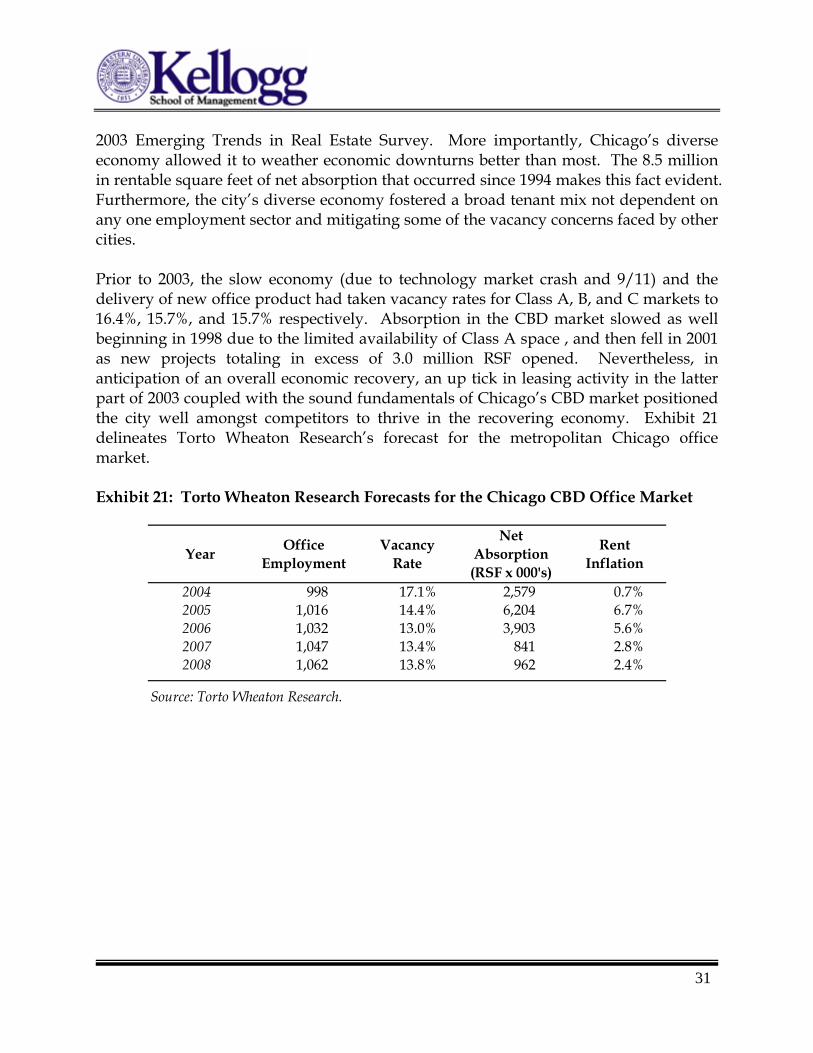
2003 Emerging Trends in Real Estate Survey. More importantly, Chicago’s diverse economy allowed it to weather economic downturns better than most. The 8.5 million in rentable square feet of net absorption that occurred since 1994 makes this fact evident. Furthermore, the city’s diverse economy fostered a broad tenant mix not dependent on any one employment sector and mitigating some of the vacancy concerns faced by other cities. Prior to 2003, the slow economy (due to technology market crash and 9/11) and the delivery of new office product had taken vacancy rates for Class A, B, and C markets to 16.4%, 15.7%, and 15.7% respectively. Absorption in the CBD market slowed as well beginning in 1998 due to the limited availability of Class A space , and then fell in 2001 as new projects totaling in excess of 3.0 million RSF opened. Nevertheless, in anticipation of an overall economic recovery, an up tick in leasing activity in the latter part of 2003 coupled with the sound fundamentals of Chicago’s CBD market positioned the city well amongst competitors to thrive in the recovering economy. Exhibit 21 delineates Torto Wheaton Research’s forecast for the metropolitan Chicago office market. Exhibit 21: Torto Wheaton Research Forecasts for the Chicago CBD Office Market
Year Office Employment
Vacancy Rate
Net Absorption (RSF x 000's)
Rent Inflation
2004 998 17.1% 2,579 0.7%2005 1,016 14.4% 6,204 6.7%2006 1,032 13.0% 3,903 5.6%2007 1,047 13.4% 841 2.8%2008 1,062 13.8% 962 2.4%
Source: Torto Wheaton Research.
The Sears Tower January 1, 2007
IV. Joseph Chetrit and Company Acquire the Sears Tower
Valuation of the Tower in 2004
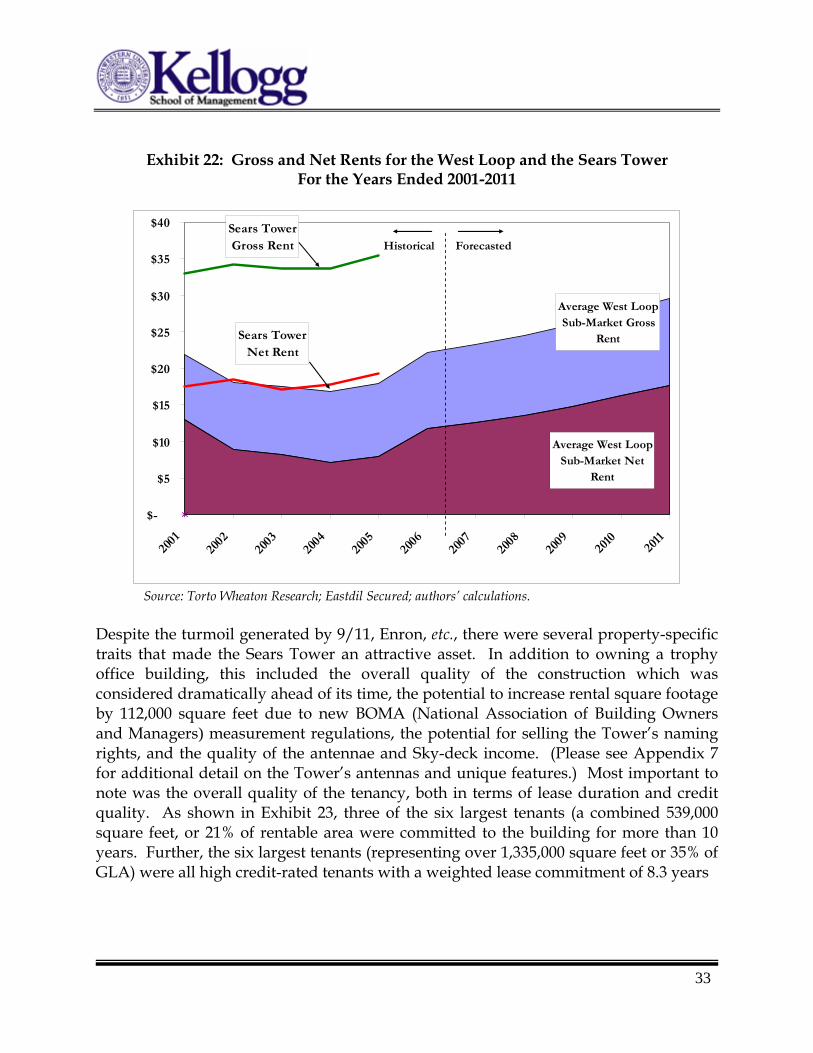
The commercial vacancy rate in Chicago reached 17.1% in 2004. However, eleven notable tenants relocated to the West Loop submarket, a migration that bode well for the Sears Tower. These high “credit” tenants included PriceWaterhouse Coopers, Quaker Oats, UBS Warburg, Deloitte & Touche, ABN Amro, and Options Clearing Corporation, plus law firms Gardner, Carton & Douglas, Mayer, Brown, Rowe & Maw, and Lord, Bissel & Brook. Between 1996 and 2004, sixteen premier CBD buildings, with an average of 92% occupancy, were sold in Chicago for a weighted-average sales price of $252 per square foot. Adjusting for the Sears Tower’s occupancy of 88% in 2004, this suggested an approximate purchase price of $918 million. In the past, the Tower was considered a premier location and, as such, it demanded among the highest rents in the city. After 9/11, however, this trend reversed; many potential investors forecasted that rents for the Tower in the range of $24-$30 gross rent per square foot were unlikely to be obtained in the future. This widening disparity was evidenced by the Sears Tower’s six primary competitors’ occupancy at 96% in 2004, eight percentage points higher than that of the Tower. Exhibit 22 shows the growth of rents through 2001, followed by the correction, and projections through 2011:
32
33
Exhibit 22: Gross and Net Rents for the West Loop and the Sears Tower
For the Years Ended 2001-2011
Average West Loop Sub-Market Net
Rent
Average West Loop Sub-Market Gross
Rent
Sears Tower Gross Rent
Sears Tower Net Rent
$-
$5
$10
$15
$20
$25
$30
$35
$40
2001
2002
2003
2004
2005
2006
2007
2008
2009
2010
2011
Historical Forecasted
Source: Torto Wheaton Research; Eastdil Secured; authors’ calculations.
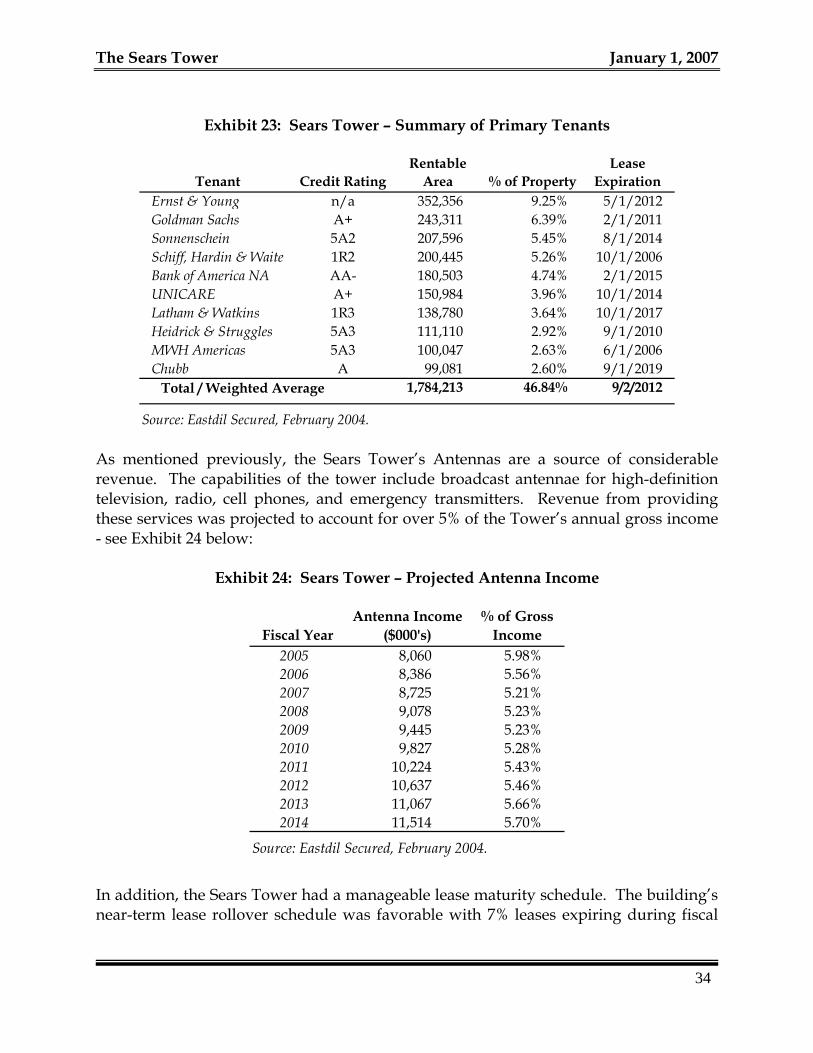
Despite the turmoil generated by 9/11, Enron, etc., there were several property-specific traits that made the Sears Tower an attractive asset. In addition to owning a trophy office building, this included the overall quality of the construction which was considered dramatically ahead of its time, the potential to increase rental square footage by 112,000 square feet due to new BOMA (National Association of Building Owners and Managers) measurement regulations, the potential for selling the Tower’s naming rights, and the quality of the antennae and Sky-deck income. (Please see Appendix 7 for additional detail on the Tower’s antennas and unique features.) Most important to note was the overall quality of the tenancy, both in terms of lease duration and credit quality. As shown in Exhibit 23, three of the six largest tenants (a combined 539,000 square feet, or 21% of rentable area were committed to the building for more than 10 years. Further, the six largest tenants (representing over 1,335,000 square feet or 35% of GLA) were all high credit-rated tenants with a weighted lease commitment of 8.3 years
The Sears Tower January 1, 2007
Exhibit 23: Sears Tower – Summary of Primary Tenants
Tenant Credit RatingRentable
Area % of PropertyLease
ExpirationErnst & Young n/a 352,356 9.25% 5/1/2012Goldman Sachs A+ 243,311 6.39% 2/1/2011Sonnenschein 5A2 207,596 5.45% 8/1/2014Schiff, Hardin & Waite 1R2 200,445 5.26% 10/1/2006Bank of America NA AA- 180,503 4.74% 2/1/2015UNICARE A+ 150,984 3.96% 10/1/2014Latham & Watkins 1R3 138,780 3.64% 10/1/2017Heidrick & Struggles 5A3 111,110 2.92% 9/1/2010MWH Americas 5A3 100,047 2.63% 6/1/2006Chubb A 99,081 2.60% 9/1/2019
Total / Weighted Average 1,784,213 46.84% 9/2/2012
Source: Eastdil Secured, February 2004. As mentioned previously, the Sears Tower’s Antennas are a source of considerable revenue. The capabilities of the tower include broadcast antennae for high-definition television, radio, cell phones, and emergency transmitters. Revenue from providing these services was projected to account for over 5% of the Tower’s annual gross income - see Exhibit 24 below:
Exhibit 24: Sears Tower – Projected Antenna Income
Fiscal YearAntenna Income
($000's)% of Gross
Income2005 8,060 5.98%2006 8,386 5.56%2007 8,725 5.21%2008 9,078 5.23%2009 9,445 5.23%2010 9,827 5.28%2011 10,224 5.43%2012 10,637 5.46%2013 11,067 5.66%2014 11,514 5.70%
Source: Eastdil Secured, February 2004.
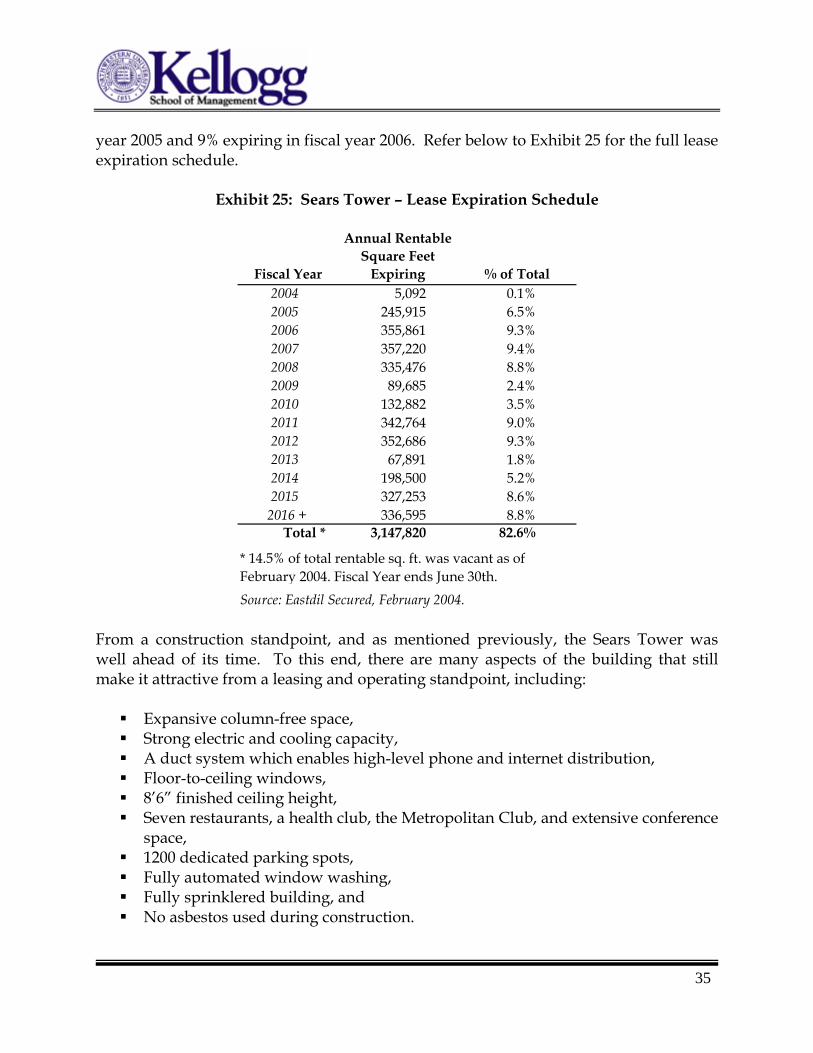
In addition, the Sears Tower had a manageable lease maturity schedule. The building’s near-term lease rollover schedule was favorable with 7% leases expiring during fiscal
34
35
year 2005 and 9% expiring in fiscal year 2006. Refer below to Exhibit 25 for the full lease expiration schedule.
Exhibit 25: Sears Tower – Lease Expiration Schedule
Fiscal Year
Annual Rentable Square Feet
Expiring % of Total2004 5,092 0.1%2005 245,915 6.5%2006 355,861 9.3%2007 357,220 9.4%2008 335,476 8.8%2009 89,685 2.4%2010 132,882 3.5%2011 342,764 9.0%2012 352,686 9.3%2013 67,891 1.8%2014 198,500 5.2%2015 327,253 8.6%
2016 + 336,595 8.8%Total * 3,147,820 82.6%
Source: Eastdil Secured, February 2004.
* 14.5% of total rentable sq. ft. was vacant as of February 2004. Fiscal Year ends June 30th.
From a construction standpoint, and as mentioned previously, the Sears Tower was well ahead of its time. To this end, there are many aspects of the building that still make it attractive from a leasing and operating standpoint, including:
Expansive column-free space, Strong electric and cooling capacity, A duct system which enables high-level phone and internet distribution, Floor-to-ceiling windows, 8’6” finished ceiling height, Seven restaurants, a health club, the Metropolitan Club, and extensive conference
space, 1200 dedicated parking spots, Fully automated window washing, Fully sprinklered building, and No asbestos used during construction.
The Sears Tower January 1, 2007 Based on NCREIF data, commercial capitalization rates in the Chicago area were approximately 7.27% for the quarter ending March 31, 2004. Using this estimate and the Sears Tower’s 2003 NOI of $65.1 million, the likely purchase price could be estimated at $896 million. As mentioned previously, however, many of the rents in the buildings were considered well-above market. Further, it was generally known that Goldman Sachs was planning on vacating the building in 6-7 years. Not only did Goldman Sachs represent the second largest tenant at 243,000 square feet, it also paid net rent of $25 per square foot, which most thought would be nearly impossible to replace.
Aggressive Financing Leads to Sky High Prices & Emergence of Private Buyers
Fueled by the “dot.com” implosion, low interest rates, investors “flocking to quality” and banks wanting to finance large deals, a glut of capital flooded the real estate market after 2001. Further, buyers with a healthy borrowing history were finding the opportunities to leverage close to 100 percent of the purchase price of an asset. Such financing often included a first mortgage for approximately 75% of the property’s value with the balance supplied by aggressive mezzanine financing. The looming Sears Tower transaction also highlighted a more general trend in which private individuals, as opposed to large institutions, were increasingly engineering mammoth deals to acquire trophy properties. Many wealthy investors were acquiring prized properties. For example:
• A group of investors, led by New York investor David Werner, paid $675 million at the end of 2003 to acquire 11 Madison Ave in New York City.
• Another group of investors along with David Werner invested $400 million for 50 percent stake in the Bank of America building in San Francisco in 2004.
• In 2004, New York investor Harry Macklowe stunned the real estate world with a record-setting $1.4 billion bid for the General Motors building, in New York.33
The rush of private capital into these properties resulted in driving down cap rates to well below historical levels for CBD office properties, which typically ranged between 7% and 8%. In 2004, it was not uncommon to see cap rates as low as 5%. Generally speaking, these low cap rates were attributable to the high prices paid by private buyers who were more comfortable (than their institutional counterparts) taking on substantially higher leverage ratios (and implicitly incurring substantially more risk).
36
33 Alison Gregor, “Will Building Buyers Bust?,” The Real Deal, March 2005 (http://www.therealdeal.net/deals/sales.php?deals_sales_sort_order=DESC&deals_sales_sort_field=price).
37
Referring to these bidding wars, Richard Baxter, an Executive Director at Cushman & Wakefield stated:
“The prices for the assets are considered high -- even bubbly. This is the market of the individual investor. They're dominating right now.”34
In addition, James Hanson, a Managing Director for Jones Lang LaSalle, stated at this time:
"Anybody who is going to use a high degree of leverage in an acquisition is going to have an advantage, given how low interest rates are, and also how aggressive lenders are just to put money out."
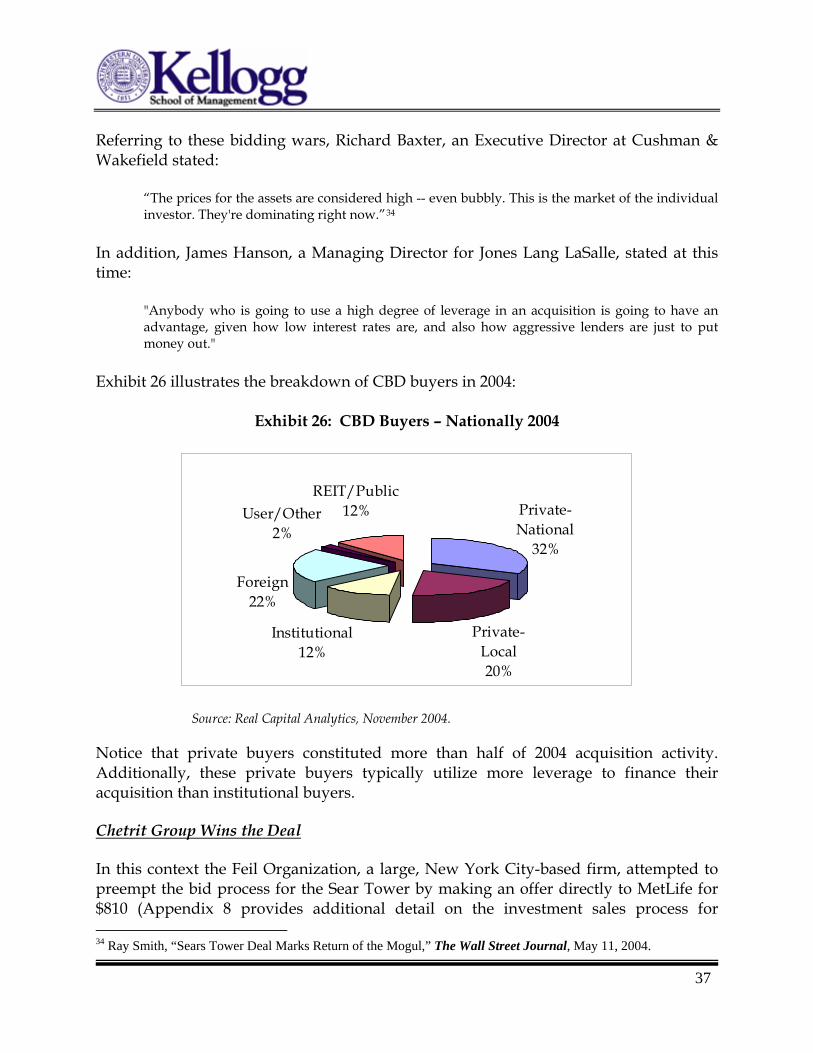
Exhibit 26 illustrates the breakdown of CBD buyers in 2004:
Exhibit 26: CBD Buyers – Nationally 2004
Private-National
32%
Private-Local20%
Institutional12%
Foreign22%
User/Other2%
REIT/Public12%
Source: Real Capital Analytics, November 2004.
Notice that private buyers constituted more than half of 2004 acquisition activity. Additionally, these private buyers typically utilize more leverage to finance their acquisition than institutional buyers.
Chetrit Group Wins the Deal
In this context the Feil Organization, a large, New York City-based firm, attempted to preempt the bid process for the Sear Tower by making an offer directly to MetLife for $810 (Appendix 8 provides additional detail on the investment sales process for 34 Ray Smith, “Sears Tower Deal Marks Return of the Mogul,” The Wall Street Journal, May 11, 2004.
The Sears Tower January 1, 2007 commercial real estate.) The offer was very credible as Feil had a respectable and well-known track record of successfully developing and managing millions of square feet of office buildings across the country up through 2003 (it was also rumored that Wachovia was to be Feil’s mortgage lender). MetLife, anxious to exit the deal, had the Sears Tower on the books for a carrying value of $700 million. Feil’s offer would get them out at a sizeable profit. Moreover, few in the industry believed that the Sears Tower would sell for over $800 million. MetLife verbally accepted Feil’s offer before bidding concluded, but because of the approaching end-of-year holidays, decided to wait to enter into a formal purchase-and-sale agreement. Meanwhile, Eastdil advised MetLife against accepting the deal and to wait for the auction process deadline to be reached. Although the Feil deal was reportedly under contract, Joseph Chetrit, a French-speaking, Moroccan-born New Yorker, formed a group and partnered with Joseph Moinian and Israel Gluck from American Landmark Properties to aggressively pursue the purchase of the Sears Tower. Chetrit, who pleaded guilty in 1990 to a felony count of violating federal customs law when he was operating his business of importing and exporting fabric,35 had already been active on the high-profile real estate scene. Just prior to his purchase of the Tower, Chetrit crafted the acquisition deals of two large Manhattan office properties—530 Fifth Avenue, for $210 million36 and 450 West 33rd Street for $171.5 million37—and in Miami—Roney Palace, a beach resort for $149.8 million38 – among others. In addition, Chetrit had already purchased other properties in the Chicago area. Moinian, an immigrant who came to the U.S. from Iran in the late 1970s, was also prominent in large real estate deals. Moinian and his group purchased several high-priced properties in New York City: 180 Maiden Lane for $355 million; 530 Fifth Avenue for $213 million; 95 Wall Street for $184 million; 1450 Broadway for $124 million; and 17 Battery Place North for $70 million.39
Chetrit’s group immediately made an offer of $840 million which MetLife accepted conditioned upon Chetrit forming a partnership with Feil to jointly acquire the Tower. Eastdil spoke with the other bidders, described as the “top five trophy landlords in the United States,” to see if any other offers were forthcoming at prices approaching this number. Eastdil received a unanimous response of “no” and Chetrit’s group won the deal.
35 Ray Smith, “Sears Tower Deal Marks Return of the Mogul,” The Wall Street Journal, May 11, 2004. 36 “$220 Million Fifth Ave. Sale - Joseph Chetrit,” Real Estate Weekly, February 25, 2004. 37 Real Estate Alert, January 14, 2004. 38 “Real Estate Developer Joseph Chetrit May or May Not Buy the Bankrupt Roney Palace Hotel and Condominiums for $153.5 million”, Knight Ridder/Tribune Business News, June 10, 2004.
38
39 Alison Gregor, “Will Building Buyers Bust?,” The Real Deal, March 2005.
39
In order to secure sole ownership and avoid a power struggle, Chetrit reportedly bought out Feil for $30 million. To alleviate MetLife’s concerns over Chetrit’s capacity to close such a large transaction, the purchase-and-sale agreement provided for $20 million in non-refundable earnest money and a five-day due diligence period. These actions are highly unusual and essentially eliminated any risk to MetLife for accepting Chetrit’s offer. It is estimated that the Chetrit group required approximately $80 million (or approximately 9.5% of the purchase price) in equity to acquire the Tower – see Exhibit 27:
Exhibit 27: Estimate of Equity Requirement
Purchase Price 840,000$ Payment for Feil Buyout 30,000 Legal & Other Professional Fees 5,000 Loan Origination Fees & Costs 10,000
All-In Purchase Price 885,000 Less: Gross Loan Amount 825,000$
Net Loan Reserves * (20,462) Net Loan Proceeds 804,538$ (804,538)
Cash Required to Close 80,462$
Source: Author's calculations.
* For purposes of simplicity, the lender's escrows for property taxes and insurance are assumed to equal the buyer's closing proration for property taxes and pre-paid insurance (if any).
Although it is difficult to determine the motives for why such a high premium was paid for the Tower, there was some speculation that the Chetrit group used the acquisition to defer taxes on income generated from another real estate transaction. Section 1031 of the U.S. Internal Revenue Code allows investors to defer capital gains taxes when they exchange similar properties. The Code specifies that the exchange must take place within a certain time period (usually 6 months) which could explain the hurried nature of the deal and the apparent high price paid for the Tower.
The CMBS Market Provides the Fuel
Commercial mortgage-backed securities are structured investment instruments that typically represent an undivided ownership interest in a group of mortgages, secured
The Sears Tower January 1, 2007 by income-producing commercial properties. Lease agreements signed by the tenants serve as the source of income from which the mortgage payments are ultimately made. Therefore, the quality of the properties, geographic regions in which the properties are located, and the creditworthiness of the tenant plays a part in assessing the overall risk of the CMBS offering.40 Typically, a CMBS offering is divided into two major classes of debt, a senior and a subordinated tranche - sometimes, these are referred to as the “A piece” and “B piece.” There are often several subclasses within each of these two major categories. Following the A and B debt pieces is an equity allocation generally referred to as the “residual- or equity-class shareholder.” As to be expected, the senior tranche receives the highest priority claim, followed by the subordinated “B” piece, and finally, the residual equity holders. Consistent with the CMBS lending environment and the very low interest rates at the time, Chetrit’s purchase price reflected the availability of plentiful mortgage debt. With the increased competitiveness in the CMBS market place, Bank of America emerged the victor due to what many industry observers thought to be its aggressiveness. This aggressiveness was rumored to have been motivated by the fact that Bank of America had recently lost a string of “mega” deals to other real estate investment banks and was, therefore, determined to originate this loan. This approach proved successful and during 2003-2004, Bank of America quickly ascended to the top of the League Tables. Some of its lending activity during this time period included:
$825 million for the Sears Tower in Chicago, $750 million for the Bank of America Center in San Francisco, $315 million for One Beacon Street in Boston, and $225 million for the Desert Passage at Aladdin in Las Vegas.
For the Tower acquisition, Bank of America provided Chetrit with an $825 million loan (in part, based upon a $925 million appraisal). This interest-only acquisition loan used floating-rate debt at a weighted-average of 225 basis points over the 1-month London Interbank Offered Rate (LIBOR). This represented 98% leverage on the sale price of $840 million. The term was 3 years, with three one-year extension options. The price required that Chetrit and his partners put up an estimated additional $80 million in equity and reserves for closing costs, various improvements, taxes and insurance. Including this amount, the deal was ultimately leveraged at 90%, and represented an implied cap rate of 7.08%. With financing in place, MetLife completed the sale to Chetrit on March 26, 2004.
40
40 William B. Brueggeman and Jeffrey D. Fisher, Real Estate Finance and Investments, McGraw-Hill/Irwin, 2005.
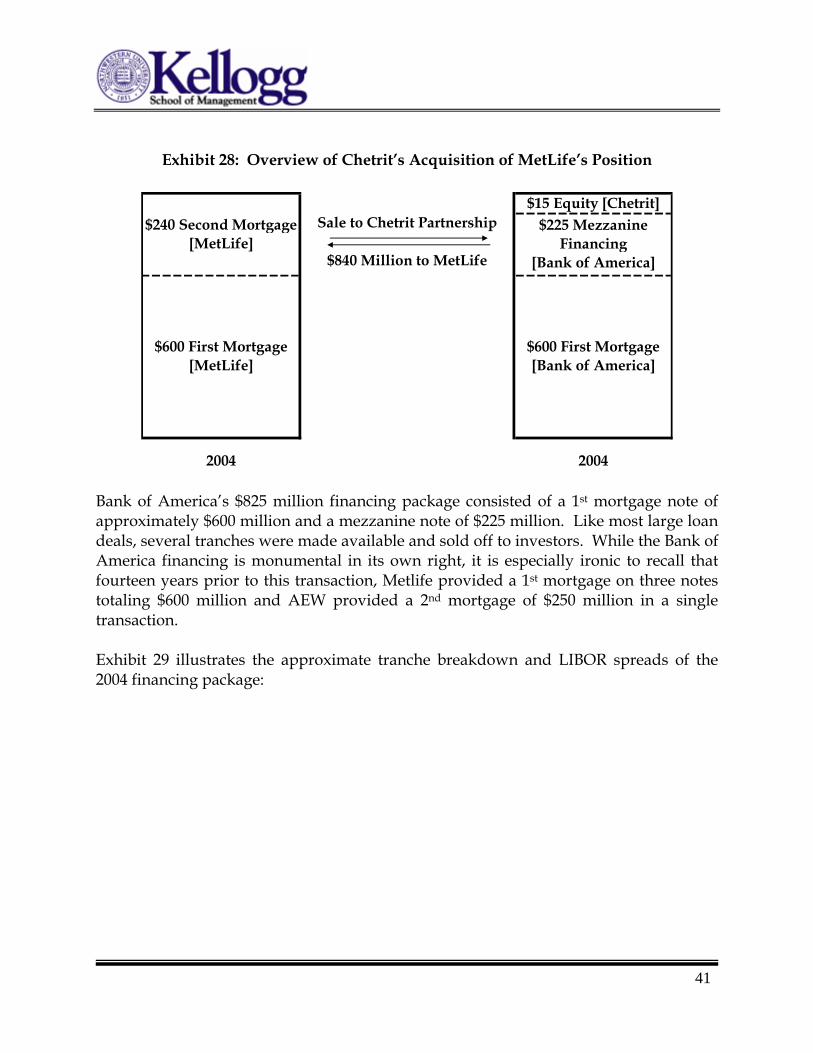
41
Exhibit 28: Overview of Chetrit’s Acquisition of MetLife’s Position
2004 2004
$600 First Mortgage [MetLife]
$600 First Mortgage [Bank of America]
$225 Mezzanine Financing
[Bank of America]
$240 Second Mortgage [MetLife]
$15 Equity [Chetrit]Sale to Chetrit Partnership
$840 Million to MetLife
Bank of America’s $825 million financing package consisted of a 1st mortgage note of approximately $600 million and a mezzanine note of $225 million. Like most large loan deals, several tranches were made available and sold off to investors. While the Bank of America financing is monumental in its own right, it is especially ironic to recall that fourteen years prior to this transaction, Metlife provided a 1st mortgage on three notes totaling $600 million and AEW provided a 2nd mortgage of $250 million in a single transaction. Exhibit 29 illustrates the approximate tranche breakdown and LIBOR spreads of the 2004 financing package:
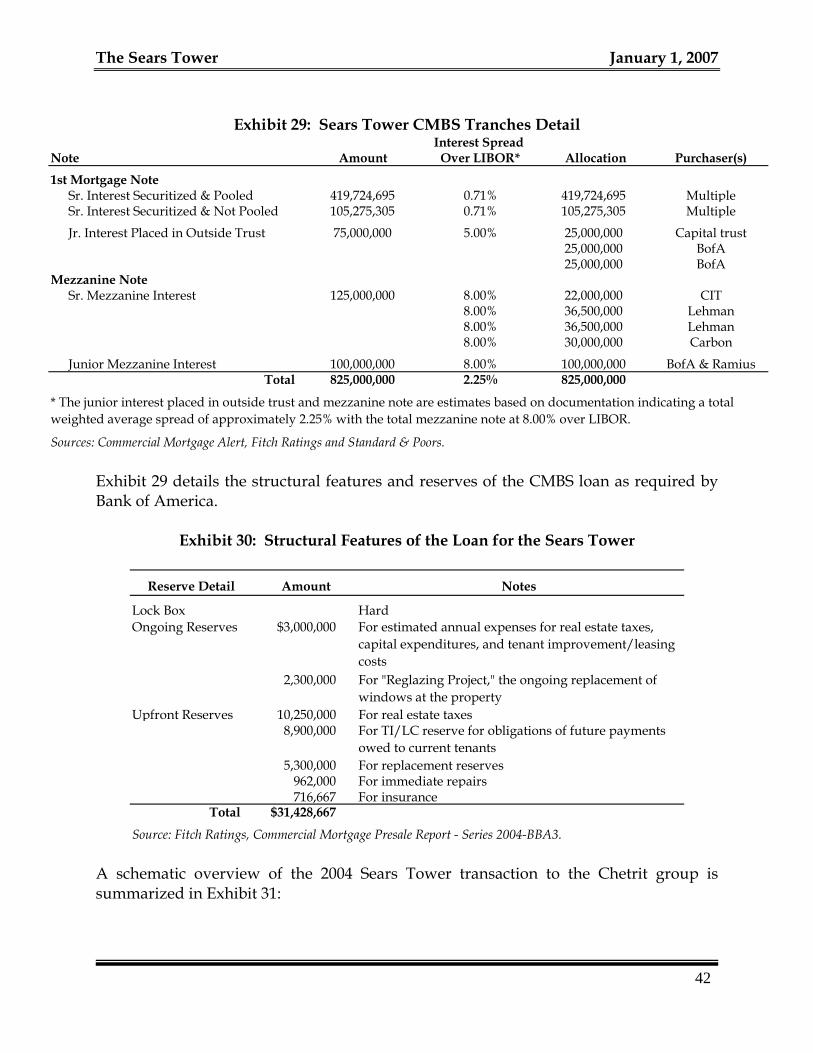
The Sears Tower January 1, 2007
42
Exhibit 29: Sears Tower CMBS Tranches Detail
Interest Spread Note Amount Over LIBOR* Allocation Purchaser(s)1st Mortgage Note
Sr. Interest Securitized & Pooled 419,724,695 0.71% 419,724,695 MultipleSr. Interest Securitized & Not Pooled 105,275,305 0.71% 105,275,305 Multiple
Jr. Interest Placed in Outside Trust 75,000,000 5.00% 25,000,000 Capital trust25,000,000 BofA25,000,000 BofA
Mezzanine NoteSr. Mezzanine Interest 125,000,000 8.00% 22,000,000 CIT
8.00% 36,500,000 Lehman8.00% 36,500,000 Lehman8.00% 30,000,000 Carbon
Junior Mezzanine Interest 100,000,000 8.00% 100,000,000 BofA & RamiusTotal 825,000,000 2.25%
Sources: Commercial Mortgage Alert, Fitch Ratings and Standard & Poors.
* The junior interest placed in outside trust and mezzanine note are estimates based on doc al weighted average spread of approximately 2.25% with the total mezzanine note at 8.00% over
825,000,000
umentation indicating a totLIBOR.
A schematic overview of the 2004 Sears Tower transaction to the Chetrit group is summarized in Exhibit 31:
Exhibit 29 details the structural features and reserves of the CMBS loan as required by Bank of America.
Reserve Detail Amount Notes
Lock Box HardOngoing Reserves $3,000,000 For estimated annual expenses for real estate taxes,
capital expenditures, and tenant improvement/leasing costs
2,300,000 For "Reglazing Project," the ongoing replacement of windows at the property
U
Exhibit 30: Structural Features of the Loan for the Sears Tower
pfront Reserves 10,250,000 For real estate taxes8,900,000 For TI/LC reserve for obligations of future payments
owed to current tenants5,300,000 For replacement reserves
962,000 For immediate repairs716,667 For insurance
Total $31,428,667
Source: Fitch Ratings, Commercial Mortgage Presale Report - Series 2004-BBA3.
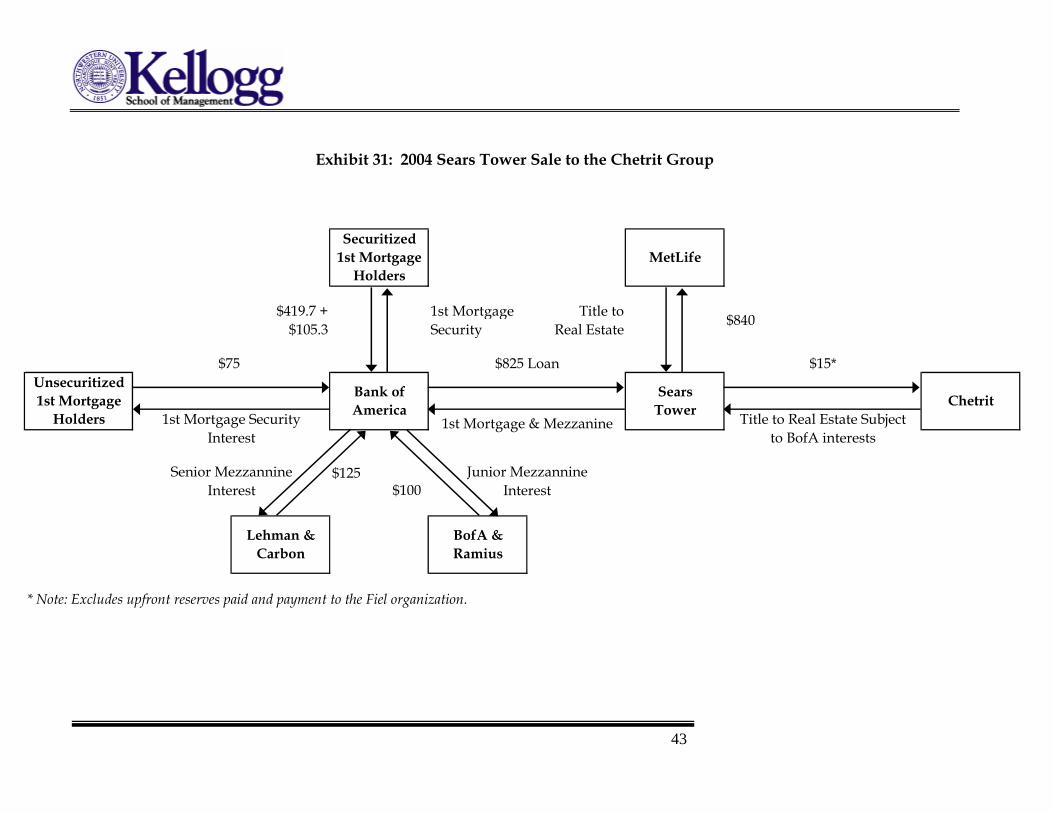
43
$125$100
des upfront reserves paid and payment to the Fiel organization.
Senior MezzannineInterest
$15*$825 Loan
SearsTower
itized ortgage
Lehman & Carbon
BofA &Ramius
Title to
Exhibit 31: 2004 Sears Tower Sale to the Chetrit Group
* Note: Exclu
Unsecur1st M
Holders
Real Estate
1st Mortgage Security
$419.7 +$105.3
$75
Junior MezzannineInterest
Bank of America1st Mortgage Security
Interest
Chetrit
MetLifeSecuritized
1st Mortgage Holders
$840
1st Mortgage & Mezzanine Title to Real Estate Subjectto BofA interests
The Sears Tower January 1, 2007
It was also widely rumored that the Fiel organization has a $10-20 million interest in the junior mezzanine note. If true, this move may indicate that the firm had a “win/win” proposition: If Chetrit overpaid for the Sears Tower and eventually defaults, Feil may then end up owning the Sears Tower after all. If not, he still was able to secure a high yielding piece of mezzanine debt apparently using a portion of the $30 million buy-out payment that was originally supplied by Chetrit. Bank of America included the loan for the Sears Tower in a pool established by Bear Stearns, which securitized a number of loans and brought the entire pooled transaction to the market. For most CMBS transactions, the rating agencies will review the underlying assets in the pool and provide an independent assessment of the risk and creditworthiness of the offering. Three well-known agencies that serve this space include Fitch Ratings, Moody’s Investors Service and Standard & Poors. Each reviewed the CMBS offering conducted by Bear Stearns and provided specific strengths and weaknesses on both the entire pool and the Sears Tower portion, since it was such a large percentage of the total pool (approximately 39% of the total). The complete securitized offering by Bear Stearns, dated July 27, 2004, of pooled mortgages including the Sears Tower is detailed below in Exhibit 32.
44
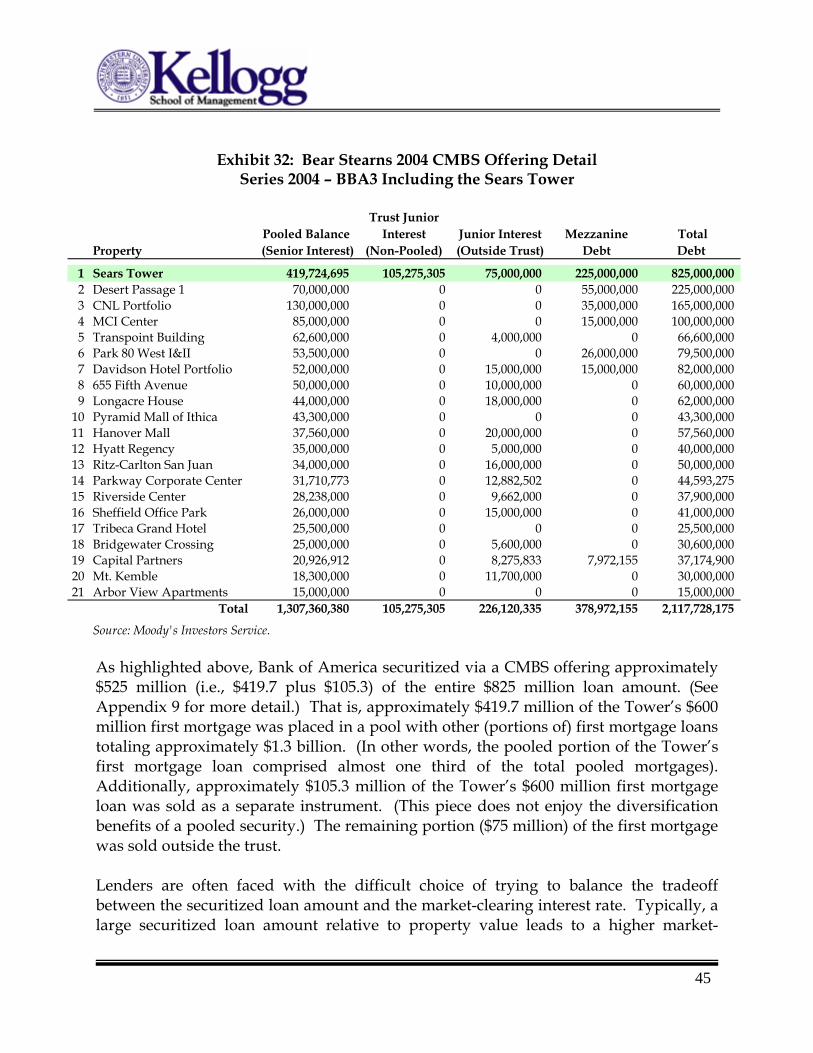
45
Exhibit 32: Bear Stearns 2004 CMBS Offering Detail
Series 2004 – BBA3 Including the Sears Tower
Trust JuniorPooled Balance Interest Junior Interest Mezzanine Total
Property (Senior Interest) (Non-Pooled) (Outside Trust) Debt Debt
1 Sears Tower 419,724,695 105,275,305 75,000,000 225,000,000 825,000,0002 Desert Passage 1 70,000,000 0 0 55,000,000 225,000,0003 CNL Portfolio 130,000,000 0 0 35,000,000 165,000,0004 MCI Center 85,000,000 0 0 15,000,000 100,000,0005 Transpoint Building 62,600,000 0 4,000,000 0 66,600,0006 Park 80 West I&II 53,500,000 0 0 26,000,000 79,500,0007 Davidson Hotel Portfolio 52,000,000 0 15,000,000 15,000,000 82,000,0008 655 Fifth Avenue 50,000,000 0 10,000,000 0 60,000,0009 Longacre House 44,000,000 0 18,000,000 0 62,000,000
10 Pyramid Mall of Ithica 43,300,000 0 0 0 43,300,00011 Hanover Mall 37,560,000 0 20,000,000 0 57,560,00012 Hyatt Regency 35,000,000 0 5,000,000 0 40,000,00013 Ritz-Carlton San Juan 34,000,000 0 16,000,000 0 50,000,00014 Parkway Corporate Center 31,710,773 0 12,882,502 0 44,593,27515 Riverside Center 28,238,000 0 9,662,000 0 37,900,00016 Sheffield Office Park 26,000,000 0 15,000,000 0 41,000,00017 Tribeca Grand Hotel 25,500,000 0 0 0 25,500,00018 Bridgewater Crossing 25,000,000 0 5,600,000 0 30,600,00019 Capital Partners 20,926,912 0 8,275,833 7,972,155 37,174,90020 Mt. Kemble 18,300,000 0 11,700,000 0 30,000,00021 Arbor View Apartments 15,000,000 0 0 0 15,000,000
Total 1,307,360,380 105,275,305 226,120,335 378,972,155 2,117,728,175
Source: Moody's Investors Service.
As highlighted above, Bank of America securitized via a CMBS offering approximately $525 million (i.e., $419.7 plus $105.3) of the entire $825 million loan amount. (See Appendix 9 for more detail.) That is, approximately $419.7 million of the Tower’s $600 million first mortgage was placed in a pool with other (portions of) first mortgage loans totaling approximately $1.3 billion. (In other words, the pooled portion of the Tower’s first mortgage loan comprised almost one third of the total pooled mortgages). Additionally, approximately $105.3 million of the Tower’s $600 million first mortgage loan was sold as a separate instrument. (This piece does not enjoy the diversification benefits of a pooled security.) The remaining portion ($75 million) of the first mortgage was sold outside the trust. Lenders are often faced with the difficult choice of trying to balance the tradeoff between the securitized loan amount and the market-clearing interest rate. Typically, a large securitized loan amount relative to property value leads to a higher market-
The Sears Tower January 1, 2007 clearing interest rate. In the same vein, a more concentrated pool offering (whether its loan size/allocation, property type, geographic area, borrower or sponsor) is viewed as a more risky investment and, therefore, increases the market-clearing interest rate. In the case of the Sears Tower, Bank of America may have received feedback from ratings agencies that a CMBS pool with a smaller Sears Tower concentration, given its inherent strengths and weaknesses, may have been viewed more favorably. Consequently, approximately $525 million of the $600 million first mortgage loan was securitized. The $75 million balance of first mortgage loan was sold outside the CMBS offering. Additionally, the $225 million second/mezzanine mortgage was separated into “senior” and “junior” pieces and sold privately. This is not an uncommon practice for lenders to “sell off” a portion of the total loan since this course of action will significantly reduce the amount of risk the lender faces. Again, separation into senior and junior tranches will balance the potential rewards of the loan/interest payouts and the risk taken by the note holders. As shown in Exhibit 32, the $525 million securitized portion of the Sears Tower loan was divided into a “pooled” senior interest and a “non-pooled” junior interest. The main difference between the two is the primary reason CMBS transactions are so popular: sequential-pay bond structures. A sequential-pay structure means that as principal from the underlying loans is paid, it is allocated to the top of the structure first (the highest rated tranches or in this case the “pooled” senior interests) and continues down through the bond structure in sequential order after each bond is paid off. In contrast, loan losses work from the other direction as they are applied to the lowest-rated tranche outstanding (in this case the “non-pooled” junior interest) and continue upward through the structure.41 In industry parlance, the subordinated positions are sometimes referred to as “rake certificates.” Generally speaking, losses in respect to the loan would be applied first to the subordinate “non-pooled” interest. Once the subordinate “non-pooled” interest reaches zero, further losses would then be applied to the senior “pooled” component.42 Hence, by keeping approximately $105 million of the loan securitized but non-pooled, Bank of America may have satisfied certain feedback it received from the ratings agencies regarding loan size, portfolio concentration, and overall risk.
41 Wachovia Securities, “Real Estate in Real Terms, Wachovia Real Estate Primer,” July 2005.
46
42 Commercial Mortgage Securities Association, “CMBS World,” Spring 2005.
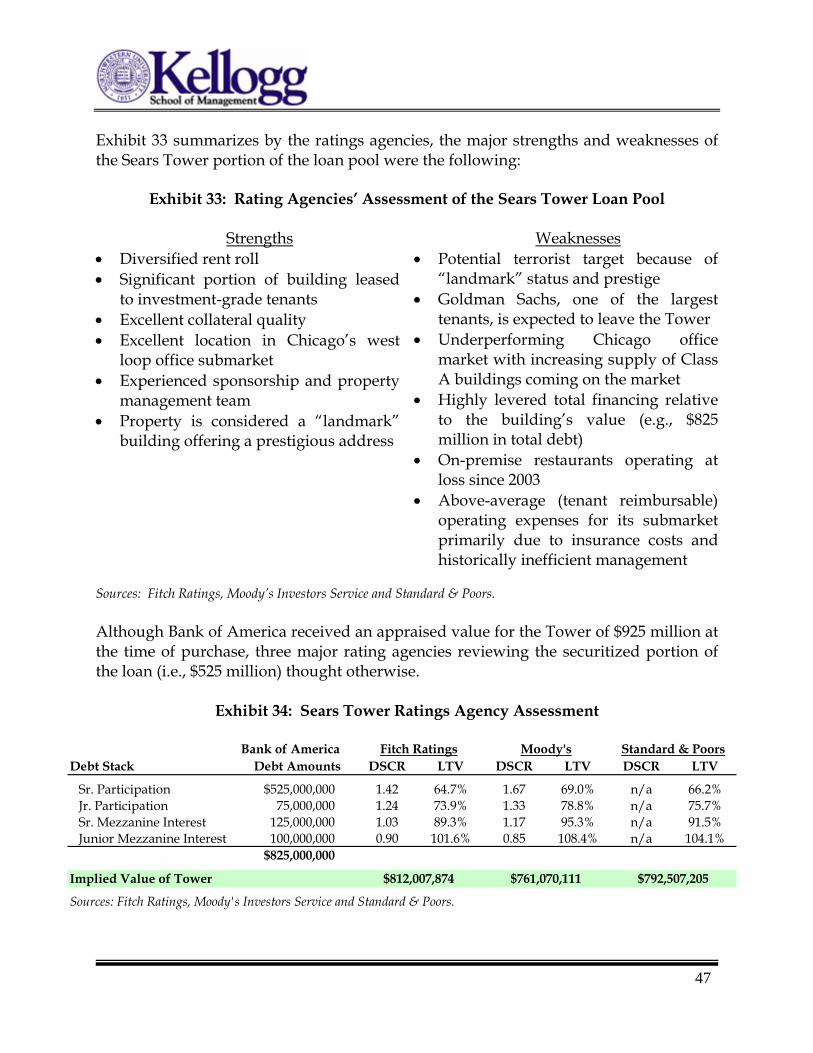
47
Exhibit 33 summarizes by the ratings agencies, the major strengths and weaknesses of the Sears Tower portion of the loan pool were the following:
Exhibit 33: Rating Agencies’ Assessment of the Sears Tower Loan Pool
Strengths Weaknesses
• Diversified rent roll • Significant portion of building leased
to investment-grade tenants • Excellent collateral quality • Excellent location in Chicago’s west
loop office submarket • Experienced sponsorship and property
management team • Property is considered a “landmark”
building offering a prestigious address
• Potential terrorist target because of “landmark” status and prestige
• Goldman Sachs, one of the largest tenants, is expected to leave the Tower
• Underperforming Chicago office market with increasing supply of Class A buildings coming on the market
• Highly levered total financing relative to the building’s value (e.g., $825 million in total debt)
• On-premise restaurants operating at loss since 2003
• Above-average (tenant reimbursable) operating expenses for its submarket primarily due to insurance costs and historically inefficient management
Sources: Fitch Ratings, Moody’s Investors Service and Standard & Poors. Although Bank of America received an appraised value for the Tower of $925 million at the time of purchase, three major rating agencies reviewing the securitized portion of the loan (i.e., $525 million) thought otherwise.
Exhibit 34: Sears Tower Ratings Agency Assessment
Bank of America Fitch Ratings Moody's Standard & PoorsDebt Stack Debt Amounts DSCR LTV DSCR LTV DSCR LTV
Sr. Participation $525,000,000 1.42 64.7% 1.67 69.0% n/a 66.2%Jr. Participation 75,000,000 1.24 73.9% 1.33 78.8% n/a 75.7%Sr. Mezzanine Interest 125,000,000 1.03 89.3% 1.17 95.3% n/a 91.5%Junior Mezzanine Interest 100,000,000 0.90 101.6% 0.85 108.4% n/a 104.1%
$825,000,000
Implied Value of Tower $812,007,874 $761,070,111 $792,507,205
Sources: Fitch Ratings, Moody's Investors Service and Standard & Poors.
The Sears Tower January 1, 2007 The Chetrit group opted for a floating-rate loan lasting three years with three one-year extensions. Although interest rates for fixed- as well as floating-rate loans were at historically low levels (please refer to Exhibit 35), Chetrit – like a significant number of other borrowers at the time - may have chosen short-term floating-rate debt for the following reasons:
• Fixed-rate debt is generally more costly. • Reduced cost of floating-rate debt provides buffer to reinvest in Sears Tower to
increase NOI by: – Increasing occupancy levels, – Improving facilities, grounds or systems, – Bumping tenant rents upon lease expiration, and/or – Repositioning and retail space and sky-deck income.
• Lockout, prepayment and defeasance provisions are generally less restrictive and not as costly.
As the following exhibit shows, LIBOR rates for the period between 2003 and 2004 (and approximately concurrent with the Chetrit Group’s acquisition of the Tower) had dipped to the lowest point in 10 years. Had Chetrit financed the Tower with fixed-rate debt, (the same exhibit displays 5- and 10-year Treasury rates during this same time period (generally fixed-rate loans are based on a spread over Treasury rates)), the differential would have been approximately $12 million in annual debt service when calculated at the time of loan origination (using the 10-year Treasury rate as the benchmark for the fixed-rate financing alternative). As shown in Exhibit 35, this differential narrowed considerably in 2005.
48
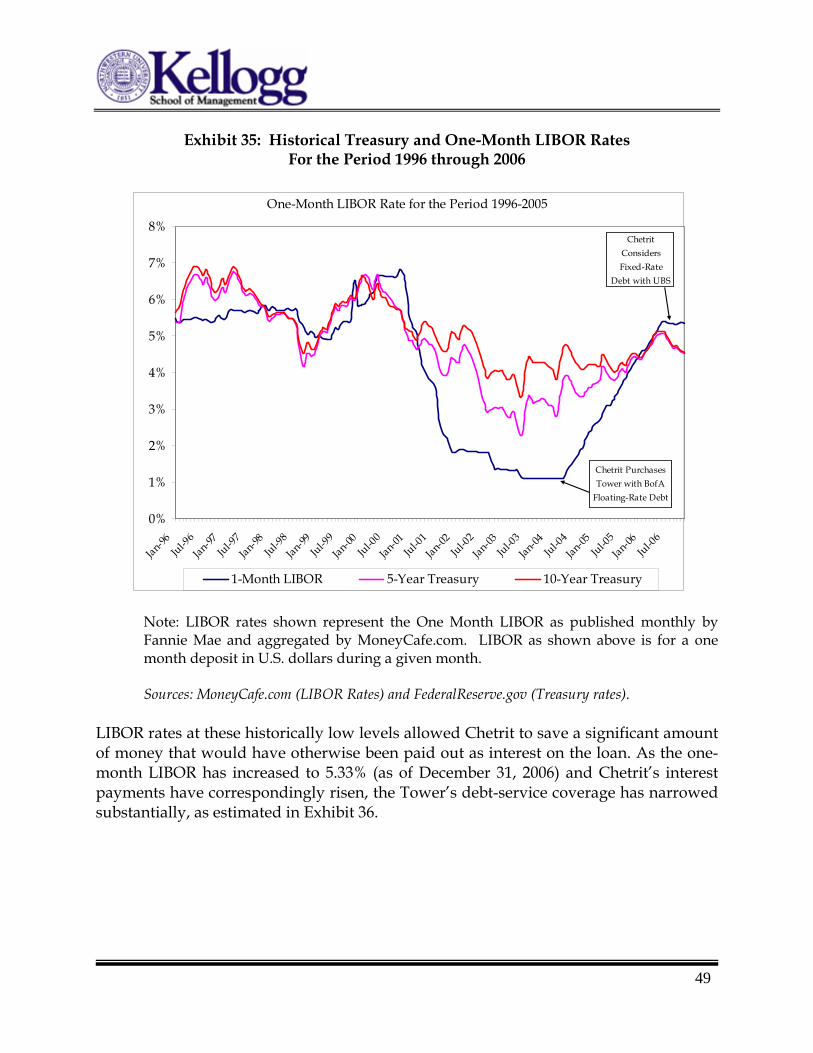
49
Exhibit 35: Historical Treasury and One-Month LIBOR Rates For the Period 1996 through 2006
One-Month LIBOR Rate for the Period 1996-2005
0%
1%
2%
3%
4%
5%
6%
7%
8%
Jan-96Jul-9
6Jan-97
Jul-97
Jan-98Jul-9
8Jan-99
Jul-99
Jan-00Jul-0
0Jan-01
Jul-01
Jan-02Jul-0
2Jan-03
Jul-03
Jan-04Jul-0
4Jan-05
Jul-05
Jan-06Jul-0
6
1-Month LIBOR 5-Year Treasury 10-Year Treasury
Chetrit Considers Fixed-Rate
Debt with UBS
Chetrit Purchases Tower with BofA
Floating-Rate Debt
Note: LIBOR rates shown represent the One Month LIBOR as published monthly by Fannie Mae and aggregated by MoneyCafe.com. LIBOR as shown above is for a one month deposit in U.S. dollars during a given month.
Sources: MoneyCafe.com (LIBOR Rates) and FederalReserve.gov (Treasury rates).
LIBOR rates at these historically low levels allowed Chetrit to save a significant amount of money that would have otherwise been paid out as interest on the loan. As the one-month LIBOR has increased to 5.33% (as of December 31, 2006) and Chetrit’s interest payments have correspondingly risen, the Tower’s debt-service coverage has narrowed substantially, as estimated in Exhibit 36.
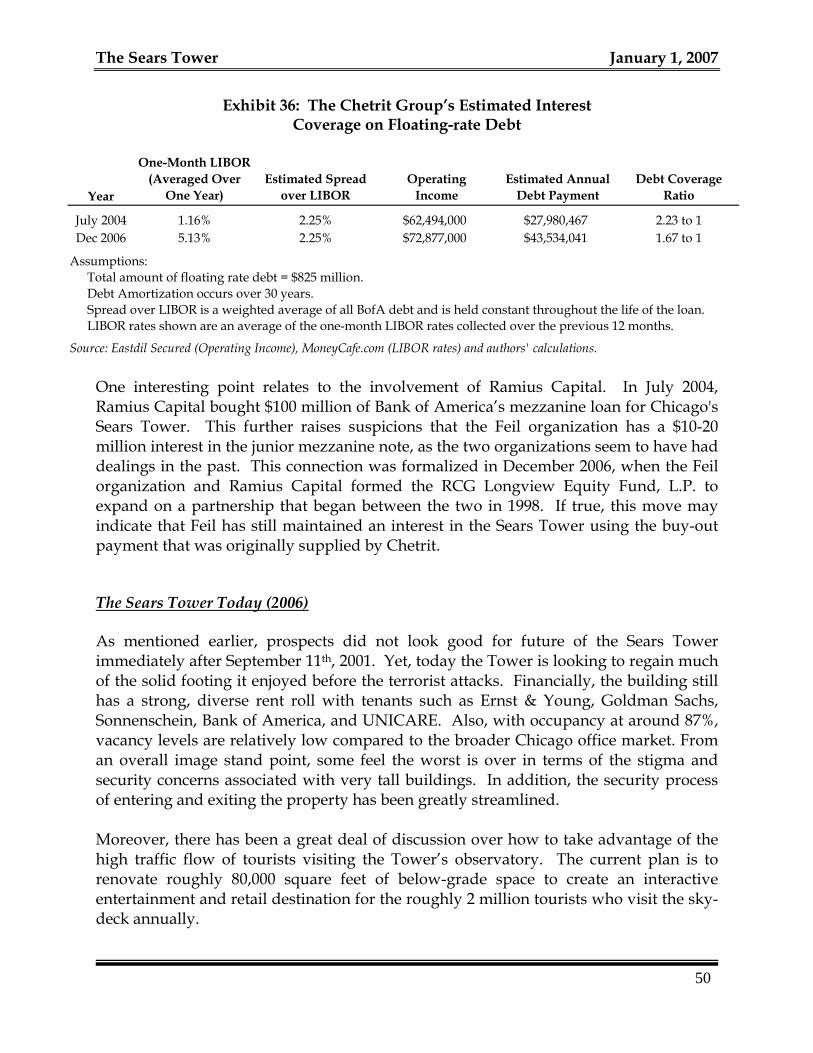
The Sears Tower January 1, 2007
Exhibit 36: The Chetrit Group’s Estimated Interest Coverage on Floating-rate Debt
Year
One-Month LIBOR (Averaged Over
One Year)Estimated Spread
over LIBOROperating
IncomeEstimated Annual
Debt PaymentDebt Coverage
Ratio
July 2004 1.16% 2.25% $62,494,000 $27,980,467 2.23 to 1Dec 2006 5.13% 2.25% $72,877,000 $43,534,041 1.67 to 1
Assumptions: Total amount of floating rate debt = $825 million.Debt Amortization occurs over 30 years.Spread over LIBOR is a weighted average of all BofA debt and is held constant throughout the life of the loan.LIBOR rates shown are an average of the one-month LIBOR rates collected over the previous 12 months.
Source: Eastdil Secured (Operating Income), MoneyCafe.com (LIBOR rates) and authors' calculations. One interesting point relates to the involvement of Ramius Capital. In July 2004, Ramius Capital bought $100 million of Bank of America’s mezzanine loan for Chicago's Sears Tower. This further raises suspicions that the Feil organization has a $10-20 million interest in the junior mezzanine note, as the two organizations seem to have had dealings in the past. This connection was formalized in December 2006, when the Feil organization and Ramius Capital formed the RCG Longview Equity Fund, L.P. to expand on a partnership that began between the two in 1998. If true, this move may indicate that Feil has still maintained an interest in the Sears Tower using the buy-out payment that was originally supplied by Chetrit.
The Sears Tower Today (2006)
As mentioned earlier, prospects did not look good for future of the Sears Tower immediately after September 11th, 2001. Yet, today the Tower is looking to regain much of the solid footing it enjoyed before the terrorist attacks. Financially, the building still has a strong, diverse rent roll with tenants such as Ernst & Young, Goldman Sachs, Sonnenschein, Bank of America, and UNICARE. Also, with occupancy at around 87%, vacancy levels are relatively low compared to the broader Chicago office market. From an overall image stand point, some feel the worst is over in terms of the stigma and security concerns associated with very tall buildings. In addition, the security process of entering and exiting the property has been greatly streamlined. Moreover, there has been a great deal of discussion over how to take advantage of the high traffic flow of tourists visiting the Tower’s observatory. The current plan is to renovate roughly 80,000 square feet of below-grade space to create an interactive entertainment and retail destination for the roughly 2 million tourists who visit the sky-deck annually. 50
51
On the other hand, there have been some negative events. This would include the recent construction efforts of several Class A competitor buildings in the downtown business district, such as Mesirow Financial’s 1.2-million-square-feet tower at 353 N. Clark Street and Hines’ 1.3-million-square-feet tower at 300 N. LaSalle Street, both slated for completion in 2009. Also, a few buildings have recently opened and are now competing with the Sears Tower for tenants. (See Appendix 10.) These buildings include:
191 N. Wacker - 734,500 rentable square feet
-Developer: Hines, 2003 Dearborn Center
- 1,400,00 rentable square feet -Developer: Beitler/Prime, 2003 540 W. Madison
- 1,300,000 rentable square feet -Developer: ABN AMRO/Hines, 2004
71 South Wacker (Hyatt Center)
- 1,550,000 rentable square feet -Developer: Prime/Pritzker, 2005
111 S. Wacker (Deloitte)
- 970,000 rentable square feet -Developer: The John Buck Co., 2005
1 S. Dearborn
- 800,000 rentable square feet -Developer: Hines, 2006
Prior to their lease maturities and as suspected, Goldman Sachs and Merrill Lynch elected to prematurely leave the Sears Tower, choosing to relocate to 71 South Wacker and 1 North Wacker, respectively. These two tenants occupied 243,311 square feet (Goldman) and 46,876 (Merrill Lynch), representing an additional 7.6% vacancy. As these leases have yet to expire (Goldman expires in February 2011 and Merrill Lynch in June of 2008), this space has entered the sublease market, cannibalizing potential new tenants for the Tower. Nonetheless, over the past three years, CB Richard Ellis has managed to sign roughly 600,000 square feet of new leases, broken down as 400,000 in renewals or expansions, and 200,000 in new tenancy. The Merrill and Goldman spaces
The Sears Tower January 1, 2007 are predominately located on floors 50 through 69 which, in addition to great views, have the desirable 40,000 square foot floor plate, making this space very attractive. Currently, the majority of vacant space falls below the 20th floor and on the Tower’s largest floor plates. According to CBRE, however, the weakened market has dropped average rents from the $18-24 per square foot range pre-9/11 to the $10-14 per square foot range currently. Nevertheless, there has reportedly been interest in the naming rights and CBRE expects a Tower renaming scenario in the coming years. It is rumored that renaming the Tower could fetch up to an additional $10 million in revenue annually. In March of 2007, the owners of the Sears Tower selected U.S. Equities to handle leasing and management after CB Richard Ellis resigned in November 2006.(CBRE was handling duties in the interim). U.S. Equities was chosen in large part for their success in positioning the John Hancock Center in Chicago during the 1990s. Vacancies for the Tower hit 21.8% during the third quarter of 2006, but recently have rebounded to 17.7%, due in large part to expansions by key tenants.43
As noted earlier, another source of income for the Tower is the revenue generated from the leasing of rooftop space for telecommunications antennas. Previously, there appeared to be few buildings with the height necessary to compete against the Sears Tower for this business. However, recent plans by other Chicago developers may jeopardize this income stream. Paul Beitler and LR Development Co. unveiled plans in October 2005 for a 2,000 foot-tall broadcast center, to be built in downtown Chicago.44 In addition, developer Garrett Kelleher of Dublin, Ireland-based Shelbourne Development Ltd. has mentioned placing a broadcast antenna on top of its 2,000 foot spiral high rise, dubbed the Chicago Spire. Although these developments are still in question, they pose a risk to a previously secure source of income for Sears Tower. Two years after acquiring the Tower, the Chetrit group is apparently seeking to refinance the Tower. The partnership has hired Carlton Group, a New York real estate investment bank, to explore refinancing the building’s $825 million mortgage and “bringing in an institutional equity partner,” says a person familiar with the situation. It’s reported that Chetrit’s group wants to sell as much as $200 in preferred equity in the building.45 This deal would potentially allow Joseph Chetrit and his partners to recoup their equity investment and take profits from the deal while remaining in control of the asset. In marketing the property for refinancing, the Carlton Group indicates that: 43 Thomas A. Corfman, “Sears Tower Owners Tap New Firm for Leasing, Management,” Crain’s Chicago Business, March 17, 2007. 44 Thomas A. Corfman, “Tweezer Broadcast Tower Off the Horizon,” Chicago Tribune, March 10, 2006.
52
45 Alby Gallun, “Sears Tower Owner Seeks Refinancing,” Crain’s Chicago Business, March 6, 2006.
53
530,000 square feet of leases have been renewed, 120,000 square feet of vacant space has been leased, 200,000 square feet of leases are projected to be signed this year, $8,000,000 will be spent on renovating the observation deck, restaurant space has been repositioned with Sodexho operating 4 restaurants and
adding catering and other services, and additional opportunities being explored are:
• leasing of signage space, and • selling of naming rights
The State of the Office Market As indicated in Exhibit 37, the downtown Chicago office market has steadily deteriorated since 1996 as total rentable building area increased to approximately 380 million while occupancy levels were at approximately 340 million. In 2005, the office sector was dominated by a strong investment market selling $20 billion. Some of this office space was vacant, with many of these properties were being redeveloped into residential condos. In regards to new developments, the office investment market combined with developers generally looking to pre-lease expensive new construction to “marquis” tenants has provided fuel to the new construction building market, keeping a steady line of new office projects in the construction pipeline. While prices for vacant properties increased, CBD buildings specifically experienced an increase of 52%.46
46 “Office Capital Trends Monthly, March 2006,” Real Capital Analytics.
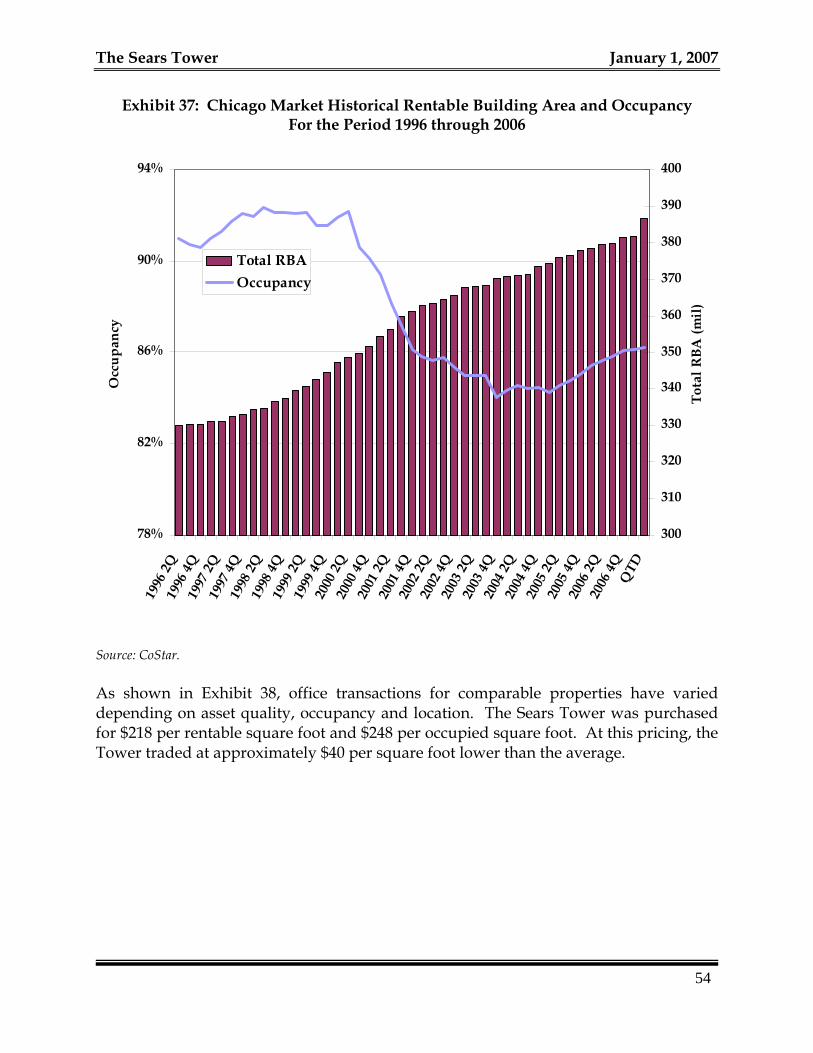
The Sears Tower January 1, 2007
Exhibit 37: Chicago Market Historical Rentable Building Area and Occupancy For the Period 1996 through 2006
78%
82%
86%
90%
94%19
96 2
Q19
96 4
Q19
97 2
Q19
97 4
Q19
98 2
Q19
98 4
Q19
99 2
Q19
99 4
Q20
00 2
Q20
00 4
Q20
01 2
Q20
01 4
Q20
02 2
Q20
02 4
Q20
03 2
Q20
03 4
Q20
04 2
Q20
04 4
Q20
05 2
Q20
05 4
Q20
06 2
Q20
06 4
TD
Occ
upan
cy
300
310
320
330
340
350
360
370
380
390
400
Tota
l RBA
(mil
)
Total RBAOccupancy
Source: CoStar. As shown in Exhibit 38, office transactions for comparable properties have varied depending on asset quality, occupancy and location. The Sears Tower was purchased for $218 per rentable square foot and $248 per occupied square foot. At this pricing, the Tower traded at approximately $40 per square foot lower than the average.
54
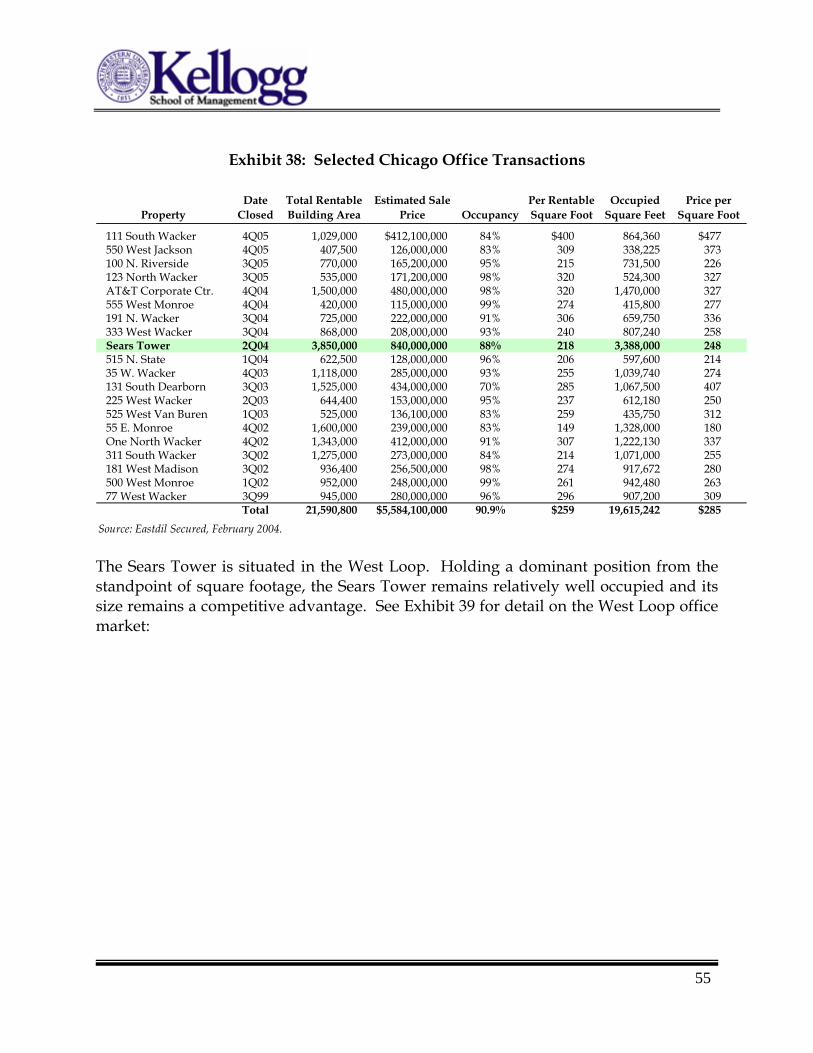
55
Exhibit 38: Selected Chicago Office Transactions
Property Date
ClosedTotal Rentable Building Area
Estimated Sale Price Occupancy
Per Rentable Square Foot
Occupied Square Feet
Price per Square Foot
111 South Wacker 4Q05 1,029,000 $412,100,000 84% $400 864,360 $477550 West Jackson 4Q05 407,500 126,000,000 83% 309 338,225 373100 N. Riverside 3Q05 770,000 165,200,000 95% 215 731,500 226123 North Wacker 3Q05 535,000 171,200,000 98% 320 524,300 327AT&T Corporate Ctr. 4Q04 1,500,000 480,000,000 98% 320 1,470,000 327555 West Monroe 4Q04 420,000 115,000,000 99% 274 415,800 277191 N. Wacker 306 659,750 336333 West Wacker 240 807,240 258Sears Tower 218 3,388,000 248515 N. State 206 597,600 21435 W. Wacker 255 1,039,740 274131 South Dear 285 1,067,500 407225 West Wacker 237 612,180 250525 West Van 259 435,750 31255 E. Monroe 149 1,328,000 180One North Wacke 307 1,222,130 337311 South Wac 214 1,071,000 255181 West Ma 274 917,672 280500 West Monr 261 942,480 26377 West Wacker 296 907,200 309
$259 19,615,242 $285Source: Eastdil Se
3Q04 725,000 222,000,000 91%3Q04 868,000 208,000,000 93%2Q04 3,850,000 840,000,000 88%1Q04 622,500 128,000,000 96%4Q03 1,118,000 285,000,000 93%
born 3Q03 1,525,000 434,000,000 70%2Q03 644,400 153,000,000 95%
Buren 1Q03 525,000 136,100,000 83%4Q02 1,600,000 239,000,000 83%
r 4Q02 1,343,000 412,000,000 91%ker 3Q02 1,275,000 273,000,000 84%
dison 3Q02 936,400 256,500,000 98%oe 1Q02 952,000 248,000,000 99%
3Q99 945,000 280,000,000 96%Total 21,590,800 $5,584,100,000 90.9%
cured, February 2004. The Sears Tower is situated in the West Loop. Holding a dominant position from the standpoint of square footage, the Sears Tower remains relatively well occupied and its size remains a competitive advantage. See Exhibit 39 for detail on the West Loop office market:
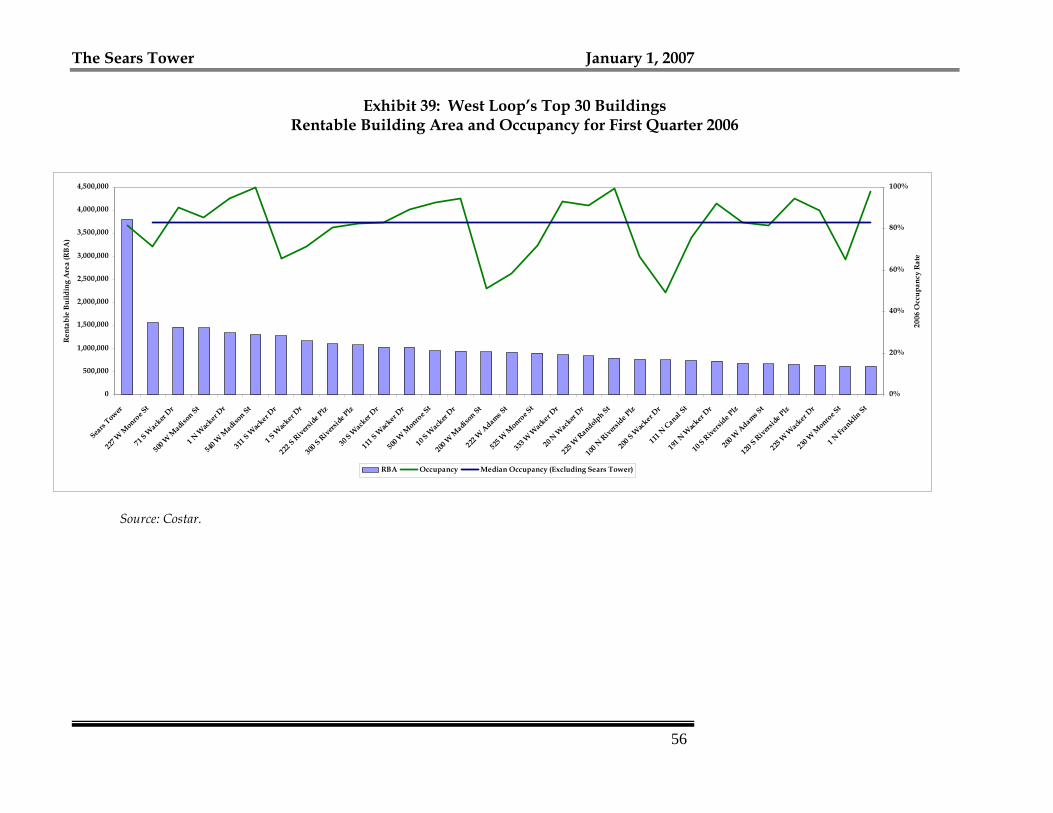
January 1, 2007
56
0
500,000
1,000,000
1,500,000
2,000,000
2,500,000
3,000,000
3,500,000
4,000,000
4,500,000
Sears
Tower22
7 W M
onro
e St
71 S W
acker
Dr
500 W
Mad
ison St
1 N W
acker
Dr
540 W
Madis
on St31
1 S W
acker D
r1 S
Wack
er Dr
222 S Rivers
ide Plz
300 S
Riversi
de Plz
30 S W
acker
Dr111
S Wack
er Dr
500 W
Mon
roe S
t10
S Wack
er Dr
200 W
Madis
on St222
W A
dams S
t
525 W
Monro
e St
333 W
Wack
er Dr
20 N W
acker
Dr
225 W
Randolph St
100 N
Riverside Plz
200 S
Wack
er Dr
111 N
Canal St
191 N
Wack
er Dr
10 S R
iverside P
lz200
W A
dams St
120 S
Riverside
Plz
225 W
Wack
er Dr
230 W
Monro
e St
1 N Fr
anklin
St
0%
20%
40%
60%
80%
100%
2006
Occ
upan
cy R
ate
Ren
tabl
e B
uild
ing
Are
a (R
BA
)
RBA Occupancy Median Occupancy (Excluding Sears Tower)
Exhibit 39: West Loop’s Top 30 Buildings Rentable Building Area and Occupancy for First Quarter 2006
Source: Costar.
The Sears Tower
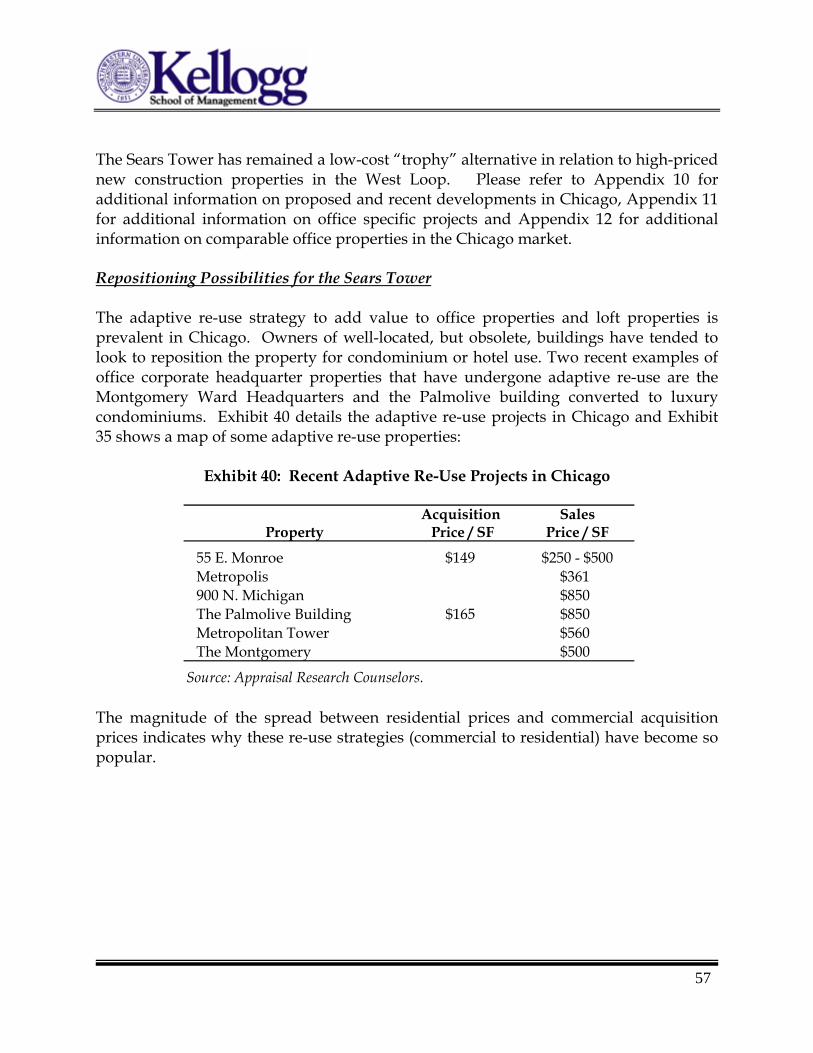
57
The Sears Tower has remained a low-cost “trophy” alternative in relation to high-priced new construction properties in the West Loop. Please refer to Appendix 10 for additional information on proposed and recent developments in Chicago, Appendix 11 for additional information on office specific projects and Appendix 12 for additional information on comparable office properties in the Chicago market. Repositioning Possibilities for the Sears Tower The adaptive re-use strategy to add value to office properties and loft properties is prevalent in Chicago. Owners of well-located, but obsolete, buildings have tended to look to reposition the property for condominium or hotel use. Two recent examples of office corporate headquarter properties that have undergone adaptive re-use are the Montgomery Ward Headquarters and the Palmolive building converted to luxury condominiums. Exhibit 40 details the adaptive re-use projects in Chicago and Exhibit 35 shows a map of some adaptive re-use properties:
Exhibit 40: Recent Adaptive Re-Use Projects in Chicago
Acquisition SalesProperty Price / SF Price / SF
55 E. Monroe $149 $250 - $500Metropolis $361900 N. Michigan $850The Palmolive Building $165 $850Metropolitan Tower $560The Montgomery $500
Source: Appraisal Research Counselors.
The magnitude of the spread between residential prices and commercial acquisition prices indicates why these re-use strategies (commercial to residential) have become so popular.
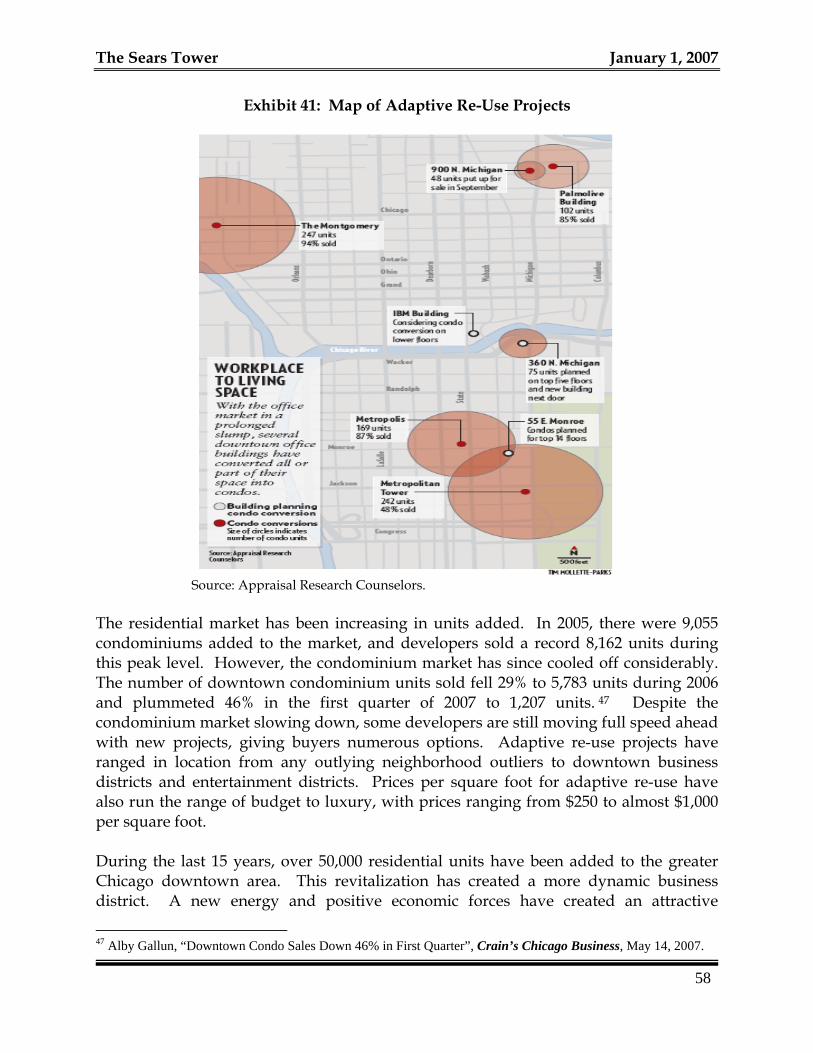
The Sears Tower January 1, 2007
Exhibit 41: Map of Adaptive Re-Use Projects
Source: Appraisal Research Counselors.
The residential market has been increasing in units added. In 2005, there were 9,055 condominiums added to the market, and developers sold a record 8,162 units during this peak level. However, the condominium market has since cooled off considerably. The number of downtown condominium units sold fell 29% to 5,783 units during 2006 and plummeted 46% in the first quarter of 2007 to 1,207 units. 47 Despite the condominium market slowing down, some developers are still moving full speed ahead with new projects, giving buyers numerous options. Adaptive re-use projects have ranged in location from any outlying neighborhood outliers to downtown business districts and entertainment districts. Prices per square foot for adaptive re-use have also run the range of budget to luxury, with prices ranging from $250 to almost $1,000 per square foot. During the last 15 years, over 50,000 residential units have been added to the greater Chicago downtown area. This revitalization has created a more dynamic business district. A new energy and positive economic forces have created an attractive
58
47 Alby Gallun, “Downtown Condo Sales Down 46% in First Quarter”, Crain’s Chicago Business, May 14, 2007.
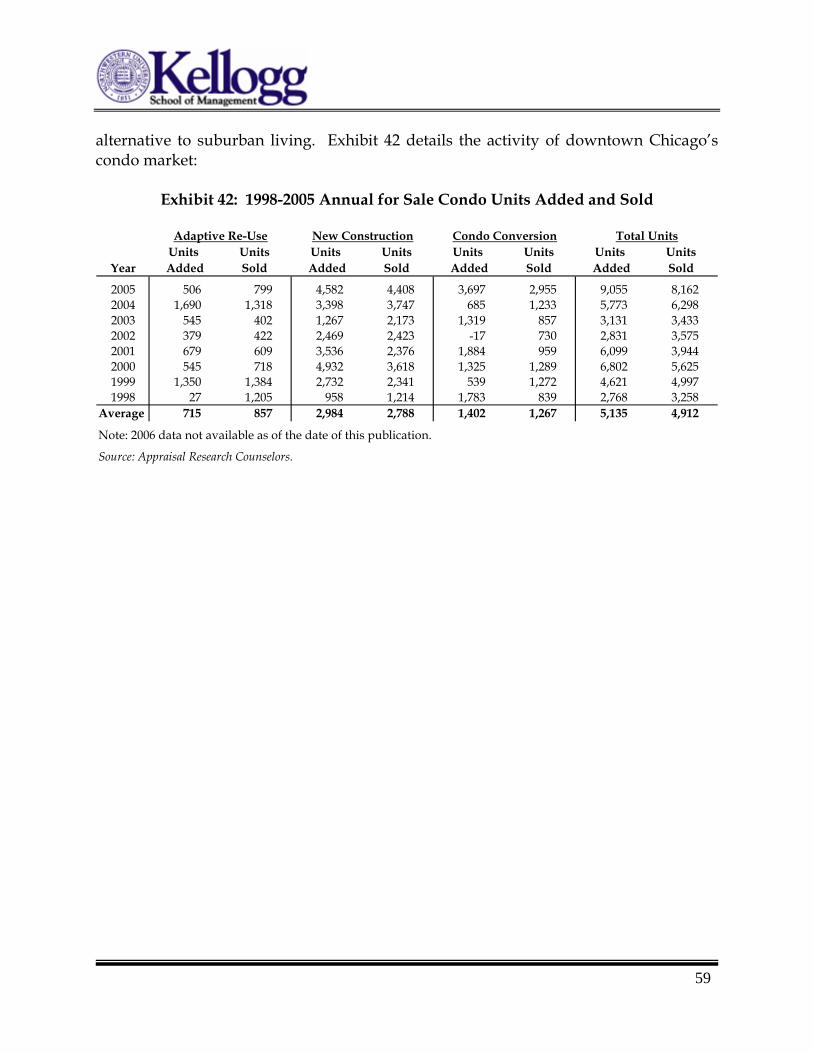
59
alternative to suburban living. Exhibit 42 details the activity of downtown Chicago’s condo market:
Exhibit 42: 1998-2005 Annual for Sale Condo Units Added and Sold
Adaptive Re-Use New Construction Condo Conversion Total UnitsUnits Units Units Units Units Units Units Units
Year Added Sold Added Sold Added Sold Added Sold
2005 506 799 4,582 4,408 3,697 2,955 9,055 8,1622004 1,690 1,318 3,398 3,747 685 1,233 5,773 6,2982003 545 402 1,267 2,173 1,319 857 3,131 3,4332002 379 422 2,469 2,423 -17 730 2,831 3,5752001 679 609 3,536 2,376 1,884 959 6,099 3,9442000 545 718 4,932 3,618 1,325 1,289 6,802 5,6251999 1,350 1,384 2,732 2,341 539 1,272 4,621 4,9971998 27 1,205 958 1,214 1,783 839 2,768 3,258
Average 715 857 2,984 2,788 1,402 1,267 5,135 4,912
Note: 2006 data not available as of the date of this publication.
Source: Appraisal Research Counselors.
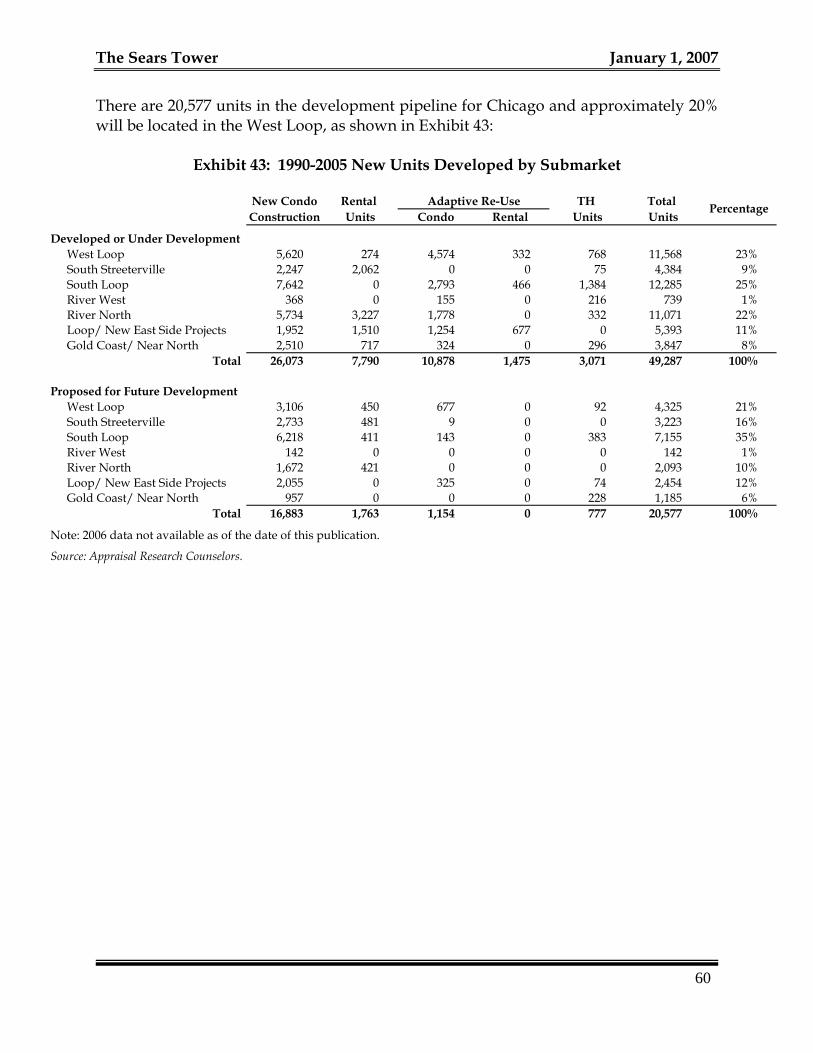
The Sears Tower January 1, 2007 There are 20,577 units in the development pipeline for Chicago and approximately 20% will be located in the West Loop, as shown in Exhibit 43:
Exhibit 43: 1990-2005 New Units Developed by Submarket
New Condo Rental Adaptive Re-Use TH Total Construction Units Condo Rental Units Units
Developed or Under DevelopmentWest Loop 5,620 274 4,574 332 768 11,568 23%South Streeterville 2,247 2,062 0 0 75 4,384 9%South Loop 7,642 0 2,793 466 1,384 12,285 25%River West 368 0 155 0 216 739 1%River North 5,734 3,227 1,778 0 332 11,071 22%Loop/ New East Side Projects 1,952 1,510 1,254 677 0 5,393 11%Gold Coast/ Near North 2,510 717 324 0 296 3,847 8%
Total 26,073 7,790 10,878 1,475 3,071 49,287 100%
Proposed for Future DevelopmentWest Loop 3,106 450 677 0 92 4,325 21%South Streeterville 2,733 481 9 0 0 3,223 16%South Loop 6,218 411 143 0 383 7,155 35%River West 142 0 0 0 0 142 1%River North 1,672 421 0 0 0 2,093 10%Loop/ New East Side Projects 2,055 0 325 0 74 2,454 12%Gold Coast/ Near North 957 0 0 0 228 1,185 6%
Total 16,883 1,763 1,154 0 777 20,577 100%
Note: 2006 data not available as of the date of this publication.
Source: Appraisal Research Counselors.
Percentage
60
61
V. Conclusion Over thirty years ago, the Sears Tower transformed the Chicago skyline and set a new precedent for building design and architecture. Since that time, the Tower has undergone a series of refinancings and ownership changes while weathering economic downturns and the tragedy of September 11th. Nevertheless, today the Sears Tower remains an American icon and one of the world’s most well-known skyscrapers with a story left to be told. During the period of the 1990s thru to the turn of this century, the Tower has endured many buyers and investors with varied intentions and motivations. Since 2004, though, the focus has turned towards the Chetrit group. Although there is no doubt that the Tower is a building of superior design, there is uncertainty as to how the building can maintain its tenant roster amidst an increasingly competitive Chicago office market. Within the context of regional and national office investment trends, there are several key questions that have arisen. Will the Chetrit group’s willingness to pay such a high premium for the Sears Tower be justified by an even greater resale of the Tower? Will banks continue to finance the Tower with record-setting loan amounts? Will Chetrit look for a global investor willing to pay a premium for the building, given that the investment may look like a discount relative to trophy assets located on the east and west coasts? Moreover, how will the Tower be positioned in Chicago’s increasingly competitive office market? Are there possible re-use strategies worth considering viable enough for the Chetrit group or future owners to consider converting this office space for another use? How will future investors find ways to create value? The Sears Tower has survived such periods of uncertainty in the past. Nevertheless, with so many questions left unanswered, the future of the Tower will undoubtedly be as storied as its past.
The Sears Tower January 1, 2007
VI. Case Questions
1. From Sears background section – questions focus on leverage and corporate investment in non-core assets prior to 1990 refinancing:
Prior to 1990, Sears, Sears, Roebuck & Co financed the Tower using cash from working capital. Evaluate this decision to finance the Sears Tower itself rather than utilize a mortgage or other debt vehicle to leverage the asset. What factors would have amplified or detracted from the ultimate return that Sears, Roebuck & Co realized from the sale of the building? In your opinion, should Sears (a retail company which owned many of its retail stores) have owned the Tower? Why or why not?
2. From the Sears background section – questions focus on potential buyers for the Sears Tower prior to 1990 refinancing:
Why would Olympia & York consider buying such a sizeable asset with when one of its largest tenants [Sears] was going to vacate the building? What factors would influence this decision? Why did Olympia & York eventually decline to purchase the Tower? Why would Sears agree to continue paying rent for up to six years on vacated space, in effect paying “double rent” with its new space at Hoffman Estates?
3. From the Sears background section – questions focus on location decision and corporate strategy in move to Hoffman Estates:
Evaluate the decision by Sears to move its headquarters from the Sears Tower to Hoffman Estates. What were some of the primary considerations for choosing this new location over the other potential sites in Chicago, the Chicagoland area, and cities outside of Illinois? Describe the tax incentives used by the State of Illinois to “win over” Sears. Are these incentives similar to those used today to lure new businesses to the area?
4. From “A Series of Tower Refinancings (1990-2003)” section – questions focus on intentions of buyers/investors:
What motivated Sears to pursue the 1994 General Agreement? Describe the transaction that led to a “deed-in-lieu-of-foreclosure.” What were the benefits and drawbacks of such a transaction? Why did Sears need to contribute a relatively small amount of funds (in relation to the total size of the 1994 General Agreement) in
62
63
order for the transaction to move forward? What were the tax implications for Sears to consider at this time?
5. From “A Series of Tower Refinancings (1990-2003)” section – questions focus on intentions of buyers/investors:
What were the motivations of the buyers of the 2nd mortgage? Compare and contrast the different perspectives on each side of the deal:
A. Sears to AEW B. AEW to Trizec C. Trizec to MetLife
Which of these investments seemed like a “good deal” at the time? With the advantage of hindsight, which of these investments were actually a “good deal?” How could the investors have protected themselves or mitigated some of the risk with this investment?
6. From “Joseph Chetrit and Company Acquire the Sears Tower” Section – questions focus on individual’s ability to compete in real estate auctions, the ease of financing during the sale, and valuation.
Was Chetrit’s group willingness to pay such a high premium for the Sears Tower (on such short notice) reasonable?, What was their strategy for positioning the Tower in an increasingly competitive Chicago office market?” Comment on how private buyers can pay more for a real estate asset than public buyers, all else equal. What gives private buyers this flexibility? Short-term interest rates in 2004 enabled Chetrit to secure a very favorable loan and value the building at a level higher than his competitors. Given historical interest rate movements, was the floating-rate mortgage aggressive? How would the building have been valued using fixed-rate debt? Was Chetrit decision to pursue a fixed-rate loan in 2007 prudent?
7. From “Joseph Chetrit and Company Acquire the Sears Tower” Section – questions focus on the CMBS market and Bank of America’s loan on the Tower:
The Sears Tower January 1, 2007
Why did Chetrit pursue a CMBS loan over a whole/portfolio loan? Comment generally on the differences between interest rates and flexibility of terms for each? Given the total size of the loan, why couldn’t Bank of America collateralize a larger portion of the loan? Why was a portion of the CMBS loan “pooled” and a portion “not pooled?” Bank of America received an appraisal on the Tower at the time of its CMBS loan of approximately $925 million. Speculate on the potential reasons why the rating’s agencies valued the Tower around $800 million. Why was there such as large gap? It is speculated that the Fiel organization purchased an interest in the junior mezzanine loan? Why would Fiel consider doing this? Comment on the potential transfer of ownership if Chetrit were to ever default on its mortgage payment. Who or what organization would get the rights to the Tower given this type of situation?
8. From “Joseph Chetrit and Company Acquire the Sears Tower” Section – questions focus on the effects of September 11, 2001 on the value of trophy assets such as the Sears Tower:
September 11, 2001 had a huge and adverse impact on the Sears Tower with regard to tenant occupancy, perceived safety, and rents collected. Given the flight of tenants to other office buildings and the difficulty in attracting new tenants, do you believe that the Sears Tower can reclaim its “top” position in the market and command premium rents and occupancy levels?
9. From “The Sears Tower Today (2006)” Section – questions focus on the downtown Chicago office market and space-market fundamentals for Class A office space:
Since 2000, several new Class A office buildings have been constructed in the downtown Chicago CBD, yet vacancy rates have hovered in the mid- to upper-teens on a percentage basis. Comment on the ability of developers to secure financing and proceed with construction on such assets. How has this new construction affected other office buildings in Chicago’s CBD (especially those buildings considered Class B or C)? Are some buildings/locations in the Chicago’s CBD hurt worse than others? Comment on the adaptive re-use strategies some office buildings have pursued to deal with the rise of this new space.
10. From “The Sears Tower Today (2006)” Section – questions focus on possible re-use strategies and the value of the Sears Tower today.
64
65
What, if any, adaptive re-use strategy would you recommend for the Sears Tower? Given the height and structure of the building itself, what are some of the limitations for a re-use strategy involving residential or hotel applications? Given current market conditions, what do you think is the optimal strategy for the Chetrit group today?
The Sears Tower January 1, 2007
VII. Acknowledgments
First and foremost, we would like to thank Stephen Livaditis of Eastdil Secured for his continuing support, inspiration, and guidance in the preparation of this case study. In addition, we would also like to thank the following people: • Michael Caron – Lyon & Caron LLP • Lijian Chen – UBS • James Church – Moody’s Investors Service • Thomas Corfman – Crain’s • Menahem Deitcher – CB Richard Ellis • Sally Gordon – Moody’s Investors Service • David R. Hendrickson – Jones Lang LaSalle • Chang Lee – Eastdil Secured • Bryan P. McDonnell – Prudential Mortgage Capital • Teri Murray – Kellogg School of Management • Paolo Obias – Moody’s Investors Service • Rickard Olander - Moody's Investors Service • Daniel T. Ryan – Jones Lang LaSalle • Stephen Simsic - U.S. Equities Realty • Steve Steinmeyer – Jones Lang LaSalle • Jim Sullivan – Green Street Advisors • Raymond Torto – Torto Wheaton Research • Neal White - Wachovia Capital Markets • Michael Yurnich – BlackRock Realty However, any errors or omissions are the sole responsibilities of the authors. We recognize that there have been many others who have provided guidance on this case study along the way from idea inception to final production that have not been mentioned outright. Our sincerest thanks go to each and every one of you. Your contributions were invaluable to us for the successful completion of this project.
66
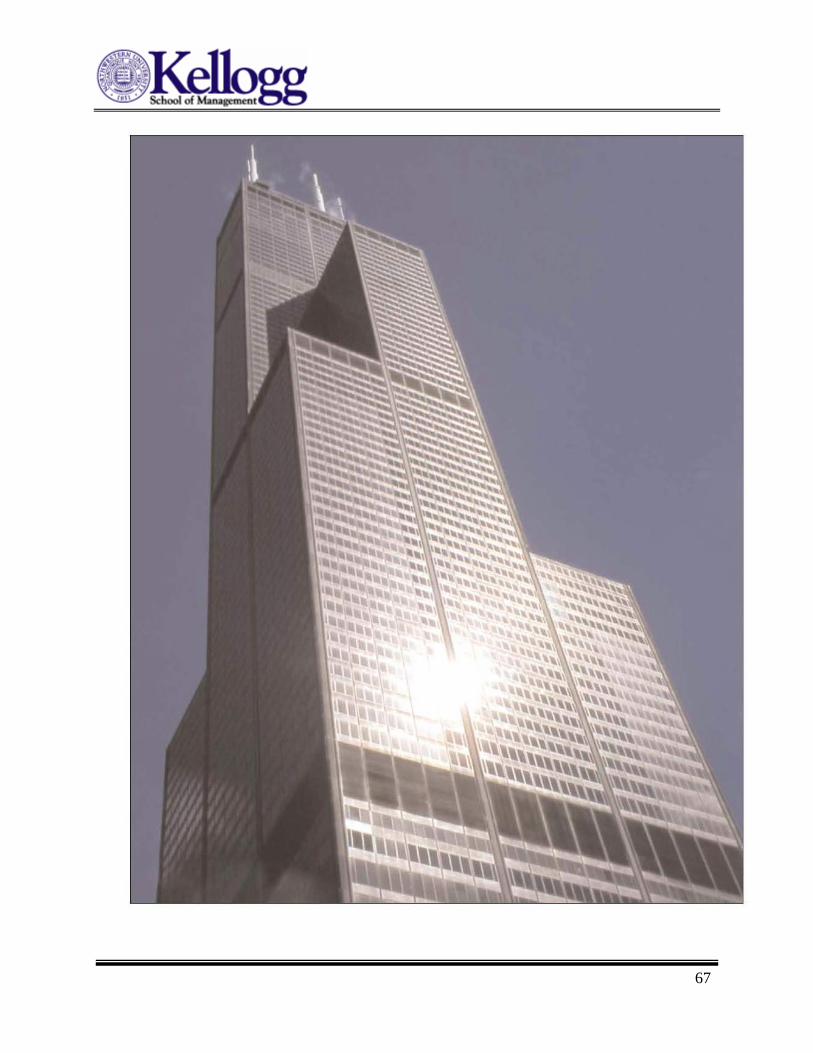
67
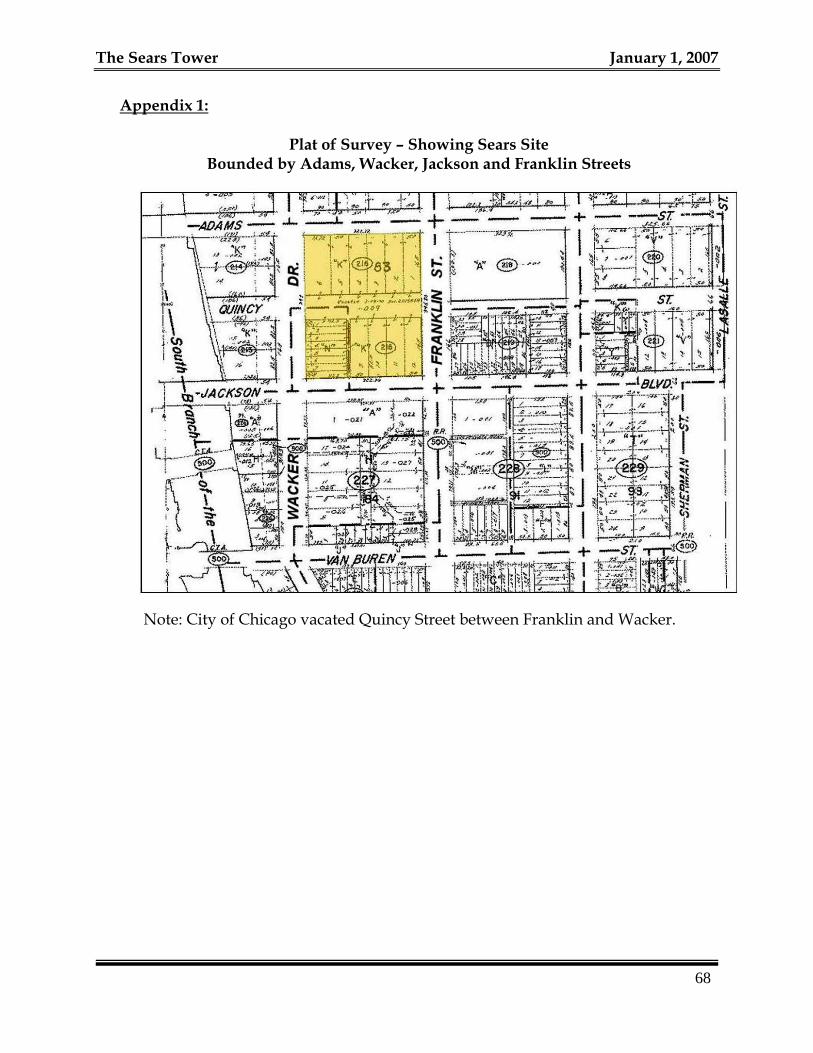
The Sears Tower January 1, 2007
Appendix 1:
Plat of Survey – Showing Sears Site Bounded by Adams, Wacker, Jackson and Franklin Streets
Note: City of Chicago vacated Quincy Street between Franklin and Wacker.
68
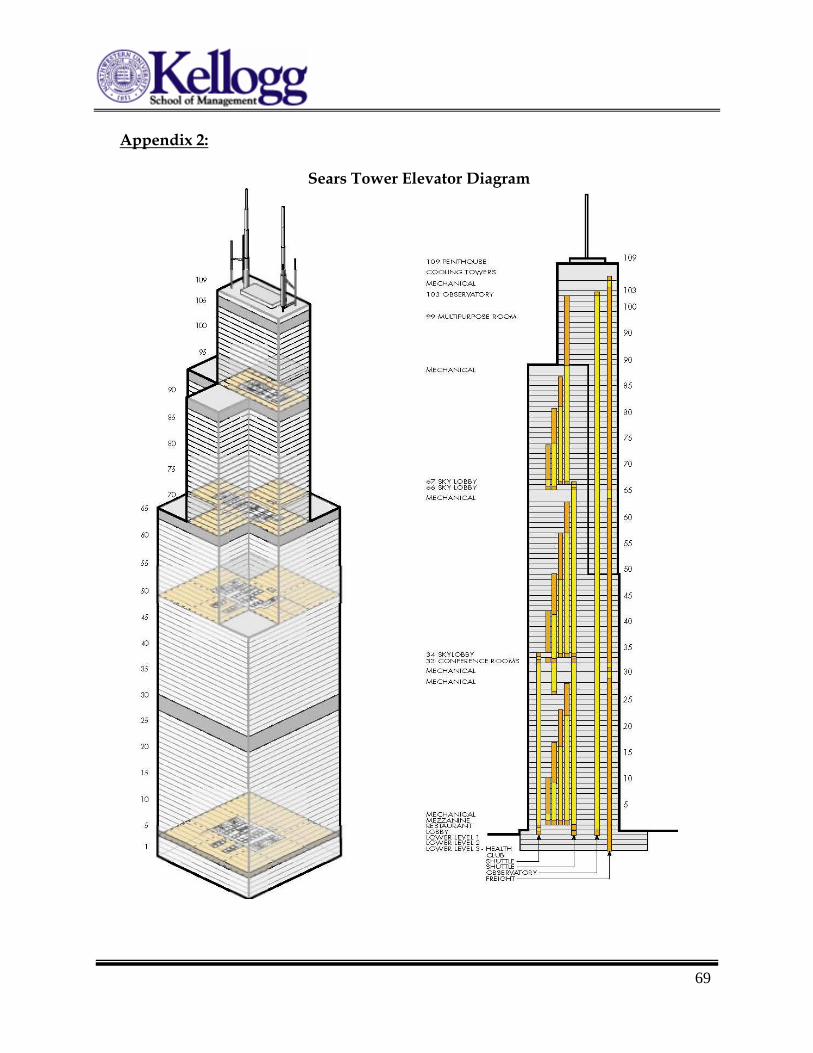
69
Appendix 2:
Sears Tower Elevator Diagram
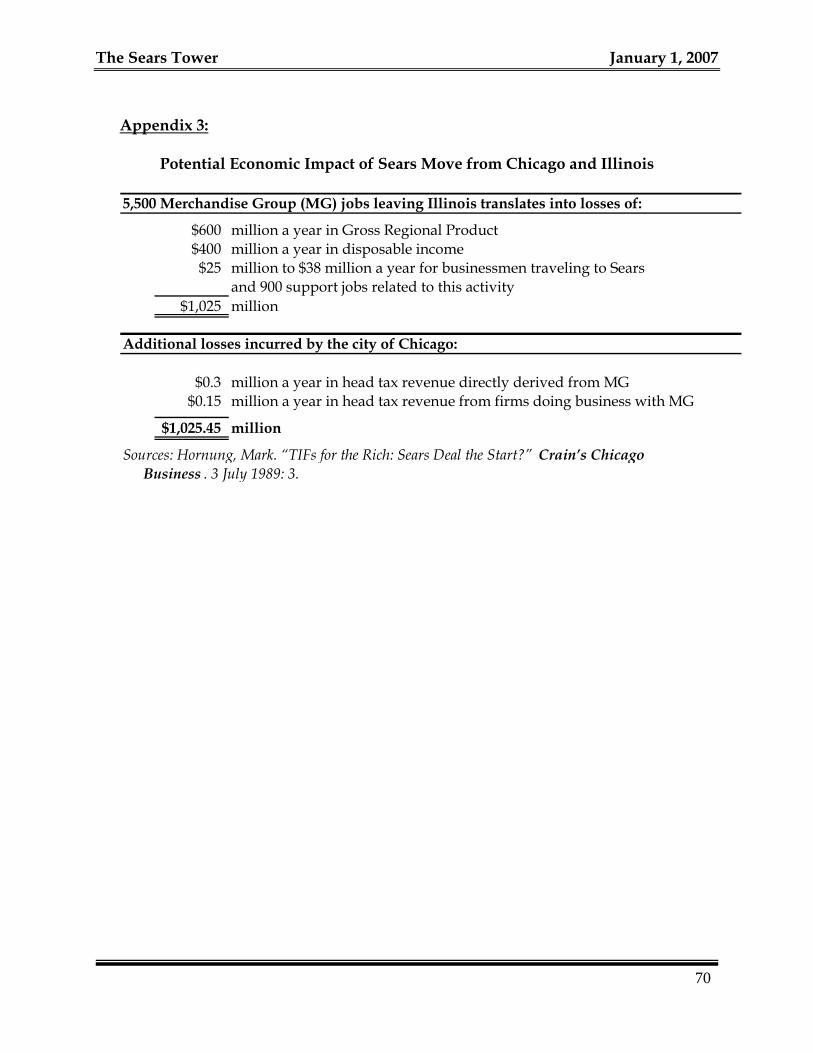
The Sears Tower January 1, 2007
Appendix 3:
Potential Economic Impact of Sears Move from Chicago and Illinois
5,500 Merchandise Group (MG) jobs leaving Illinois translates into losses of:
$600 million a year in Gross Regional Product$400 million a year in disposable income$25 million to $38 million a year for businessmen traveling to Sears
and 900 support jobs related to this activity$1,025 million
Additional losses incurred by the city of Chicago:
$0.3 million a year in head tax revenue directly derived from MG$0.15 million a year in head tax revenue from firms doing business with MG
$1,025.45 million
Sources: Hornung, Mark. “TIFs for the Rich: Sears Deal the Start?” Crain’s Chicago Business . 3 July 1989: 3.
70
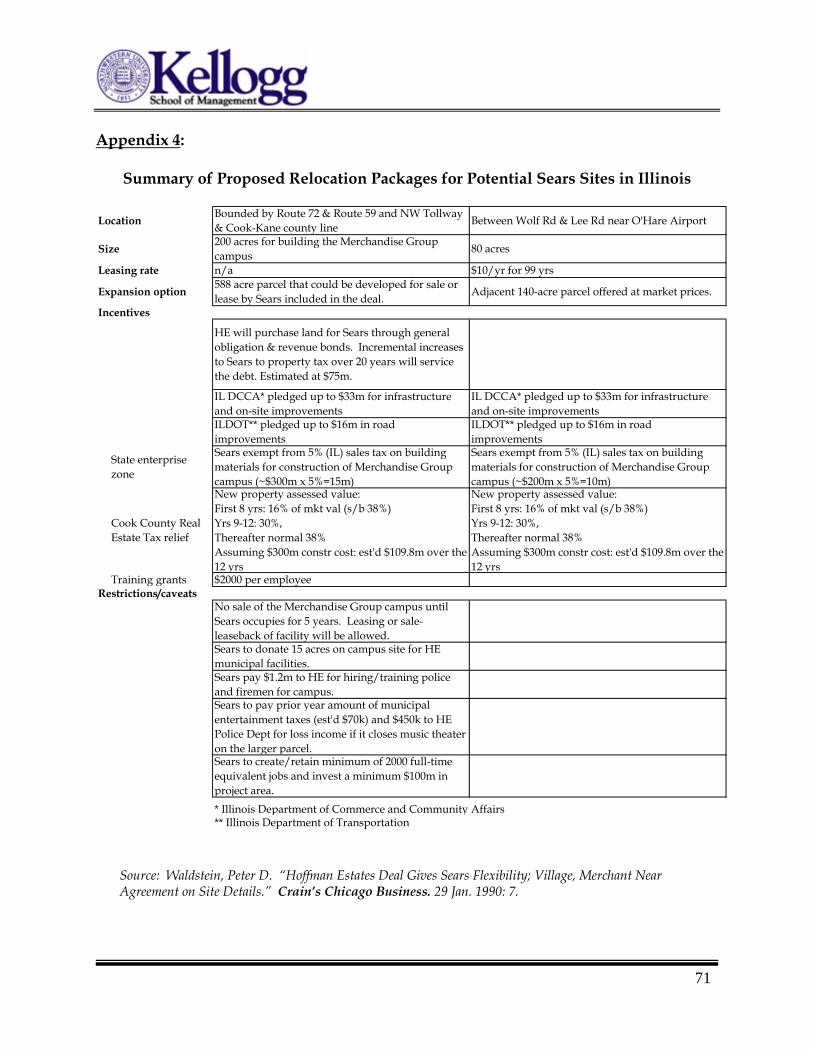
71
Appendix 4:
Summary of Proposed Relocation Packages for Potential Sears Sites in Illinois
Location Bounded by Route 72 & Route 59 and NW Tollway & Cook-Kane county line Between Wolf Rd & Lee Rd near O'Hare Airport
Size 200 acres for building the Merchandise Group campus 80 acres
Leasing rate n/a $10/yr for 99 yrs
Expansion option 588 acre parcel that could be developed for sale or lease by Sears included in the deal. Adjacent 140-acre parcel offered at market prices.
Incentives
HE will purchase land for Sears through general obligation & revenue bonds. Incremental increases to Sears to property tax over 20 years will service the debt. Estimated at $75m.
IL DCCA* pledged up to $33m for infrastructure and on-site improvements
IL DCCA* pledged up to $33m for infrastructure and on-site improvements
ILDOT** pledged up to $16m in road improvements
ILDOT** pledged up to $16m in road improvements
State enterprise zone
Sears exempt from 5% (IL) sales tax on building materials for construction of Merchandise Group campus (~$300m x 5%=15m)
Sears exempt from 5% (IL) sales tax on building materials for construction of Merchandise Group campus (~$200m x 5%=10m)
Cook County Real Estate Tax relief
New property assessed value:First 8 yrs: 16% of mkt val (s/b 38%)Yrs 9-12: 30%,Thereafter normal 38%Assuming $300m constr cost: est'd $109.8m over the 12 yrs
New property assessed value:First 8 yrs: 16% of mkt val (s/b 38%)Yrs 9-12: 30%,Thereafter normal 38%Assuming $300m constr cost: est'd $109.8m over the 12 yrs
Training grants $2000 per employeeRestrictions/caveats
No sale of the Merchandise Group campus until Sears occupies for 5 years. Leasing or sale-leaseback of facility will be allowed.Sears to donate 15 acres on campus site for HE municipal facilities.Sears pay $1.2m to HE for hiring/training police and firemen for campus.Sears to pay prior year amount of municipal entertainment taxes (est'd $70k) and $450k to HE Police Dept for loss income if it closes music theater on the larger parcel.Sears to create/retain minimum of 2000 full-time equivalent jobs and invest a minimum $100m in project area.* Illinois Department of Commerce and Community Affairs** Illinois Department of Transportation
Source: Waldstein, Peter D. “Hoffman Estates Deal Gives Sears Flexibility; Village, Merchant Near Agreement on Site Details.” Crain’s Chicago Business. 29 Jan. 1990: 7.
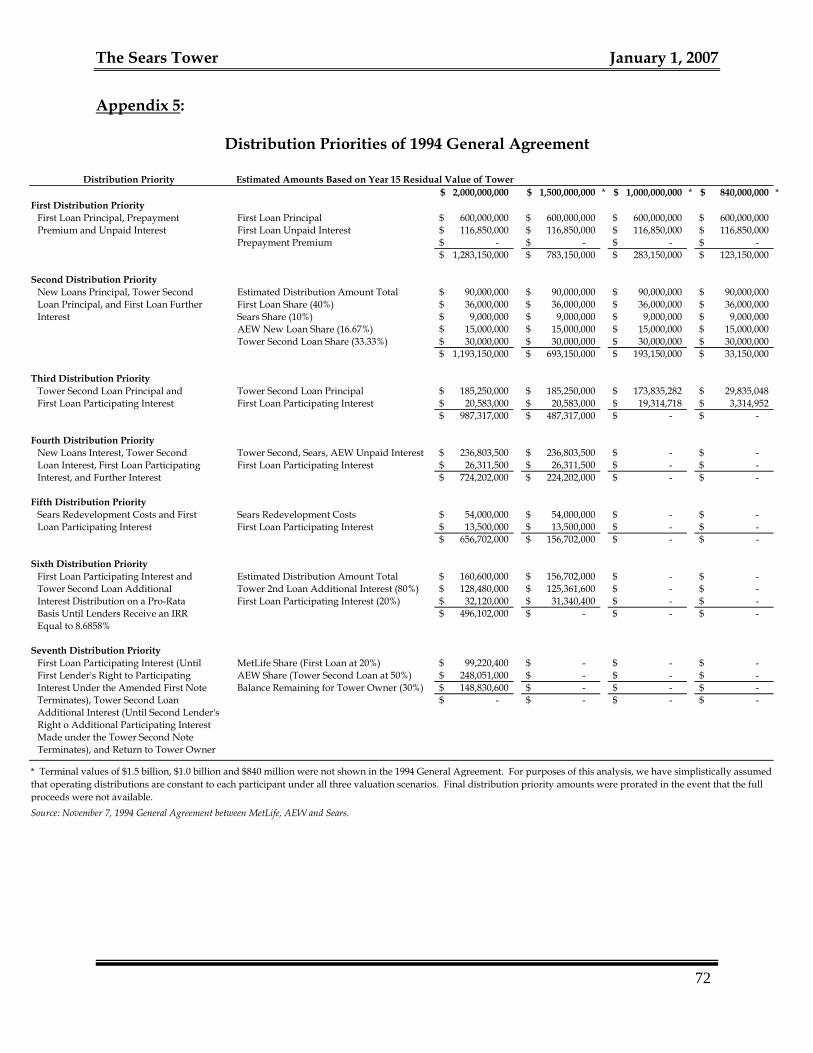
The Sears Tower January 1, 2007 Appendix 5:
Distribution Priorities of 1994 General Agreement
Distribution Priority Estimated Amounts Based on Year 15 Residual Value of Tower
2,000,000,000$ 1,500,000,000$ * 1,000,000,000$ * 840,000,000$ *First Distribution Priority
First Loan Principal, Prepayment First Loan Principal 600,000,000$ 600,000,000$ 600,000,000$ 600,000,000$ Premium and Unpaid Interest First Loan Unpaid Interest 116,850,000$ 116,850,000$ 116,850,000$ 116,850,000$
Prepayment Premium -$ -$ -$ -$ 1,283,150,000$ 783,150,000$ 283,150,000$ 123,150,000$
Second Distribution PriorityNew Loans Principal, Tower Second Estimated Distribution Amount Total 90,000,000$ 90,000,000$ 90,000,000$ 90,000,000$ Loan Principal, and First Loan Further First Loan Share (40%) 36,000,000$ 36,000,000$ 36,000,000$ 36,000,000$ Interest Sears Share (10%) 9,000,000$ 9,000,000$ 9,000,000$ 9,000,000$
AEW New Loan Share (16.67%) 15,000,000$ 15,000,000$ 15,000,000$ 15,000,000$ Tower Second Loan Share (33.33%) 30,000,000$ 30,000,000$ 30,000,000$ 30,000,000$
1,193,150,000$ 693,150,000$ 193,150,000$ 33,150,000$
Third Distribution PriorityTower Second Loan Principal and Tower Second Loan Principal 185,250,000$ 185,250,000$ 173,835,282$ 29,835,048$ First Loan Participating Interest First Loan Participating Interest 20,583,000$ 20,583,000$ 19,314,718$ 3,314,952$
987,317,000$ 487,317,000$ -$ -$
Fourth Distribution PriorityNew Loans Interest, Tower Second Tower Second, Sears, AEW Unpaid Interest 236,803,500$ 236,803,500$ -$ -$ Loan Interest, First Loan Participating First Loan Participating Interest 26,311,500$ 26,311,500$ -$ -$ Interest, and Further Interest 724,202,000$ 224,202,000$ -$ -$
Fifth Distribution PrioritySears Redevelopment Costs and First Sears Redevelopment Costs 54,000,000$ 54,000,000$ -$ -$ Loan Participating Interest First Loan Participating Interest 13,500,000$ 13,500,000$ -$ -$
656,702,000$ 156,702,000$ -$ -$
Sixth Distribution PriorityFirst Loan Participating Interest and Estimated Distribution Amount Total 160,600,000$ 156,702,000$ -$ -$ Tower Second Loan Additional Tower 2nd Loan Additional Interest (80%) 128,480,000$ 125,361,600$ -$ -$ Interest Distribution on a Pro-Rata First Loan Participating Interest (20%) 32,120,000$ 31,340,400$ -$ -$ Basis Until Lenders Receive an IRR 496,102,000$ -$ -$ -$ Equal to 8.6858%
Seventh Distribution PriorityFirst Loan Participating Interest (Until MetLife Share (First Loan at 20%) 99,220,400$ -$ -$ -$ First Lender's Right to Participating AEW Share (Tower Second Loan at 50%) 248,051,000$ -$ -$ -$ Interest Under the Amended First Note Balance Remaining for Tower Owner (30%) 148,830,600$ -$ -$ -$ Terminates), Tower Second Loan -$ -$ -$ -$ Additional Interest (Until Second Lender'sRight o Additional Participating InterestMade under the Tower Second NoteTerminates), and Return to Tower Owner
Source: November 7, 1994 General Agreement between MetLife, AEW and Sears.
* Terminal values of $1.5 billion, $1.0 billion and $840 million were not shown in the 1994 General Agreement. For purposes of this analysis, we have simplistically assumed that operating distributions are constant to each participant under all three valuation scenarios. Final distribution priority amounts were prorated in the event that the full proceeds were not available.
72
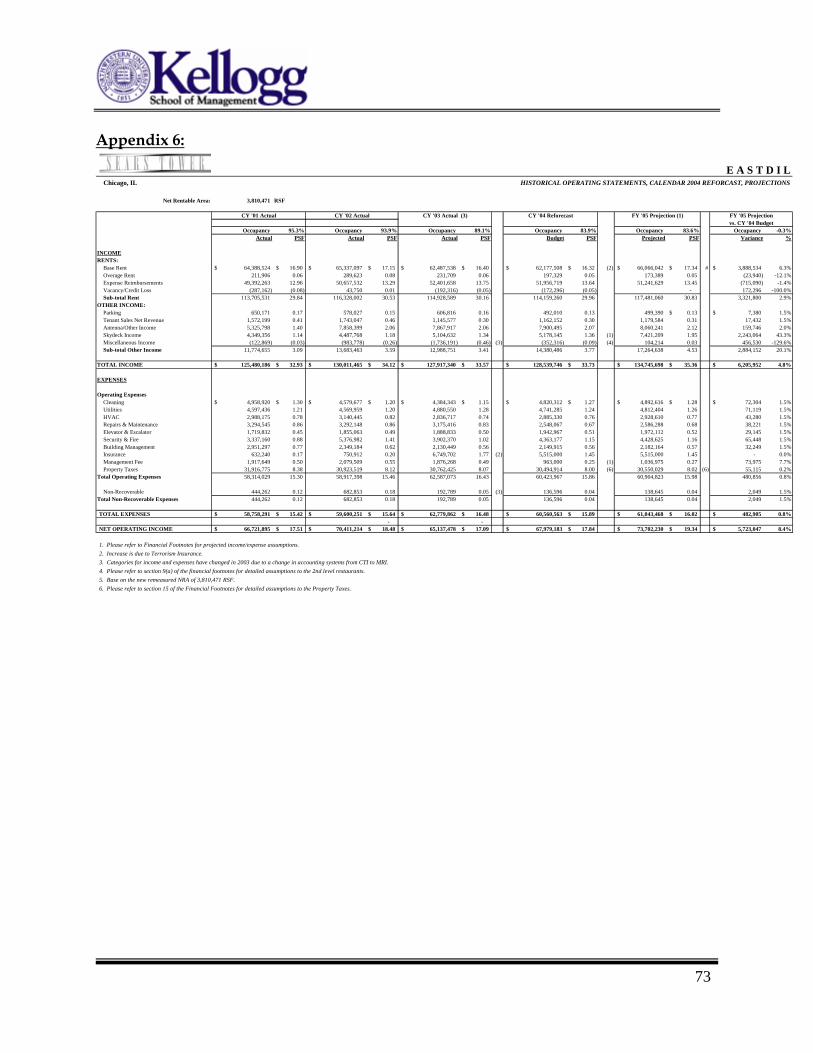
73
Appendix 6:
E A S T D I LChicago, IL HISTORICAL OPERATING STATEMENTS, CALENDAR 2004 REFORCAST, PROJECTIONS
Net Rentable Area: 3,810,471 RSF
Occupancy 95.3% Occupancy 93.9% Occupancy 89.1% Occupancy 83.9% Occupancy 83.6% Occupancy -0.3%Actual PSF Actual PSF Actual PSF Budget PSF Projected PSF Variance %
INCOMERENTS:
Base Rent 64,388,524$ 16.90$ 65,337,097$ 17.15$ 62,487,538$ 16.40$ 62,177,508$ 16.32$ (2) 66,066,042$ 17.34$ # 3,888,534$ 6.3%Overage Rent 211,906 0.06 289,623 0.08 231,709 0.06 197,329 0.05 173,389 0.05 (23,940) -12.1%Expense Reimbursements 49,392,263 12.96 50,657,532 13.29 52,401,658 13.75 51,956,719 13.64 51,241,629 13.45 (715,090) -1.4%Vacancy/Credit Loss (287,162) (0.08) 43,750 0.01 (192,316) (0.05) (172,296) (0.05) - 172,296 -100.0%Sub-total Rent 113,705,531 29.84 116,328,002 30.53 114,928,589 30.16 114,159,260 29.96 117,481,060 30.83 3,321,800 2.9%
OTHER INCOME:Parking 650,171 0.17 578,027 0.15 606,816 0.16 492,010 0.13 499,390 0.13$ 7,380$ 1.5%Tenant Sales Net Revenue 1,572,199 0.41 1,743,047 0.46 1,145,577 0.30 1,162,152 0.30 1,179,584 0.31 17,432 1.5%Antenna/Other Income 5,325,798 1.40 7,858,399 2.06 7,867,917 2.06 7,900,495 2.07 8,060,241 2.12 159,746 2.0%Skydeck Income 4,349,356 1.14 4,487,768 1.18 5,104,632 1.34 5,178,145 1.36 (1) 7,421,209 1.95 2,243,064 43.3%Miscellaneous Income (122,869) (0.03) (983,778) (0.26) (1,736,191) (0.46) (3) (352,316) (0.09) (4) 104,214 0.03 456,530 -129.6%Sub-total Other Income 11,774,655 3.09 13,683,463 3.59 12,988,751 3.41 14,380,486 3.77 17,264,638 4.53 2,884,152 20.1%
TOTAL INCOME 125,480,186$ 32.93$ 130,011,465$ 34.12$ 127,917,340$ 33.57$ 128,539,746$ 33.73$ 134,745,698$ 35.36$ 6,205,952$ 4.8%
EXPENSES
Operating ExpensesCleaning 4,958,920$ 1.30$ 4,579,677$ 1.20$ 4,384,343$ 1.15$ 4,820,312$ 1.27$ 4,892,616$ 1.28$ 72,304$ 1.5%Utilities 4,597,436 1.21 4,569,959 1.20 4,880,550 1.28 4,741,285 1.24 4,812,404 1.26 71,119 1.5%HVAC 2,988,175 0.78 3,140,445 0.82 2,836,717 0.74 2,885,330 0.76 2,928,610 0.77 43,280 1.5%Repairs & Maintenance 3,294,545 0.86 3,292,148 0.86 3,175,416 0.83 2,548,067 0.67 2,586,288 0.68 38,221 1.5%Elevator & Escalator 1,719,832 0.45 1,855,063 0.49 1,888,833 0.50 1,942,967 0.51 1,972,112 0.52 29,145 1.5%Security & Fire 3,337,160 0.88 5,376,982 1.41 3,902,370 1.02 4,363,177 1.15 4,428,625 1.16 65,448 1.5%Building Management 2,951,297 0.77 2,349,184 0.62 2,130,449 0.56 2,149,915 0.56 2,182,164 0.57 32,249 1.5%Insurance 632,240 0.17 750,912 0.20 6,749,702 1.77 (2) 5,515,000 1.45 5,515,000 1.45 - 0.0%Management Fee 1,917,649 0.50 2,079,509 0.55 1,876,268 0.49 963,000 0.25 (1) 1,036,975 0.27 73,975 7.7%Property Taxes 31,916,775 8.38 30,923,519 8.12 30,762,425 8.07 30,494,914 8.00 (6) 30,550,029 8.02 (6) 55,115 0.2%
Total Operating Expenses 58,314,029 15.30 58,917,398 15.46 62,587,073 16.43 60,423,967 15.86 60,904,823 15.98 480,856 0.8%
Non-Recoverable 444,262 0.12 682,853 0.18 192,789 0.05 (3) 136,596 0.04 138,645 0.04 2,049 1.5%Total Non-Recoverable Expenses 444,262 0.12 682,853 0.18 192,789 0.05 136,596 0.04 138,645 0.04 2,049 1.5%
TOTAL EXPENSES 58,758,291$ 15.42$ 59,600,251$ 15.64$ 62,779,862$ 16.48$ 60,560,563$ 15.89$ 61,043,468$ 16.02$ 482,905$ 0.8%- -
NET OPERATING INCOME 66,721,895$ 17.51$ 70,411,214$ 18.48$ 65,137,478$ 17.09$ 67,979,183$ 17.84$ 73,702,230$ 19.34$ 5,723,047$ 8.4%
1. Please refer to Financial Footnotes for projected income/expense assumptions.2. Increase is due to Terrorism Insurance.3. Categories for income and expenses have changed in 2003 due to a change in accounting systems from CTI to MRI.4. Please refer to section 9(a) of the financial footnotes for detailed assumptions to the 2nd level restaurants.5. Base on the new remeasured NRA of 3,810,471 RSF.6. Please refer to section 15 of the Financial Footnotes for detailed assumptions to the Property Taxes.
vs. CY '04 BudgetFY '05 ProjectionCY '04 Reforecast FY '05 Projection (1)CY '01 Actual CY '02 Actual CY '03 Actual (3)
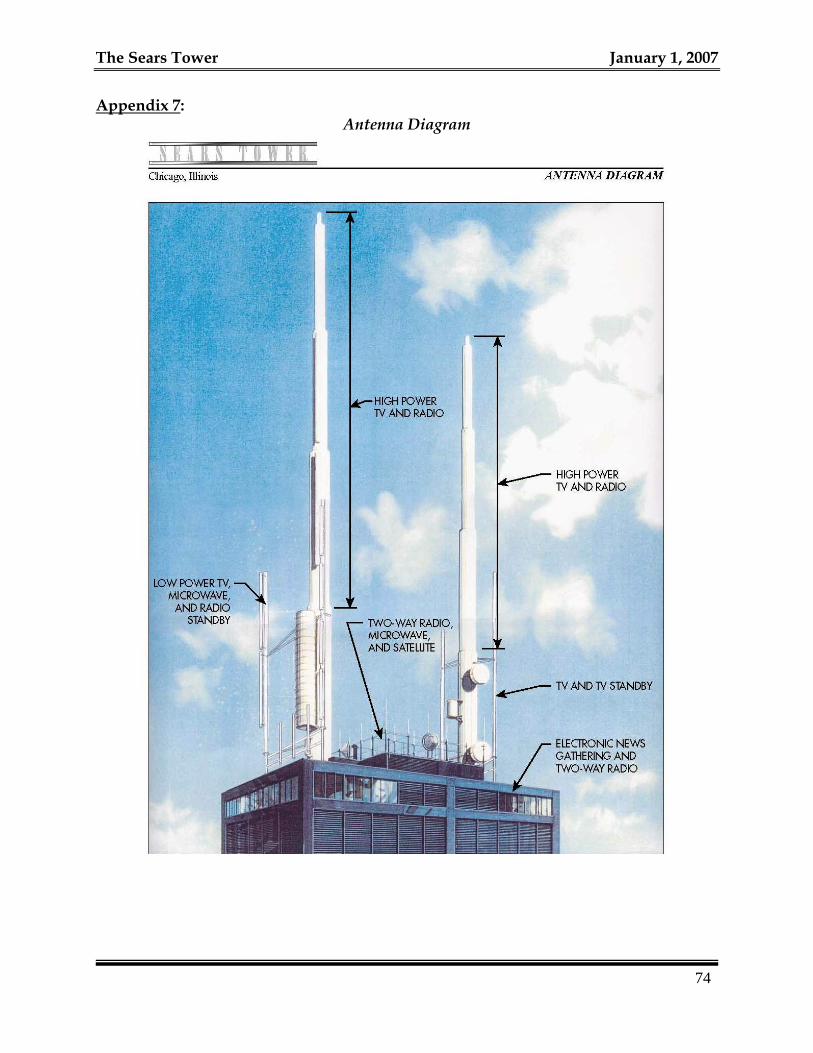
The Sears Tower January 1, 2007 Appendix 7:
Antenna Diagram
74
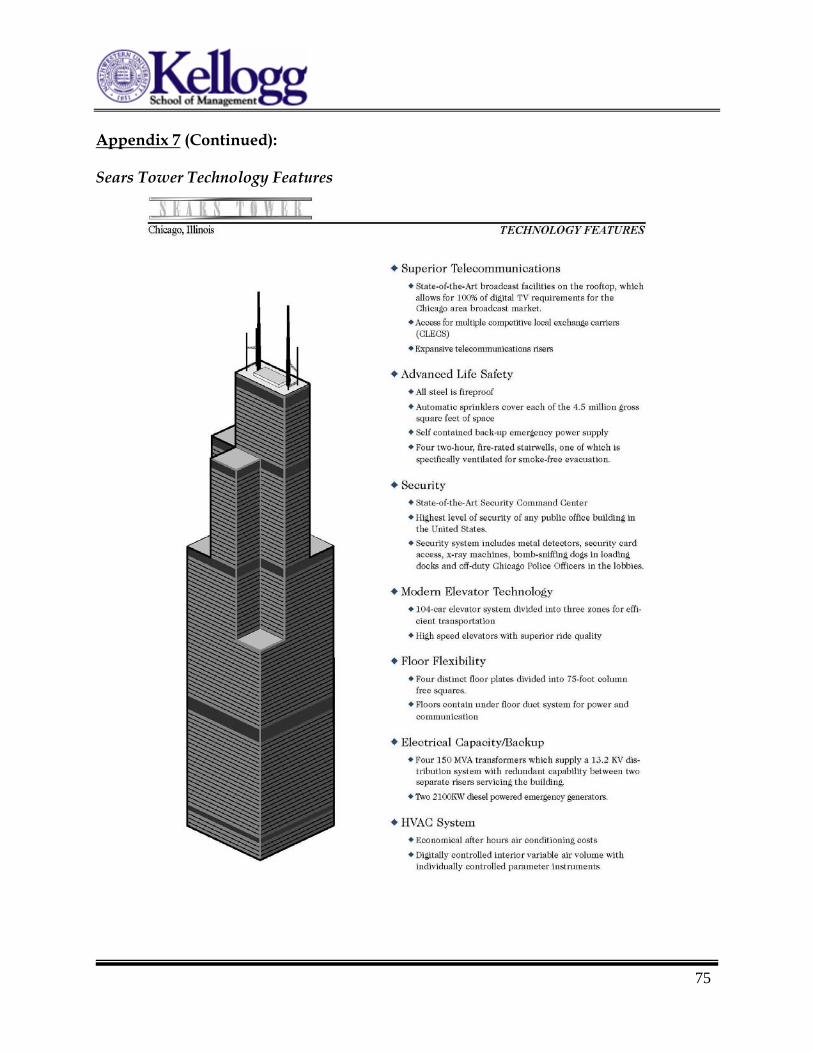
75
Appendix 7 (Continued): Sears Tower Technology Features
The Sears Tower January 1, 2007
Appendix 8:
The Investment Sales Process
The typical investment sale process (for a real estate asset) begins when prospective investment brokers are interviewed for the assignment. Once the assignment is awarded, the winning broker begins assembling a vast array of financial, market and physical information concerning the subject property and the market while at the same time creating a list of potential buyers. In the case of the Sears Tower and other large trophy buildings, the list is typically smaller due to the large equity commitment. The seller often adds to the list as well, though many of the names often overlap. In addition to traditional buyers such as REITs and pension fund advisors, the list may include high-net-worth individuals. For example, Michael Dell has recently invested substantially in real estate. Once this list is complete, the brokers will distribute a “teaser” flyer along with a confidentiality agreement, and follow this up with a phone call. Once the broker has received the signed confidentiality agreement from a qualified buyer, they send out the Offering Memorandum (“OM”) and (more recently) a link to a website which contains an ARGUS© model, an electronic version of the OM, and other due diligence items. The electronic/digital aspects of distribution have become instrumental in the process because it drastically improves the speed of distribution of the sales materials. The preparation of the OM generally takes about three to four weeks to complete, which overlaps with the assembly of potential bidders and the distribution of teaser materials. During this time, the main priorities include modeling the financial aspects of the deal (specifically the rent roll and operating budget to build an ARGUS model), completely detailing all lease options, preparing the marketing materials, which includes photography, preparing graphics, and developing a website presentation. Bids almost always have a firm bid deadline, roughly three to four weeks after the distribution of due diligence via offering memorandum and website access. Bids historically were accepted via letter, but more recently emails have sufficed. For high-priced assets or sales with a large volume of bids, a second round of bids is common for top bidders.
Bid Evaluation
Bidders for real estate assets are typically “qualified” prior to being provided bid materials and evaluated throughout the process. For assets the size of the Sears Tower, the deal size limits the number of groups that could make a reasonable bid. From the perspective of the seller, pertinent evaluation questions include:
How much time have they spent researching the project?
76
77
What is their familiarity with the asset – are they located in the market, have they owned similar assets, what are the quality of their inquires, have they toured the asset?
How many deals has the group previously acquired? What types of properties? What is the financial strength of the bidder? What is the bidder’s reputation (particularly important if the potential buyer has
a reputation of “re-trading”)?
The on-line availability of due diligence materials now provides the investment sales group detailed information about the buyer’s evaluation process (e.g., have all files been opened and, if so, how much time was spent using the materials on the web portal in general?). For bidders which have acquired relatively few properties, the perception of the bidder’s ability to close becomes very important. A significant earnest money deposit and/or favorable commitments from major lenders may demonstrate this strength. In the case of Joseph Chetrit’s purchase of the Sears Tower, a concern over their viability was assuaged by strong earnest money that was nonrefundable, a commitment to a five day due diligence period, and favorable lender relationships.
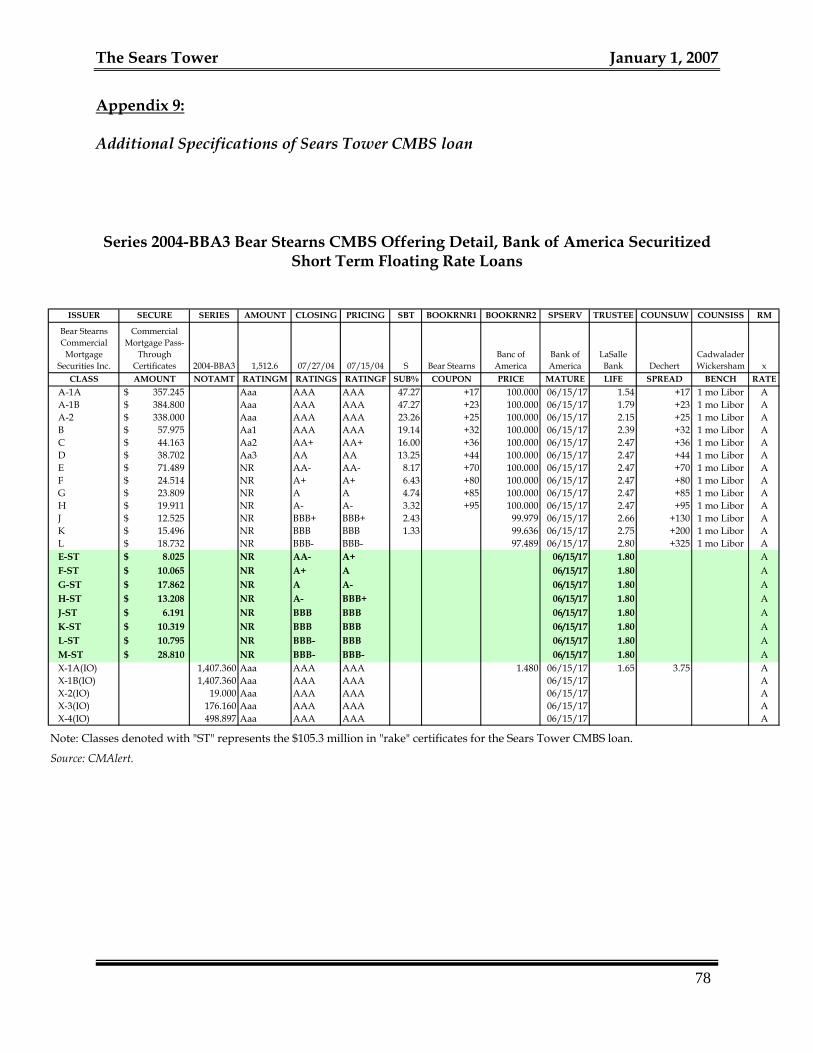
The Sears Tower January 1, 2007 Appendix 9: Additional Specifications of Sears Tower CMBS loan
Series 2004-BBA3 Bear Stearns CMBS Offering Detail, Bank of America Securitized
Short Term Floating Rate Loans
ISSUER SECURE SERIES AMOUNT CLOSING PRICING SBT BOOKRNR1 BOOKRNR2 SPSERV TRUSTEE COUNSUW COUNSISS RM
Bear Stearns Commercial
Mortgage Securities Inc.
Commercial Mortgage Pass-
Through Certificates 2004-BBA3 1,512.6 07/27/04 07/15/04 S Bear Stearns
Banc of America
Bank of America
LaSalle Bank Dechert
Cadwalader Wickersham x
CLASS AMOUNT NOTAMT RATINGM RATINGS RATINGF SUB% COUPON PRICE MATURE LIFE SPREAD BENCH RATEA-1A 357.245$ Aaa AAA AAA 47.27 +17 100.000 06/15/17 1.54 +17 1 mo Libor AA-1B 384.800$ Aaa AAA AAA 47.27 +23 100.000 06/15/17 1.79 +23 1 mo Libor AA-2 338.000$ Aaa AAA AAA 23.26 +25 100.000 06/15/17 2.15 +25 1 mo Libor AB 57.975$ Aa1 AAA AAA 19.14 +32 100.000 06/15/17 2.39 +32 1 mo Libor AC 44.163$ Aa2 AA+ AA+ 16.00 +36 100.000 06/15/17 2.47 +36 1 mo Libor AD 38.702$ Aa3 AA AA 13.25 +44 100.000 06/15/17 2.47 +44 1 mo Libor AE 71.489$ NR AA- AA- 8.17 +70 100.000 06/15/17 2.47 +70 1 mo Libor AF 24.514$ NR A+ A+ 6.43 +80 100.000 06/15/17 2.47 +80 1 mo Libor AG 23.809$ NR A A 4.74 +85 100.000 06/15/17 2.47 +85 1 mo Libor AH 19.911$ NR A- A- 3.32 +95 100.000 06/15/17 2.47 +95 1 mo Libor AJ 12.525$ NR BBB+ BBB+ 2.43 99.979 06/15/17 2.66 +130 1 mo Libor AK 15.496$ NR BBB BBB 1.33 99.636 06/15/17 2.75 +200 1 mo Libor AL 18.732$ NR BBB- BBB- 97.489 06/15/17 2.80 +325 1 mo Libor AE-ST 8.025$ NR AA- A+ 06/15/17 1.80 AF-ST 10.065$ NR A+ A 06/15/17 1.80 AG-ST 17.862$ NR A A- 06/15/17 1.80 AH-ST 13.208$ NR A- BBB+ 06/15/17 1.80 AJ-ST 6.191$ NR BBB BBB 06/15/17 1.80 AK-ST 10.319$ NR BBB BBB 06/15/17 1.80 AL-ST 10.795$ NR BBB- BBB 06/15/17 1.80 AM-ST 28.810$ NR BBB- BBB- 06/15/17 1.80 AX-1A(IO) 1,407.360 Aaa AAA AAA 1.480 06/15/17 1.65 3.75 AX-1B(IO) 1,407.360 Aaa AAA AAA 06/15/17 AX-2(IO) 19.000 Aaa AAA AAA 06/15/17 AX-3(IO) 176.160 Aaa AAA AAA 06/15/17 AX-4(IO) 498.897 Aaa AAA AAA 06/15/17 A
Note: Classes denoted with "ST" represents the $105.3 million in "rake" certificates for the Sears Tower CMBS loan.
Source: CMAlert.
78
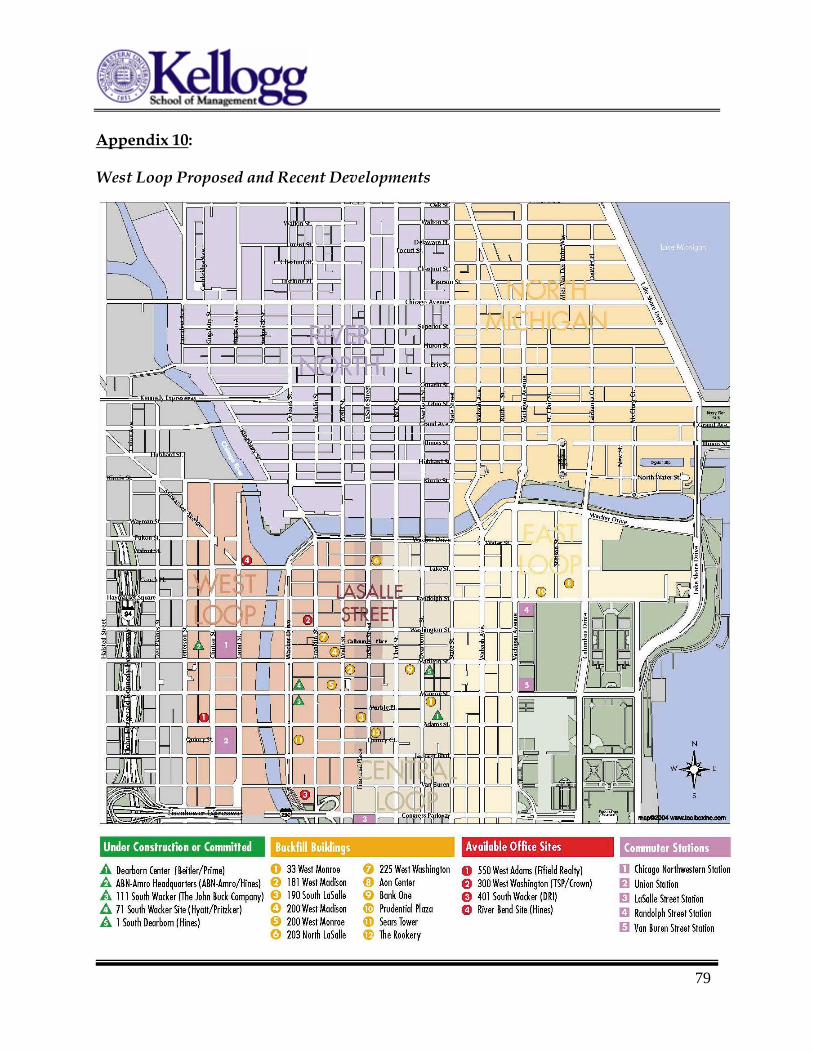
79
Appendix 10: West Loop Proposed and Recent Developments
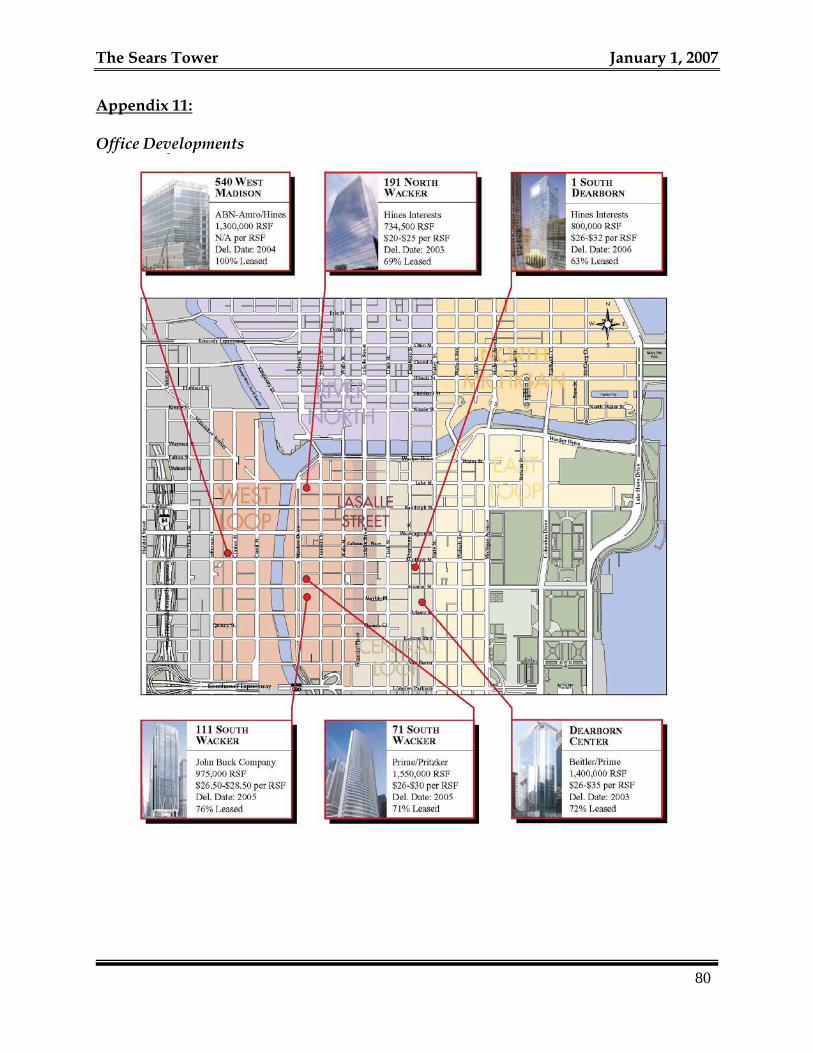
The Sears Tower January 1, 2007 Appendix 11: Office Developments
80
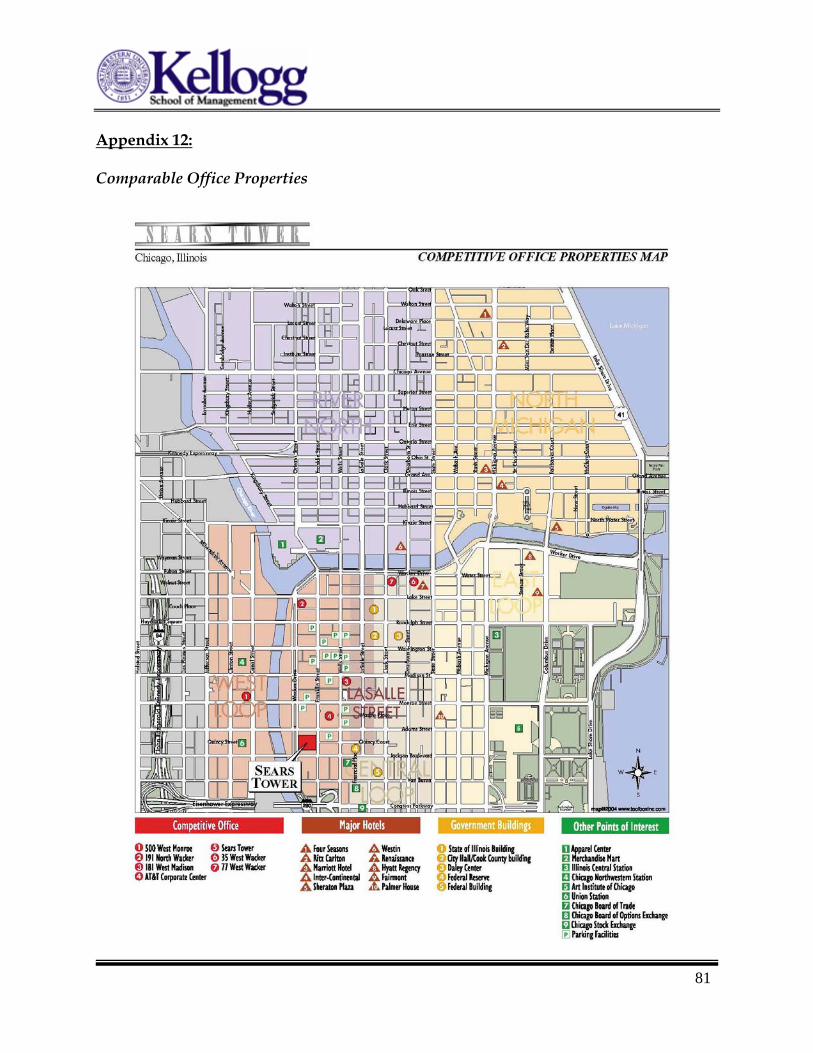
81
Appendix 12: Comparable Office Properties