Embed Size (px)
Citation preview
Geography and the American Community SurveyWhat Data Users Need to Know
Issued February 2020

Acknowledgments Linda A. Jacobsen, Vice President, U.S. Programs, Population Reference Bureau (PRB) and Mark Mather, Associate Vice President, U.S. Programs, PRB, drafted this handbook in partnership with the U.S. Census Bureau’s American Community Survey Office. Other PRB staff who assisted in drafting the handbook include: Beth Jarosz, Lillian Kilduff, Kelvin Pollard, and Paola Scommegna.
Nicole Scanniello, Gretchen Gooding, and Charles Gamble III, Census Bureau, contributed to the planning and review of this handbook.
The American Community Survey program is under the direction of Albert E. Fontenot Jr., Associate Director for Decennial Census Programs, James B. Treat, Assistant Director for Decennial Census Programs, and Donna M. Daily, Chief, American Community Survey Office.
Other individuals from the Census Bureau who contributed to the review and release of these handbooks include Fay Dahlquist, Sirius Fuller, Amanda Klimek, Laura La Kose, Janice Valdisera, and Tyson Weister.
Faye Brock, Linda Chen, and Christine Geter provided publication management, graphic design and composition, and editorial review for print and electronic media under the direction of Janet Sweeney, Chief of the Graphic and Editorial Services Branch, Public Information Office.
U.S. Department of Commerce Wilbur Ross,
Secretary
Karen Dunn Kelley, Deputy Secretary
U.S. CENSUS BUREAU Steven Dillingham,
Director
Geography and the American Community SurveyWhat Data Users Need to Know
Issued February 2020
Suggested Citation
U.S. Census Bureau, Geography and the American
Community Survey: What Data Users Need to Know
U.S. Government Printing Office, Washington, DC, 2020.
U.S. CENSUS BUREAU Steven Dillingham, Director
Ron Jarmin, Deputy Director and Chief Operating Officer
Albert E. Fontenot Jr., Associate Director for Decennial Census Programs
James B. Treat, Assistant Director for Decennial Census Programs
Donna M. Daily, Chief, American Community Survey Office
Geography and the American Community Survey iii What Data Users Need to Know iiiU.S. Census Bureau
Contents 1. Geographic Areas Covered in the ACS . . . . . . . . . . . . . . . . . . . . . . . . . . . . . . . . . . . 2
2. Geographic Boundaries, Vintages, and Frequency of Updates . . . . . . . . . . . . . 12
3. Accessing and Mapping ACS Data . . . . . . . . . . . . . . . . . . . . . . . . . . . . . . . . . . . . . . 13
4. Additional Resources . . . . . . . . . . . . . . . . . . . . . . . . . . . . . . . . . . . . . . . . . . . . . . . . . . 21

This page is intentionally blank.
Geography and the American Community Survey 1 What Data Users Need to Know 1U.S. Census Bureau
GEOGRAPHY AND THE AMERICAN COMMUNITY SURVEY: WHAT DATA USERS NEED TO KNOWGeography plays an important role in all U.S. Census Bureau activities by providing the framework used to collect and publish data, including American Community Survey (ACS) estimates. Data users employ ACS data that are tabulated for a variety of geographic areas to produce detailed portraits and maps of social, economic, housing, and demographic character-istics of America’s communities.
This guide provides an overview of geographic areas for which ACS data are available, special considerations in working with spatial data, and links to tools and other resources that data users can use to map ACS data.
What Is the ACS?
The ACS is a nationwide survey designed to pro-vide communities with reliable and timely social, economic, housing, and demographic data every year. A separate annual survey, called the Puerto Rico Community Survey (PRCS), collects similar data about the population and housing units in Puerto Rico. The Census Bureau uses data col-lected in the ACS and the PRCS to provide esti-mates on a broad range of population, housing unit, and household characteristics for states, counties, cities, school districts, congressional districts, census tracts, block groups, and many other geographic areas.
The ACS has an annual sample size of about 3.5 million addresses, with survey information
collected nearly every day of the year. Data are pooled across a calendar year to produce esti-mates for that year. As a result, ACS estimates reflect data that have been collected over a period of time rather than for a single point in time as in the decennial census, which is con-ducted every 10 years and provides population counts as of April 1 of the census year.
ACS 1-year estimates are data that have been col-lected over a 12-month period and are available for geographic areas with at least 65,000 people. Starting with the 2014 ACS, the Census Bureau is also producing “1-year Supplemental Estimates”—simplified versions of popular ACS tables—for geographic areas with at least 20,000 people. The Census Bureau combines 5 consecutive years of ACS data to produce multiyear estimates for geographic areas with fewer than 65,000 resi-dents. These 5-year estimates represent data col-lected over a period of 60 months.
For more detailed information about the ACS—how to judge the accuracy of ACS estimates, understanding multiyear estimates, knowing which geographic areas are covered in the ACS, and how to access ACS data on the Census Bureau’s Web site—see the Census Bureau’s handbook on Understanding and Using American Community Survey Data: What All Data Users Need to Know.1
1 U.S. Census Bureau, American Community Survey (ACS), Understanding and Using American Community Survey Data: What All Data Users Need to Know, <www.census.gov/programs-surveys/acs /guidance/handbooks/general.html>.

2 Geography and the American Community Survey 2 What Data Users Need to Know U.S. Census Bureau
1. GEOGRAPHIC AREAS COVERED IN THE ACSFor reporting purposes, the U.S. Census Bureau divides the nation into two main types of geographic areas, legal and statistical. Legal areas are defined specifi-cally by law, and include state, local, and tribal govern-ment units, and some specially defined administrative areas like congressional districts. Many, but not all of these areas, are represented by elected officials. An example of a legal area is New York State.
Statistical areas are defined directly by the Census Bureau and state, regional, or local authorities for the purpose of presenting data. Examples of statistical areas include census designated places, census tracts, urban areas, and metropolitan statistical areas (such as the Boston-Cambridge-Newton, MA-NH Metropolitan Statistical Area).
Geographic areas are organized in a hierarchy (see Figure 1.1). Larger units, such as states, include smaller units such as counties and census tracts. This structure is derived from the legal, administrative, or areal rela-tionships of the entities. In the American Community Survey (ACS), block groups are the lowest (smallest) level of geography published. Block group data are only available in the ACS 5-year data products. The ACS does not produce data at the block level.
In Figure 1.1, the geographic types connected by lines are nested within each other. For example, a line extends from counties to census tracts because a county is completely comprised of census tracts, and a single census tract cannot cross a county boundary.
Figure 1.1. Hierarchy of Select Geographic Entities in the ACS
REGIONS
DIVISIONS
Counties
Census Tracts*
Block Groups*
American Indian Areas/Alaska Native Areas/Hawaiian Home Lands
Urban Areas
Metropolitan and Micropolitan Areas
Public Use Microdata Areas
State Legislative Districts*
Alaska Native Regional Areas
Places
STATES
NATION
ZIP Code Tabulation Areas (ZCTA)**
School Districts
County Subdivisions
Congressional Districts
* Five-year estimates only. ** Five-year estimates only, first released in 2012 for the 2007–2011 ACS estimates. Source: U.S. Census Bureau.
Geography and the American Community Survey 3 What Data Users Need to Know 3U.S. Census Bureau
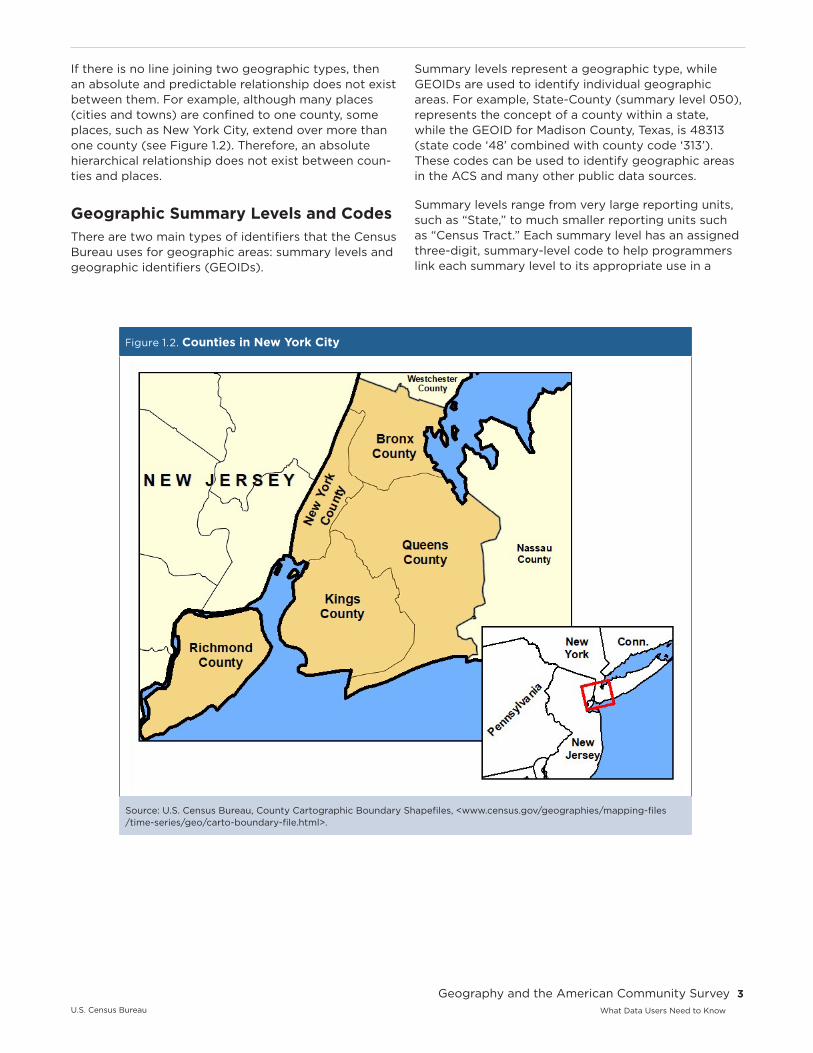
If there is no line joining two geographic types, then an absolute and predictable relationship does not exist between them. For example, although many places (cities and towns) are confined to one county, some places, such as New York City, extend over more than one county (see Figure 1.2). Therefore, an absolute hierarchical relationship does not exist between coun-ties and places.
Geographic Summary Levels and Codes There are two main types of identifiers that the Census Bureau uses for geographic areas: summary levels and geographic identifiers (GEOIDs).
Summary levels represent a geographic type, while GEOIDs are used to identify individual geographic areas. For example, State-County (summary level 050), represents the concept of a county within a state, while the GEOID for Madison County, Texas, is 48313 (state code ‘48’ combined with county code ‘313’). These codes can be used to identify geographic areas in the ACS and many other public data sources.
Summary levels range from very large reporting units, such as “State,” to much smaller reporting units such as “Census Tract.” Each summary level has an assigned three-digit, summary-level code to help programmers link each summary level to its appropriate use in a
Figure 1.2. Counties in New York City
Source: U.S. Census Bureau, County Cartographic Boundary Shapefiles, <www.census.gov/geographies/mapping-files /time-series/geo/carto-boundary-file.html>.
4 Geography and the American Community Survey 4 What Data Users Need to Know U.S. Census Bureau
table, map, or other data summarization format. Here are some common summary levels used to identify types of geographic areas:
• 010 Nation• 020 Region• 030 Division2• 040 State• 050 State-County• 140 State-County-Census Tract• 155 State-Place-County• 160 State-Place• 250 American Indian Area/Alaska Native Area/
Hawaiian Home Land• 310 Metropolitan Statistical Area/Micropolitan
Statistical Area• 500 State-Congressional District
Summary levels may cross between two or more geographic hierarchies to produce units that are only portions of geographic areas. For example, summary level “State-Place-County” crosses the “State-Place” hierarchy with the “State-County” hierarchy and may create units that cover only a portion of one county.
A list of Cartographic Boundary File Summary Level Codes is available on the Census Bureau’s Web site.3
Geographic Codes
The Census Bureau and other state and federal agen-cies are responsible for assigning codes, or GEOIDs, to geographic areas. GEOIDs are numeric codes that uniquely identify each legal or statistical geographic area for which the Census Bureau tabulates data.
GEOIDS are useful for sorting names of geographic areas for presentation purposes or analysis, merging ACS data with data from other sources, identifying areas as legally or statistically defined entities, and describing the classification category of the area.
2 Divisions represent regional subdivisions such as “Middle Atlantic Division.”
3 U.S. Census Bureau, Geography Program, Cartographic Boundary File Summary Level Codes, <www.census.gov/programs-surveys /geography/technical-documentation/naming-convention /cartographic-boundary-file/carto-boundary-summary-level.html>.
The Census Bureau uses several different code sets to identify geographic areas depending on area type and purpose. The most frequently used code systems are Federal Information Processing Series and American National Standards Institute codes.4
To identify a geographic area that is nested within a larger area, such as a state or the nation, one or more higher-level codes may be required. Census tract codes are unique within counties, and county codes are unique within states. Therefore, a complete set of state, county, and tract codes is needed to uniquely identify a particular census tract.
For example:
• The unique GEOID for census tract 201 in AutaugaCounty, Alabama, is 01001020100.
• The unique GEOID for census tract 201 in La PazCounty, Arizona, is 04012020100.
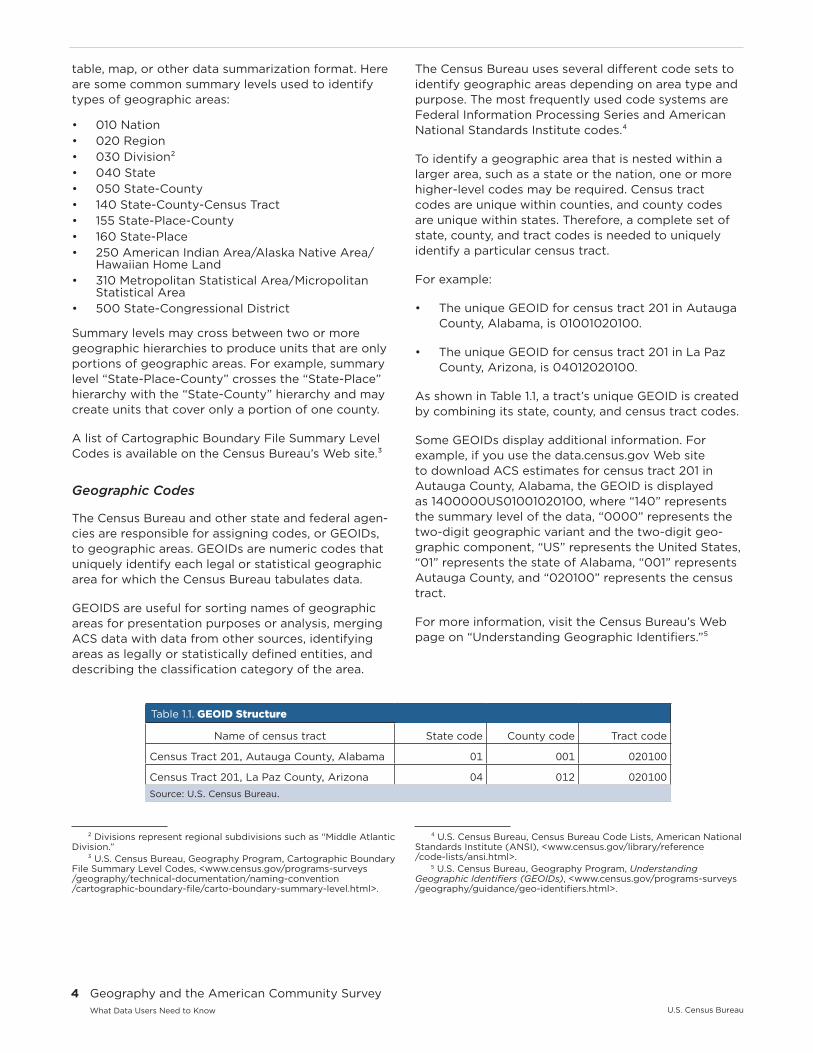
As shown in Table 1.1, a tract’s unique GEOID is created by combining its state, county, and census tract codes.
Some GEOIDs display additional information. For example, if you use the data.census.gov Web site to download ACS estimates for census tract 201 in Autauga County, Alabama, the GEOID is displayed as 1400000US01001020100, where “140” represents the summary level of the data, “0000” represents the two-digit geographic variant and the two-digit geo-graphic component, “US” represents the United States, “01” represents the state of Alabama, “001” represents Autauga County, and “020100” represents the census tract.
For more information, visit the Census Bureau’s Web page on “Understanding Geographic Identifiers.”5
4 U.S. Census Bureau, Census Bureau Code Lists, American National Standards Institute (ANSI), <www.census.gov/library/reference /code-lists/ansi.html>.
5 U.S. Census Bureau, Geography Program, Understanding Geographic Identifiers (GEOIDs), <www.census.gov/programs-surveys /geography/guidance/geo-identifiers.html>.
Table 1.1. GEOID Structure
Name of census tract State code County code Tract code
Census Tract 201, Autauga County, Alabama 01 001 020100
Census Tract 201, La Paz County, Arizona 04 012 020100Source: U.S. Census Bureau.
Geography and the American Community Survey 5 What Data Users Need to Know 5U.S. Census Bureau
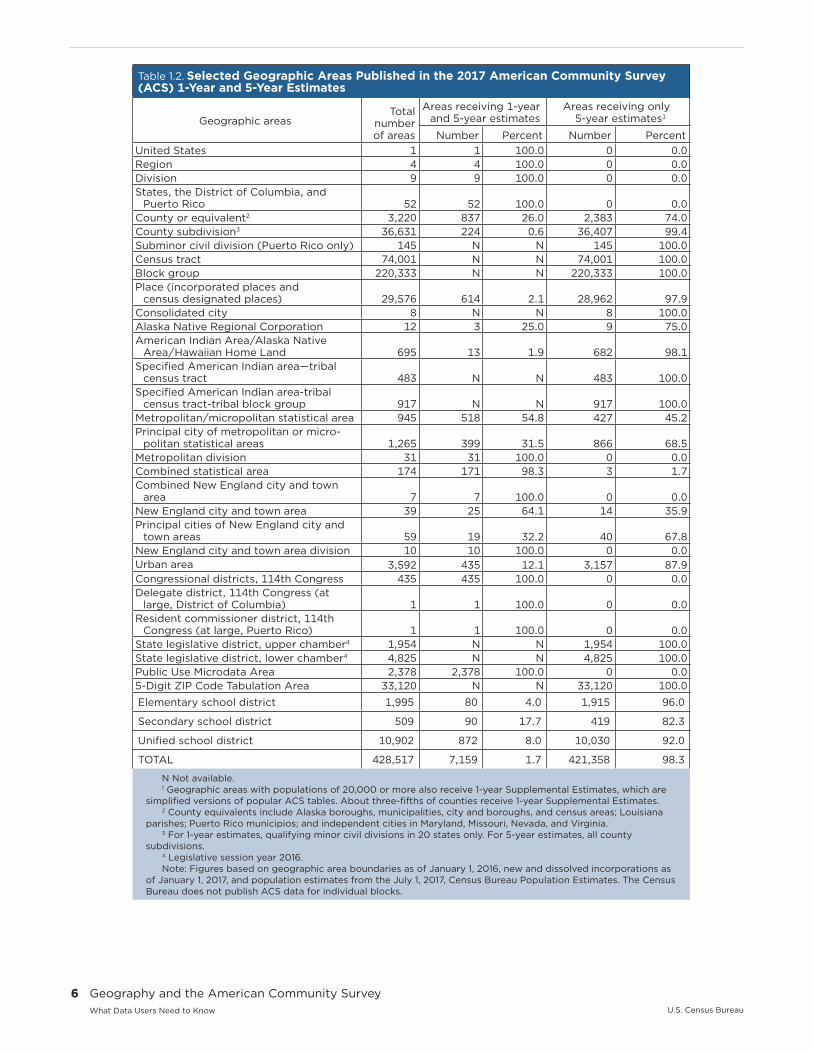
Population Thresholds for Geographic AreasEach year, the Census Bureau publishes ACS 1-year estimates for geographic areas with populations of 65,000 or more. The 65,000-population threshold ensures that 1-year data are available for all regions, divisions, states, the District of Columbia, Puerto Rico, congressional districts, Public Use Microdata Areas (PUMAs), many large counties and county equivalents, metropolitan and micropolitan statistical areas, cit-ies, school districts, and American Indian areas.6 The 1-year Supplemental Estimates—simplified versions of popular ACS tables—are also available for geographic areas with at least 20,000 people. These annual data provide policymakers, planners, business leaders, and others with a critical source of up-to-date information to plan for services such as transportation, medical care, housing, and schools.
For geographic areas with smaller populations, the ACS samples too few housing units to provide reliable single-year estimates. For these areas, several years of data are pooled together to create more precise multiyear estimates. Since 2010, the ACS has published 5-year data (beginning with 2005–2009 estimates) for geographic areas down to the census tract and block group levels.7
6 PUMAs are collections of counties—or census tracts within coun-ties—with approximately 100,000 people each. PUMAs do not cross state lines. PUMAs were initially adopted by the ACS because they were the only wall-to-wall geographic entities below the state level that met the minimum population threshold of 65,000 required to dis-seminate ACS 1-year estimates.
7 For several years, the Census Bureau produced both ACS 3-year estimates (for areas with populations of 20,000 or more) and ACS 5-year estimates (for all geographic areas). Starting with the 2014 data release, the 3-year products were discontinued, but 5-year estimates are still published each year.
Table 1.2 shows the type and number of geographic areas included in the ACS 1-year and 5-year products for 2017. For example, in 2017, ACS 1-year data were available for 837 counties (26 percent of all counties), while the remaining 2,383 counties (74 percent of all counties) received 5-year estimates.
Data users interested in ACS estimates for areas with populations of 65,000 or more have a choice between the 1-year and 5-year data series. Which data should be used and why? The 1-year estimates for an area reflect the most current data but have larger margins of error (MOEs)—indicating less reliability or preci-sion—than the 5-year estimates because they are based on a smaller sample. The 5-year estimates for an area have a larger sample and smaller MOEs than the 1-year estimates. However, they are less current because the larger samples include data that were collected in earlier years. The main advantage of using multiyear estimates is the increased statistical reliabil-ity for smaller geographic areas and small population groups.
In the end, what makes the most sense is a mat-ter of judgment regarding the balance between the period covered by an estimate and its level of reliabil-ity or precision. The key is to strive to use only reli-able estimates, where the period covered best suits the question at hand. For more information about ACS 1-year and 5-year estimates, see the section on “Understanding and Using ACS Single-Year and Multiyear Estimates” in the Census Bureau’s handbook on Understanding and Using American Community Survey Data: What All Data Users Need to Know.8
8 U.S. Census Bureau, Understanding and Using American Community Survey Data: What All Data Users Need to Know, <www.census.gov/programs-surveys/acs/guidance/handbooks /general.html>.
6 Geography and the American Community Survey 6 What Data Users Need to Know U.S. Census Bureau
Table 1.2. Selected Geographic Areas Published in the 2017 American Community Survey (ACS) 1-Year and 5-Year Estimates
Geographic areasTotal
number of areas
Areas receiving 1-year and 5-year estimates
Areas receiving only 5-year estimates1
Number Percent Number PercentUnited States 1 1 100.0 0 0.0Region 4 4 100.0 0 0.0Division 9 9 100.0 0 0.0States, the District of Columbia, and
Puerto Rico 52 52 100.0 0 0.0County or equivalent2 3,220 837 26.0 2,383 74.0County subdivision3 36,631 224 0.6 36,407 99.4Subminor civil division (Puerto Rico only) 145 N N 145 100.0Census tract 74,001 N N 74,001 100.0Block group 220,333 N N 220,333 100.0Place (incorporated places and
census designated places) 29,576 614 2.1 28,962 97.9Consolidated city 8 N N 8 100.0Alaska Native Regional Corporation 12 3 25.0 9 75.0American Indian Area/Alaska Native
Area/Hawaiian Home Land 695 13 1.9 682 98.1Specified American Indian area—tribal
census tract 483 N N 483 100.0Specified American Indian area-tribal
census tract-tribal block group 917 N N 917 100.0Metropolitan/micropolitan statistical area 945 518 54.8 427 45.2Principal city of metropolitan or micro-
politan statistical areas 1,265 399 31.5 866 68.5Metropolitan division 31 31 100.0 0 0.0Combined statistical area 174 171 98.3 3 1.7Combined New England city and town
area 7 7 100.0 0 0.0New England city and town area 39 25 64.1 14 35.9Principal cities of New England city and
town areas 59 19 32.2 40 67.8New England city and town area division 10 10 100.0 0 0.0Urban area 3,592 435 12.1 3,157 87.9Congressional districts, 114th Congress 435 435 100.0 0 0.0Delegate district, 114th Congress (at
large, District of Columbia) 1 1 100.0 0 0.0Resident commissioner district, 114th
Congress (at large, Puerto Rico) 1 1 100.0 0 0.0State legislative district, upper chamber4 1,954 N N 1,954 100.0State legislative district, lower chamber4 4,825 N N 4,825 100.0Public Use Microdata Area 2,378 2,378 100.0 0 0.05-Digit ZIP Code Tabulation Area 33,120 N N 33,120 100.0
Elementary school district 1,995 80 4.0 1,915 96.0
Secondary school district 509 90 17.7 419 82.3
Unified school district 10,902 872 8.0 10,030 92.0
TOTAL 428,517 7,159 1.7 421,358 98.3
N Not available.1 Geographic areas with populations of 20,000 or more also receive 1-year Supplemental Estimates, which are
simplified versions of popular ACS tables. About three-fifths of counties receive 1-year Supplemental Estimates.2 County equivalents include Alaska boroughs, municipalities, city and boroughs, and census areas; Louisiana
parishes; Puerto Rico municipios; and independent cities in Maryland, Missouri, Nevada, and Virginia.3 For 1-year estimates, qualifying minor civil divisions in 20 states only. For 5-year estimates, all county
subdivisions.4 Legislative session year 2016.Note: Figures based on geographic area boundaries as of January 1, 2016, new and dissolved incorporations as
of January 1, 2017, and population estimates from the July 1, 2017, Census Bureau Population Estimates. The Census Bureau does not publish ACS data for individual blocks.
Geography and the American Community Survey 7 What Data Users Need to Know 7U.S. Census Bureau
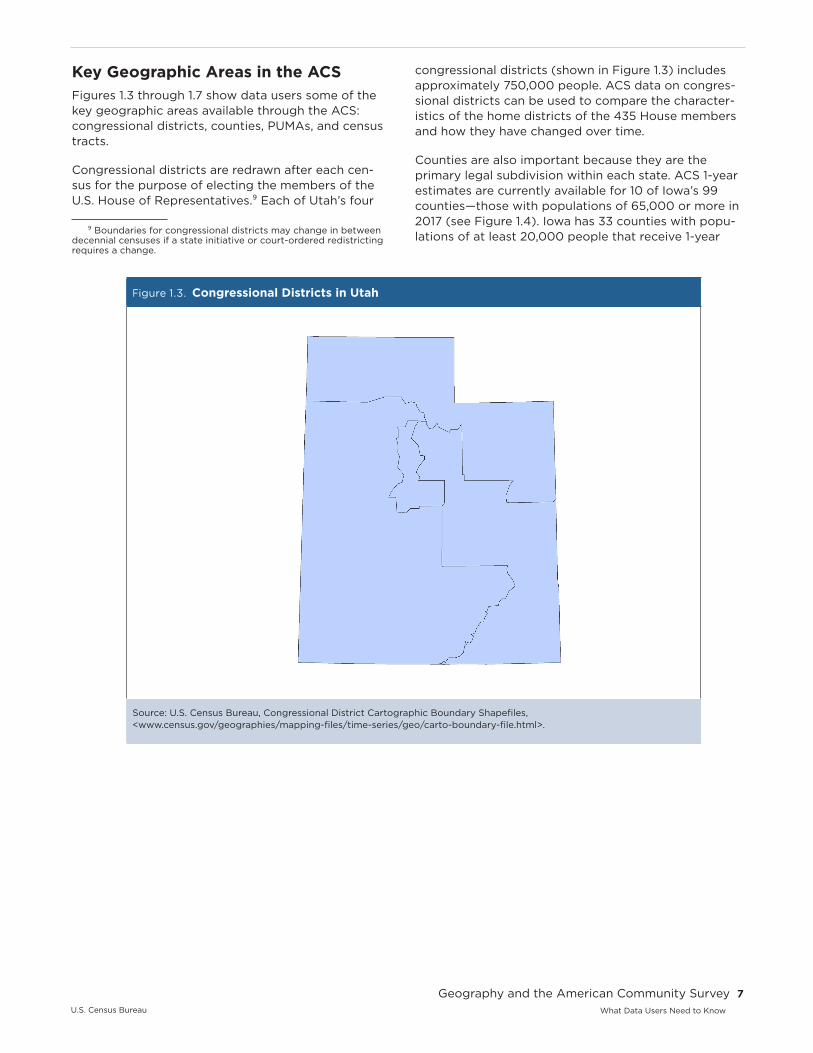
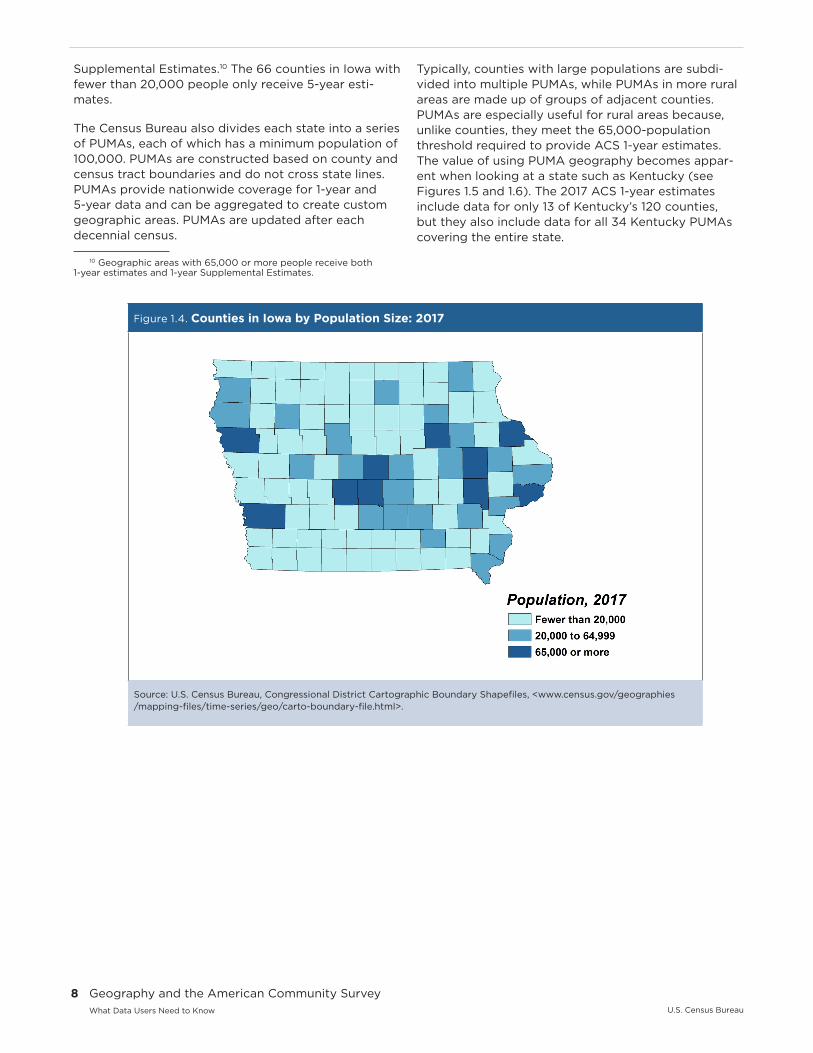
Key Geographic Areas in the ACSFigures 1.3 through 1.7 show data users some of the key geographic areas available through the ACS: congressional districts, counties, PUMAs, and census tracts.
Congressional districts are redrawn after each cen-sus for the purpose of electing the members of the U.S. House of Representatives.9 Each of Utah’s four
9 Boundaries for congressional districts may change in between decennial censuses if a state initiative or court-ordered redistricting requires a change.
congressional districts (shown in Figure 1.3) includes approximately 750,000 people. ACS data on congres-sional districts can be used to compare the character-istics of the home districts of the 435 House members and how they have changed over time.
Counties are also important because they are the primary legal subdivision within each state. ACS 1-year estimates are currently available for 10 of Iowa’s 99 counties—those with populations of 65,000 or more in 2017 (see Figure 1.4). Iowa has 33 counties with popu-lations of at least 20,000 people that receive 1-year
Figure 1.3. Congressional Districts in Utah
Source: U.S. Census Bureau, Congressional District Cartographic Boundary Shapefiles, <www.census.gov/geographies/mapping-files/time-series/geo/carto-boundary-file.html>.
8 Geography and the American Community Survey 8 What Data Users Need to Know U.S. Census Bureau
Supplemental Estimates.10 The 66 counties in Iowa with fewer than 20,000 people only receive 5-year esti-mates.
The Census Bureau also divides each state into a series of PUMAs, each of which has a minimum population of 100,000. PUMAs are constructed based on county and census tract boundaries and do not cross state lines. PUMAs provide nationwide coverage for 1-year and 5-year data and can be aggregated to create custom geographic areas. PUMAs are updated after each decennial census.
10 Geographic areas with 65,000 or more people receive both 1-year estimates and 1-year Supplemental Estimates.
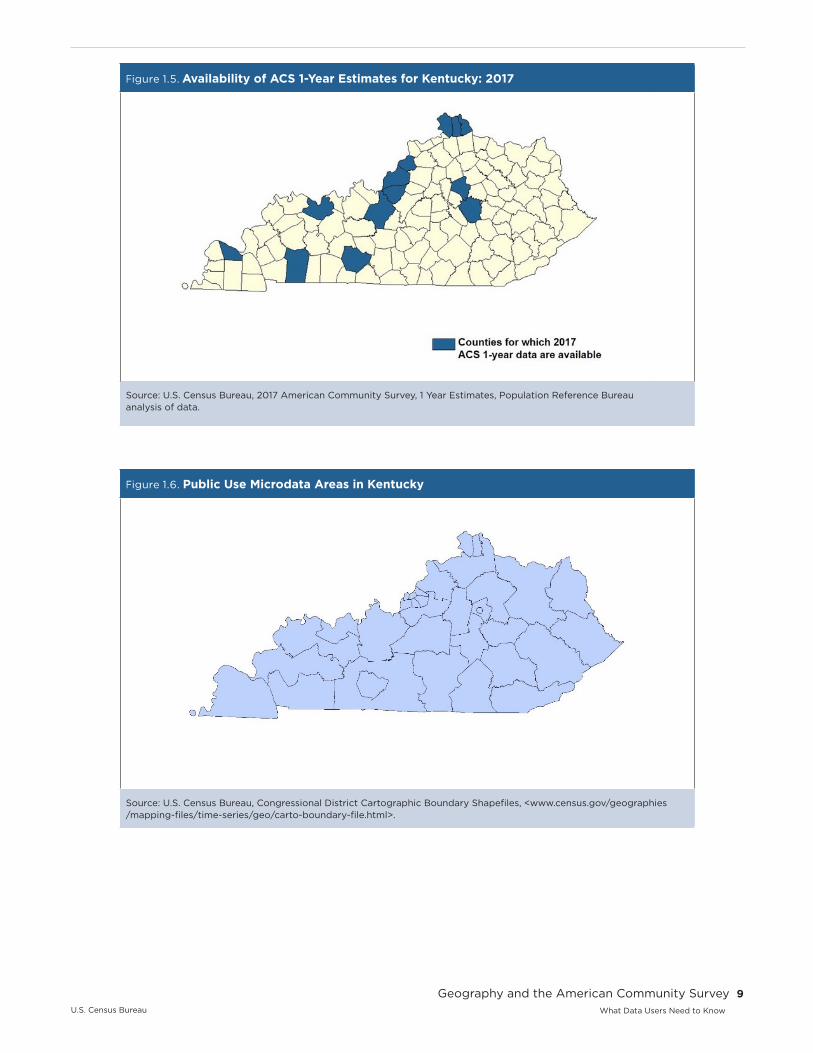
Typically, counties with large populations are subdi-vided into multiple PUMAs, while PUMAs in more rural areas are made up of groups of adjacent counties. PUMAs are especially useful for rural areas because, unlike counties, they meet the 65,000-population threshold required to provide ACS 1-year estimates. The value of using PUMA geography becomes appar-ent when looking at a state such as Kentucky (see Figures 1.5 and 1.6). The 2017 ACS 1-year estimates include data for only 13 of Kentucky’s 120 counties, but they also include data for all 34 Kentucky PUMAs covering the entire state.
Figure 1.4. Counties in Iowa by Population Size: 2017
Source: U.S. Census Bureau, Congressional District Cartographic Boundary Shapefiles, <www.census.gov/geographies /mapping-files/time-series/geo/carto-boundary-file.html>.
Geography and the American Community Survey 9 What Data Users Need to Know 9U.S. Census Bureau
Figure 1.5. Availability of ACS 1-Year Estimates for Kentucky: 2017
Source: U.S. Census Bureau, 2017 American Community Survey, 1 Year Estimates, Population Reference Bureau analysis of data.
Figure 1.6. Public Use Microdata Areas in Kentucky
Source: U.S. Census Bureau, Congressional District Cartographic Boundary Shapefiles, <www.census.gov/geographies /mapping-files/time-series/geo/carto-boundary-file.html>.
10 Geography and the American Community Survey 10 What Data Users Need to Know U.S. Census Bureau
PUMAs are also useful for examining densely popu-lated areas in depth. Data users who want to investi-gate single-year estimates for subregions within large urban areas can do so by using PUMA-level data to obtain detailed descriptions of the areas. For example, the ACS releases estimates for the city of Chicago (in Cook County, Illinois), but Chicago is also subdivided into 19 PUMAs, each with its own ACS 1-year estimates.
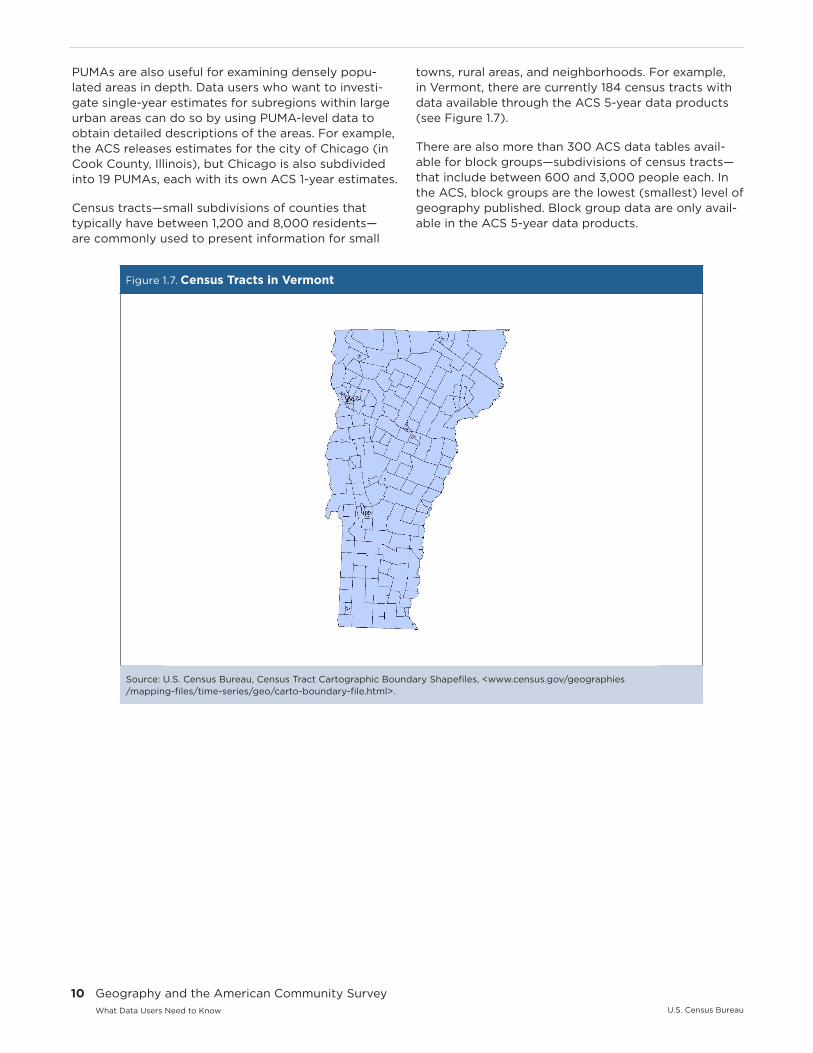
Census tracts—small subdivisions of counties that typically have between 1,200 and 8,000 residents—are commonly used to present information for small
towns, rural areas, and neighborhoods. For example, in Vermont, there are currently 184 census tracts with data available through the ACS 5-year data products (see Figure 1.7).
There are also more than 300 ACS data tables avail-able for block groups—subdivisions of census tracts—that include between 600 and 3,000 people each. In the ACS, block groups are the lowest (smallest) level of geography published. Block group data are only avail-able in the ACS 5-year data products.
Figure 1.7. Census Tracts in Vermont
Source: U.S. Census Bureau, Census Tract Cartographic Boundary Shapefiles, <www.census.gov/geographies /mapping-files/time-series/geo/carto-boundary-file.html>.
Geography and the American Community Survey 11 What Data Users Need to Know 11U.S. Census Bureau
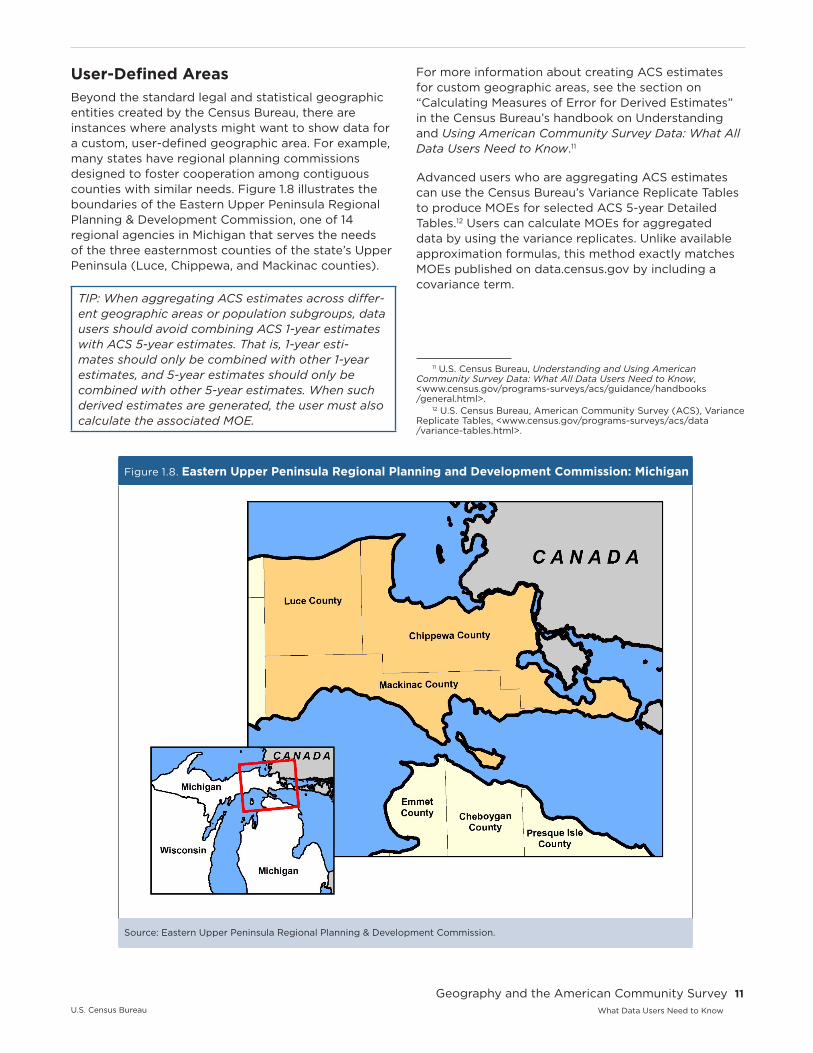
User-Defined AreasBeyond the standard legal and statistical geographic entities created by the Census Bureau, there are instances where analysts might want to show data for a custom, user-defined geographic area. For example, many states have regional planning commissions designed to foster cooperation among contiguous counties with similar needs. Figure 1.8 illustrates the boundaries of the Eastern Upper Peninsula Regional Planning & Development Commission, one of 14 regional agencies in Michigan that serves the needs of the three easternmost counties of the state’s Upper Peninsula (Luce, Chippewa, and Mackinac counties).
TIP: When aggregating ACS estimates across differ-ent geographic areas or population subgroups, data users should avoid combining ACS 1-year estimates with ACS 5-year estimates. That is, 1-year esti-mates should only be combined with other 1-year estimates, and 5-year estimates should only be combined with other 5-year estimates. When such derived estimates are generated, the user must also calculate the associated MOE.
For more information about creating ACS estimates for custom geographic areas, see the section on “Calculating Measures of Error for Derived Estimates” in the Census Bureau’s handbook on Understanding and Using American Community Survey Data: What All Data Users Need to Know.11
Advanced users who are aggregating ACS estimates can use the Census Bureau’s Variance Replicate Tables to produce MOEs for selected ACS 5-year Detailed Tables.12 Users can calculate MOEs for aggregated data by using the variance replicates. Unlike available approximation formulas, this method exactly matches MOEs published on data.census.gov by including a covariance term.
11 U.S. Census Bureau, Understanding and Using American Community Survey Data: What All Data Users Need to Know, <www.census.gov/programs-surveys/acs/guidance/handbooks /general.html>.
12 U.S. Census Bureau, American Community Survey (ACS), Variance Replicate Tables, <www.census.gov/programs-surveys/acs/data /variance-tables.html>.
Figure 1.8. Eastern Upper Peninsula Regional Planning and Development Commission: Michigan
Source: Eastern Upper Peninsula Regional Planning & Development Commission.
12 Geography and the American Community Survey 12 What Data Users Need to Know U.S. Census Bureau
2. GEOGRAPHIC BOUNDARIES, VINTAGES, AND FREQUENCY OF UPDATESThe American Community Survey (ACS) publishes estimates using vintages (the latest available geo-graphic boundaries). For the ACS 5-year estimates, the vintage is the last year of the multiyear period. For example, the 2017 ACS 1-year estimates and 2013–2017 ACS 5-year estimates use the same vin-tage (2017) of geographic boundaries.
More specifically, ACS data generally reflect the geographic boundaries of legal areas as of January 1 of the estimate year. For example, the 2017 ACS 1-year estimates use the geographic area boundar-ies in effect as of January 1, 2017, and the 2013–2017 ACS 5-year estimates (covering January 1, 2013, to December 31, 2017) also use the geographic area boundaries effective as of January 1, 2017.
While geographic boundary changes are not com-mon, they do occur, and those changes can affect a data user’s ability to make comparisons over time. For example, the city of Jurupa Valley, California, incorporated in July 2011. The U.S. Census Bureau published the first set of data for this city in 2012, and has produced updated data each subsequent year, but ACS data are not available for Jurupa Valley for 2011 and earlier years. The Census Bureau does not revise ACS data for previous years to reflect changes in geographic boundaries.
Congressional districts, which are redrawn every 10 years immediately following the decennial census, provide another example. Congressional district data from the 2012 ACS and later years reflect the new boundaries drawn after the 2010 Census, while ACS data for earlier years reflect the 2000 Census-based boundaries. Given the major changes to district boundaries after each census, a comparison of
congressional district data between 2011 and 2012 is not feasible.
Many statistical areas (like census tracts and block groups) are updated once per decade to reflect the most recent decennial census. Beginning with the 2010 ACS data products, most statistical areas reflect 2010 Census geographic definitions and boundaries. The 2009 and earlier ACS data prod-ucts use mostly 2000 Census statistical definitions. Most legal areas (like counties, places, and school districts) are updated every year or every other year. Boundary changes for selected legal areas are reported to the Census Bureau through the annual Boundary and Annexation Survey.13
TIP: In some cases, a geographic boundary may change, but the GEOID may remain the same, so data users need to pay attention to year-to-year changes to make sure the data are comparable over time. For example, the boundary of Bedford County, Virginia, was modified to add the former indepen-dent city of Bedford (effective July 1, 2013).
For a complete schedule of legal and statistical area updates, see the Census Bureau’s Web page on Geography Boundaries by Year.14 Geographic changes for each ACS data release are recorded on the Census Bureau’s Table & Geography Changes Web page.15
13 U.S. Census Bureau, Boundary and Annexation Survey (BAS), <www.census.gov/programs-surveys/bas.html>.
14 U.S. Census Bureau, American Community Survey (ACS), Geography Boundaries by Year, <www.census.gov/programs-surveys /acs/geography-acs/geography-boundaries-by-year.html>.
15 U.S. Census Bureau, American Community Survey (ACS), Table & Geography Changes, <www.census.gov/programs-surveys/acs /technical-documentation/table-and-geography-changes.html>.
Geography and the American Community Survey 13 What Data Users Need to Know 13U.S. Census Bureau
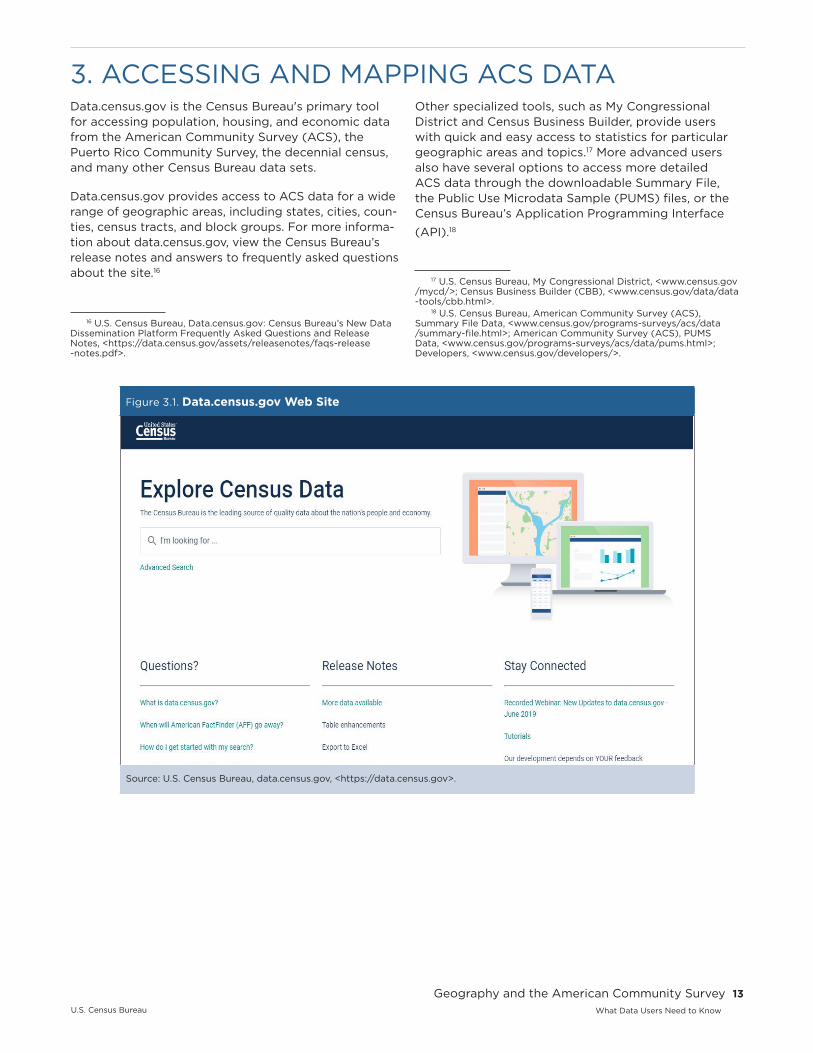
3. ACCESSING AND MAPPING ACS DATAData.census.gov is the Census Bureau's primary tool for accessing population, housing, and economic data from the American Community Survey (ACS), the Puerto Rico Community Survey, the decennial census, and many other Census Bureau data sets.
Data.census.gov provides access to ACS data for a wide range of geographic areas, including states, cities, coun-ties, census tracts, and block groups. For more informa-tion about data.census.gov, view the Census Bureau’s release notes and answers to frequently asked questions about the site.16
16 U.S. Census Bureau, Data.census.gov: Census Bureau’s New Data Dissemination Platform Frequently Asked Questions and Release Notes, <https://data.census.gov/assets/releasenotes/faqs-release -notes.pdf>.
Other specialized tools, such as My Congressional District and Census Business Builder, provide users with quick and easy access to statistics for particular geographic areas and topics.17 More advanced users also have several options to access more detailed ACS data through the downloadable Summary File, the Public Use Microdata Sample (PUMS) files, or the Census Bureau’s Application Programming Interface
(API).18
17 U.S. Census Bureau, My Congressional District, <www.census.gov /mycd/>; Census Business Builder (CBB), <www.census.gov/data/data -tools/cbb.html>.
18 U.S. Census Bureau, American Community Survey (ACS), Summary File Data, <www.census.gov/programs-surveys/acs/data /summary-file.html>; American Community Survey (ACS), PUMS Data, <www.census.gov/programs-surveys/acs/data/pums.html>; Developers, <www.census.gov/developers/>.
Figure 3.1. Data.census.gov Web Site
Source: U.S. Census Bureau, data.census.gov, <https://data.census.gov>.
14 Geography and the American Community Survey 14 What Data Users Need to Know U.S. Census Bureau
Topologically Integrated Geographic Encoding and Referencing (TIGER) Data and Products
If you need to combine ACS estimates with spatial data, the TIGER products are a good place to start. TIGER products are spatial extracts from the Census Bureau's Master Address File (MAF)/TIGER database (MTDB), designed for use with GIS (geographic infor-mation science/system) software. The data contain features, such as roads, railroads, and rivers, as well as legal and statistical geographic areas.19
TIGER products include the following:
• TIGERweb is a Web-based system that allowsusers to visualize TIGER data in several ways suchas viewing spatial data online or streaming tomapping applications.
• TIGER/Line with Selected Demographic andEconomic Data are geodatabases (or shapefiles,for some 2010 Census data) joined with selectedattributes (including population and housing unitcounts, demographic characteristics, such as sexby age, and socio-economic characteristics suchas poverty) from the 2010 Census, 2006–2010through current ACS 5-year estimates, and CountyBusiness Patterns for selected geographic areas.
19 U.S. Census Bureau, Geography Program, TIGER Data Products Guide, <www.census.gov/programs-surveys/geography/guidance /tiger-data-products-guide.html>.
• TIGER/Line Shapefiles provide legal boundaries,roads, address ranges, water features, and more.20
These files do not include demographic informa-tion but can be linked to data from demographictables using the GEOID.
• TIGER/Line Geodatabases are spatial extractsfrom the Census Bureau’s MTDB. The geodata-bases contain national coverage (for geographicboundaries or features) or state coverage (bound-aries within state). These files do not includedemographic data, but they contain GEOIDs thatcan be linked to the Census Bureau’s demographicdata.
• Cartographic Boundary Shapefiles are small scale(limited detail) mapping projects clipped to shore-line. These files are designed for thematic map-ping using GIS and are available for a limited set ofgeographic types.
• Keyhole Markup Language—CartographicBoundary Files are simplified representationsof selected geographic areas from the CensusBureau’s MAF/TIGER system. These boundary filesare specifically designed for small-scale thematicmapping using an online tool such as Google Earthor Google Maps.
The Census Bureau produced a brochure that describes several of these products in more detail.21
20 U.S. Census Bureau, Census Blogs, Understanding Census Bureau Address Ranges, <www.census.gov/newsroom/blogs/research-matters /2016/04/understanding-census-bureau-address-ranges.html>.
21 U.S. Census Bureau, Geography Program, TIGER Products Brochure, <www.census.gov/programs-surveys/geography/about /training/brochures.html>.
Geography and the American Community Survey 15 What Data Users Need to Know 15U.S. Census Bureau
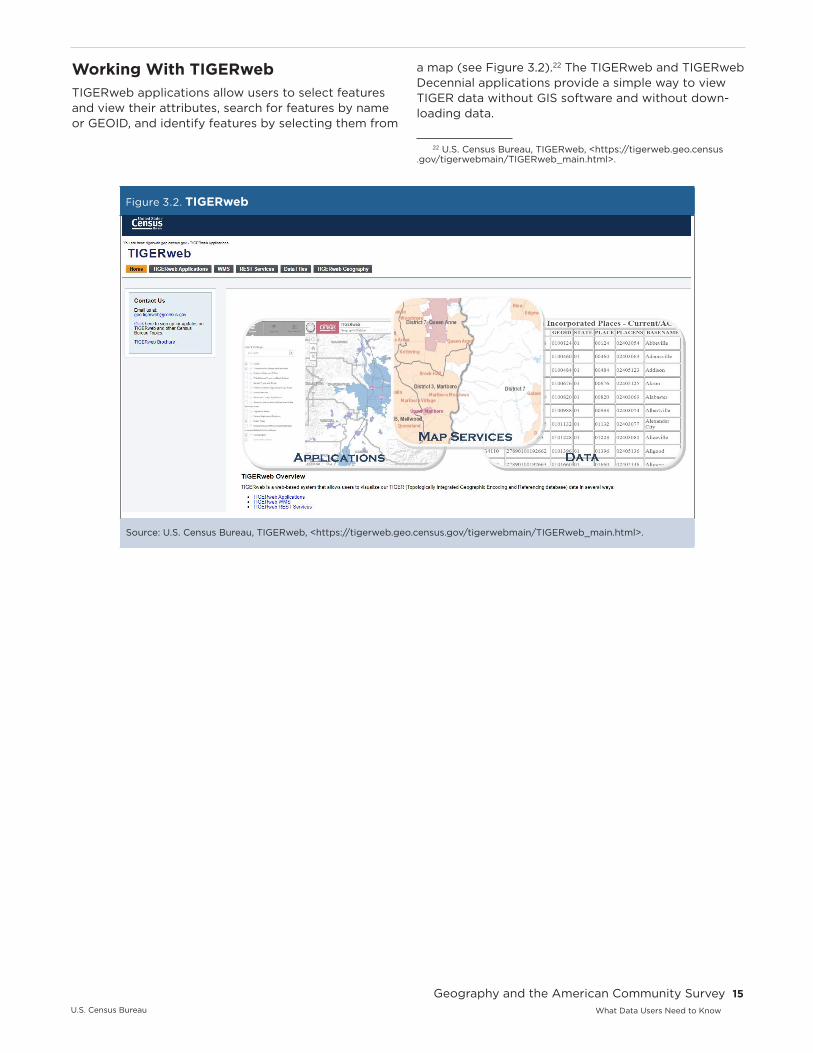
Working With TIGERwebTIGERweb applications allow users to select features and view their attributes, search for features by name or GEOID, and identify features by selecting them from
a map (see Figure 3.2).22 The TIGERweb and TIGERweb Decennial applications provide a simple way to view TIGER data without GIS software and without down-loading data.
22 U.S. Census Bureau, TIGERweb, <https://tigerweb.geo.census .gov/tigerwebmain/TIGERweb_main.html>.
Figure 3.2. TIGERweb
Source: U.S. Census Bureau, TIGERweb, <https://tigerweb.geo.census.gov/tigerwebmain/TIGERweb_main.html>.
16 Geography and the American Community Survey 16 What Data Users Need to Know U.S. Census Bureau
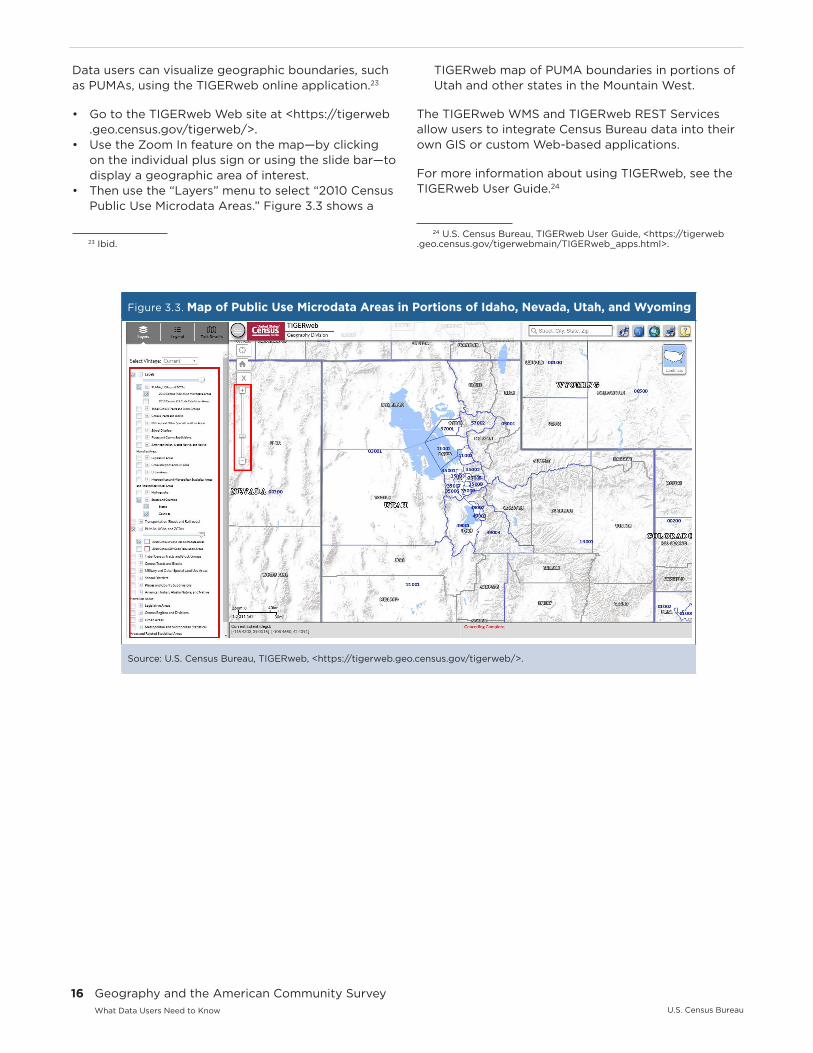
Data users can visualize geographic boundaries, such as PUMAs, using the TIGERweb online application.23
• Go to the TIGERweb Web site at <https://tigerweb .geo.census.gov/tigerweb/>.
• Use the Zoom In feature on the map—by clicking on the individual plus sign or using the slide bar—to display a geographic area of interest.
• Then use the “Layers” menu to select “2010 Census Public Use Microdata Areas.” Figure 3.3 shows a
23 Ibid.
TIGERweb map of PUMA boundaries in portions of Utah and other states in the Mountain West.
The TIGERweb WMS and TIGERweb REST Services allow users to integrate Census Bureau data into their own GIS or custom Web-based applications.
For more information about using TIGERweb, see the TIGERweb User Guide.24
24 U.S. Census Bureau, TIGERweb User Guide, <https://tigerweb .geo.census.gov/tigerwebmain/TIGERweb_apps.html>.
Figure 3.3. Map of Public Use Microdata Areas in Portions of Idaho, Nevada, Utah, and Wyoming
Source: U.S. Census Bureau, TIGERweb, <https://tigerweb.geo.census.gov/tigerweb/>.
Geography and the American Community Survey 17 What Data Users Need to Know 17U.S. Census Bureau
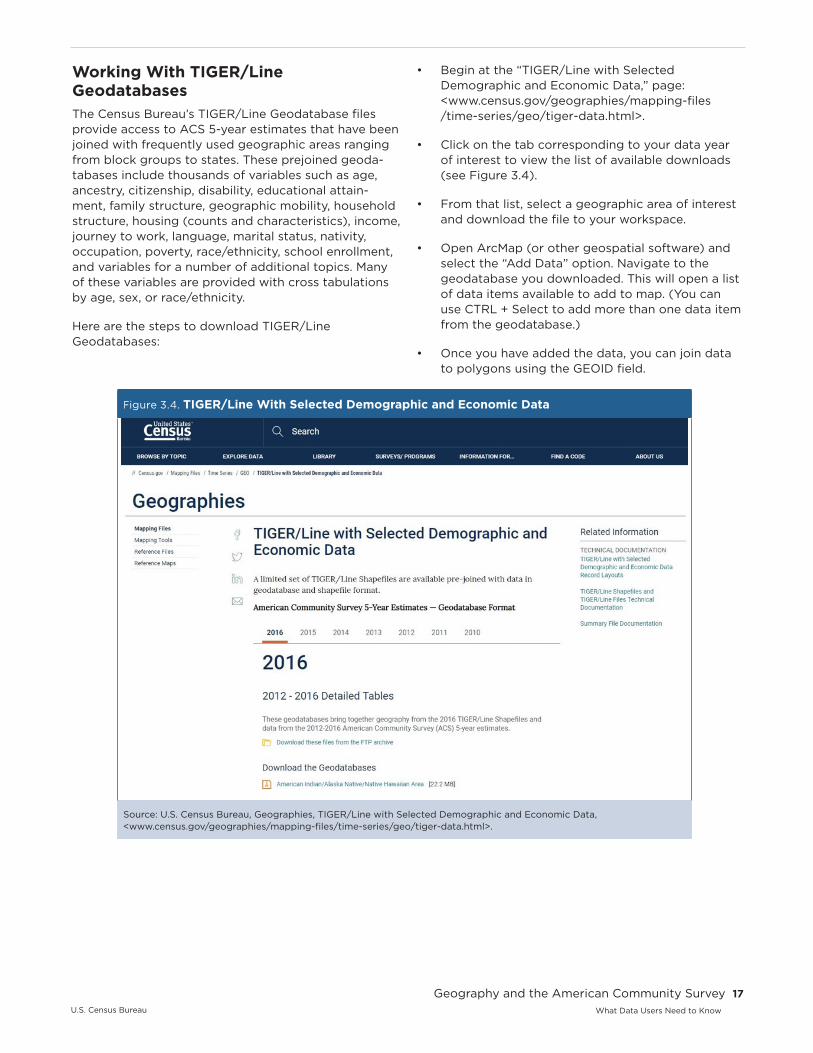
Working With TIGER/Line Geodatabases The Census Bureau’s TIGER/Line Geodatabase files provide access to ACS 5-year estimates that have been joined with frequently used geographic areas ranging from block groups to states. These prejoined geoda-tabases include thousands of variables such as age, ancestry, citizenship, disability, educational attain-ment, family structure, geographic mobility, household structure, housing (counts and characteristics), income, journey to work, language, marital status, nativity, occupation, poverty, race/ethnicity, school enrollment, and variables for a number of additional topics. Many of these variables are provided with cross tabulations by age, sex, or race/ethnicity.
Here are the steps to download TIGER/Line Geodatabases:
• Begin at the “TIGER/Line with Selected Demographic and Economic Data,” page: <www.census.gov/geographies/mapping-files /time-series/geo/tiger-data.html>.
• Click on the tab corresponding to your data year of interest to view the list of available downloads (see Figure 3.4).
• From that list, select a geographic area of interest and download the file to your workspace.
• Open ArcMap (or other geospatial software) and select the “Add Data” option. Navigate to the geodatabase you downloaded. This will open a list of data items available to add to map. (You can use CTRL + Select to add more than one data item from the geodatabase.)
• Once you have added the data, you can join data to polygons using the GEOID field.
Figure 3.4. TIGER/Line With Selected Demographic and Economic Data
Source: U.S. Census Bureau, Geographies, TIGER/Line with Selected Demographic and Economic Data, <www.census.gov/geographies/mapping-files/time-series/geo/tiger-data.html>.
18 Geography and the American Community Survey 18 What Data Users Need to Know U.S. Census Bureau
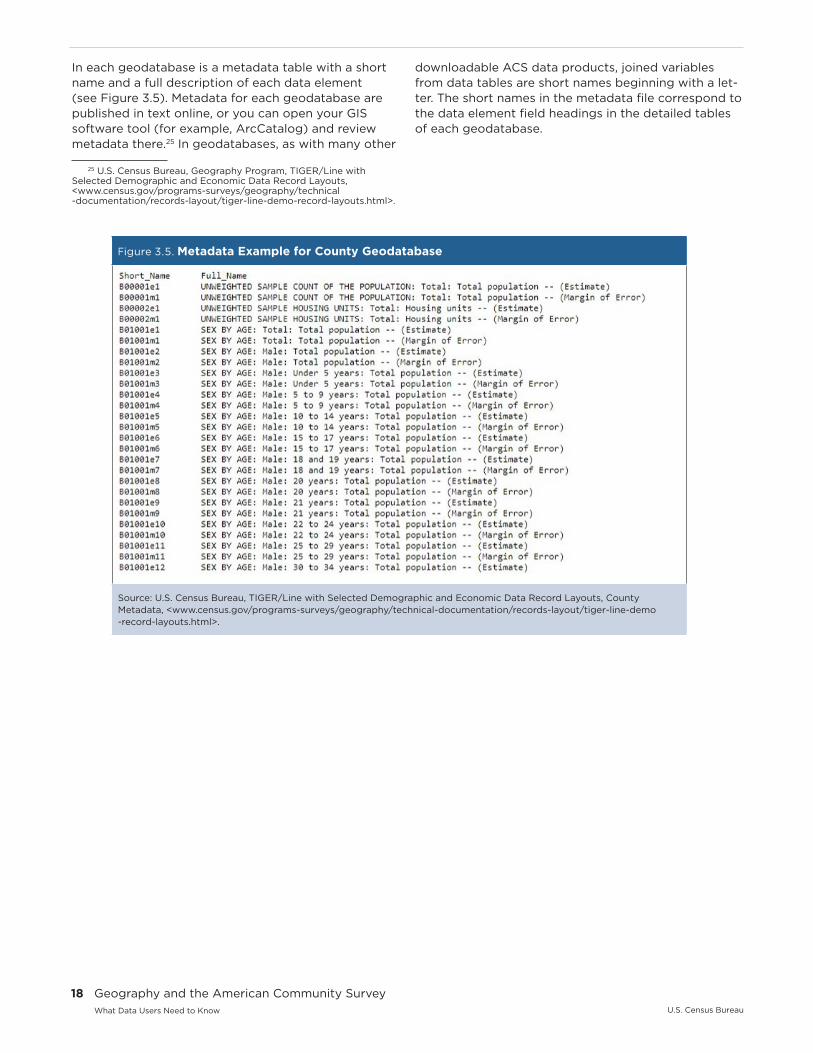
In each geodatabase is a metadata table with a short name and a full description of each data element (see Figure 3.5). Metadata for each geodatabase are published in text online, or you can open your GIS software tool (for example, ArcCatalog) and review metadata there.25 In geodatabases, as with many other
25 U.S. Census Bureau, Geography Program, TIGER/Line with Selected Demographic and Economic Data Record Layouts, <www.census.gov/programs-surveys/geography/technical -documentation/records-layout/tiger-line-demo-record-layouts.html>.
downloadable ACS data products, joined variables from data tables are short names beginning with a let-ter. The short names in the metadata file correspond to the data element field headings in the detailed tables of each geodatabase.
Figure 3.5. Metadata Example for County Geodatabase
Source: U.S. Census Bureau, TIGER/Line with Selected Demographic and Economic Data Record Layouts, County Metadata, <www.census.gov/programs-surveys/geography/technical-documentation/records-layout/tiger-line-demo -record-layouts.html>.
Geography and the American Community Survey 19 What Data Users Need to Know 19U.S. Census Bureau
Linking Other ACS Data to TIGER/Line ShapefilesIn some cases, users may not be able to find the ACS data they need in the Selected Demographic and Economic Data geodatabases (for example, users work-ing with ACS 1-year data). A more comprehensive set
of ACS data tables is available through data.census.gov and the ACS Summary File.
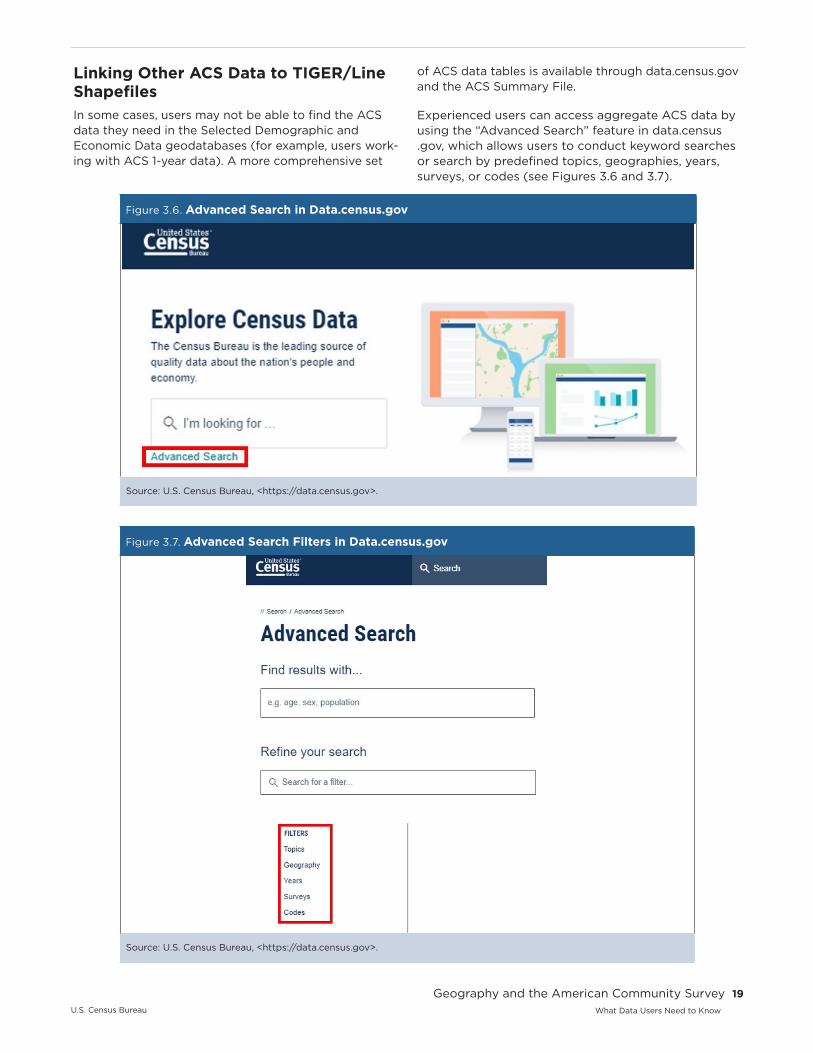
Experienced users can access aggregate ACS data by using the “Advanced Search” feature in data.census .gov, which allows users to conduct keyword searches or search by predefined topics, geographies, years, surveys, or codes (see Figures 3.6 and 3.7).
Figure 3.6. Advanced Search in Data.census.gov
Source: U.S. Census Bureau, <https://data.census.gov>.
Figure 3.7. Advanced Search Filters in Data.census.gov
Source: U.S. Census Bureau, <https://data.census.gov>.
20 Geography and the American Community Survey 20 What Data Users Need to Know U.S. Census Bureau
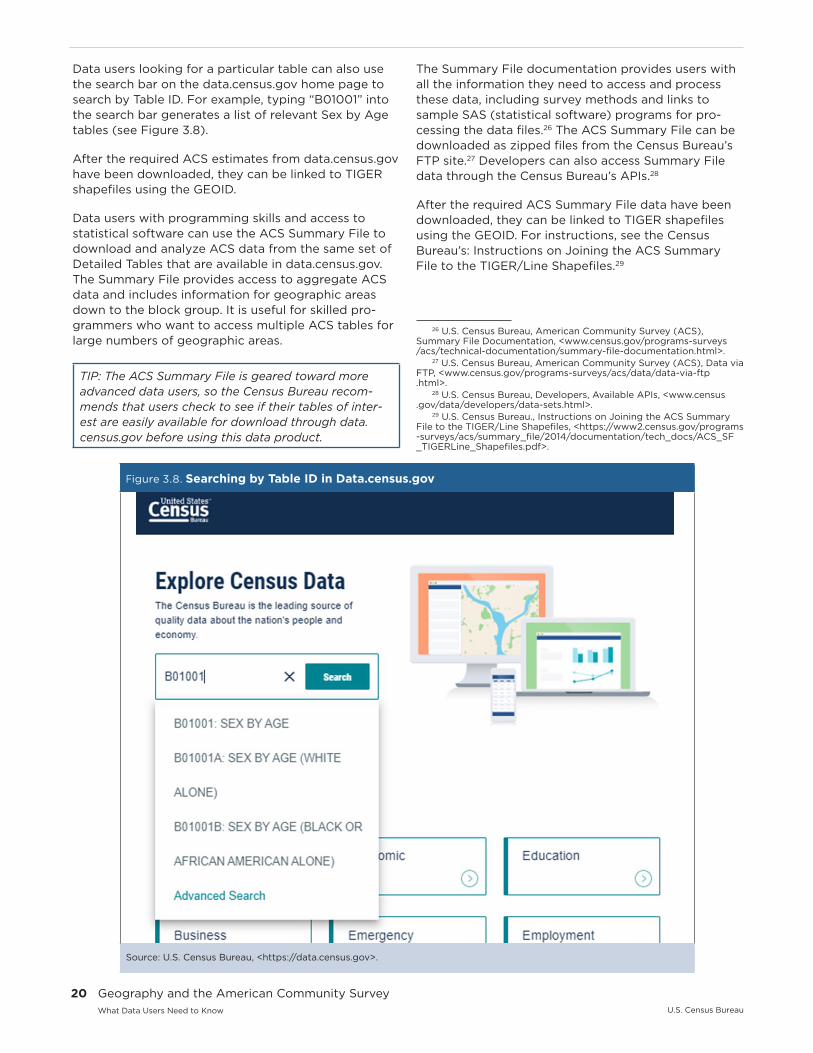
Data users looking for a particular table can also use the search bar on the data.census.gov home page to search by Table ID. For example, typing “B01001” into the search bar generates a list of relevant Sex by Age tables (see Figure 3.8).
After the required ACS estimates from data.census.gov have been downloaded, they can be linked to TIGER shapefiles using the GEOID.
Data users with programming skills and access to statistical software can use the ACS Summary File to download and analyze ACS data from the same set of Detailed Tables that are available in data.census.gov. The Summary File provides access to aggregate ACS data and includes information for geographic areas down to the block group. It is useful for skilled pro-grammers who want to access multiple ACS tables for large numbers of geographic areas.
TIP: The ACS Summary File is geared toward more advanced data users, so the Census Bureau recom-mends that users check to see if their tables of inter-est are easily available for download through data.census.gov before using this data product.
The Summary File documentation provides users with all the information they need to access and process these data, including survey methods and links to sample SAS (statistical software) programs for pro-cessing the data files.26 The ACS Summary File can be downloaded as zipped files from the Census Bureau’s FTP site.27 Developers can also access Summary File data through the Census Bureau’s APIs.28
After the required ACS Summary File data have been downloaded, they can be linked to TIGER shapefiles using the GEOID. For instructions, see the Census Bureau’s: Instructions on Joining the ACS Summary File to the TIGER/Line Shapefiles.29
26 U.S. Census Bureau, American Community Survey (ACS), Summary File Documentation, <www.census.gov/programs-surveys /acs/technical-documentation/summary-file-documentation.html>.
27 U.S. Census Bureau, American Community Survey (ACS), Data via FTP, <www.census.gov/programs-surveys/acs/data/data-via-ftp .html>.
28 U.S. Census Bureau, Developers, Available APIs, <www.census .gov/data/developers/data-sets.html>.
29 U.S. Census Bureau., Instructions on Joining the ACS Summary File to the TIGER/Line Shapefiles, <https://www2.census.gov/programs -surveys/acs/summary_file/2014/documentation/tech_docs/ACS_SF_TIGERLine_Shapefiles.pdf>.
Figure 3.8. Searching by Table ID in Data.census.gov
Source: U.S. Census Bureau, <https://data.census.gov>.
Geography and the American Community Survey 21 What Data Users Need to Know 21U.S. Census Bureau
4. ADDITIONAL RESOURCESUnderstanding and Using American Community Survey Data: What All Data Users Need to Know <www.census.gov/programs-surveys/acs/guidance /handbooks/general.html>
This handbook provides an overview of the America Community Survey (ACS) to help data users under-stand the basics of the survey, how the data can be used, how to judge the accuracy of ACS estimates, and how to access ACS data.
Geography and ACS <www.census.gov/programs-surveys/acs/geography -acs.html>
This Web page includes information about changes in geographic boundaries in the ACS, key concepts and definitions, and reference materials.
Gazetteer Files <www.census.gov/geographies/reference-files/time -series/geo/gazetteer-files.html>
The U.S. Gazetteer Files provide a listing of all geo-graphic areas for selected geographic area types. The files include geographic identifier codes, names, area measurements, and representative latitude and longi-tude coordinates.
Hierarchy Diagrams <www.census.gov/programs-surveys/geography /guidance/hierarchy.html>
The hierarchy of census geographic entities displays the relationships between legal, administrative, and statistical boundaries maintained by the U.S. Census Bureau.
Census Geocoder <https://geocoding.geo.census.gov/>
The Census Geocoder is an address look-up tool that converts an address to an approximate coordinate (latitude/longitude) and returns information about the address range that includes the address and the cen-sus geography the address is within.
Census Data API User Guide <www.census.gov/data/developers/guidance/api-user -guide.html>
The purpose of this user guide is to instruct develop-ers and researchers on how to use the Census Data Application Programming Interface to request data from Census Bureau data sets.
How to Use ACS Geodatabase Files and ArcMap <www.census.gov/programs-surveys/acs/guidance /training-presentations/acs-geodatabase.html>
This Webinar covers background information about the ACS, as well as how to join ACS data with a layer of geography by downloading a geodatabase file, opening the file in ArcMap, and joining the ACS data table to a feature class.
U.S. Census Bureau, data.census.gov: Census Bureau’s New Data Dissemination Platform Frequently Asked Questions and Release Notes <https://data.census.gov/assets/releasenotes/faqs -release-notes.pdf>
Data.census.gov is the main platform to access data and digital content from the Census Bureau, created based on overwhelming feedback to streamline the way you get data.
Related Sites <www.census.gov/programs-surveys/geography /about/related-sites.html>
Many outside groups, such as other federal agencies and academic institutions, have mapped census data and can provide additional tools to data users. The Census Bureau compiled a list of sites that either map Census Bureau data or help you map census data.